plant washington prevention of significant deterioration
TRANSCRIPT

Plant Washington
Prevention of Significant Deterioration Air Permit
Application
Prepared for:
Power4Georgians, LLC
258 N. Harris Street P.O Box 258
Sandersville, Georgia 31082
Prepared by:
MACTEC Engineering and Consulting, Inc.
3200 Town Point Drive NW, Suite 100 Kennesaw, Georgia, 30144
January 17, 2008

Prevention of Significant Deterioration Air Permit Application January 17, 2008 Plant Washington, Power4Georgians, LLC
070007.2201 i
TABLE OF CONTENTS Page
1.0 INTRODUCTION ........................................................................................................... 1-1 1.1 Power Demand For Georgia ................................................................................ 1-5
2.0 Process Description.......................................................................................................... 2-1 2.1 Process Description for the Power Boiler............................................................ 2-4 2.2 Process Description for Coal Handling................................................................ 2-5 2.3 Process Description for Limestone Handling ...................................................... 2-7 2.4 Process Description for Fly Ash Handling .......................................................... 2-9 2.5 Process Description for Bottom Ash Handling.................................................... 2-9 2.6 Process Description for Gypsum Handling........................................................ 2-12 2.7 Process Description for Anhydrous Ammonia .................................................. 2-12 2.8 Process Description for SO3 and Mercury Sorbents .......................................... 2-14 2.9 Process Description for the Pretreatment Soda Ash Silo and the Pretreatment
Lime Silo............................................................................................................ 2-14 2.10 Process Description for the Auxiliary Boiler..................................................... 2-14 2.11 Process Description for the Emergency Equipment .......................................... 2-15 2.12 Process Description for the Cooling Tower....................................................... 2-15 2.13 Process Description for the Solid Materials Handling Facility for Long Term
Storage ............................................................................................................... 2-15 2.14 Plant Production Capacity.................................................................................. 2-16
3.0 REGULATORY ANALYSIS.......................................................................................... 3-1 3.1 PSD Applicability Analysis ................................................................................. 3-1 3.2 New Source Performance Standard – Subpart Da Applicability ......................... 3-3 3.3 New Source Performance Standard – Subpart Db Applicability......................... 3-7 3.4 New Source Performance Standard – Subpart Y Applicability........................... 3-7 3.5 New Source Performance Standard – Subpart OOO Applicability ..................... 3-8 3.6 New Source Performance Standard – Subpart HHHH Applicability .................. 3-8 3.7 New Source Performance Standard – Subpart IIII Applicability ........................ 3-8 3.8 New Source Performance Standard – Subpart Kb............................................... 3-9 3.9 National Emission Standards For Hazardous Air Pollutants – Subpart ZZZZ.... 3-9 3.10 National Emission Standards For Hazardous Air Pollutants – Subpart DDDDD3-9 3.11 Clean Air Mercury Rule (CAMR) ....................................................................... 3-9 3.12 Acid Rain Program ............................................................................................ 3-10 3.13 New Source Review........................................................................................... 3-10 3.14 Fine Particulate Review Requirements (PM2.5) ................................................. 3-11 3.15 Georgia State Requirements .............................................................................. 3-11 3.16 Compliance Assurance Monitoring (CAM) Plan .............................................. 3-11
4.0 BACT Analysis................................................................................................................ 4-1 4.1 Introduction.......................................................................................................... 4-1 4.2 Key Steps in a Top-Down BACT Analysis ......................................................... 4-2 4.3 Supercritical Pulverized Coal (SCPC) Boiler .................................................... 4-10
4.3.1 BACT Demonstration for PM Emissions from the Supercritical Pulverized Coal Boiler ............................................................................................. 4-10

Prevention of Significant Deterioration Air Permit Application January 17, 2008 Plant Washington, Power4Georgians, LLC
Page
070007.2201 ii
4.3.2 BACT Demonstration for NOx Emissions from the Supercritical Pulverized Coal Boiler........................................................................... 4-25
4.3.3 BACT Demonstration for CO Emissions from the Supercritical Pulverized Coal Boiler ............................................................................................. 4-39
4.3.4 BACT Demonstration for VOC Emissions from the Supercritical Pulverized Coal Boiler........................................................................... 4-44
4.3.5 BACT Demonstration for SO2 Emissions from the Supercritical Pulverized Coal Boiler........................................................................... 4-48
4.3.6 BACT Demonstration for Pb Emissions from the Supercritical Pulverized Coal Boiler ............................................................................................. 4-61
4.3.7 BACT Demonstration for Fluoride Emissions from the Supercritical Pulverized Coal Boiler........................................................................... 4-70
4.3.8 BACT Demonstration for Sulfuric Acid Mist (H2SO4) Emissions from the Supercritical Pulverized Coal Boiler ..................................................... 4-78
4.3.9 BACT Demonstration for Mercury (Hg) Emissions from the Supercritical Pulverized Coal Boiler........................................................................... 4-91
4.4 Auxiliary Boiler ............................................................................................... 4-101 4.4.1 BACT Demonstration for Particulate Matter (PM) Emissions from the
Auxiliary Boiler ................................................................................... 4-101 4.4.2 BACT Demonstration for NOx Emissions from the Auxiliary Boiler 4-109 4.4.3 BACT Demonstration for Carbon Monoxide (CO) Emissions from the
Auxiliary Boiler ................................................................................... 4-112 4.4.4 BACT Demonstration for VOC Emissions from the Auxiliary Boiler 4-115 4.4.5 BACT Demonstration for Sulfur Dioxide (SO2) Emissions from the
Auxiliary Boiler ................................................................................... 4-118 4.4.6 BACT Demonstration for Sulfuric Acid Mist (H2SO4) Emissions from the
Auxiliary Boiler ................................................................................... 4-121 4.5 Diesel Engine Generator and Fire Water Pump............................................... 4-124
Step 1 – Identify All Control Technologies..................................................... 4-124 4.6 Cooling Towers................................................................................................ 4-126
4.6.1 BACT Demonstration for PM Emissions from the Cooling Towers... 4-126 4.7 Material Handling and Storage Facilities ........................................................ 4-128 4.8 Storage Tanks................................................................................................... 4-135 4.9 Opacity............................................................................................................. 4-135
5.0 PSD Ambient AIR QUALITY ANALYSIS.................................................................... 5-1 5.1 Modeling Methodology ....................................................................................... 5-1 5.2 fugitive particulate modeling ............................................................................... 5-9 5.3 Meteorological Data........................................................................................... 5-10 5.4 PSD Screen Modeling Results ........................................................................... 5-13
5.4.1 PM2.5 Screen Model Results .................................................................. 5-14 5.4.2 PM10 Screen Model Results ................................................................... 5-15 5.4.3 NOx Screen Model Results .................................................................... 5-16 5.4.4 CO Screen Model Results...................................................................... 5-17 5.4.5 SO2 Screen Model Results ..................................................................... 5-18

Prevention of Significant Deterioration Air Permit Application January 17, 2008 Plant Washington, Power4Georgians, LLC
Page
070007.2201 iii
5.4.6 Hydrogen Fluoride Screen Model Results............................................. 5-19 5.4.7 Lead Screen Model Results ................................................................... 5-19 5.4.8 Alternative Modeling Evaluations ......................................................... 5-20
5.5 Significant Impact Area Determination and Determination of off-Site Emissions Data for refined so2 modeling ........................................................................... 5-21
5.6 Refined Modeling Analysis ............................................................................... 5-26 5.7 National Ambient Air Quality Standard Modeling Results............................... 5-26 5.8 PSD INCREMENT Modeling Results............................................................... 5-28
6.0 Air Toxics Modeling........................................................................................................ 6-1 7.0 Class I Area Modeling ..................................................................................................... 7-1 8.0 Other impact analysis....................................................................................................... 8-1
8.1 Class II Visibility ................................................................................................. 8-1 8.2 Secondary impacts on Soil and Vegetation ......................................................... 8-5 8.3 Demographics ...................................................................................................... 8-8 8.4 Construction impacts ........................................................................................... 8-8 8.5 Minimization of Water Use ................................................................................. 8-9 8.6 Greenhouse gas (ghg) minimization .................................................................. 8-11
9.0 Georgia EPD Forms......................................................................................................... 9-1 10.0 REFERENCES .............................................................................................................. 10-1

Prevention of Significant Deterioration Air Permit Application January 17, 2008 Plant Washington, Power4Georgians, LLC
070007.2201 iv
LIST OF TABLES
Table 3-1 Facilitywide Emissions Summary Table 4-1 Facility Operations at the Facility Requiring a BACT Review Table 4-2 BACT Analysis Summary Table Table 4-3 PM Emissions from Pulverized Coal Boilers Taken from the RBLC Table 4-4 Listing of NOx Emissions from Pulverized Coal Boilers Taken From the RBLC Table 4-5 RBLC Listings for CO Emissions from Pulverized Coal-Fired Boilers Table 4-6 RBLC Listings for VOC Emissions from Pulverized Coal-Fired Boilers Table 4-7 RBLC Listings for SO2 Emissions from Pulverized Coal Fired Boilers Table 4-8 RBLC Listings for Pb Emissions from Pulverized Coal-Fired Boilers Table 4-9 RBLC Listings for Fluoride Emissions from Pulverized Coal-Fired Boilers Table 4-10 RBLC Listings for Sulfuric Acid Mist (H2SO4) Emissions from Pulverized Coal-
Fired Boilers Table 4-11 RBLC Listings for Mercury (Hg) Emissions from Pulverized Coal-Fired Boilers Table 4-12 RBLC Listings for PM Emissions from Distillate Oil Boilers Up to 250
MMBtu/hr Table 4-13 RBLC Listings for Nitrogen Oxide (NOX) Emissions from Distillate Oil Boilers
Up To 250 MMBtu/hr Table 4-14 RBLC Listings for Carbon Monoxide (CO) Emissions from Distillate Oil Boilers
Up To 250 MMBtu/hr Table 4-15 RBLC Listings for Volatile Organic Compound (VOC) Emissions from Distillate
Oil Boilers Up To 250 MMBtu/hr Table 4-16 RBLC Listings for Sulfur Dioxide (SO2) Emissions from Distillate Oil Boilers
Up To 250 MMBtu/hr Table 4-17 RBLC Listings for Sulfuric Acid Mist (H2SO4) Emissions from Distillate Oil
Boilers Up To 250 MMBtu/hr Table 4-18 RBLC Listings for Cooling Tower Drift Table 4-19 RBLC Listings for Material Management Handling Sources Table 5-1 Significant Impact Levels and Significant Monitoring Concentrations Table 5-2 Land Use Analysis - Auer Method Table 5-3 Screen Modeling Source Emissions Table 5-4 Qualitative Comparisons between the Surface Characteristics at Plant Washigton
and the Macon Airport Table 5-5 PM2.5 Screening Results Table 5-6 PM10 Screening Results Table 5-7 NOx Screening Results Table 5-8 CO Screening Results Table 5-9 SO2 Screening Results Table 5-10 HF Screening Results Table 5-11 Pb Screening Results Table 5-12 40% Load and Startup Model Modeling Results Table 5-13 Background, MAAQS, and PSD Increment Standards Table 5-14 SO2 NAAQS Modeling Summary Table 5-15 SO2 PSD Increment Modeling Summary Table 6-1 SCREEN3 Modeling Results Summary Table 6-2 Toxic Emissions Summary Table 6-3 ISCST3 Toxics Maodeling Results Table 7-1 Class Area within 300 km Plant Washington

Prevention of Significant Deterioration Air Permit Application January 17, 2008 Plant Washington, Power4Georgians, LLC
070007.2201 v
Table 7-2 CALPUFF Method 2 Modeling Results for Class I Areas near Plant Washington Table 7-3 Class I Increment Deposition Results Table 7-4 CALPUFF Class I PM10 Screening Analysis Table 7-5 CALPUFF Class I SO2 Screening Analysis Table 7-6 CALPUFF Class I NOx Screening Analysis Table 7-7 CALPUFF SO2 PSD Increment Modeling Results for Wolf Island Class I Area Table 8-1 Summary Table of Meteorological Conditions Resulting in a 1 Percent
Cumulative Frequency of Occurrence at Louisville Municipal Airport Table 8-2 Screening Concentrations for Exposure to Ambient Air Concentrations
LIST OF FIGURES Figure 1-1 Plant Washington Site Vicinity Location Figure 1-2 Plant Washington Approximate Site Location Figure 1-3 EMC Projections of Power Demand and Availability Figure 2-1 Overall Process Flow Diagram Figure 2-2 Coal Handling Process Flow Diagram Figure 2-3 Limestone Handling Process Flow Diagram Figure 2-4 Fly Ash Handling Process Flow Diagram Figure 2-5 Bottom Ash Handling Process Flow Diagram Figure 2-6 Gypsum Handling Process Flow Diagram Figure 5-1 Aerial Photograph Showing 3-Kilometer Radius around Proposed Site Figure 5-2 Entire Modeling Receptor Set Figure 5-3 Aerial View of Macon Surface Meteorological Station in Macon, Georgia Figure 5-4 Aerial View of Plant Washington in Sandersville, Georgia Figure 5-5 Significant Impact Area: 1987 SO2 Screening Results, 3-hour Figure 5-6 Significant Impact Analysis: 1987 SO2 Screening Results, 24-hour Figure 5-7 Significant Impact Area: 1989 SO2 Screening Results, Annual Figure 7-1 Relative Location Map of Site to the Class I Area Figure 7-2 Relative Location Map of Site to the Class I Area Figure 8-1 22.5º Wind Sector Directed Towards Louisville Municipal Airport
LIST OF EXHIBITS
EXHIBIT A EMISSION CALCULATIONS
EXHIBIT B SITE LAYOUT
EXHIBIT C MODELING INFORMATION
EXHIBIT D AIR QUALITY MODELS

Prevention of Significant Deterioration Air Permit Application January 17, 2008 Plant Washington, Power4Georgians, LLC
070007.2201 vi
LIST OF ACRONYMS AND ABBREVIATIONS Acronym Definition ACFM Actual Cubic Feet per Minute
ACGIH American Conference of Governmental Industrial Hygienists
AEGI Amine Enhanced Gas Injection
AERMAP AERMOD Mapping Program
AERMOD ARMS/EPA Regulatory Model
AHPC Advanced Hybrid Particulate Collector
AOI Area of Impact
AP Air Pollution
ARMS AERMOD Retrieval Modeling System
BACT Best Achievable Control Technology
BART Best Available Retrofit Technology
BPIP Building Profile Input Program
Btu British Thermal Unit(s)
Btu/hr British Thermal Unit(s) per Hour
CaCO3 Limestone
CAIR Clean Air Interstate Rule
CALPUFF (Dispersion Model Name)
CAMR Clean Air Mercury Rule
CaO Lime or Pebble Lime
Ca(OH)2 Slaked Lime or Hydrated Lime
CaSO3 Calcium Sulfite
CaSO4 · H2O Calcium Sulfate (Anhydrite)
CaSO4 · 2H2O Calcium Sulfate (Gypsum)
CDS Circulating Dry Scrubber
CEM Continuous Emission Monitor
cfm Cubic Feet per Minute
Cl2 Chlorine
CO Carbon Monoxide
CO2 Carbon Dioxide
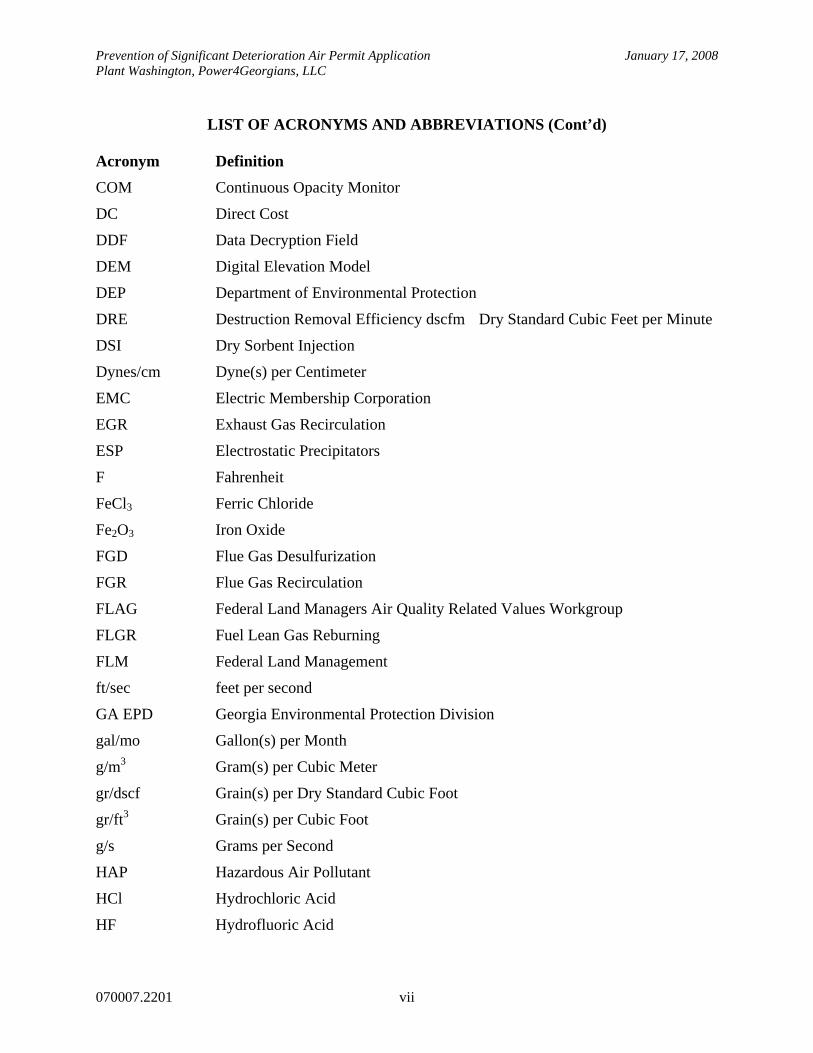
Prevention of Significant Deterioration Air Permit Application January 17, 2008 Plant Washington, Power4Georgians, LLC
LIST OF ACRONYMS AND ABBREVIATIONS (Cont’d) Acronym Definition
070007.2201 vii
COM Continuous Opacity Monitor
DC Direct Cost
DDF Data Decryption Field
DEM Digital Elevation Model
DEP Department of Environmental Protection
DRE Destruction Removal Efficiency dscfm Dry Standard Cubic Feet per Minute
DSI Dry Sorbent Injection
Dynes/cm Dyne(s) per Centimeter
EMC Electric Membership Corporation
EGR Exhaust Gas Recirculation
ESP Electrostatic Precipitators
F Fahrenheit
FeCl3 Ferric Chloride
Fe2O3 Iron Oxide
FGD Flue Gas Desulfurization
FGR Flue Gas Recirculation
FLAG Federal Land Managers Air Quality Related Values Workgroup
FLGR Fuel Lean Gas Reburning
FLM Federal Land Management
ft/sec feet per second
GA EPD Georgia Environmental Protection Division
gal/mo Gallon(s) per Month
g/m3 Gram(s) per Cubic Meter
gr/dscf Grain(s) per Dry Standard Cubic Foot
gr/ft3 Grain(s) per Cubic Foot
g/s Grams per Second
HAP Hazardous Air Pollutant
HCl Hydrochloric Acid
HF Hydrofluoric Acid

Prevention of Significant Deterioration Air Permit Application January 17, 2008 Plant Washington, Power4Georgians, LLC
LIST OF ACRONYMS AND ABBREVIATIONS (Cont’d) Acronym Definition
070007.2201 viii
Hg Mercury
HNO3 Nitric Acid
hp Horsepower
H2SO4 Sulfuric Acid
IC Indirect Cost
ID Identification
in/yr inch per year
IPPC Integrated Pollution Prevention and Control
ISC Industrial Source Complex
ISCST3 Industrial Source Complex Short Term
kPa Kilopascals
kV Kilovolts
kWh Kilowatt Hours
LAER Lowest Achievable Emission Rate
lb/MMBtu Pound(s) per Million British Thermal Unit
lb/MMscf Pound(s) per Million Standard Cubic Feet
LCC Lambert Conformal Coordinate
LEA Low Excess Air
LNB Low NOX Burner
m3 Cubic Meters
MACT Maximum Achievable Control Technology
MACTEC MACTEC Engineering and Consulting, Inc.
µg/m3 Microgram(s) per Cubic Meter
mg/dscm Milligram(s) per Dry Standard Cubic Meter
MGLC Maximum Ground-level Concentration
mg/L Milligrams per Liter
mg/m3 Milligram(s) per Cubic Meter
MMBtu/hr Million British Thermal Unit(s) per Hour
MMcf Million Cubic Feet

Prevention of Significant Deterioration Air Permit Application January 17, 2008 Plant Washington, Power4Georgians, LLC
LIST OF ACRONYMS AND ABBREVIATIONS (Cont’d) Acronym Definition
070007.2201 ix
MW Megawatts
NAAQS National Ambient Air Quality Standard
Na2CO3 Sodium Carbonate
NAICS North American Industry Classification System
NaOH Sodium Hydroxide
NESHAP National Emissions Standards for Hazardous Air Pollutants
ng/J nanogram per Joule
NGR Natural Gas Reburning
NH3 Ammonia
NH4SO4 Ammonia Sulfate
NOV Notice of Violation
NOx Nitrogen Oxide
NO2 Nitrogen Dioxide
N2O5 Nitric Pentoxide
NSCR Non-selective Catalytic Reduction
NSR New Source Review
NSPS New Source Performance Standard
NWS National Weather Service
OFA Over-fired Air
OSHA Occupational Safety and Health Administration
PAC Powdered Activated Carbon
Pb Lead
PM Particulate Matter
PM2.5 Particulate Matter Less Than 2.5 Microns
PM10 Particulate Matter Less Than 10 Microns
ppm Part(s) per Million
PRB Powder River Basin
PSD Prevention of Significant Deterioration
psia Pound(s) per Square Inch Acceptable/Atmospheric
Prevention of Significant Deterioration Air Permit Application January 17, 2008 Plant Washington, Power4Georgians, LLC
LIST OF ACRONYMS AND ABBREVIATIONS (Cont’d) Acronym Definition
070007.2201 x
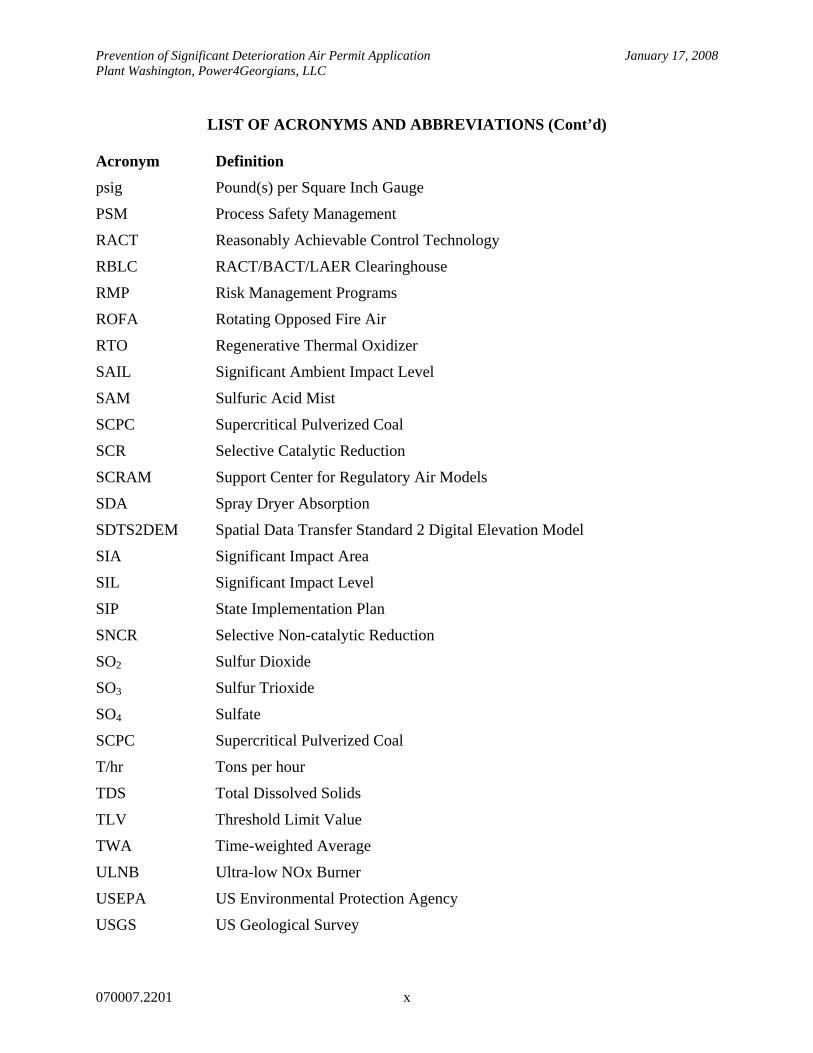
psig Pound(s) per Square Inch Gauge
PSM Process Safety Management
RACT Reasonably Achievable Control Technology
RBLC RACT/BACT/LAER Clearinghouse
RMP Risk Management Programs
ROFA Rotating Opposed Fire Air
RTO Regenerative Thermal Oxidizer
SAIL Significant Ambient Impact Level
SAM Sulfuric Acid Mist
SCPC Supercritical Pulverized Coal
SCR Selective Catalytic Reduction
SCRAM Support Center for Regulatory Air Models
SDA Spray Dryer Absorption
SDTS2DEM Spatial Data Transfer Standard 2 Digital Elevation Model
SIA Significant Impact Area
SIL Significant Impact Level
SIP State Implementation Plan
SNCR Selective Non-catalytic Reduction
SO2 Sulfur Dioxide
SO3 Sulfur Trioxide
SO4 Sulfate
SCPC Supercritical Pulverized Coal
T/hr Tons per hour
TDS Total Dissolved Solids
TLV Threshold Limit Value
TWA Time-weighted Average
ULNB Ultra-low NOx Burner
USEPA US Environmental Protection Agency
USGS US Geological Survey

Prevention of Significant Deterioration Air Permit Application January 17, 2008 Plant Washington, Power4Georgians, LLC
LIST OF ACRONYMS AND ABBREVIATIONS (Cont’d) Acronym Definition
070007.2201 xi
USNPS National Park Service
UTM Universal Transverse Mercator
VISCREEN Visibility Screening Model
VISTAS Visibility Improvement – State and Tribal Association of the Southeast
VOL Volatile Organic Liquid
VOC Volatile Organic Compound
WESP Wet Electrostatic Precipitator
WFGD Wet Flue Gas Desulfurization

Prevention of Significant Deterioration Air Permit Application January 17, 2008 Plant Washington, Power4Georgians, LLC
070007.2201 1-1
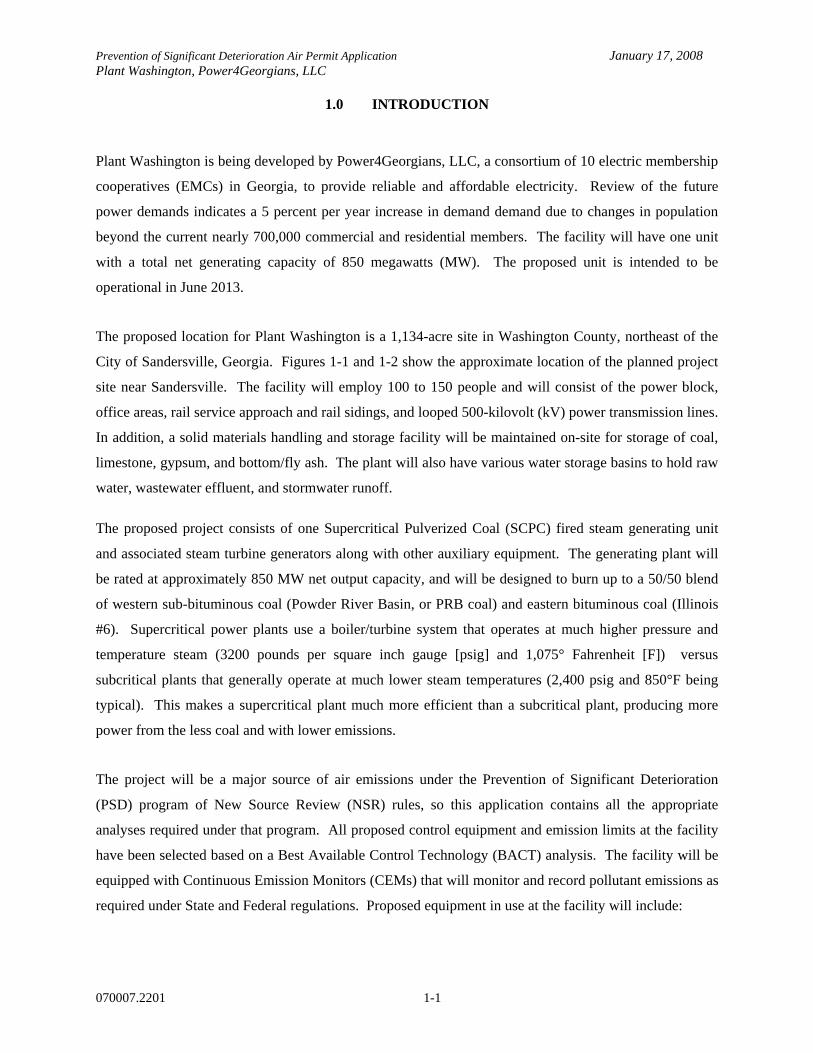
1.0 INTRODUCTION
Plant Washington is being developed by Power4Georgians, LLC, a consortium of 10 electric membership
cooperatives (EMCs) in Georgia, to provide reliable and affordable electricity. Review of the future
power demands indicates a 5 percent per year increase in demand demand due to changes in population
beyond the current nearly 700,000 commercial and residential members. The facility will have one unit
with a total net generating capacity of 850 megawatts (MW). The proposed unit is intended to be
operational in June 2013.
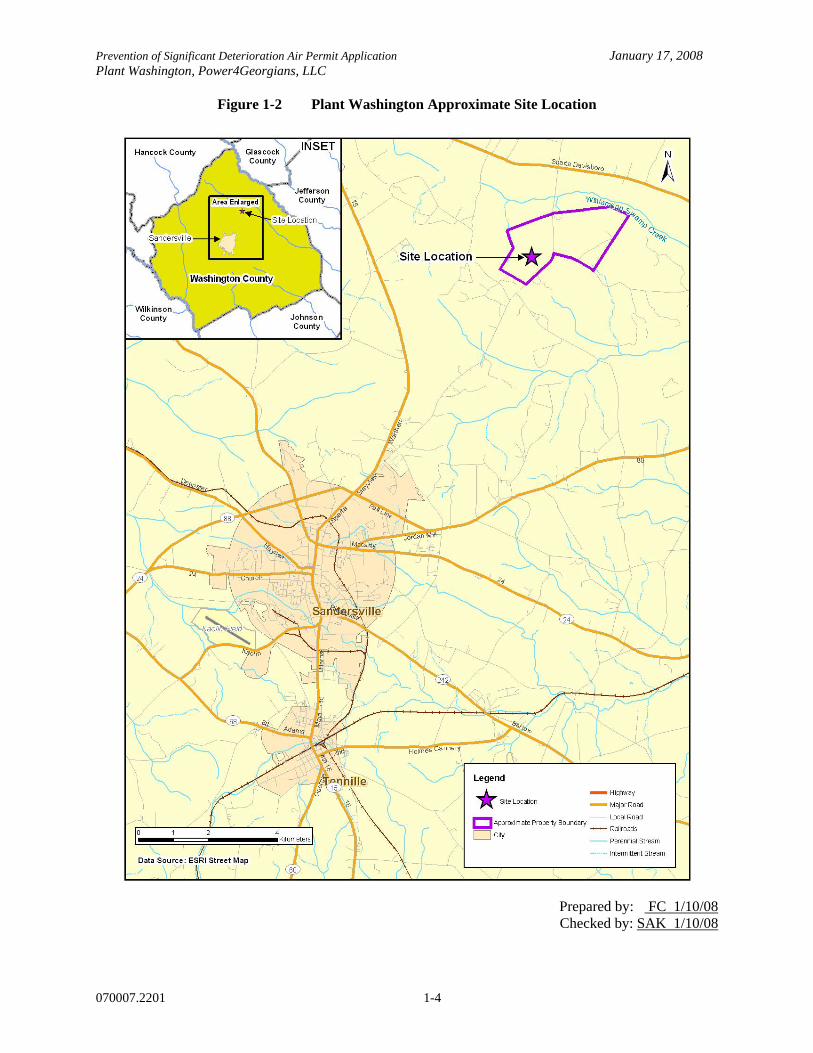
The proposed location for Plant Washington is a 1,134-acre site in Washington County, northeast of the
City of Sandersville, Georgia. Figures 1-1 and 1-2 show the approximate location of the planned project
site near Sandersville. The facility will employ 100 to 150 people and will consist of the power block,
office areas, rail service approach and rail sidings, and looped 500-kilovolt (kV) power transmission lines.
In addition, a solid materials handling and storage facility will be maintained on-site for storage of coal,
limestone, gypsum, and bottom/fly ash. The plant will also have various water storage basins to hold raw
water, wastewater effluent, and stormwater runoff.
The proposed project consists of one Supercritical Pulverized Coal (SCPC) fired steam generating unit
and associated steam turbine generators along with other auxiliary equipment. The generating plant will
be rated at approximately 850 MW net output capacity, and will be designed to burn up to a 50/50 blend
of western sub-bituminous coal (Powder River Basin, or PRB coal) and eastern bituminous coal (Illinois
#6). Supercritical power plants use a boiler/turbine system that operates at much higher pressure and
temperature steam (3200 pounds per square inch gauge [psig] and 1,075° Fahrenheit [F]) versus
subcritical plants that generally operate at much lower steam temperatures (2,400 psig and 850°F being
typical). This makes a supercritical plant much more efficient than a subcritical plant, producing more
power from the less coal and with lower emissions.
The project will be a major source of air emissions under the Prevention of Significant Deterioration
(PSD) program of New Source Review (NSR) rules, so this application contains all the appropriate
analyses required under that program. All proposed control equipment and emission limits at the facility
have been selected based on a Best Available Control Technology (BACT) analysis. The facility will be
equipped with Continuous Emission Monitors (CEMs) that will monitor and record pollutant emissions as
required under State and Federal regulations. Proposed equipment in use at the facility will include:

Prevention of Significant Deterioration Air Permit Application January 17, 2008 Plant Washington, Power4Georgians, LLC
070007.2201 1-2
• One coal-fired electric utility steam generating unit with a rated heat input of 8,300
million British Thermal Units per hour (MMBtu/hr) utilizing a supercritical cycle design,
which will be equipped with low nitrogen oxide (NOX) burners, overfire air, Selective
Catalytic Reduction (SCR), a fabric filter baghouse, and a Wet Flue Gas Desulfurization
(WFGD) System. In addition, emission controls will include sorbent injection systems
for the control of sulfuric acid (H2SO4) mist and mercury (Hg) emissions.
• A steam turbine and associated generator.
• Facilities for receiving, handling, storing, blending, and processing two types of coal,
PRB and Illinois #6, with as much as 431 tons per hour (T/hr) of blended coal or at a rate
of 490 T/hr when burning only PRB coal.
• Facilities for receiving, handling, and storing anhydrous ammonia, which is a raw
material for the SCR system.
• Facilities for receiving, handling, storing and process limestone, which is a raw material
for the WFGD system.
• Facilities for receiving, handling, storing and delivering mercury removal adsorbent
(sorbent) and sulfur trioxide (SO3) removal sorbent (for the control of Sulfuric Acid Mist
[SAM] emissions).
• A solids material handling facility (SMHF) for handling and storing process byproducts.
• Facilities for on-site storage of process wastes for potential reuse.
• An emergency diesel-fired generator.
• A diesel engine driven fire pump.
• A 240 MMBtu/hr No. 2 fuel oil fired auxiliary boiler.

Prevention of Significant Deterioration Air Permit Application January 17, 2008 Plant Washington, Power4Georgians, LLC
070007.2201 1-3
Figure 1-1 Plant Washington Site Vicinity Location
Prepared by: FC 1/10/08
Checked by: SAK 1/10/08
Prevention of Significant Deterioration Air Permit Application January 17, 2008 Plant Washington, Power4Georgians, LLC
070007.2201 1-4
Figure 1-2 Plant Washington Approximate Site Location
Prepared by: FC 1/10/08 Checked by: SAK 1/10/08

Prevention of Significant Deterioration Air Permit Application January 17, 2008 Plant Washington, Power4Georgians, LLC
070007.2201 1-5
This air permit application includes a process and project description (Section 2), an emission calculation
summary and regulatory analysis of the proposed project (Section 3), a BACT analysis (Section 4) for the
affected equipment, the required National Ambient Air Quality Standard (NAAQS) and PSD air quality
modeling analyses (Section 5), Georgia Air Toxics Modeling (Section 6), Class I Area modeling (Section
7), Class II visibility and an other impacts analysis (Section 8), and the required Georgia Environmental
Protection Division (GA EPD) permit application forms (Section 9).
The application also includes the following exhibits: emission calculations (Exhibit A) that form the basis
of the permitting approach and modeling assessments, the site layout (Exhibit B), air quality modeling
information (Exhibit C), and an electronic copy of models (Exhibit D).
1.1 Power Demand For Georgia
Power4Georgians, LLC, is a company formed to ensure that Georgians will continue to have reliable
electric power in the coming years. The company consists of 10 Georgia EMCs that have pooled their
resources to construct a baseload power generating facility in middle Georgia. Power4Georgians, LLC,
will be the legal entity developing the power plant. The 10 EMCs and their locations are: Upson EMC,
Thomaston; Central Georgia EMC, Jackson; Snapping Shoals EMC, Covington; Diverse Power,
LaGrange; Excelsior EMC, Metter; GreyStone Power, Douglasville; Jackson EMC, Jefferson; Cobb
EMC, Marietta; Pataula EMC, Cuthbert; and Washington EMC, Sandersville. All of these EMCs have
independently concluded that, despite efforts in promoting energy conservation, power demand will
substantially increase in the years ahead. Although power demand is increasing, the supply of power that
the EMC have contracts for will be decreasing, and by the year 2013 the EMCs will have a large gap to
fill between the growing demand and the loss of available power. Figure 1-3 shows the increasing
demand curve and the reduction of available power. Plant Washington will be a significant supply to fill
this energy gap coming in the near future. The other portion of the solution is to rely on continued
conservation efforts of the membership and the EMCs’ alternative energy sources, such as the biomass
plant in Bleckley County.
Power4Georgians, LLC, is exploring all sources of energy including natural gas, wind, solar, and biomass
(such as on-site storage of methane gas, wood chips, and poultry litter-to-energy) to ensure a reliable
energy supply. Many of the co-ops in this project participate in Georgia’s Green Power EMC and make
green energy available to members. Power generated by Green Power EMC helps meet peak demand but
is not sufficient to meet baseload demand.

Prevention of Significant Deterioration Air Permit Application January 17, 2008 Plant Washington, Power4Georgians, LLC
070007.2201 1-6
In reviewing options to meet power requirements, the members of this coalition investigated other
possible options for baseload. Two potential options, which could provide substantial capacity of
baseload, were considered. One is Plant Vogtle’s expansion, which will occur in 2016 or later.
Consortium members are currently taking power from the existing units, and the current forecast assumes
that the Consortium will participate in the expansion; however, the Consortium’s baseload needs must be
met before any supply is available from Vogtle.
At the moment, the progress on the proposed power plant in southwest Georgia has been halted until
resolution of an anticipated appeal of a court ruling regarding the air permit. Depending on the outcome
of the appeal and various other business issues, that plant could meet some of our needs for baseload, but
even with proposed plant capacity, the ten members would be deficient in baseload capacity; therefore, it
is necessary for this group (due to reliability and demand requirements) to construct a baseload coal plant.
Additional options using renewable and solar energy sources have been investigated, contracted for, and
partially implemented. Portions of the load will be served by these energy sources; however, there is not
enough capacity to cover our member’s energy needs within Georgia.

Prevention of Significant Deterioration Air Permit Application January 17, 2008 Plant Washington, Power4Georgians, LLC
070007.2201 1-7
Figure 1-3 EMC Projections of Power Demand and Availability
Prepared by: LMG 1/10/08 Checked by: SAK 1-10-08
0
5,000
10,000
15,000
20,000
25,000
2007
2008
2009
2010
2011
2012
2013
2014
2015
2016
2017
2018
2019
2020
2021
2022
2023
2024
2025
2026
MW
OPC / Smarr / SEPA Resources Member ResourcesAdditional Requirements Member Demand

Prevention of Significant Deterioration Air Permit Application January 17, 2008 Plant Washington, Power4Georgians, LLC
070007.2201 2-1
2.0 PROCESS DESCRIPTION
Power4Georgians, LLC proposes to construct and operate a new power generation facility in Washington
County near Sandersville, Georgia. The proposed project consists of one SCPC fired steam generating
unit and associated steam turbine generators along with other auxiliary equipment. The generating plant
will be rated at approximately 850 MW net output capacity, and will be designed to burn up to a 50/50
blend of western sub-bituminous coal (Powder River Basin, or PRB coal), and eastern bituminous coal
(Illinois #6). The unit will be normally used for “base load” electricity generating operations. The unit
may also operate for extended periods at loads within the operating range of 40 to 100 percent load during
the shoulder months (spring and fall). The steam will be expanded through a high pressure steam turbine
section, then reheated and expanded in intermediate and low pressure turbine sections to drive an electric
power generator.
A blend of coals is being proposed for two reasons: 1) to ensure reliability of receipt of the daily coal
shipments needed to keep the plant operational and 2) eastern coal is more cost effective when
considering the transportation cost of obtaining the coal. Both Powder River Basin (PRB) and Illinois #6
coals will be brought to the facility by bottom dump railcars. Coal will be unloaded from the railcars at
the railcar unloading facility and sent to the PRB and Illinois #6 active coal piles, with a portion of the
coals being sent to the PRB and Illinois #6 inactive coal piles in order to accommodate for interruptions
in the fuel supply. Coal will be pulled from the PRB and Illinois #6 coal piles, blended to a 50/50 coal
blend, and sent to the crushers where the coal is crushed and pulverized. Crushed coal will be fed to
conveyors and transferred to fuel storage silos.
Pulverized coal will then be combusted in the facility main boiler, an 850 MW net output capacity steam
generating unit. Produced steam will be used to drive a steam turbine, which in turn will create electricity
through the mechanical energy created by driving the steam turbine generator shaft. Emissions from the
main facility boiler will be controlled by air pollution control equipment prior to discharge from the main
boiler stack. The air pollution control equipment in use on the main boiler will include a SCR system for
control of NOX emissions, sorbent injection systems for the control of H2SO4 and mercury emissions, a
fabric filter for the control of Particulate Matter (PM) emissions, and an WFGD for control of sulfur
dioxide (SO2) emissions. Additional pollutants will be controlled through use of the above discussed air
pollution control equipment, which will be discussed further in the BACT analysis in Section 4 of this
application.

Prevention of Significant Deterioration Air Permit Application January 17, 2008 Plant Washington, Power4Georgians, LLC
070007.2201 2-2
The following Figure 2-1 provides an overall process flow diagram of the facility operations surrounding
the main facility boiler.

Prevention of Significant Deterioration Air Permit Application January 17, 2008 Plant Washington, Power4Georgians, LLC
070007.2201 2-3
Figure 2-1 Overall Process Flow Diagram
Cooling Towers (S2-S35) and Condenser System
Boiler8,300 MMBtu/hr
SCR Baghouse Wet FGD
350,000 Gallon Fuel Oil Tank
Ammonia StorageSteam Turbine
Steam850 MW
Water
Coal Transfer and Conveying
Bottom Ash Handling
SO3 Sorbent Silo Sorbent Injection
For SO3 and Mercury Control
Main Stack Exhaust
S1
Fly Ash Handling
Auxiliary Boiler
Auxiliary Steam System
SteamWater
Auxiliary Stack Exhaust
S45
S2-S35
Emergency Diesel Generator
Emergency Firewater Pump
Fuel Storage Tank
Fuel Storage Tank
Process Flow = Stack or Vent =Stack No. = Fugitive Emissions = Control Device =
X
Mercury Sorbent Silo
S36
S38
Prepared by: LMG 1/10/08 Checked by: SAK 1/10/08

Prevention of Significant Deterioration Air Permit Application January 17, 2008 Plant Washington, Power4Georgians, LLC
070007.2201 2-4
2.1 Process Description for the Power Boiler
The SCPC fired boiler will be a pulverized coal single reheat, wall fired dry bottom boiler with low NOX
burners and overfire air. The unit will be a Babcock & Wilcox boiler designed to produce very high
pressure steam while minimizing the formation of NOX in the combustion process. NOX formation is
minimized by the use of air staging. Overfire air is injected to the furnace in several different levels. This
in effect divides the furnace volume in three different zones: 1) the primary firing zone, 2) the NOX
reduction zone and 3) the final burnout zone. The maximum heat input rate of the boiler will be
approximately 8300 MMBtu/hr (while firing coal). Actual heat input and generator production will
depend on a variety of operating variables, including ambient temperature and pressure and the condition
of equipment associated with boiler operation. No. 2 fuel oil will be used for unit startup and for flame
stabilization. The maximum heat input rate of the boiler while burning No. 2 fuel oil will be 1,300
MMBtu/hr.
Flue gas from the boiler will be passed through a series of control devices. After leaving the furnace and
an air heater, the economized hot flue gases will be sent to two SCR system reactor chambers operating in
parallel for the control of NOX. Anhydrous ammonia, stored in pressurized tanks will be injected into the
SCR absorbers as the chemical agent for driving the NOX reduction reaction (ammonia combines with the
NOX in the exhaust gas to ultimately form nitrogen and water vapor). From the SCR chambers the
exhaust gases will be directed through an air preheater to recover heat before being sent on to a baghouse
to control particulate emissions. Prior to entering the baghouse, the adsorbents will be injected into the
exhaust gas stream. One adsorbent (activated carbon) is used to absorb the small amount of elemental Hg
vapor in the exhaust air while the second adsorbent reacts with SO3 in the exhaust air to prevent sulfuric
acid mist formation further downstream. The baghouse removes both the fly ash in the exhaust gas and
the absorbents that were added and the reaction products of the adsorbents. The gas then passes through
induced draft fans. Finally, the exhaust gas passes through a wet limestone scrubber to remove the SO2 in
the gas before being exhausted out the main stack (S1).
Boiler Start up Procedures
The startup procedure for the main facility boiler will include a 15 hour startup cycle, beginning with the
main facility boiler utilizing ultra low sulfur No. 2 distillate fuel oil. The combustion of oil is used to
slowly warm the boiler systems to reduce thermal stresses on the boiler system during startup. At the
same time the auxiliary boiler produces steam to feed the steam turbine so that it can be slowly brought
up to full load. During the entire start up process, the fabric filter baghouse is used for control of PM
Prevention of Significant Deterioration Air Permit Application January 17, 2008 Plant Washington, Power4Georgians, LLC
070007.2201 2-5
emissions; and the wet flue gas desulfurization system (wet scrubber or WFGD) used for control of SO2
emissions will be in service. However, the SCR system, used for control of NOX emissions, will not be in
operation during the startup procedure since the process is ineffective until the exhaust gas (and
equipment) reaches a minimum temperature of 450 degrees F. Coal will begin to be introduced to the
main boiler after approximately four hours into the startup procedure. As the startup procedure continues,
the coal input to the boiler will be increased while the distillate fuel oil input to the boiler will be
decreased by progressively turning on pulverizers and coal burners. The SCR system will come online
approximately thirteen hours into the startup procedure. The startup procedure will end at hour 15, with
the boiler experiencing full coal-based operation.
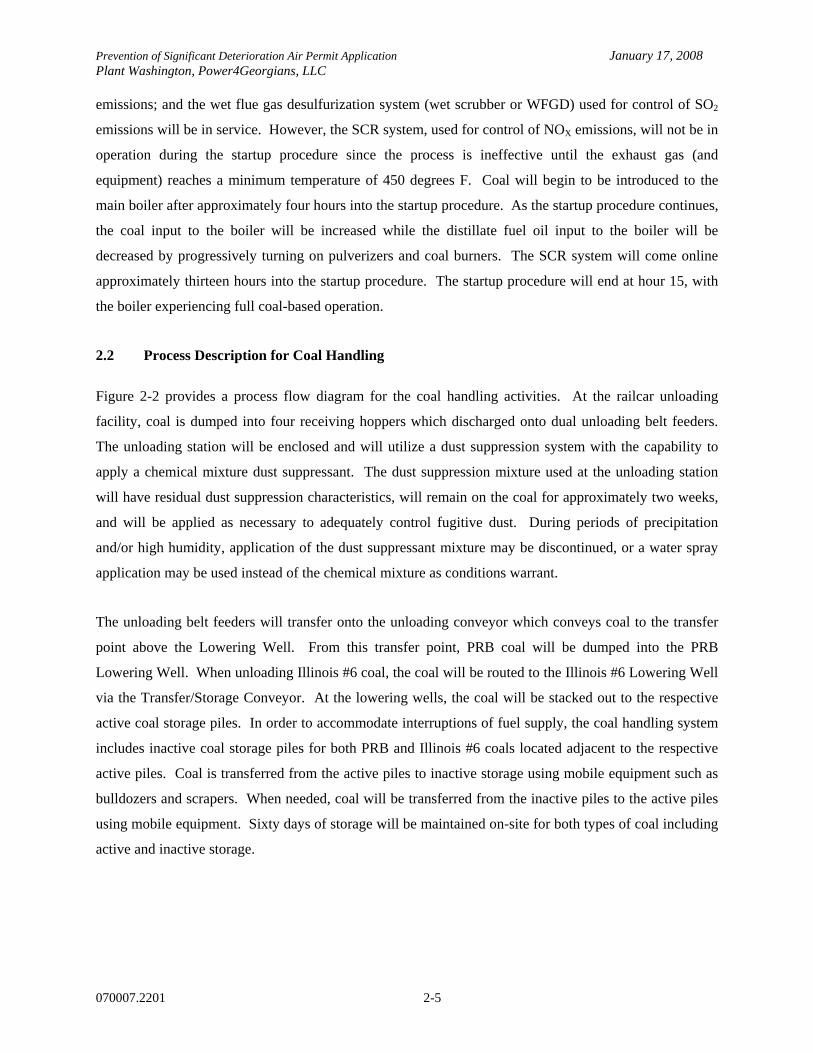
2.2 Process Description for Coal Handling
Figure 2-2 provides a process flow diagram for the coal handling activities. At the railcar unloading
facility, coal is dumped into four receiving hoppers which discharged onto dual unloading belt feeders.
The unloading station will be enclosed and will utilize a dust suppression system with the capability to
apply a chemical mixture dust suppressant. The dust suppression mixture used at the unloading station
will have residual dust suppression characteristics, will remain on the coal for approximately two weeks,
and will be applied as necessary to adequately control fugitive dust. During periods of precipitation
and/or high humidity, application of the dust suppressant mixture may be discontinued, or a water spray
application may be used instead of the chemical mixture as conditions warrant.
The unloading belt feeders will transfer onto the unloading conveyor which conveys coal to the transfer
point above the Lowering Well. From this transfer point, PRB coal will be dumped into the PRB
Lowering Well. When unloading Illinois #6 coal, the coal will be routed to the Illinois #6 Lowering Well
via the Transfer/Storage Conveyor. At the lowering wells, the coal will be stacked out to the respective
active coal storage piles. In order to accommodate interruptions of fuel supply, the coal handling system
includes inactive coal storage piles for both PRB and Illinois #6 coals located adjacent to the respective
active piles. Coal is transferred from the active piles to inactive storage using mobile equipment such as
bulldozers and scrapers. When needed, coal will be transferred from the inactive piles to the active piles
using mobile equipment. Sixty days of storage will be maintained on-site for both types of coal including
active and inactive storage.
Prevention of Significant Deterioration Air Permit Application January 17, 2008 Plant Washington, Power4Georgians, LLC
070007.2201 2-6
Figure 2-2 Coal Handling Process Flow Diagram
Dust Suppressant
Rail Car Unloading Station
Unloading Conveyors
Lowering Wells
Active Coal Piles
Reclaim Conveyors
Crusher House
Feed Conveyor
Tripper DeckBoiler Feed
Silos
Coal
Inactive Coal Piles Baghouse
Baghouse
Crusher Exhaust
S40
Tripper Deck Exhaust
S41
Main Boiler
Process Flow = Stack or Vent =Stack No. = Fugitive Emissions = Control Device =
X
Insertable Dust Collectors
S46-S47
Prepared by: LMG 1/10/08
Checked by: SAK 1/10/08

Prevention of Significant Deterioration Air Permit Application January 17, 2008 Plant Washington, Power4Georgians, LLC
070007.2201 2-7
Coal is pulled from the active storage piles via eight grizzly hoppers and feeders to two Reclaim
Conveyors. Two hoppers from PRB active storage and two hoppers from Illinois #6 active storage feed
Reclaim Conveyor 1. Two hoppers from PRB active storage and two hoppers from Illinois #6 active
storage feed Reclaim Conveyor 2. Belt scales weighing Illinois #6 and the total coal flow on the reclaim
conveyors will facilitate blending the coals to specific ratios. The conveying system includes a fugitive
dust collection system called “insertable dust collector” (emission points S-46 & S-47 for PRB and
Illinois 6 coal respectively) and a tramp metal cleaning system.
Coal will be conveyed to the Crusher Surge Bin on Reclaim Conveyors 1 and/or 2. In the Crusher House,
the coal will be fed from the surge bin to two diverters with fixed grizzlys. From the diverters, the coal is
routed to two crushers where the coal is crushed. Dust created from the crushers is controlled by a
baghouse (emission point S-40). Coal fines will be bypassed around the crushers. The crushed coal will
be fed from the crushers to two conveyors, Feed Conveyors 1 and 2. The coal is then distributed to boiler
Silo Fill Conveyors 1 and 2 in the Boiler Silo Bay. Silo Fill Conveyors 1 and 2 will be outfitted with
traveling trippers used to fill each of the 6 boiler silos for feed to the pulverizers. All the emissions from
the conveyors and tripper are controlled by a single baghouse (emission point S-41).
2.3 Process Description for Limestone Handling
Figure 2-3 provides a process flow diagram for the limestone handling activities at the facility.
Limestone will be delivered to the site by bottom-dump railcars for use in the WFGD system. At the
limestone unloading station, limestone is dumped into four receiving hoppers which discharge onto dual
Unloading Belt Feeders. The unloading station will be enclosed and will utilize a dust suppression
system similar to that in the coal unloading facility. In the limestone unloading facility, the Unloading
Belt Feeders will dump onto the Limestone Unloading Conveyor which conveys limestone to the
Limestone Stacking Tube where it is stacked out to the Limestone Storage Pile.
Limestone will be pulled from the storage pile via two grizzly hoppers with vibrating feeders to a single
Limestone Reclaim Conveyor. The Reclaim Conveyor will deliver the limestone to the day bin silo
located at the limestone reagent preparation area (air exhausted from the bin vent filter point S-42). The
conveying system will include a dust collection system called an “insertable dust collector” (emission
point S-48), belt scale and a tramp metal cleaning system.

Prevention of Significant Deterioration Air Permit Application January 17, 2008 Plant Washington, Power4Georgians, LLC
070007.2201 2-8
Figure 2-3 Limestone Handling Process Flow Diagram
Dust Suppressant
Rail Car Unloading Station
Unloading Conveyors Stacking Tube Limestone
PileLimestone Reclaim
ConveyorLimestone Preparation Building Day Bin Silo
Slurry System
Baghouse
Lime Prep Building Exhaust
S42
Process Flow = Stack or Vent =Stack No. = Fugitive Emissions = Control Device =
X
Insertable Dust Collector
S48
Prepared by: LMG 1/10/08 Checked by: SAK 1/10/08

Prevention of Significant Deterioration Air Permit Application January 17, 2008 Plant Washington, Power4Georgians, LLC
070007.2201 2-9
2.4 Process Description for Fly Ash Handling
Figure 2-4 provides a process flow diagram for handling fly ash at the facility. The fly ash system will
pneumatically convey dry free flowing ash from the pulse jet fabric filter (baghouse) hoppers and air
heater hoppers to the fly ash Storage Silo, which will have a storage capacity of 3600 tons (5-6 days
storage). Fly ash will be stored in the silo until load-out to trucks for transfer to the on-site storage
facility. The fly ash handling system will be designed to include a vacuum system to transfer ash from
the baghouse and air heater hoppers to a filter separator (exhaust point S-43) and fly ash silo, and an ash
truck load out station from ash silo pugmills which uses water for dust control. The fly ash handling
system serving the baghouse and air heater systems will have a conveying capacity of approximately 50
tons per hour.
The fly ash storage silo will be equipped with a bin vent dust filter, and fly ash mixing/conditioning
equipment. Conveying air will be exhausted from the silo through the bin vent filter located at the top of
the silo which removes suspended particulates. The silo and associated bin vent filter will be designed
with sufficient bag filtering capacity to support operation of fly ash transport. Each bag filter will operate
with an air-to-cloth ratio of approximately 2 to 1 during normal operation. The air-to-cloth ratio is well
within the range of optimum performance of the pulse jet bag filter. The silo will vent from the bin vent
filter with side exhausts (S-37)
The fly ash storage silo is equipped with a fluidizing air system including the porous fluidizing media,
two blowers, and two electric air heaters to enhance gravity flow of ash from the bottom of the silo. Fly
ash destined for storage will be conditioned by wetting with water as it is unloaded from the silo to
minimize dust generation. The conditioned ash will be unloaded through a chute into trucks for
transportation to an on-site storage facility. The system will employ redundant features to ensure
dependable operation, including a spare vacuum mechanical exhauster and fluidizing blower. The silo
and its associated equipment (fly ash conditioner and automatic bin vent filter) will be designed to
accommodate the fly ash from the boiler.
2.5 Process Description for Bottom Ash Handling
Figure 2-5 provides a process flow diagram for the bottom ash handling activities at the facility. The
bottom ash handling system collects boiler bottom ash and pyrites from the coal pulverizers for

Prevention of Significant Deterioration Air Permit Application January 17, 2008 Plant Washington, Power4Georgians, LLC
070007.2201 2-10
Figure 2-4 Fly Ash Handling Process Flow Diagram
Main Boiler Baghouse Hoppers
Air Heater Hoppers
Filter Separator Fly Ash Storage Silo
Bin Vent Filter Bag
Pug Mill Truck Loading Solid Materials Handling Facility
S43
S37
Process Flow = Stack or Vent =Stack No. = Fugitive Emissions = Control Device =
X
Water
Prepared by: LMG 1/10/08 Checked by: SAK 1/10/08

Prevention of Significant Deterioration Air Permit Application January 17, 2008 Plant Washington, Power4Georgians, LLC
070007.2201 2-11
Figure 2-5 Bottom Ash Handling Process Flow Diagram
Coal
Coal Pulverizers
BoilerBottom Ash
Pyrites
Submerged Chain Conveyor
Water
Bottom Ash Transfer Conveyors (1A and 2A) Storage Bunker Truck Loading Solid Materials
Handling Facility
Process Flow = Stack or Vent =Stack No. = Fugitive Emissions = Control Device =
X
Prepared by: LMG 1/10/08 Checked by: SAK 1/10/08

Prevention of Significant Deterioration Air Permit Application January 17, 2008 Plant Washington, Power4Georgians, LLC
070007.2201 2-12
disposal. The bottom ash from the boiler furnace is collected in the submerged chain conveyor. The
pyrites are sluiced from the pulverizers and fed into the submerged chain conveyor. The drag chain
conveyor discharges onto bottom ash transfer conveyor 1A. Bottom ash transfer conveyor 1A discharges
onto bottom ash transfer conveyor 1B. Bottom ash transfer conveyor 1B discharges into a three sided
ground level bunker for disposal. From the bunker the bottom ash is loaded onto trucks using mobile
equipment for transfer to the on-site storage.
2.6 Process Description for Gypsum Handling
Figure 2-6 provides a process flow diagram for the gypsum handling operations. Operation of the WFGD
scrubber will produce gypsum as a by-product, which will be transported to the on-site long term storage
facility together with the bottom ash and fly ash. Vacuum belt or drum filters will dewater the gypsum to
a free moisture content of approximately 15 to 20 percent. Two vacuum filters will transfer dewatered
gypsum onto the Gypsum Collection/Load-out Conveyor. This conveyor will transfer gypsum to the
Gypsum Storage/Loading Bin, which at a capacity of 800 tons will hold approximately 10 days worth of
gypsum production.
Trucks will be loaded out from the bypsum storage/loading bin during periods when trucks are operating
and transporting gypsum to the on-site storage. Gypsum will be transferred from the storage bin to a
radial stacker that will pile the gypsum on the ground near the bin when trucks are not operating (i.e.
nights, weekends, and emergency situations). The piled gypsum will be loaded onto trucks when
operations resume using mobile equipment and removed to the on-site storage.
2.7 Process Description for Anhydrous Ammonia
Anhydrous ammonia storage and handling facilities associated with the SCR system will be installed as
part of the project as shown in Figure 2-1.. The ammonia unloading facilities will be equipped with vapor
recovery whereby vapors will vent back to the host tank when transferring ammonia. The ammonia will
be stored in pressurized storage tanks each with an emergency relief valve. From the storage tanks the
ammonia will be piped to the SCR system for injection and mixing in the flue gas upstream of the catalyst
layers. A Risk Management Plan will be prepared to address on-site storage and handling of anhydrous
ammonia pursuant to the requirements of 40 CFR 68 Subpart G.

Prevention of Significant Deterioration Air Permit Application January 17, 2008 Plant Washington, Power4Georgians, LLC
070007.2201 2-13
Figure 2-6 Gypsum Handling Process Flow Diagram
Wet Flue Gas Desulfurization
System
Limestone Slurry
GypsumVacuum Filters Gypsum Collection
Load Out Conveyor
Gypsum Storage Loading Bin Transfer Conveyor
Truck Loading Solid Materials Handling Facility
Radial Stacker Gypsum Radial Storage Pile Truck Loading Solid Materials
Handling Facility
Process Flow = Stack or Vent =Stack No. = Fugitive Emissions = Control Device =
X
Prepared by: LMG 1/10/08 Checked by: SAK 1/10/08
Prevention of Significant Deterioration Air Permit Application January 17, 2008 Plant Washington, Power4Georgians, LLC
070007.2201 2-14
2.8 Process Description for SO3 and Mercury Sorbents
The air quality control system of the plant will include sorbent injection systems for capture of Hg and
SO3 for control of sulfuric acid mist emissions. Systems to handle these materials will incorporate self
unloading of trucks and pneumatic conveying of the sorbents to their respective storage silos. The
sorbent storage silos will be equipped with bin vent filters designed with sufficient bag filtering capacity
to support sorbent unloading operations. Conveying air from the self unloading trucks is exhausted from
the silo through the bin vent filters located at the top of the silos to separate suspended particulates and
return them to the silo. Emissions from these silos are expected to occur only during filling operation at a
maximum of one hour per shift.
2.9 Process Description for the Pretreatment Soda Ash Silo and the Pretreatment Lime Silo
As part of the raw water treatment system at the facility, soda ash and lime will be used to reduce iron and
phosphorous levels prior to use in industrial services (i.e. cooling tower) at the facility. The lime and
soda ash will precipitate iron and phosphorous and removed in a clarifier system. Systems to handle these
materials will incorporate self unloading of trucks and pneumatic conveying of the soda ash and lime to
their respective storage silos. The soda ash and lime storage silos will be equipped with bin vent filters
designed with sufficient bag filtering capacity to support material unloading operations. Conveying air
from the self unloading trucks is exhausted from the silo through the bin vent filters located at the top of
the silos to separate suspended particulates and return them to the silo.
2.10 Process Description for the Auxiliary Boiler
The plant will be served by an auxiliary boiler to provide steam for startup and other operations as
required when steam from the boiler is unavailable or inadequate to supply auxiliary steam equipment
needs as shown in Figure 2-1. The auxiliary boiler will be fired on low sulfur No. 2 fuel oil and will have
a maximum gross heat input of 240 MMBtu/hr. The auxiliary boiler will be equipped with low NOX
burners and Flue Gas Recirculation (FGR). The exhaust from the auxiliary boiler will be emitted through
a stack. Operation of the auxiliary boiler will be limited to a ten percent annual capacity factor based on
heat input. During the initial plant commissioning activities, the auxiliary boiler may operate more than
the 10 percent capacity factor over the first 12 months.

Prevention of Significant Deterioration Air Permit Application January 17, 2008 Plant Washington, Power4Georgians, LLC
070007.2201 2-15
2.11 Process Description for the Emergency Equipment
The plant configuration, as indicated in Figure 2-1, will include an emergency diesel generator, which
will be used for shutdown or other operations when normal power supply to plant equipment is
interrupted. The generator engine will be fired on diesel fuel and its output will be approximately
1,120 kw. It is anticipated that the generator will not be operated for more than 500 hours per year as it
will be for emergency use and maintenance/testing operations only. The generator will be equipped with
a small, approximately 2,000 gallon capacity diesel storage tank.
The plant will also include a diesel driven emergency fire water pump. The pump engine will be fired on
diesel fuel and its output will be approximately 350 hp. It is expected the emergency fire water pump will
not be operated for more than 500 hours per year as it is only for emergency use and maintenance/testing.
2.12 Process Description for the Cooling Tower
The cooling tower will be a multi-celled, back-to-back style tower. The purpose of the cooling tower is to
cool the water that is circulated in the heat exchangers that condense the steam from the steam turbine.
The cooling tower will be comprised of 34 cells using drift eliminators for the reduction of drift (the
amount of water from the cooling tower carried into the ambient air in liquid form) (emission points S-2
through S-35). Mineral salts present in the water droplets released in the drift form PM as the water
droplets evaporate in the air. So in order to reduce the amount of particulated generated in this manner,
the cooling tower will be equipped with drift eliminators designed to limit drift to 0.0005 percent of the
cooling tower water flow. A water minimization plan will in place at the plant with a goal to reuse water
as much as possible. Even with this plan in place the total dissolved solids (TDS) in the cooling tower
water is expected to be maintained at less than 3300 ppm.
2.13 Process Description for the Solid Materials Handling Facility for Long Term Storage
The facility will maintain a long-term storage facility on site for solid material produced by the plant
namely gypsum and fly ash. The materials will be loaded into trucks from the appropriate storage silo in
the main operational areas of the facility and transported to the on-site storage. The trucks will unload the
solid materials into an active “cell” of the SMHF. There will be separate storage areas for the gypsum
and the fly ash. It is planned that the fly ash can be sold to concrete production facilities and the gypsum
used to produce wall board.

Prevention of Significant Deterioration Air Permit Application January 17, 2008 Plant Washington, Power4Georgians, LLC
070007.2201 2-16
2.14 Plant Production Capacity
The maximum annual coal consumption of the main facility boiler is 431 ton/hr, or 3.78 x 10⁶ ton/yr. The
maximum anticipated power output of the facility is 850 MW net.

Prevention of Significant Deterioration Air Permit Application January 17, 2008 Plant Washington, Power4Georgians, LLC
070007.2201 3-1
3.0 REGULATORY ANALYSIS
3.1 PSD Applicability Analysis
The Power4Georgians facility will emit more than 100 tons per year of several PSD pollutants including
PM10, VOC, NOx, CO, and SO2; therefore, the facility will be considered a major source under the PSD
program since it is one of the 27 industrial categories (fossil fuel-fired steam electric plants of more than
250 million British thermal units per hour heat input). The facility will be located in Washington County,
which is currently designated as an attainment area for all criteria pollutants. Before the proposed project
can be permitted, it must be evaluated according to a PSD applicability analysis, and, if the project
exceeds significant impact levels, a PSD review must be completed for each significant pollutant.
In December 2002, the United States Environmental Protection Agency (USEPA) enacted rules that
changed the NSR program. This permit application, therefore, has been prepared under the new PSD
rules. The first step is to evaluate the potential emissions for all regulated pollutants. As shown in Table
3-1, the proposed project may result in a PSD significant increase for PM10, NOx, CO, VOC, SO2, Pb,
Fluorides, and H2SO4 Because this will be a new facility, there will be no contemporaneous reductions of
emissions to offset these increases, so the project triggers a PSD review for PM, NOx, CO, VOCs, SO2,
Pb, Fluorides, and H2SO4. Also, although Hg emissions are not subject to PSD review per 40 CFR 52.21
Prevention of Significant Deterioration of Air Quality, the Georgia Rules for Air Quality Control,
Georgia Rules Chapter 391-3-1-.02(ttt) require that any boiler installed later than January 1, 2007
operating to produce greater than 25 MW of electricity for sale apply Best Available Control Technology
(BACT) for control of mercury emissions. Therefore, a BACT evaluation has been conducted for the
main facility boiler for control of mercury emissions.
Exhibit A provides calculations of potential emissions for each PSD pollutant for all of the proposed
emission units at Plant Washington. Table 3-1 below provides a facility wide emissions summary for the
facility.

Prevention of Significant Deterioration Air Permit Application January 17, 2008 Plant Washington, Power4Georgians, LLC
070007.2201 3-2
Table 3-1 Facilitywide Emissions Summary
PM PM10 PM2.5 SO2 NOx CO VOC Pb HF H2SO4
Future Emissions
(tpy)
Future Emissions
(tpy)
Future Emissions
(tpy)
Future Emissions
(tpy)
Future Emissions
(tpy)
Future Emissions
(tpy)
Future Emissions
(tpy)
Future Emissions
(tpy)
Future Emissions
(tpy)
Future Emissions
(tpy)Coal-fired Boiler 654 654 374 3272 1818 5453 124 0.61 10.91 182Auxiliary Boiler 2.10 2.10 0.25 5.26 10.51 0.88 0.26 9.46E-04 9.79E-04 6.31E-03Emergency Diesel Generator 0.26 0.26 7.55E-03 1.52 4.88 2.06 0.26 - - -Emergency Firewater Pump 0.193 0.19 5.54E-03 0.18 2.71 0.58 0.22 - - -Cooling Towers 16.28 7.51 3.29E-02 - - - - - - -Crusher House Dust Collector 4.51 4.51 0.72 - - - - - - -Tripper Decker 3.38 3.38 0.54 - - - - - - -Limestone Preparation Building 0.94 0.94 0.25 - - - - - - -Fly Ash Mechanical Exhausters 0.45 0.45 0.26 - - - - - - -Fly Ash Silo 0.28 0.28 0.16 - - - - - - -Bottom Ash Transfer Point to Bottom Ash Bin 2.78E-02 1.32E-02 1.99E-03 - - - - - - -Bottom Ash Transfer Point from Bin to Truck 2.78E-02 1.32E-02 1.99E-03 - - - - - - -Mercury Sorbent Silo 7.04E-02 7.04E-02 7.04E-02 - - - - - - -SO3 Sorbent Silo 7.04E-02 7.04E-02 7.04E-02 - - - - - - -Pre-Treatment Soda Ash Silo 3.52E-02 3.52E-02 3.52E-02 - - - - - - -Pre-Treatment Hydrated Lime Silo 3.52E-02 3.52E-02 9.50E-03 - - - - - - -PRB Stackout 0.28 0.28 4.51E-02 - - - - - - -Illinois No. 6 Stackout 0.28 0.28 4.51E-02 - - - - - - -Limestone Stackout 0.28 0.28 7.60E-02 - - - - - - -Solid Material Handling - Ash 1.73 0.33 0.18 - - - - - - -Solid Material Handling - Gypsum 1.73 0.33 0.18Limestone Unloading 4.39E-03 2.08E-03 3.15E-04 - - - - - - -Unloading Conveyor to Limestone Stackout 3.53E-02 1.67E-02 2.53E-03 - - - - - - -Limestone Pile 2.89E-03 2.89E-03 4.11E-04 - - - - - - -Rail Unloading 2.72E-02 1.29E-02 1.95E-03 - - - - - - -Inactive PRB Coal Pile 8.21 2.05 1.81E-01 - - - - - - -Inactive Illinois No. 6 Coal Pile 8.21 2.05 1.81E-01 - - - - - - -Active PRB Coal Pile 1.76E-02 8.79E-03 1.32E-03 - - - - - - -Transfer Point for Active PRB Coal Pile 0.11 5.17E-02 7.83E-03Active Illinois No. 6 Coal Pile 1.76E-02 8.79E-03 1.32E-03 - - - - - - -Transfer Point for Active Illinois Basin Coal Pile 0.11 5.17E-02 7.83E-03Solid Material Handling Haul Road 0.55 0.55 8.19E-02 - - - - - - -Project Totals 705 681 377 3,279 1,836 5,457 124 0.62 10.91 182PSD Significance Level 25 15 15 40 40 100 40 0.6 3 7Significant Emissions Increase (Yes or No) Yes Yes Yes Yes Yes Yes Yes Yes Yes Yes
Prepared by: LMG 1/10/08 Checked by: SAK 1/10/08

Prevention of Significant Deterioration Air Permit Application January 17, 2008 Plant Washington, Power4Georgians, LLC
070007.2201 3-3
3.2 New Source Performance Standard – Subpart Da Applicability
40 CFR 60.40, Subpart Da regulations apply to fossil fuel fired electric utility steam generating units for
which construction, modification, or reconstruction commenced after September 18, 1978 and have a heat
input capacity of greater than 250 MMBtu/hr. Also, an electric utility steam generating unit is defined in
40 CFR 60.41Da (Definitions) as “…any steam electric generating unit that is constructed for the
purpose of supplying more than one-third of its potential electric output capacity and more than 25 MW
net-electrical output to any utility power distribution system for sale. Also, any steam supplied to a steam
distribution system for the purpose of providing steam to a steamelectric generator that would produce
electrical energy for sale is considered in determining the electrical energy output capacity of the affected
facility”. Since the main facility boiler will have a maximum heat input capacity of greater than 8300
MMBtu/hr, and meets the definition of an electric utility steam generating unit, the main facility boiler
will be subject to Subpart Da.
Subpart Da contains regulatory provisions involving emission limitations, monitoring, reporting, and
recordkeeping requirements for the pollutants PM, SO2, NOX, Hg, and opacity. The following is a
summary of the emission standards present in Subpart Da. Additional regulatory provisions in Subpart
Da, regarding compliance, monitoring, performance testing, and reporting are not provided in this
document. The PM emission standards, NOX emission standards, and Hg emission standards apply at all
times except during periods of startup, shutdown, or malfunction (40 CFR 60.48Da(c)). The emissions
limitations applicable to the main boiler operations are given below.
Opacity – 40 CFR 60.42Da
(b) On and after the date the initial PM performance test is completed or required to be completed under §
60.8, whichever date comes first, no owner or operator subject to the provisions of this subpart shall cause
to be discharged into the atmosphere from any affected facility any gases which exhibit greater than 20
percent opacity (6-minute average), except for one 6-minute period per hour of not more than 27 percent
opacity.

Prevention of Significant Deterioration Air Permit Application January 17, 2008 Plant Washington, Power4Georgians, LLC
070007.2201 3-4
Particulate Matter – 40 CFR 60.42Da
(c) Except as provided in paragraph (d) of this section, on and after the date on which the initial
performance test is completed or required to be completed under § 60.8, whichever date comes first, no
owner or operator of an affected facility that commenced construction, reconstruction, or modification
after February 28, 2005 shall cause to be discharged into the atmosphere from that affected facility any
gases that contain PM in excess of either:
(1) 18 ng/J (0.14 lb/MWh) gross energy output; or
(2) 6.4 ng/J (0.015 lb/MMBtu) heat input derived from the combustion of solid, liquid, or gaseous fuel.
(d) As an alternative to meeting the requirements of paragraph (c) of this section, the owner or operator of
an affected facility for which construction, reconstruction, or modification commenced after February 28,
2005, may elect to meet the requirements of this paragraph. On and after the date on which the initial
performance test is completed or required to be completed under § 60.8, whichever date comes first, no
owner or operator of an affected facility shall cause to be discharged into the atmosphere from that
affected facility for which construction, construction, or modification commenced after February 28,
2005, any gases that contain PM in excess of:
(1) 13 ng/J (0.03 lb/MMBtu) heat input derived from the combustion of solid, liquid, or gaseous fuel, and
(2) 0.1 percent of the combustion concentration determined according to the procedure in § 60.48Da(o)(5)
(99.9 percent reduction) for an affected facility for which construction or reconstruction commenced after
February 28, 2005 when combusting solid, liquid, or gaseous fuel, or
(3) 0.2 percent of the combustion concentration determined according to the procedure in § 60.48Da(o)(5)
(99.8 percent reduction) for an affected facility for which modification commenced after February 28,
2005 when combusting solid, liquid, or gaseous fuel.
Sulfur Dioxide – 40 CFR 60.43Da
(i) On and after the date on which the initial performance test is completed or required to be completed
under § 60.8, whichever date comes first, no owner or operator of an affected facility that commenced

Prevention of Significant Deterioration Air Permit Application January 17, 2008 Plant Washington, Power4Georgians, LLC
070007.2201 3-5
construction, reconstruction, or modification commenced after February 28, 2005 shall cause to be
discharged into the atmosphere from that affected facility, any gases that contain SO2 in excess of the
applicable emission limitation specified in paragraphs (i)(1) through (3) of this section.
(1) For an affected facility for which construction commenced after February 28, 2005, any gases that
contain SO2 in excess of either: (i) 180 ng/J (1.4 lb/MWh) gross energy output on a 30-day rolling
average basis; or (ii) 5 percent of the potential combustion concentration (95 percent reduction) on a 30-
day rolling average basis.
Nitrogen Oxides (NOX) – 40 CFR 60.44Da
On and after the date on which the initial performance test is completed or required to be completed under
§ 60.8, whichever date comes first, no owner or operator of an affected facility that commenced
construction, reconstruction, or modification after February 28, 2005 shall cause to be discharged into the
atmosphere from that affected facility any gases that contain NOX (expressed as NO2) in excess of the
applicable emission limitation specified in paragraphs (e)(1) through (3) of this section.
(1) For an affected facility for which construction commenced after February 28, 2005, the owner or
operator shall not cause to be discharged into the atmosphere any gases that contain NOX (expressed as
NO2) in excess of 130 ng/J (1.0 lb/MWh) gross energy output on a 30-day rolling average basis, except as
provided under § 60.48Da(k).
Mercury (Hg) – 40 CFR 60.45Da
(2) For each coal-fired electric utility steam generating unit that burns only subbituminous coal:
(i) If any unit is located in a county-level geographical area receiving greater than 25 inches per year
(in/yr) mean annual precipitation, based on the most recent publicly available U.S. Department of
Agriculture 30-year data, you must not discharge into the atmosphere any gases from a new affected
source that contain Hg in excess of 66 x 10-6 lb/MWh or 0.066 lb/GWh on an output basis. The SI
equivalent is 0.0083 ng/J.
(ii) If any unit is located in a county-level geographical area receiving less than or equal to 25 in/yr mean
annual precipitation, based on the most recent publicly available U.S. Department of Agriculture 30-year

Prevention of Significant Deterioration Air Permit Application January 17, 2008 Plant Washington, Power4Georgians, LLC
070007.2201 3-6
data, you must not discharge into the atmosphere any gases from a new affected source that contain Hg in
excess of 97 x 10-6 lb/MWh or 0.097 lb/GWh on an output basis. The SI equivalent is 0.0122 ng/J.
(5) For each coal-fired electric utility steam generating unit that burns a blend of coals from different coal
ranks (i.e., bituminous coal, subbituminous coal, lignite) or a blend of coal and coal refuse, you must not
discharge into the atmosphere any gases from a new affected source that contain Hg in excess of the unit-
specific Hg emissions limit established according to paragraph (a)(5)(i) or (ii) of this section, as
applicable to the affected unit.
(i) If you operate a coal-fired electric utility steam generating unit that burns a blend of coals from
different coal ranks or a blend of coal and coal refuse, you must not discharge into the atmosphere any
gases from a new affected source that contain Hg in excess of the computed weighted Hg emissions limit
based on the Btu, MWh, or MJ) contributed by each coal rank burned during the compliance period and
its applicable Hg emissions limit in paragraphs (a)(1) through (4) of this section as determined using
Equation 1 in this section. For each affected source, you must comply with the weighted Hg emissions
limit calculated using Equation 1 in this section based on the total Hg emissions from the unit and the
total Btu, MWh, or MJ contributed by all fuels burned during the compliance period.
Where:
ELb = Total allowable Hg in lb/MWh that can be emitted to the atmosphere from any affected source
being averaged according to this paragraph.
ELi = Hg emissions limit for the subcategory i (coal rank) that applies to affected source, lb/MWh;
HHi = For each affected source, the Btu, MWh, or MJ contributed by the corresponding subcategory i
(coal rank) burned during the compliance period; and
N = Number of subcategories (coal ranks) being averaged for an affected source.

Prevention of Significant Deterioration Air Permit Application January 17, 2008 Plant Washington, Power4Georgians, LLC
070007.2201 3-7
3.3 New Source Performance Standard – Subpart Db Applicability
40 CFR 60.40 Subpart Db regulations apply to steam generating units that commence construction,
modification, or reconstruction after June 19, 1984, and have a heat input capacity of 29 MW, or 100
MMBtu/hr. Since the facility auxiliary boiler will have a maximum heat input capacity of 240
MMBtu/hr, it will be subject to Subpart Db.
Subpart Db contains regulatory provisions involving emission limitations, monitoring, reporting, and
recordkeeping requirements for the pollutants PM, SO2, NOX, and opacity. However, since the auxiliary
boiler will only combust distillate fuel that contains less than 0.3 percent sulfur by weight, the auxiliary
boiler is not subject to the PM, SO2, or opacity limits in Subpart Db, per 40 CFR 60.42b(k)(1),
60.43b(h)(5), and 71 FR 9868. However, the auxiliary boiler will be subject to the NOX emission
standards under Subpart Db. Additional regulatory provisions in Subpart Db, regarding compliance,
monitoring, performance testing, and reporting are not provided in this document. The NOX emission
standards applicable to the facility auxiliary boiler are given below.
Nitrogen Oxides (NOX) – 40 CFR 60.44Db
(a) Except as provided under paragraphs (k) and (l) of this section, on and after the date on which the
initial performance test is completed or is required to be completed under § 60.8, whichever date comes
first, no owner or operator of an affected facility that is subject to the provisions of this section and that
combusts only coal, oil, or natural gas shall cause to be discharged into the atmosphere from that affected
facility any gases that contain NOx (expressed as NO2) in excess of the following emission limits: Natural
gas and distillate oil with a low heat release rate – 0.10 lb/MMBtu; Natural gas and distillate oil with a
high heat release rate – 0.20 lb/MMBtu.
3.4 New Source Performance Standard – Subpart Y Applicability
40 CFR 60.250 Subpart Y regulations apply to any of the following affected facilities in a coal
preparation plant that processes more than 200 tons per day of coal and were constructed or modified
after October 24, 1974: thermal dryers, pneumatic coal cleaning equipment (air tables), coal processing
and conveying equipment (including breakers and crushers), coal storage systems, and coal transfer and
loading systems.
Prevention of Significant Deterioration Air Permit Application January 17, 2008 Plant Washington, Power4Georgians, LLC
070007.2201 3-8
The affected facility operations described above at Plant Washington will be subject to the 40 CFR
60.252 Subpart Y standards for Particulate Matter, which establish an opacity limit. The opacity limit
will be verified through use of EPA Method 9 and the procedures established in 40 CFR 60.254 Subpart
Y. The opacity limit applicable to facility operations under Subpart Y is given below.
(c) On and after the date on which the performance test required to be conducted by § 60.8 is completed,
an owner or operator subject to the provisions of this subpart shall not cause to be discharged into the
atmosphere from any coal processing and conveying equipment, coal storage system, or coal transfer and
loading system processing coal, gases which exhibit 20 percent opacity or greater.
3.5 New Source Performance Standard – Subpart OOO Applicability
The emission standards listed in 40 CFR 60 Subpart OOO, which provide standards of performance for
non-metallic mineral processing plants for applicable sources constructed, modified, or reconstructed
after August 31, 1983, apply to the limestone handling and processing operations at Plant Washington.
Plant Washington will comply with the monitoring, testing, reporting, and recordkeeping requirements of
Subpart OOO.
3.6 New Source Performance Standard – Subpart HHHH Applicability
The Plant Washington main boiler will be subject to the Subpart HHHH requirements contained in the
Clean Air Mercury Rule (CAMR) and discussed in 40 CFR 60 Subpart HHHH since the proposed facility
is a new coal fired power plant. The provisions of the Clean Air Mercury Rule (CAMR) are further
discussed in Section 3.10.
3.7 New Source Performance Standard – Subpart IIII Applicability
40 CFR Part 60, Subpart IIII establishes standards of performance for stationary compression ignition
internal combustion engines. Applicable sources to Subpart IIII at Plant Washington will include the
emergency generator (engine) and the fire pump. Applicable emission standards under Subpart IIII are
related to the hp rating of the engine and the year the engine was manufactured. The facility will comply
with the applicable Subpart IIII emission limits by purchasing an emergency generator (engine) and fire
pump certified to the emissions standards of Subpart IIII.

Prevention of Significant Deterioration Air Permit Application January 17, 2008 Plant Washington, Power4Georgians, LLC
070007.2201 3-9
3.8 New Source Performance Standard – Subpart Kb
40 CFR Part 60, Subpart Kb establishes standards of performance for volatile organic liquid storage
Vessels (including petroleum liquid storage vessels) for which construction, reconstruction, or
modification commenced after July 23, 1984. Subpart Kb applies to storage vessels containing volatile
organic liquids (VOLs) with a capacity greater than or equal to 75 cubic meters (m3), or approximately
19,800 gallons. One on-site storage vessel, the 350,000 gallon distillate fuel oil tank used for operation of
the auxiliary boiler and main boiler startup operations, will have a storage capacity greater than 75 m3.
However, Subpart Kb does not apply to storage vessels with a capacity greater than 151 m3 storing a
liquid with a maximum true vapor pressure less than 3.5 kilopascals (kPa). Since the vapor pressure of
distillate fuel oil is below 3.5 kPa, the tank is exempt from Subpart Kb.
3.9 National Emission Standards For Hazardous Air Pollutants – Subpart ZZZZ
40 CFR Part 63, Subpart ZZZZ establishes a Maximum Achievable Control Technology (MACT)
standard for Stationary Reciprocating Internal Combustion Engines. Engines rated at less than 500 hp,
such as the emergency fire water pump, are not subject to the Rule. Under Subpart ZZZZ, emergency
internal combustion engines, such as the emergency diesel generator at the facility, are subject to the
initial notification requirements of 40 CFR 63.6645(d).
3.10 National Emission Standards For Hazardous Air Pollutants – Subpart DDDDD
40 CFR Part 63, Subpart DDDDD, affected Industrial, Commercial, and Institutional Boilers and Process
Heaters. However, Subpart DDDDD was rescinded. Therefore, a case-by-case MACT evaluation was
conducted for the facility auxiliary boiler. Although rescinded, the facility auxiliary boiler will comply
with the emissions limits previously established for CO in Subpart DDDDD. The emission limits
established by Subpart DDDDD were 0.03 lb/MMBtu for PM, 0.0009 lb/MMBtu for HCl, and 400 ppm
for CO. The established BACT emission limits for PM and CO will demonstrate compliance with the
case-by-case MACT emission limits for PM and CO.
3.11 Clean Air Mercury Rule (CAMR)
On March 15, 2005, the EPA issued the first federal rule to permanently reduce and cap Hg emissions
from coal fired power plants. This rule, known as the Clean Air Mercury Rule (CAMR), builds on EPA’s
Clean Air Interstate Rule (CAIR) to reduce mercury emissions from coal fired power plants from an
estimated 48 tons/yr to 15 tons/yr, a reduction of nearly 70 percent. The CAMR establishes standards of

Prevention of Significant Deterioration Air Permit Application January 17, 2008 Plant Washington, Power4Georgians, LLC
070007.2201 3-10
performance for mercury, limiting emissions from new and existing coal fired power plants and creating a
market based, cap and trade program that will reduce nationwide emissions of mercury form coal fired
power plants in two phases. The first phase involves a 38 ton/yr mercury cap by 2010 as a co-benefit
reduction through reduction of SO2 and NOX emissions under the requirements of the CAIR. In the
second phase, due in 2018, coal fired power plants will be subject to a second cap, reducing emissions to
15 tons/yr upon full implementation. Power plants with coal fired units will be required to install and
operate mercury specific CEMs.
The requirements of the CAMR have been incorporated into the Georgia Rules For Air Quality Control,
Chapter 391-3-1-.02(14). Plant Washington will maintain compliance with the applicable requirements of
the CAMR.
3.12 Acid Rain Program
The Title IV Acid Rain provisions, adopted as part of the 1990 Clean Air Act (CAA) Amendments, are
primarily designed to control SO2 and NOX emissions from fossil fuel-fired combustion devices in the
electricity generating industry. Along with emission limitations, there are requirements for monitoring,
testing, recordkeeping, and reporting. A new facility must apply for an acid rain program permit at least
24 months before operations of the proposed unit begin. All requirements of the Acid Rain Program will
be met by Plant Washington. The proper Acid Rain Permit Application forms will be submitted
following submittal of this permit application.
3.13 New Source Review
Plant Washington will be located in Washington County, which is currently classified as an attainment
area for all criteria pollutants. PSD section (40 CFR 51.166) of the NSR Regulations (40 CFR 51 Subpart
I) requires states to implement a program to prevent deterioration of air quality beyond National Ambient
Air Quality Standards (NAAQS) levels. The Georgia EPD has implemented such a program by adopting
past federal regulations (namely 40CFR 52.21). Because Plant Washington would be considered a new
major PSD source of emissions, the project must be evaluated to determine whether emission increases
will exceed major modification levels. This evaluation is discussed in Section 3.1, and the supporting
analyses for PSD are presented in Sections 4, 5, 7, and 8.

Prevention of Significant Deterioration Air Permit Application January 17, 2008 Plant Washington, Power4Georgians, LLC
070007.2201 3-11
3.14 Fine Particulate Review Requirements (PM2.5)
In 1997 NAAQS were set for fine particulate. Fine particles or "PM2.5" can aggravate heart and lung
diseases and have been associated with premature death and a variety of serious health problems
including heart attacks, chronic bronchitis and asthma attacks. This standard was set in addition to the
PM10 NAAQS that was already existing. On September 8, 2005, the Environmental Protection Agency
(EPA) issued a proposed rule implementing the 1997 fine particle (PM2.5) national ambient air quality
standards. On March 29, 2007, EPA issued a final rule defining requirements for state plans to clean the
air in 39 areas where particle pollution levels do not meet national air quality standards. This rule
addressed only those areas that which are not in attainment with the standard and listed no additional
requirements for those areas which are currently in attainment with the standard. Therefore in this
application we have reviewed and addressed control of emissions of PM10 which also includes the
subcategory of PM2.5. By doing this it is expected that controls specified for PM10 will also address
required controls of PM2.5.
3.15 Georgia State Requirements
The Georgia Rules For Air Quality Control, Chapter 391-3-1, have promulgated rules for emission
limitations regarding visible emissions, fuel burning equipment, fugitive dust, and mercury emissions
from new electric generating units. Georgia Rule 391-3-1-.02(ttt) requires application of BACT to Hg
emissions from new coal-fired electric generation units installed after January 1, 2007 and that generate
greater than 25 MW of electricity for sale. Therefore, the main boiler at Plant Washington will be subject
to the Georgia Rule 391-3-1-.02(ttt). Additional emission limitation requirements under the Georgia
Rules for Air Quality Control are less stringent than the application of BACT, or other applicable
requirements such as New Source Performance Standards (NSPS) to the emission units present at Plant
Washington. Plant Washington, where applicable, shall maintain compliance with all Georgia State
Requirements.
3.16 Compliance Assurance Monitoring (CAM) Plan
The Compliance Assurance Monitoring (CAM) Rule, established in 40 CFR Part 64, was established in
order to provide reasonable assurance that facilities comply with emissions limitations by monitoring the
operation and maintenance of their control devices. In order to be subject to CAM, the following criteria
must be met:
Prevention of Significant Deterioration Air Permit Application January 17, 2008 Plant Washington, Power4Georgians, LLC
070007.2201 3-12
1. An emission unit must be subject to an emission limit or standard for the pollutant of concern.
2. A control device is used to achieve compliance with the emission limit or standard.
3. The emission unit’s potential pre control emissions are greater than the applicable Title V Major
Source threshold for the pollutant of concern.
The CAM rule is not applicable to emission unit pollutant emissions that are subject to New Source
Performance Standards (NSPS) or National Emission Standards For Hazardous Air Pollutants (NESHAP)
regulations, Acid Rain Program, or other emissions trading programs. For example, Nitrogen Oxides
(NOX) and Sulfur Dioxide (SO2) emissions from the main facility boiler are subject to monitoring
requirements under the Acid Rain Program. Therefore, the facility will be exempt from CAM for NOX
and SO2 for the main boiler.
A CAM Plan will be developed for applicable facility units and submitted with the facility Title V
Application.

Prevention of Significant Deterioration Air Permit Application January 17, 2008 Plant Washington, Power4Georgians, LLC
070007.2201 4-1
4.0 BACT ANALYSIS
4.1 Introduction
Sources undergoing a PSD review must apply BACT to any new or modified emission unit that emits a
PSD-triggered pollutant in an amount above significant impact levels. Federal PSD regulations define
BACT as “an emission limitation (including a visible emission standard) based on the maximum degree
of reduction of each pollutant subject to regulation under the Clean Air Act, emitted from or which results
from any major emitting facility, which the permitting authority, on a case-by-case basis, taking into
account energy, environmental, and economic impacts and other costs, determines is achievable for such
facility through application of production processes and available methods, systems, and techniques,
including cleaning or treatment or innovative fuel combustion techniques for control of each such
pollutant.” No BACT determination may be less stringent than the applicable NSPS, NESHAP, or State
Implementation Plan (SIP) limits.
On December 1, 1987, the USEPA Assistant Administrator for Air and Radiation issued a memorandum
that implemented certain program initiatives designed to improve the effectiveness of the NSR programs
in the confines of existing regulations and SIPs. Among these was the “top-down” method for
determining BACT. The top-down process provides that available control technologies be ranked in
descending order of control effectiveness. The first step of this process is to evaluate the most stringent
or “top” alternative. This represents BACT, unless it can be demonstrated, and the permitting authority
agrees, that technical considerations, energy, environmental, or economic impacts justify a conclusion
that the most stringent technology is not “achievable” in a particular case. If the most stringent
technology is eliminated in this fashion, then the next most stringent alternative is considered, and so on,
until the most appropriate control strategy is selected for each source.
BACT is required for any emission unit that emits a PSD triggering pollutant. Table 3-1 identifies all
PSD triggering pollutants as PM/PM10, NOX, CO, SO2, VOCs, Pb, Fluorides, and H2SO4. In addition, a
BACT analysis should also address opacity. A BACT analysis is required for any emission unit that
emits any one of these pollutants. Table 4-1 summarizes the facility operations requiring a BACT
analysis.

Prevention of Significant Deterioration Air Permit Application January 17, 2008 Plant Washington, Power4Georgians, LLC
070007.2201 4-2
Table 4-1 Facility Operations at the Facility Requiring a BACT Review
The Washington Plant - Supercritical Pulverized Coal Boiler - Auxiliary Boiler - Diesel Engine Generator and Fire Water
Pump - Cooling Towers - Material Handling and Storage Facilities - Storage Tanks
Prepared by: PMH 1/10/08 Checked by: JDF 1/10/08
4.2 Key Steps in a Top-Down BACT Analysis
To develop the BACT analysis, the key steps outlined in the NSR US PSD Guidance Document (1990)
were followed. These steps include:
Step 1 – Identify All Control Technologies
The primary objective of Step 1 is, for the emission unit in questions (i.e. PC boiler) identify all
“available” control options. Available control options are defined in the 1990 Draft New
Source Review Workshop Manual as “those air pollution control technologies or techniques
with a practical potential for application to the emissions unit and the regulated pollutant
under evaluation. Air pollution control technologies and techniques include the application of
production process or available methods, systems, and techniques, including fuel cleaning or
treatment or innovative fuel combustion techniques for control of the affected pollutant. This
includes technologies employed outside of the United States. As discussed later, in some
circumstances inherently lower-polluting processes are appropriate for consideration as
available control alternatives. The control alternatives should include not only existing
controls for the source category in question, but also (through technology transfer) controls
applied to similar source categories and gas streams, and innovative control technologies.
Technologies required under lowest achievable emission rate (LAER) determinations are
available for BACT purposes and must also be included as control alternatives and usually
represent the top alternative.”
A lower polluting process or practice is considered applicable if it has been demonstrated for a
similar emission unit or application. An add-on control is considered applicable if it can

Prevention of Significant Deterioration Air Permit Application January 17, 2008 Plant Washington, Power4Georgians, LLC
070007.2201 4-3
properly function given the physical characteristics of the pollutant stream being controlled (i.e.
gas stream temperature, pollutant concentration, etc.).
Potentially applicable control options were surveyed. These included control technologies that
have been used in other source categories and countries. Control technologies identified by
LAER determinations were also included as available control technologies.
Based on the guidelines provided in the USEPA Draft New Source Review Workshop Manual
document, a comprehensive list of available control technologies was developed for this permit
application.
A December 13, 2005 letter from Stephen Page, Director of USEPA’s Office of Air Quality,
Planning and Standards to E3 Consulting, LLC regarding BACT requirements for proposed coal-
fired power plant projects stated “As noted in prior EPA decisions and guidance, EPA does not
consider the BACT requirement as a means to redefine the basic design of the source or change
the fundamental scope of the project when considering available control alternatives. For
example, we do not require applicants proposing to construct a coal-fired steam electric
generator to consider building a natural gas-fired combustion turbine as part of a BACT
analysis, even though the turbine may be inherently less polluting per unit product (in this case
electricity).”
An excerpt from the USEPA’s Draft New Source Review Workshop Manual, page B.13, states
the following; “Historically, EPA has not considered the BACT requirement as a means to
redefine the design of the source when considering available control alternatives. For example,
applicants proposing to construct a coal-fired electric generator, have not been required by EPA
as part of a BACT analysis to consider building a natural gas-fired electric turbine although the
turbine may be inherently less polluting per unit product (in this case electricity). However, this
is an aspect of the PSD permitting process in which states have the discretion to engage in a
broader analysis if they so desire. Thus, a gas turbine normally would not be included in the list
of control alternatives for a coal-fired boiler. However, there may be instances where, in the
permit authority's judgment, the consideration of alternative production processes is warranted
and appropriate for consideration in the BACT analysis.”

Prevention of Significant Deterioration Air Permit Application January 17, 2008 Plant Washington, Power4Georgians, LLC
070007.2201 4-4
Due to the above discussed documentation, alternative plant design strategies, such as Integrated
Gasification Combined Cycle (IGCC) or Circulating Fluidized Bed (CFB) technologies, have not
been evaluated as part of this BACT analysis.
Step 2 – Eliminate Technically Infeasible Options
The purpose of Step 2 is to evaluate the technical feasibility of the control technology options
identified in Step 1. Control technologies that have been installed and operated successfully on
the type of emission unit under review are considered demonstrated and technically feasible.
Control technologies that are not applicable or not available are determined to be technically
infeasible. For a technology that has not been demonstrated for a particular type of emission
unit, the Draft New Source Review Workshop Manual provides the following guidance.
“Two key concepts are important in determining whether an undemonstrated technology is
feasible: "availability" and "applicability." As explained in more detail below, a technology is
considered "available" if it can be obtained by the applicant through commercial channels or is
otherwise available within the common sense meaning of the term. An available technology is
"applicable" if it can reasonably be installed and operated on the source type under
consideration. A technology that is available and applicable is technically feasible.”
“A control technique is considered available, within the context presented above, if it has
reached the licensing and commercial sales stage of development. A source would not be
required to experience extended time delays or resource penalties to allow research to be
conducted on a new technique. Neither is it expected that an applicant would be required to
experience extended trials to learn how to apply a technology on a totally new and dissimilar
source type. Consequently, technologies in the pilot scale testing stages of development would
not be considered available for BACT review. An exception would be if the technology were
proposed and permitted under the qualifications of an innovative control device consistent with
the provisions of 40 CFR 52.21(v) or, where appropriate, the applicable SIP.”
“Commercial availability by itself, however, is not necessarily sufficient basis for
concluding a technology to be applicable and therefore technically feasible. Technical
feasibility, as determined in Step 2, also means a control option may reasonably be
deployed on or "applicable" to the source type under consideration.”

Prevention of Significant Deterioration Air Permit Application January 17, 2008 Plant Washington, Power4Georgians, LLC
070007.2201 4-5
“Technical judgment on the part of the applicant and the review authority is to be exercised in
determining whether a control alternative is applicable to the source type under consideration.
In general, a commercially available control option will be presumed applicable if it has been
or is soon to be deployed (e.g., is specified in a permit) on the same or a similar source type.
Absent a showing of this type, technical feasibility would be based on examination of the
physical and chemical characteristics of the pollutant-bearing gas stream and comparison to
the gas stream characteristics of the source types to which the technology had been applied
previously. Deployment of the control technology on an existing source with similar gas stream
characteristics is generally sufficient basis for concluding technical feasibility barring a
demonstration to the contrary.”
Step 3 – Rank Remaining Technically Feasible Control Options
The third step in the five step Top-Down BACT evaluation process involves ranking of the
technically feasible control options determined in Step 2 from most effective to least effective
in terms of emissions reduction potential. Step 3 also determines the energy, economic, and
environmental impacts associated with the technically feasible control options, which are more
fully evaluated in Step 4 of the process.
Ranking control options involves the selection of appropriate units of emissions for comparison
between types of control technologies and emission units. For purposes of this BACT
evaluation, the unit of measure for the emission rate for each pollutant from a combustion
source was pounds per million British thermal units (lb/MMBtu) with the exception of
Mercury. For Mercury, the unit of measure was lb/MW-hr, which is an output based limit. The
establishment of output based limits for mercury is consistent with the NSPS Subpart Da
emission limits established for Mercury. Achievable emission limits were determined for each
of the control technology options based on engineering estimates, published literature, and
testing data from existing sources. After establishing performance levels for the technically
feasible control technologies, tables were developed to rank the various control technology
alternatives by their demonstrated emissions reduction performance. Also, as indicated in the
Draft New Source Review Workshop Manual regarding selection of the defined “top” control
technology alternative;

Prevention of Significant Deterioration Air Permit Application January 17, 2008 Plant Washington, Power4Georgians, LLC
070007.2201 4-6
“…an applicant proposing the top control alternative need not provide cost and other
detailed information in regard to other control options. In such cases the applicant should
document that the control option chosen is, indeed, the top, and review for collateral
environmental impacts.”
Step 4 – Evaluate Remaining Control Technologies
Step 4 of the five step Top-Down BACT evaluation process involves evaluating the suitability
of the ranked control technology options under Step 3, based on energy, economic, and
environmental impacts of utilization of the control technology. The following excerpt, taken
from the Draft New Source Review Workshop Manual, explains the general evaluation process
of Step 4.
“If the applicant accepts the top alternative in the listing as BACT, the applicant proceeds to
consider whether impacts of unregulated air pollutants or impacts in other media would justify
selection of an alternative control option. If there are no outstanding issues regarding
collateral environmental impacts, the analysis is ended and the results proposed as BACT. In
the event that the top candidate is shown to be inappropriate, due to energy, environmental, or
economic impacts, the rationale for this finding should be documented for the public record.
Then the next most stringent alternative in the listing becomes the new control candidate and is
similarly evaluated. This process continues until the technology under consideration cannot be
eliminated by any source-specific environmental, energy, or economic impacts which
demonstrate that alternative to be inappropriate as BACT.”
The energy impacts analysis determines whether the use of the control technology results in
any significant or unusual energy penalties or benefits. The economic impacts analysis
evaluates average and incremental cost effectiveness to determine if use of the control
technology would result in a negative economic impact. The evaluation of environmental
impacts considers the site specific environmental impacts of use of the control technology
option, involving issues such as waste generation, water use and discharge, visibility impacts,
emissions of additional pollutants, etc.

Prevention of Significant Deterioration Air Permit Application January 17, 2008 Plant Washington, Power4Georgians, LLC
070007.2201 4-7
Step 5 – Selection of BACT
The highest ranked and most effective control option not eliminated in Step 4 for energy,
economic, or environmental impacts is selected and proposed as BACT for that pollutant and
emission unit.
Table 4-2 summarizes the proposed BACT levels for all emission units subject to BACT. This table
provides the overall conclusions of all the analyses that follow. In addition to proposing BACT emission
limits for the emission units subject to BACT, Table 4-2 also includes a summary of the proposed
compliance methods for demonstrating compliance with the applicable pollutants. To develop these
analyses, MACTEC obtained information from the following databases and listings to identify emission
limits and control technologies which apply to sources being proposed for the Project:
• The USEPA RACT/BACT/LAER Clearinghouse (RBLC)
• USEPA’s New Source Review Technology Transfer Network website
• Federal and State New Source Review (NSR) permits, permit applications, and associated reports
• Discussions with control technology vendors
• Discussions with Georgia EPD and other State Air Quality Branch personnel
• National Coal-Fired Utility NSR Spreadsheet (November 2007)
Reviewing the information provided in these documents ensure that the latest appropriate control
technology results of these reviews provide a comprehensive list of control technologies that are used in
industry today.

Prevention of Significant Deterioration Air Permit Application January 17, 2008 Plant Washington, Power4Georgians, LLC
070007.2201 4-8
Table 4-2 BACT Analysis Summary Table
Source Pollutant Control
Technology Emission Limit (lb/MMBtu)
Proposed Compliance Test
Method
Particulate Matter (PM/PM10)
Fabric Filter Baghouse
Total PM10 – 0.018 lb/MMBtu (3-hr. average)
Total PM (excluding SAM)
– 0.018 lb/MMBtu
NSPS Limit 0.015 lb/MMbtu Filterable PM
PM10 – USEPA Method
201A/202 with N2 Purge or
USEPA CTM-039/40
PM – USEPA Method 5B
Nitrogen Oxides (NOX) LNB/OFA/SCR 0.05 lb/MMBtu – Annual
Avg. CEMS Monthly
Avg.
Carbon Monoxide (CO)
Combustion Controls
0.15 lb/MMBtu – 30 Day Avg.
0.30 lb/MMBtu – 1 hr. Avg.
CEMS Monthly Avg.
USEPA Method
10
Volatile Organic Compounds (VOC)
Combustion Controls
0.0034 lb/MMBtu – 3 hr. Avg.
USEPA Method 25A Minus
USEPA Method 18 (Methane
Removal)
Sulfur Dioxide (SO2)
Wet Flue Gas Desulfurization
(WFGD)
0.09 lb/MMBtu – 12 Month Rolling Avg.
996 lb/hr – 3 hr. Avg.
CEMS Monthly Avg.
USEPA Method
6C
Lead (Pb) Fabric Filter Baghouse
1.69 x 10⁻⁵ lb/MMBtu – 3 hr. Avg.
USEPA Method 29
Fluorides (as HF) Wet Flue Gas
Desulfurization (WFGD)
3.0 x 10⁻⁴ lb/MMBtu – 3 hr. Avg.
USEPA Method 13A or USEPA
Method 26
Sulfuric Acid Mist (H2SO4)
Sorbent Injection and Wet Flue Gas
Desulfurization (WFGD)
0.005 lb/MMBtu – 3 hr. Avg.
USEPA CTM-013 (Controlled
Condensate Method 8A)
Supercritical Pulverized Coal (SCPC) Boiler
Mercury (Hg)
Multi-Control: Sorbent
Injection In Conjunction
With SCR/FF/WFGD
15 x 10-6 lb/MWh-hr Annual Avg.
USEPA Method 29, 30A, or 30B, or Ontario Hydro Method (ASTM Method D6784-
02) CEMS
Particulate Matter (PM/PM10)
Combustion Controls 0.02 lb/MMBtu Fuel
Specification
Nitrogen Oxides (NOX)
Combustion Controls – LNB/FGR
0.1 lb/MMBtu Engineering Controls
Carbon Monoxide (CO)
Combustion Controls 0.04 lb/MMBtu Engineering
Controls
Auxiliary Boiler
Volatile Organic Compounds (VOC)
Combustion Controls 0.003 lb/MMBtu Engineering
Controls

Prevention of Significant Deterioration Air Permit Application January 17, 2008 Plant Washington, Power4Georgians, LLC
070007.2201 4-9
Table 4-2 BACT Analysis Summary Table (Continued)
Source Pollutant Control Technology Emission Limit
(lb/MMBtu)
Proposed Compliance Test
Method
Sulfur Dioxide (SO2) Use of Low Sulfur
Diesel 0.05 lb/MMbtu Fuel Specification Auxiliary Boiler
Sulfuric Acid Mist (H2SO4)
Use of Low Sulfur Diesel 6.0 x 10⁻⁵ lb/MMBtu Fuel Specification
Particulate Matter (PM/PM10)
Use of Low Sulfur Diesel
Nitrogen Oxides (NOX)
Good Combustion Practices
Carbon Monoxide (CO)
Good Combustion Practices
Volatile Organic Compounds (VOC)
Good Combustion Practices
Sulfur Dioxide (SO2) Use of Low Sulfur
Diesel
Diesel Engine Generator and Fire
Water Pump
Sulfuric Acid Mist (H2SO4)
Use of Low Sulfur Diesel
See BACT Discussion Section 4.5
Cooling Towers Particulate Matter (PM/PM10)
Drift Eliminators
0.0005 percent Drift
Total Dissolved Solids (TDS) Limit
3300 mg/L
Vendor Data
Quarterly TDS Testing
Material Handling and Storage
Facilities
Particulate Matter (PM/PM10)
See BACT Discussion Section 4.7
Fuel Storage Tanks VOC See BACT Discussion Section 4.8 Opacity Multi – Pollutant See BACT Discussion Section 4.9
Prepared by: PMH 1/10/08 Checked by: JDF 1/10/08
Prevention of Significant Deterioration Air Permit Application January 17, 2008 Plant Washington, Power4Georgians, LLC
070007.2201 4-10
4.3 Supercritical Pulverized Coal (SCPC) Boiler
This section contains the BACT analysis for the planned 850 MW net SCPC unit planned for use at the
facility. A summary of the BACT results for the SCPC boiler is found in Table 4-2 above.
4.3.1 BACT Demonstration for PM Emissions from the Supercritical Pulverized Coal Boiler
The composition and amount of PM emissions from a coal fired boiler is a function of the type of coal
used, firing configuration of the boiler, and emission controls in place on the unit. The primary source of
PM emissions from coal-fired boilers is a result of incombustible inert matter (ash) in the fuel and
condensable substances such as acid gases. Sub-bituminous coals such as PRB coals are usually of lower
heating value due to the higher moisture content present when compared to bituminous coals.
Step 1 – Identify All Control Technologies
Lower Emitting Process or Practice – Coal Selection
A potential pre-combustion control method for reduction of Particulate Matter (PM) emissions
is the use of coals that contain a lower ash content. Combustion of a lower ash containing coal
would lead to a lower content of incombustible matter in the coal fuel source, leading to less fly
ash generation and thus lower PM emissions.
Lower Emitting Process or Practice – Coal Cleaning
Coal cleaning, also called coal benefaction, or coal washing, is a cleaning process in which
mineral ash matter is removed from mined coal to produce a “cleaner” coal. Coal cleaning is
generally performed in order to remove impurities in the coal to improve the heat content of the
coal, thereby improving power plant capacity, reduce maintenance costs at power plants and
extend plant life. Coal cleaning is also performed to reduce potential air pollutants, including
reduction of PM emissions through reduction of the ash content of the coal.

Prevention of Significant Deterioration Air Permit Application January 17, 2008 Plant Washington, Power4Georgians, LLC
070007.2201 4-11
Fabric Filter Baghouse
Fabric filters are used for PM control in a wide variety of industries, including use as PM
control on PC fired boilers, and are capable of achieving control efficiencies of 99 percent or
greater. According to the USEPA’s fabric filter fact sheet (2003) “flue gas is passed through a
tightly woven or felted fabric, causing PM in the flue gas to be collected on the fabric by
sieving and other mechanisms. Fabric filters may be in the form of sheets, cartridges, or bags,
with a number of the individual fabric filter units housed together in a group. Bags are the
most common type of fabric filter. The dust cake that forms on the filter from the collected PM
can significantly increase collection efficiency. Fabric filters are frequently referred to as
baghouses because the fabric is usually configured in cylindrical bags. Bags may be 6 to 9 m
(20 to 30 ft) long and 12.7 to 30.5 centimeters (cm) (5 to 12 inches) in diameter. Groups of
bags are placed in isolable compartments to allow cleaning of the bags or replacement of some
of the bags without shutting down the entire fabric filter.”
Advantages of fabric filters can include the following:
1. Can provide high collection efficiencies on both coarse and fine (submicron)
particulates.
2. Fabric filters are available in a large number of configurations and system designs,
allowing for high flexibility in design.
3. Collected material is collected dry for subsequent processing or disposal.
Some disadvantages of fabric filters include:
1. Fabric filters can have relatively high maintenance requirements (filter bag
replacement).
2. Concentrations of dusts in the collector can represent a fire or explosion hazard if a
spark or flame is somehow introduced.

Prevention of Significant Deterioration Air Permit Application January 17, 2008 Plant Washington, Power4Georgians, LLC
070007.2201 4-12
3. The units cannot be operated in high moisture gas streams; moisture can cause caking
or plugging of the fabric filter.
Dry Electrostatic Precipitator (ESP)
Dry electrostatic precipitators (ESPs) are used in a wide variety of source categories for control
of PM emissions, and are capable of achieving control efficiencies of 99 percent or greater.
The following is an excerpt from the USEPA’s dry ESP fact sheet (2003);
“An ESP is a particulate control device that uses electrical forces to move particles entrained
within an exhaust stream onto collector plates. The entrained particles are given an electrical
charge when they pass through a corona, a region where gaseous ions flow. Electrodes in the
center of the flow lane are maintained at high voltage and generate the electrical field that
forces the particles to the collector walls. In dry ESPs, the collectors are knocked, or
“rapped”, by various mechanical means to dislodge the particulate, which slides downward
into a hopper where they are collected. The hopper is evacuated periodically, as it becomes
full. Dust is removed through a valve into a dust handling system, such as a pneumatic
conveyor, and is then disposed of in an appropriate manner.”
Advantages of dry ESPs include the following:
1. Are capable of very high efficiencies, even for small particulate sizes.
2. Can be designed for a wide range of gas temperatures, and can handle high
temperatures (up to 1300 degrees F).
3. Relatively large gas flow rates can be effectively handled.
Some disadvantages of dry ESPs include the following:
1. High capital costs and high maintenance items, such as the wire discharge electrodes.
2. Generally not suited for processes that are highly variable because they are sensitive to
fluctuations in gas stream conditions (temperature, flow rate, particulate loading, etc.).

Prevention of Significant Deterioration Air Permit Application January 17, 2008 Plant Washington, Power4Georgians, LLC
070007.2201 4-13
3. Fly ash from the combustion of low sulfur coal typically has a high resistivity, and thus
is difficult to collect.
Wet Electrostatic Precipitator (WESP)
A Wet Electrostatic Precipitator (WESP) is commonly used in situations where a dry ESP is not
viable, such as when the material to be collected is wet, flammable, or has a high resistivity.
WESPs are commonly used by the wood products and metallurgical industries, and can achieve
PM control efficiencies of greater than 99 percent. The following is an excerpt from the
USEPA’s WESP fact sheet (2003).
“An ESP is a particulate control device that uses electrical forces to move particles entrained
within an exhaust stream onto collector plates. The entrained particles are given an electrical
charge when they pass through a corona, a region where gaseous ions flow. Electrodes in the
center of the flow lane are maintained at high voltage and generate the electrical field that
forces the particles to the collector walls. In wet ESPs, the collectors are either intermittently
or continuously washed by a spray of liquid, usually water. The collection hoppers used by dry
ESPs are replaced with a drainage system. The wet effluent is collected, and often treated on-
site.”
Advantages of WESPs include the following:
1. Are capable of very high efficiencies, even for low particulate sizes.
2. Relatively large gas flow rates can be effectively handled.
3. WESPs can collect sticky particles, mists, and highly resistive or explosive dusts due to
the humid atmosphere from washing in the ESP.
4. Continuous or intermittent washing with a liquid eliminates the reentrainment of
particles, which dry ESPs are subject to through the rapping process.
Some disadvantages of WESPs include the following:

Prevention of Significant Deterioration Air Permit Application January 17, 2008 Plant Washington, Power4Georgians, LLC
070007.2201 4-14
1. High capital costs and high maintenance items, such as the wire discharge electrodes.
2. Generally not suited for processes that are highly variable because they are sensitive to
fluctuations in gas stream conditions (temperature, flow rate, particulate loading, etc.).
3. WESPs add the complexity of a wash system, and the fact that the resulting slurry must
be handled more carefully than a dry product, and can require treatment.
4. WESPs are typically operated at gas stream temperatures less than 190 degrees F, and
usually must be constructed of noncorrosive materials.
Electro-Catalytic Oxidation
Electro Catalytic Oxidation is a multi-pollutant technology developed by the Powerspan
Corporation. Electro Catalytic Oxidation is capable of simultaneously controlling NOX, SO2,
PM, Hg, and other trace elements in a three step process involving ash removal in a
conventional dry ESP, passing the gas stream through a barrier discharge reactor to oxidize
gaseous pollutants, and finally passing the gas stream through a WESP.
Venturi Scrubber
A venturi scrubber is a type of wet scrubber using a venturi device to increase the gas velocity
in the unit. Increased velocity of the gas stream improves the gas liquid contact in the scrubber.
A cyclonic separator or mist eliminator is typically used to collect the PM and excess liquid
droplets.
Centrifugal Separator (Cyclone)
A cyclone is a particulate control device which uses centrifugal forces to separate PM from the
flue gas stream. The use of cyclones, and multiple cyclone type devices (multiclones) or series
cyclone devices, are being replaced over time by more efficient control devices such as fabric
filter baghouses and ESPs. Cyclones are not as efficient at collecting small particles, and are
most efficient at collecting larger coarse particles. This is due to the fact that the smaller
particles have a lower mass to generate the centrifugal forces needed for collection. Pulverized

Prevention of Significant Deterioration Air Permit Application January 17, 2008 Plant Washington, Power4Georgians, LLC
070007.2201 4-15
coal boilers tend to produce a smaller fraction of coarse particles compared to other types of
boilers.
Advanced Hybrid Particulate Collector
An Advanced Hybrid Particulate Collector (AHPC) is a new type of control device under
development which combines the best features of electrostatic precipitators (ESPs) and fabric
filter baghouses. The AHPC combines the technologies of an ESP and a fabric filter baghouse
into one control device.
Agglomerator
There are varying types of particulate control devices termed “agglomerator”. One such type,
the Indigo Agglomerator, was developed in Australia for reduction in visible emissions from
coal-fired boilers. An agglomerator is essentially a modification of a standard ESP design. In
the Indigo Agglomerator there are two sections, a bipolar charger followed by a mixing section.
The bipolar charger has varying passages with positive or negative charging. A conventional
ESP only has negative charging electrodes. Following the charging sections, the positive and
negatively charged particles are brought together in a mixing chamber, where the particles are
electrostatically attracted to each other. The agglomerated particles enter the precipitator,
where they are more effectively removed due to their large size.
Side Stream Separator
Side stream separation would be a type of particulate matter emission control in which a
cyclone type primary separator in conjunction with a fabric filter baghouse in side stream
relation to the cyclone separator would be used to collection PM emissions.

Prevention of Significant Deterioration Air Permit Application January 17, 2008 Plant Washington, Power4Georgians, LLC
070007.2201 4-16
Step 2 – Eliminate Technically Infeasible Options
Lower Emitting Process or Practice – Coal Selection
The type of coal used in a boiler can greatly affect the design of the boiler and associated air
pollution control equipment. While use of a lower ash fuel (and corresponding higher heating
value coal) could result in lower PM emissions, any lower ash fuel used could have a higher
sulfur content, and lead to increased emissions of SO2. Also, coals are not typically sorted per
ash content. Therefore, coal selection is not a technically feasible option for control of PM
emissions for the facility.
Lower Emitting Process or Practice – Coal Cleaning
Coal cleaning is considered effective for coals with a significant overburden. However, PRB
coals are typically mined from thick coal seams with little overburden, and PRB coal mining
techniques produce a coal product with little rock and non-combustible material. Also, PRB
coals typically contain low ash levels. For these reasons, coal cleaning is typically not
conducted for PRB coals. Illinois #6 coals do contain a higher ash content than PRB coals.
However, if these coals were to be washed, the moisture content of the coal would be increased,
and the heating value of the coal would be degraded. This would lead to an increase in the
amount of coal burned, and a potential subsequent increase in secondary pollutant emissions
(such as SO2). Therefore, due to the minimal expected reduction in PM emissions, and
detrimental impacts to emissions of other pollutants, coal cleaning is not a technically feasible
option for the facility for reduction of PM emissions.
Fabric Filter Baghouse
A Fabric filter baghouse is a proven technology in the control of PM/PM10 emissions from PC
fired boiler units. This technology has been demonstrated in similar applications to the current
project and is considered technically feasible.

Prevention of Significant Deterioration Air Permit Application January 17, 2008 Plant Washington, Power4Georgians, LLC
070007.2201 4-17
Dry Electrostatic Precipitator (ESP)
A dry ESP is a proven technology in the control of PM/PM10 emissions from PC fired boiler
units. This technology has been demonstrated in similar applications to the current project and
is considered technically feasible.
Wet Electrostatic Precipitator (WESP)
A WESP is a proven technology in the control of PM/PM10 emissions. This technology has
been demonstrated in similar applications to the current project and is considered technically
feasible.
Electro-Catalytic Oxidation
The USEPA New Source Review Workshop Manual states that “technologies in the pilot scale
testing stages of development would not be considered available for BACT review”. Since
Electro Catalytic Oxidation is still in the pilot stage of development, and not commercially
demonstrated, it is not considered technically feasible for this project.
Venturi Scrubber
A Venturi scrubber device alone cannot meet the NSPS Subpart Da limit of 0.015 lb/MMBtu
filterable particulate matter, which is the minimal acceptable level for BACT. Therefore, they
are considered technically infeasible for this BACT analysis.
Centrifugal Separator (Cyclone)
A cyclone alone cannot meet the NSPS Subpart Da limit of 0.015 lb/MMBtu. Therefore, they
are considered technically infeasible for this BACT analysis.
Advanced Hybrid Particulate Collector (AHPC)
An AHPC is a new type of control device under development which combines the best features
of ESPs and fabric filter baghouses. AHPCs are not yet commercially available, and therefore
not considered technically feasible for this project.

Prevention of Significant Deterioration Air Permit Application January 17, 2008 Plant Washington, Power4Georgians, LLC
070007.2201 4-18
Agglomerator
Limited information is available regarding the effectiveness of agglomerator particulate control
devices when compared to more standard devices such as ESPs and fabric filter baghouses, and
the potential effects of the loss of co-benefit control from use of a fabric filter baghouse. For
this reason, agglomerators are not considered technically feasible for this project.
Side Stream Separator
Side stream separation would be a type of particulate matter emission control in which a
cyclone type primary separator in conjunction with a fabric filter baghouse in side stream
relation to the cyclone separator would be used to collection PM emissions. Side stream
separation is much better suited for sources of coarse particulate matter, and is therefore not
considered technically feasible for this project.
Step 3 – Rank Remaining Technically Feasible Control Options
Control Effectiveness
Following elimination of the technically infeasible control technologies in Step 2, the
remaining technologies are ranked by control effectiveness. The technically feasible control
technologies identified in Step 2 included fabric filter baghouses, dry ESP, and WESP.
According to the USEPA fact sheets, the typical new equipment design efficiencies for all three
technologies are between 99 percent and 99.9 percent.
Energy Impacts
This subsection discusses the energy impacts of the PM control options. The main energy
impact which affects the remaining control options is the electrical energy required to operate
the system. Fabric filter baghouses require minimal electrical energy when compared to
electrostatic precipitators (ESPs), which require use of electric power to impart an electric
charge to capture the PM. Based on data in an USEPA Air Pollution Training Institute
publication on Electrostatic Precipitator Operation, the power required to operate either a dry or
wet electrostatic precipitator can be around 1000 watts per 1000 acfm, with limited collection
efficiency degradation at 705 watts per 1000 acfm. For the estimated air flow currently

Prevention of Significant Deterioration Air Permit Application January 17, 2008 Plant Washington, Power4Georgians, LLC
070007.2201 4-19
available for the site, this could lead to ESP power requirements from 2 to 3 MW. A secondary
energy impact is the energy impact associated with the pressure drop of the systems. An
increase in pressure drop increases the power required to operate the system. Fabric filters can
experience higher pressure drops than those associated with ESPs.
Environmental Impacts
PM control devices remove the PM from the exhaust stream. An obvious environmental
concern surrounds the disposal of the collected PM. Fabric filter baghouses and dry
electrostatic precipitators both collect dry collected waste materials that would have to be
disposed of in accordance with applicable State and Federal Regulations. With a fabric filter
baghouse, an additional waste source would be the disposal over times of worn out filter bags.
With a wet electrostatic precipitator, both the collected and dried waste products would have to
be disposed of in accordance with State and Federal Regulations, and wastewaters generated
from the process would have to be treated and handled in accordance with applicable
regulations.
Economic Impacts
An obvious economic impact is the loss of saleable power through the high internal power
requirements of use of an electrostatic precipitator. As stated above, potential power
requirements for ESP units at the site could exceed 2-3 MW. Using a rough estimation of an
average power demand of 1000 watts per home, the power required for operation of facility
ESP units would be roughly equivalent to the amount of power needed to supply electricity to
3,000 homes. However, potential power requirements associated with a fabric filter baghouse
can also be significant due to high pressure drops across system bag filters. Based on data
provided by the USEPA in air emissions control cost guidance, and the USEPA’s Coal Utility
Environmental Cost Model (CUECost), the cost effectiveness of fabric filter controls is
approximately $32/ton PM removed.
Step 4 – Evaluate Remaining Control Technologies
Fabric filter baghouses and ESPs both provide the maximum degree of emissions reduction of
PM emissions from coal-fired units. Both controls are cost effective and do not have any
significant collateral environmental impacts. WESPs have a slight disadvantage when

Prevention of Significant Deterioration Air Permit Application January 17, 2008 Plant Washington, Power4Georgians, LLC
070007.2201 4-20
compared to fabric filter baghouses and dry ESPs, in that they produce a wet waste product,
which can lead to additional treatment and disposal costs than with dry systems. While both a
fabric filter baghouse and an ESP can achieve the maximum amount of PM reduction available,
fabric filter baghouses have additional benefits when sorbent injection is used, and may be
more effective in the combined control of metallic (i.e. Pb, Hg) emissions. For these reasons, a
fabric filter baghouse is chosen as the most effective and top control.
Energy Impacts
Although a fabric filter baghouse would require additional auxiliary power to overcome the
pressure drop across the fabric filter bags, such energy requirements would not be enough to
preclude use of a fabric filter baghouse.
Environmental Impacts
There are no major environmental issues that would preclude the use of a baghouse. Waste
materials collected by the fabric filter baghouses will be disposed of in accordance with State
and Federal regulations.
Economic Impacts
Economic impacts are not a concern for a fabric filter baghouse as discussed in Step 3.
Step 5 – Selection of BACT
A summary of recent PM BACT evaluations conducted for similar projects can be found in the following
Table 4-3. This table lists the emission levels determined for each project. BACT for PM emissions is
proposed as a fabric filter baghouse with a PM emission limit of 0.018 lb/MMBtu on a 3-hr average basis,
excluding sulfuric acid mist (H2SO4), and a PM10 emission limit of 0.018 lb/MMBtu (total – filterable and
condensable) on a 3-hr average basis utilizing Method 201A and 202 with a nitrogen purge, or using
Conditional Test Method 39 (CTM-039)/Conditional Test Method 40 (CTM-040). The filterable PM
limit would be 0.015 lb/MMBtu per NSPS Subpart Da. This level of control and emission limit has been
proposed as BACT on recent similar projects. These values are comparable to the BACT emission limits
recently demonstrated through stack testing by the Santee Cooper Cross Generating Station, Unit 3 in

Prevention of Significant Deterioration Air Permit Application January 17, 2008 Plant Washington, Power4Georgians, LLC
070007.2201 4-21
South Carolina. Facilities with lower BACT emissions limits, such as the TS Power Plant, have not yet
been demonstrated in practice.

Prevention of Significant Deterioration Air Permit Application January 17, 2008 Plant Washington, Power4Georgians, LLC
070007.2201 4-22
Table 4-3 PM Emissions from Pulverized Coal Boilers Taken from the RBLC
Facility NameFacility
State Permit Number Permit Date Process NameCapacity
(MW) Control Description
TS POWER PLANT NV AP4911-1349 5/5/2005 200 MW PC COAL BOILER 595 FABRIC FILTER DUST COLLECTION 0.012 lb/MMBtu
WYGEN 2 WY CT-3030 9/25/2002 BOILER, 500 MW PC 90 FABRIC FILTER 0.012 lb/MMBtu
WYGEN 3 WY CT-4517 2/5/2007 PC BOILER 100 BAGHOUSE 0.012 lb/MMBtuLONGLEAF GA 4911-099-0030-P-0 5/14/07 BOILER #1 600 BAGHOUSE 0.012 lb/MMBtuLONGLEAF GA 4911-099-0030-P-0 5/14/07 BOILER #2 600 BAGHOUSE 0.012 lb/MMBtu
COMANCHE STATION CO 04UNITPB1015 7/5/2005 PC BOILER - UNIT 3 750 BAGHOUSE 0.013 lb/MMBtu
INTERMOUNTAIN POWER STATION UNIT 3 UTDAQE-AN0327010-04 10/15/04 PC BOILER 900 BAGHOUSE 0.013 lb/MMBtu
ELY ENERGY STATION NV 2007 SUPERCRITICAL BOILER 2-750 FABRIC FILTER 0.013 lb/MMBtuAGP SOY PROCESSING NE CP05-0050 9/11/2006 STEAM GENERATION 112 FABRIC FILTER 0.015 lb/MMBtuBULL MOUNTAIN, NO. 1, LLC - ROUNDUP POWER PROJECT MT 3182-00 7/21/2003 BOILER, PC NO. 1 390 FABRIC FILTERS 0.015 lb/MMBtuBULL MOUNTAIN, NO. 1, LLC - ROUNDUP POWER PROJECT MT 3182-00 7/21/2003 BOILER, PC NO. 2 390 FABRIC FILTERS 0.015 lb/MMBtu
HARDIN GENERATOR PROJECT MT 3185-00 6/11/2002BOILER, PULVERIZED COAL-FIRED 382
MULTICLONE USED IN CONJUNCTION WITH WET SCRUBBER 0.015 lb/MMBtu
KANSAS CITY POWER & LIGHT COMPANY - IATAN STATION MO 012006-019 1/27/2006
PULVERIZED COAL BOILER - UNIT 2
7800 mmbtu
KCPL SHALL INSTALL A FABRIC FILTRATION SYSTEM (BAGHOUSE) FOR THE UNIT 2 BOILER TO REDUCE PM10 EMISSIONS. 0.015 lb/MMBtu
BIG CAJUN II POWER PLANT LA PSD-LA-677 8/22/2005NEW 675 MW PULVERIZED COAL BOILER (UNIT 4) 675
ESP AND BAGHOUSE IN SERIES CONFIGURATION 0.015 lb/MMBtu
SANDY CREEK ENERGY STATION TX PSD-TX 1039 AND 7/24/2006PULVERIZED COAL BOILER 800 BAGHOUSE 0.015 lb/MMBtu
THOROUGHBRED GENERATING STATION KY TV-02-001 10/11/2002 BOILER, COAL, (2) 2-750ESP, AND WET ELECTROSTATIC PRECIPATATOR (WESP) 0.018 lb/MMBtu
VIRGINIA TECH VA 20124 9/15/2005 OPERATION OF BOILER 11 43 BAG HOUSE EQUIPED WITH CEM 0.018 lb/MMBtu
CITY UTILITIES OF SPRINGFIELD - SOUTHWEST POWER STATION MO 122004-007 12/15/2004
PULVERIZED COAL FIRED BOILER 798 BAGHOUSE 0.018 lb/MMBtu
HOLCOMB UNIT #2 KS 0550087/C-3855 10/8/2002BOILER, PULVERIZED COAL 660 DRY FABRIC FILTER 0.018 lb/MMBtu
KANSAS CITY POWER & LIGHT CO. - HAWTHORN STATION MO 888 8/17/1999
ELECTRIC GENERATION, BOILER, COAL 565 FABRIC FILTER SYSTEM 0.018 lb/MMBtu
Emission Limit

Prevention of Significant Deterioration Air Permit Application January 17, 2008 Plant Washington, Power4Georgians, LLC
070007.2201 4-23
Table 4 3 PM Emissions from Pulverized Coal Boilers Taken from the RBLC (Continued)
Facility NameFacility
State Permit Number Permit Date Process NameCapacity
(MW) Control Description
WPS - WESTON PLANT WI 04-RV-248 10/19/2004
SUPER CRITICAL PULVERIZED COAL ELECTRIC STEAM BOILER (S04, P04) 500
FABRIC FILTER BAGHOUSE (WHEN FIRING COAL) NATURAL GAS USE (W/O BAGHOUSE) LIMITED TO 500 MMBTU/HR 0.018 lb/MMBtu
MAIDSVILLE WV R14-0024 3/2/2004 BOILER, PC 695DRY SOLID INJECTION W/ FABRIC FILTER AND WET SCRUBBER 0.018 lb/MMBtu
MAIDSVILLE WV R14-0024 3/2/2004 BOILER, PC 695DRY SOLID INJECTION W/ FABRIC FILTER AND WET SCRUBBER 0.018 lb/MMBtu
OPPD - NEBRASKA CITY STATION NE 58343C01 3/9/2005 UNIT 2 BOILER FABRIC FILTER BAGHOUSES 0.018 lb/MMBtu
PLUM POINT ENERGY AR 1995-AOP-R0 8/20/2003 BOILER , UNIT 1 - SN-01 800 BAGHOUSE 0.018 lb/MMBtu
PLUM POINT ENERGY AR 1995-AOP-R0 8/20/2003 BOILER - SN-01 800 BAGHOUSE 0.018 lb/MMBtuSANTEE COOPER CROSS SC 0420-0030-CI 2/5/04 BOILER #3 600 BAGHOUSE 0.018 lb/MMBtuSANTEE COOPER CROSS SC 0420-0030-CI 2/5/04 BOILER #4 600 BAGHOUSE 0.018 lb/MMBtuAES BEAVER VALLEY, LLC PA PA-04-446C 11/21/2001 COAL FIRED BOILER 631 BAGHOUSE 0.02 lb/MMBtu
WPS - WESTON PLANT WI 04-RV-248 10/19/2004
SUPER CRITICAL PULVERIZED COAL ELECTRIC STEAM BOILER (S04, P04) 500
FABRIC FILTER BAGHOUSE (WHEN FIRING COAL). NATURAL GAS USE (W/O BAGHOUSE) IS LIMITED TO 500 MMBTU/HR. 0.02 lb/MMBtu
TWO ELK GENERATION PARTNERS, LIMITED PARTNERSHIP WY CT-1352 2/27/1998
BOILER, STEAM ELECTRIC POWER GENERATING 250 BAGHOUSE 0.02 lb/MMBtu
ENCOAL CORPORATION-ENCOAL NORTH ROCHELLE FACILITY WY CT-1324 10/10/1997
BOILER, COAL FIRED, MAIN STACK 240 BAGHOUSE 0.02 lb/MMBtu
JK SPRUCE ELECTRIC GENERATING STATION TXPSD-TX 1037 & 70492 12/28/05 UNIT 2 BOILER 750 FABRIC FILTER 0.022 lb/MMBtu
KANSAS CITY POWER & LIGHT COMPANY - IATAN STATION MO 012006-019 1/27/2006
PULVERIZED COAL BOILER - UNIT 1 850 BAGHOUSE 0.0244 lb/MMBtu
ARCHER DANIELS MIDLAND COMPANY IL 97070097 12/24/1998BOILER (9&10), FLUIDIZED BED 440
FABRIC FILTER. IF UNIT DEMONSTRATES 0.015 LB/MMBTU OR LESS, TESTING INTERVAL IS DOUBLED. 0.025 lb/MMBtu
MIDAMERICAN ENERGY COMPANY IA PROJECT 02-528 6/17/2003 CBEC 4 BOILER7675
mmbtu BAGHOUSE 0.025 lb/MMBtu
MIDAMERICAN ENERGY COMPANY IA PROJECT 02-528 6/17/2003 CBEC 4 BOILER7675
mmbtu BAGHOUSE 0.027 lb/MMBtu
COLSTRIP ENERGY LIMITED PARTNERSHIP MT 2035-03 3/20/1998ELECTRIC GENERATION, MATERIAL TRANSFER BAGHOUSE 0.03 lb/MMBtu
COLSTRIP ENERGY LIMITED PARTNERSHIP MT 2035-03 3/20/1998ELECTRIC GENERATION, BOILER 147 BAGHOUSE 0.03 lb/MMBtu
Emission Limit

Prevention of Significant Deterioration Air Permit Application January 17, 2008 Plant Washington, Power4Georgians, LLC
070007.2201 4-24
Table 4 3 PM Emissions from Pulverized Coal Boilers Taken from the RBLC (Continued)
Facility NameFacility
State Permit Number Permit Date Process NameCapacity
(MW) Control DescriptionTOQUOP NV ap4911-1146 SCPC BOILER 750 BAGHOUSE 0.03 lb/MMBtuAGP SOY PROCESSING NE CP05-0050 9/11/2006 STEAM GENERATION 112 GOOD COMBUSTION PRACTICES 0.041 lb/MMBtuINLAND PAPERBOARD AND PACKAGING, INC. - ROME LINERBOARD MILL GA 2631-115-0021-V- 10/13/2004 BOILER, COAL FIRED 166 ESP 0.05 lb/MMBtu
WA PARISH ELECTRIC GENERATING STATION TX PSD-TX-901, PSD 10/15/2003BOILER UNIT 7, COAL, WAP7
6700 mmbtu COMBUSTION CONTROL 0.085 lb/MMBtu
WA PARISH ELECTRIC GENERATING STATION TX PSD-TX-901, PSD 10/15/2003BOILER UNIT 7, COAL & GAS, WAP7
6700 mmbtu COMBUSTION CONTROL 0.086 lb/MMBtu
WASHINGTON PARISH ELECTRIC GENERATING STATION TX PSD-TX-33 M1 10/15/2002
BOILER STACK, WAP 7, COAL ONLY
6700 mmbtu COMBUSTION CONTROL 0.086 lb/MMBtu
WASHINGTON PARISH ELECTRIC GENERATING STATION TX PSD-TX-33 M1 10/15/2002
BOILER STACK, WAP 7, COAL & NAT GAS
6700 mmbtu FIRING NAT GAS 0.087 lb/MMBtu
WA PARISH ELECTRIC GENERATING STATION TX PSD-TX-901, PSD 10/15/2003(2) BOILERS, UNITS 5 & 6, WAP5&6, COAL
7400 mmbtu COMBUSTION CONTROL 0.088 lb/MMBtu
WA PARISH ELECTRIC GENERATING STATION TX PSD-TX-901, PSD 10/15/2003(2) BOILERS, UNITS 5 & 6, COAL & GAS, WAP5&6
7400 mmbtu COMBUSTION CONTROL 0.089 lb/MMBtu
WASHINGTON PARISH ELECTRIC GENERATING STATION TX PSD-TX-33 M1 10/15/2002
(2) BOILER STACKS, WAP 5 & 6 , COAL & NAT GAS
7400 mmbtu FIRING NAT GAS 0.089 lb/MMBtu
WASHINGTON PARISH ELECTRIC GENERATING STATION TX PSD-TX-33 M1 10/15/2002
(2) BOILER STACKS, WAP 5 & 6 , COAL ONLY
7400 mmbtu NONE INDICATED 0.097 lb/MMBtu
MANSFIELD MILL LA PSD-LA-93 (M-6) 8/14/2001POWER BOILER #1 & #2, COAL 189 SINGLE STAGE DUST COLLECTOR/ESP 0.1 lb/MMBtu
THERMAL VENTURES VA 30529 2/15/2002 BOILER, STEAM 35
GOOD COMBUSTION PRACTICES, CLEAN BURNING FUEL, AND CONTINUOUS EMISSION MONITORING DEVICE. 0.14 lb/MMBtu
THERMAL VENTURES VA 30529 2/15/2002 BOILER, STEAM 35
GOOD COMBUSTION PRACTICES, CLEAN BURNING FUEL, AND CONTINUOUS EMISSION MONITORING DEVICE. 0.15 lb/MMBtu
MIDAMERICAN ENERGY COMPANY IA PROJECT 02-528 6/17/2003 CBEC 4 BOILER7675
mmbtu BAGHOUSE 0.18 lb/MMBtuDESERET GENERATION AND TRANSMISSION COMPANY UT DAQE-186-98 3/16/1998 COAL FIRED BOILER 500 FABRIC FILTER 0.286 lb/MMBtu
Emission Limit
Prepared by: PMH 1/10/08 Checked by: JDF 1/10/08

Prevention of Significant Deterioration Air Permit Application January 17, 2008 Plant Washington, Power4Georgians, LLC
070007.2201 4-25
4.3.2 BACT Demonstration for NOx Emissions from the Supercritical Pulverized Coal Boiler
NOX emissions are formed from combustion of coal and other fossil fuels, and are formed from the
formation of thermal NOX in the combustion zone, and from oxidation of the nitrogen present in the fuel
source. Thermal NOX is formed when elemental Nitrogen present in the air reacts with Oxygen (O2) in
the high temperature environment of the combustion zone. Factors which can affect NOX formation in a
coal-fired boiler include the combustion zone temperature, nitrogen content of the fuel, and quantity of
excess air present
Step 1 – Identify All Control Technologies
Lower Emitting Processes or Practices – LNB
Low NOX Burners (LNBs) incorporate mechanisms for reducing the peak flame temperature in
the combustion zone of a combustion unit. This reduction in peak flame temperature results in
lower NOX emissions. Peak flame temperature is controlled by carefully regulating the
distribution and mixing of the fuel and air in the combustion zone, and is most commonly
reduced by separating combustion into multiple zones, or stages. LNB are widely used for the
reduction of NOX emissions.
Lower Emitting Processes or Practices – OFA
In the OFA process, combustion air is diverted from the burners to create a fuel rich zone in the
lower portion of the combustion zone, or furnace. This process inhibits fuel bound nitrogen
conversion to NOX emissions on fossil fuel fired boilers. Peak flame temperatures can be reduced
to limit thermal NOX formation. A high momentum air stream intersects the burner flames in the
upper combustion zone, or furnace, to complete combustion. OFA can be used in conjunction
with LNB technology.
Lower Emitting Processes or Practices – Flue Gas Recirculation (FGR)
In FGR, emissions of NOX can be reduced by recirculating a portion of the boiler flue gas into the
main combustion chamber. This process reduces the peak combustion temperature and lowers
the percentage of oxygen in the combustion air/flue gas mixture, thus reducing the formation of
thermal NOX caused by high flame and combustion zone temperatures.

Prevention of Significant Deterioration Air Permit Application January 17, 2008 Plant Washington, Power4Georgians, LLC
070007.2201 4-26
Selective Catalytic Reduction (SCR)
SCR is a post-combustion control process which chemically reduces NOX into molecular nitrogen
and water vapor. SCR is capable of NOX reduction efficiencies in the range of 70 percent to 90
percent. The following is a description of the SCR process as described in the USEPA’s
Selective Catalytic Reduction Fact Sheet (2003); “A nitrogen based reagent such as ammonia or
urea is injected into the ductwork, downstream of the combustion unit. The waste gas mixes with
the reagent and enters a reactor module containing catalyst. The hot flue gas and reagent diffuse
through the catalyst. The reagent reacts selectively with the NOX within a specific temperature
range and in the presence of the catalyst and oxygen. The catalyst is composed of active metals
or ceramics with a highly porous structure. Catalysts configurations are generally ceramic
honeycomb and pleated metal plate (monolith) designs.”
Selective Non-Catalytic Reduction (SNCR)
Selective Non-Catalytic Reduction (SNCR) is a post combustion control process which controls
NOX emissions through chemical reduction via a reducing agent. Stand alone NOX reduction
levels for an SNCR can range from 30 percent to 50 percent, and when used in conjunction with
LNB or other combustion controls can achieve NOX emissions reductions of 65 percent to 75
percent. The following is a description of the SNCR process as described in the USEPA’s SNCR
Fact Sheet (2003); “SNCR is based on the chemical reduction of the NOX molecule into molecular
nitrogen (N2) and water vapor (H2O). In the SNCR process, the combustion unit acts as the
reactor chamber. The reagent is generally injected within the boiler superheater and reheater
radiant and convective regions, where the combustion gas temperature is at the required
temperature range. The injection system is designed to promote mixing of the reagent with the
flue gas. The number and location of injection points is determined by the temperature profiles
and flow patterns within the combustion unit. Both ammonia and urea are used as reagents.”
SCONOx
The SCONOx system is a relatively new catalytic reduction technology that is based on
integration of catalytic oxidation and absorption technology. The system uses a coated catalyst to
oxidize and reduce both CO and NOX emissions. NOX emission are oxidized to NO2 and then
adsorbed onto the catalyst. In the second step, a proprietary regenerative natural gas is passed

Prevention of Significant Deterioration Air Permit Application January 17, 2008 Plant Washington, Power4Georgians, LLC
070007.2201 4-27
through the catalyst periodically. The natural gas desorbs the NO2 from the catalyst and reduces it
to N2. The system does not use ammonia as a reagent, but instead uses natural gas as the basis for
a proprietary catalyst regeneration process.
Rotating Opposed Fire Air (ROFA)
ROFA utilizes a booster fan to supply high velocity air to improve mixing and lower the
maximum temperature, reducing the formation of thermal NOX. ROFA has only been installed as
a retrofit technology on units using bituminous coals.
Gas Re-Burning
Various forms of gas re-burn technologies exist, including Advanced Gas Reburning (AGR), Fuel
Lean Gas Reburning (FLGR), Natural Gas Reburning (NGR), and Amine Enhanced Gas Injection
(AEGI). Gas re-burning systems typically utilize a second combustion zone following the
primary combustion zone in the main boiler. The second combustion zone has a secondary fuel
source, such as natural gas or coal.
Electro-Catalytic Oxidation
Electro Catalytic Oxidation is a multi-pollutant technology developed by the Powerspan
Corporation. Electro Catalytic Oxidation is capable of simultaneously controlling NOX, SO2, PM,
mercury, and other trace elements in a three step process involving ash removal in a conventional
dry ESP, passing the gas stream through a barrier discharge reactor to oxidize gaseous pollutants,
and finally passing the gas stream through a WESP.
Hybrid SNCR/Catalyst Systems
An emerging technology involves the use of an SNCR and SCR system in series. The hybrid
technology utilizes an SNCR to reduce NOX levels with a controlled amount of ammonia slip.
The ammonia slip then functions as an ammonia source for the secondary SCR step that achieves
additional NOX reduction and minimizes total ammonia slip.

Prevention of Significant Deterioration Air Permit Application January 17, 2008 Plant Washington, Power4Georgians, LLC
070007.2201 4-28
Pahlman Process
The Pahlman process is a multi-pollutant control technology that simultaneously controls SO2,
NOX, and mercury (Hg) emissions. EnviroScrub Technologies Corporation is the developer of the
Pahlman process, and limited information on the process is available. The process is located
downstream of the particulate matter collection device and uses a spray dryer absorber where a
proprietary scrubber material is used.
THERMALONOx
THERMALONOx is a technology developed by Thermal Energy International, Inc. that uses the
reaction of elemental phosphorous, oxygen, and nitrogen monoxide to form NO2. The NO2 further
combines such that it can be removed by a wet scrubber.
Oxygen Enhanced Combustion
Oxygen enhanced combustion is a technology that replaces a small fraction of the combustion air
at the burner with oxygen. By generating higher flame temperatures, nitrogen compounds from
the coal are released in a manner allowing air staging to be more effective in reducing NOX
emissions. While demonstration data from use of this technology appears promising, this
technology is still in the pilot stages of development.
Step 2 – Eliminate Technically Infeasible Options
Lower Emitting Process or Practice –LNB
LNBs are a proven and demonstrated technology for the reduction of NOX emissions from
combustion processes. LNBs are considered standard equipment for modern boilers, and are
therefore considered technically feasible for this project.
Lower Emitting Process or Practice – OFA
OFA is a demonstrated technology for the reduction of NOX emissions from combustion
processes, commonly used in conjunction with LNB. OFA is a common design incorporation
into new boilers. For these reasons, use of OFA is considered technically feasible for this project.

Prevention of Significant Deterioration Air Permit Application January 17, 2008 Plant Washington, Power4Georgians, LLC
070007.2201 4-29
Lower Emitting Process or Practice – Flue Gas Recirculation (FGR)
FGR is a demonstrated technology in the reduction of NOX emissions on gas and oil-fired boilers.
FGR has only been commercially applied for oil and natural gas fired boiler systems. Technical
issues have thus far precluded use of FGR technology with coal-fired boilers. Therefore, FGR
technology is not considered technically feasible for this project.
Selective Catalytic Reduction (SCR)
SCR is a proven and demonstrated technology for the reduction of NOX emissions on PC fired
boiler units. For this reason, the use of SCR is considered technically feasible for this project.
Selective Non-Catalytic Reduction (SNCR)
SNCR is no longer widely considered a stand alone control technology, primarily because the
technology cannot achieve the NSPS Subpart Da NOX emissions limit of 1.0 lb/MW-hr.
Therefore, use of SNCR is considered technically infeasible for this project.
SCONOx
SCONOx technologies have been developed and are currently commercially available for natural
gas fired turbines and units. It is not a demonstrated technology for use with coal-fired boilers.
Since this technology is not commercially available or applicable for a coal-fired boiler, use of
this technology is considered technically infeasible for this project.
Rotating Opposed Fire Air (ROFA)
ROFA utilizes a booster fan to supply high velocity air to improve mixing and lower the
maximum temperature, reducing the formation of thermal NOX. ROFA has only been installed as
a retrofit technology on units using bituminous coals. As the technology has not yet been
developed or evaluated for sub-bituminous coals, and the design coal blend for the facility is a
50/50 blend of bituminous Illinois #6 and PRB coals, use of ROFA is not considered technically
feasible for this project.

Prevention of Significant Deterioration Air Permit Application January 17, 2008 Plant Washington, Power4Georgians, LLC
070007.2201 4-30
Gas Re-Burning
Various forms of gas re-burn technologies exist, including Advanced Gas Reburning, Fuel Lean
Gas Reburning, Natural Gas Reburning, and Amine Enhanced Gas Injection. Gas re-burning
systems typically utilize a second combustion zone following the primary combustion zone in the
main boiler. The second combustion zone has a secondary fuel source, such as natural gas or coal.
As stand alone technologies, none of the gas re-burning options can meet the emission limit of 1.0
lb/MW-hr established by the NSPS standard set in 40 CFRP Part 60.44 Da. Re-burning
technologies could be combined with SCR, but the combination of these technologies has not been
shown to reduce emissions below the levels obtainable by an SCR alone. Therefore, the use of re-
burning technologies is not considered technically feasible for this project.
Electro-Catalytic Oxidation
Electro Catalytic Oxidation is a multi-pollutant technology developed by the Powerspan
Corporation. Electro Catalytic Oxidation is capable of simultaneously controlling NOX, SO2, PM,
mercury, and other trace elements in a three step process involving ash removal in a conventional
dry ESP, passing the gas stream through a barrier discharge reactor to oxidize gaseous pollutants,
and finally passing the gas stream through a WESP.
The USEPA New Source Review Workshop Manual states that “technologies in the pilot scale
testing stages of development would not be considered available for BACT review”. Since
Electro Catalytic Oxidation is still in the pilot stage of development, and not commercially
available, it is not considered technically feasible for this project.
Hybrid SNCR/Catalyst Systems
An emerging technology involves the use of an SNCR and SCR system in series. The hybrid
technology utilizes an SNCR to reduce NOX levels with a controlled amount of ammonia slip.
The ammonia slip then functions as an ammonia source for the secondary SCR step that achieves
additional NOX reduction and minimizes total ammonia slip.

Prevention of Significant Deterioration Air Permit Application January 17, 2008 Plant Washington, Power4Georgians, LLC
070007.2201 4-31
The technology has not been well proven, and has achieved NOX reductions equivalent to stand
alone SCR technology. Due to the lack of emissions reduction when compared to stand alone
SCR technology, and the unproven nature of the technology, hybrid SNCR catalyst systems are
considered technically infeasible for this project.
Pahlman Process
The Pahlman process is a multi-pollutant control technology that simultaneously controls SO2,
NOX, and mercury (Hg) emissions. EnviroScrub Technologies Corporation is the developer of the
Pahlman process, and limited information on the process is available. The process is located
downstream of the particulate matter collection device and uses a spray dryer absorber where a
proprietary scrubber material is used. The technology is still in the pilot study state of
development. The USEPA New Source Review Workshop Manual states that “technologies in
the pilot scale testing stages of development would not be considered available for BACT
review”. Since the Pahlman process is still in the pilot stage of development, and not
commercially available, it is not considered technically feasible for this project.
THERMALONOx
THERMALONOx was tested on a full scale unit (335 MW) which was funded by American
Electric Power Industry in 2001. This test showed the technology failed to reduce NOX emissions
from the unit. Since the THERMALONOx process is not a demonstrated technology, it is not
considered technically feasible for this project.
Oxygen Enhanced Combustion
While demonstration data from use of this technology appears promising, this technology is still in
the pilot stages of development. Since the oxygen enhanced combustion process is still in the
pilot stage of development, and not commercially available, it is not considered technically
feasible for this project.
Prevention of Significant Deterioration Air Permit Application January 17, 2008 Plant Washington, Power4Georgians, LLC
070007.2201 4-32
Step 3 – Rank Remaining Technically Feasible Control Options
Control Effectiveness
Following elimination of the technically infeasible control options in Step 2, SCR is the only
effective add-on control technology. For added control of NOX emissions, SCR can be used in
conjunction with LNB and OFA. Recent control effectiveness values, based on the RBLC
database, range from 0.05 lb/MMBtu to 0.09 lb/MMBtu.
Energy Impacts
LNB and OFA are standard design incorporations into combustion units and do not create any
significant energy impacts. Use of the SCR will require additional power to overcome the
pressure drop loss across the system catalyst, and operation of the SCR equipment (i.e. ammonia
distribution equipment).
Environmental Impacts
Properly designed combustion controls, such as LNB and OFA do not create adverse
environmental impacts, since such control are designed to minimize the generation of pollutant
emissions. Use of SCR technology will require the storage and use of ammonia, which can have
significant environmental consequences if not handled properly. Storage and use of ammonia at
the facility could trigger requirements of multiple different USEPA and OSHA related programs,
including Risk Management Programs (RMP), Process Safety Management (PSM), and
specialized safety and training programs.
SCR systems have added collateral benefits in the conversion of elemental mercury to an
oxidized form, typically mercuric chloride (HgCl2). Elemental mercury is difficult to collect and
remove in pollution control equipment, but the oxidized form can be collected in a wet flue gas
desulfurization (wet scrubber) system.

Prevention of Significant Deterioration Air Permit Application January 17, 2008 Plant Washington, Power4Georgians, LLC
070007.2201 4-33
Economic Impacts
Based on data provided by the USEPA in air emissions control cost guidance, and the USEPA’s
Coal Utility Environmental Cost Model (CUECost), the cost effectiveness of an SCR system is
approximately $1,650/ton of NOX removed.
Step 4 – Evaluate Remaining Control Technologies
Energy Impacts
The energy impacts discussed in Step 3 above are not significant enough to preclude the use of
SCR in combination with LNB and OFA.
Environmental Impacts
The environmental impacts discussed in Step 3 above are not significant enough to preclude the
use of SCR in combination with LNB and OFA.
Economic Impacts
While the capital costs and annualized operating costs of implementation of SCR technology at
the site are significant, SCR technology represents the top tier of controls available for NOX
emissions reduction. The economic impacts are not significant enough to preclude the use of SCR
in combination with LNB and OFA.
Step 5 – Selection of BACT
A summary of recent NOX BACT evaluations conducted for similar projects can be found in Table 4-4.
Utilization of an SCR system in conjunction with LNB and OFA can achieve the maximum amount of
NOX emissions reduction available, and is both technically feasible and demonstrated in PC fired boilers.
Therefore, BACT for NOX emissions is proposed as use of an SCR system in conjunction with LNB and
OFA, with an emission limit of 0.05 lb/MMBtu on an annual basis (12-month rolling average). This 12-
month rolling average will be computed using consecutive 30 day rolling monthly averages. This level of
control and emission limit has been proposed as BACT on similar recent projects. A review of
Continuous Emissions Monitoring (CEMS) data available through the EPA Clean Air Markets web site

Prevention of Significant Deterioration Air Permit Application January 17, 2008 Plant Washington, Power4Georgians, LLC
070007.2201 4-34
indicated that the average NOX emission rate for 63 coal fired boilers was 0.083 lb/MMBtu. The lowest
demonstrated BACT NOX emissions limits in practice have been demonstrated by the Midamerican
Energy Company with a NOX emission limit of 0.07 lb/MMBtu on a 30 day rolling average. Facilities
with emission limits comparable to the proposed project site would include the Hugo Generating Station
with a NOX emissions limit of 0.05 lb/MMBtu on a 12-month rolling average. However, the Hugo
Generating Station has not yet been constructed or demonstrated.

Prevention of Significant Deterioration Air Permit Application January 17, 2008 Plant Washington, Power4Georgians, LLC
070007.2201 4-35
Table 4-4 Listing of NOx Emissions from Pulverized Coal Boilers Taken From the RBLC Facility Name
Facility State
Permit Number
Capacity (MW)
Permit Date Process Name Control Description Avg Period
WYGEN 3 WY CT-4517 381 2/5/2007 PC BOILER SCR/LNB/OVERFIRE AIR 0.05 lb/MMBtu 30-day rolling average
HUGO GENERATING STA OK97-058-C M-
2 PSD 750 2/9/2007
COAL-FIRED STEAM EGU BOILER (HU-UNIT 2)
LOW NOX BURNERS (LNB) W/ OVERFIRE AIR (OFA) AND SELECTIVE CATALYTIC REDUCTION (SCR) 0.05 lb/MMBtu 12-month rolling average
JK SPRUCE ELECTRIC GENERATING STATION TX
PSD-TX 1037 & 70492 750 12/28/05 UNIT 2 BOILER SCR/LNB/OVERFIRE AIR 0.05 lb/MMBtu Annual average
WPS - WESTON PLANT WI 04-RV-248 500 10/19/2004
SUPER CRITICAL PULVERIZED COAL ELECTRIC STEAM BOILER (S04, P04)
LOW NOX BURNERS, GOOD COMBUSTION PRACTICES SELECTIVE CATALYTIC REDUCTION (SCR) 0.06 lb/MMBtu 12-month rolling average
TOQUOP NVap4911-
1146 750 SCPC BOILER SCR/LNB/OVERFIRE AIR 0.06 lb/MMBtu 24-hour rolling average
ELY ENERGY STATION NV 2-750 2007SUPERCRITICAL BOILER SCR/LNB/OVERFIRE AIR 0.06 lb/MMBtu 24-hour rolling average
TS POWER PLANT NVAP4911-
1349 200 5/5/2005200 MW PC COAL BOILER SCR & LOW NOX BURNERS 0.067 lb/MMBtu unknown
HUGO GENERATING STATION OK97-058-C M-
2 PSD 750 2/9/2007
COAL-FIRED STEAM EGU BOILER (HU-UNIT 2)
LOW NOX BURNERS (LNB) W/ OVERFIRE AIR (OFA) AND SELECTIVE CATALYTIC REDUCTION (SCR) 0.07 lb/MMBtu 30-day rolling average
BULL MOUNTAIN, NO. 1, LLC - ROUNDUP POWER PROJEC MT 3182-00 390 7/21/2003 BOILER, PC NO. 1LOW NOX BURNER, OVERFIRE AIR, AND SCR. 0.07 lb/MMBtu unknown
BULL MOUNTAIN, NO. 1, LLC - ROUNDUP POWER PROJEC MT 3182-00 390 7/21/2003 BOILER, PC NO. 2LOW NOX BURNER, OVERFIRE AIR, SCR 0.07 lb/MMBtu unknown
WPS - WESTON PLANT WI 04-RV-248 500 10/19/2004
SUPER CRITICAL PULVERIZED COAL ELECTRIC STEAM BOILER (S04, P04)
LOW NOX BURNERS, GOOD COMBUSTION PRACTICES SELECTIVE CATALYTIC REDUCTION (SCR) 0.07 lb/MMBtu 30-day rolling average
MIDAMERICAN ENERGY COMPANY IAPROJECT
02-5287675
mmbtu 6/17/2003 CBEC 4 BOILER
LOW NOX BURNERS, OVERFIRE AIR, AND SELECTIVE CATALYTIC REDUCTION 0.07 lb/MMBtu 30-day rolling average
BIG CAJUN II POWER PLANT LAPSD-LA-
677 675 8/22/2005
NEW 675 MW PULVERIZED COAL BOILER (UNIT 4)
LOW NOX BURNERS AND SELECTIVE CATALYTIC REDUCTION 0.07 lb/MMBtu Annual average
OPPD - NEBRASKA CITY STATION NE 58343C01 660 3/9/2005 UNIT 2 BOILERSELECTIVE CATALYTIC REDUCTION (SCR) 0.07 lb/MMBtu 30-day rolling average
WYGEN 2 WY CT-3030 90 9/25/2002 BOILER, 500 MW PC LOW NOX BURNERS/SCR 0.07 lb/MMBtu 30-day rolling average
SANDY CREEK ENERGY STATION TX
PSD-TX 1039 AND
70861 800PULVERIZED CAOL BOILER
AT THIS POINT, THE FLUE GAS HAS BEEN COOLED TO THE APPROPRIATE TEMPERATURE FOR SCR, SO IT NEXT PASSES THROUGH THE SCR REACTOR, WHERE NOX IS REDUCED TO FORM NITROGEN. 0.07 lb/MMBtu 30-day rolling average
LONGLEAF GA4911-099-0030-P-
01-0 600 5/14/07 BOILER #1 SCR/LNB/OVERFIRE AIR 0.07 lb/MMBtu 30-day rolling average
LONGLEAF GA4911-099-0030-P-
01-0 600 5/14/07 BOILER #2 SCR/LNB/OVERFIRE AIR 0.07 lb/MMBtu 30-day rolling average
Emission Limit
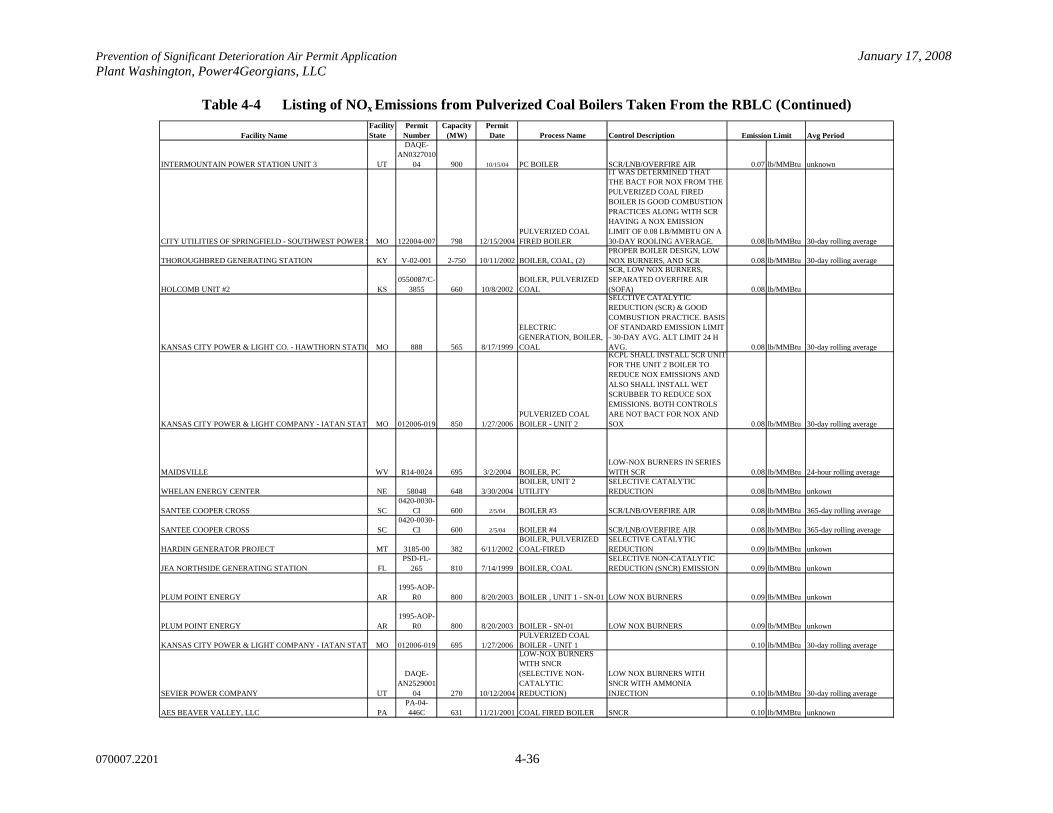
Prevention of Significant Deterioration Air Permit Application January 17, 2008 Plant Washington, Power4Georgians, LLC
070007.2201 4-36
Table 4-4 Listing of NOx Emissions from Pulverized Coal Boilers Taken From the RBLC (Continued)
Facility NameFacility State
Permit Number
Capacity (MW)
Permit Date Process Name Control Description Avg Period
INTERMOUNTAIN POWER STATION UNIT 3 UT
DAQE-AN0327010-
04 900 10/15/04 PC BOILER SCR/LNB/OVERFIRE AIR 0.07 lb/MMBtu unknown
CITY UTILITIES OF SPRINGFIELD - SOUTHWEST POWER S MO 122004-007 798 12/15/2004PULVERIZED COAL FIRED BOILER
IT WAS DETERMINED THAT THE BACT FOR NOX FROM THE PULVERIZED COAL FIRED BOILER IS GOOD COMBUSTION PRACTICES ALONG WITH SCR HAVING A NOX EMISSION LIMIT OF 0.08 LB/MMBTU ON A 30-DAY ROOLING AVERAGE. 0.08 lb/MMBtu 30-day rolling average
THOROUGHBRED GENERATING STATION KY V-02-001 2-750 10/11/2002 BOILER, COAL, (2)PROPER BOILER DESIGN, LOW NOX BURNERS, AND SCR 0.08 lb/MMBtu 30-day rolling average
HOLCOMB UNIT #2 KS0550087/C-
3855 660 10/8/2002BOILER, PULVERIZED COAL
SCR, LOW NOX BURNERS, SEPARATED OVERFIRE AIR (SOFA) 0.08 lb/MMBtu
KANSAS CITY POWER & LIGHT CO. - HAWTHORN STATIO MO 888 565 8/17/1999
ELECTRIC GENERATION, BOILER, COAL
SELCTIVE CATALYTIC REDUCTION (SCR) & GOOD COMBUSTION PRACTICE. BASIS OF STANDARD EMISSION LIMIT - 30-DAY AVG. ALT LIMIT 24 H AVG. 0.08 lb/MMBtu 30-day rolling average
KANSAS CITY POWER & LIGHT COMPANY - IATAN STATI MO 012006-019 850 1/27/2006PULVERIZED COAL BOILER - UNIT 2
KCPL SHALL INSTALL SCR UNIT FOR THE UNIT 2 BOILER TO REDUCE NOX EMISSIONS AND ALSO SHALL INSTALL WET SCRUBBER TO REDUCE SOX EMISSIONS. BOTH CONTROLS ARE NOT BACT FOR NOX AND SOX 0.08 lb/MMBtu 30-day rolling average
MAIDSVILLE WV R14-0024 695 3/2/2004 BOILER, PCLOW-NOX BURNERS IN SERIES WITH SCR 0.08 lb/MMBtu 24-hour rolling average
WHELAN ENERGY CENTER NE 58048 648 3/30/2004BOILER, UNIT 2 UTILITY
SELECTIVE CATALYTIC REDUCTION 0.08 lb/MMBtu unkown
SANTEE COOPER CROSS SC0420-0030-
CI 600 2/5/04 BOILER #3 SCR/LNB/OVERFIRE AIR 0.08 lb/MMBtu 365-day rolling average
SANTEE COOPER CROSS SC0420-0030-
CI 600 2/5/04 BOILER #4 SCR/LNB/OVERFIRE AIR 0.08 lb/MMBtu 365-day rolling average
HARDIN GENERATOR PROJECT MT 3185-00 382 6/11/2002BOILER, PULVERIZED COAL-FIRED
SELECTIVE CATALYTIC REDUCTION 0.09 lb/MMBtu unkown
JEA NORTHSIDE GENERATING STATION FLPSD-FL-
265 810 7/14/1999 BOILER, COALSELECTIVE NON-CATALYTIC REDUCTION (SNCR) EMISSION 0.09 lb/MMBtu unkown
PLUM POINT ENERGY AR1995-AOP-
R0 800 8/20/2003 BOILER , UNIT 1 - SN-01 LOW NOX BURNERS 0.09 lb/MMBtu unkown
PLUM POINT ENERGY AR1995-AOP-
R0 800 8/20/2003 BOILER - SN-01 LOW NOX BURNERS 0.09 lb/MMBtu unkown
KANSAS CITY POWER & LIGHT COMPANY - IATAN STATI MO 012006-019 695 1/27/2006PULVERIZED COAL BOILER - UNIT 1 0.10 lb/MMBtu 30-day rolling average
SEVIER POWER COMPANY UT
DAQE-AN2529001-
04 270 10/12/2004
LOW-NOX BURNERS WITH SNCR (SELECTIVE NON-CATALYTIC REDUCTION)
LOW NOX BURNERS WITH SNCR WITH AMMONIA INJECTION 0.10 lb/MMBtu 30-day rolling average
AES BEAVER VALLEY, LLC PAPA-04-446C 631 11/21/2001 COAL FIRED BOILER SNCR 0.10 lb/MMBtu unknown
Emission Limit

Prevention of Significant Deterioration Air Permit Application January 17, 2008 Plant Washington, Power4Georgians, LLC
070007.2201 4-37
Table 4-4 Listing of NOx Emissions from Pulverized Coal Boilers Taken From the RBLC (Continued)
Facility NameFacility State
Permit Number
Capacity (MW)
Permit Date Process Name Control Description Avg Period
KANSAS CITY POWER & LIGHT CO. - HAWTHORN STATIO MO 888 565 8/17/1999
ELECTRIC GENERATION, BOILER, COAL
SELCTIVE CATALYTIC REDUCTION (SCR) & GOOD COMBUSTION PRACTICE. BASIS OF STANDARD EMISSION LIMIT - 30-DAY AVG. ALT LIMIT 24 H AVG. 0.12 lb/MMBtu 24-hour rolling average
EDISON MISSION ENERGY PA 32-0055C6600
mmbtu 5/25/1999
BOILER, COAL, PULVERIZED BITUMINOUS, UNITS 1, 2 &3
SCR. SEE COMMENT ABOUT NOX EMISSION LIMITS IN FACILITY NOTES. REGULATORY BASIS IS STATE IMPLEMENTATION PLAN. 0.15 lb/MMBtu unknown
TWO ELK GENERATION PARTNERS, LIMITED PARTNERSH WY CT-1352 250 2/27/1998
BOILER, STEAM ELECTRIC POWER GENERATING
LOW NOX BURNERS WITH OVER FIRE AIR AND SELECTIVE CATALYTIC REDUCTION 0.15 lb/MMBtu unknown
ENCOAL CORPORATION-ENCOAL NORTH ROCHELLE FAC WY CT-1324 240 10/10/1997
BOILER, PULVERIZED COAL FIRED POWER GENERATION UNI
LOW NOX BURNERS ITH OVERFIRE AIR AND SELECTIVE CATALYTIC REDUCTION 0.15 lb/MMBtu unknown
ENCOAL CORPORATION-ENCOAL NORTH ROCHELLE FAC WY CT-1324 1160 10/10/1997BOILER, COAL FIRED, MAIN STACK
LOW NOX BURNERS WITH FLUE GAS RECIRCULATION. 0.16 lb/MMBtu unknown
ENCOAL CORPORATION-ENCOAL NORTH ROCHELLE FAC WY CT-1324 352 10/10/1997
LIQUIDS FROM COAL PLANT (3 MODULES PER PLANT)
LOW NOX BURNERS WITH FLUE GAS RECIRCULATION 0.17 lb/MMBtu unknown
SANTEE COOPER CROSS SC0420-0030-
CI 600 2/5/04 BOILER #3 SCR/LNB/OVERFIRE AIR 0.185 lb/MMBtu 30-day rolling average
SANTEE COOPER CROSS SC0420-0030-
CI 600 2/5/04 BOILER #4 SCR/LNB/OVERFIRE AIR 0.185 lb/MMBtu 30-day rolling average
SANDY CREEK ENERGY STATION TX
PSD-TX 1039 AND
70861 2398 7/24/2006PULVERIZED COAL BOILER
AT THIS POINT, THE FLUE GAS HAS BEEN COOLED TO THE APPROPRIATE TEMPERATURE FOR SCR, SO IT NEXT PASSES THROUGH THE SCR REACTOR, WHERE NOX IS REDUCED TO FORM NITROGEN. 0.20 lb/MMBtu 1-hour average
KIMBERLY CLARK/CHESTER PLANT PA 23-0014A 73 6/24/1998 BOILER, VERTICAL 0.2 lb/MMBtu unknownKIMBERLY CLARK/CHESTER PLANT PA 23-0014A 58 6/24/1998 BOILER, VERTICAL 0.2 lb/MMBtu unknown
VIRGINIA TECH VA 20124 43 9/15/2005OPERATION OF BOILER 11
EMISSIONS CONTROLLED BY A MASS-FEED STOKER CONFIGURATION WITH LOW EXCESS AIR/STAGED COMBUSTION 0.246 lb/MMBtu 30-day rolling average
SOUTHWESTERN PUBLIC SERVICE COMPANY-HARRINGT TX P017M1 1134 10/17/2006 UNIT 3 BOILER
LOW NOX BURNERS, SEPARATED OVERFIRE AIR WINDBOX, WITH ADDITIONAL YAW CONTROL OF THE BURNERS FOR ADDITIONAL NOX CONTROL 0.3 lb/MMBtu 30-day rolling average
Emission Limit

Prevention of Significant Deterioration Air Permit Application January 17, 2008 Plant Washington, Power4Georgians, LLC
070007.2201 4-38
Table 4-4 Listing of NOx Emissions from Pulverized Coal Boilers Taken From the RBLC (Continued)
Facility NameFacility State
Permit Number
Capacity (MW)
Permit Date Process Name Control Description Avg Period
WA PARISH ELECTRIC GENERATING STATION TX
PSD-TX-901, PSD-
TX-902 & -33M1
6700 mmbtu 10/15/2003
BOILER UNIT 7, COAL, WAP7 NONE INDICATED 0.324 lb/MMBtu unknown
WASHINGTON PARISH ELECTRIC GENERATING STATION TXPSD-TX-33
M16700
mmbtu 10/15/2002BOILER STACK, WAP 7, COAL ONLY NONE INDICATED 0.325 lb/MMBtu unknown
WA PARISH ELECTRIC GENERATING STATION TX
PSD-TX-901, PSD-
TX-902 & -33M1
6700 mmbtu 10/15/2003
BOILER UNIT 7, COAL & GAS, WAP7
EMISSIONS SHALL COMPLY WITH 30 TAC CHAPTER 17. 0.352 lb/MMBtu unknown
WASHINGTON PARISH ELECTRIC GENERATING STATION TXPSD-TX-33
M16700
mmbtu 10/15/2002BOILER STACK, WAP 7, COAL & NAT GAS NONE INDICATED 0.353 lb/MMBtu unknown
WA PARISH ELECTRIC GENERATING STATION TX
PSD-TX-901, PSD-
TX-902 & -33M1
7400 mmbtu 10/15/2003
(2) BOILERS, UNITS 5 & 6, WAP5&6, COAL NONE INDICATED 0.38 lb/MMBtu unknown
WASHINGTON PARISH ELECTRIC GENERATING STATION TXPSD-TX-33
M17400
mmbtu 10/15/2002(2) BOILER STACKS, WAP 5 & 6 , COAL ONLY NONE INDICATED 0.38 lb/MMBtu unknown
THERMAL VENTURES VA 30529 35 2/15/2002 BOILER, STEAM
GOOD COMBUSTION PRACTICES, CLEAN BURNING FUEL, AND CONTINUOUS EMISSION MONITORING DEVICE. 0.4 lb/MMBtu unknown
WA PARISH ELECTRIC GENERATING STATION TX
PSD-TX-901, PSD-
TX-902 & -33M1
7400 mmbtu 10/15/2003
(2) BOILERS, UNITS 5 & 6, COAL & GAS, WAP5&6 NONE INDICATED 0.40 lb/MMBtu unknown
WASHINGTON PARISH ELECTRIC GENERATING STATION TXPSD-TX-33
M17400
mmbtu 10/15/2002
(2) BOILER STACKS, WAP 5 & 6 , COAL & NAT GAS NONE INDICATED 0.40 lb/MMBtu unknown
DESERET GENERATION AND TRANSMISSION COMPANY UTDAQE-186-
98 500 3/16/1998 COAL FIRED BOILER BOILER DESIGN 0.5 lb/MMBtu Annual average
DESERET GENERATION AND TRANSMISSION COMPANY UTDAQE-186-
98 500 3/16/1998 COAL FIRED BOILER BOILER DESIGN 0.55 lb/MMBtu 30-day rolling average
MANSFIELD MILL LAPSD-LA-93
(M-6) 189 8/14/2001POWER BOILER #1 & #2, COAL
LOW NOX STAGED BURNERS, CMS FOR O2 NOX EMISSIONS 0.7 lb/MMBtu unknown
AES BEAVER VALLEY PARTNERS, INC. PA 040446B 161 6/1/1999BOILER, PULVERIZED COAL FIRED
LNB/SOFA MODEL DRB-XCL, LOW NOX BURNER 0.7 lb/MMBtu unknown
Emission Limit
Prepared by: PMH 1/10/08
Checked by: JDF 1/10/08 \

Prevention of Significant Deterioration Air Permit Application January 17, 2008 Plant Washington, Power4Georgians, LLC
070007.2201 4-39
4.3.3 BACT Demonstration for CO Emissions from the Supercritical Pulverized Coal Boiler
Carbon Monoxide (CO) is a by-product of the incomplete combustion of carbon in the fuel source, in this
case coal. Control of CO is usually accomplished by providing proper fuel residence time and proper
combustion conditions (excess air). However, factors to reduce CO emissions, such as addition of excess
air to improve combustion, can lead to a resultant increase in NOX emissions. Therefore, an evaluation of
the reduction of CO emissions needs to take into account the potential secondary impacts on NOX
emissions.
Step 1 – Identify All Control Technologies
Combustion Controls
The use of combustion controls for CO emissions would be a lower pollutant emitting process,
through managing the combustion process to optimize the combustion process and reduce the
generation of CO emissions. Important factors in proper combustion include proper fuel
residence time, proper air to fuel ratios in the combustion chamber, and consistent proper
temperatures in the combustion chamber. CO formation will be limited through the use of a
properly designed combustion chamber with adequate controls to regulate the combustion
process. Proper maintenance is also necessary for proper combustion control. Proper operation
of fuel feed systems, fans, system dampers, and other equipment will assist in minimization of
CO emissions. However, as stated above, careful consideration is necessary in the process of
combustion controls, since increasing the combustion temperature or oxygen concentration in
the combustion chamber would decrease CO emissions, it would likely increase the formation
of thermal NOX, and increase overall NOX emissions.
Add-On Controls
No effective add-on controls currently exist for CO emissions from a boiler. Use of control
technologies such as afterburners would use large quantities of natural gas and simply convert
CO to CO2. Use of afterburners, and other control devices such as catalytic oxidation or flares,
have not been demonstrated in practice in PC boiler units. Any such control devices would lead
to negative secondary environmental impacts, such as increased fuel usage and associated air
emissions.

Prevention of Significant Deterioration Air Permit Application January 17, 2008 Plant Washington, Power4Georgians, LLC
070007.2201 4-40
Step 2 – Eliminate Technically Infeasible Options
As discussed above, the use of add-on controls for control of CO emissions for the PC boiler units is not
technically feasible. Use of add-on controls such as flares, afterburners, catalytic oxidation, and external
thermal oxidation have not been demonstrated in practice for control of CO emissions from PC fired
boilers. Combustion controls, such as the proper combustion chamber and system design, and proper
operation and maintenance, are demonstrated and proven techniques for the reduction of CO emissions.
Combustion controls are considered a demonstrated technology for PC fired boiler CO emissions
controls, and therefore considered technically feasible under the BACT evaluation process.
Step 3 – Rank Remaining Technically Feasible Control Options
Combustion controls are the only feasible technology for control of CO emissions. Combustion controls
are designed to optimize the emissions of CO (and consequently NOX) from a PC fired boiler. Therefore,
there are no energy or environmental impacts associated with the implementation of combustion controls.
Since combustion controls are now a standard part of the design process of a PC fired boiler, there are no
economic impacts associated with the implementation of combustion controls.
Step 4 – Evaluate Remaining Control Technologies
There are no energy, environmental, or economic impacts associated with the use of combustion controls
which precludes the use of combustion controls as BACT for CO emissions for a PC fired boiler.
Step 5 – Selection of BACT
Table 4-5 shows the RBLC listings for CO emissions from Pulverized Coal boilers. BACT for CO
emissions is chosen as the implementation of combustion controls and an emission limit of 0.15
lb/MMBtu on a 30-day average basis and 0.30 lb/MMBtu on a 1-hr average basis. Although BACT
determinations for similar PC fired boilers have selected BACT with emission limits as low as 0.10
lb/MMBtu, control of NOX emissions is determined to be the most environmentally “sensitive” factor, as
those sources have selected higher NOX emissions limits than those proposed as part of this application.
Also, sources with emission limits as low as 0.10 lb/MMBtu have not yet been demonstrated in practice.
The lowest demonstrated BACT emission limit in practice is by the Hardin Generator Project with an
emission limit of 0.15 lb/MMBtu. The emission limits chosen for this BACT evaluation are comparable
to those chosen for recent similar projects. Therefore, through implementation of more strict NOX
emission limits as evaluated as part of the overall BACT evaluation for the facility PC fired boiler unit, a
higher CO emission limit is chosen.

Prevention of Significant Deterioration Air Permit Application January 17, 2008 Plant Washington, Power4Georgians, LLC
070007.2201 4-41
Table 4-5 RBLC Listings for CO Emissions from Pulverized Coal-Fired Boilers
Facility NameFacility
State Permit Number Permit Date Process Name FuelThruput
(MW) Control DescriptionDESERET GENERATION AND TRANSMISSION COMPANY UT DAQE-186-98 3/16/1998 COAL FIRED BOILER COAL 500 NONE INDICATED 0.08 lb/MMBtu
THOROUGHBRED GENERATING STATION KY V-02-001 10/11/2002 BOILER, COAL, (2) COAL 750PROPER BOILER DESIGN AND OPERATION 0.10 lb/MMBtu
TOQUOP ENERGY, LLC NV AP4911-1146 DRAFT 750 MW PC BOILER COAL 750 COMBUSTION CONTROLS 0.10 lb/MMbtuELY ENERGY CENTER NV AP4911-2241 DRAFT (2) 750 MW PC BOILERS COAL 750 COMBUSTION CONTROLS 0.10 lb/MMbtuDESERT ROCK NM DRAFT 7/1/2006 (2) 750 MW PC BOILERS COAL 750 NONE INDICATED 0.10 lb/MMbtu
TRIMBLE COUNTY GENERATING STATION KY DRAFT 7/6/2005PULVERIZED COAL BOILER COAL 750 GOOD COMBUSTION PRACTICES 0.10 lb/MMbtu
MAIDSVILLE WV R14-0024 3/2/2004 BOILER, PC PULVERIZED COAL 600 GOOD COMBUSTION PRACTICES 0.11 lb/MMBtuJEA NORTHSIDE GENERATING STATION FL PSD-FL-265 7/14/1999 BOILER, COAL COAL 810 GOOD COMBUSTION PRACTICES. 0.13 lb/MMBtu
COMANCHE STATION CO 04UNITPB1015 7/5/2005 PC BOILER - UNIT 3 SUB-BITUMINOUS COAL 750 GOOD COMBUSTION PRACTICES 0.13 lb/MMBtu
BIG CAJUN II POWER PLANT LA PSD-LA-677 8/22/2005
NEW 675 MW PULVERIZED COAL BOILER (UNIT 4) SUBBITUMINOUS COAL
OPTIMUM BURNER DESIGN AND GOOD COMBUSTION TECHNIQUES 0.135 lb/MMBtu
KANSAS CITY POWER & LIGHT COMPANY - IATAN STATION MO 012006-019 1/27/2006PULVERIZED COAL BOILER - UNIT 2 PULVERIZED COAL
7800 MMBtu/hr NONE INDICATED 0.14 lb/MMBtu
AGP SOY PROCESSING NE CP05-0050 9/11/2006 STEAM GENERATION COAL 112 COMBUSTION CONTROL 0.15 lb/MMBtu
BULL MOUNTAIN, NO. 1, LLC - ROUNDUP POWER PROJECT MT 3182-00 7/21/2003 BOILER, PC NO. 1 COAL 390 NONE INDICATED 0.15 lb/MMBtu
BULL MOUNTAIN, NO. 1, LLC - ROUNDUP POWER PROJECT MT 3182-00 7/21/2003 BOILER, PC NO. 2 COAL 390 NONE INDICATED 0.15 lb/MMBtu
HOLCOMB UNIT #2 KS 0550087/C-3855 10/8/2002BOILER, PULVERIZED COAL COAL 660 GOOD COMBUSTION PRACTICES 0.15 lb/MMBtu
HARDIN GENERATOR PROJECT MT 3185-00 6/11/2002BOILER, PULVERIZED COAL-FIRED COAL 382 NONE INDICATED 0.15 lb/MMBtu
TS POWER PLANT NV AP4911-1349 5/5/2005200 MW PC COAL BOILER
POWDER RIVER BASIN COAL 595 GOOD COMBUSTION PRACTICES 0.15 lb/MMBtu
WPS - WESTON PLANT WI 04-RV-248 10/19/2004
SUPER CRITICAL PULVERIZED COAL ELECTRIC STEAM BOILER (S04, P04) PRB COAL 500
GOOD COMBUSTION PRACTICES; LOW NOX BURNERS 0.15 lb/MMBtu
Emission Limit

Prevention of Significant Deterioration Air Permit Application January 17, 2008 Plant Washington, Power4Georgians, LLC
070007.2201 4-42
Table 4-5 RBLC Listings for CO Emissions from Pulverized Coal-Fired Boilers (Continued)
Facility NameFacility
State Permit Number Permit Date Process Name FuelThruput
(MW) Control Description
TWO ELK GENERATION PARTNERS, LIMITED PARTNERSHIP WY CT-1352 2/27/1998
BOILER, STEAM ELECTRIC POWER GENERATING PULVERIZED COAL 250 NONE INDICATED 0.15 lb/MMBtu
WYGEN 3 WY CT-4517 2/5/2007 PC BOILER SUBBITUMINOUS COAL 381 GOOD COMBUSTION 0.15 lb/MMBtuWHELAN ENERGY CENTER NE 58048 3/30/2004 BOILER, UNIT 2 UTILITY SUBBITUMINOUS COAL 648 GOOD COMBUSTION CONTROLS 0.15 lb/MMBtu
WYGEN 2 WY CT-3030 9/25/2002 BOILER, 500 MW PC SUBBITUMINOUS COAL5145
MMBtu/hr GOOD COMBUSTION CONTROL 0.15 lb/MMBtu
ENCOAL CORPORATION-ENCOAL NORTH ROCHELLE FACILITY WY CT-1324 10/10/1997
LIQUIDS FROM COAL PLANT (3 MODULES PER PLANT) SUBBITUMINUS COAL 352 NONE INDICATED 0.15 lb/MMBtu
ENCOAL CORPORATION-ENCOAL NORTH ROCHELLE FACILITY WY CT-1324 10/10/1997BOILER, COAL FIRED, MAIN STACK SUBBITUMINUS COAL 352 NONE INDICATED 0.15 lb/MMBtu
HUGO GENERATING STATION OK 97-058-C M-2 PSD 2/9/2007
COAL-FIRED STEAM EGU BOILER (HU-UNIT 2) COAL 750 GOOD COMBUSTION CONTROL 0.15 lb/MMBtu
ENCOAL CORPORATION-ENCOAL NORTH ROCHELLE FACILITY WY CT-1324 10/10/1997
BOILER, PULVERIZED COAL FIRED POWER GENERATION UNI COAL 240
DUE TO THE LNB/OFA STRATEGY TO CONTROL NOX IT WOULD BE COUNTER PRODUCTIVE TO LIMIT CO. 0.15 lb/MMBtu
LONGLEAF ENERGY ASSOCIATES, LLC GA4911-099-0030-P-01-
0 5/14/2007 (2) 600 MW UNITS COAL 600COMBUSTION CONTROLS - 30 DAY ROLLING AVG 0.15 lb/MMbtu
JK SPRUCE ELECTRIC GENERATING UNIT 2 TX 70492 1/19/2006
PULVERIZED COAL FIRED ELECTRIC STEAM BOILER COAL 750 GOOD COMBUSTION PRACTICES 0.15 lb/MMbtu
INTERMOUNTAIN POWER GENERATING STATION UNIT #3 UTDAQE-AN0327010-
04 10/15/2004
PULVERIZED COAL FIRED ELECTRIC GENERATING UNIT COAL 950 COMBUSTION CONTROLS 0.15 lb/MMbtu
MIDAMERICAN ENERGY COMPANY IA PROJECT 02-528 6/17/2003 CBEC 4 BOILER PRB COAL7675
MMBtu/hr COMBUSTION CONTROLS 0.154 lb/MMBtuGASCOYNE GENERATING STATION ND PTC 05005 6/3/2005 BOILER COAL 220 GOOD COMBUSTION PRACTICES 0.154 lb/MMbtu
KANSAS CITY POWER & LIGHT COMPANY - IATAN STATION MO 012006-019 1/27/2006PULVERIZED COAL BOILER - UNIT 1 COAL
7800 MMBtu/hr
GOOD COMBUSTION CONTROL PRATICE 0.16 lb/MMBtu
CITY UTILITIES OF SPRINGFIELD - SOUTHWEST POWER STATION MO 122004-007 12/15/2004PULVERIZED COAL FIRED BOILER COAL 798
THE UTILIZATION OF GOOD COMBUSTION PRACTICES WITH A CO EMISSION LIMIT OF 0.16 LBS/MMBTU WAS DETERMINED TO BE BACT FOR CO FROM THE PULVERZIE COAL FIRED BOILER. 0.16 lb/MMBtu
KANSAS CITY POWER & LIGHT CO. - HAWTHORN STATION MO 888 8/17/1999
ELECTRIC GENERATION, BOILER, COAL COAL 384 T/HR GOOD COMBUSTION PRACTICES 0.16 lb/MMBtu
OPPD - NEBRASKA CITY STATION NE 58343C01 3/9/2005 UNIT 2 BOILER SUBBITUMINOUS COAL 660 COMBUSTION CONTROLS 0.16 lb/MMBtu
PLUM POINT ENERGY AR 1995-AOP-R0 8/20/2003 BOILER , UNIT 1 - SN-01 SUB-BITUMINOUS COAL 800 COMBUSTION CONTROLS 0.16 lb/MMBtu
PLUM POINT ENERGY AR 1995-AOP-R0 8/20/2003 BOILER - SN-01 SUB-BITUMINOUS COAL 800 COMBUSTION CONTROLS 0.16 lb/MMBtuSANDY CREEK ENERGY STATION TX DRAFT 3/1/2005 BOILER COAL 800 COMBUSTION CONTROLS 0.16 lb/MMbtuSANTEE COOPER CROSS GENERATING STATION SC 0420-0030-CI 2/5/2004 BOILER NO. 3 AND 4 COAL 660 GOOD COMBUSTION PRACTICES 0.16 lb/MMbtuAES BEAVER VALLEY, LLC PA PA-04-446C 11/21/2001 COAL FIRED BOILER COAL 631 GOOD COMBUSTION PRACTICES 0.20 lb/MMBtu
Emission Limit

Prevention of Significant Deterioration Air Permit Application January 17, 2008 Plant Washington, Power4Georgians, LLC
070007.2201 4-43
Table 4-5 RBLC Listings for CO Emissions from Pulverized Coal-Fired Boilers (Continued)
Facility NameFacility
State Permit Number Permit Date Process Name FuelThruput
(MW) Control Description
MANSFIELD MILL LA PSD-LA-93 (M-6) 8/14/2001POWER BOILER #1 & #2, COAL COAL 189
LESS THAN 0.041 LB/MMBTU FROM COAL 0.20 lb/MMBtu
MANSFIELD MILL LA PSD-LA-93 (M-6) 8/14/2001POWER BOILER #1 & #2, COMBINED FUEL COMBINED FUEL 223 RESTRICTION ON INPUTS 0.20 lb/MMBtu
VIRGINIA TECH VA 20124 9/15/2005OPERATION OF BOILER 11 COAL 43 CEM 0.226 lb/MMBtu
INLAND PAPERBOARD AND PACKAGING, INC. - ROME LINERBOARD MILL GA2631-115-0021-V-
01-4 10/13/2004 BOILER, COAL FIRED COAL 166STAGED COMBUSTION AND GOOD COMBUSTION PRACTICES 0.25 lb/MMBtu
WA PARISH ELECTRIC GENERATING STATION TXPSD-TX-901, PSD-TX-902 & -33M1 10/15/2003
BOILER UNIT 7, COAL, WAP7 COAL
6700 MMBtu/hr COMBUSTION CONTROL 0.282 lb/MMBtu
WA PARISH ELECTRIC GENERATING STATION TXPSD-TX-901, PSD-TX-902 & -33M1 10/15/2003
(2) BOILERS, UNITS 5 & 6, WAP5&6, COAL COAL
6750 MMBtu/hr COMBUSTION CONTROL 0.292 lb/MMBtu
WA PARISH ELECTRIC GENERATING STATION TXPSD-TX-901, PSD-TX-902 & -33M1 10/15/2003
BOILER UNIT 7, COAL & GAS, WAP7 COAL
6700 MMBtu/hr COMBUSTION CONTROL 0.294 lb/MMBtu
LONGLEAF ENERGY ASSOCIATES, LLC GA4911-099-0030-P-01-
0 5/14/2007 (2) 600 MW UNITS COAL 600COMBUSTION CONTROLS - 1 HR AVG 0.30 lb/MMbtu
SANDY CREEK ENERGY STATION TXPSD-TX 1039 AND
70861 7/24/2006PULVERIZED CAOL BOILER COAL 800 NONE INDICATED 0.30 lb/MMBtu
WA PARISH ELECTRIC GENERATING STATION TXPSD-TX-901, PSD-TX-902 & -33M1 10/15/2003
(2) BOILERS, UNITS 5 & 6, COAL & GAS, WAP5&6 COAL
6750 MMBtu/hr COMBUSTION CONTROL 0.302 lb/MMBtu
SEVIER POWER COMPANY UTDAQE-AN2529001-
04 10/12/2004COMBUSTION CONTROLS WESTERN COAL 270 NONE INDICATED 0.32 lb/MMBtu
WASHINGTON PARISH ELECTRIC GENERATING STATION TX PSD-TX-33 M1 10/15/2002(2) BOILER STACKS, WAP 5 & 6 , COAL ONLY COAL
6750 MMBtu/hr COMBUSTION CONTROL 0.321 lb/MMBtu
WASHINGTON PARISH ELECTRIC GENERATING STATION TX PSD-TX-33 M1 10/15/2002BOILER STACK, WAP 7, COAL ONLY COAL
6700 MMBtu/hr COMBUSTION CONTROL 0.33 lb/MMBtu
WASHINGTON PARISH ELECTRIC GENERATING STATION TX PSD-TX-33 M1 10/15/2002
(2) BOILER STACKS, WAP 5 & 6 , COAL & NAT GAS COAL & NAT GAS 2168 COMBUSTION CONTROL 0.33 lb/MMBtu
WASHINGTON PARISH ELECTRIC GENERATING STATION TX PSD-TX-33 M1 10/15/2002BOILER STACK, WAP 7, COAL & NAT GAS COAL & NAT GAS
6700 MMBtu/hr COMBUSTION CONTROL 0.33 lb/MMBtu
INDEPENDENCE AR 449-AOP-R0 3/10/1998BOILER (2 EACH), COAL FIRED SUB-BITUMINOUS COAL
8700 MMBtu/hr GOOD COMBUSTION PRACTICE 0.37 lb/MMBtu
NEAL ENERGY CENTER SOUTH IA 05-A-655-P 9/28/2005 UNIT 4 BOILER COAL 399 GOOD COMBUSTION 0.42 lb/MMBtu
THERMAL VENTURES VA 30529 2/15/2002 BOILER, STEAM COAL 35
GOOD COMBUSTION PRACTICES, CLEAN BURNING FUEL, AND CONTINUOUS EMISSION MONITORING DEVICE. 0.44 lb/MMBtu
GEORGE NEAL NORTH IA 05-A-878-P 12/9/2005 NEAL 1 BOILER COAL 399 GOOD COMBUSTION PRACTICES 1.26 lb/MMBtuGEORGE NEAL NORTH IA 07-A-951-P 9/5/2007 NEAL 2 BOILER COAL 903 GOOD COMBUSTION PRACTICES 1.63 lb/MMBtu
Emission Limit
Prepared by: PMH 1/10/08 Checked by: JDF 1/10/08
Prevention of Significant Deterioration Air Permit Application January 17, 2008 Plant Washington, Power4Georgians, LLC
070007.2201 4-44
4.3.4 BACT Demonstration for VOC Emissions from the Supercritical Pulverized Coal Boiler
VOC emissions are generated during a combustion process from incomplete combustion of the fuel,
similar to CO emissions. Control of VOC emissions, therefore, is completed in the same manner as that
of CO emissions, through providing adequate fuel residence time in the combustion chamber and
maintaining a high temperature and sufficient oxygen in the combustion zone to ensure complete
combustion. Excessive VOC emissions could result from below optimal combustion zone conditions.
Low levels of VOC emissions are expected from properly operated PC fired boilers.
Step 1 – Identify All Control Technologies
Combustion Controls
The use of combustion controls for VOC emissions would be a lower pollutant emitting
process, through managing the combustion process to optimize the combustion process and
reduce the generation of VOC emissions. Important factors in proper combustion include
proper fuel residence time, proper air to fuel ratios in the combustion chamber, and consistent
proper temperatures in the combustion chamber. VOC formation will be limited through use of
a properly designed combustion chamber with adequate controls to regulate the combustion
process. Proper maintenance is also necessary for proper combustion control. Proper operation
of fuel feed systems, fans, system dampers, and other equipment will assist in minimization of
VOC emissions. However, as stated above, careful consideration is necessary in the process of
combustion controls, since increasing the combustion temperature or oxygen concentration in
the combustion chamber would decrease VOC emissions, it would likely increase the formation
of thermal NOX, and increase overall NOX emissions.
Add-On Controls
No effective add-on controls currently exist for VOC emissions from a boiler. Use of
afterburners, and other control devices such as catalytic oxidation or flares, have not been
demonstrated in practice in PC boiler units. Any such control devices would lead to negative
secondary environmental impacts such as higher NOX emissions. The use of combustion
controls is widely recognized as BACT for VOC emissions for PC fired boilers.

Prevention of Significant Deterioration Air Permit Application January 17, 2008 Plant Washington, Power4Georgians, LLC
070007.2201 4-45
Step 2 – Eliminate Technically Infeasible Options
As discussed above, the use of add-on controls for control of VOC emissions for the PC boiler units is not
technically feasible. Use of add-on controls such as flares, afterburners, catalytic oxidation, and thermal
oxidation have not been demonstrated in practice for control of VOC emissions from PC fired boilers.
Combustion controls, such as the proper combustion chamber and system design, and proper operation
and maintenance, are demonstrated and proven techniques for the reduction of VOC emissions.
Combustion controls are considered a demonstrated technology for PC fired boiler VOC emissions
controls, and therefore considered technically feasible under the BACT evaluation process.
Step 3 – Rank Remaining Technically Feasible Control Options
Combustion controls are the only feasible technology for control of VOC emissions. Combustion
controls are designed to optimize the emissions of VOC (and consequently NOX) from a PC fired boiler.
Therefore, there are no energy or environmental impacts associated with the implementation of
combustion controls. Since combustion controls are now a standard part of the design process of a PC
fired boiler, there are no economic impacts associated with the implementation of combustion controls.
Step 4 – Evaluate Remaining Control Technologies
There are no energy, environmental, or economic impacts associated with the use of combustion controls
which precludes the use of combustion controls as BACT for VOC emissions for a PC fired boiler.
Step 5 – Selection of BACT
Table 4-6 provides RBLC listings for VOC emissions from Pulverized Coal-fired Boilers. BACT for
VOC emissions is chosen as the implementation of combustion controls and an emission limit of 0.0034
lb/MMBtu on a 3-hr average basis. Selection of this BACT emissions limit is comparable as for other
similar PC fired boiler units. The Hardin Generator Project has demonstrated compliance with a VOC
BACT emission limit of 0.0034 lb/MMbtu. Although BACT determinations for similar PC fired boilers
have selected BACT with emission limits as low as 0.0024 lb/MMBtu, such as for the Santee Cooper
Cross Generating Station, control of NOX emissions is determined to be the most environmentally
“sensitive” factor, as the Santee Cooper Cross Generation Station has much higher NOX emissions limits
(0.08 lb/MMbtu annual limit) than those proposed as part of this application. Therefore, through
implementation of more strict NOX emission limits as evaluated as part of the overall BACT evaluation
for the facility PC fired boiler unit, a higher VOC emission limit is chosen.

Prevention of Significant Deterioration Air Permit Application January 17, 2008 Plant Washington, Power4Georgians, LLC
070007.2201 4-46
Table 4-6 RBLC Listings for VOC Emissions from Pulverized Coal-Fired Boilers Facility Name
Facility State Permit Number
Permit Date Process Name Fuel
Thruput (MW) Control Description
Emission Limit
Emission Limit Unit
VIRGINIA TECH VA 20124 9/15/2005OPERATION OF BOILER 11 COAL 43 GOOD COMBUSTION PRACTICE 0.002 lb/MMBtu
SANTEE COOPER CROSS GENERATING STATION SC 0420-0030-CI 2/5/2004BOILER, NO. 3 AND NO. 4 BITUMINOUS COAL 1670 GOOD COMBUSTION PRACTICE 0.0024 lb/MMBtu
JK SPRUCE ELECTRIC GENERATING UNIT 2 TX 70492 1/19/2006
PULVERIZED COAL FIRED ELECTRIC STEAM BOILER COAL 750 GOOD COMBUSTION PRACTICES 0.0025 lb/MMbtu
INTERMOUNTAIN POWER GENERATING STATION - UNIT #3 UT
DAQE-AN0327010-04 10/15/2004
PULVERIZED COAL FIRED ELECTRIC GENERATING UNIT
BITUMINOUS OR BLEND 950 COMBUSTION CONTROL 0.0027 lb/MMBtu
BULL MOUNTAIN, NO. 1, LLC - ROUNDUP POWER PROJECT MT 3182-00 7/21/2003 BOILER, PC NO. 1 COAL 390 NONE INDICATED 0.003 lb/MMBtuBULL MOUNTAIN, NO. 1, LLC - ROUNDUP POWER PROJECT MT 3182-00 7/21/2003 BOILER, PC NO. 2 COAL 390 NONE INDICATED 0.003 lb/MMBtuTOQUOP ENERGY, LLC NV AP4911-1146 DRAFT 750 MW PC BOILER COAL 750 COMBUSTION CONTROLS 0.003 lb/MMbtu
DESERT ROCK ENERGY FACILITY NM DRAFT 7/1/2006(2) 750 MW SCPC BOILERS COAL 750 GOOD COMBUSTION PRACTICES 0.003 lb/MMbtu
WA PARISH ELECTRIC GENERATING STATION TXPSD-TX-901, PSD-TX-902 & -33M1 10/15/2003
BOILER UNIT 7, COAL, WAP7 COAL
6700 MMBtu/hr COMBUSTION CONTROL 0.0030 lb/MMBtu
WASHINGTON PARISH ELECTRIC GENERATING STATION TX PSD-TX-33 M1 10/15/2002
BOILER STACK, WAP 7, COAL ONLY COAL
6700 MMBtu/hr COMBUSTION CONTROL 0.0030 lb/MMBtu
WA PARISH ELECTRIC GENERATING STATION TXPSD-TX-901, PSD-TX-902 & -33M1 10/15/2003
(2) BOILERS, UNITS 5 & 6, WAP5&6, COAL COAL
6750 MMBtu/hr COMBUSTION CONTROL 0.0031 lb/MMBtu
TRIMBLE COUNTY GENERATING STATION KY DRAFT 7/6/2005PULVERIZED COAL FIRED BOILER COAL 750 GOOD COMBUSTION PRACTICES 0.0032 lb/MMbtu
HARDIN GENERATOR PROJECT MT 3185-00 6/11/2002BOILER, PULVERIZED COAL-FIRED COAL 382
GOOD COMBUSTION PRACTICES, SOME CONTROL OFFERED BY WET SCRUBBER (REQUIRED FOR SO2 CONTROL) 0.0034 lb/MMBtu
OPPD - NEBRASKA CITY STATION NE 58343C01 3/9/2005 UNIT 2 BOILERSUBBITUMINOUS COAL 660 COMBUSTION CONTROLS 0.0034 lb/MMBtu
WASHINGTON PARISH ELECTRIC GENERATING STATION TX PSD-TX-33 M1 10/15/2002
(2) BOILER STACKS, WAP 5 & 6 , COAL ONLY COAL
6750 MMBtu/hr COMBUSTION CONTROL 0.0035 lb/MMBtu
HOLCOMB UNIT #2 KS 0550087/C-3855 10/8/2002BOILER, PULVERIZED COAL COAL 660 GOOD COMBUSTION PRACTICES 0.0035 lb/MMBtu
COMANCHE STATION CO 04UNITPB1015 7/5/2005 PC BOILER - UNIT 3SUB-BITUMINOUS COAL 750 GOOD COMBUSTION PRACTICES 0.0035 lb/MMBtu
ELY ENERGY CENTER NV AP4911-2241 DRAFT (2) 750 MW PC BOILERS COAL 750 COMBUSTION CONTROLS 0.0035 lb/MMbtu
WA PARISH ELECTRIC GENERATING STATION TXPSD-TX-901, PSD-TX-902 & -33M1 10/15/2003
(2) BOILERS, UNITS 5 & 6, COAL & GAS, WAP5&6 COAL
6750 MMBtu/hr COMBUSTION CONTROL 0.0035 lb/MMBtu
WASHINGTON PARISH ELECTRIC GENERATING STATION TX PSD-TX-33 M1 10/15/2002
(2) BOILER STACKS, WAP 5 & 6 , COAL & NAT GAS COAL & NAT GAS
6750 MMBtu/hr COMBUSTION CONTROL 0.0035 lb/MMBtu
AGP SOY PROCESSING NE CP05-0050 9/11/2006 STEAM GENERATION COAL 112 NONE INDICATED 0.0035 lb/MMBtu
SANDY CREEK ENERGY STATION TXPSD-TX 1039 AND 70861 7/24/2006
PULVERIZED CAOL BOILER COAL 800 NONE INDICATED 0.0035 lb/MMBtu
WA PARISH ELECTRIC GENERATING STATION TXPSD-TX-901, PSD-TX-902 & -33M1 10/15/2003
BOILER UNIT 7, COAL & GAS, WAP7 COAL
6700 MMBtu/hr COMBUSTION CONTROL 0.0036 lb/MMBtu
WASHINGTON PARISH ELECTRIC GENERATING STATION TX PSD-TX-33 M1 10/15/2002
BOILER STACK, WAP 7, COAL & NAT GAS COAL & NAT GAS
6700 MMBtu/hr COMBUSTION CONTROL 0.0036 lb/MMBtu
KANSAS CITY POWER & LIGHT COMPANY - IATAN STATION MO 012006-019 1/27/2006
PULVERIZED COAL BOILER - UNIT 1 COAL
7800 MMBtu/hr
GOOD COMBUSTION CONTROL PRACTICE 0.0036 lb/MMBtu
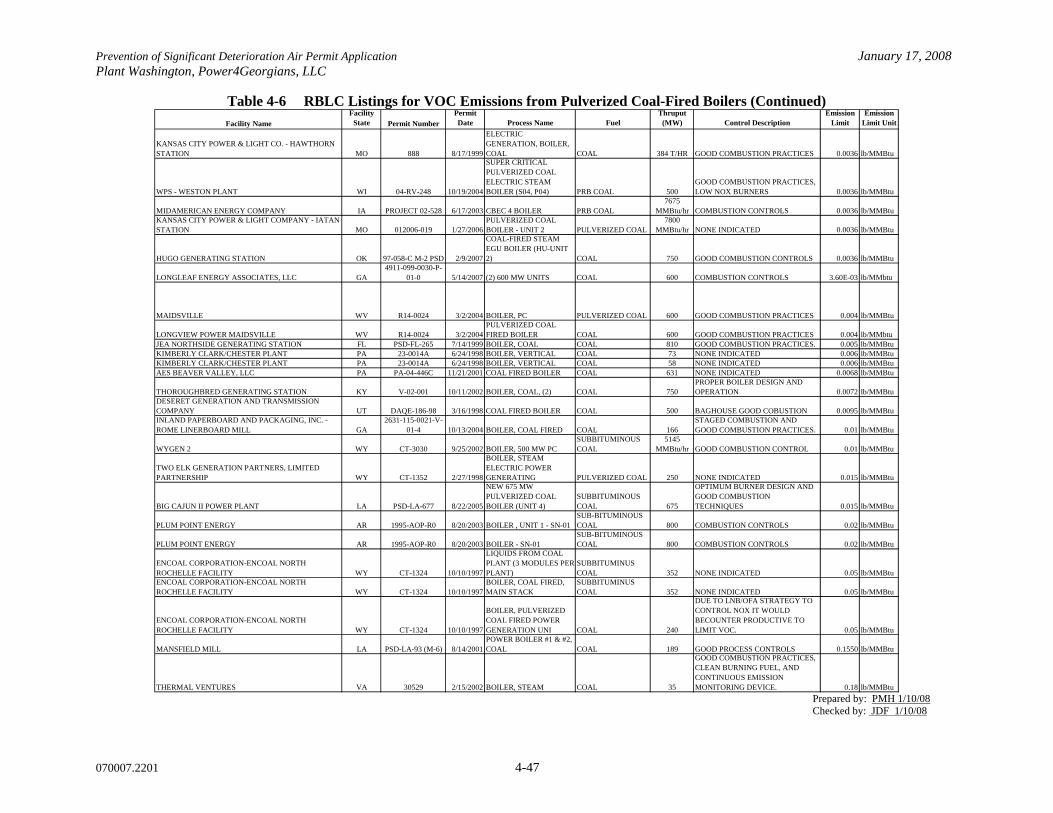
Prevention of Significant Deterioration Air Permit Application January 17, 2008 Plant Washington, Power4Georgians, LLC
070007.2201 4-47
Table 4-6 RBLC Listings for VOC Emissions from Pulverized Coal-Fired Boilers (Continued) Facility Name
Facility State Permit Number
Permit Date Process Name Fuel
Thruput (MW) Control Description
Emission Limit
Emission Limit Unit
KANSAS CITY POWER & LIGHT CO. - HAWTHORN STATION MO 888 8/17/1999
ELECTRIC GENERATION, BOILER, COAL COAL 384 T/HR GOOD COMBUSTION PRACTICES 0.0036 lb/MMBtu
WPS - WESTON PLANT WI 04-RV-248 10/19/2004
SUPER CRITICAL PULVERIZED COAL ELECTRIC STEAM BOILER (S04, P04) PRB COAL 500
GOOD COMBUSTION PRACTICES, LOW NOX BURNERS 0.0036 lb/MMBtu
MIDAMERICAN ENERGY COMPANY IA PROJECT 02-528 6/17/2003 CBEC 4 BOILER PRB COAL7675
MMBtu/hr COMBUSTION CONTROLS 0.0036 lb/MMBtuKANSAS CITY POWER & LIGHT COMPANY - IATAN STATION MO 012006-019 1/27/2006
PULVERIZED COAL BOILER - UNIT 2 PULVERIZED COAL
7800 MMBtu/hr NONE INDICATED 0.0036 lb/MMBtu
HUGO GENERATING STATION OK 97-058-C M-2 PSD 2/9/2007
COAL-FIRED STEAM EGU BOILER (HU-UNIT 2) COAL 750 GOOD COMBUSTION CONTROLS 0.0036 lb/MMBtu
LONGLEAF ENERGY ASSOCIATES, LLC GA4911-099-0030-P-
01-0 5/14/2007 (2) 600 MW UNITS COAL 600 COMBUSTION CONTROLS 3.60E-03 lb/MMbtu
MAIDSVILLE WV R14-0024 3/2/2004 BOILER, PC PULVERIZED COAL 600 GOOD COMBUSTION PRACTICES 0.004 lb/MMBtu
LONGVIEW POWER MAIDSVILLE WV R14-0024 3/2/2004PULVERIZED COAL FIRED BOILER COAL 600 GOOD COMBUSTION PRACTICES 0.004 lb/MMbtu
JEA NORTHSIDE GENERATING STATION FL PSD-FL-265 7/14/1999 BOILER, COAL COAL 810 GOOD COMBUSTION PRACTICES. 0.005 lb/MMBtuKIMBERLY CLARK/CHESTER PLANT PA 23-0014A 6/24/1998 BOILER, VERTICAL COAL 73 NONE INDICATED 0.006 lb/MMBtuKIMBERLY CLARK/CHESTER PLANT PA 23-0014A 6/24/1998 BOILER, VERTICAL COAL 58 NONE INDICATED 0.006 lb/MMBtuAES BEAVER VALLEY, LLC PA PA-04-446C 11/21/2001 COAL FIRED BOILER COAL 631 NONE INDICATED 0.0068 lb/MMBtu
THOROUGHBRED GENERATING STATION KY V-02-001 10/11/2002 BOILER, COAL, (2) COAL 750PROPER BOILER DESIGN AND OPERATION 0.0072 lb/MMBtu
DESERET GENERATION AND TRANSMISSION COMPANY UT DAQE-186-98 3/16/1998 COAL FIRED BOILER COAL 500 BAGHOUSE GOOD COBUSTION 0.0095 lb/MMBtuINLAND PAPERBOARD AND PACKAGING, INC. - ROME LINERBOARD MILL GA
2631-115-0021-V-01-4 10/13/2004 BOILER, COAL FIRED COAL 166
STAGED COMBUSTION AND GOOD COMBUSTION PRACTICES. 0.01 lb/MMBtu
WYGEN 2 WY CT-3030 9/25/2002 BOILER, 500 MW PCSUBBITUMINOUS COAL
5145 MMBtu/hr GOOD COMBUSTION CONTROL 0.01 lb/MMBtu
TWO ELK GENERATION PARTNERS, LIMITED PARTNERSHIP WY CT-1352 2/27/1998
BOILER, STEAM ELECTRIC POWER GENERATING PULVERIZED COAL 250 NONE INDICATED 0.015 lb/MMBtu
BIG CAJUN II POWER PLANT LA PSD-LA-677 8/22/2005
NEW 675 MW PULVERIZED COAL BOILER (UNIT 4)
SUBBITUMINOUS COAL 675
OPTIMUM BURNER DESIGN AND GOOD COMBUSTION TECHNIQUES 0.015 lb/MMBtu
PLUM POINT ENERGY AR 1995-AOP-R0 8/20/2003 BOILER , UNIT 1 - SN-01SUB-BITUMINOUS COAL 800 COMBUSTION CONTROLS 0.02 lb/MMBtu
PLUM POINT ENERGY AR 1995-AOP-R0 8/20/2003 BOILER - SN-01SUB-BITUMINOUS COAL 800 COMBUSTION CONTROLS 0.02 lb/MMBtu
ENCOAL CORPORATION-ENCOAL NORTH ROCHELLE FACILITY WY CT-1324 10/10/1997
LIQUIDS FROM COAL PLANT (3 MODULES PER PLANT)
SUBBITUMINUS COAL 352 NONE INDICATED 0.05 lb/MMBtu
ENCOAL CORPORATION-ENCOAL NORTH ROCHELLE FACILITY WY CT-1324 10/10/1997
BOILER, COAL FIRED, MAIN STACK
SUBBITUMINUS COAL 352 NONE INDICATED 0.05 lb/MMBtu
ENCOAL CORPORATION-ENCOAL NORTH ROCHELLE FACILITY WY CT-1324 10/10/1997
BOILER, PULVERIZED COAL FIRED POWER GENERATION UNI COAL 240
DUE TO LNB/OFA STRATEGY TO CONTROL NOX IT WOULD BECOUNTER PRODUCTIVE TO LIMIT VOC. 0.05 lb/MMBtu
MANSFIELD MILL LA PSD-LA-93 (M-6) 8/14/2001POWER BOILER #1 & #2, COAL COAL 189 GOOD PROCESS CONTROLS 0.1550 lb/MMBtu
THERMAL VENTURES VA 30529 2/15/2002 BOILER, STEAM COAL 35
GOOD COMBUSTION PRACTICES, CLEAN BURNING FUEL, AND CONTINUOUS EMISSION MONITORING DEVICE. 0.18 lb/MMBtu
Prepared by: PMH 1/10/08 Checked by: JDF 1/10/08

Prevention of Significant Deterioration Air Permit Application January 17, 2008 Plant Washington, Power4Georgians, LLC
070007.2201 4-48
4.3.5 BACT Demonstration for SO2 Emissions from the Supercritical Pulverized Coal Boiler
Emissions of Sulfur Dioxide (SO2) are generated in fossil fuel sources from oxidation of sulfur present in
the fuel source. Uncontrolled emissions of SO2 are therefore significantly affected by the sulfur content
of the fuel source.
Step 1 – Identify All Control Technologies
Lower Emitting Process or Practice – Coal Selection
Emissions of Sulfur Dioxide (SO2) result from the oxidation of sulfur present in the coal during
the combustion process. Therefore, coal source selection can have an impact on SO2 emissions
from a coal fired boiler.
Lower Emitting Process or Practice – Coal Cleaning
Coal cleaning is generally performed in order to remove impurities in the coal to improve the heat
content of the coal, thereby improving power plant capacity, reduce maintenance costs at power
plants and extend plant life. Coal cleaning is also performed to reduce the sulfur content in the
coal, to reduce the SO2 emissions which result from oxidation of the sulfur present in the coal
during combustion.
Lower Emitting Process or Practice – Coal Refining
Coal refining is a mechanical and thermal process to remove moisture, sulfur, nitrogen, and heavy
metals from coal. Also, as a result of the refining process, the ash content and moisture of the
coal can be lowered, as well as increasing the heat content of the coal. Coal refining processes
include processes still in the research and development stage, such as patented technologies for
conversion of coal to char, a “clean” boiler fuel, and processes already in limited operation such
as the Evergreen Energy, Inc. K-Fuel patented pre-combustion coal refining process.
Wet Scrubber
Wet scrubbers systems are often used as FGD systems, where they are used to control emissions
of SO2 from oil and coal combustion sources from industrial sources and electrical utilities. A
Prevention of Significant Deterioration Air Permit Application January 17, 2008 Plant Washington, Power4Georgians, LLC
070007.2201 4-49
wet scrubber brings the exhaust gas stream into contact with a sorbent material designed to
absorb and react with the SO2 present in the gas stream. Reagents commonly used in the process
include lime and limestone. Additives, such as magnesium, are sometimes added to the reagent
materials to further improve the reaction of the reagent with the SO2 present in the gas stream.
However, magnesium enhancement has been found to be not well suited for larger scale electric
utility units. The by-products of the wet scrubber are in a wet slurry form and must be dewatered
prior to handling and further disposal. Wastewaters generated through the wet scrubbing process
may also require some level of treatment.
Spray Dryer Absorber (Dry Scrubber)
In a spray dryer absorber (SDA), or spray dryer, a fine spray of reagent slurry (mixed with water)
is atomized and comes into contact with the hot exhaust gas, or flue gas. Lime is the typical
reagent used in an SDA unit. A significant part of the acidic components of the flue gas are
rapidly absorbed into the alkaline droplets, with the water/moisture content present being
evaporated simultaneously. Control of exhaust gas distribution, slurry flow rate, and spray
droplet size ensure that the droplets introduced into the gas stream are effectively dried to a fine
powder before touching the chamber walls of the spray dryer unit or exiting the spray dryer
system. A portion of the reacted product is collected and discharged from the spray dryer
absorber. The treated flue gas is then discharged to a fabric filter baghouse, or other PM control
device, where additional reacted product is collected from the exhaust gas stream.
Circulating Dry Scrubber
A CDS is similar in concept and reaction chemistry to a spray dryer absorber (SDA). In a CDS
system, a circulating fluidized bed arrangement is used for contacting the sorbent reagent, lime,
with the SO2 laden flue exhaust gas. As with a spray dryer absorber, the reaction products exit
the system in a dry form and are collected down stream in a fabric filter baghouse or other PM
control device.
Activated Carbon Flue Gas Desulfurization
In this system, activated carbon is used as the sorbent for removal of SO2 emissions. Activated
carbon is injected into the flue gas exhaust stream through a series of header nozzles upstream of

Prevention of Significant Deterioration Air Permit Application January 17, 2008 Plant Washington, Power4Georgians, LLC
070007.2201 4-50
a fabric filter baghouse or other PM control device. A portion of the reacted carbon and fly ash
collected by the PM control device is recycled and injected back into the flue gas exhaust stream
to minimize the need for fresh activated carbon, making the process a partially “regenerable”
process.
Duct Sorbent Injection (DSI) and Wet Scrubber
One potential control technology is the combination of sorbent injection with a wet scrubber. A
reagent, such as lime or limestone, is injected into the ductwork between the air heater and the
PM control device. Sorbent injection technology could be used in conjunction with a wet
scrubber device.
Duct Sorbent Injection (DSI) and Dry Scrubber
One potential control technology is the combination of sorbent injection with a dry scrubber. A
reagent, such as lime or limestone, is injected into the ductwork between the air heater and the
PM control device. Sorbent injection technology could be used in conjunction with a dry
scrubber device.
Step 2 – Eliminate Technically Infeasible Options
Lower Emitting Process or Practice – Coal Selection
Coal selection is a demonstrated method for minimizing the amount of sulfur available for SO2
formation. Therefore, coal selection is determined to be technically feasible for this project.
Lower Emitting Process or Practice – Coal Cleaning
Coal washing involves removing the sulfur from the fuel before combusting it in a boiler. The
majority of the sulfur in the coal is organic and is chemically bonded in the molecular structure of
the coal itself. A small fraction of the sulfur in the coal is within an iron compound called pyrite
that can be removed through washing of the coal. However, the pyritic sulfur contents of PRB
and Illinois #6 coals is low, with a pyritic sulfur content of approximately 0.05% for PRB coals
and approximately 2.15% for Illinois #6 coals. Assuming coal washing could remove 40% of the
pyritic sulfur content of the coal, less than 1% of the sulfur (and corresponding SO2 emissions) of

Prevention of Significant Deterioration Air Permit Application January 17, 2008 Plant Washington, Power4Georgians, LLC
070007.2201 4-51
the use of Illinois #6 coals would be expected. Therefore, coal washing would be ineffective
because there would be little sulfur content removed by the process. Also, were these coals to be
washed the moisture content of the coal would be increased, and the heating value of the coal
would be degraded. This would lead to an increase in the amount of coal burned, and a potential
subsequent increase in pollutant emissions. Therefore, due to the minimal expected reduction in
SO2 emissions, and potential increase in emissions due to the consumption of more coal, coal
cleaning is not a technically feasible option for the facility for reduction of SO2 emissions.
Lower Emitting Process or Practice – Coal Refining
Coal refining is not yet a demonstrated technology for controlling SO2 emissions for a large scale
coal combustion facility. A company called Evergreen Energy, Inc. is the only vendor currently
found to offer refined PRB coal. The refined fuel product is called K-Fuel, and claims made
regarding the use of the fuel indicate that the use of K-Fuel can lead to lower emissions of SO2,
NOX, and CO than standard PRB coal. However, the company is only operating one facility in
Wyoming which has thus far seen limited production. The company hopes to produce over 50
million tpy of K-fuel in 5 years, through full operation at the existing facility and expansion of
new facilities. However, wide scale production and use, and demonstration of the improved
performance of the K-fuel have yet to be conducted.
Based on the current lack of sufficient supply of coal refining facilities, coal refining is not
considered an available technology for SO2 emissions reduction. Therefore, coal refining is
determined to be technically infeasible for this project.
Wet Scrubber
Wet scrubbers have been demonstrated in wide scale use on coal-fired boilers and are available
from a number of vendors. Wet scrubbers are therefore considered to be technically feasible.
Spray Dryer Absorber (Dry Scrubber)
Dry scrubbers have been demonstrated in wide scale use on coal-fired boilers and are available
from a number of vendors. Dry scrubbers are therefore considered to be technically feasible.

Prevention of Significant Deterioration Air Permit Application January 17, 2008 Plant Washington, Power4Georgians, LLC
070007.2201 4-52
Circulating Dry Scrubber
Circulating Dry Scrubbers have not yet been demonstrated on a coal-fired boiler of greater than
400 MW. The size and scale differences between the proposed utility boiler and the boilers on
which this technology has been demonstrated would likely lead to the requirement for further
design, research, and testing for assessing viability on such a large scale unit. Circulating
fluidized bed systems, as with a circulating fluidized bed boiler, are not in use at the size and
scale of the proposed utility boiler. Therefore, circulating dry scrubber systems are not
considered available for this project and are considered technically infeasible for this analysis.
Activated Carbon Flue Gas Desulfurization
Although some level of SO2 removal would be expected from use of injection of activated carbon
into the flue gas exhaust stream, removal efficiencies when using this technology as a stand alone
control methodology are not as effective as those of other stand alone control devices, such as wet
or dry scrubbers. Research data has shown that concentrations of NOX in the flue gas exhaust
stream, specifically nitrogen monoxide (NO), can lead to inhibition of the catalytic effect of the
porous carbon material, leading to deteriorated desulfurization performance. This deteriorated
desulfurization performance can lead to the requirement for an increasing amount of activated
carbon use, thereby increasing the treatment costs. Activated carbon desulfurization would not be
expected to reach the required SO2 emissions reduction necessary to achieve BACT as a stand
alone technology. Therefore, for the above listed reasons, the use of activated carbon flue gas
desulfurization for removal of SO2 emissions is considered technically infeasible for this project.
DSI and Wet Scrubber
Sorbent injection technology could be used in conjunction with a wet scrubber device. However,
the control efficiency of the wet scrubber would be affected and would likely decrease due to the
lower inlet SO2 concentrations. Also, there is no data available to indicate that there would be a
substantial SO2 emissions reduction benefit from use of duct sorbent injection along with a wet
scrubber. Inclusion of duct sorbent injection with a wet scrubber would lead to increased capital
and annualized operating costs, with no assurance of an improved system performance from use
of a wet scrubber alone. For these reasons, use of duct sorbent injection in conjunction with a wet
scrubber is considered technically infeasible for control of SO2 emissions for this project.

Prevention of Significant Deterioration Air Permit Application January 17, 2008 Plant Washington, Power4Georgians, LLC
070007.2201 4-53
Duct Sorbent Injection (DSI) and Dry Scrubber
Sorbent injection technology could be used in conjunction with a dry scrubber device. However,
as with the wet scrubber, the control efficiency of the dry scrubber would be affected and would
likely decrease due to the lower inlet SO2 concentrations. Also, there is no data available to
indicate that there would be a substantial SO2 emissions reduction benefit from use of duct
sorbent injection along with a dry scrubber. Inclusion of duct sorbent injection with a dry
scrubber would lead to increased capital and annualized operating costs, with no assurance of an
improved system performance from use of a dry scrubber alone. Also, a secondary concern for
use of duct sorbent injection with a dry scrubber is the potential for interference of the duct
sorbent material with the operation of the dry scrubber. A sorbent material present in the flue gas
exhaust stream could potentially interfere with the ability of the spray dryer absorber (dry
scrubber) to evaporate the moisture in the reagent slurry, thus impacting the effectiveness of the
unit. For these reasons, use of duct sorbent injection in conjunction with a dry scrubber is
considered technically infeasible for control of SO2 emissions for this project.
Step 3 – Rank Remaining Technically Feasible Control Options
Control Effectiveness
The feasible control technologies found during Step 2 of this analysis include wet scrubbers, and
spray dryer absorbers (dry scrubbers). Reviews were conducted of technical publications, the
USEPA RBLC, and vendor information to determine the control efficiencies of each of these
identified technically feasible SO2 reduction technologies. Based on data provided in the 2000
USEPA report “Controlling SO2 Emissions: A Review of Technologies” dry scrubbers can have
design efficiencies of 90 percent to 95 percent, while wet scrubbers can have a design efficiency
of 90 percent to greater than 95 percent. According to discussions with equipment vendors,
typical achieved SO2 removal efficiencies for dry scrubbers would be in the 90 percent to 92
percent range, with an expected efficiency of 95 percent or greater for a wet scrubber. In
addition, wet scrubbers have an added collateral control benefit for secondary pollutants due to
more effective capture of secondary acid gases in the flue gas exhaust stream than a dry scrubber,
including reactive mercury, hydrogen chloride, and fluorides.

Prevention of Significant Deterioration Air Permit Application January 17, 2008 Plant Washington, Power4Georgians, LLC
070007.2201 4-54
Energy Impacts
Energy penalties are much more significant for a wet scrubber than for a dry scrubber. With wet
scrubbers, greater energy requirements exist due to greater system pressure drops and larger
energy requirements for ancillary equipment, such as water recycling pumps, and slurry
dewatering pumps. Utilization of a wet scrubber can demand greater than 2% of the gross power
generation of the facility, while dry scrubbers can demand typically around 1% of the gross
power generation of the facility.
Environmental Impacts
Wet scrubbers have an added collateral environmental benefit over dry scrubbers in that they are
more effective in the capture of secondary acid gases in the flue gas exhaust stream than a dry
scrubber, including reactive mercury, hydrogen chloride, and fluorides. Water consumption is an
important environmental impact when evaluating wet scrubbers and dry scrubbers, since wet
scrubbers have a more significant water usage than dry scrubbers. However, dry scrubbers are
not truly “dry”, as water is used in preparation of the reagent slurry which is atomized and
injected into the exhaust gas stream.
Another significant environmental impact involves the generation of solid waste and wastewaters
from wet scrubbers and dry scrubbers. Wastewater from a wet scrubber would require more
specialized handling and treatment than a dry scrubber, since dry scrubber systems do not
produce blowdown or a wastewater stream. Wet scrubbers can produce a solid waste stream
(gypsum) which can be marketable depending on the quality of the gypsum produced, and the
status of the current market. Dry scrubbers produce a solid waste stream with little to no
commercial value that is traditionally disposed of in a solid waste facility.
Economic Impacts
Coal selection was determined to be technically feasible for this project. The process proposed
for Plant Washington is a unique process utilizing a 50/50 blend of both PRB and Illinois #6
coals. Current cost estimates for PRB coals, including transportation, are $50.83/ton. Current
cost estimates for Illinois #6 coals are $51.31 per ton. However, while Illinois #6 coal is slightly

Prevention of Significant Deterioration Air Permit Application January 17, 2008 Plant Washington, Power4Georgians, LLC
070007.2201 4-55
more expensive than PRB coal, what must be considered is the Higher Heating Value (HHV), or
Btu/lb content of PRB and the proposed 50/50 blend.
The typical HHV for PRB coals is 8456 Btu/lb, while the typical HHV for the 50/50 blend of
PRB and Illinois #6 is 9628 Btu/lb. Since the HHV for PRB coals is lower, more PRB coals
would have to be consumed than coals consumed for the 50/50 blend. The coal usage rate for
burning just PRB coal would be approximately 491 ton/hr, while the coal usage rate for the 50/50
blend is approximately 431 ton/hr at the facility.
Based on the current PRB and Illinois #6 cost rate, the annualized fuel cost for burning just PRB
would be approximately $219 million, but burning the proposed 50/50 blend leads to annualized
costs of approximately $192 million. Therefore, there would be an incremental cost of usage of
PRB only at the facility of approximately $27 million.
Using the sulfur content of a typical PRB coal of 0.32%, and applying a control efficiency of
97.5%, gives an annualized emission of 691 ton/yr of SO2. Using the typical sulfur content of the
50/50 blend of 1.72%, and applying a control efficiency of 97.5%, gives an annualized emission
of 3,272 ton/yr of SO2 emissions. This is an incremental SO2 emissions increase of
approximately 2,581 ton/yr.
Applying the incremental cost of $27 million to the incremental potential reduction in emissions
of SO2 of 2,581 ton/yr gives a cost effectiveness of approximately $10,460/ton. Therefore,
switching to burning just the low sulfur coal (PRB) is not cost effective and determined to be
infeasible
Based on data provided by the USEPA in air emissions control cost guidance, and the USEPA’s
Coal Utility Environmental Cost Model (CUECost), the cost effectiveness of a wet flue gas
desulfurization system (wet scrubber) would be approximately $840/ton of SO2 removed.
Step 4 – Evaluate Remaining Control Technologies
Wet scrubbing, or wet flue gas desulfurization, is evaluated as the top control option since wet
scrubbers are demonstrated as more efficient in the removal of SO2 emissions.

Prevention of Significant Deterioration Air Permit Application January 17, 2008 Plant Washington, Power4Georgians, LLC
070007.2201 4-56
Energy Impacts
As discussed above, while wet scrubber systems at the facility would use approximately 2 percent
of the gross power generation of the facility, dry scrubbing systems would use almost 1 percent of
the gross power generation of the facility. This approximately 1 percent difference in gross
power demand does not preclude the use of a wet scrubber system at the facility.
Environmental Impacts
Wet scrubbers have an added collateral environmental benefit over dry scrubbers in that they are
more effective in the capture of secondary acid gases in the flue gas exhaust stream than a dry
scrubber, including reactive mercury, hydrogen chloride, and fluorides. Water consumption for a
wet scrubber system would be higher than the water consumption for a dry scrubber, due to the
inherent design difference present between a wet scrubber and a dry scrubber. However, the
additional water consumption necessary for operation of a wet scrubber does not preclude the use
of a wet scrubber at the facility. The waste stream present from a wet scrubber (gypsum) is a
potentially saleable product. Waste streams generated by a wet scrubber are inherently more
saleable or recyclable than those waste streams generated by a dry scrubber.
Economic Impacts
Economic impacts would not preclude use of a wet scrubber control device for control of SO2
emissions.
Step 5 – Selection of BACT
A summary of recent SO2 BACT evaluations conducted for similar projects can be found in Table 4-7.
From these listings it is apparent that utilization of a wet scrubber (wet flue gas desulfurization) can
achieve the maximum amount of SO2 emissions reduction available, and is both technically feasible and
demonstrated in Pulverized Coal (PC) fired boilers. The selection of the BACT emission limits for this
project is based on an assumption of 97.5 percent control of the uncontrolled SO2 emissions. A review of
comparable wet scrubbing applications from data available from USEPA’s Clean Air Markets website of
CEMs data for coal-fired boilers indicates that 97.5 percent reduction is the highest removal efficiency
that can be expected on a consistent basis. Uncontrolled SO2 emissions are based on the design sulfur
content and Higher Heating Value (HHV – Btu/lb) of the typical average (correlated to SO2 annual

Prevention of Significant Deterioration Air Permit Application January 17, 2008 Plant Washington, Power4Georgians, LLC
070007.2201 4-57
average) and worst case (correlated to SO2 3-hr. average) 50/50 blend of PRB coal and Illinois #6 coal.
Therefore, BACT for SO2 emissions is proposed as use of a wet scrubber with an emission limit of 0.09
lb/MMBtu on an annual average basis and 996 lb/hr on a 3-hr average basis. The annual (12-month
rolling) average will be computed using consecutive 30 day rolling monthly averages. This level of
control and emission limit has been proposed as BACT on similar recent projects. The lowest annual
average SO2 BACT emission limit demonstrated in practice is 0.0976 lb/MMBtu by the Deseret
Generation and Transmission facility. Facilities with lower proposed emission limits, such as the Hugo
Generation Station, have not yet been constructed or demonstrated in practice.

Prevention of Significant Deterioration Air Permit Application January 17, 2008 Plant Washington, Power4Georgians, LLC
070007.2201 4-58
Table 4-7 RBLC Listings for SO2 Emissions from Pulverized Coal Fired Boilers
Facility NameFacility
State Permit NumberPermit Date PROCESS NAME
Thruput (MW) Control Description Avg Period
INTERMOUNTAIN POWER STATION UNIT 3 UTDAQE-
AN0327010-04 10/15/04 PC BOILER 900 WET LIMESTONE SCRUBBER 0.01 lb/MMBtu unknownELY ENERGY STATION NV 2007 SUPERCRITICAL BOILER 2-750 WET LIMESTONE SCRUBBER 0.06 lb/MMBtu 24-hour avgTOQUOP NV ap4911-1146 SCPC BOILER 750 WET LIMESTONE SCRUBBER 0.06 lb/MMBtu 24-hour avg
HUGO GENERATING STATION OK97-058-C M-2
PSD 2/9/2007COAL-FIRED STEAM EGU BOILER (HU-UNIT 2) 750
WET LIMESTONE FLUE GAS DESULFURIZATION 0.065 lb/MMBtu 30-day rolling average
LONGLEAF GA4911-099-0030-P-
01-0 5/14/07 BOILER #1 600 DRY SCRUBBER 0.065 lb/MMBtu 30-day rolling average
LONGLEAF GA4911-099-0030-P-
01-0 5/14/07 BOILER #2 600 DRY SCRUBBER 0.12 lb/MMBtu 24-hr average
KANSAS CITY POWER & LIGHT COMPANY - IATAN STATION MO 012006-019 1/27/2006PULVERIZED COAL BOILER - UNIT 2 850
KCPL SHALL INSTALL SCR UNIT FOR THE UNIT 2 BOILER TO REDUCE NOX EMISSIONS AND ALSO SHALL INSTALL WET SCRUBBER TO REDUCE SOX EMISSIONS. BOTH CONTROLS ARE NOT BACT FOR NOX AND SOX 0.09 lb/MMBtu 30-day rolling average
TS POWER PLANT NV AP4911-1349 5/5/2005 200 MW PC COAL BOILER 595 LIME SPRAY SPRAY DRY SCRUBBER 0.09 lb/MMBtu 24-hour rollingWYGEN 3 WY CT-4517 2/5/2007 PC BOILER 381 DRY FGD 0.09 lb/MMBtu 12 month rolling
CITY UTILITIES OF SPRINGFIELD - SOUTHWEST POWER STATION MO 122004-007 12/15/2004PULVERIZED COAL FIRED BOILER 798
DRY FLUE GAS DESULFURIZATION > 90% 0.095 lb/MMBtu 30-day rolling average
OPPD - NEBRASKA CITY STATION NE 58343C01 3/9/2005 UNIT 2 BOILERDRY FLUE GAS DESULFURIZATION & FABRIC FILTER 0.095 lb/MMBtu 30-day rolling average
DESERET GENERATION AND TRANSMISSION COMPANY UT DAQE-186-98 3/16/1998 COAL FIRED BOILER 500 WET SCRUBBER 0.0976 lb/MMBtu 12-month average
BIG CAJUN II POWER PLANT LA PSD-LA-677 8/22/2005
NEW 675 MW PULVERIZED COAL BOILER (UNIT 4) 675
OPTION 1: SEMI-DRY LIME SCRUBBER OPTION 2: WET FLUE GAS DESULFURIZATION SYSTEM 0.100 lb/MMBtu Annual average
JK SPRUCE ELECTRIC GENERATING STATION TXPSD-TX 1037 &
70492 12/28/05 UNIT 2 BOILER 750 WET LIMESTONE SCRUBBER 0.1 lb/MMBtu Annual average
KANSAS CITY POWER & LIGHT COMPANY - IATAN STATION MO 012006-019 1/27/2006PULVERIZED COAL BOILER - UNIT 1 850 0.100 lb/MMBtu 30-day rolling average
MIDAMERICAN ENERGY COMPANY IAPROJECT 02-
528 6/17/2003 CBEC 4 BOILER7675
mmbtuLIME SPRAY DRYER FLUE GAS DESULFURIZATION 0.100 lb/MMBtu 30-day rolling average
WPS - WESTON PLANT WI 04-RV-248 10/19/2004
SUPER CRITICAL PULVERIZED COAL ELECTRIC STEAM BOILER (S04, P04) 500
DRY FGD, LIMIT ON EMISSIONS ENTERING CONTROL SYSTEM: 1.23 LBS/MMBTU 30 DAY AVG. 0.100 lb/MMBtu 30-day rolling average
WYGEN 2 WY CT-3030 9/25/2002 BOILER, 500 MW PC 90SEMI-DRY LIME SPRAY DRYER ABSORBER 0.100 lb/MMBtu 30-day rolling average
LAMAR LIGHT & POWER POWER PLANT CO 05PR0027 2/3/2006CIRCULATING FLUIDIZED BED BOILER 147
LIMESTONE INJECTION FOR S02 CONTROL . SAND IS USED AS INERT MATERIAL FOR REGULATION OF CIRCULATING BED TEMPERATURE 0.103 lb/MMBtu daily average
AGP SOY PROCESSING NE CP05-0050 9/11/2006 STEAM GENERATION 112 LIMESTONE INJECTION 0.11 lb/MMBtu
Emission Limit

Prevention of Significant Deterioration Air Permit Application January 17, 2008 Plant Washington, Power4Georgians, LLC
070007.2201 4-59
Table 4-7 RBLC Listings for SO2 Emissions from Pulverized Coal Fired Boilers (Continued)
Facility NameFacility
State Permit NumberPermit Date PROCESS NAME
Thruput (MW) Control Description Avg Period
BULL MOUNTAIN, NO. 1, LLC - ROUNDUP POWER PROJECT MT 3182-00 7/21/2003 BOILER, PC NO. 1 390DRY FLUE GAS DESULFURIZATION (FGD) 0.12 lb/MMBtu 24-hour average
BULL MOUNTAIN, NO. 1, LLC - ROUNDUP POWER PROJECT MT 3182-00 7/21/2003 BOILER, PC NO. 2 390DRY FLUE GAS DESULFURIZATION (FGD) 0.12 lb/MMBtu 24-hour average
HOLCOMB UNIT #2 KS 0550087/C-3855 10/8/2002BOILER, PULVERIZED COAL 660 DRY FLUE GAS DESULFURIZATION 0.12 lb/MMBtu
KANSAS CITY POWER & LIGHT CO. - HAWTHORN STATION MO 888 8/17/1999ELECTRIC GENERATION, BOILER, COAL 565
DRY FLUE GAS DESULFURIZATION & LOW SULFUR COAL. EMISSION LIMIT BASIS - 30-DAY AVG. 0.12 lb/MMBtu unknown
MAIDSVILLE WV R14-0024 3/2/2004 BOILER, PC 695 WET LIMESTONE FORCED OXIDATION 0.12 lb/MMBtu 30-day rolling average
SCHILLER STATION NH TP-B-0501 10/25/2004BOILER, COAL FIRED, UNIT #5 186 LIME INJECTION, FUEL SULFUR LIMITS 0.12 lb/MMBtu 24-hour average
WHELAN ENERGY CENTER NE 58048 3/30/2004 BOILER, UNIT 2 UTILITY 648 SPRAY DRYER ABSORBER (SDA) 0.12 lb/MMBtu 30-day rolling averageSANTEE COOPER CROSS SC 0420-0030-CI 2/5/04 BOILER #3 600 WET LIMESTONE SCRUBBER 0.13 lb/MMBtu Annual averageSANTEE COOPER CROSS SC 0420-0030-CI 2/5/04 BOILER #4 600 WET LIMESTONE SCRUBBER 0.13 lb/MMBtu Annual average
AES BEAVER VALLEY, LLC PA PA-04-446C 11/21/2001 COAL FIRED BOILER 631HYDRATED ASH RE-INJECTION SYSTEM 0.14 lb/MMBtu 12-month rolling average
HARDIN GENERATOR PROJECT MT 3185-00 6/11/2002BOILER, PULVERIZED COAL-FIRED 382 WET VENTURI SCRUBBER 0.14 lb/MMBtu 30-day rolling average
WV R14-0024 3/2/2004 BOILER, PC 695 WET LIMESTONE FORCED OXIDATION 0.15 lb/MMBtu 24-hour averagePLUM POINT ENERGY AR 1995-AOP-R0 8/20/2003 BOILER , UNIT 1 - SN-01 800 DRY FLUE GAS DESULFURIZATION 0.16 lb/MMBtu 3-hour rolling averagePLUM POINT ENERGY AR 1995-AOP-R0 8/20/2003 BOILER - SN-01 800 DRY FLUE GAS DESULFURIZATION 0.16 lb/MMBtu 3-hour rolling average
VIRGINIA TECH VA 20124 9/15/2005 OPERATION OF BOILER 11 43
DRY SCRUBBER FLUE GAS DESULFURIZATION SYSTEM AND CEMS 0.16 lb/MMBtu 30-day rolling average
THOROUGHBRED GENERATING STATION KY V-02-001 10/11/2002 BOILER, COAL, (2) 2-750
WET FLUE GAS DESULFURIZATION (FGD), WESP, AND PROPER BOILER DESIGN 0.167 lb/MMBtu 30-day rolling average
ENCOAL CORPORATION-ENCOAL NORTH ROCHELLE FACILITY WY CT-1324 10/10/1997BOILER, COAL FIRED, MAIN STACK 240 LIME SPRAY DRYER 0.200 lb/MMBtu 2-hour fixed
JEA NORTHSIDE GENERATING STATION FL PSD-FL-265 7/14/1999 BOILER, COAL 810
PROPOSED CONTROLS: CIRC. FLUIDIZED BED SCRUBBER/ELECTROSTATIC PREC. OR SPRAY DRYER ABSORBER/FABRIC FILTER OR CIRC. FLUIDIZED BED SCRUBBER/FABRIC FILTER. 0.200 lb/MMBtu 24-hour average
TWO ELK GENERATION PARTNERS, LIMITED PARTNERSHIP WY CT-1352 2/27/1998
BOILER, STEAM ELECTRIC POWER GENERATING 250 LIME SPRAY DRY SCRUBBER 0.200 lb/MMBtu 2-hour fixed
SANDY CREEK ENERGY STATION TXPSD-TX 1039 AND 70861 7/24/2006
PULVERIZED COAL BOILER 800 0.30 lb/MMBtu 1-hour average
EDISON MISSION ENERGY PA 32-0055C 5/25/1999
BOILER, COAL, PULVERIZED BITUMINOUS, UNIT 3
6600 mmbtu WET LIMESTONE SCRUBBER 0.40 lb/MMBtu
Emission Limit

Prevention of Significant Deterioration Air Permit Application January 17, 2008 Plant Washington, Power4Georgians, LLC
070007.2201 4-60
Table 4-7 RBLC Listings for SO2 Emissions from Pulverized Coal Fired Boilers (Continued)
Facility NameFacility
State Permit NumberPermit Date PROCESS NAME
Thruput (MW) Control Description Avg Period
THERMAL VENTURES VA 30529 2/15/2002 BOILER, STEAM 35
GOOD COMBUSTION PRACTICES, CLEAN BURNING FUEL, AND CONTINUOUS EMISSION MONITORING DEVICE. 0.47 lb/MMBtu unknown
SANTEE COOPER CROSS SC 0420-0030-CI 2/5/04 BOILER #3 600 WET LIMESTONE SCRUBBER 0.6 lb/MMBtu 30-day rolling averageSANTEE COOPER CROSS SC 0420-0030-CI 2/5/04 BOILER #4 600 WET LIMESTONE SCRUBBER 0.6 lb/MMBtu 30-day rolling average
WA PARISH ELECTRIC GENERATING STATION TX
PSD-TX-901, PSD-TX-902 & -
33M1 10/15/2003(2) BOILERS, UNITS 5 & 6, WAP5&6, COAL
7400 mmbtu FUEL S CONTENT LIMITED 1.06 lb/MMBtu unknown
WASHINGTON PARISH ELECTRIC GENERATING STATION TX PSD-TX-33 M1 10/15/2002(2) BOILER STACKS, WAP 5 & 6 , COAL & NAT GAS
7400 mmbtu BURN LOW-S SUBBITUMINOUS COAL 1.07 lb/MMBtu unknown
MANSFIELD MILL LAPSD-LA-93 (M-
6) 8/14/2001POWER BOILER #1 & #2, COAL 189
SULFUR IN COAL NOT TO EXCEED 1.2% BY WEIGHT 1.20 lb/MMBtu unknown
WA PARISH ELECTRIC GENERATING STATION TX
PSD-TX-901, PSD-TX-902 & -
33M1 10/15/2003BOILER UNIT 7, COAL, WAP7
6700 mmbtu LIMITED FUEL S CONTENT 1.20 lb/MMBtu unknown
WA PARISH ELECTRIC GENERATING STATION TX
PSD-TX-901, PSD-TX-902 & -
33M1 10/15/2003BOILER UNIT 7, COAL & GAS, WAP7
6700 mmbtu FUEL S CONTENT LIMITED 1.20 lb/MMBtu unknown
WA PARISH ELECTRIC GENERATING STATION TX
PSD-TX-901, PSD-TX-902 & -
33M1 10/15/2003(2) BOILERS, UNITS 5 & 6, COAL & GAS, WAP5&6
7400 mmbtu FUEL S CONTENT LIMITED 1.20 lb/MMBtu unknown
WASHINGTON PARISH ELECTRIC GENERATING STATION TX PSD-TX-33 M1 10/15/2002BOILER STACK, WAP 7, COAL ONLY
6700 mmbtu BURN LOW-S SUBBITUMINOUS COAL 1.20 lb/MMBtu unknown
WASHINGTON PARISH ELECTRIC GENERATING STATION TX PSD-TX-33 M1 10/15/2002BOILER STACK, WAP 7, COAL & NAT GAS
6700 mmbtu BURN LOW-S SUBBITUMINOUS COAL 1.20 lb/MMBtu unknown
WASHINGTON PARISH ELECTRIC GENERATING STATION TX PSD-TX-33 M1 10/15/2002(2) BOILER STACKS, WAP 5 & 6 , COAL ONLY
7400 mmbtu NONE INDICATED 1.20 lb/MMBtu unknown
Emission Limit
Prepared by: PMH 1/10/08 Checked by: JDF 1/10/08

Prevention of Significant Deterioration Air Permit Application January 17, 2008 Plant Washington, Power4Georgians, LLC
070007.2201 4-61
4.3.6 BACT Demonstration for Pb Emissions from the Supercritical Pulverized Coal Boiler
Emissions of Pb are generated from fossil fuel combustion sources from trace amounts of Pb present in
the fuel ash. During the combustion process, lead can be vaporized and later condensed or adsorbed by
the fly ash suspended in the flue gas. As such, Pb is emitted as PM from a PC fired boiler. Therefore,
technologies available for the control of Pb emissions are the same technologies available for the control
of PM emissions.
Step 1 – Identify All Control Technologies
Lower Emitting Process or Practice – Coal Cleaning
Coal cleaning, also called coal beneficiation, or coal washing, is a cleaning process in which
mineral ash matter is removed from mined coal to produce a “cleaner” coal. Coal cleaning is
generally performed in order to remove impurities in the coal to improve the heat content of the
coal, thereby improving power plant capacity, reduce maintenance costs at power plants and
extend plant life. Coal cleaning is also performed to reduce potential air pollutants, including
reduction of PM emissions through reduction of the ash content of the coal. Lead present in the
coal could also potentially be removed by coal cleaning.
Fabric Filter Baghouse
Fabric filters are used for PM control in a wide variety of industries, including use as PM control
on PC fired boilers, and are capable of achieving control efficiencies of 99 percent or greater.
According to the USEPA’s fabric filter fact sheet (2003) “flue gas is passed through a tightly
woven or felted fabric, causing PM in the flue gas to be collected on the fabric by sieving and
other mechanisms. Fabric filters may be in the form of sheets, cartridges, or bags, with a number
of the individual fabric filter units housed together in a group. Bags are the most common type of
fabric filter. The dust cake that forms on the filter from the collected PM can significantly
increase collection efficiency. Fabric filters are frequently referred to as baghouses because the
fabric is usually configured in cylindrical bags. Bags may be 6 to 9 m (20 to 30 ft) long and 12.7
to 30.5 centimeters (cm) (5 to 12 inches) in diameter. Groups of bags are placed in isolable
compartments to allow cleaning of the bags or replacement of some of the bags without shutting
down the entire fabric filter.”

Prevention of Significant Deterioration Air Permit Application January 17, 2008 Plant Washington, Power4Georgians, LLC
070007.2201 4-62
Advantages of fabric filters can include the following:
1. Can provide high collection efficiencies on both coarse and fine (submicron) particulates.
2. Fabric filters are available in a large number of configurations and system designs, allowing
for high flexibility in design.
3. Collected material is collected dry for subsequent processing or disposal.
Some disadvantages of fabric filters include:
1. Fabric filters can have relatively high maintenance requirements (filter bag replacement).
2. Concentrations of dusts in the collector can represent a fire or explosion hazard if a spark or
flame is somehow introduced.
3. The units cannot be operated in high moisture gas streams; moisture can cause caking or
plugging of the fabric filter.
Dry Electrostatic Precipitator (ESP)
Dry ESPs are used in a wide variety of source categories for control of PM emissions, and are
capable of achieving control efficiencies of 99% or greater. The following is an excerpt from the
USEPA’s dry ESP fact sheet (2003);
“An ESP is a particulate control device that uses electrical forces to move particles entrained
within an exhaust stream onto collector plates. The entrained particles are given an electrical
charge when they pass through a corona, a region where gaseous ions flow. Electrodes in the
center of the flow lane are maintained at high voltage and generate the electrical field that forces
the particles to the collector walls. In dry ESPs, the collectors are knocked, or “rapped”, by
various mechanical means to dislodge the particulate, which slides downward into a hopper
where they are collected. The hopper is evacuated periodically, as it becomes full. Dust is
removed through a valve into a dust handling system, such as a pneumatic conveyor, and is then
disposed of in an appropriate manner.”

Prevention of Significant Deterioration Air Permit Application January 17, 2008 Plant Washington, Power4Georgians, LLC
070007.2201 4-63
Advantages of dry ESPs include the following:
1. Are capable of very high efficiencies, even for small particulate sizes.
2. Can be designed for a wide range of gas temperatures, and can handle high temperatures (up
to 1300oF).
3. Relatively large gas flow rates can be effectively handled.
Some disadvantages of dry ESPs include the following:
1. High capital costs and high maintenance items, such as the wire discharge electrodes.
2. Generally not suited for processes that are highly variable because they are sensitive to
fluctuations in gas stream conditions (temperature, flow rate, particulate loading, etc.).
3. Fly ash from the combustion of low sulfur coal typically has a high resistivity, and thus is
difficult to collect.
Wet Electrostatic Precipitator (WESP)
A WESP is commonly used in situations where a dry ESP is not viable, such as when the material
to be collected is wet, flammable, or has a high resistivity. WESPs are commonly used by the
wood products and metallurgical industries, and can achieve PM control efficiencies of greater
than 99 percent. The following is an excerpt from the USEPA’s WESP fact sheet (2003).
“An ESP is a particulate control device that uses electrical forces to move particles entrained
within an exhaust stream onto collector plates. The entrained particles are given an electrical
charge when they pass through a corona, a region where gaseous ions flow. Electrodes in the
center of the flow lane are maintained at high voltage and generate the electrical field that forces
the particles to the collector walls. In wet ESPs, the collectors are either intermittently or
continuously washed by a spray of liquid, usually water. The collection hoppers used by dry
ESPs are replaced with a drainage system. The wet effluent is collected, and often treated on-
site.”

Prevention of Significant Deterioration Air Permit Application January 17, 2008 Plant Washington, Power4Georgians, LLC
070007.2201 4-64
Advantages of WESPs include the following:
1. Are capable of very high efficiencies, even for low particulate sizes.
2. Relatively large gas flow rates can be effectively handled.
3. WESPs can collect stick particles, mists, and highly resistive or explosive dusts due to the
humid atmosphere from washing in the ESP.
4. Continuous or intermittent washing with a liquid eliminates the reentrainment of particles,
which dry ESPs are subject to through the rapping process.
Some disadvantages of WESPs include the following:
1. High capital costs and high maintenance items, such as the wire discharge electrodes.
2. Generally not suited for processes that are highly variable because they are sensitive to
fluctuations in gas stream conditions (temperature, flow rate, particulate loading, etc.).
3. Wet ESPs add the complexity of a wash system, and the fact that the resulting slurry must be
handled more carefully than a dry product, and can require treatment.
4. Wet ESPs are typically operated at gas stream temperatures under 190oF, and usually must be
constructed of noncorrosive materials.
Wet Scrubber
Wet scrubbers have been applied to control PM emissions from utility, industrial, commercial,
and institutional boilers fired with coal, oil, wood, and liquid waste. In wet scrubbers, the gas
stream is contacted by liquid droplets generated by spray nozzles. Physical adsorption depends
on the properties of the gas stream and liquid solvent, such as density and viscosity, as well as
specific characteristics of the pollutant in the gas and the liquid stream.

Prevention of Significant Deterioration Air Permit Application January 17, 2008 Plant Washington, Power4Georgians, LLC
070007.2201 4-65
Advantages of wet scrubbers include:
1. Provide cooling for hot gases in the exhaust stream.
2. Corrosive gases and dusts can be neutralized.
3. Can handle flammable and explosive dusts with minimal risk.
Disadvantages of wet scrubbers include:
1. The effluent liquid creates a waste sludge, and disposal/handling of this sludge can be costly.
2. Liquid wastes generated from the process can require treatment.
3. Potential for corrosive problems exists.
Step 2 – Eliminate Technically Infeasible Options
Lower Emitting Process or Practice – Coal Cleaning
Coal cleaning is considered effective for coals with a significant overburden. However, PRB
coals are typically mined from thick coal seams with little overburden, and PRB coal mining
techniques produce a coal product with little rock and non-combustible material. Also, PRB
coals typically contain low ash levels. For these reasons, coal cleaning is typically not conducted
for PRB coals. Illinois #6 coals do contain a higher ash content than PRB coals. However, were
these coals to be washed the moisture content of the coal would be increased, and the heating
value of the coal would be degraded. This would lead to an increase in the amount of coal
burned, and a potential subsequent increase in secondary pollutant emissions (such as SO2). The
Pb content of PRB and Illinois #6 coals is expected to be small (8 ppm). Therefore, due to the
minimal expected reduction in Pb emissions, and detrimental impacts to emissions of other
pollutants, coal cleaning is not a technically feasible option for the facility for reduction of Pb
emissions.
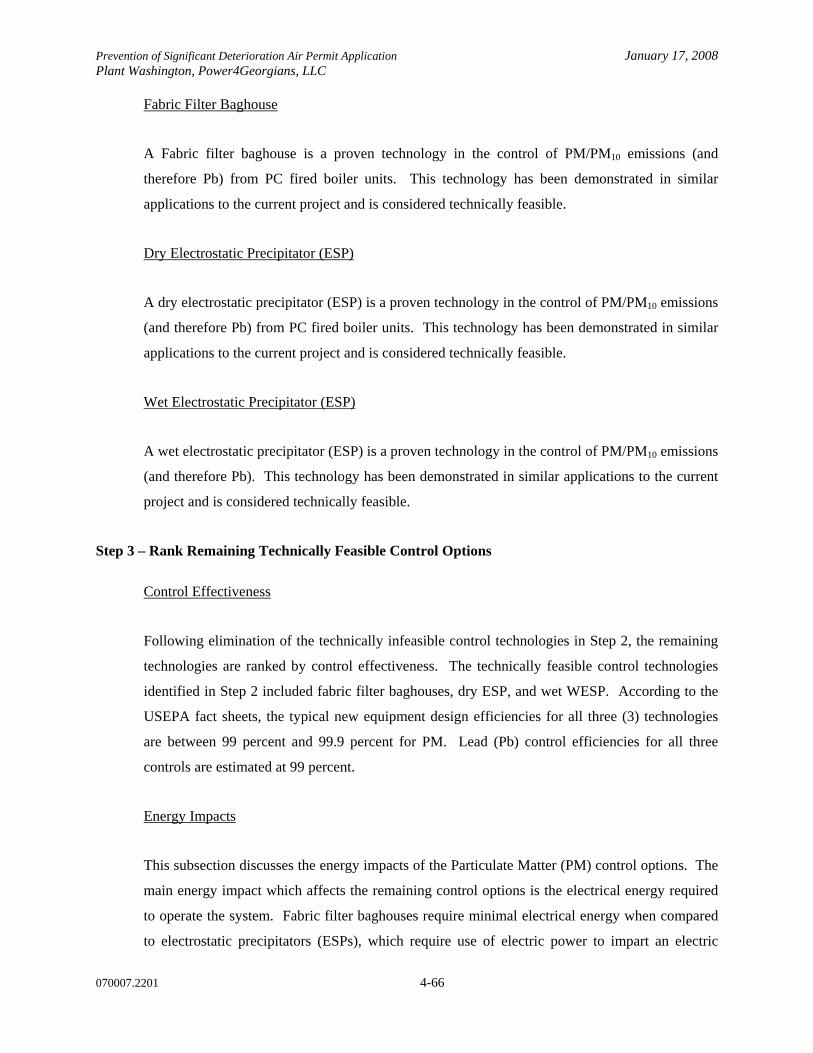
Prevention of Significant Deterioration Air Permit Application January 17, 2008 Plant Washington, Power4Georgians, LLC
070007.2201 4-66
Fabric Filter Baghouse
A Fabric filter baghouse is a proven technology in the control of PM/PM10 emissions (and
therefore Pb) from PC fired boiler units. This technology has been demonstrated in similar
applications to the current project and is considered technically feasible.
Dry Electrostatic Precipitator (ESP)
A dry electrostatic precipitator (ESP) is a proven technology in the control of PM/PM10 emissions
(and therefore Pb) from PC fired boiler units. This technology has been demonstrated in similar
applications to the current project and is considered technically feasible.
Wet Electrostatic Precipitator (ESP)
A wet electrostatic precipitator (ESP) is a proven technology in the control of PM/PM10 emissions
(and therefore Pb). This technology has been demonstrated in similar applications to the current
project and is considered technically feasible.
Step 3 – Rank Remaining Technically Feasible Control Options
Control Effectiveness
Following elimination of the technically infeasible control technologies in Step 2, the remaining
technologies are ranked by control effectiveness. The technically feasible control technologies
identified in Step 2 included fabric filter baghouses, dry ESP, and wet WESP. According to the
USEPA fact sheets, the typical new equipment design efficiencies for all three (3) technologies
are between 99 percent and 99.9 percent for PM. Lead (Pb) control efficiencies for all three
controls are estimated at 99 percent.
Energy Impacts
This subsection discusses the energy impacts of the Particulate Matter (PM) control options. The
main energy impact which affects the remaining control options is the electrical energy required
to operate the system. Fabric filter baghouses require minimal electrical energy when compared
to electrostatic precipitators (ESPs), which require use of electric power to impart an electric

Prevention of Significant Deterioration Air Permit Application January 17, 2008 Plant Washington, Power4Georgians, LLC
070007.2201 4-67
charge to capture the PM. Based on data in an USEPA Air Pollution Training Institute
publication on Electrostatic Precipitator Operation, the power required to operate either a dry or
wet electrostatic precipitator can be around 1000 watts per 1000 acfm, with limited collection
efficiency degradation at 705 watts per 1000 acfm. For the estimated air flow currently available
for the site, this could lead to ESP power requirements from 2 to 3 MW. A secondary energy
impact is the energy impact associated with the pressure drop of the systems. An increase in
pressure drop increases the power required to operate the system. Fabric filters can experience
higher pressure drops than those associated with ESPs.
Environmental Impacts
Fabric filter baghouses and dry electrostatic precipitators both collect dry collected waste
materials that would have to be disposed of in accordance with applicable State and Federal
Regulations. With a fabric filter baghouse, an additional waste source would be the disposal over
times of worn out filter bags. With a wet electrostatic precipitator, both the collected and dried
waste products would have to be disposed of in accordance with State and Federal Regulations,
and wastewaters generated from the process would have to be treated and handled in accordance
with applicable regulations.
Economic Impacts
An obvious economic impact is the loss of saleable power through the high internal power
requirements of use of an electrostatic precipitator. As stated above, potential power
requirements for ESP units at the site could exceed 3 MW. Using a rough estimation of an
average power demand of 1000 watts per home, the power required for operation of facility ESP
units would be roughly equivalent to the amount of power needed to supply electricity to 3,000
homes. However, potential power requirements associated with a fabric filter baghouse can also
be significant due to high pressure drops across system bag filters. The costing estimates for PM
controls are discussed in Section 4.3.1 above.
Step 4 – Evaluate Remaining Control Technologies
Fabric filter baghouses and ESPs both provide the maximum degree of emissions reduction of
PM emissions from coal-fired units, and are presumed to provide equally effective control for
lead (Pb) emissions. Both controls are cost effective and do not have any significant collateral

Prevention of Significant Deterioration Air Permit Application January 17, 2008 Plant Washington, Power4Georgians, LLC
070007.2201 4-68
environmental impacts. Wet Electrostatic Precipitators have a slight disadvantage when
compared to fabric filter baghouses and dry ESPs, in that they produce a wet waste product,
which can lead to additional treatment and disposal costs than with dry systems. While both a
fabric filter baghouse and an ESP can achieve the maximum amount of lead emissions reduction
available, fabric filter baghouses have additional benefits when sorbent injection is used, and may
be more effective in the combined control of additional metallic (i.e. Hg) emissions. For these
reasons, a fabric filter baghouse is chosen as the most effective and top control.
Energy Impacts
Although a fabric filter baghouse would require additional auxiliary power to overcome the
pressure drop across the fabric filter bags, such energy requirements would not be enough to
preclude use of a fabric filter baghouse.
Environmental Impacts
There are no major environmental issues that would preclude the use of a baghouse. Waste
materials collected by the fabric filter baghouses will be disposed of in accordance with State and
Federal regulations.
Economic Impacts
Economic impacts are not a concern for a fabric filter baghouse as discussed in Step 3.
Step 5 – Selection of BACT
A summary of recent lead (Pb) BACT evaluations conducted for similar projects can be found in Table 4-
8 below. BACT for lead (Pb) emissions is proposed as a fabric filter baghouse with an emission limit of
1.69 x 10⁻⁵ lb/MMBtu on a 3-hr average basis. This emission limit was recently demonstrated in practice
by the Santee Cooper Cross Generating Station, Unit 3, in South Carolina and is the most stringent BACT
emissions limit for lead achieved in practice. This level of control and emission limit has been proposed
as BACT on recent similar projects.

Prevention of Significant Deterioration Air Permit Application January 17, 2008 Plant Washington, Power4Georgians, LLC
070007.2201 4-69
Table 4-8 RBLC Listings for Pb Emissions from Pulverized Coal-Fired Boilers
Facility NameFacility
State Permit NumberPermit Date Process Name Fuel
Thruput (MW) Control Description
Emission Limit
Emission Limit Unit
SANTEE COOPER CROSS GENERATING STATION SC 0420-0030-CI 2/5/2004 BOILER, NO. 3 AND NO. 4BITUMINOUS COAL 660 ESP 1.69E-05 lb/MMBtu
MAIDSVILLE WV R14-0024 3/2/2004 BOILER, PCPULVERIZED COAL 600
DRY SOLID INJECTION W/ FABRIC FILTER AND WET SCRUBBER 1.78E-05 lb/MMBtu
LONGLEAF ENERGY ASSOCIATES, LLC GA4911-099-0030-P-01-0 5/14/2007 (2) 600 MW UNITS COAL 600 FABRIC FILTER BAGHOUSE 1.80E-05 lb/MMbtu
WPS - WESTON PLANT WI 04-RV-248 10/19/2004
SUPER CRITICAL PULVERIZED COAL ELECTRIC STEAM BOILER (S04, P04) PRB COAL 50 FABRIC FILTER BAGHOUSE 2.51E-05 lb/MMBtu
PLUM POINT ENERGY AR 1995-AOP-R0 8/20/2003 BOILER , UNIT 1 - SN-01SUB-BITUMINOUS COAL 800 FABRIC FILTER 2.56E-05 lb/MMBtu
PLUM POINT ENERGY AR 1995-AOP-R0 8/20/2003 BOILER - SN-01SUB-BITUMINOUS COAL 800 FABRIC FILTER 2.56E-05 lb/MMBtu
ELY ENERGY CENTER NV AP4911-2241 DRAFT (2) 750 MW PC BOILERS COAL 750 FABRIC FILTER BAGHOUSE 2.59E-05 lb/MMbtu
CITY UTILITIES OF SPRINGFIELD - SOUTHWEST POWER STATION MO 122004-007 12/15/2004PULVERIZED COAL FIRED BOILER COAL 798 NONE INDICATED 2.60E-05 lb/MMBtu
MIDAMERICAN ENERGY COMPANY IA PROJECT 02-528 6/17/2003 CBEC 4 BOILER PRB COAL7675
MMBtu/hr BAGHOUSE 2.60E-05 lb/MMBtu
LIMESTONE ELECTRIC GENERATING STATION TX PSD-TX-371 (M3) 5/23/2001(2) BOILER UNIT 1 & 2 SCRUBBER STACKS, LMS1 & 2 LIGNITE 2304 NONE INDICATED 3.31E-05 lb/MMBtu
TOQUOP ENERGY, LLC NV AP4911-1146 DRAFT 750 MW PC BOILER COAL 750 FABRIC FILTER BAGHOUSE 4.00E-05 lb/MMbtu
WA PARISH ELECTRIC GENERATING STATION TXPSD-TX-901, PSD-TX-902 & -33M1 10/15/2003 BOILER UNIT 7, COAL, WAP7 COAL
6700 MMBtu/hr NONE INDICATED 5.52E-05 lb/MMBtu
WA PARISH ELECTRIC GENERATING STATION TXPSD-TX-901, PSD-TX-902 & -33M1 10/15/2003
BOILER UNIT 7, COAL & GAS, WAP7 COAL
6700 MMBtu/hr NONE INDICATED 5.52E-05 lb/MMBtu
WASHINGTON PARISH ELECTRIC GENERATING STATION TX PSD-TX-33 M1 10/15/2002BOILER STACK, WAP 7, COAL ONLY COAL
6700 MMBtu/hr NONE INDICATED 5.52E-05 lb/MMBtu
WASHINGTON PARISH ELECTRIC GENERATING STATION TX PSD-TX-33 M1 10/15/2002BOILER STACK, WAP 7, COAL & NAT GAS COAL & NAT GAS
6700 MMBtu/hr NONE INDICATED 5.52E-05 lb/MMBtu
WA PARISH ELECTRIC GENERATING STATION TXPSD-TX-901, PSD-TX-902 & -33M1 10/15/2003
(2) BOILERS, UNITS 5 & 6, WAP5&6, COAL COAL
6750 MMBtu/hr NONE INDICATED 5.81E-05 lb/MMBtu
WA PARISH ELECTRIC GENERATING STATION TXPSD-TX-901, PSD-TX-902 & -33M1 10/15/2003
(2) BOILERS, UNITS 5 & 6, COAL & GAS, WAP5&6 COAL
6750 MMBtu/hr NONE INDICATED 5.81E-05 lb/MMBtu
WASHINGTON PARISH ELECTRIC GENERATING STATION TX PSD-TX-33 M1 10/15/2002(2) BOILER STACKS, WAP 5 & 6 , COAL & NAT GAS COAL & NAT GAS
6750 MMBtu/hr NONE INDICATED 5.81E-05 lb/MMBtu
WASHINGTON PARISH ELECTRIC GENERATING STATION TX PSD-TX-33 M1 10/15/2002(2) BOILER STACKS, WAP 5 & 6 , COAL ONLY COAL
6750 MMBtu/hr NONE INDICATED 6.37E-05 lb/MMBtu
SANDY CREEK ENERGY STATION TXPSD-TX 1039 AND 70861 7/24/2006 PULVERIZED CAOL BOILER COAL 800 NONE INDICATED 6.72E-05 lb/MMBtu
Prepared by: PMH 1/10/08 Checked by: JDF 1/10/08
Prevention of Significant Deterioration Air Permit Application January 17, 2008 Plant Washington, Power4Georgians, LLC
070007.2201 4-70
4.3.7 BACT Demonstration for Fluoride Emissions from the Supercritical Pulverized Coal Boiler
Emissions of fluoride are generated in fossil fuel fired sources from oxidation of fluorine present in the
fuel source. Fluorine is emitted predominantly in the gaseous form of Hydrogen Fluoride (HF).
Hydrogen Fluoride can be controlled by the same technologies available for SO2 emissions.
Step 1 – Identify All Control Technologies
Lower Emitting Process or Practice – Coal Cleaning
Coal cleaning, also called coal beneficiation, or coal washing, is a cleaning process in which
mineral ash matter is removed from mined coal to produce a “cleaner” coal. Coal cleaning is
generally performed in order to remove impurities in the coal to improve the heat content of the
coal, thereby improving power plant capacity, reduce maintenance costs at power plants and
extend plant life. Coal cleaning could reduce the levels of fluorine present in the coal, thereby
reducing the amount of fluorine present and available to form HF during the combustion process.
Wet Scrubber
Wet scrubbers systems are often used as Flue Gas Desulfurization (FGD) systems, where they are
used to control emissions of SO2 from oil and coal combustion sources from industrial sources
and electrical utilities. Wet scrubbers can also be used in the control of HF emissions. The HF is
removed from the flue gas by sorption and reaction with the reagent slurry created by the wet
scrubber. Reagents commonly used in the process include lime and limestone. Additives, such
as magnesium, can be added to the reagent materials to further improve the reaction of the
reagent with the HF present in the gas stream. The by-products of the wet scrubber are in a wet
slurry form and must be dewatered prior to handling and further disposal. Wastewaters generated
through the wet scrubbing process may also require some level of treatment.

Prevention of Significant Deterioration Air Permit Application January 17, 2008 Plant Washington, Power4Georgians, LLC
070007.2201 4-71
Spray Dryer Absorber (SDA)
In a SDA, or spray dryer, a fine spray of reagent slurry is atomized and comes into contact with
the hot exhaust gas, or flue gas. Lime is the typical reagent used in an SDA unit. A significant
part of the acidic components of the flue gas, including HF, are rapidly absorbed into the alkaline
droplets, with the water/moisture content present being evaporated simultaneously. Control of
exhaust gas distribution, slurry flow rate, and spray droplet size ensure that the droplets
introduced into the gas stream are effectively dried to a fine powder before touching the chamber
walls of the spray dryer unit or exiting the spray dryer system. A portion of the reacted product is
collected and discharged from the spray dryer absorber. The treated flue gas is then discharged to
a fabric filter baghouse, or other PM control device, where additional reacted product is collected
from the exhaust gas stream.
Circulating Dry Scrubber (CDS)
A CDS is similar in concept and reaction chemistry to a SDA. In a CDS system, a circulating
fluidized bed arrangement is used for contacting the sorbent reagent, lime, with the HF present in
the flue exhaust gas. A with a spray dryer absorber, the reaction products exit the system in a dry
form and are collected down stream in a fabric filter baghouse or other PM)control device.
Sorbent Injection
One potential control technology is the use of sorbent injection, in which a reagent, such as
limestone, is injected into the ductwork between the air heater and particulate collection device.
Step 2 – Eliminate Technically Infeasible Options
Lower Emitting Process or Practice – Coal Cleaning
As stated above in other pollutant evaluations, coal cleaning is not typically performed on the low
sulfur PRB coals that will be used at the facility. There are no large scale coal cleaning facilities
currently established for western coals such as PRB coals. Illinois #6 coals do contain a higher
ash content than PRB coals. However, were these coals to be washed the moisture content of the
coal would be increased, and the heating value of the coal would be degraded. This would lead to
an increase in the amount of coal burned, and a potential subsequent increase in secondary

Prevention of Significant Deterioration Air Permit Application January 17, 2008 Plant Washington, Power4Georgians, LLC
070007.2201 4-72
pollutant emissions (such as SO2). Therefore, due to the minimal expected reduction in HF
emissions, and detrimental impacts to emissions of other pollutants, coal cleaning is not a
technically feasible option for the facility for reduction of HF emissions.
Wet Scrubber
Wet scrubbers have been installed and operated on PC fired boiler units. Therefore, wet
scrubbers are considered technically feasible for this project.
Spray Dryer Absorber (Dry Scrubber)
Dry scrubbers have been installed and operated successfully on PC fired boiler units. Therefore,
dry scrubbers are considered technically feasible for this project.
Circulating Dry Scrubber
Circulating Dry Scrubbers have not yet been demonstrated on a coal-fired boiler of greater than
100 MW. The size and scale differences between the proposed utility boiler and the boilers on
which this technology has been demonstrated would likely lead to the requirement for further
design, research, and testing for assessing viability on such a large scale unit. Circulating
fluidized bed systems, as with a circulating fluidized bed boiler, are not in use at the size and
scale of this proposed utility boiler. Therefore, circulating dry scrubber systems are not
considered available for this project and are considered technically infeasible for this analysis.
Sorbent Injection
Although there is limited evidence that sorbent injection would be effective at the removal of
Hydrogen Fluoride (HF) emissions from the exhaust gas stream, sorbent injection is considered
technically feasible for this analysis.

Prevention of Significant Deterioration Air Permit Application January 17, 2008 Plant Washington, Power4Georgians, LLC
070007.2201 4-73
Step 3 – Rank Remaining Technically Feasible Control Options
Control Effectiveness
The feasible control technologies found during Step 2 of this analysis include wet scrubbers,
sorbent injection, and spray dryer absorbers (dry scrubbers). Reviews were conducted of
technical publications, the USEPA RBLC, and vendor information to determine the control
efficiencies of each of these identified technically feasible HF reduction technologies. There are
not many instances where the performance of control technologies for HF emissions control has
been evaluated and limited data exists as to the effectiveness of differing control technologies. A
review of data on the RBLC database includes a variety of controls deemed applicable
historically for BACT for HF emissions for coal fired boilers, including use of dry scrubbers, wet
scrubbers, and sorbent injection with a fabric filter baghouse.
Energy Impacts
Energy penalties are much more significant for a wet scrubber than for a dry scrubber. With wet
scrubbers, greater energy requirements exist due to greater system pressure drops and larger
energy requirements for ancillary equipment, such as water recycling pumps, and slurry
dewatering pumps. Utilization of a wet scrubber can demand greater than 2 percent of the gross
power generation of the facility, while dry scrubbers can demand typically around 1 percent of
the gross power generation of the facility. Utilization of sorbent injection along with a wet
scrubber would be expected to add minimal power demand to the system. Any significant power
demand for the sorbent injection system would come from power required to handle or process
the sorbent powder or slurry.
Environmental Impacts
Wet scrubbers have an added collateral environmental benefit over dry scrubbers in that they are
more effective in the capture of secondary acid gases in the flue gas exhaust stream than a dry
scrubber, including reactive mercury, hydrogen chloride, and fluorides. Water consumption is an
important environmental impact when evaluating wet scrubbers and dry scrubbers, since wet
scrubbers have a more significant water usage than dry scrubbers. However, dry scrubbers are
not truly “dry”, as water is used in preparation of the reagent slurry which is atomized and
injected into the exhaust gas stream.

Prevention of Significant Deterioration Air Permit Application January 17, 2008 Plant Washington, Power4Georgians, LLC
070007.2201 4-74
Another significant environmental impact involves the generation of solid waste and wastewaters
from wet scrubbers and dry scrubbers. Wastewater from a wet scrubber would require more
specialized handling and treatment than a dry scrubber, since dry scrubber systems do not
produce blowdown or a wastewater stream. Sorbent injection would not be expected to produce a
wastewater stream. Wet scrubbers can produce a solid waste stream (gypsum) which can be
marketable depending on the quality of the gypsum produced, and the status of the current
market. Dry scrubbers produce a solid waste stream with little to no commercial value that is
traditionally disposed of in a solid waste facility.
Economic Impacts
The costing data for a wet scrubber is discussed in Section 4.3.5 above.
Step 4 – Evaluate Remaining Control Technologies
As stated above in Step 3, there are not many instances where the performance of control
technologies for HF emissions control has been evaluated and limited data exists as to the
effectiveness of differing control technologies. A review of data on the RBLC database includes
a wide variety of controls deemed applicable historically for BACT for coal-fired boilers.
Therefore, for the above listed reasons, utilization of a wet scrubber is chosen as the top control
option for control of HF emissions. Utilization of a baghouse system (for PM control) should
provide some additional added control of HF emissions. Since the use of sorbent injection has
been determined as BACT for control of H2SO4 emissions, there will be co-benefit control of HF
emissions through use of the sorbent injection system.
Energy Impacts
While wet scrubber systems at the facility would use approximately 2 percent of the gross power
generation of the facility, dry scrubbing systems would use almost 1 percent of the gross power
generation of the facility. This approximately 1 percent difference in gross power demand does
not preclude the use of a wet scrubber system at the facility. Utilization of sorbent injection along
with a wet scrubber would be expected to add minimal power demand to the system. Any
significant power demand for the sorbent injection system would come from power required to
handle or process the sorbent powder or slurry.

Prevention of Significant Deterioration Air Permit Application January 17, 2008 Plant Washington, Power4Georgians, LLC
070007.2201 4-75
Environmental Impacts
Wet scrubbers have an added collateral environmental benefit over dry scrubbers in that they are
more effective in the capture of secondary acid gases in the flue gas exhaust stream than a dry
scrubber, including reactive mercury, hydrogen chloride, and fluorides. Water consumption for a
wet scrubber system would be higher than the water consumption for a dry scrubber, due to the
inherent design difference present between a wet scrubber and a dry scrubber. However, the
additional water consumption necessary for operation of a wet scrubber does not preclude the use
of a wet scrubber at the facility. The waste stream present from a wet scrubber (gypsum) is a
potentially saleable product. Waste streams generated by a wet scrubber are inherently more
saleable or recyclable than those waste streams generated by a dry scrubber. Sorbent injection
would not be expected to produce a wastewater stream. However, there would be additional solid
wastes generated from use of the sorbent injection materials.
Economic Impacts
Economic concerns would not be an issue regarding use of a wet scrubber.
Step 5 – Selection of BACT
A summary of recent HF BACT evaluations conducted for similar projects can be found in Table
4-9 below. Utilization of a wet scrubber (wet flue gas desulfurization) is believed to achieve the
maximum amount of HF emissions reduction available. Therefore, BACT for HF emissions is
proposed as use of a wet scrubber and an emission limit of 0.0003 lb/MMBtu on a 3-hr average
basis. This emission limit is the lowest BACT emission limit demonstrated in practice by the
Santee Cooper Cross Generating Station, Unit 3, in South Carolina. Facilities with lower emission
limits, such as the Thoroughbred Generation Station in Kentucky, have not yet been constructed or
demonstrated in practice. This level of control and emission limit has been proposed as BACT on
similar recent projects.

Prevention of Significant Deterioration Air Permit Application January 17, 2008 Plant Washington, Power4Georgians, LLC
070007.2201 4-76
Table 4-9 RBLC Listings for Fluoride Emissions from Pulverized Coal-Fired Boilers
Facility NameFacility
State Permit Number Permit Date Process Name FuelThruput
(MW) Control Description
MAIDSVILLE WV R14-0024 3/2/2004 BOILER, PCPULVERIZED COAL 600
DRY SORBENT INJECTION W/ FABRIC FILTER BAGHOUSE 0.0001 lb/MMBtu
THOROUGHBRED GENERATING STATION KY V-02-001 10/11/2002 BOILER, COAL, (2) COAL 750
PROPER BOILER DESIGN AND CONTROL TECHNOLOGY, WFGD, AND WESP 0.000159 lb/MMBtu
THOROUGHBRED GENERATING STATION KY V-02-001 10/11/2002 PC BOILERS (2) COAL 750
PROPER BOILER DESIGN AND CONTROL TECHNOLOGY, WFGD, AND WESP 0.000159 lb/MMBtu
WPS WESTON PLANT WI 04-RV-248 10/19/2004
SUPERCRITICAL PULVERIZED COAL ELECTRIC STEAM BOILER COAL 500 DRY FGD AND BAGHOUSE 0.0002 lb/MMbtu
TOQUOP ENERGY, LLC NV AP4911-1146 DRAFT 750 MW PC BOILER COAL 750 WET SCRUBBER 0.00024 lb/MMbtu
DESERT ROCK ENERGY FACILITY NM DRAFT 7/1/2006(2) 750 MW SCPC BOILERS COAL 750
LIMESTONE WET FGD, HYDRATED LIME INJECTION 0.00024 lb/MMbtu
SANTEE COOPER CROSS GENERATING STATION SC 0420-0030-CI 2/5/2004BOILER, NO. 3 AND NO. 4
BITUMINOUS COAL 660
FLUE GAS DESULFURIZATION (WET SCRUBBING) 0.0003 lb/MMBtu
WHELAN ENERGY CENTER NE 58048 3/30/2004BOILER, UNIT 2 UTILITY
SUBBITUMINOUS COAL 648
SPRAY DRYER ABSORBER & PM CONTROL EQUIPMENT 0.0004 lb/MMBtu
ELY ENERGY CENTER NV AP4911-2241 DRAFT(2) 750 MW PC BOILERS COAL 750 WET SCRUBBER 0.0004 lb/MMbtu
OPPD NEBRASKA CITY STATION NE 58343C01 3/9/2005 BOILER COAL 660FLUE GAS DESULFURIZATION AND FABRIC FILTER 0.0004 lb/MMbtu
PLUM POINT ENERGY AR 1995-AOP-R0 8/20/2003 PC BOILERS (2) COAL 800 DRY FGD AND BAGHOUSE 0.0004 lb/MMbtu
COMANCHE STATION CO 04UNITPB1015 7/5/2005PC BOILER - UNIT 3
SUB-BITUMINOUS COAL 750
LIME SPRAY DRYER FOLLOWED BY A BAGHOUSE 0.0005 lb/MMBtu
GASCOYNE GENERATING STATION ND PTC 05005 6/3/2005BOILER, COAL-FIRED LIGNITE 620
LIMESTONE INJECTION AND SPRAY DRYER. 0.0005 lb/MMBtu
INTERMOUNTAIN POWER GENERATING STATION - UNIT #3 UTDAQE-AN0327010-
04 10/15/2004
PULVERIZED COAL FIRED ELECTRIC GENERATING UNIT
BITUMINOUS OR BLEND 950 0.0005 lb/MMBtu
TS POWER PLANT NV AP4911-1349 5/5/2005200 MW PC COAL BOILER
POWDER RIVER BASIN COAL 595
DRY SPRAY SCRUBBER & FABRIC FILTER DUST COLLECTION 0.0005764 lb/MMBtu
JK SPRUCE ELECTRIC GENERATING UNIT 2 TX 70492 1/19/2006
PULVERIZED COAL FIRED ELECTRIC STEAM BOILER COAL 750 WET FGD 0.0008 lb/MMbtu
MIDAMERICAN ENERGY COMPANY IA PROJECT 02-528 6/17/2003 CBEC 4 BOILER PRB COAL7675
MMBtu/hrLIME SPRAY DRYER FLUE GAS DESULFURIZATION 0.0009 lb/MMBtu
Emission Limit

Prevention of Significant Deterioration Air Permit Application January 17, 2008 Plant Washington, Power4Georgians, LLC
070007.2201 4-77
Table 4-9 RBLC Listings for Fluoride Emissions from Pulverized Coal Fired-Boilers (Continued)
Facility NameFacility
State Permit Number Permit Date Process Name FuelThruput
(MW) Control Description
LONGLEAF ENERGY ASSOCIATES, LLC GA4911-099-0030-P-
01-0 5/14/2007 (2) 600 MW UNITS PRB COAL 600DRY SCRUBBER AND FABRIC FILTER BAGHOUSE 0.00095 lb/MMbtu
LONGLEAF ENERGY ASSOCIATES, LLC GA4911-099-0030-P-
01-0 5/14/2007 (2) 600 MW UNITS CAPP COAL 600DRY SCRUBBER AND FABRIC FILTER BAGHOUSE 0.0014 lb/MMbtu
SANDY CREEK ENERGY STATION TXPSD-TX 1039 AND
70861 7/24/2006PULVERIZED CAOL BOILER COAL 800 0.00281 lb/MMBtu
KANSAS CITY POWER & LIGHT COMPANY - IATAN STATION MO 012006-019 1/27/2006PULVERIZED COAL BOILER COAL
7800 MMBtu/hr NONE INDICATED 0.00425 lb/MMbtu
LIMESTONE ELECTRIC GENERATING STATION TX PSD-TX-371 (M3) 5/23/2001
(2) BOILER UNIT 1 & 2 SCRUBBER STACKS, LMS1 & 2 LIGNITE 800 NONE INDICATED 0.0103523 lb/MMBtu
WA PARISH ELECTRIC GENERATING STATION TXPSD-TX-901, PSD-TX-902 & -33M1 10/15/2003
BOILER UNIT 7, COAL, WAP7 COAL
6700 MMBtu/hr NONE INDICATED 0.0165672 lb/MMBtu
WA PARISH ELECTRIC GENERATING STATION TXPSD-TX-901, PSD-TX-902 & -33M1 10/15/2003
BOILER UNIT 7, COAL & GAS, WAP7 COAL
6700 MMBtu/hr NONE INDICATED 0.0165672 lb/MMBtu
WASHINGTON PARISH ELECTRIC GENERATING STATION TX PSD-TX-33 M1 10/15/2002
BOILER STACK, WAP 7, COAL ONLY COAL
6700 MMBtu/hr NONE INDICATED 0.0165672 lb/MMBtu
WASHINGTON PARISH ELECTRIC GENERATING STATION TX PSD-TX-33 M1 10/15/2002
BOILER STACK, WAP 7, COAL & NAT GAS
COAL & NAT GAS
6700 MMBtu/hr NONE INDICATED 0.0165672 lb/MMBtu
WA PARISH ELECTRIC GENERATING STATION TXPSD-TX-901, PSD-TX-902 & -33M1 10/15/2003
(2) BOILERS, UNITS 5 & 6, WAP5&6, COAL COAL
6750 MMBtu/hr NONE INDICATED 0.0172973 lb/MMBtu
WA PARISH ELECTRIC GENERATING STATION TXPSD-TX-901, PSD-TX-902 & -33M1 10/15/2003
(2) BOILERS, UNITS 5 & 6, COAL & GAS, WAP5&6 COAL
6750 MMBtu/hr NONE INDICATED 0.0172973 lb/MMBtu
WASHINGTON PARISH ELECTRIC GENERATING STATION TX PSD-TX-33 M1 10/15/2002
(2) BOILER STACKS, WAP 5 & 6 , COAL & NAT GAS
COAL & NAT GAS
6750 MMBtu/hr NONE INDICATED 0.0172973 lb/MMBtu
WASHINGTON PARISH ELECTRIC GENERATING STATION TX PSD-TX-33 M1 10/15/2002
(2) BOILER STACKS, WAP 5 & 6 , COAL ONLY COAL
6750 MMBtu/hr NONE INDICATED 0.018963 lb/MMBtu
Emission Limit
Prepared by: PMH 1/10/08
Checked by: JDF 1/10/08
Prevention of Significant Deterioration Air Permit Application January 17, 2008 Plant Washington, Power4Georgians, LLC
070007.2201 4-78
4.3.8 BACT Demonstration for Sulfuric Acid Mist (H2SO4) Emissions from the Supercritical Pulverized Coal Boiler
H2SO4 is formed in coal-fired boilers due to oxidation of SO2 to SO3, and subsequent reaction with water
vapor to form H2SO4. The formation of H2SO4 is therefore highly dependent on coal sulfur content and
the presence of oxidizing catalysts. The size of H2SO4 particle formation can be dependent on the gas
cooling rate. H2SO4 is an acid gas, and can be controlled by the same technologies available for control
of SO2 emissions. The control technologies and strategies for control of H2SO4 are similar to those
technologies and strategies for control of SO2 emissions with the addition of sorbent injection technology.
Step 1 – Identify All Control Technologies
Lower Emitting Process or Practice – Coal Selection
Emissions of Sulfur Dioxide (SO2) result from the oxidation of sulfur present in the coal during
the combustion process. Therefore, coal source selection can have an impact on SO2 emissions,
and corresponding SO3 formation (leading to emissions of H2SO4) from a coal fired boiler.
Lower Emitting Process or Practice – Coal Cleaning
Coal cleaning, also called coal beneficiation, or coal washing, is a cleaning process in which
mineral ash matter is removed from mined coal to produce a “cleaner” coal. Coal cleaning is
generally performed in order to remove impurities in the coal to improve the heat content of the
coal, thereby improving power plant capacity, reduce maintenance costs at power plants and
extend plant life. Coal cleaning is also performed to reduce the sulfur content in the coal. This
reduction in sulfur content in the coal reduces the amount of sulfur available to form H2SO4 in the
system exhaust gas.
Lower Emitting Process or Practice – Coal Refining
Coal refining is a mechanical and thermal process to remove moisture, sulfur, nitrogen, and heavy
metals from coal. Also, as a result of the refining process, the ash content and moisture of the
coal can be lowered, as well as increasing the heat content of the coal. Coal refining processes
include processes still in the research and development stage, such as patented technologies for
conversion of coal to char, a “clean” boiler fuel, and processes already in limited operation such

Prevention of Significant Deterioration Air Permit Application January 17, 2008 Plant Washington, Power4Georgians, LLC
070007.2201 4-79
as the Evergreen Energy, Inc. K-Fuel patented pre-combustion coal refining process. A reduction
in the sulfur content in the coal would reduce the amount of sulfur available to form H2SO4 in the
system exhaust gas.
Lower Emitting Process or Practice – Low Oxidation Catalyst
Low oxidation catalysts can be used to reduce the conversion of SO2 to SO3 in the exhaust flue
gas stream, thereby reducing the amount of formation of H2SO4 emissions.
Wet Scrubber
Wet scrubbers systems are often used as Flue Gas Desulfurization (FGD) systems, where they are
used to control emissions of SO2 from oil and coal combustion sources from industrial sources
and electrical utilities. Wet scrubbers can also be used in the control of H2SO4 emissions. The
H2SO4 is removed from the flue gas by sorption and reaction with the reagent slurry created by
the wet scrubber. Reagents commonly used in the process include lime and limestone.
Additives, such as magnesium, can be added to the reagent materials to further improve the
reaction of the reagent with the H2SO4 present in the gas stream. The by-products of the wet
scrubber are in a wet slurry form and must be dewatered prior to handling and further disposal.
Wastewaters generated through the wet scrubbing process may also require some level of
treatment.
Spray Dryer Absorber (Dry Scrubber)
In a spray dryer absorber (SDA), or spray dryer, a fine spray of reagent slurry is atomized and
comes into contact with the hot exhaust gas, or flue gas. Lime is the typical reagent used in an
SDA unit. A significant part of the acidic components of the flue gas, including H2SO4, are
rapidly absorbed into the alkaline droplets, with the water/moisture content present being
evaporated simultaneously. Control of exhaust gas distribution, slurry flow rate, and spray
droplet size ensure that the droplets introduced into the gas stream are effectively dried to a fine
powder before touching the chamber walls of the spray dryer unit or exiting the spray dryer
system. A portion of the reacted product is collected and discharged from the spray dryer
absorber. The treated flue gas is then discharged to a fabric filter baghouse, or other PM control
device, where additional reacted product is collected from the exhaust gas stream.

Prevention of Significant Deterioration Air Permit Application January 17, 2008 Plant Washington, Power4Georgians, LLC
070007.2201 4-80
Circulating Dry Scrubber
A CDS is similar in concept and reaction chemistry to a spray dryer absorber (SDA). In a CDS
system, a circulating fluidized bed arrangement is used for contacting the sorbent reagent, lime,
with the H2SO4 present in the flue exhaust gas. In a spray dryer absorber, the reaction products
exit the system in a dry form and are collected down stream in a fabric filter baghouse or other
PM control device.
Regenerable Wet Scrubber
The significant difference between a regenerable wet scrubber and a standard wet scrubber, as
described above, is the fact that the regenerable system recycles the spent sorbent back into the
system for reuse, or regenerates the sorbent for further processing into other products. Standard
wet scrubbers, and the described spray dryer absorber and circulating dry scrubbers described
above, are once-through systems where the spent sorbent is collected and either disposed of as a
waste or utilized and sold as a by-product (i.e. gypsum). Regenerable wet scrubbers utilize
ammonia, amine, sodium sulfite, or other reagents as the sorbent material for removal of H2SO4
emissions from the exhaust flue gas. Regenerable wet scrubbers reportedly achieve H2SO4
emissions reductions comparable to that of non-regenerable wet scrubbers.
Activated Carbon Flue Gas Desulfurization
In this system, activated carbon is used as the sorbent for removal of H2SO4 emissions. Activated
carbon is injected into the flue gas exhaust stream through a series of header nozzles upstream of
a fabric filter baghouse or other Particulate Matter (PM) control device. A portion of the reacted
carbon and fly ash collected by the PM control device could be recycled and injected back into
the flue gas exhaust stream to minimize the need for fresh activated carbon, making the process a
partially “regenerable” process.
Sorbent Injection and Wet Scrubber
One potential control technology is the combination of sorbent injection with a wet scrubber. A
reagent, such as lime or limestone, is injected into the exhaust gas stream between the air heater

Prevention of Significant Deterioration Air Permit Application January 17, 2008 Plant Washington, Power4Georgians, LLC
070007.2201 4-81
and the PM control device. Sorbent injection technology could be used in conjunction with a wet
scrubber device.
Sorbent Injection and Dry Scrubber
One potential control technology is the combination of sorbent injection with a dry scrubber. A
reagent, such as lime or limestone, is injected into the exhaust gas stream between the air heater
and the PM control device. Sorbent injection technology could be used in conjunction with a dry
scrubber device.
Wet Electrostatic Precipitator (WESP)
WESP remove PM from the exhaust gas stream, including H2SO4. In a WESP unit, the collectors
are either intermittently or continuously washed by a spray of liquid, usually water. The wet
effluent is collected, and often treated on-site.
Step 2 – Eliminate Technically Infeasible Options
Lower Emitting Process or Practice – Coal Selection
Coal selection is a demonstrated method for minimizing the amount of sulfur available for SO2
formation, and therefore SO3 and H2SO4 formation. Therefore, coal selection is determined to be
technically feasible for this project.
Lower Emitting Process or Practice – Coal Cleaning
Coal washing involves removing the sulfur from the fuel before combusting it in a boiler. The
majority of the sulfur in the coal is organic and is chemically bonded in the molecular structure of
the coal itself. A small fraction of the sulfur in the coal is within an iron compound called pyrite
that can be removed through washing of the coal. However, the pyritic sulfur contents of PRB
and Illinois #6 coals is low, with a pyritic sulfur content of approximately 0.05% for PRB coals
and approximately 2.15% for Illinois #6 coals. Assuming coal washing could remove 40% of the
pyritic sulfur content of the coal, less than 1% of the sulfur (and corresponding H2SO4 emissions)
of the use of Illinois #6 coals would be expected. Therefore, coal washing would be ineffective
because there would be little sulfur content removed by the process. Also, were these coals to be

Prevention of Significant Deterioration Air Permit Application January 17, 2008 Plant Washington, Power4Georgians, LLC
070007.2201 4-82
washed the moisture content of the coal would be increased, and the heating value of the coal
would be degraded. This would lead to an increase in the amount of coal burned, and a potential
subsequent increase in pollutant emissions. Therefore, due to the minimal expected reduction in
SO2 emissions, and potential increase in emissions due to the consumption of more coal, coal
cleaning is not a technically feasible option for the facility for reduction of H2SO4 emissions
Lower Emitting Process or Practice – Coal Refining
Coal refining is not yet a demonstrated technology for controlling H2SO4 emissions for a large
scale coal combustion facility. A company called Evergreen Energy, Inc. is the only vendor
currently found to offer refined PRB coal. The refined fuel product is called K-Fuel, and claims
made regarding the use of the fuel indicate that the use of K-Fuel can lead to lower emissions of
pollutants, including sulfur dioxide (and presumably H2SO4), nitrogen oxides, and carbon
monoxide than standard PRB coal. However, the company is only operating one facility in
Wyoming which has thus far seen limited production. The company hopes to produce over 50
million tons per year of K-fuel in 5 years, through full operation at the existing facility and
expansion of new facilities. However, wide scale production and use, and demonstration of the
improved performance of the K-fuel have yet to be conducted.
Based on the current lack of sufficient supply of coal refining facilities, coal refining is not
considered an available technology for H2SO4 emissions reduction. Therefore, coal refining is
determined to be technically infeasible for this project.
Lower Emitting Process or Practice – Low Oxidation Catalyst
Low oxidation catalysts have been used in practice, and are considered technically feasible for
this project.
Wet Scrubber
Wet scrubbers have been demonstrated in wide scale use on coal-fired boilers and are available
from a number of vendors. Wet scrubbers are therefore considered to be technically feasible.

Prevention of Significant Deterioration Air Permit Application January 17, 2008 Plant Washington, Power4Georgians, LLC
070007.2201 4-83
Spray Dryer Absorber (Dry Scrubber)
Dry scrubbers have been demonstrated in wide scale use on coal fired boilers and are available
from a number of vendors. Dry scrubbers are therefore considered to be technically feasible.
Circulating Dry Scrubber
Circulating Dry Scrubbers have not yet been demonstrated on a coal-fired boiler of greater than
250 MW. The size and scale differences between the proposed utility boiler and the boilers on
which this technology has been demonstrated would likely lead to the requirement for further
design, research, and testing for assessing viability on such a large scale unit. Circulating
fluidized bed systems, as with the a circulating fluidized bed boiler, are not in use at the size and
scale of the proposed utility boiler. Therefore, circulating dry scrubber systems are not
considered available for this project and are considered technically infeasible for this analysis.
Activated Carbon Flue Gas Desulfurization
Although some level of H2SO4 removal would be expected from use of injection of activated
carbon into the flue gas exhaust stream, removal efficiencies when using this technology as a
stand alone control methodology are not as effective as those of other stand alone control devices,
such as wet or dry scrubbers. Research data has shown that concentrations of NOX in the flue gas
exhaust stream, specifically nitrogen monoxide (NO), can lead to inhibition of the catalytic effect
of the porous carbon material, leading to deteriorated desulfurization performance. This
deteriorated desulfurization performance can lead to the requirement for an increasing amount of
activated carbon use, thereby increasing the treatment costs. Activated carbon desulfurization
would not be expected to achieve a significant reduction in SO2 emissions. Therefore, for the
above listed reasons, the use of activated carbon FGD for removal of H2SO4 emissions is
considered technically infeasible for this project.
Sorbent Injection and Wet Scrubber
There is some data to indicate that there would be an H2SO4 emissions reduction benefit from use
of sorbent injection along with a wet scrubber. For these reasons, use of duct sorbent injection in
conjunction with a wet scrubber is considered technically feasible for this project.

Prevention of Significant Deterioration Air Permit Application January 17, 2008 Plant Washington, Power4Georgians, LLC
070007.2201 4-84
Sorbent Injection and Dry Scrubber
There is limited operating data available to indicate that there would be a substantial H2SO4
emissions reduction benefit from use of sorbent injection along with a dry scrubber. Inclusion of
duct sorbent injection with a dry scrubber would lead to increased capital and annualized
operating costs, with no assurance of an improved system performance from use of a dry scrubber
alone. Also, a secondary concern for use of sorbent injection with a dry scrubber is the potential
for interference of the duct sorbent material with the operation of the dry scrubber. A sorbent
material present in the flue gas exhaust stream could potentially interfere with the ability of the
spray dryer absorber (dry scrubber) to evaporate the moisture in the reagent slurry, thus impacting
the effectiveness of the unit. For these reasons, use of sorbent injection in conjunction with a dry
scrubber is considered technically infeasible.
Wet Electrostatic Precipitator (WESP)
WESP units have been shown to remove H2SO4 mists from exhaust streams and are considered
technically feasible.
Step 3 – Rank Remaining Technically Feasible Control Options
Control Effectiveness
The feasible control technologies found during Step 2 of this analysis include coal selection, low
oxidation catalysts, wet scrubbers, sorbent injection with wet scrubbers, spray dryer absorbers
(dry scrubbers), and WESP. Reviews were conducted of technical publications, the USEPA
RBLC, and vendor information to determine the control efficiencies of each of these identified
technically feasible H2SO4 reduction technologies. There are not many instances where the
comparative performance of control technologies for H2SO4 emissions control has been
evaluated, and limited and conflicting data exists as to the effectiveness of differing control
technologies. A review of data on the RBLC database includes a wide variety of controls deemed
applicable historically for BACT for coal-fired boilers, including wet scrubbers, dry scrubbers,
dry scrubber and baghouse in coordination, baghouse and wet scrubber in coordination, limiting
of fuel sulfur content, and coordination of an ESP, dry scrubber, and WESP unit.

Prevention of Significant Deterioration Air Permit Application January 17, 2008 Plant Washington, Power4Georgians, LLC
070007.2201 4-85
Energy Impacts
Energy penalties are much more significant for a wet scrubber and WESP than for a dry scrubber.
With wet scrubbers, greater energy requirements exist due to greater system pressure drops and
larger energy requirements for ancillary equipment, such as water recycling pumps, slurry
dewatering pumps, etc. Utilization of a wet scrubber can demand greater than 2 percent of the
gross power generation of the facility, while dry scrubbers can demand typically around 1 percent
of the gross power generation of the facility. Utilization of sorbent injection along with a wet
scrubber would be expected to add minimal power demand to the system. Any significant power
demand for the sorbent injection system would come from power required to handle or process
the sorbent powder or slurry.
Based on data in an USEPA Air Pollution Training Institute publication on Electrostatic
Precipitator Operation, the power required to operate a wet electrostatic precipitator can be
around 1000 watts per 1000 acfm, with limited collection efficiency degradation at 705 watts per
1000 acfm. For the estimated air flow currently available for the site, this could lead to ESP
power requirements from 2 to 3 MW. Therefore, power generation requirements for a wet
scrubber or a WESP unit would be more significant than the power generation requirements for a
dry scrubber. Obviously, if a wet scrubber was used in tandem with a WESP unit, significant
demands of the gross power generation of the facility would be required to operate the facility air
pollution control equipment.
Environmental Impacts
Wet scrubbers have an added collateral environmental benefit over dry scrubbers in that they are
more effective in the capture of secondary acid gases in the flue gas exhaust stream than a dry
scrubber, including reactive mercury, hydrogen chloride, and fluorides. Water consumption is an
important environmental impact when evaluating wet scrubbers and dry scrubbers, since wet
scrubbers have a more significant water usage than dry scrubbers. However, dry scrubbers are
not truly “dry”, as water is used in preparation of the reagent slurry which is atomized and
injected into the exhaust gas stream.
Another significant environmental impact involves the generation of solid waste and wastewaters
from wet scrubbers and dry scrubbers. Wastewater from a wet scrubber would require more

Prevention of Significant Deterioration Air Permit Application January 17, 2008 Plant Washington, Power4Georgians, LLC
070007.2201 4-86
specialized handling and treatment than a dry scrubber, since dry scrubber systems do not
produce blowdown or a wastewater stream. Sorbent injection would not be expected to produce a
wastewater stream. Wet scrubbers can produce a solid waste stream (gypsum) which can be
marketable depending on the quality of the gypsum produced, and the status of the current
market. Dry scrubbers produce a solid waste stream with little to no commercial value that is
traditionally disposed in a solid waste facility.
WESP units create wastewaters, which would have to be treated and handled in accordance with
applicable regulations. Obviously, use of a WESP unit in conjunction with a wet scrubber would
increase the amount of wastewaters generated at the facility.
Economic Impacts
The BACT analysis for SO2 emissions has proposed use of a wet scrubber, and the PM BACT
analysis has proposed use of a fabric filter baghouse. Also, the BACT evaluation for SO2
emissions in Section 4.3.5 determined that coal selection to reduce SO2 (and therefore SO3 and
H2SO4 emissions) was not feasible. Use of a sorbent injection system in conjunction with a
fabric filter baghouse and wet scrubber will not lead to a significant economic impact.
Step 4 – Evaluate Remaining Control Technologies
As stated above in Step 3, there are not many instances where the performance of control
technologies for H2SO4 emissions control has been evaluated and limited and conflicting data
exists as to the effectiveness of differing control technologies. A review of data on the RBLC
database includes a wide variety of controls deemed applicable historically for BACT for coal-
fired boilers, including wet scrubbers, dry scrubbers, dry scrubber and baghouse in coordination,
baghouse and wet scrubber in coordination, limiting of fuel sulfur content, and coordination of an
ESP, dry scrubber, and WESP unit. Data exists which indicates that a facility installing a wet
scrubber may or may not install a WESP unit.
Therefore, for the above listed reasons, utilization of a wet scrubber with sorbent material
injection is chosen as the top control option for control of H2SO4 emissions. Utilization of a
baghouse system (for PM control), in addition to sorbent injection for mercury control utilizing
activated carbon, should provide some additional added control of H2SO4 emissions. This level
of control has been proposed as BACT in recent PSD permit applications.

Prevention of Significant Deterioration Air Permit Application January 17, 2008 Plant Washington, Power4Georgians, LLC
070007.2201 4-87
Energy Impacts
While wet scrubber systems at the facility would use approximately 2 percent of the gross power
generation of the facility, dry scrubbing systems would use almost 1 percent of the gross power
generation of the facility. This approximately 1 percent difference in gross power demand does
not preclude the use of a wet scrubber system at the facility. Utilization of sorbent injection
along with a wet scrubber would be expected to add minimal power demand to the system. Any
significant power demand for the sorbent injection system would come from power required to
handle or process the sorbent powder or slurry.
Environmental Impacts
Wet scrubbers have an added collateral environmental benefit over dry scrubbers in that they are
more effective in the capture of secondary acid gases in the flue gas exhaust stream than a dry
scrubber, including reactive mercury, hydrogen chloride, and fluorides. Water consumption for a
wet scrubber system would be higher than the water consumption for a dry scrubber, due to the
inherent design difference present between a wet scrubber and a dry scrubber. However, the
additional water consumption necessary for operation of a wet scrubber does not preclude the use
of a wet scrubber at the facility. The waste stream present from a wet scrubber (gypsum) is a
potentially saleable product. Waste streams generated by a wet scrubber are inherently more
saleable or recyclable than those waste streams generated by a dry scrubber. Sorbent injection
would not be expected to produce a wastewater stream. However, there would be additional
solid wastes generated from use of the sorbent injection materials.
Economic Impacts
As discussed above, a wet scrubber in conjunction with sorbent injection has been chosen as the
most effective control of H2SO4 emissions, based on recent BACT determinations and achieved
emissions levels of H2SO4. Use of a sorbent injection system will not lead to a significant
economic impact.
Step 5 – Selection of BACT
A summary of recent H2SO4 BACT evaluations conducted for similar projects can be found in
Table 4-10 below. Utilization of a wet scrubber (wet flue gas desulfurization) with sorbent

Prevention of Significant Deterioration Air Permit Application January 17, 2008 Plant Washington, Power4Georgians, LLC
070007.2201 4-88
injection is believed to achieve the maximum amount of H2SO4 emissions reduction available.
BACT for H2SO4 emissions is proposed as use of a wet scrubber with sorbent injection and an
emission limit of 0.005 lb/MMBtu on a 3-hr average basis. This level of control and emission
limit has been proposed as BACT on similar recent projects, such as the Toquop Energy, LLC
facility in Nevada. The lowest demonstrated emission limit value from the RBLC database is
0.0014 lb/MMBtu from the Santee Cooper Cross Generation Station Unit 3. Preliminary
indications from SC DHEC are that stack testing has shown compliance with this emission limit.
However, due to the variation in the types of coal used between the current project and Santee
Cooper Cross, this value is not deemed appropriate for this evaluation.

Prevention of Significant Deterioration Air Permit Application January 17, 2008 Plant Washington, Power4Georgians, LLC
070007.2201 4-89
Table 4-10 RBLC Listings for Sulfuric Acid Mist (H2SO4) Emissions from Pulverized Coal-Fired Boilers
Facility NameFacility
State Permit Number Permit Date Process Name FuelThruput
(MW) Control Description
TS POWER PLANT NV AP4911-1349 5/5/2005200 MW PC COAL BOILER
POWDER RIVER BASIN COAL 595
DRY SPRAY SCRUBBER & FABRIC FILTER DUST COLLECTION 0.0010 lb/MMBtu
SANTEE COOPER CROSS GENERATING STATION SC 0420-0030-CI 2/5/2004BOILER, NO. 3 AND NO. 4
BITUMINOUS COAL 660
FLUE GAS DESULFURIZATION (WET SCRUBBING) 0.0014 lb/MMBtu
HUGO GENERATING STATION OK 97-058-C M-2 PSD 2/9/2007
COAL-FIRED STEAM EGU BOILER (HU-UNIT 2) UNKNOWN 750 WET FLUE GAS DESULFURIZATION 0.0037 lb/MMBtu
JK SPRUCE ELECTRIC GENERATING UNIT 2 TX N/A 1/19/2006
PULVERIZED COAL FIRED ELECTRIC GENERATING UNIT COAL 750 WET FGD AND BAGHOUSE 0.0037 lb/MMbtu
AGP SOY PROCESSING NE CP05-0050 9/11/2006STEAM GENERATION COAL 112 LIMESTONE INJECTION 0.0039 lb/MMBtu
DESERT ROCK ENERGY FACILITY NM N/A 7/1/2006(2) 750 MW SCPC BOILERS COAL 750
LIMESTONE WET FGD, HYDRATED LIME INJECTION BEFORE FF 0.004 lb/MMBtu
ELY ENERGY CENTER NV AP4911-2241 DRAFT(2) 750 MW PC BOILERS COAL 750 FF AND WET SCRUBBER 0.004 lb/MMbtu
MIDAMERICAN ENERGY COMPANY IA PROJECT 02-528 6/17/2003 CBEC 4 BOILER PRB COAL7675
MMBtu/hrLIME SPRAY DRYER FLUE GAS DESULFURIZATION 0.0042 lb/MMBtu
OPPD - NEBRASKA CITY STATION NE 58343C01 3/9/2005 UNIT 2 BOILERSUBBITUMINOUS COAL 660
DRY FLUE GAS DESULFURIZATION & FABRIC FILTER 0.0042 lb/MMBtu
COMANCHE STATION CO 04UNITPB1015 7/5/2005 PC BOILER - UNIT 3
SUB-BITUMINOUS COAL 750
LIME SPRAY DRYER FOLLOWED BY A BAGHOUSE 0.0042 lb/MMBtu
WA PARISH ELECTRIC GENERATING STATION TXPSD-TX-901, PSD-TX-902 & -33M1 10/15/2003
BOILER UNIT 7, COAL, WAP7 COAL
6700 MMBtu/hr NONE INDICATED 0.0043 lb/MMBtu
WA PARISH ELECTRIC GENERATING STATION TXPSD-TX-901, PSD-TX-902 & -33M1 10/15/2003
BOILER UNIT 7, COAL & GAS, WAP7 COAL
6700 MMBtu/hr FUEL S CONTENT LIMITED 0.0043 lb/MMBtu
WASHINGTON PARISH ELECTRIC GENERATING STATION TX PSD-TX-33 M1 10/15/2002BOILER STACK, WAP 7, COAL ONLY COAL
6700 MMBtu/hr NONE INDICATED 0.0043 lb/MMBtu
WASHINGTON PARISH ELECTRIC GENERATING STATION TX PSD-TX-33 M1 10/15/2002
BOILER STACK, WAP 7, COAL & NAT GAS
COAL & NAT GAS
6700 MMBtu/hr NONE INDICATED 0.0043 lb/MMBtu
INTERMOUNTAIN POWER GENERATING STATION - UNIT #3 UTDAQE-AN0327010-
04 10/15/2004
PULVERIZED COAL FIRED ELECTRIC GENERATING UNIT
BITUMINOUS OR BLEND 950
BAGHOUSE/FABRIC FILTER AND WET FLUE GAS DESULPHURIZATION 0.0044 lb/MMBtu
INTERMOUNTAIN POWER GENERATING STATION - UNIT #3 UT DAQE-AN0327010-04 10/15/2004
PULVERIZED COAL FIRED ELECTRIC GENERATING UNIT COAL 950
BAGHOUSE/FABRIC FILTER AND WET FLUE GAS DESULPHURIZATION 0.0044 lb/MMbtu
WA PARISH ELECTRIC GENERATING STATION TXPSD-TX-901, PSD-TX-902 & -33M1 10/15/2003
(2) BOILERS, UNITS 5 & 6, WAP5&6, COAL COAL
6750 MMBtu/hr FUEL S CONTENT LIMITED 0.0045 lb/MMBtu
WA PARISH ELECTRIC GENERATING STATION TXPSD-TX-901, PSD-TX-902 & -33M1 10/15/2003
(2) BOILERS, UNITS 5 & 6, COAL & GAS, WAP5&6 COAL
6750 MMBtu/hr FUEL S CONTENT LIMITED 0.0045 lb/MMBtu
WASHINGTON PARISH ELECTRIC GENERATING STATION TX PSD-TX-33 M1 10/15/2002
(2) BOILER STACKS, WAP 5 & 6 , COAL & NAT GAS
COAL & NAT GAS
6750 MMBtu/hr NONE INDICATED 0.0045 lb/MMBtu
WASHINGTON PARISH ELECTRIC GENERATING STATION TX PSD-TX-33 M1 10/15/2002
(2) BOILER STACKS, WAP 5 & 6 , COAL ONLY COAL
6750 MMBtu/hr NONE INDICATED 0.0049 lb/MMBtu
Emission Limit

Prevention of Significant Deterioration Air Permit Application January 17, 2008 Plant Washington, Power4Georgians, LLC
070007.2201 4-90
Table 4-10 RBLC Listings for Sulfuric Acid Mist (H2SO4) Emissions from Pulverized Coal-Fired Boilers (Continued)
Facility NameFacility
State Permit Number Permit Date Process Name FuelThruput
(MW) Control Description
THOROUGHBRED GENERATING STATION KY V-02-001 10/11/2002 BOILER, COAL, (2) COAL 750
PROPER BOILER DESIGN AND CONTROL TECHNOLOGY, ESP, FGD, AND WESP 4.97E-03 lb/MMBtu
THOROUGHBRED GENERATING STATION KY V-02-001 10/11/2002(2) 750 MW PC BOILERS COAL 750
PROPER BOILER DESIGN AND CONTROL TECHNOLOGY, ESP, FGD, AND WESP 0.00497 lb/MMbtu
WPS - WESTON PLANT WI 04-RV-248 10/19/2004
SUPER CRITICAL PULVERIZED COAL ELECTRIC STEAM BOILER (S04, P04) PRB COAL 500 FGD SYSTEM 0.005 lb/MMBtu
OTTER TAIL POWER COMPANY SD N/A 4/1/2006600 MW SCPC BOILER COAL 600 WET SCRUBBER AND BAGHOUSE 0.005 lb/MMBtu
TRIMBLE COUNTY GENERATING STATION KY N/A 7/6/2005SUPER CRITICAL PULVERIZED COAL COAL 750 WET FGD AND WET ESP 0.005 lb/MMbtu
LONGLEAF ENERGY ASSOCIATES, LLC GA 4911-099-0030-P-01-0 5/14/2007 (2) 600 MW UNITS COAL 600 DRY FGD AND BAGHOUSE 0.005 lb/MMbtu
TOQUOP ENERGY, LLC NV AP4911-1146 DRAFT 750 MW PC BOILER COAL 750WET SCRUBBER AND SORBENT INJECTION 0.005 lb/MMbtu
GASCOYNE GENERATING STATION ND PTC 05005 6/3/2005BOILER, COAL-FIRED LIGNITE 620
LIMESTONE IJECTION AND SPRAY DRYER. 0.0061 lb/MMBtu
PLUM POINT ENERGY AR 1995-AOP-R0 8/20/2003BOILER , UNIT 1 - SN-01
SUB-BITUMINOUS COAL 800 DRY FGD/FABRIC FILTER 0.0061 lb/MMBtu
PLUM POINT ENERGY AR 1995-AOP-R0 8/20/2003 BOILER - SN-01
SUB-BITUMINOUS COAL 800 DRY FGD/FABRIC FILTER 0.0061 lb/MMBtu
BULL MOUNTAIN, NO. 1, LLC - ROUNDUP POWER PROJECT MT 3182-00 7/21/2003 BOILER, PC NO. 1 COAL 390DRY FLUE GAS DESULFURIZATION (FGD) - SPRAY DRY ABSORBER 0.0064 lb/MMBtu
BULL MOUNTAIN, NO. 1, LLC - ROUNDUP POWER PROJECT MT 3182-00 7/21/2003 BOILER, PC NO. 2 COAL 390DRY FLUE GAS DESULFURIZATION (FGD) SPRAY DRY ABSORBER 0.0064 lb/MMBtu
MAIDSVILLE WV R14-0024 3/2/2004 BOILER, PCPULVERIZED COAL 600
DRY SOLID INJECTION W/ FABRIC FILTER 0.0075 lb/MMBtu
SANDY CREEK ENERGY STATION TXPSD-TX 1039 AND
70861 7/24/2006PULVERIZED COAL BOILER COAL 800 NONE INDICATED 0.0155 lb/MMBtu
LIMESTONE ELECTRIC GENERATING STATION TX PSD-TX-371 (M3) 5/23/2001
(2) BOILER UNIT 1 & 2 SCRUBBER STACKS, LMS1 & 2 LIGNITE
7863 MMBtu/hr LIMESTONE WET SCRUBBING 0.0312 lb/MMBtu
Emission Limit
Prepared by: PMH 1/10/08 Checked by: JDF 1/10/08

Prevention of Significant Deterioration Air Permit Application January 17, 2008 Plant Washington, Power4Georgians, LLC
070007.2201 4-91
4.3.9 BACT Demonstration for Mercury (Hg) Emissions from the Supercritical Pulverized Coal Boiler
Hg is present in coal in trace amounts, and is released into the main boiler exhaust flue gas during
combustion. According to the USEPA document Control of Mercury Emissions from Coal Fired Electric
Utility Boilers: An Update (2005) the Hg content in coal is approximately 0.1 parts per million (ppm) on
average. Design coal analysis data for the facility indicates that both the PRB and Illinois #6 coals used
in the 50/50 blend at the facility contain an average of approximately 0.09 ppm Hg.
Hg is typically present in the exhaust flue gas in three distinct forms. Hg is typically present in the flue
gas stream as either an elemental Hg vapor, particle bound Hg, or as a vapor of an oxidizer Hg species
(Hg2+). Elemental Hg is typically regarded as the most difficult form of Hg to control. The chemical
form of the Hg present in the flue gas stream can have a significant impact on the effectiveness of the
control strategies employed for control of Hg emissions.
Step 1 – Identify All Control Technologies
Lower Emitting Process or Practice – Coal Refining
Coal refining is a mechanical and thermal process to remove moisture, sulfur, nitrogen, and heavy
metals from coal. Also, as a result of the refining process, the ash content and moisture of the
coal can be lowered, as well as increasing the heat content of the coal. Coal refining processes
include processes still in the research and development stage, such as patented technologies for
conversion of coal to char, a “clean” boiler fuel, and processes already in limited operation such
as the Evergreen Energy, Inc. K-Fuel patented pre-combustion coal refining process. The Alaska
Cowboy Coal Power Consortium has conducted small scale demonstration tests to remove a
portion of the Hg content of the coal. The process removes Hg from the coal utilizing a low
temperature ambient pressure method. However, the process has yet to be demonstrated on a full
scale. A reduction in the Hg content in the coal would reduce the amount of Hg available and
thereby released in the system exhaust gas.

Prevention of Significant Deterioration Air Permit Application January 17, 2008 Plant Washington, Power4Georgians, LLC
070007.2201 4-92
Lower Emitting Process or Practice – Fuel Blending
One of the primary reactions of Hg in the flue gas stream is with gas phase chlorine. Reactions
with gas phase chlorine lead to formation of mercuric chloride (HgCl2), which can be more
effectively removed from the flue gas stream than elemental Hg. Gas phased Hg oxidation is a
slow process, and is dependent on the amount of chlorine present in the flue gas. The amount of
chlorine present in the flue gas is proportional to the amount of chlorine present in the coal being
combusted.
Western sub-bituminous coals, such as PRB coals, typically have much lower chlorine content
than that of Eastern bituminous coals, such as Illinois #6 coal. Therefore, blending of sub-
bituminous and bituminous coals for combustion in the main facility boiler could theoretically
lead to increased gas phase reactions in the flue gas with chlorine, thereby increasing the effective
capture of Hg and reducing Hg emissions. However, limited data is available on the effectiveness
of fuel blending as a control strategy for Hg emissions.
Lower Emitting Process or Practice – Oxidizing Chemicals
Introduction of chlorine or other halogens into the flue gas stream could potentially lead to
increased gas phase reactions in the flue gas, thereby increasing the effective capture of mercury
and reducing mercury emissions. However, limited data is available on the effectiveness of such
systems, and the effectiveness of use of oxidizing chemicals would likely be affected by the type
and quality of coal being combusted, and the type and design of additional pollution control
equipment in use at the facility.
Lower Emitting Process or Practice – Unburned Carbon (UBC) Enhancement
Increasing the unburned carbon in the coal ash could potentially reduce Hg emissions through
decreasing the amount of Hg released into the flue gas stream and by providing carbon present for
reaction with Hg. However, adjusting combustion conditions in the main boiler to increase the
unburned carbon content present in the ash could have detrimental effects to the efficiency and
operation of the main boiler, and could negatively effective emissions of other pollutants, such as
PM and SO2 since effectively more coal would have to be burned.
Prevention of Significant Deterioration Air Permit Application January 17, 2008 Plant Washington, Power4Georgians, LLC
070007.2201 4-93
Lower Emitting Process or Practice – Chemical Additive Injection to SCR
Chemicals added to the SCR control device could potentially increase the oxidation of elemental
Hg and reduce the chemical reduction of oxidized Hg in a wet FGD system. However, limited
information is available to date on the effectiveness of such practices.
Fabric Filter Baghouse and Wet Scrubber
Fabric filter baghouses have been shown to be relatively more effective at control of Hg
emissions than ESP control devices. The amount of control achieved by ESP devices is through
capture of particle bound Hg. Therefore, the effectiveness of an ESP system at control of Hg
emissions would be highly dependent on the amount of particle bound Hg present in the flue gas
stream. Fabric filter baghouses are likely more effective at control of Hg emissions than ESPs
due to the filter cake collecting on the outside of the baghouse filter bags. The filter cake will
enhance gas phase particle reactions, increasing adsorption of oxidized Hg and potentially
oxidation of elemental Hg.
Wet scrubbers systems are often used as FGD systems, where they are used to control emissions
of SO2 from oil and coal combustion sources from industrial sources and electrical utilities. Wet
scrubbers can also be used in the control of Hg emissions. Oxidized Hg, present in such forms as
HgCl2, is an acid gas and water soluble, therefore potentially effectively removed by a wet
scrubber device. However, effectiveness of the wet scrubber in removal of Hg emissions could
be reduced by the chemical reduction of oxidized Hg to elemental Hg in the wet scrubber, leading
to re-emission of Hg. As stated in the USEPA document Control of Mercury Emissions from
Coal Fired Electric Utility Boilers: An Update (2005), “Experience has shown that Hg2+
reduction and reemission may be more difficult to avoid in magnesium-enhanced lime (MEL)
scrubbers due to the much higher sulfite concentration in those systems.”

Prevention of Significant Deterioration Air Permit Application January 17, 2008 Plant Washington, Power4Georgians, LLC
070007.2201 4-94
Spray Dryer Absorber (Dry Scrubber) and Fabric Filter Baghouse
Spray Dryer Absorbers, or dry scrubbers, used in conjunction with fabric filter baghouses have
been found to provide greater than 90 percent control efficiency for mercury with bituminous coal
combustion. However, control efficiencies when burning sub—bituminous coals is
approximately 25 percent, which is much less than the effectiveness of fabric filter baghouses
alone. One possibility is that the Spray Dryer Absorber is effectively removing the chlorine (as
HCl), and that bituminous coals contain enough excess chlorine that chlorine (as HCl) scrubbing
by the Spray Dryer Absorber is not an issue for bituminous coals.
Selective Catalytic Reduction (SCR)
Use of SCR units potentially enhance oxidation of elemental mercury, thus enabling more
effective control of mercury in downstream air pollution control devices.
Sorbent Injection
Unlike the pollution control devices listed above, sorbent injection would be conducted primarily
for removal of Hg emissions, and not achieving Hg removal as a co-benefit (i.e. fabric filter
baghouse). Injection of dry sorbents such as PAC into flue gas streams has been used for control
of Hg emissions from waste combustors, and has been tested at electric utility units in the United
States.
Dry sorbent is typically injected into the ductwork upstream of a PM control device, either an
ESP or fabric filter baghouse. The sorbent is typically pneumatically injected as a powder. The
sorbent provides an active surface for adsorption of Hg present in the flue gas stream, thus
promoting formation of particle bound Hg that can be removed by a particulate matter control
device, such as a fabric filter baghouse. As discussed above, due to the potential secondary
reaction effects of dry sorbents on the filter cake of a fabric filter baghouse, a fabric filter
baghouse would be a more effective PM control device when used in conjunction with a sorbent
injection system for control of Hg emissions.

Prevention of Significant Deterioration Air Permit Application January 17, 2008 Plant Washington, Power4Georgians, LLC
070007.2201 4-95
Step 2 – Eliminate Technically Infeasible Options
Lower Emitting Process or Practice – Coal Refining
Coal refining is a mechanical and thermal process to remove moisture, sulfur, nitrogen, and heavy
metals from coal. Based on the current lack of sufficient supply of coal refining facilities, and the
lack of full scale testing of certain methods such as the Cowboy Coal method, coal refining is not
considered an available technology for H2SO4 emissions reduction. Therefore, coal refining is
determined to be technically infeasible for this project.
Lower Emitting Process or Practice – Fuel Blending
Western sub-bituminous coals, such as PRB coals, typically have much lower chlorine content
than that of Eastern bituminous coals, such as Illinois #6 coal. Therefore, blending of sub-
bituminous and bituminous coals for combustion in the main facility boiler could theoretically
lead to increased gas phase reactions in the flue gas with chlorine, thereby increasing the effective
capture of Hg and reducing Hg emissions. The design criteria for the facility is to burn a 50/50
by weight blend of western sub-bituminous PRB coal and eastern bituminous Illinois #6 coal.
Therefore, fuel blending is considered technically feasible for this project.
Lower Emitting Process or Practice – Oxidizing Chemicals
Introduction of chlorine or other halogens into the flue gas stream could potentially lead to
increased gas phase reactions in the flue gas, thereby increasing the effective capture of Hg and
reducing Hg emissions. However, limited data is available on the effectiveness of such systems,
and the effectiveness of use of oxidizing chemicals would likely be affected by the type and
quality of coal being combusted, and the type and design of additional pollution control
equipment in use at the facility. Therefore, use of oxidizing chemicals is considered technically
infeasible for this project.
Lower Emitting Process or Practice – Unburned Carbon (UBC) Enhancement
Adjusting combustion conditions in the main boiler to increase the unburned carbon content
present in the ash could have detrimental effects to the efficiency and operation of the main
Prevention of Significant Deterioration Air Permit Application January 17, 2008 Plant Washington, Power4Georgians, LLC
070007.2201 4-96
boiler, and could negatively effect emissions of other pollutants, such as PM. Therefore,
unburned carbon enhancement is considered technically infeasible for this project.
Lower Emitting Process or Practice – Chemical Additive Injection to SCR
Chemicals added to the SCR control device could potentially increase the oxidation of elemental
Hg and reduce the chemical reduction of oxidized Hg in a wet FGD system. However, limited
information is available to date on the effectiveness of such practices. Therefore, use of chemical
additive injection to the SCR device is considered technically infeasible for this project.
Fabric Filter Baghouse and Wet Scrubber
BACT evaluations conducted above for the main facility boiler for PM and SO2 emissions
determined that a fabric filter baghouse and wet scrubber were BACT controls to be utilized at
the facility. Fabric filter baghouses and wet scrubbers are in extensive use as pollution control
devices for electric utility boilers. Therefore, use of a fabric filter baghouse in conjunction with a
wet scrubber is considered technically feasible for control of Hg emissions.
Spray Dryer Absorber (Dry Scrubber) and Fabric Filter Baghouse
BACT evaluations conducted above for the main facility boiler for PM and SO2 emissions
determined that a fabric filter baghouse and wet scrubber were BACT controls to be utilized at
the facility. Therefore, use of a fabric filter baghouse in conjunction with a spray dryer absorber
is considered technically infeasible for control of Hg emissions for this project.
Selective Catalytic Reduction (SCR)
Use of SCR units potentially enhance oxidation of elemental Hg, thus enabling more effective
control of mercury in downstream air pollution control devices. Use of an SCR unit has been
proposed as BACT for control of NOX emissions from the facility. Therefore, use of an SCR
system for control of Hg emissions is feasible for this project.

Prevention of Significant Deterioration Air Permit Application January 17, 2008 Plant Washington, Power4Georgians, LLC
070007.2201 4-97
Sorbent Injection
Sorbent injection would be conducted primarily for removal of Hg emissions, and not achieving
Hg removal as a co-benefit (i.e. fabric filter baghouse). Injection of dry sorbents such as PAC
into flue gas streams has been used for control of Hg emissions from waste combustors, and has
been tested at electric utility units in the United States. Therefore, use of sorbent injection for
control of Hg emissions is considered technically feasible for this process.
Step 3 – Rank Remaining Technically Feasible Control Options
Control Effectiveness
The only feasible control technology found during Step 2 not already determined as BACT earlier
in this evaluation (i.e. fabric filter baghouse and wet scrubber) or determined as a design criteria
for the facility (i.e. fuel blending) is use of sorbent injection through use of PAC. Research data
and evaluations conducted to date indicate that a greater than 90 percent reduction in Hg
emissions could be achieved through use of an SCR, PAC sorbent injection system, fabric filter
baghouse, and wet scrubber system.
Energy Impacts
Utilization of a PAC sorbent injection system would be expected to add minimal power demand
to the system compared to other facility pollution control devices. Any significant power demand
for the sorbent injection system would come from power required to handle or process the sorbent
powder.
Environmental Impacts
The main environmental impact associated with use of the activated carbon sorbent injection
system is generation of solid waste materials now containing small amounts of Hg. A study by
Consol Energy, The Evolution of Mercury From Coal Combustion Materials and By-products
(2003) evaluated the fate of Hg collected on fly ash, which are materials collected by the
particulate matter control devices, on flue gas desulfurization solids, and on bottom ash materials.
The objective of the study was to address the concern of Hg evolution into the ecosystem
following disposal of waste materials from a coal fired power plant potentially containing Hg.

Prevention of Significant Deterioration Air Permit Application January 17, 2008 Plant Washington, Power4Georgians, LLC
070007.2201 4-98
Samples were taken from fly ash, FGD sludge, and bottom ash waste streams and analyzed for
leachable Hg, or that Hg which would be released into the surrounding soils following disposal.
Data showed less than the analytical detection limit of 1.0 parts per billion (ppb) of Hg in the
filtrates of all fly ash, FGD sludge, and bottom ash samples analyzed. In order for a waste stream
to be considered a hazardous waste due to the concentration of Hg, it must contain greater than
200 ppb leachable Hg.
Groundwater samples were also taken in areas of active FGD sludge disposal and ash
impoundments. Groundwater samples analyzed were found to contain less than the Hg analytical
detection limit of 1 ppb.
Economic Impacts
Utilizing the USEPA Air Pollution Control Cost Manual, and data provided in the USEPA
document Control of Mercury Emissions from Coal Fired Electric Utility Boilers: An Update
and the DOE report Preliminary Cost Estimate of Activated Carbon Injection for Controlling
Mercury Emissions from an Un-Scrubbed 500 MW Coal-Fired Power Plant, the total annual cost
of a PAC sorbent injection system would be a minimum of approximately $1.6 million. At this
cost, the $/ton cost effectiveness of the system would be much greater than $10,000/ton, at a cost
of greater than $60,000/ton. The $/ton cost effectiveness of the system is so high due to the low
concentration of Hg present (0.09 ppm) in the design coal for the plant, leading to a low
uncontrolled emission rate of Hg. However, due to the underlying environmental concerns
regarding emissions of Hg, requirements under the CAMR and NSPS Subpart HHHH, use of an
activated carbon sorbent injection system is considered economically feasible for this project.
Step 4 – Evaluate Remaining Control Technologies
Utilization of an activated carbon sorbent injection system, in conjunction with collateral benefits
from use of additional pollution control devices determined as BACT for differing pollutants, is
chosen as the top control option for control of Hg emissions.
Energy Impacts
Utilization of a PAC sorbent injection system would be expected to add minimal power demand
to the system compared to other facility pollution control devices. Any significant power demand
Prevention of Significant Deterioration Air Permit Application January 17, 2008 Plant Washington, Power4Georgians, LLC
070007.2201 4-99
for the sorbent injection system would come from power required to handle or process the sorbent
powder. No energy impacts would preclude the use of activated carbon sorbent injection.
Environmental Impacts
The main environmental impact associated with use of the activated carbon sorbent injection
system is generation of solid waste materials now containing small amounts of Hg. As discussed
above, study data has indicated that environmental impacts from disposal of solid waste materials
from air pollution control equipment potentially containing Hg at a coal-fired power plant are not
a direct environmental concern for this project. Therefore, environmental impacts from use of
activated carbon sorbent injection do not pose a concern.
Economic Impacts
The $/ton cost effectiveness of an activated carbon sorbent injection system is so high due to the
low concentration of Hg present (0.09 ppm) in the design coal for the plant, leading to a low
uncontrolled emission rate of Hg. However, due to the underlying environmental concerns
regarding emissions of Hg, and regulatory requirements under the CAMR and NSPS Subpart
HHHH, use of an activated carbon sorbent injection system is considered economically feasible
for this project. Therefore, economic concerns do not preclude the use of activated carbon
sorbent injection for this project.
Step 5 – Selection of BACT
A summary of recent mercury BACT evaluations conducted for similar projects can be found in Table 4-
11 below. Utilization of an activated carbon sorbent injection system is proposed as BACT for the main
facility boiler. An emission limit of 15 x 10-6 lb/MW-hr has been deemed appropriate based on the level
of control and emission limits proposed as BACT on similar recent projects, such as the Longleaf Energy
Associates, LLC facility in Georgia.

Prevention of Significant Deterioration Air Permit Application January 17, 2008 Plant Washington, Power4Georgians, LLC
070007.2201 4-100
Table 4-11 RBLC Listings for Mercury (Hg) Emissions from Pulverized Coal-Fired Boilers
Facility NameFacility
State Permit NumberPermit Date Process Name Fuel
Thruput (MW) Control Description
Emission Limit
Emission Limit Unit
WPS - WESTON PLANT WI 04-RV-248 10/19/2004
SUPER CRITICAL PULVERIZED COAL ELECTRIC STEAM BOILER (S04, P04) PRB COAL 500
FABRIC FILTER BAGHOUSE, SORBENT INJECTION OPTIMIZATION STUDY 1.70E-06 lb/MMBtu
MIDAMERICAN ENERGY COMPANY IA PROJECT 02-528 6/17/2003 CBEC 4 BOILER PRB COAL7675
MMBtu/hr ACTIVATED CARBON 1.70E-06 lb/MMBtu
MAIDSVILLE WV R14-0024 3/2/2004 BOILER, PC PULVERIZED COAL 600
SCR, DRY SOLID INJECTION W/ FABRIC FILTER, AND WET LIMESTONE FORCED OXIDATION 2.39E-06 lb/MMBtu
THOROUGHBRED GENERATING STATION KY V-02-001 10/11/2002 BOILER, COAL, (2) COAL 750 ESP, WESP, WFGD 3.21E-06 lb/MMBtu
SANTEE COOPER CROSS GENERATING STATION SC 0420-0030-CI 2/5/2004 BOILER, NO. 3 AND NO. 4 BITUMINOUS COAL 660
ESP/FLUE DESULFURIZATION/LOW NOX BURNERS, AND SCR COMBINED 3.60E-06 lb/MMBtu
CITY UTILITIES OF SPRINGFIELD - SOUTHWEST POWER STATION MO 122004-007 12/15/2004 PULVERIZED COAL FIRED BOILER COAL 798 NONE INDICATED 7.54E-06 lb/MMBtuLONGLEAF ENERGY ASSOCIATES, LLC GA 4911-099-0030-P-01-0 5/14/2007 (2) 600MW UNITS COAL 600 NONE INDICATED 1.50E-05 lb/MW-hr
LIMESTONE ELECTRIC GENERATING STATION TX PSD-TX-371 (M3) 5/23/2001(2) BOILER UNIT 1 & 2 SCRUBBER STACKS, LMS1 & 2 LIGNITE
7863 MMBtu/hr NONE INDICATED 5.09E-05 lb/MMBtu
SANDY CREEK ENERGY STATION TX PSD-TX 1039 AND 70861 7/24/2006 PULVERIZED COAL BOILER COAL 800 NONE INDICATED 1.15E-04 lb/MMBtu
WA PARISH ELECTRIC GENERATING STATION TX PSD-TX-901, PSD-TX-902 & -33M1 10/15/2003 BOILER UNIT 7, COAL, WAP7 COAL6700
MMBtu/hr NONE INDICATED 2.78E-04 lb/MMBtu
WA PARISH ELECTRIC GENERATING STATION TX PSD-TX-901, PSD-TX-902 & -33M1 10/15/2003BOILER UNIT 7, COAL & GAS, WAP7 COAL
6700 MMBtu/hr NONE INDICATED 2.78E-04 lb/MMBtu
WASHINGTON PARISH ELECTRIC GENERATING STATION TX PSD-TX-33 M1 10/15/2002BOILER STACK, WAP 7, COAL ONLY COAL
6700 MMBtu/hr NONE INDICATED 2.78E-04 lb/MMBtu
WASHINGTON PARISH ELECTRIC GENERATING STATION TX PSD-TX-33 M1 10/15/2002BOILER STACK, WAP 7, COAL & NAT GAS COAL & NAT GAS
6700 MMBtu/hr NONE INDICATED 2.78E-04 lb/MMBtu
WA PARISH ELECTRIC GENERATING STATION TX PSD-TX-901, PSD-TX-902 & -33M1 10/15/2003(2) BOILERS, UNITS 5 & 6, WAP5&6, COAL COAL
6750 MMBtu/hr NONE INDICATED 2.88E-04 lb/MMBtu
WA PARISH ELECTRIC GENERATING STATION TX PSD-TX-901, PSD-TX-902 & -33M1 10/15/2003(2) BOILERS, UNITS 5 & 6, COAL & GAS, WAP5&6 COAL
6750 MMBtu/hr NONE INDICATED 2.88E-04 lb/MMBtu
WASHINGTON PARISH ELECTRIC GENERATING STATION TX PSD-TX-33 M1 10/15/2002(2) BOILER STACKS, WAP 5 & 6 , COAL & NAT GAS COAL & NAT GAS
6750 MMBtu/hr NONE INDICATED 2.88E-04 lb/MMBtu
WASHINGTON PARISH ELECTRIC GENERATING STATION TX PSD-TX-33 M1 10/15/2002(2) BOILER STACKS, WAP 5 & 6 , COAL ONLY COAL
6750 MMBtu/hr NONE INDICATED 3.16E-04 lb/MMBtu
Prepared by: PMH 1/10/08 Checked by: JDF 1/10/08

Prevention of Significant Deterioration Air Permit Application January 17, 2008 Plant Washington, Power4Georgians, LLC
070007.2201 4-101
4.4 Auxiliary Boiler
This section contains the BACT analysis for the planned 240 MMBtu/hr auxiliary boiler unit planned for
use at the facility. A summary of the BACT results for the auxiliary boiler is found in Table 4-2 above.
Pollutants which exist in deminimis quantities in the boiler fuel (No. 2 fuel oil), including Lead, Mercury,
and Fluorides (as HF) were not evaluated due to their low level of estimated annual emissions (< 2 lb/yr).
If required, BACT emission levels for these pollutants will be established as the pollutant emission
factors established in AP-42, Fifth Edition, Volume 1, Chapter 1.3.
4.4.1 BACT Demonstration for Particulate Matter (PM) Emissions from the Auxiliary Boiler
PM emissions can be affected by the grade of fuel oil fired in a boiler. PM emissions from oil
fired boilers are primarily composed of particles resulting from the incomplete combustion of
the oil, and are not correlated to the ash or sulfur content of the oil. Combustion of lighter
distillate oil results in lower PM formation than combustion of heavier residual oils.
Step 1 – Identify All Control Technologies
Lower Emitting Process or Practice – Fuel Selection
The only applicable lower emitting process or practice would be the selection of low sulfur
distillate fuel oil (0.05%) for fuel for the auxiliary boiler. The use of light distillate fuel oil for
combustion would lead to lower PM emissions than use of heavier residual oils.
Fabric Filter Baghouse
Fabric filters are used for PM control in a wide variety of industries, including use as PM
control on PC fired boilers, and are capable of achieving control efficiencies of 99 percent or
greater. According to the USEPA’s fabric filter fact sheet (2003) “flue gas is passed through a
tightly woven or felted fabric, causing PM in the flue gas to be collected on the fabric by
sieving and other mechanisms. Fabric filters may be in the form of sheets, cartridges, or bags,
with a number of the individual fabric filter units housed together in a group. Bags are the
most common type of fabric filter. The dust cake that forms on the filter from the collected PM
can significantly increase collection efficiency. Fabric filters are frequently referred to as
baghouses because the fabric is usually configured in cylindrical bags. Bags may be 6 to 9 m

Prevention of Significant Deterioration Air Permit Application January 17, 2008 Plant Washington, Power4Georgians, LLC
070007.2201 4-102
(20 to 30 ft) long and 12.7 to 30.5 centimeters (cm) (5 to 12 inches) in diameter. Groups of
bags are placed in isolable compartments to allow cleaning of the bags or replacement of some
of the bags without shutting down the entire fabric filter.”
Advantages of fabric filters can include the following:
4. Can provide high collection efficiencies on both coarse and fine (submicron) particulates.
5. Fabric filters are available in a large number of configurations and system designs,
allowing for high flexibility in design.
6. Collected material is collected dry for subsequent processing or disposal.
Some disadvantages of fabric filters include:
4. Fabric filters can have relatively high maintenance requirements (filter bag replacement).
5. Concentrations of dusts in the collector can represent a fire or explosion hazard if a spark or
flame is somehow introduced.
6. The units cannot be operated in high moisture gas streams; moisture can cause caking or
plugging of the fabric filter.
Dry Electrostatic Precipitator (ESP)
Dry ESPs are used in a wide variety of source categories for control of PM emissions, and are
capable of achieving control efficiencies of 99 percent or greater. The following is an excerpt
from the USEPA’s dry ESP fact sheet (2003):
“An ESP is a particulate control device that uses electrical forces to move particles entrained
within an exhaust stream onto collector plates. The entrained particles are given an electrical
charge when they pass through a corona, a region where gaseous ions flow. Electrodes in the
center of the flow lane are maintained at high voltage and generate the electrical field that
forces the particles to the collector walls. In dry ESPs, the collectors are knocked, or

Prevention of Significant Deterioration Air Permit Application January 17, 2008 Plant Washington, Power4Georgians, LLC
070007.2201 4-103
“rapped”, by various mechanical means to dislodge the particulate, which slides downward
into a hopper where they are collected. The hopper is evacuated periodically, as it becomes
full. Dust is removed through a valve into a dust handling system, such as a pneumatic
conveyor, and is then disposed of in an appropriate manner.”
Advantages of dry ESPs include the following:
4. Are capable of very high efficiencies, even for small particulate sizes.
5. Can be designed for a wide range of gas temperatures, and can handle high temperatures
(up to 1300o F).
6. Relatively large gas flow rates can be effectively handled.
Some disadvantages of dry ESPs include the following:
4. High capital costs and high maintenance items, such as the wire discharge electrodes.
5. Generally not suited for processes that are highly variable because they are sensitive to
fluctuations in gas stream conditions (temperature, flow rate, particulate loading, etc.).
6. Fly ash from the combustion of low sulfur coal typically has a high resistivity, and thus is
difficult to collect.
Wet Electrostatic Precipitator (WESP)
A WESP is commonly used in situations where a dry ESP is not viable, such as when the
material to be collected is wet, flammable, or has a high resistivity. WESPs are commonly
used by the wood products and metallurgical industries, and can achieve PM control
efficiencies of greater than 99 percent. The following is an excerpt from the USEPA’s wet ESP
fact sheet (2003).
“An ESP is a particulate control device that uses electrical forces to move particles entrained
within an exhaust stream onto collector plates. The entrained particles are given an electrical
Prevention of Significant Deterioration Air Permit Application January 17, 2008 Plant Washington, Power4Georgians, LLC
070007.2201 4-104
charge when they pass through a corona, a region where gaseous ions flow. Electrodes in the
center of the flow lane are maintained at high voltage and generate the electrical field that
forces the particles to the collector walls. In wet ESPs, the collectors are either intermittently
or continuously washed by a spray of liquid, usually water. The collection hoppers used by dry
ESPs are replaced with a drainage system. The wet effluent is collected, and often treated on-
site.”
Advantages of WESPs include the following:
5. Are capable of very high efficiencies, even for low particulate sizes.
6. Relatively large gas flow rates can be effectively handled.
7. WESPs can collect sticky particles, mists, and highly resistive or explosive dusts due to the
humid atmosphere from washing in the ESP.
8. Continuous or intermittent washing with a liquid eliminates the reentrainment of particles,
which dry ESPs are subject to through the rapping process.
Some disadvantages of WESPs include the following:
5. High capital costs and high maintenance items, such as the wire discharge electrodes.
6. Generally not suited for processes that are highly variable because they are sensitive to
fluctuations in gas stream conditions (temperature, flow rate, particulate loading, etc.).
7. WESPs add the complexity of a wash system, and the fact that the resulting slurry must be
handled more carefully than a dry product, and can require treatment.
8. Wet ESPs are typically operated at gas stream temperatures under 190 degrees F, and
usually must be constructed of non-corrosive materials.

Prevention of Significant Deterioration Air Permit Application January 17, 2008 Plant Washington, Power4Georgians, LLC
070007.2201 4-105
Step 2 – Eliminate Technically Infeasible Options
Lower Emitting Process or Practice – Fuel Selection
The combustion of light distillate fuel oils results in lower levels of PM emissions than
combustion of heavier residual fuel oils. Fuel selection is considered technically feasible for
this analysis.
Fabric Filter Baghouse
A fabric filter baghouse is a proven technology in the control of PM/PM10 emissions. Data
exists which indicates that oily mist from the combustion of fuel oil can clog the filter bags,
thus affecting the performance and efficiency of the fabric filter baghouse. However, this
technology has been demonstrated on solid fuel boilers and is considered technically feasible.
Dry Electrostatic Precipitator (ESP)
A dry ESP is a proven technology in the control of PM/PM10 emissions. This technology is
considered technically feasible.
Wet Electrostatic Precipitator (ESP)
A WESP is a proven technology in the control of PM/PM10 emissions. This technology is
considered technically feasible.
Step 3 – Rank Remaining Technically Feasible Control Options
The combination of the low duty cycle, 10 percent, in conjunction with the placement and
configuration of the auxiliary boiler at a power plant have generally eliminated consideration of
add on emission control devices. Since the primary purpose of the auxiliary boiler is for start
up and shut downs of the PC boiler, it operational schedule generally precludes the use of
onsite control systems.

Prevention of Significant Deterioration Air Permit Application January 17, 2008 Plant Washington, Power4Georgians, LLC
070007.2201 4-106
Step 4 – Evaluate Remaining Control Technologies
Fabric filter baghouses and ESPs both provide the maximum degree of emissions reduction of
PM emissions from an auxiliary boiler unit. Both controls do not have any significant collateral
environmental impacts. WESP have a slight disadvantage when compared to fabric filter
baghouses and dry ESPs, in that they produce a wet waste product, which can lead to additional
treatment and disposal costs than with dry systems.
Energy Impacts
Although a fabric filter baghouse would require additional auxiliary power to overcome the
pressure drop across the fabric filter bags, such energy requirements would not be enough to
preclude use of a fabric filter baghouse. The energy requirements needed for operation of an
electrostatic precipitator would be significant and represent an adverse energy impact.
Environmental Impacts
There are no major environmental issues that would preclude the use of a fabric filter baghouse
or dry ESP. Solid waste materials collected by the fabric filter baghouses and dry ESPs would
be disposed of in accordance with State and Federal regulations. WESPs would also create a
liquid waste stream.
Economic Impacts
Due to the inherently low amount of PM emissions generated from light distillate fuel oil
combustion compared to the significant annualized costs of PM control technologies, cost
effectiveness for a fabric filter baghouse or an ESP for an auxiliary boiler would be
significantly higher than $10,000/ton, and not cost effective. Therefore, the use of PM control
technologies on a light distillate fuel oil fired boiler would lead to a significant negative
economic impact.

Prevention of Significant Deterioration Air Permit Application January 17, 2008 Plant Washington, Power4Georgians, LLC
070007.2201 4-107
Step 5 – Selection of BACT
A summary of recent PM BACT evaluations conducted for similar projects can be found in
Table 4-12 below. BACT for PM emissions is proposed as use of low sulfur distillate fuel oil
with an emission limit of 0.02 lb/MMBtu total PM/PM10. This level of control and emission
limit has been proposed as BACT on recent similar projects.

Prevention of Significant Deterioration Air Permit Application January 17, 2008 Plant Washington, Power4Georgians, LLC
070007.2201 4-108
Table 4-12 RBLC Listings for PM Emissions from Distillate Oil Boilers Up to 250 MMBtu/hr
Facility Name State Permit Number Permit Date Process Name Throughput Throughput Unit Control DescriptionEmissions
LimitEmission Limit
unitPLUM POINT ENERGY AR 1995-AOP-R0 8/20/2003 AUXILLARY BOILER 175 MMBTU/H LOW ASH FUEL 0.0071 LB/MMBTUPLUM POINT ENERGY AR 1995-AOP-R0 8/20/2003 AUXILIARY BOILER 175 MMBTU LOW ASH FUEL 0.0071 LB/MMBTUVCU EAST PLANT VA VA-50126 3/31/2003 BOILER, #2 FUEL OIL, (3) 150.6 MMBTU/H NONE INDICATED 0.01 LB/MMBTUVCU EAST PLANT VA 50126 3/31/2003 BOILER - DISTILLATE 150 MMBTU GOOD COMBUSTION PRACTICES. 0.011 LB/MMBTUMILLER BREWING COMPANY - TRENTON OH 14-05515 5/27/2004 BOILER (2), NO. 2 FUEL OIL 238 MMBTU/H BAGHOUSE 0.02 LB/MMBTUVCU EAST PLANT VA VA-50126 3/31/2003 BOILER, #2 FUEL OIL, (3) 150.6 MMBTU/H NONE INDICATED 0.02 LB/MMBTUALABAMA POWER COMPANY AL AND -X002 12/17/1997 BOILER, FUEL OIL (NEW/USED) 190 MMBTU/H NONE INDICATED 0.02 LB/MMBTUVCU EAST PLANT VA 50126 3/31/2003 BOILER - DISTILLATE 150 MMBTU GOOD COMBUSTION PRACTICES. 0.022 LB/MMBTUPINE BLUFF ENERGY LLC - PINE BLUFF ENERGY CENTER AR 1822-AOP-R0 5/5/1999 BOILER, FUEL OIL 346 MMBTU/H COMBUSTION PRACTICES 0.03 LB/MMBTUVCU EAST PLANT VA 50126 3/31/2003 BOILER - NO 6 FUEL OIL 150 MMBTU/H GOOD COMBUSTION PRACTICES. 0.05 LB/MMBTUVCU EAST PLANT VA VA-50126 3/31/2003 BOILER, #6 FUEL OIL, (3) 150.6 MMBTU/H NONE INDICATED 0.05 LB/MMBTUVCU EAST PLANT VA VA-50126 3/31/2003 BOILER, #6 FUEL OIL, (3) 150.6 MMBTU/H NONE INDICATED 0.06 LB/MMBTULSP - COTTAGE GROVE, L.P. MN 16300087-001 11/10/1998 BOILERS, AUXILIARY, 2, FUEL OIL 104 MMBTU/H HAS A NOX PREDICTIVE EMISSION 0.061 LB/MMBTULSP - COTTAGE GROVE, L.P. MN 16300087-001 11/10/1998 BOILERS, AUXILIARY, 2, FUEL OIL 104 MMBTU/H OF THE TIME. BOILERS ARE LIMITED 0.061 LB/MMBTUVCU EAST PLANT VA 50126 3/31/2003 BOILER - NO 6 FUEL OIL 150 MMBTU/H GOOD COMBUSTION PRACTICES. 0.063 LB/MMBTUTECO-POLK POWER STATION/MULBERRY FL PSD-FL-194 12/23/2002 BOILER, NO 2 FUEL OIL 120 MMBTU/H NONE INDICATED 0.1 LB/MMBTUMILLER BREWING COMPANY - TRENTON OH 14-05515 5/27/2004 BOILER (2), NO. 6 FUEL OIL 238 MMBTU/H BAGHOUSE 0.125 LB/MMBTUALABAMA POWER COMPANY AL AND -X002 12/17/1997 BOILER, FUEL OIL (NEW/USED) 190 MMBTU/H NONE INDICATED 0.15 LB/MMBTUINLAND PAPERBOARD AND PACKAGING, INC. - ROME LINERBOARD MILL GA 01-4 10/13/2004 BOILER, OIL-FIRED 192 MMBTU/H NONE INDICATED 0.5 LB/MMBTUOKEELANTA CORPORATION SUGAR MILL FL PSD-FL-169A 3/31/2003 BOILER, FUEL OIL 211 MMBTU/H SULFUR (0.05% S BY WT) DISTILLATE - -
Prepared by: JDC 1/10/08 Checked by: JDF 1/10/08

Prevention of Significant Deterioration Air Permit Application January 17, 2008 Plant Washington, Power4Georgians, LLC
070007.2201 4-109
4.4.2 BACT Demonstration for NOx Emissions from the Auxiliary Boiler
NOX is a by-product of the combustion process and generally refers to both NO and NO2. NOX is formed
by the oxidation of nitrogen contained in the fuel are oxidized in the combustion process. Additionally,
NOX can be formed when elemental nitrogen and elemental oxygen are subjected to high temperatures in
the combustion process to form thermal NOX. Temperature, residence time, excess air and nitrogen
availability all impact the generation of NOX.
Step 1 – Identify All Control Technologies
Combustion Controls
The use of combustion controls for NOX emissions would be a lower pollutant emitting process,
through managing the combustion process through the use of low NOX burners to optimize the
combustion process and reduce the generation of NOX emissions. Important factors in proper
combustion include proper fuel residence time, proper air to fuel ratios in the combustion
chamber, and consistent proper temperatures in the combustion chamber.
Add-On Controls
The use of add on controls for NOX control is discussed thoroughly in section 4.1. The
potential add on controls for the auxiliary boiler include:
• Low NOX Burners (already discussed in the combustion controls section) • Selective Catalytic reduction (SCR) • Selective Non-Catalytic Reduction (SNCR) • SCONOx • Flue Gas Recirculation (FGR)
Step 2 – Eliminate Technically Infeasible Options
The use of add-on technology for control of NOX emissions from the auxiliary boiler unit is not
technically feasible. Use of add-on controls such as SCR, SNCR, or SCONOx has not been
demonstrated in practice for control of NOX emissions from auxiliary boilers. These controls
require steady state operations, which do not occur for units that are utilized for minimized
timer periods such as auxiliary boilers. Combustion controls, such as the proper combustion
chamber with low NOX burners in conjunction with flue gas recirculation are demonstrated and

Prevention of Significant Deterioration Air Permit Application January 17, 2008 Plant Washington, Power4Georgians, LLC
070007.2201 4-110
proven techniques for the reduction of NOX emissions. Combustion controls are considered a
demonstrated technology for auxiliary boiler NOX emissions controls, and therefore considered
technically feasible under the BACT evaluation process.
Step 3 – Rank Remaining Technically Feasible Control Options
Combustion controls are the only feasible technology for control of NOX emissions.
Combustion controls are designed to optimize the emissions of NOX from an auxiliary boiler.
Therefore, there are no energy or environmental impacts associated with the implementation of
combustion controls. Since combustion controls are now a standard part of the design process
of a boiler, there are no economic impacts associated with the implementation of combustion
controls.
Step 4 – Evaluate Remaining Control Technologies
There are no energy, environmental, or economic impacts associated with the use of
combustion controls which precludes the use of combustion controls as BACT for NOX
emissions for an auxiliary boiler.
Step 5 – Selection of BACT
A summary of recent NOX BACT evaluations conducted for similar projects can be found in
Table 4-13 below. The proposed BACT for NOX emissions was chosen as the implementation
of combustion controls including low NOX burners and flue gas recirculation with an emission
limit of 0.1 lb/MMBtu. This level of emissions has been chosen as BACT on recent similar
projects. Facilities with lower emission limits are utilizing a different grade of fuel, or have not
yet been demonstrated in practice.

Prevention of Significant Deterioration Air Permit Application January 17, 2008 Plant Washington, Power4Georgians, LLC
070007.2201 4-111
Table 4-13 RBLC Listings for Nitrogen Oxide (NOX) Emissions from Distillate Oil Boilers Up To 250 MMBtu/hr
Facility Name State Permit Number Permit Date Process Name Throughput Throughput Unit Control DescriptionEmissions
LimitEmission Limit
UnitPLUM POINT ENERGY AR 1995-AOP-R0 8/20/2003 AUXILLARY BOILER 175 MMBTU/H LOW ASH FUEL 0.1 LB/MMBTU
TECO-POLK POWER STATION/MULBERRY FL PSD-FL-194 12/23/2002 BOILER NO 2 FUEL OIL 120 MMBTU/H LOW-NOX BURNERS 0.1 LB/MMBTU
LSP - COTTAGE GROVE, L.P. MN 16300087-001 11/10/1998 BOILERS, AUXILIARY, 2, FUEL OIL 104 MMBTU/H
LOW NOX BURNER. EACH BURNER HAS A NOX PREDICTIVE EMISSION MONITORING SYSTEM. 0.12 LB/MMBTU
ARCHER DANIELS MIDLAND CO. - NORTHERN SUN VEG. OIL ND PTC98002 7/9/1998 BOILER, KEWAUNEE 13 MMBTU/H NONE INDICATED 0.14 LB/MMBTU
PINE BLUFF ENERGY LLC - PINE BLUFF ENERGY CENTER AR 1822-AOP-R0 5/5/1999 BOILER, FUEL OIL 346 MMBTU/H
CLEAN FUELS AND GOOD COMBUSTION PRACTICES 0.14 LB/MMBTU
BULL MOUNTAIN, NO. 1, LLC - ROUNDUP POWER PROJECT MT 3182-00 7/21/2003 BOILERS, AUXILIARY, 2, FUEL OIL 117 MMBTU/H
LOW NOX BURNERS, HOURLY OPERATION LIMIT 0.169 LB/MMBTU
VCU EAST PLANT VA VA-50126 3/31/2003 BOILER, #2 FUEL OIL, (3) 150.6 MMBTU/H NONE INDICATED 0.2 LB/MMBTU
VCU EAST PLANT VA 50126 3/31/2003 BOILER - DISTILLATE 150 MMBTU/HGOOD COMBUSTION PRACTICES. 0.2 LB/MMBTU
PLUM POINT ENERGY AR 1995-AOP-R0 8/20/2003 AUXILIARY BOILER 175 MMBTU/H LOW ASH FUEL 0.4 LB/MMBTUMILLER BREWING COMPANY - TRENTON OH 14-05515 5/27/2004 BOILER (2), NO. 2 FUEL OIL 238 MMBTU/H BAGHOUSE 0.7 LB/MMBTU
Prepared by: JDC 1/10/08 Checked by: JDF 1/10/08

Prevention of Significant Deterioration Air Permit Application January 17, 2008 Plant Washington, Power4Georgians, LLC
070007.2201 4-112
4.4.3 BACT Demonstration for Carbon Monoxide (CO) Emissions from the Auxiliary Boiler
CO is a by-product of the incomplete combustion of carbon in the fuel source, in this case coal, in the
combustion unit in use. Control of CO is usually accomplished by providing proper fuel residence time
and proper combustion conditions. However, factors to reduce CO emissions, such as addition of excess
air to improve combustion, can lead to a resultant increase in NOX emissions through thermal formation
of NOX emissions. Therefore, any evaluation of the reduction of CO emissions needs to take into account
the potential secondary impacts in reductions of CO emissions.
Step 1 – Identify All Control Technologies
Combustion Controls
The use of combustion controls for CO emissions would be a lower pollutant emitting process,
through managing the combustion process to optimize the combustion process and reduce the
generation of CO emissions. Important factors in proper combustion include proper fuel
residence time, proper air to fuel ratios in the combustion chamber, and consistent proper
temperatures in the combustion chamber. CO formation will be limited through use of a
properly designed combustion chamber with adequate controls to regulate the combustion
process. Proper maintenance is also necessary for proper combustion control. Proper operation
of fuel feed systems, fans, system dampers, and other equipment will assist in minimization of
CO emissions. However, as stated above, careful consideration is necessary in the process of
combustion controls, since increasing the combustion temperature or oxygen concentration in
the combustion chamber would decrease CO emissions, it would likely increase the formation
of thermal NOX, and increase overall NOX emissions.
Add-On Controls
No effective add-on controls currently exist for CO emissions from a boiler. Use of control
technologies such as afterburners would use large quantities of natural gas and simply covert
CO to CO2. Use of afterburners, and other control devices such as catalytic oxidation or flares,
have not been demonstrated in practice in auxiliary boiler units. Any such control devices
would lead to negative secondary environmental impacts (more NOX emissions).

Prevention of Significant Deterioration Air Permit Application January 17, 2008 Plant Washington, Power4Georgians, LLC
070007.2201 4-113
Step 2 – Eliminate Technically Infeasible Options
As discussed above, the use of add-on controls for control of CO emissions for the auxiliary
boiler unit is not technically feasible. Use of add-on controls such as flares, afterburners,
catalytic oxidation, and external thermal oxidation have not been demonstrated in practice for
control of CO emissions from auxiliary boilers. Combustion controls, such as the proper
combustion chamber and system design, and proper operation and maintenance, are
demonstrated and proven techniques for the reduction of CO emissions. Combustion controls
are considered a demonstrated technology for auxiliary boiler CO emissions controls, and
therefore considered technically feasible under the BACT evaluation process.
Step 3 – Rank Remaining Technically Feasible Control Options
Combustion controls are the only feasible technology for control of CO emissions. Combustion
controls are designed to optimize the emissions of CO (and consequently NOX) from an
auxiliary boiler. Therefore, there are no energy or environmental impacts associated with the
implementation of combustion controls. Since combustion controls are now a standard part of
the design process of a boiler, there are no economic impacts associated with the
implementation of combustion controls.
Step 4 – Evaluate Remaining Control Technologies
There are no energy, environmental, or economic impacts associated with the use of
combustion controls which precludes the use of combustion controls as BACT for CO
emissions for an auxiliary boiler.
Step 5 – Selection of BACT
A summary of recent CO BACT evaluations conducted for similar projects can be found in
Table 4-14 below. BACT for CO emissions is chosen as the implementation of combustion
controls and an emission limit of 0.04 lb/MMBtu. This level of BACT is comparable to the
level chosen for recent similar projects.
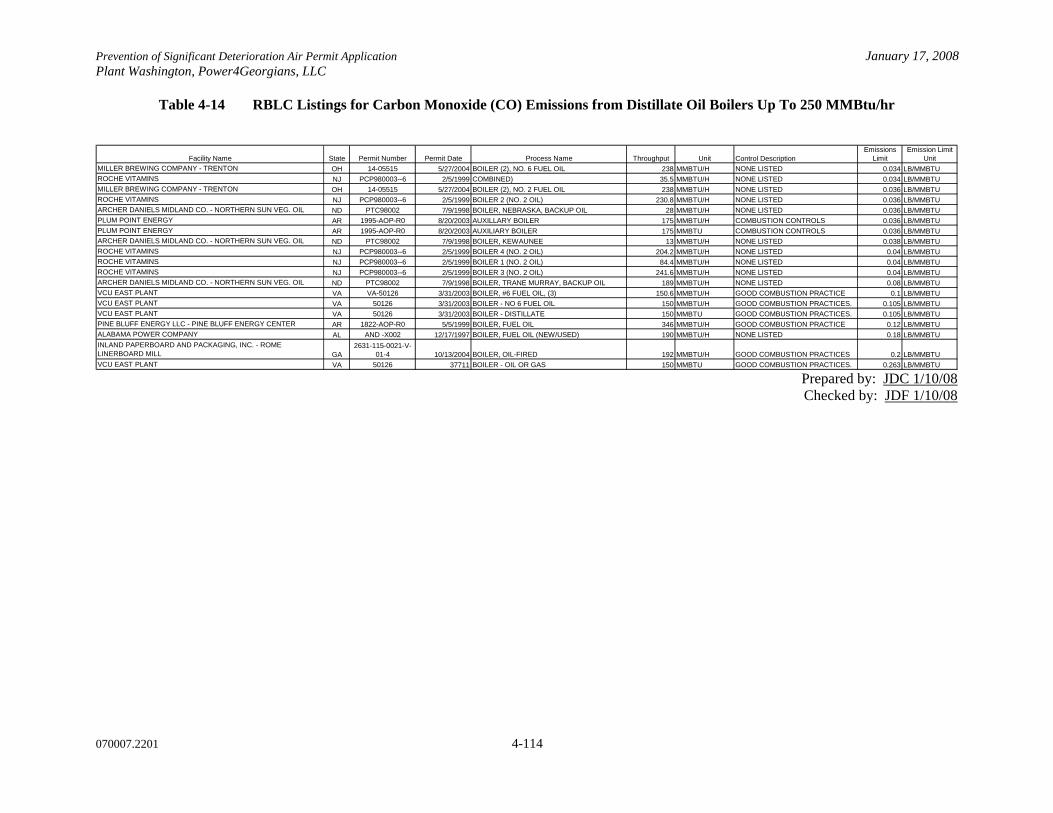
Prevention of Significant Deterioration Air Permit Application January 17, 2008 Plant Washington, Power4Georgians, LLC
070007.2201 4-114
Table 4-14 RBLC Listings for Carbon Monoxide (CO) Emissions from Distillate Oil Boilers Up To 250 MMBtu/hr
Facility Name State Permit Number Permit Date Process Name Throughput Unit Control DescriptionEmissions
LimitEmission Limit
UnitMILLER BREWING COMPANY - TRENTON OH 14-05515 5/27/2004 BOILER (2), NO. 6 FUEL OIL 238 MMBTU/H NONE LISTED 0.034 LB/MMBTUROCHE VITAMINS NJ PCP980003--6 2/5/1999
(COMBINED) 35.5 MMBTU/H NONE LISTED 0.034 LB/MMBTU
MILLER BREWING COMPANY - TRENTON OH 14-05515 5/27/2004 BOILER (2), NO. 2 FUEL OIL 238 MMBTU/H NONE LISTED 0.036 LB/MMBTUROCHE VITAMINS NJ PCP980003--6 2/5/1999 BOILER 2 (NO. 2 OIL) 230.8 MMBTU/H NONE LISTED 0.036 LB/MMBTUARCHER DANIELS MIDLAND CO. - NORTHERN SUN VEG. OIL ND PTC98002 7/9/1998 BOILER, NEBRASKA, BACKUP OIL 28 MMBTU/H NONE LISTED 0.036 LB/MMBTUPLUM POINT ENERGY AR 1995-AOP-R0 8/20/2003 AUXILLARY BOILER 175 MMBTU/H COMBUSTION CONTROLS 0.036 LB/MMBTUPLUM POINT ENERGY AR 1995-AOP-R0 8/20/2003 AUXILIARY BOILER 175 MMBTU COMBUSTION CONTROLS 0.036 LB/MMBTUARCHER DANIELS MIDLAND CO. - NORTHERN SUN VEG. OIL ND PTC98002 7/9/1998 BOILER, KEWAUNEE 13 MMBTU/H NONE LISTED 0.038 LB/MMBTUROCHE VITAMINS NJ PCP980003--6 2/5/1999 BOILER 4 (NO. 2 OIL) 204.2 MMBTU/H NONE LISTED 0.04 LB/MMBTUROCHE VITAMINS NJ PCP980003--6 2/5/1999 BOILER 1 (NO. 2 OIL) 84.4 MMBTU/H NONE LISTED 0.04 LB/MMBTUROCHE VITAMINS NJ PCP980003--6 2/5/1999 BOILER 3 (NO. 2 OIL) 241.6 MMBTU/H NONE LISTED 0.04 LB/MMBTUARCHER DANIELS MIDLAND CO. - NORTHERN SUN VEG. OIL ND PTC98002 7/9/1998 BOILER, TRANE MURRAY, BACKUP OIL 189 MMBTU/H NONE LISTED 0.08 LB/MMBTUVCU EAST PLANT VA VA-50126 3/31/2003 BOILER, #6 FUEL OIL, (3) 150.6 MMBTU/H GOOD COMBUSTION PRACTICE 0.1 LB/MMBTUVCU EAST PLANT VA 50126 3/31/2003 BOILER - NO 6 FUEL OIL 150 MMBTU/H GOOD COMBUSTION PRACTICES. 0.105 LB/MMBTUVCU EAST PLANT VA 50126 3/31/2003 BOILER - DISTILLATE 150 MMBTU GOOD COMBUSTION PRACTICES. 0.105 LB/MMBTUPINE BLUFF ENERGY LLC - PINE BLUFF ENERGY CENTER AR 1822-AOP-R0 5/5/1999 BOILER, FUEL OIL 346 MMBTU/H GOOD COMBUSTION PRACTICE 0.12 LB/MMBTUALABAMA POWER COMPANY AL AND -X002 12/17/1997 BOILER, FUEL OIL (NEW/USED) 190 MMBTU/H NONE LISTED 0.18 LB/MMBTUINLAND PAPERBOARD AND PACKAGING, INC. - ROME LINERBOARD MILL GA
2631-115-0021-V-01-4 10/13/2004 BOILER, OIL-FIRED 192 MMBTU/H GOOD COMBUSTION PRACTICES 0.2 LB/MMBTU
VCU EAST PLANT VA 50126 37711 BOILER - OIL OR GAS 150 MMBTU GOOD COMBUSTION PRACTICES. 0.263 LB/MMBTU Prepared by: JDC 1/10/08 Checked by: JDF 1/10/08
Prevention of Significant Deterioration Air Permit Application January 17, 2008 Plant Washington, Power4Georgians, LLC
070007.2201 4-115
4.4.4 BACT Demonstration for VOC Emissions from the Auxiliary Boiler
VOC emissions are generated during a combustion process from incomplete combustion of the fuel,
similar to CO emissions. Control of VOC emissions, therefore, is completed in the same manner as that
of CO emissions, through providing adequate fuel residence time in the combustion chamber and
maintaining a high temperature and sufficient oxygen in the combustion zone to ensure complete
combustion. Excessive VOC emissions could result from below optimal combustion zone conditions.
Low levels of VOC emissions are expected from properly operated boilers.
Step 1 – Identify All Control Technologies
Combustion Controls
The use of combustion controls for VOC emissions would be a lower pollutant emitting
process, through managing the combustion process to optimize the combustion process and
reduce the generation of VOC emissions. Important factors in proper combustion include
proper fuel residence time, proper air to fuel ratios in the combustion chamber, and consistent
proper temperatures in the combustion chamber. VOC formation will be limited through use of
a properly designed combustion chamber with adequate controls to regulate the combustion
process. Proper maintenance is also necessary for proper combustion control. Proper operation
of fuel feed systems, fans, system dampers, and other equipment will assist in minimization of
VOC emissions. However, as stated above, careful consideration is necessary in the process of
combustion controls, since increasing the combustion temperature or oxygen concentration in
the combustion chamber would decrease VOC emissions, it would likely increase the formation
of thermal NOX, and increase overall NOX emissions.
Add-On Controls
No effective add-on controls currently exist for VOC emissions from a boiler. Use of
afterburners, and other control devices such as catalytic oxidation or flares, have not been
demonstrated in practice in boiler units. Any such control devices would lead to negative
secondary environmental impacts. The use of combustion controls is widely recognized as
BACT for VOC emissions for boilers.
Prevention of Significant Deterioration Air Permit Application January 17, 2008 Plant Washington, Power4Georgians, LLC
070007.2201 4-116
Step 2 – Eliminate Technically Infeasible Options
As discussed above, the use of add-on controls for control of VOC emissions for the PC boiler
units is not technically feasible. Use of add-on controls such as flares, afterburners, catalytic
oxidation, and thermal oxidation have not been demonstrated in practice for control of VOC
emissions from auxiliary boiler units. Combustion controls, such as the proper combustion
chamber and system design, and proper operation and maintenance, are demonstrated and
proven techniques for the reduction of VOC emissions. Combustion controls are considered a
demonstrated technology for auxiliary boiler VOC emissions controls, and therefore considered
technically feasible under the BACT evaluation process.
Step 3 – Rank Remaining Technically Feasible Control Options
Combustion controls are the only feasible technology for control of VOC emissions.
Combustion controls are designed to optimize the emissions of VOC (and consequently NOX)
from a PC fired boiler. Therefore, there are no energy or environmental impacts associated
with the implementation of combustion controls. Since combustion controls are now a standard
part of the design process of a boiler, there are no economic impacts associated with the
implementation of combustion controls.
Step 4 – Evaluate Remaining Control Technologies
There are no energy, environmental, or economic impacts associated with the use of
combustion controls which precludes the use of combustion controls as BACT for VOC
emissions for an auxiliary boiler unit.
Step 5 – Selection of BACT
A summary of recent VOC BACT evaluations conducted for similar projects can be found in
Table 4-15 below. BACT for VOC emissions is proposed as the implementation of combustion
controls and an emission limit of 0.003 lb/MMBtu. This level of BACT is comparable to the
level chosen for recent similar projects.

Prevention of Significant Deterioration Air Permit Application January 17, 2008 Plant Washington, Power4Georgians, LLC
070007.2201 4-117
Table 4-15 RBLC Listings for Volatile Organic Compound (VOC) Emissions from Distillate Oil Boilers Up To 250 MMBtu/hr
Facility Name State Permit Number Permit Date Process Name Throughput Throughput Unit Control DescriptionEmissions
LimitEmission Limit
UnitINLAND PAPERBOARD AND PACKAGING, INC. - ROME LINERBOARD MILL GA 2631-115-0021-V-01-4 10/13/2004 BOILER, OIL-FIRED 192 MMBTU/H
GOOD COMBUSTION PRACTICES 0.02 LB/MMBTU
PINE BLUFF ENERGY LLC - PINE BLUFF ENERGY CENTER AR 1822-AOP-R0 5/5/1999 BOILER, FUEL OIL 346 MMBTU/H
GOOD COMBUSTION PRACTICES 0.005 LB/MMBTU
LSP - COTTAGE GROVE, L.P. MN 16300087-001 11/10/1998 BOILERS, AUXILIARY, 2, FUEL OIL 104 MMBTU/HNATURAL GAS LIMIT AND DISTILLATE FUEL OIL LIMIT. 0.03 LB/MMBTU
PLUM POINT ENERGY AR 1995-AOP-R0 8/20/2003 AUXILLARY BOILER 175 MMBTU/H COMBUSTION CONTROLS 0.0015 LB/MMBTU
MILLER BREWING COMPANY - TRENTON OH 14-05515 5/27/2004 BOILER (2), NO. 6 FUEL OIL 238 MMBTU/H NONE INDICATED 0.005 LB/MMBTU
MILLER BREWING COMPANY - TRENTON OH 14-05515 5/27/2004 BOILER (2), NO. 2 FUEL OIL 238 MMBTU/H NONE INDICATED 0.0016 LB/MMBTU
VCU EAST PLANT VA 50126 3/31/2003 BOILER - NO 6 FUEL OIL 150 MMBTU/HGOOD COMBUSTION PRACTICES. 0.014 LB/MMBTU
VCU EAST PLANT VA 50126 3/31/2003 BOILER - DISTILLATE 150 MMBTUGOOD COMBUSTION PRACTICES. 0.014 LB/MMBTU
VCU EAST PLANT VA VA-50126 3/31/2003 BOILER, #6 FUEL OIL, (3) 150.6 MMBTU/H GOOD COMBUSTION 0.014 LB/MMBTU
ALABAMA POWER COMPANY AL 108-0018-X001 AND -X002 12/17/1997 BOILER, FUEL OIL (NEW/USED) 190 MMBTU/H NONE INDICATED 0.01 LB/MMBTU
PLUM POINT ENERGY AR 1995-AOP-R0 8/20/2003 AUXILIARY BOILER 175 MMBTU COMBUSTION CONTROLS 0.001 LB/MMBTU Prepared by: JDC 1/10/08 Checked by: JDF 1/10/08

Prevention of Significant Deterioration Air Permit Application January 17, 2008 Plant Washington, Power4Georgians, LLC
070007.2201 4-118
4.4.5 BACT Demonstration for Sulfur Dioxide (SO2) Emissions from the Auxiliary Boiler
SO2 emissions are generated during a combustion process from the combustion of sulfur contained in the
fuel. Control of SO2 emissions is primarily controlled through the sulfur content in the fuel. Since the
auxiliary boiler will be fired on light distillate oil (diesel fuel), the sulfur content of the fuel will be easily
controlled.
Step 1 – Identify All Control Technologies
Fuel Selection
Firing of lower sulfur fuel is a common lower emission process/practice to lower SO2
emissions.
Add-On Controls
Add on controls for SO2 are generally post combustion and are similar to those discussed for
the PC boiler. The add-on controls generally include wets scrubbers, dry scrubbers, sorbent
injection, limestone injection, and activated carbon injection.
Step 2 – Eliminate Technically Infeasible Options
Each of the identified controls was reviewed and the infeasible options identified. For the
purposes of the auxiliary boiler, only the low sulfur fuel, dry scrubbers, and wet scrubbers were
identified as technically feasible. Any control devices added to this unit would be ineffective
due to the short duration that they would be used.
Step 3 – Rank Remaining Technically Feasible Control Options
The RBLC identifies low-sulfur fuel as the most stringent limit for an auxiliary boiler
combusting fuel oil. The combination of the low duty cycle, 10 percent, in conjunction with
the placement and configuration of the auxiliary boiler at a power plant have generally
eliminated consideration of emission controls. Since the primary purpose of the auxiliary boiler
is for start up and shut downs of the PC boiler, it operational schedule generally precludes the
use of onsite control systems.

Prevention of Significant Deterioration Air Permit Application January 17, 2008 Plant Washington, Power4Georgians, LLC
070007.2201 4-119
Step 4 – Evaluate Remaining Control Technologies
There are no energy, environmental, or economic impacts associated with the use of low sulfur
diesel fuel.
Step 5 – Selection of BACT
A summary of recent SO2 BACT evaluations conducted for similar projects can be found in Table 4-16
below. Based on the preceding analysis, the proposed BACT for SO2 emissions is combustion of low
sulfur fuel. Compliance with this limitation will be through fuel certification. The emission limit
proposed as BACT would be 0.05 lb/MMBtu.

Prevention of Significant Deterioration Air Permit Application January 17, 2008 Plant Washington, Power4Georgians, LLC
070007.2201 4-120
Table 4-16 RBLC Listings for Sulfur Dioxide (SO2) Emissions from Distillate Oil Boilers Up To 250 MMBtu/hr
Facility Name State Permit Number Permit Date Process Name Throughput Throughput Unit Control DescriptionEmissions
LimitEmission Limit
Unit
BULL MOUNTAIN, NO. 1, LLC - ROUNDUP POWER PROJECT MT 3182-00 7/21/2003 BOILER, AUXILIARY, # 1 & #2 117 MMBTU/H
USE OF LOW SULFUR FUEL OIL (0.05% S), LIMIT ON HOURS OF OPERATION. 0.055 LB/MMBTU
VCU EAST PLANT VA 50126 3/31/2003 BOILER - NO 6 FUEL OIL 150 MMBTU/H
GOOD COMBUSTION PRACTICES. LOW SULFUR FUELS. 0.52 LB/MMBTU
VCU EAST PLANT VA 50126 3/31/2003 BOILER - DISTILLATE 150 MMBTU
GOOD COMBUSTION PRACTICES. LOW SULFUR FUELS. 0.53 LB/MMBTU
VCU EAST PLANT VA VA-50126 3/31/2003 BOILER, #6 FUEL OIL, (3) 150.6 MMBTU/HFUEL SULFUR LIMIT: < 0.5% S BY WT 0.52 LB/MMBTU
MILLER BREWING COMPANY - TRENTON OH 14-05515 5/27/2004 BOILER (2), NO. 6 FUEL OIL 238 MMBTU/H NONE INDICATED 1.6 LB/MMBTUMILLER BREWING COMPANY - TRENTON OH 14-05515 5/27/2004 BOILER (2), NO. 2 FUEL OIL 238 MMBTU/H NONE INDICATED 1.6 LB/MMBTU
VCU EAST PLANT VA VA-50126 3/31/2003 BOILER, #2 FUEL OIL, (3) 150.6 MMBTU/HFUEL SULFUR LIMITS: < 0.05% S BY WEIGHT 0.8 LB/MMBTU
PENN SPECIALTY CHEMICALS TN 0274-04B 1/19/2001 BOILER, FUEL OIL, 4-C 250 MMBTU/HCEMS/OPERATIONAL CONTROLS 0.1 LB/MMBTU
PINE BLUFF ENERGY LLC - PINE BLUFF ENERGY CENTER AR 1822-AOP-R0 5/5/1999 BOILER, FUEL OIL 346 MMBTU/H LOW S FUELS: < .05% BY WT S 0.052 LB/MMBTU
PLUM POINT ENERGY AR 1995-AOP-R0 8/20/2003 AUXILLARY BOILER 175 MMBTU/H LOW SULFUR FUEL OIL 0.051 LB/MMBTU
PLUM POINT ENERGY AR 1995-AOP-R0 8/20/2003 AUXILIARY BOILER 175 MMBTUSULFUR CONTENT < 0.05% S BY WT. 0.051 LB/MMBTU
OKEELANTA CORPORATION SUGAR MILL FL PSD-FL-169A 10/29/2001 BOILER, FUEL OIL 211 MMBTU/H SULFUR (0.05% S BY WT) 0.054 LB/MMBTU
PROCTOR & GAMBLE MANUFACTURING COMPANY TN 3P (SEE NOTES) 3/5/2001 UTILITY BOILER #2 (FUEL OIL) 183 MMBTU/H
FUEL SPEC: SULFUR CONTENT OF FUEL SHALL NOT EXCEED 0.2% BY WEIGHT. 0.217 LB/MMBTU
PROCTOR & GAMBLE MANUFACTURING COMPANY TN 3P (SEE NOTES) 3/5/2001 UTILITY BOILER #50-1 (FUEL OIL) 225 MMBTU/H
FUEL SPEC: SULFUR CONTENT OF FUEL SHALL NOT EXCEED 0.2% BY WEIGHT. 0.217 LB/MMBTU
Prepared by: JDC 1/10/08 Checked by: JDF 1/10/08

Prevention of Significant Deterioration Air Permit Application January 17, 2008 Plant Washington, Power4Georgians, LLC
070007.2201 4-121
4.4.6 BACT Demonstration for Sulfuric Acid Mist (H2SO4) Emissions from the Auxiliary Boiler
SAM is formed by the oxidation of a portion of the SO2 in the stack gases to SO3, which then reacts with
water vapor in the flue gas to form H2SO4. Since the basis of the formation of SAM is SO2 emissions,
then the SO2 BACT should also be considered BACT for SAM.
Step 1 – Identify All Control Technologies
Fuel Selection
Firing of lower sulfur fuel is a common lower emission process/practice to lower H2SO4
emissions.
Add-On Controls
Add on controls for SO2 are generally post combustion and are similar to those discussed for
the PC boiler. The add-on controls generally include wets scrubbers, dry scrubbers, sorbent
injection, limestone injection, and activated carbon injection.
Step 2 – Eliminate Technically Infeasible Options
Each of the identified controls were reviewed and the infeasible options identified. For the
purposes of the auxiliary boiler, only the low sulfur fuel, dry scrubbers, and wet scrubbers were
identified as technically feasible.
Step 3 – Rank Remaining Technically Feasible Control Options
The RBLC identifies low-sulfur fuel as the most stringent limit for an auxiliary boiler
combusting fuel oil. The combination of the low duty cycle, 10 percent, in conjunction with
the placement and configuration of the auxiliary boiler at a power plant have generally
eliminated consideration of emission controls. Since the primary purpose of the auxiliary boiler
is for start up and shut downs of the PC boiler, it operational schedule generally precludes the
use of onsite control systems.
Prevention of Significant Deterioration Air Permit Application January 17, 2008 Plant Washington, Power4Georgians, LLC
070007.2201 4-122
Step 4 – Evaluate Remaining Control Technologies
There are no energy, environmental, or economic impacts associated with the use of low sulfur
diesel fuel.
Step 5 – Selection of BACT
A summary of recent H2SO4 BACT evaluations conducted for similar projects can be found in Table 4-17
below. Based on the preceding analysis, the proposed BACT for H2SO4 emissions is combustion of low
sulfur fuel. Compliance with this limitation will be through fuel certification. This level of BACT has
been proposed on recent similar projects.

Prevention of Significant Deterioration Air Permit Application January 17, 2008 Plant Washington, Power4Georgians, LLC
070007.2201 4-123
Table 4-17 RBLC Listings for Sulfuric Acid Mist (H2SO4) Emissions from Distillate Oil Boilers Up To 250 MMBtu/hr
Facility Name State Permit Number Permit Date Process Name Throughput Unit Control DescriptionEmissions
LimitEmission Limit
UnitPLUM POINT ENERGY AR 1995-AOP-R0 8/20/2003 AUXILLARY BOILER 175 MMBTU/H LOW SULFUR FUEL OIL 0.0008 LB/MMBTUPLUM POINT ENERGY AR 1995-AOP-R0 8/20/2003 AUXILIARY BOILER 175 MMBTU LOW SULFUR FUEL OIL 0.0008 LB/MMBTULSP - COTTAGE GROVE, L.P. MN 16300087-001 11/10/1998
, ,FIRE PUMP 2.7 MMBTU/H LIMITED TO BURN DIESEL 150 H/YR. 0.0017 LB/MMBTU
LSP - COTTAGE GROVE, L.P. MN 16300087-001 11/10/1998 BOILERS, AUXILIARY, 2, FUEL OIL 104 MMBTU/H DISTILLATE FUEL OIL LIMIT. 0.0025 LB/MMBTU Prepared by: JDC 1/10/08 Checked by: JDF 1/10/08

Prevention of Significant Deterioration Air Permit Application January 17, 2008 Plant Washington, Power4Georgians, LLC
070007.2201 4-124
4.5 Diesel Engine Generator and Fire Water Pump
The facility plans to install and operate a diesel fired emergency backup generator and diesel fired
emergency fire pump. The two engines will operate only during emergencies and/or maintenance cycles.
The facility plans on limiting the operating hours of these engines to 500 hours per year for each engine.
Typical maintenance operations range from 4 to 8 hours per month.
Step 1 – Identify All Control Technologies
Combustion is a thermal oxidation process which produces emissions as a byproduct of fuel combustion.
Combustion of diesel fuel produces emissions of VOC, CO, SO2, NOx, PM, H2SO4 and trace amounts of
Fluorides and Lead. Categories of potential control technologies to reduce these emissions were
identified as: 1) prevent the formation of the emissions, 2) reduce the formation of the pollutant as low as
technologically possible, or 3) treat the emissions once the pollutants have been formed. The identified
technologies include:
Lower Emitting Process Practices
The process of controlling combustion conditions to reduce the formation of VOC, CO, NOx, and PM is
the generally accepted method for controlling these pollutants. Emissions of these pollutants are
regulated under the New Source Performance Standard (NSPS) promulgated in 40 CFR 60 Subpart IIII.
Add on Controls
Add on controls could potentially be used to control NOx emissions from the operation of the diesel fired
engines. The two add on controls identified included SCR and non-selective catalytic reduction (NSCR)/
These options were described in section 4.1 of this report. No add on controls were identified for
controlling SO2 emissions in AP42, Section 3.3 Gasoline and Diesel Industrial Engines, Section 3.4 Large
Stationary Diesel Engines, or the RBLC.
Refined Fuels
Refined fuels include use of low sulfur diesel fuel. Traditionally, low sulfur fuels have been limited to 0.5
percent sulfur content. Recently, low diesel fuel has been developed to further reduce sulfur emission

Prevention of Significant Deterioration Air Permit Application January 17, 2008 Plant Washington, Power4Georgians, LLC
070007.2201 4-125
from diesel fired engines. As an added bonus, the low sulfur fuel has also been identified as being a low
ash fuel, which also reduces emissions of PM in the diesel exhaust.
Step 2 – Eliminate Technically Infeasible Options
The operation of the emergency units will be limited to 500 hours per year, which translates into an
operational duty cycle of 6 percent. In reviewing the feasibility of the identified control technologies, we
have identified that add on controls are not a feasible option for this type of operation. The add on control
unit are considered infeasible based on the installation cost and the operation and maintenance costs
associated with limited operation.
Step 3 – Rank Remaining Technically Feasible Control Options
Good combustion practices are considered the only feasible control method for controlling emissions of
VOC, CO, and NOx,. Combustion of low sulfur fuel is the s emissions of SO2, H2SO4 and PM is the only
technically feasible control technology.
Step 4 – Evaluate Remaining Control Technologies
Good combustion practices are the most effective strategy for controlling emissions of VOC, CO, and
NOx,. Combustion of low sulfur fuel for reducing the emissions of SO2, H2SO4 and PM is the only
technically feasible control technology. There are no energy, environmental or economic impacts that
would preclude the use of good combustion controls or low sulfur fuel.
Step 5 – Selection of BACT
The proposed BACT for the emergency backup generator and the emergency fire pump will be the
utilization of good combustion controls and the use of low sulfur fuels. The emergency backup generator
and the emergency fire pump engine will comply with the emission limitations contained in 40 CFR 60
Subpart IIII. Additionally, the facility proposes to use low sulfur diesel fuel. Compliance will be
demonstrated with these limits by manufacturer’s certification and fuel certification.

Prevention of Significant Deterioration Air Permit Application January 17, 2008 Plant Washington, Power4Georgians, LLC
070007.2201 4-126
4.6 Cooling Towers
The cooling tower will be a multi-celled back-to-back style tower. The purpose of the cooling tower is to
reduce the heat released by the condensed steam from the steam turbine. The cooling tower will be
comprised of 34 cells using drift eliminators for the reduction of drift, or the amount of water from the
cooling tower carried into the ambient air in liquid form (emission points S-2 through S-35). Mineral
matter present in the water droplets released in the drift is considered PM emissions.
4.6.1 BACT Demonstration for PM Emissions from the Cooling Towers
Particulate emissions will be generated from the wet cooling towers in the form of drift. Drift is formed
when droplets of water are entrained in the exhaust gas stream passing through the cooling tower. As the
water in the droplets evaporate, the solids in the water becomes particulate matter.
The only available control method available for wet cooling towers are drift eliminators. The design of
the drift eliminators dictates their control efficiency. The efficiencies range from 0.05 to 0.0005 percent
(gallons of drift per gallons of cooling water.)
The proposed BACT for this project is the use of ultra high efficiency drift eliminators with an efficiency
of 0.0005 percent. The proposed method of compliance for the drift eliminators is by use of a
manufacturer’s guarantee and analysis of the quality of the Total Dissolved Solids (TDS) in the cooling
tower makeup water, limited to 3300 mg/L. This drift limit is consistent with recent BACT evaluations
for other power production facilities, and the RBLC database confirms BACT levels of 0.0005 percent. A
review of the literature and the RBLC database indicate that this is the highest level of control at this time
as indicated in Table 4-18.

Prevention of Significant Deterioration Air Permit Application January 17, 2008 Plant Washington, Power4Georgians, LLC
070007.2201 4-127
Table 4-18 RBLC Listings for Cooling Tower Drift
Facility Name State Permit Number Permit Date Process Name Throughput Throughput Unit Control DescriptionEmissions
Limit Emission Limit Unit
ADM CORN PROCESSING - CEDAR RAPIDS IA 57-01-080 6/29/2007 INDUSTRIAL COOLING TOWER 150000 GALLON/MIN DRIFT ELIMINATORS 0.0005 % DRIFT RATE
LA PAZ GENERATING FACILITY AZ 1001743 9/4/2003MECHANICAL DRAFT COOLING TOWERS FOR GE TURBINES 173870 GALLON/MIN DRIFT ELIMINATORS 0.0005 % BY VOL
LA PAZ GENERATING FACILITY AZ 1001743 9/4/2003MECHANICAL DRAFT COOLING TOWERS FOR SIEMENS TURBINES 141400 GALLON/MIN DRIFT ELIMINATORS 0.0005 % BY VOL
SPIRITWOOD STATION ND PTC07026 9/14/2007 COOLING TOWER 80000 GALLON/MIN DRIFT ELIMINATOR 0.0005 % COOLING WATER FLOW
MIDAMERICAN ENERGY COMPANY IA PROJECT 02-528 6/17/2003 COOLING TOWER UNKNOWN DRIFT ELIMINATORS 0.0005 % DRIFT LOSSTRIGEN-NASSAU ENERGY CORPORATION NY 1-2820-01015/00009 3/31/2005 COOLING TOWER NONE INDICATED 0.0005 % DRIFTHOMELAND ENERGY SOLUTIONS, LLC, PN 06-672 IA 07-A-955P TO 07-A-982P 8/8/2007 COOLING TOWER, F80 (07-A-979P) 50000 GALLON/MIN DEMISTER 0.0005 % DRIFT LOSSHOMELAND ENERGY SOLUTIONS, LLC, PN 06-672 IA 07-A-955P TO 07-A-982P 8/8/2007 COOLING TOWER, F80 (07-A-979P) 50000 GALLON/MIN DEMISTER 0.0005 % DRIFT LOSSADM CORN PROCESSING - CEDAR RAPIDS IA 57-01-080 6/29/2007 INDUSTRIAL COOLING TOWER 150000 GALLON/MIN DRIFT ELIMINATORS 0.0005 % EFF. DRIFT ELIMINCOMANCHE STATION CO 04UNITPB1015 38538 COOLING TOWER 140650 GALLON/MIN ACHIEVE 0.0005 % DRIFT OR 0.0005 % DRIFT RATECOMANCHE STATION CO 04UNITPB1015 38538 COOLING TOWER 140650 GALLON/MIN ACHIEVE 0.0005% DRIFT OR 0.0005 % DRIFT RATE
DICKERSON MD CPCN CASE NO. 8888 11/5/2004 COOLING TOWER 10 CELLS MIST ELIMINATORS 0.001 % DRIFT RATEHORSESHOE ENERGY PROJECT OK 2001-156-C PSD 2/12/2002 COOLING TOWERS 111438 GALLON/MIN DESIGN 0.001 % DRIFTGENOVA ARKANSAS I, LLC AR 2009-AOP-R0 8/23/2002 COOLING TOWER 11.4 MMGAL/H DRIFT ELIMINATORS 0.001 % DRIFT LOSSDARRINGTON ENERGY COGENERATION POWER PLANT WA PSD 03-04 38394 COOLING TOWER ELIMINATORS WITH DRIFT 0.001 % DRIFT RATEBP CHERRY POINT COGENERATION PROJECT WA EFSEC/2002-01 38363 COOLING TOWER ELIMINATORS WITH DRIFT 0.001 % DRIFT RATEBATON ROUGE REFINERY LA PSD-LA-667(M-1) 2/18/2004 COOLING TOWERS DRIFT ELIMINATOR SYSTEM 0.003 % DRIFTPLAQUEMINE COGENERATION FACILITY LA PSD-LA-659 12/26/2001 COOLING TOWER 0.01 % DRIFT RATE PRACTICES 0.005 % DRIFT RATEGARYVILLE REFINERY LA PSD-LA-719 12/27/2006
( )HYDROGEN PLANT COOLING TOWER (53-08) ELIMINATORS 0.005 % DRIFT RATE
ROCKPORT WORKS IN 147-6713-00041 2/13/1997 COOLING TOWERS (2), NON-CONTACT DRIFT ELIMINATORS 0.005 % DRIFT
AUBURN NUGGET IN 033-19475-00092 5/31/2005 COOLING TOWER 23450 GALLON/MIN NONE INDICATED 0.005 % OF THROUGH PUTNUCOR STEEL NC 08680T09 11/23/2004 COOLING TOWERS 0.008 PERCENT DRIFT LOSS 0.008 % DRIFT RATENUCOR STEEL NC 08680T09 38314 COOLING TOWERS 0.008 PERCENT DRIFT LOSS 0.008 % DRIFT RATE
ST. CHARLES REFINERY LA PSD-LA-619(M-2) 39121 COOLING TOWERS (2004-6, 2005-42, & 2005-43) DRIFT ELIMINATORS - -KELSON RIDGE MD CPCN CASE NO. 8843 37161 COOLING TOWERS MIST ELIMINATORS - -NUCOR STEEL IN 107-12143-00038 36910 COOLING TOWER SYSTEM 12000 GALLON/MIN NO NUMERICAL LIMIT - -
Prepared by: JDC 1/10/08 Checked by: JDF 1/10/08

Prevention of Significant Deterioration Air Permit Application January 17, 2008 Plant Washington, Power4Georgians, LLC
070007.2201 4-128
4.7 Material Handling and Storage Facilities
Particulate emissions will be generated from material handling systems and storage facilities. In
particular, emissions will result from handling systems for coal, limestone; storage facilities for coal and
limestone; solid materials handling operations; and haul roads. The particulate sources can be grouped
into the following categories: transfer points, storage piles, material processing and haul roads. The
permit application contains detailed descriptions of the material handling emissions points and associated
emissions calculations.
Step 1 – Identify All Control Technologies
Control options for potential application to the material handling and storage facilities were
identified by category. The potential controls include the following:
1) Transfer Points:
Enclosed Transfer point with dust suppression and/or dust collector
Partially Enclosed Transfer point with dust suppression and/or dust collector
Dust Suppression (water sprays, use of surfactants or crusting agents)
2) Storage Piles
Full Enclosure
Partial Enclosure
Dust Suppressions (water sprays, surfactants, crusting agents, seeding and covering)
Telescopic Chutes
Lowering Wells
Contouring, Compaction and Stabilization
Minimized Active Cell Area
3) Material Processing
Enclosed Processing operation with dust suppression and/or dust collector
4) Haul Roads
Paving
Dust Suppression (water sprays and surfactants)

Prevention of Significant Deterioration Air Permit Application January 17, 2008 Plant Washington, Power4Georgians, LLC
070007.2201 4-129
Step 2 – Eliminate Technically Infeasible Options
Transfer Points
Transfer points include coal railcar unloading, transfer point for PRB coal, transfer point for Illinois #6
coal, limestone railcar unloading, unloading conveyor to limestone stackhouse, fly-ash mechanical
exhausters, bottom ash transfer point to storage bin, and bottom ash transfer point from bin to truck. In
addition, the tripper deck, fly ash silo, the Hg sorbent silo, the SO3 sorbent silo, the pre-treatment soda
ash silo, and the pre-treatment hydrated lime silo also include transfer points.
Three control options were identified in Step 1 as potential control for transfer points. The total enclosure
with dust suppression is not a technically feasible option for coal railcar unloading, limestone railcar
unloading, transfer point for PRB coal and the transfer point for Illinois #6 coal because of railcar
handling procedures and safety procedures. The other two (2) options, partial enclosures with dust
suppression and/or dust collectors, and dust suppression (use of water sprays, surfactants, or crusting
agents) are considered technically feasible for the remainder of the transfer points.
Storage Piles
Storage piles include an active pile for PRB coal, an active pile for Illinois #6 coal, an inactive pile for
PRB coal, an inactive pile for Illinois #6 coal, an active pile for limestone and the solid materials handling
operations. Seven potential control options were identified in Step 1 for control of emissions from
storage pile emissions. Of the seven options identified, the full enclosure control strategy for the storage
piles is not technically feasible.
Material Processing
Material processing areas on site include a coal preparation facility and a limestone preparation facility.
Both processing operations are to be enclosed inside a separate building. The control option identified in
Step 1, enclosing processing operations and utilizing dust suppression and/or a dust collector is
technically feasible.
Haul Roads
Haul roads onsite are primarily internal roadways utilized by the facility to transport combustion
byproducts to the onsite storage facility. Particulate emissions are generated primarily from re-entrained

Prevention of Significant Deterioration Air Permit Application January 17, 2008 Plant Washington, Power4Georgians, LLC
070007.2201 4-130
road dust. The two control strategy options identified in Step 1 are technically feasible to control
roadway dust.
Step 3 – Rank Remaining Technically Feasible Control Options
Transfer Points
With the exception of the rail unloading operations and transfer to storage pile, the options for controlling
particulate emissions from the transfer points, the three options are ranked in order of effectiveness as: 1)
enclosed transfer point with dust suppression and/or dust collector; 2) partially enclosed transfer point
with dust suppression and/or dust collector, and 3) dust suppression (water sprays, use of surfactants or
crusting agents).
Material Processing
Since only one option was identified for onsite material processing, no ranking is required.
Storage Piles
The ranking of the control strategies for storage piles is similar to the ranking for transfer points. The full
or partial enclosure is the must effective control strategy to minimize emissions, but is technically
infeasible due to the size of the piles and potential hazardous environments that could be found inside
such a structure. Dust suppression techniques such as water sprays with or without chemical additives
such as surfactants and crusting agents will be the most effective control for the storage piles. Use of
telescoping spouts and lowering wells will minimize the creation of particulates for materials being add to
or removed from the piles. Dust suppression sprays are also effective during pile maintenance operations.
Particulate emissions from operations at the onsite storage facility (solid materials handling facility) will
be most effectively controlled by a combination of physical control strategies including contouring,
compaction, stabilization and cover in conjunction with management practices including minimizing the
active work areas in the onsite storage facility. The operations and maintenance practice will be fully
identified in the solid materials handling operations plan.

Prevention of Significant Deterioration Air Permit Application January 17, 2008 Plant Washington, Power4Georgians, LLC
070007.2201 4-131
Haul Roads
The two options identified as control options for haul roads were paving and dust suppression through the
use of water sprays and/or chemical additives. Since the facility is planning on implementing both
control strategies, no additional evaluation is required.
Step 4 – Evaluate Remaining Control Technologies
Transfer Points
Fully enclosed transfer point with dust suppression and/or dust collector provides the most effective
controls for particulate emissions. Demonstrated BACT testing indicates that control efficiencies of 80 to
99 percent are achievable. Since the facility plans on using fully enclosed transfer points with dust
controls where feasible, additional evaluation is not warranted.
Storage Piles
Use of dust suppression sprays with or without chemical additives is the most effective control strategy
after full and partial enclosure was identified as being technically infeasible. The facility will use water
sprays, surfactants, seeding agents and contouring to obtain a control efficiency of 90 percent.
Telescoping chutes and lowering well will also be utilized in the transfer point to further minimize
emissions from storage pile operation. Covering, limiting the active cell area and other best management
practices will be utilized in the onsite storage facility to reduce particulate emissions.
Material Processing
The facility will utilize an enclosed building with fabric filter to control emissions for the coal and
limestone processing area.
Haul Roads
Dust suppression techniques, including the use of water sprays, in conjunction with paving haul roads to
obtain a control efficiency of 80 to 90 percent. Regular cleaning and application of water sprays will also
reduce roadway dust emissions.

Prevention of Significant Deterioration Air Permit Application January 17, 2008 Plant Washington, Power4Georgians, LLC
070007.2201 4-132
Step 5 – Selection of BACT
Techniques to control emissions from material handling identified herein will be utilized to reduce
particulate emissions from these processes. The proposed facility will utilize a combination of
enclosures, dust collectors, telescopic chutes, lowering wells, wet suppression systems, covering, crusting
agents as BACT for material handling. Baghouses with flow rates greater than 1000 ACFM will have a
maximum average outlet loading of 0.005 grains per dry standard cubic feet (gr/dscf).
Emissions from transfer points will be reduce by 80 to 90 percent using enclosures in conjunction with
dust suppression.
Storage pile particulate emissions will be reduced 90 percent through the use of water sprays in
conjunction with best management practices. Fugitive emissions from the coal storage piles will be
reduced through the use of a retractable chute in conjunction with water sprays, surfactants, crusting
agents, contouring and covering. Fugitive emissions from the limestone stock pile will be reduced by 90
percent through the use of a lowering well when removing material from the pile.
Haul road emissions will be reduced by 90 percent by paving the haul road in conjunction with water
sprays and surfactants. The emission limit of 0.005 gr/dscf and proposed control procedures are
consistent with recently permitted facilities and those contained in the RBLC database as shown in Table
4-19.

Prevention of Significant Deterioration Air Permit Application January 17, 2008 Plant Washington, Power4Georgians, LLC
070007.2201 4-133
Table 4-19 RBLC Listings for Material Management Handling Sources
Facility Name State Permit Number Permit Date Process Name Throughput Throughput Unit Control Description
Emissions Limit
Emission Limit Unit
RICHARDTON PLANT ND 4004 8/4/2004 COAL HANDLING 27 T/H BAGHOUSE 0.004 GR/DSCFENERGY SERVICES OF MANITOWOC WI 00-RV-092 6/26/2001 FUEL HANDLING PULSE-JET BAGHOUSES, ENCLO 0.004 GR/DSCFERIE NUGGET MN 13700318-001 6/26/2005 COAL & FLUX UNLOADING 4000000 DSCF FF 0.005 GR/DSCFERIE NUGGET MN 13700318-001 6/26/2005 COAL & FLUX UNLOADING 4000000 DSCF FF 0.005 GR/DSCFUNIVERSITY OF NORTHERN IOWA IA 02-111 5/3/2007 COAL SYSTEM - BUNKER #3 SILO 27.4 lbs/hr BAGHOUSE 0.005 GR/DSCFUNIVERSITY OF NORTHERN IOWA IA 02-111 5/3/2007 COAL SYSTEM - BUNKER #3 SILO 27.4 lbs/hr BAGHOUSE 0.005 GR/DSCFGASCOYNE GENERATING STATION ND PTC 05005 6/3/2005 COAL HANDLING 400 T/H BAGHOUSES 0.005 GR/DSCFSPIRITWOOD STATION ND PTC07026 9/14/2007 COAL HANDLING 85.3 T/H BAGHOUSE 0.005 GR/DSCF
HOMELAND ENERGY SOLUTIONS, LLC, PN 06-672 IA 07-A-955P TO 07-A-982P 8/8/2007 GASIFIER COAL FEED BINS, S14 (07-A-959P) 15 tons BAGHOUSE 0.005 GR/DSCFHOMELAND ENERGY SOLUTIONS, LLC, PN 06-672 IA 07-A-955P TO 07-A-982P 8/8/2007 COAL STORAGE SILOS, S15 (07-A-960P) 5000 tons BAGHOUSE 0.005 GR/DSCF
HOMELAND ENERGY SOLUTIONS, LLC, PN 06-672 IA 07-A-955P TO 07-A-982P 8/8/2007COAL STORAGE RECLAIM SILO, S16 (07-A-961P) 5000 tons BAGHOUSE 0.005 GR/DSCF
HOMELAND ENERGY SOLUTIONS, LLC, PN 06-672 IA 07-A-955P TO 07-A-982P 8/8/2007 GASIFIER COAL FEED BINS, S14 (07-A-959P) 15 tons BAGHOSUE 0.005 GR/DSCFHOMELAND ENERGY SOLUTIONS, LLC, PN 06-672 IA 07-A-955P TO 07-A-982P 8/8/2007 COAL STORAGE SILOS, S15 (07-A-960P) 5000 tons BAGHOUSE 0.005 GR/DSCF
HOMELAND ENERGY SOLUTIONS, LLC, PN 06-672 IA 07-A-955P TO 07-A-982P 8/8/2007COAL STORAGE RECLAIM SILO, S16 (07-A-961P) 5000 tons BAGHOUSE 0.005 GR/DSCF
MIDAMERICAN ENERGY COMPANY IA PROJECT 02-528 6/17/2003 ROTARY CAR DUMPER 3500 TONS/HR BAGHOUSE 0.005 GR/DSCFMIDAMERICAN ENERGY COMPANY IA PROJECT 02-528 6/17/2003 TRANSFER CONVEYING BAY 1800 TONS/HR BAGHOUSE 0.005 GR/DSCFMIDAMERICAN ENERGY COMPANY IA PROJECT 02-528 6/17/2003 TRANSFER HOUSE 2 3500 TONS/HR BAGHOUSE 0.005 GR/DSCFMIDAMERICAN ENERGY COMPANY IA PROJECT 02-528 6/17/2003 TRANSFER HOUSE 4 3600 TONS/HR BAGHOUSE 0.005 GR/DSCFMIDAMERICAN ENERGY COMPANY IA PROJECT 02-528 6/17/2003 SILOS 900 TONS/HR BAGHOUSE 0.005 GR/DSCFMIDAMERICAN ENERGY COMPANY IA PROJECT 02-528 6/17/2003 ROTARY CAR DUMPER 3500 TONS/HR BAGHOUSE 0.005 GR/DSCFMIDAMERICAN ENERGY COMPANY IA PROJECT 02-528 6/17/2003 TRANSFER CONVEYING BAY 1800 TONS/HR BAGHOUSE 0.005 GR/DSCFMIDAMERICAN ENERGY COMPANY IA PROJECT 02-528 6/17/2003 TRANSFER HOUSE 2 3500 TONS/HR BAGHOUSE 0.005 GR/DSCFMIDAMERICAN ENERGY COMPANY IA PROJECT 02-528 6/17/2003 TRANSFER HOUSE 4 3600 TONS/HR BAGHOUSE 0.005 GR/DSCFMIDAMERICAN ENERGY COMPANY IA PROJECT 02-528 6/17/2003 SILOS 900 TONS/HR BAGHOUSE 0.005 GR/DSCFAUBURN NUGGET IN 033-19475-00092 5/31/2005 COAL CAR UNLOADING 165 T/H BAGHOUSE 0.0052 GR/DSCFWYGEN 2 WY CT-3030 9/25/2002 COAL HANDLING EQUIPMENT FABRIC FILTER 0.009 GR/DSCFERIE NUGGET MN 13700318-001 6/26/2005 COAL PULVERIZER #1 36 MMBTU/H FF 0.01 GR/DSCFERIE NUGGET MN 13700318-001 6/26/2005 COAL PULVERIZER #2 9 MMBTU/H FF 0.01 GR/DSCFIRON DYNAMICS, INC. (IDI) IN 033-19160-00076 4/13/2005 COAL DRYER 25 mmbtu/h BAGHOUSE 0.01 GR/DSCFTWO ELK GENERATION PARTNERS, LIMITED PARTNERSHIP WY CT-1352 2/27/1998 SILO, BOILER, PLANT COAL 8500 SCFM 8500 SCFM BAGHOUSE 0.01 GR/DCSFTWO ELK GENERATION PARTNERS, LIMITED PARTNERSHIP WY CT-1352 2/27/1998 DUMP POCKET, COAL 3000 SCFM BAGHOUSE 0.01 GR/DSCFTWO ELK GENERATION PARTNERS, LIMITED PARTNERSHIP WY CT-1352 2/27/1998 SILO, COAL 6000 SCFM BAGHOUSE 0.01 GR/DSCFTWO ELK GENERATION PARTNERS, LIMITED PARTNERSHIP WY CT-1352 2/27/1998 CRUSHER, CONE, SECONDARY COAL 6000 SCFM 6000 SCFM BAGHOUSE 0.01 GR/DSCFAUBURN NUGGET IN 033-19475-00092 5/31/2005 COAL DRYERS 33 T (COAL)/H BAGHOUSE 0.01 GR/DSCFWESTERN GREENBRIER CO-GENERATION, LLC WV R14-0028 4/26/2006 COAL HANDLING 300 T/H FABRIC FILTERS 0.01 GR/DSCFGCC DACOTAH SD 28.1101-PSD 4/10/2003 COAL SURGE BIN TOP (2) 400 T/H FABRIC FILTER 0.01 GR/DSCFGCC DACOTAH SD 28.1101-PSD 4/10/2003 COAL TUNNEL TO COAL STACKER 400 T/H FABRIC FILTER 0.01 GR/DSCFGCC DACOTAH SD 28.1101-PSD 4/10/2003 COAL TRANSFER 400 T/H FABRIC FILTER 0.01 GR/DSCFGCC DACOTAH SD 28.1101-PSD 4/10/2003 COAL DRYER - FK PUMP 20 T/H FABRIC FILTER 0.01 GR/DSCFGCC DACOTAH SD 28.1101-PSD 4/10/2003 COAL HOPPER TO CONVEYOR 400 T/H FABRIC FILTER 0.01 GR/DSCFLONE STAR INDUSTRIES, INC. IN 133-10159 4/16/1999 CEMENT MANUFACTURING, COAL MILL 40 T/YR FABRIC FILTER 0.01 GR/DSCFSUWANNEE AMERICAN CEMENT COMPANY, INC. FL 1210465-001-AC 6/1/2000 COAL MILL BAGHOUSE 0.01 GR/DSCFHUGO GENERATING STA OK 97-058-C M-2 PSD 2/9/2007 MATERIAL HANDLING FABRIC FILTER BAGHOUSE 0.01 GR/DSCFTS POWER PLANT NV AP4911-1349 5/5/2005 COAL HANDLING OPERATIONS FABRIC FILTER DUST COLLECIT 0.01 GR/DSCF
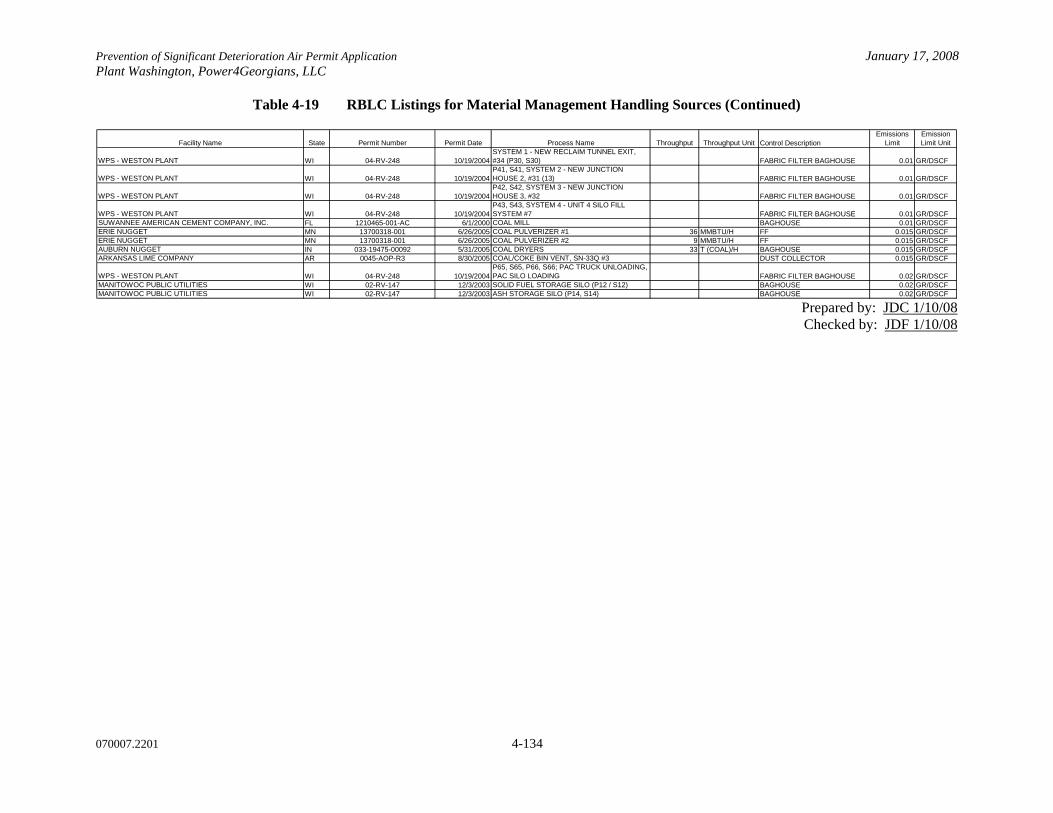
Prevention of Significant Deterioration Air Permit Application January 17, 2008 Plant Washington, Power4Georgians, LLC
070007.2201 4-134
Table 4-19 RBLC Listings for Material Management Handling Sources (Continued)
Facility Name State Permit Number Permit Date Process Name Throughput Throughput Unit Control DescriptionEmissions
LimitEmission Limit Unit
WPS - WESTON PLANT WI 04-RV-248 10/19/2004SYSTEM 1 - NEW RECLAIM TUNNEL EXIT, #34 (P30, S30) FABRIC FILTER BAGHOUSE 0.01 GR/DSCF
WPS - WESTON PLANT WI 04-RV-248 10/19/2004P41, S41, SYSTEM 2 - NEW JUNCTION HOUSE 2, #31 (13) FABRIC FILTER BAGHOUSE 0.01 GR/DSCF
WPS - WESTON PLANT WI 04-RV-248 10/19/2004P42, S42, SYSTEM 3 - NEW JUNCTION HOUSE 3, #32 FABRIC FILTER BAGHOUSE 0.01 GR/DSCF
WPS - WESTON PLANT WI 04-RV-248 10/19/2004P43, S43, SYSTEM 4 - UNIT 4 SILO FILL SYSTEM #7 FABRIC FILTER BAGHOUSE 0.01 GR/DSCF
SUWANNEE AMERICAN CEMENT COMPANY, INC. FL 1210465-001-AC 6/1/2000 COAL MILL BAGHOUSE 0.01 GR/DSCFERIE NUGGET MN 13700318-001 6/26/2005 COAL PULVERIZER #1 36 MMBTU/H FF 0.015 GR/DSCFERIE NUGGET MN 13700318-001 6/26/2005 COAL PULVERIZER #2 9 MMBTU/H FF 0.015 GR/DSCFAUBURN NUGGET IN 033-19475-00092 5/31/2005 COAL DRYERS 33 T (COAL)/H BAGHOUSE 0.015 GR/DSCFARKANSAS LIME COMPANY AR 0045-AOP-R3 8/30/2005 COAL/COKE BIN VENT, SN-33Q #3 DUST COLLECTOR 0.015 GR/DSCF
WPS - WESTON PLANT WI 04-RV-248 10/19/2004P65, S65, P66, S66; PAC TRUCK UNLOADING, PAC SILO LOADING FABRIC FILTER BAGHOUSE 0.02 GR/DSCF
MANITOWOC PUBLIC UTILITIES WI 02-RV-147 12/3/2003 SOLID FUEL STORAGE SILO (P12 / S12) BAGHOUSE 0.02 GR/DSCFMANITOWOC PUBLIC UTILITIES WI 02-RV-147 12/3/2003 ASH STORAGE SILO (P14, S14) BAGHOUSE 0.02 GR/DSCF
Prepared by: JDC 1/10/08 Checked by: JDF 1/10/08

Prevention of Significant Deterioration Air Permit Application January 17, 2008 Plant Washington, Power4Georgians, LLC
070007.2201 4-135
4.8 Storage Tanks
The facility will have three storage tanks used for storage of No. 2 distillate fuel oil. One (1) of these
storage tanks will be a 350,000 gallon tank used for storage of No. 2 distillate fuel oil to be used in the
main facility boiler and auxiliary boiler during startup and shutdown operations. Another of these storage
tanks will be a 750 gallon tank used for storage of No. 2 distillate fuel oil to be used as necessary for the
emergency diesel generator. Also, the final storage tank will be a 250 gallon tank used for storage of No
2 distillate fuel oil to be used as necessary in the facility emergency fire pump. The vapor pressure of No.
2 distillate fuel oil is very low (< 0.01 psia), so the VOC emissions from these tanks are minimal. At this
low vapor pressure no control device is economically viable due to the very low rate of loss. Based on
use of the USEPA TANKS Program (version 4.0.9d), used for estimation of emissions of organic
emissions from storage tanks, the total VOC emission from all storage tanks will be less than 200 lb/yr.
Work practices at the facility will be implemented to minimize VOC emissions from the facility storage
tanks as much as possible. The proposed BACT for the storage tanks is use of conservation vent valves
where applicable and best management practices to minimize emissions.
4.9 Opacity
Control methodologies established as BACT for this evaluation have also been established to minimize
the formation of visible emissions from facility emission points. These controls are discussed in detail in
the particular BACT section for each process.
Opacity is a measurement of visible emissions, and is defined as the amount of light which is blocked by
a medium, such as smoke. An opacity of 0 percent means that all light passes through the medium, and
an opacity of 100 percent would mean that no light could pass through the medium. Opacity can be an
indication of the concentration of pollutants being discharged from a stack. The more particles that are
emitted from a stack, the more light will be blocked by the particles (medium), and a higher percent
opacity will result.
The facility is proposing a 10 percent opacity limit on a six minute average for those operations not
already covered by a more stringent opacity standard (i.e., NSPS Subpart OOO). Compliance with this
level will be maintained by:
• Proper control device maintenance and operation

Prevention of Significant Deterioration Air Permit Application January 17, 2008 Plant Washington, Power4Georgians, LLC
070007.2201 4-136
• Dust Suppression Techniques to minimize fugitive emissions of Particulate Matter (PM)

Prevention of Significant Deterioration Air Permit Application January 17, 2008 Plant Washington, Power4Georgians, LLC
070007.2201 5-1
5.0 PSD AMBIENT AIR QUALITY ANALYSIS
The proposed project triggered a PSD review for PM10, NOx, CO, SO2, VOC, Lead (Pb), Sulfuric Acid Mist
(SAM) and Fluorides (as HF) as indicated in Section 3.0; therefore, an air quality modeling analysis was
required for each pollutant (PSD modeling is not required for SAM, however, it is included in the air toxics
analysis modeling evaluation in Section 7). Although the project triggers a PSD review for VOC, there are no
modeling requirements for VOC emissions; therefore, a modeling analysis was not completed for this
pollutant. Screening analyses indicated that the project will exceed the PSD Significant Impact Levels (SILs)
for SO2 while PM10, NOx, and CO concentrations will be below their corresponding levels. HF and Pb are
below their significant monitoring level concentrations. Refined modeling was completed for SO2. The
results of the refined modeling analysis demonstrated that the project will not exceed either the National
Ambient Air Quality Standards (NAAQS) or PSD Increment consumption levels for SO2 and therefore will
comply with the PSD air quality standards. The results of this analysis are summarized in the following
sections. Electronic copies of the input and output files for the model runs are included on a disc in Exhibit
D.
5.1 MODELING METHODOLOGY
The first step in air quality modeling is to run a screen model of all emission sources at the proposed facility.
The screen model results for the PSD-triggered pollutants are used to determine whether the emission
increases from the proposed facility will result in concentrations that exceed their respective SILs. Refined
modeling will be required if significant levels are exceeded. Table 5-1 shows the SILs for PM10, PM2.5, NOx,
SO2, and CO. Current USEPA guidelines call for PM2.5 to be evaluated as a surrogate for PM10. Currently
there are no promulgated significant impact levels for PM2.5, however, on September 21, 2007 the USEPA
proposed significant impact levels for PM2.5. This USEPA proposal includes three options for PM2.5 SILs. As
a worst case evaluation, the modeling results for PM2.5 are being compared to the lowest of the three options.
This modeling is not a requirement for the permit application under current guidelines; however, the results
are being included in order to demonstrate that the plant will have an insignificant impact on PM2.5
concentrations in the area. The screen results were also compared to the lowest of the proposed PM2.5
significant monitoring concentrations to determine whether a review for preconstruction monitoring will be
required.

Prevention of Significant Deterioration Air Permit Application January 17, 2008 Plant Washington, Power4Georgians, LLC
070007.2201 5-2
Table 5-1 Significant Impact Levels and Significant Monitoring Concentrations
Pollutant Averaging Period
Significant Ambient Impact Level
(µg/m3)
Significant Monitoring Concentrations
(µg/m3) 24-hour 1.20 -
PM2.51
Annual 0.30 - 24-hour 5 10
PM10 Annual 1 - 3-hour 25 -
24-hour 5 13 SO2
Annual 1 - NOx Annual 1 14
8-hour 500 575 CO
1-hour 2,000 - Pb Calendar Quarter - 0.10 HF 24-hour - 0.25
1. Lowest of the three proposed Significant Impact Levels. Completed by: LMG 1/17/08
Checked by: SAK 1/17/08
The concentrations used for comparison to significant levels calculated by the screen models were the highest
concentrations predicted at any receptor for all averaging periods for each modeled pollutant. In screening
and refined modeling, the maximum concentration predicted by the model was resolved to within the
100-meter receptor grid spacing to obtain a true maximum (if the initial maximum receptor was not already
located in the 100-meter spacing portion). The USEPA AERMOD model was used for all pollutants for all
averaging periods. The latest version of AERMOD (Version 07026) was downloaded from USEPA’s Support
Center for Regulatory Air Models (SCRAM) Web site for use in the modeling.
The latest USEPA’s Building Profile Input Program for Prime (BPIP-PRIME model -version 04274) was
used to calculate flow vectors based on 36 possible wind directions in order to allow for building downwash.
A Cartesian receptor grid was used for the model runs. Receptors were spaced 100 meters apart along the
fence line/patrolled property line and out to a distance of 2 kilometers from the property boundary. Receptors
were spaced at 500 meters apart from 2 kilometers to 10 kilometers out from the property boundary.
Figure 5-1 shows the receptors used in the PSD screen modeling. Digital Elevation Model (DEM) data

Prevention of Significant Deterioration Air Permit Application January 17, 2008 Plant Washington, Power4Georgians, LLC
070007.2201 5-3
obtained from the U.S. Geological Survey was used to determine receptor heights using USEPA’s AERMAP
(Version 06341) computer program.
As part of the project, Power4Georgians will be closing the portion of Mayview road that goes through the
plant property. A letter from the Washington County Board of Commissioners to the EPD director outlining
this road closure is included in Exhibit C of the permit application. With the closure of this road, this portion
of the plant property will not have public access and will not therefore be included in the modeling
evaluation.
The proposed project will result in a potential VOC emission increase greater than 100 tons per year;
therefore, the PSD air modeling guidelines require an evaluation to determine whether preconstruction
monitoring is warranted. Preconstruction monitoring of ozone can be waived in the event that representative
data for the area is available. The Georgia EPD operates ozone monitors at 24 locations across the state
including two sites northeast of the site in Richmond and Columbia Counties and two sites West/ Southwest
of the site in Bibb County. These monitors are considered representative of the ozone levels in the area. The
maximum 1-hour and 8-hour ozone monitor values for 2006 from the monitors are 0.10 ppm and 0.09 ppm
for the Richmond County monitor, 0.14 ppm and 0.09 ppm for the Columbia County monitor, and 0.10 and
0.09 ppm for the closest monitor in Bibb County (Georgia Forestry Commission monitor). The only impact
that VOC emissions could have on air quality is the potential creation of ozone when combined with NOx in
ambient air in the presence of sunlight. Photochemical smog is not a problem in this area of the state.
The regulatory default option and rural environment were used in the models. The Auer Method, which
determines the characteristics of a modeling area, was used to confirm that the land use surrounding the
proposed site in Washington County is rural, as shown in Table 5-2. Figure 5-2, a topographic map of the
area surrounding the proposed plant, denotes land use within 3 kilometers.

Prevention of Significant Deterioration Air Permit Application January 17, 2008 Plant Washington, Power4Georgians, LLC
070007.2201 5-4
Table 5-2 Land Use Analysis - Auer Method
Type Use and Structure Vegetation
50% of Land Use?
(Y/N) I1 Heavy Industrial
Major chemical, steel, and fabrication industries; generally 3- to 5-story buildings with flat roofs
Grass and tree growth extremely rare. Less than 5% vegetation. N
I2 Light-moderate Industrial Rail yards, truck depots, warehouses, industrial parks, and minor fabrications; generally 1- to 3-story buildings with flat roofs
Very limited grass; trees almost totally absent. Less than 5% vegetation.
N
C1 Commercial Office and apartment buildings and hotels; 10 stories and flat roofs
Limited grass and trees. Less than 5% vegetation. N
R2 Compact Residential Single and some multiple family dwellings with close spacing; generally 2 stories with pitched roofs; garages (via alley) and ash pits; no driveways
Limited lawn sizes and shade trees. Less than 30% vegetation.
N
R3 Compact Residential Old multi-family dwellings with close (2-meter) lateral separation; generally 2-story, flat-roof structures; garages (via alley) and ash pits; no driveways
Limited lawn sizes and old, established shade tress. Less than 35% vegetation.
N
Conclusion – Urban or Rural? Rural
Modeling Area
Completed by: LMG 1/17/08 Checked by: SAK 1/17/08
Each emission source was modeled at its maximum hourly emission rate for all modeled pollutants. Table 5-3
summarizes the emission rates and modeling parameters that were used for the on-site modeled emission
sources in the screen model runs.

Prevention of Significant Deterioration Air Permit Application January 17, 2008 Plant Washington, Power4Georgians, LLC
070007.2201 5-5
Figure 5-1 Aerial Photograph Showing 3-Kilometer Radius around Proposed Site
Prepared by: FC 1/17/08 Checked by: SAK 1/17/08

Prevention of Significant Deterioration Air Permit Application January 17, 2008 Plant Washington, Power4Georgians, LLC
070007.2201 5-6
Figure 5-2 Entire Modeling Receptor Set
3645000
3650000
3655000
3660000
3665000
3670000
3675000
320000 325000 330000 335000 340000 345000 350000 355000
UTM East, m
UT
M N
orth
, m
Prepared by: LMG 1/17/08 Checked by: SAK 1/17/08

Prevention of Significant Deterioration Air Permit Application January 17, 2008 Plant Washington, Power4Georgians, LLC
070007.2201 5-7
Table 5-3 Screen Modeling Source Emissions
PM2.5
24 HourPM2.5
AnnualPM10
24 HourPM10
Annual
SO2
3 and 24 Hour
SO2
AnnualNOx
CO 1-Hour
CO 8-Hour Pb HF H2SO4 Temperature Height Diameter Velocity Temperature
East (m) North (m) g/s g/s g/s g/s g/s g/s g/s g/s g/s g/s g/s g/s °F m m m/s KCoal-fired Boiler 337088.13 3659815.90 10.75 10.75 18.82 18.82 125.50 94.12 52.29 313.74 156.87 1.77E-02 0.31 5.23 140 137.16 9.14 18.55 333Auxiliary Boiler 337338.40 3659776.00 7.26E-02 7.26E-02 0.60 0.60 1.51 1.51 3.02 2.54E-01 2.54E-01 2.72E-04 2.82E-04 1.81E-03 275 27.43 1.52 19.81 408Cooling Tower No. 1 337021.84 3659703.97 2.78E-05 2.78E-05 6.35E-03 6.35E-03 - - - - - - - - 68.00 15.24 12.19 6.07 293Cooling Tower No. 2 337033.91 3659716.04 2.78E-05 2.78E-05 6.35E-03 6.35E-03 - - - - - - - - 68.00 15.24 12.19 6.07 293Cooling Tower No. 3 337033.91 3659691.90 2.78E-05 2.78E-05 6.35E-03 6.35E-03 - - - - - - - - 68.00 15.24 12.19 6.07 293Cooling Tower No. 4 337045.97 3659703.97 2.78E-05 2.78E-05 6.35E-03 6.35E-03 - - - - - - - - 68.00 15.24 12.19 6.07 293Cooling Tower No. 5 337045.97 3659679.83 2.78E-05 2.78E-05 6.35E-03 6.35E-03 - - - - - - - - 68.00 15.24 12.19 6.07 293Cooling Tower No. 6 337058.04 3659691.90 2.78E-05 2.78E-05 6.35E-03 6.35E-03 - - - - - - - - 68.00 15.24 12.19 6.07 293Cooling Tower No. 7 337058.04 3659667.76 2.78E-05 2.78E-05 6.35E-03 6.35E-03 - - - - - - - - 68.00 15.24 12.19 6.07 293Cooling Tower No. 8 337070.11 3659679.83 2.78E-05 2.78E-05 6.35E-03 6.35E-03 - - - - - - - - 68.00 15.24 12.19 6.07 293Cooling Tower No. 9 337070.11 3659655.69 2.78E-05 2.78E-05 6.35E-03 6.35E-03 - - - - - - - - 68.00 15.24 12.19 6.07 293Cooling Tower No. 10 337082.18 3659667.76 2.78E-05 2.78E-05 6.35E-03 6.35E-03 - - - - - - - - 68.00 15.24 12.19 6.07 293Cooling Tower No. 11 337082.18 3659643.62 2.78E-05 2.78E-05 6.35E-03 6.35E-03 - - - - - - - - 68.00 15.24 12.19 6.07 293Cooling Tower No. 12 337094.25 3659655.69 2.78E-05 2.78E-05 6.35E-03 6.35E-03 - - - - - - - - 68.00 15.24 12.19 6.07 293Cooling Tower No. 13 337094.25 3659631.55 2.78E-05 2.78E-05 6.35E-03 6.35E-03 - - - - - - - - 68.00 15.24 12.19 6.07 293Cooling Tower No. 14 337106.32 3659643.62 2.78E-05 2.78E-05 6.35E-03 6.35E-03 - - - - - - - - 68.00 15.24 12.19 6.07 293Cooling Tower No. 15 337106.32 3659619.48 2.78E-05 2.78E-05 6.35E-03 6.35E-03 - - - - - - - - 68.00 15.24 12.19 6.07 293Cooling Tower No. 16 337118.39 3659631.55 2.78E-05 2.78E-05 6.35E-03 6.35E-03 - - - - - - - - 68.00 15.24 12.19 6.07 293Cooling Tower No. 17 337118.39 3659607.41 2.78E-05 2.78E-05 6.35E-03 6.35E-03 - - - - - - - - 68.00 15.24 12.19 6.07 293Cooling Tower No. 18 337130.46 3659619.48 2.78E-05 2.78E-05 6.35E-03 6.35E-03 - - - - - - - - 68.00 15.24 12.19 6.07 293Cooling Tower No. 19 337130.46 3659595.34 2.78E-05 2.78E-05 6.35E-03 6.35E-03 - - - - - - - - 68.00 15.24 12.19 6.07 293Cooling Tower No. 20 337142.53 3659607.41 2.78E-05 2.78E-05 6.35E-03 6.35E-03 - - - - - - - - 68.00 15.24 12.19 6.07 293Cooling Tower No. 21 337142.53 3659583.27 2.78E-05 2.78E-05 6.35E-03 6.35E-03 - - - - - - - - 68.00 15.24 12.19 6.07 293Cooling Tower No. 22 337154.60 3659595.34 2.78E-05 2.78E-05 6.35E-03 6.35E-03 - - - - - - - - 68.00 15.24 12.19 6.07 293Cooling Tower No. 23 337154.60 3659571.20 2.78E-05 2.78E-05 6.35E-03 6.35E-03 - - - - - - - - 68.00 15.24 12.19 6.07 293Cooling Tower No. 24 337166.67 3659583.27 2.78E-05 2.78E-05 6.35E-03 6.35E-03 - - - - - - - - 68.00 15.24 12.19 6.07 293Cooling Tower No. 25 337166.67 3659559.13 2.78E-05 2.78E-05 6.35E-03 6.35E-03 - - - - - - - - 68.00 15.24 12.19 6.07 293Cooling Tower No. 26 337178.74 3659571.20 2.78E-05 2.78E-05 6.35E-03 6.35E-03 - - - - - - - - 68.00 15.24 12.19 6.07 293Cooling Tower No. 27 337178.74 3659547.06 2.78E-05 2.78E-05 6.35E-03 6.35E-03 - - - - - - - - 68.00 15.24 12.19 6.07 293Cooling Tower No. 28 337190.81 3659559.13 2.78E-05 2.78E-05 6.35E-03 6.35E-03 - - - - - - - - 68.00 15.24 12.19 6.07 293Cooling Tower No. 29 337190.81 3659534.99 2.78E-05 2.78E-05 6.35E-03 6.35E-03 - - - - - - - - 68.00 15.24 12.19 6.07 293Cooling Tower No. 30 337202.88 3659547.06 2.78E-05 2.78E-05 6.35E-03 6.35E-03 - - - - - - - - 68.00 15.24 12.19 6.07 293Cooling Tower No. 31 337202.88 3659522.92 2.78E-05 2.78E-05 6.35E-03 6.35E-03 - - - - - - - - 68.00 15.24 12.19 6.07 293Cooling Tower No. 32 337214.95 3659534.99 2.78E-05 2.78E-05 6.35E-03 6.35E-03 - - - - - - - - 68.00 15.24 12.19 6.07 293Cooling Tower No. 33 337214.95 3659510.86 2.78E-05 2.78E-05 6.35E-03 6.35E-03 - - - - - - - - 68.00 15.24 12.19 6.07 293Cooling Tower No. 34 337227.02 3659522.92 2.78E-05 2.78E-05 6.35E-03 6.35E-03 - - - - - - - - 68.00 15.24 12.19 6.07 293Crusher House Dust Collector 337335.40 3660114.80 2.07E-02 2.07E-02 0.130 0.130 - - - - - - - - 68.00 30.48 0.91 17.25 293Tripper Decker 337350.40 3659853.00 1.56E-02 1.56E-02 9.72E-02 9.72E-02 - - - - - - - - 68.00 59.13 0.79 17.45 293Limestone Preparation Building 337101.10 3659891.40 7.29E-03 7.29E-03 2.70E-02 2.70E-02 - - - - - - - - - 18.29 54.81 0.001 293Fly Ash Mechanical Exhausters (2) 337222.30 3659877.30 7.42E-03 7.42E-03 1.30E-02 1.30E-02 - - - - - - - - 258 47.24 53.78 0.001 399Fly Ash Silo 337222.30 3659890.40 4.63E-03 4.63E-03 8.10E-03 8.10E-03 - - - - - - - - 177 47.24 54.81 0.001 354Mercury Storage and Handling 337237.60 3659870.40 2.03E-03 2.03E-03 2.03E-03 2.03E-03 - - - - - - - - - 22.86 24.51 0.001 293SO3 Storage and Handling 337228.50 3659870.40 2.03E-03 2.03E-03 2.03E-03 2.03E-03 - - - - - - - - - 22.86 24.51 0.001 293Soda Ash Storage and Handling 337293.70 3659690.70 1.01E-03 1.01E-03 1.01E-03 1.01E-03 - - - - - - - - - 22.86 24.51 0.001 293Hydrated Lime Storage and Handling 337293.70 3659684.60 2.73E-04 2.73E-04 1.01E-03 1.01E-03 - - - - - - - - - 22.86 24.51 0.001 293PRB Stackout 337317.75 3660421.69 1.30E-03 1.30E-03 8.10E-03 8.10E-03 - - - - - - - - 68 33.53 30.02 0.001 293Illinois No. 6 Stackout 337313.30 3660516.57 1.30E-03 1.30E-03 8.10E-03 8.10E-03 - - - - - - - - 68 27.43 30.02 0.001 293Limestone Stackout 337169.45 3660003.07 2.19E-03 2.19E-03 8.10E-03 8.10E-03 - - - - - - - - 68 21.34 30.02 0.001 293
UTM Coordinates
Completed by: LMG 1/17/08 Checked by: SAK 1/17/08

Prevention of Significant Deterioration Air Permit Application January 17, 2008 Plant Washington, Power4Georgians, LLC
070007.2201 5-8
Table 5-3 Screen Modeling Source Emissions (Continued)
PM2.5
24 HourPM2.5
AnnualPM10
24 HourPM10
Annual
PM10
Emission Rate per
Unit Area
PM2.5
Emission Rate per
Unit Area
Release Height Vertices Release
Height
Initial Lateral
Dimension
Initial Vertical
Dimension
East (m) North (m) g/s g/s g/s g/s g/m2-s g/m2-s m - m m mBottom Ash Storage and Handling System 337315.58 3659846.66 1.15E-04 1.15E-04 7.57E-04 7.57E-04 2.95E-06 4.46E-07 3.05 4 - - -Solid Material Handling-Ash 337801.37 3660642.88 5.21E-03 5.21E-03 9.48E-03 9.48E-03 1.99E-08 1.09E-08 6.86 8 - - -Solid Material Handling-Gypsum 338256.02 3659829.94 5.21E-03 5.21E-03 9.48E-03 9.48E-03 8.78E-09 4.82E-09 6.86 16Limestone Rail Unloading 337262.54 3660047.50 9.05E-06 9.05E-06 5.98E-05 5.98E-05 3.55E-07 5.38E-08 4.57 4 - - -Coal Rail Unloading 337509.97 3660430.83 5.60E-05 5.60E-05 3.70E-04 3.70E-04 2.21E-06 3.35E-07 4.57 4 - - -Limestone Storage and Handling 337169.45 3660003.07 2.24E-03 8.46E-05 1.58E-02 5.64E-04 - - - - 2.90 26.79 1.35Inactive PRB Coal Pile Storage and Handling 337143.92 3660318.92 5.20E-03 5.20E-03 5.89E-02 5.89E-02 - - - - 15.28 63.80 7.11Inactive Illinois No. 6 Coal Pile Storage and Handling 337143.92 3660554.71 5.20E-03 5.20E-03 5.89E-02 5.89E-02 - - - - 11.70 53.16 5.44Active PRB Coal Pile 337317.75 3660421.69 4.44E-03 2.63E-04 2.96E-02 1.74E-03 - - - - 15.21 10.14 7.08Active Illinois No. 6 Coal Pile 337313.30 3660516.57 4.44E-03 2.63E-04 2.96E-02 1.74E-03 - - - - 15.21 10.14 7.08Solid Material Handling Haul Road Node 1 337237.54 3659890.21 1.12E-04 1.12E-04 7.48E-04 7.48E-04 - - - - 2.44 4.48 1.7Solid Material Handling Haul Road Node 2 337266.14 3659897.90 1.12E-04 1.12E-04 7.48E-04 7.48E-04 - - - - 2.44 4.48 1.7Solid Material Handling Haul Road Node 3 337294.15 3659907.74 1.12E-04 1.12E-04 7.48E-04 7.48E-04 - - - - 2.44 4.48 1.7Solid Material Handling Haul Road Node 4 337324.63 3659907.74 1.12E-04 1.12E-04 7.48E-04 7.48E-04 - - - - 2.44 4.48 1.7Solid Material Handling Haul Road Node 5 337355.11 3659907.74 1.12E-04 1.12E-04 7.48E-04 7.48E-04 - - - - 2.44 4.48 1.7Solid Material Handling Haul Road Node 6 337385.59 3659907.74 1.12E-04 1.12E-04 7.48E-04 7.48E-04 - - - - 2.44 4.48 1.7Solid Material Handling Haul Road Node 7 337416.07 3659907.74 1.12E-04 1.12E-04 7.48E-04 7.48E-04 - - - - 2.44 4.48 1.7Solid Material Handling Haul Road Node 8 337446.45 3659908.93 1.12E-04 1.12E-04 7.48E-04 7.48E-04 - - - - 2.44 4.48 1.7Solid Material Handling Haul Road Node 9 337467.28 3659930.67 1.12E-04 1.12E-04 7.48E-04 7.48E-04 - - - - 2.44 4.48 1.7Solid Material Handling Haul Road Node 10 337486.88 3659954.02 1.12E-04 1.12E-04 7.48E-04 7.48E-04 - - - - 2.44 4.48 1.7Solid Material Handling Haul Road Node 11 337507.83 3659976.08 1.12E-04 1.12E-04 7.48E-04 7.48E-04 - - - - 2.44 4.48 1.7Solid Material Handling Haul Road Node 12 337533.39 3659992.54 1.12E-04 1.12E-04 7.48E-04 7.48E-04 - - - - 2.44 4.48 1.7Solid Material Handling Haul Road Node 13 337562.23 3660002.17 1.12E-04 1.12E-04 7.48E-04 7.48E-04 - - - - 2.44 4.48 1.7Solid Material Handling Haul Road Node 14 337592.55 3660004.53 1.12E-04 1.12E-04 7.48E-04 7.48E-04 - - - - 2.44 4.48 1.7Solid Material Handling Haul Road Node 15 337623.03 3660004.53 1.12E-04 1.12E-04 7.48E-04 7.48E-04 - - - - 2.44 4.48 1.7Solid Material Handling Haul Road Node 16 337653.51 3660004.53 1.12E-04 1.12E-04 7.48E-04 7.48E-04 - - - - 2.44 4.48 1.7Solid Material Handling Haul Road Node 17 337683.99 3660004.53 1.12E-04 1.12E-04 7.48E-04 7.48E-04 - - - - 2.44 4.48 1.7Solid Material Handling Haul Road Node 18 337714.47 3660004.53 1.12E-04 1.12E-04 7.48E-04 7.48E-04 - - - - 2.44 4.48 1.7Solid Material Handling Haul Road Node 19 337744.95 3660004.53 1.12E-04 1.12E-04 7.48E-04 7.48E-04 - - - - 2.44 4.48 1.7Solid Material Handling Haul Road Node 20 337775.43 3660004.53 1.12E-04 1.12E-04 7.48E-04 7.48E-04 - - - - 2.44 4.48 1.7Solid Material Handling Haul Road Node 21 337805.82 3660006.54 1.12E-04 1.12E-04 7.48E-04 7.48E-04 - - - - 2.44 4.48 1.7
Area Source Volume Source
UTM Coordinates
Completed by: LMG 1/17/08 Checked by: SAK 1/17/08

Prevention of Significant Deterioration Air Permit Application January 17, 2008 Plant Washington, Power4Georgians, LLC
070007.2201 5-9
5.2 FUGITIVE PARTICULATE MODELING
The modeling of fugitive PM10 and PM2.5 emissions from the paved SMHF haul road followed the procedures
outlined in the Georgia EPD “Guideline for assuring acceptable ambient concentration of PM10 in areas
impacted by quarry operation producing crushed stones – October 15, 2004”. Emissions from the paved
SMHF haul road were estimated using the AP-42 equations outlined in the quarry modeling guidance. For
emission estimation purposes the SMHF haul road was divided into segments and the amount of traffic
through the Washington county power plant was estimated based on the amount of ash and gypsum generated
from coal combustion. The AP-42 calculations utilize average truck weights, number of wheels on the trucks,
silt content, and silt moisture content to calculate the lbs of PM10/ PM2.5 emissions per vehicle mile traveled.
Estimates for the number of trucks trips and the length of the SMHF haul road were then used to calculate the
total traveled distance. The total travel distance and PM emission factors were used to calculate emissions for
each road segment. Sample calculations are included in Exhibit A of the permit application.
Once each road segment’s PM10/PM2.5 emissions were calculated, each segment was divided into the
appropriate volume sources as outlined in the quarry modeling guidance. The Site layout found in Exhibit B
provides a map of the site, which locates all road segments included in the modeling analysis. The SMHF
haul road was modeled as 10 foot x 40 foot volume sources. The effective height for all road dust volume
sources were estimated at 8 feet in accordance with modeling guidance.
Emissions from the SMHF and the PRB and Illinois No. 6 Inactive Coal Piles were calculated based on
emission factor equations obtained from AP-42 Table 11.9-1. The emission factor equations utilize silt and
moisture contents to calculate PM10/PM2.5 emission rates, which were obtained from AP-42 Table 11.9-3.
Once emissions were calculated, each source was modeled as an area poly source as outlined in Section
3.3.2.3 of the AERMOD User Guide (September 2004).
Drop point emissions from Coal Rail Unloading, Limestone Rail Unloading, and Bottom Ash Transfer were
calculated using the drop point emission factor equation found in AP-42 Section 13.2.4.3. The equation
utilizes the mean wind speed and moisture content of the material being handled to calculate an emission per
unit ton of material handled factor. After computing emission rates, each drop point was modeled as an area
poly source according to Section 3.3.2.3 of the AERMOD User Guide (September 2004).
Emissions from the Powder River Basin and Illinois No. 6 Active Piles were calculated using the Industrial
Wind Erosion equations found in AP-42 (Section 13.2.5).

Prevention of Significant Deterioration Air Permit Application January 17, 2008 Plant Washington, Power4Georgians, LLC
070007.2201 5-10
5.3 METEOROLOGICAL DATA
The Georgia EPD provided MACTEC with AERMET (version 06341) pre-processed meteorological data
files based on surface data for the Macon Airport meteorological station and upper air data from the
Centreville meteorological station for the 1987-1991 five year period. The development of the AERMET
data set requires the assessment of surface characteristics of the surface meteorological station. These
characteristics include albedo, bowen ratio, and surface roughness. Albedo is the fraction of total incident
solar radiation reflected by the surface back to space without absorption, bowen ratio is an indicator of surface
moisture, and surface roughness length is related to the height of obstacles in relation to wind flow. The
AERMET data was processed using the surface characteristics assessed by Georgia EPD. A comparative
analysis of surface characteristics surrounding the Plant Washington in Sandersville, Georgia and the surface
meteorological station was conducted, according to the AERMOD Interim Guidance document.
The surface characteristics surrounding Plant Washington were compared to surface characteristics
surrounding the surface meteorological station at the Macon Airport. Figure 5-3 is an aerial photo centered
on the Macon airport surface meteorological data station and Figure 5-4 is an aerial photo of the Plant
Washington. Each aerial photo was divided into the four sections: Section 1 from 350° to 80°, Section 2 from
80° to 140°, Section 3 from 140° to 220°, and Section 4 from 220° to 350°. These segments corresponded to
the segments that were used in the AERMET processing. Table 5-4 shows a qualitative comparison between
the surface characteristics at the proposed coal-fired power plant and the Macon Airport. Based on this
comparative analysis, the Macon Airport justifiably represents the meteorological conditions at the proposed
site.

Prevention of Significant Deterioration Air Permit Application January 17, 2008 Plant Washington, Power4Georgians, LLC
070007.2201 5-11
Figure 5-3 Aerial View of Macon Surface Meteorological Station in Macon, Georgia
Prepared by: FC 1/17/08 Checked by: SAK 1/17/08

Prevention of Significant Deterioration Air Permit Application January 17, 2008 Plant Washington, Power4Georgians, LLC
070007.2201 5-12
Figure 5-4 Aerial View of Plant Washington in Sandersville, Georgia
Prepared by: FC 1/17/08 Checked by: SAK 1/17/08

Prevention of Significant Deterioration Air Permit Application January 17, 2008 Plant Washington, Power4Georgians, LLC
070007.2201 5-13
Table 5-4 Qualitative Comparisons between the Surface Characteristics at Plant Washigton and the Macon Airport
Surface Characteristic Macon Airport Plant Washington
Albedo – Total incident radiation reflected back into space. 0.1 – Deciduous Forest 0.9 – White Snow
Green area except for a few buildings and roads
0.1 – 0.2
Green area except for a few buildings and roads
0.1 – 0.2
Bowen Ratio – Indication of surface moisture. 0.10 – Over water 10 – Over Desert
For Sectors 1 and 3 – Elevated surface with excellent surface run-off with little standing water
~2
For Sector 2 – Poor surface run-off due to depression and poor soil permeability due to
red clay.
< 1
For Sector 4 – Primarily vegetation with good surface
run-off
~1
For Sectors 1 and 3 Excellent surface run-off with little standing water
~2
For Sector 2 – Poor infiltration due to concrete surface;
therefore, a lot of standing water
< 1
For Sector 4- Primarily
vegetation with good surface run-off
~1
Surface Roughness Length – Height of obstacles in principal where horizontal wind velocity is zero. 0.001 m – Water >1 m - for Forest or Urban
For Sectors 1 and 4 trees and buildings are at an average height of 30 ft except for airport runway
~1
For Sectors 2 and 3 – areas are
predominantly green fields
<1
For Sectors 1 and 4 trees, are at an average height of 30 ft except for cultivated areas
~1
For Sectors 2 and 3 – areas are
predominantly green fields and cultivated areas
<1
Completed by: LMG 1/17/08 Checked by: SAK 1/17/08
5.4 PSD SCREEN MODELING RESULTS
The screen modeling for PM10, PM2.5, NOx, CO, SO2, VOC, Pb, and Fluorides (as HF) were used to determine
whether the emission increases resulted in concentrations that exceed the SILs or the significant monitoring
levels. Refined modeling is required and preconstruction monitoring must be evaluated if these significant

Prevention of Significant Deterioration Air Permit Application January 17, 2008 Plant Washington, Power4Georgians, LLC
070007.2201 5-14
levels are exceeded. Tables 5-5 through 5-8 show the results of the screen modeling for each pollutant, which
are discussed in more detail below.
5.4.1 PM2.5 Screen Model Results
The screen modeling results for PM2.5, as presented in Table 5-5, do not exceed the lowest recently proposed
SILs for the 24-hour and annual averaging periods (option 3 under the USEPA proposal). This modeling
evaluation is not a regulatory requirement under the current air quality rules; however, the results are included
to demonstrate that the project will not have a significant impact on PM2.5 concentrations in the area around
the proposed plant. The lowest of the proposed preconstruction monitoring level was also not exceeded.
Table 5-5 PM2.5 Screening Results
24-hour Averaging Period Location of Receptors (UTM) Year of
Model Run
Maximum Concentration (µg/m3) X Y
1987 1.00 338337 3658911 1988 1.01 338037 3659711 1989 1.10 338037 3659711 1990 0.97 337937 3659411 1991 0.97 338537 3659411
Significant Monitoring Level: 2.3 µg/m3 Significant Impact Level: 1.2 µg/m3
Annual Averaging Period Location of Receptors (UTM) Year of
Model Run
Maximum Concentration (µg/m3) X Y
1987 0.15 337701.50 3659868.00 1988 0.16 337889.62 3659844.50 1989 0.19 338084.12 3659798.00 1990 0.15 338084.12 3659798.00 1991 0.15 337701.5 3659868.00
Significant Impact Level: 0.3 µg/m3 µg/m3 = micrograms per cubic meter km = Kilometer
Completed by: LMG 1/17/08 Checked by: SAK 1/17/08

Prevention of Significant Deterioration Air Permit Application January 17, 2008 Plant Washington, Power4Georgians, LLC
070007.2201 5-15
5.4.2 PM10 Screen Model Results
The screen modeling results for PM10, as presented in Table 5-6, do not exceed the SILs for the 24-hour and
annual averaging periods; therefore, refined modeling is not required for the pollutant. The preconstruction
monitoring level was also not exceeded.
Table 5-6 PM10 Screening Results
24-hour Averaging Period Location of Receptors (UTM) Year of
Model Run
Maximum Concentration
(µg/m3) X Y
1987 3.80 337214.66 3660874.25 1988 4.20 336838.34 3660738.75 1989 4.49 337214.66 3660874.25 1990 4.06 337026.09 3660807.50 1991 4.22 336931.34 3360774.00
Significant Impact Level: 5 µg/m Significant Monitoring Concentration: 10 µg/m3
Annual Averaging Period Location of Receptors (UTM) Year of
Model Run
Maximum Concentration
(µg/m3) X Y
1987 0.60 337026.09 3660807.50 1988 0.67 336931.94 3660774.00 1989 0.73 336931.94 3660774.00 1990 0.67 337026.09 3660807.50 1991 0.55 337026.09 3660807.50
Significant Impact Level: 1 µg/m3 µg/m3 = Micrograms per cubic meter km = Kilometer
Completed by: LMG 1/17/08 Checked by: SAK 1/17/08

Prevention of Significant Deterioration Air Permit Application January 17, 2008 Plant Washington, Power4Georgians, LLC
070007.2201 5-16
5.4.3 NOx Screen Model Results
The NOx screen model results, as presented in Table 5-7 do not exceed the NOx SIL on an annual averaging
period basis; therefore a refined modeling evaluation is not required. The modeled results also did not exceed
the significant monitoring concentration.
Table 5-7 NOx Screening Results
YearMaximum
Concentration- µg/m3 East North
1987 0.59 338137 36590111988 0.57 338137 36592111989 0.65 338237 36596111990 0.57 338137 36591111991 0.56 338137 3659111
UTM Coordinate (m)
NOx Annual Screen Results
PSD Significance Level: 1 µg/m3
Completed by: LMG 1/17/08 Checked by: SAK 1/17/08

Prevention of Significant Deterioration Air Permit Application January 17, 2008 Plant Washington, Power4Georgians, LLC
070007.2201 5-17
5.4.4 CO Screen Model Results
As shown in Table 5-8, the modeled emissions do not exceed the CO SILs on a 1-hour or 8-hour averaging
period. This result indicates that no further modeling is required. The significant monitoring concentration
was also not exceeded; therefore, preconstruction monitoring is not required for CO.
Table 5-8 CO Screening Results
Maximum Concentration
µg/m3 East North1987 124.2 337937 36612111988 127.2 335337 36623111989 113.3 338037 36620111990 105.1 337437 36627111991 97.1 337037 3662211
Maximum Concentration
µg/m3 East North1987 27.6 336137 36590111988 32.2 338037 36596111989 35.5 338037 36597111990 32.5 337937 36594111991 30.1 337437 3658911
UTM Coordinate (m)
UTM Coordinate (m)
Year
Year
PSD Significance Level: 500 µg/m3
CO 8-Hour Screen ResultsPSD Significance Level: 2,000 µg/m3
CO 1-Hour Screen Results
Completed by: LMG 1/17/08
Checked by: SAK 1/17/08

Prevention of Significant Deterioration Air Permit Application January 17, 2008 Plant Washington, Power4Georgians, LLC
070007.2201 5-18
5.4.5 SO2 Screen Model Results
The SO2 screen model results, as presented in Table 5-9, exceed the SO2 SILs for all averaging periods;
therefore, a refined modeling analysis is required. The modeled results do not exceed the significant
monitoring concentration.
Table 5-9 SO2 Screening Results
3-hour Averaging Period
Location of Receptors (UTM) Area of Impact Radius
Year of Model Run
Maximum Concentration
(µg/m3) X Y (km) 1987 31.17 337737 3659111 1.85 1988 28.44 338037 3659711 1.33 1989 32.53 338037 3659711 1.47 1990 31.35 337837 3659311 1.47 1991 30.41 336537 3658911 1.45
Significant Impact Level: 25 µg/m3 Max.: 1.85
24-hour Averaging Period
Location of Receptors (UTM) Area of Impact Radius
Year of Model Run
Maximum Concentration
(µg/m3) X Y (km) 1987 11.23 338337 3658911 5.38 1988 10.66 338137 3659611 4.01 1989 11.08 338037 3659611 4.98 1990 10.63 337937 3659411 4.89 1991 10.88 338637 3659411 4.96
Significant Impact Level: 5 µg/m3 Max: 5.38
Significant Monitoring Concentration: 13 µg/m3
Annual Averaging Period
Location of Receptors (UTM) Area of Impact Radius
Year of Model Run
Maximum Concentration
(µg/m3) X Y (km) 1987 1.06 338137 3659011 1.60 1988 1.03 338137 3659211 1.39 1989 1.17 338237 3659611 1.65 1990 1.02 338137 3659111 1.35 1991 1.01 338137 3659111 1.35
Significant Impact Level: 1 µg/m3 Max.: 1.65 km = Kilometer
Completed by: LMG 1/17/08 Checked by: SAK 1/17/08

Prevention of Significant Deterioration Air Permit Application January 17, 2008 Plant Washington, Power4Georgians, LLC
070007.2201 5-19
5.4.6 Hydrogen Fluoride Screen Model Results
The HF screen model results, as presented in Table 5-10, did not exceed the HF significant monitoring
concentration on a 24-hour averaging period basis.
Table 5-10 HF Screening Results
24-Hour Averaging Period Location of Receptors (UTM) Year of
Model Run
Maximum Concentration
(µg/m3) X Y
1987 0.02775 338337 3658911 1988 0.02633 338137 3659611 1989 0.02737 338037 3659611 1990 0.02625 337937 3659411 1991 0.02688 338637 3659411
Significant Monitoring Concentration: 0.25 µg/m3
Completed by: LMG 1/17/08 Checked by: SAK 1/17/08
5.4.7 Lead Screen Model Results
The Pb screen model results, as presented in Table 5-11, did not exceed the Pb significant monitoring
concentration on a quarterly averaging period basis.
Table 5-11 Pb Screening Results
Calendar Quarter Averaging Period1 Location of Receptors (UTM) Year of
Model Run
Maximum Concentration
(µg/m3) X Y
1987 0.00189 337937 3661211 1988 0.00194 335337 3662311 1989 0.00173 338037 3662011 1990 0.00160 337437 3662711 1991 0.00148 337037 3662211
Significant Monitoring Concentration: 0.10 µg/m3 1. Multiplied the 1-hr average result by 0.27 to convert to Calendar Quarter Average per USEPA “A Screening Procedure for the impacts of Air Pollution Sources on Plants, Soils, and Animals” (EPA/2-81-078 December 1980)
Completed by: LMG 1/17/08 Checked by: SAK 1/17/08

Prevention of Significant Deterioration Air Permit Application January 17, 2008 Plant Washington, Power4Georgians, LLC
070007.2201 5-20
5.4.8 Alternative Modeling Evaluations
The primary goal of the above modeling evaluation was to demonstrate that the proposed plant will achieve
compliance with all air quality standards during worst case operational conditions, which will occur during
the majority of the time. Two additional operational modes (reduced load operation and startup operation)
were evaluated for their potential impacts on air quality. The results from these evaluations are discussed in
detail below.
5.4.8.1 Reduced Load Operational Evaluation
The proposed plant will at times operate at reduced loads (estimated at 40% production capacity) during the
shoulder months (typically during spring and fall when power demands are below peak levels). The screen
models were therefore rerun at this reduced operational load to evaluate the impact on air quality. The
process (boiler/turbine) is less efficient at this reduced power production load. To produce 40% power the
boiler will have to operate at approximately 50% fuel firing rate. This means that emissions and air flow rate
from the main boiler stack will be at 50% of the previously modeled levels. The plant will continue to meet
all its emission limits on a lb/MMBtu basis during this reduced loading period. Table 5-12 below summarizes
the results of this modeling analysis. The results from this analysis found that the maximum impacts for all
pollutants are below the significant impact levels, except for SO2, for which a refined modeling analysis was
completed.
Table 5-12 40% Load and Startup Model Modeling Results
Pollutant Avg. Period Significant Impact
Level (µg/m3) 40% Operational
Load Mode (µg/m3) Startup Mode
(µg/m3) PM2.5 24-hr 1.20 0.91 1.18 PM2.5 Annual 0.30 0.19 0.195 PM10 24-hr 5 4.46 4.53 PM10 Annual 1 0.72 0.73 SO2 3-hr 25 25.68 32.98 SO2 24-hr 5 8.76 12.79 SO2 Annual 1 1.30 1.54 CO 8-hr 500 53.82 81.09 CO 1-hr 2,000 80.15 369.55
NOx Annual 1 0.54 0.78
Completed by: LMG 1/17/08 Checked by: SAK 1/17/08

Prevention of Significant Deterioration Air Permit Application January 17, 2008 Plant Washington, Power4Georgians, LLC
070007.2201 5-21
5.4.8.2 Startup Modeling Results
In addition to the 40% load conditions a modeling evaluation was also completed for the startup/shutdown
conditions. All pollution control equipment will be operated during the startup of the boiler except for the
SCR system. The SCR is ineffective below a certain temperature (approx. 450 degrees F) and therefore
would not reduce NOx if operated. The injection of ammonia into the flue gas during cold conditions can
result in the corrosion of the downstream pollution control equipment. For this reason, the SCR will not be
operating at maximum capacity until the startup process is complete. The NOx emissions during the startup
will therefore have the potential to be greater than that at normal 100 percent load conditions for brief periods
of time. CO emissions from the boiler will also be greater than their maximum 100 percent capacity levels for
brief periods during the startup period as the unit achieves stable combustion.
In addition the auxiliary boiler will be operated during both startup and shutdown of the main boiler. The
primary purpose of the auxiliary boiler operation is to provide steam to the turbine during the startup and
shutdown periods so as to prevent damage to the unit, which could be caused by large swings in steam
loading to the turbine. The startup mode modeling included the operation of the auxiliary boiler at maximum
firing rate 876 hr/yr (the maximum expected hours of operation) and includes 10 cold startups of the main
boiler per year (an expected typical value for the boiler). The AERMOD model allows for the input of
variable hourly emission rates for a given pollutant. A variable emission rate file was developed for all
modeled pollutants from the main and auxiliary boilers with the above identified operational conditions.
5.5 SIGNIFICANT IMPACT AREA DETERMINATION AND DETERMINATION OF OFF-SITE EMISSIONS DATA FOR REFINED SO2 MODELING
The Area of Impact (AOI) was determined to be a circular area with the radius extending from the center of
Plant Washington to the farthest point that exceeds the applicable SIL as predicted by the screen model.
Refined modeling is required for all receptors within the AOI. Five years of meteorological data were used to
determine the worst-case AOI for SO2 and each averaging period. Figures 5-5 through 5-7 show the analysis
output for each pollutant’s averaging period for the corresponding worst-case years (largest AOI).
USEPA guidance states that 50 kilometers must be added to the impact radius to complete the off-site
emission source retrieval. A list of sources emitting SO2 within 56 kilometers of the proposed site was
requested from GA EPD to determine the off-site sources that would required to be included in the modeling.
GA EPD provided spreadsheets that identified all sources within the SIA, along with their corresponding

Prevention of Significant Deterioration Air Permit Application January 17, 2008 Plant Washington, Power4Georgians, LLC
070007.2201 5-22
emission rates and stack parameters. These spreadsheets also identified the sources’ status as “PSD increment
consuming,” or “PSD increment expander” for increment-modeling purposes. The PSD-increment-
consuming sources were modeled as positive emission rates and the PSD-expanding sources were modeled as
negative emission rates for the PSD increment models. For the purposes of completing the NAAQS
modeling, the Georgia EPD provided the 2005 emission inventory database. All sources of SO2 emissions in
the database that are within 56 km of the proposed site were included in the modeling evaluation. The stack
parameters from the database were used in the modeling analysis. The emission rates were, however, based
on a review of each plant’s Title V permit applications and Title V permits. This data review was completed
to determine the allowable SO2 emissions rate for each source being modeled. All NAAQS models included
the increment consumers. Exhibit C provides the modeled data for all off site sources included in the refined
SO2 modeling.

Prevention of Significant Deterioration Air Permit Application January 17, 2008 Plant Washington, Power4Georgians, LLC
070007.2201 5-23
Figure 5-5 Significant Impact Area: 1987 SO2 Screening Results, 3-hour
Completed by: LMG 1/17/08
Checked by: SAK 1/17/08

Prevention of Significant Deterioration Air Permit Application January 17, 2008 Plant Washington, Power4Georgians, LLC
070007.2201 5-24
Figure 5-6 Significant Impact Analysis: 1987 SO2 Screening Results, 24-hour
Completed by: LMG 1/17/08
Checked by: SAK 1/17/08

Prevention of Significant Deterioration Air Permit Application January 17, 2008 Plant Washington, Power4Georgians, LLC
070007.2201 5-25
Figure 5-7 Significant Impact Area: 1989 SO2 Screening Results, Annual
Completed by: LMG 1/17/08 Checked by: SAK 1/17/08
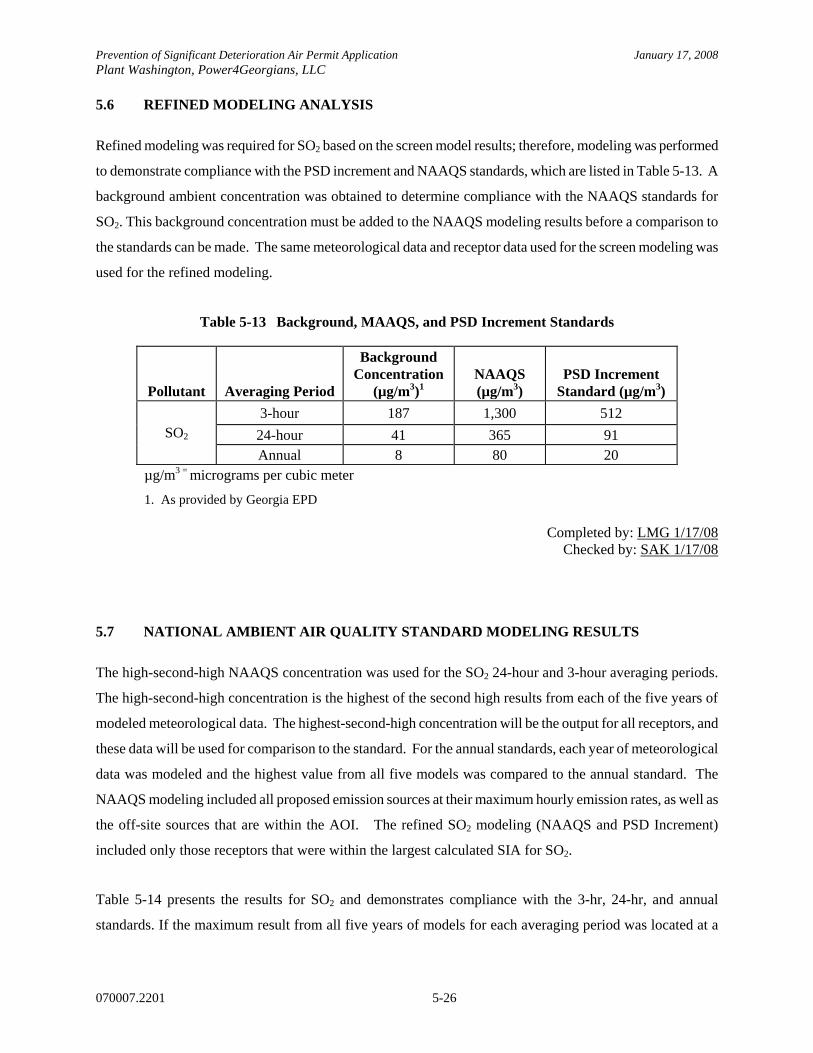
Prevention of Significant Deterioration Air Permit Application January 17, 2008 Plant Washington, Power4Georgians, LLC
070007.2201 5-26
5.6 REFINED MODELING ANALYSIS
Refined modeling was required for SO2 based on the screen model results; therefore, modeling was performed
to demonstrate compliance with the PSD increment and NAAQS standards, which are listed in Table 5-13. A
background ambient concentration was obtained to determine compliance with the NAAQS standards for
SO2. This background concentration must be added to the NAAQS modeling results before a comparison to
the standards can be made. The same meteorological data and receptor data used for the screen modeling was
used for the refined modeling.
Table 5-13 Background, MAAQS, and PSD Increment Standards
Pollutant Averaging Period
Background Concentration
(µg/m3)1 NAAQS (µg/m3)
PSD Increment Standard (µg/m3)
3-hour 187 1,300 512 24-hour 41 365 91 SO2 Annual 8 80 20
µg/m3 = micrograms per cubic meter
1. As provided by Georgia EPD
Completed by: LMG 1/17/08 Checked by: SAK 1/17/08
5.7 NATIONAL AMBIENT AIR QUALITY STANDARD MODELING RESULTS
The high-second-high NAAQS concentration was used for the SO2 24-hour and 3-hour averaging periods.
The high-second-high concentration is the highest of the second high results from each of the five years of
modeled meteorological data. The highest-second-high concentration will be the output for all receptors, and
these data will be used for comparison to the standard. For the annual standards, each year of meteorological
data was modeled and the highest value from all five models was compared to the annual standard. The
NAAQS modeling included all proposed emission sources at their maximum hourly emission rates, as well as
the off-site sources that are within the AOI. The refined SO2 modeling (NAAQS and PSD Increment)
included only those receptors that were within the largest calculated SIA for SO2.
Table 5-14 presents the results for SO2 and demonstrates compliance with the 3-hr, 24-hr, and annual
standards. If the maximum result from all five years of models for each averaging period was located at a

Prevention of Significant Deterioration Air Permit Application January 17, 2008 Plant Washington, Power4Georgians, LLC
070007.2201 5-27
receptor which was not in the 100 meter spacing area, four additional receptors at 100 meter spacing were
added around the maximum in order to ensure that the real maximum had been identified. The maximum
result from all five of these receptors (the original plus the four additional receptors) is reported in the table.
Table 5-14 SO2 NAAQS Modeling Summary
YearMaximum
Concentration- µg/m3 East North
1987 71.0 333000 36635001988 88.3 334000 36550001989 93.6 334000 36550001990 73.1 338137 36596111991 74.4 332000 3662500
YearMaximum
Concentration- µg/m3 East North
1987 22.6 337837 36591111988 26.4 334500 36645001989 24.4 338137 36597111990 25.9 338137 36591111991 22.8 338237 3659311
YearMaximum
Concentration- µg/m3 East North
1987 4.0 338037 36590111988 4.6 336037 36591111989 5.1 338137 36596111990 4.1 336137 36591111991 4.2 336137 365911
SO2 3-Hour Screen Results
UTM Coordinate (m)
NAAQS Level: 1,300 µg/m3
SO2 24-Hour Screen Results
Maximum Concentration: 93.6 µg/m3
Combined Concentration: 280.6 µg/m3Background Concentration: 187 µg/m3
NAAQS Level: 80 µg/m3
UTM Coordinate (m)
Maximum Concentration: 26.4 µg/m3
UTM Coordinate (m)
Combined Concentration: 67.4 µg/m3
Combined Concentration: 13.1 µg/m3Background Concentration: 8 µg/m3Maximum Concentration: 5.1 µg/m3
NAAQS Level: 365 µg/m3
SO2 Annual Screen Results
Background Concentration: 41 µg/m3
Completed by: JDC 1/17/08 Checked by: SAK 1/17/08

Prevention of Significant Deterioration Air Permit Application January 17, 2008 Plant Washington, Power4Georgians, LLC
070007.2201 5-28
5.8 PSD INCREMENT MODELING RESULTS
PSD increment modeling was completed in addition to NAAQS modeling. One goal of the PSD increment
modeling is to determine the increase in ground-level concentrations of SO2 since its established baseline date
(1975). Another goal is to determine whether the increases exceed the allowable PSD increments for the
corresponding pollutants. The proposed power plant is a green-field facility; therefore, all emission sources
are new and consume PSD increment.
The PSD increment model also includes off-site emission sources, which are increment consumers or
expanders. As discussed previously, the Georgia sources were identified as consumers or expanders in the
spreadsheets provided by GA EPD. The consumers were modeled as positive sources, while the expanders
were modeled as negative sources. The receptor grid and meteorological data used for the NAAQS modeling
were used for the PSD increment consumption modeling. The refined SO2 modeling (NAAQS and PSD
Increment) included only those receptors that were within the largest calculated SIA for SO2.
Table 5-15 compares the highest modeling results for the annual averaging period and the highest second high
for the 3-hour and 24-hour to the PSD SO2 increment standards. Compliance with all standards is
demonstrated.

Prevention of Significant Deterioration Air Permit Application January 17, 2008 Plant Washington, Power4Georgians, LLC
070007.2201 5-29
Table 5-15 SO2 PSD Increment Modeling Summary
CountyMaximum
Concentration- µg/m3 East North
1987 27.88 336937 36588111988 28.26 338137 36597111989 32.51 337937 36597111990 30.26 338037 36595111991 28.64 337437 3658811
YearMaximum
Concentration- µg/m3 East North
1987 9.95 338337 36588111988 10.71 338237 36596111989 11.17 338137 36596111990 10.41 338137 36594111991 10.23 337837 3659111
YearMaximum
Concentration- µg/m3 East North
1987 1.34 338137 36590111988 1.27 338137 36592111989 1.41 338237 36596111990 1.25 338137 36591111991 1.25 338137 3659111
SO2 Annual PSD Increment Standard: 20 µg/m3
SO2 24-hour PSD Increment Standard: 91 µg/m3
SO2 Annual Screen Results
UTM Coordinate (m)
PSD Increment Level: 1.41 µg/m3
SO2 3-hour PSD Increment Standard: 512 µg/m3
SO2 24-Hour Screen Results
UTM Coordinate (m)
PSD Increment Level: 11.17 µg/m3
PSD INCREMENTSO2 3-Hour Screen Results
UTM Coordinate (m)
PSD Increment Level: 32.51 µg/m3
Completed by: JDC 1/17/08 Checked by: SAK 1/17/08

Prevention of Significant Deterioration Air Permit Application January 17, 2008 Plant Washington, Power4Georgians, LLC
070007.2201 6-1
6.0 AIR TOXICS MODELING
The proposed project was evaluated for compliance with the Georgia Air Toxics program using the
“Guideline for Ambient Impact Assessment of Toxic Air Pollutant Emissions” dated June 21, 1998. The first
step was to calculate the potential emissions of all toxic pollutants from Plant Washington. The calculations
are based on USEPA AP-42 emission factors for sub-bituminous coal, natural gas, and fuel oil (distillate)
combustion. Exhibit C provides the toxic emission calculations and the development of the AACs for the
project.
For each toxic pollutant identified, an allowable ambient concentration was developed by following the
Georgia guidelines. The Georgia guidelines prioritize the available resources for toxicity data. First priority
is given to inhalation reference concentrations (RfC) and Risk Based Air Concentrations (RBAC), which are
identified in the USEPA’s Integrated Risk Information System (IRIS) database, followed by OSHA PEL
standards, ACGIH TLVs, NIOSH RELs, and LD50 toxicity data. AACs developed from worker exposure
levels are based on 40 hours/week of exposure and must be adjusted to account for the potential exposure of
the public (7 days/week, 24 hours/day). This correction along with the application of a safety factor of 300 for
carcinogenic compounds and 100 for non-carcinogenic compounds is utilized in the development of AACs
from worker exposure standards. The safety factor is applied to account for persons who may be sensitive to
exposure to these pollutants. Toxicity data taken from the IRIS database does not require any adjustments
because exposures to persons with respiratory maladies, young children, or the elderly were taken into
account in the determination of these values. Short-term exposures are addressed using OSHA, NIOSH, and
ACGIH Short Term Exposure Limits (STEL), and ceiling limits. A safety factor of 10 is universally applied
to all short-term standards.
The next step was a dispersion analysis. Each source of pollutants (main boiler and auxiliary boiler) was
modeled using the USEPA SCREEN3 model assuming an emission rate of 1 g/s. The model that resulted in
the highest Maximum Ground Level Concentration (MGLC) was assumed to be the stack with the poorest
dispersion. Table 6-1 below shows the results of this modeling for each of the sources.

Prevention of Significant Deterioration Air Permit Application January 17, 2008 Plant Washington, Power4Georgians, LLC
070007.2201 6-2
Table 6-1 SCREEN3 Modeling Results Summary
Source ID
Source Stack Height
(m)
Stack Dia. (m)
Stack Velocity
(m/s)
Stack Temp.
(K)
1-Hour MGLC from SCREEN3 Analysis
(µg/m3) MAIN Coal Fired Boiler 137.16 9.14 18.55 333 0.698
AUX Auxiliary Boiler 27.43 1.52 19.81 408 6.02
Completed by: LMG 1/17/08 Checked by: SAK 1/17/08
As shown, the Auxiliary Boiler was found to have the highest 1-hour MGLC. In order to determine the worst
case ambient air concentration for each pollutant, it was assumed that the worst case emission rate for each
toxic was emitted out of this stack. Following the Georgia guidelines, the 1-hour concentration for the actual
emission rate from each toxic was determined by a direct ratio of emission rates. The 1-hour MGLC from the
SCREEN3 model was adjusted to an annual, 24-hr continuous or short-term (15-min) concentration using the
correction factors 0.08, 0.40, and 1.32, respectively. These annual and short-term MGLC’s were then
compared to the derived AACs and short-term limits. The results of this analysis are summarized in Table 6-
2, which shows levels below the AACs for all compounds except hydrogen chloride, sulfuric acid, arsenic,
and hexavalent chromium.
As per the Georgia guidelines, ISCST3 modeling was completed for these pollutants. The results of the
analysis for the ISCST3 models are shown below in Table 6-3. The results of these models demonstrate
compliance with the Georgia air toxics program.

Prevention of Significant Deterioration Air Permit Application January 17, 2008 Plant Washington, Power4Georgians, LLC
070007.2201 6-3
Table 6-2 Toxic Emissions Summary
PollutantMain Boiler (g/s)
Auxiliary Boiler (g/s)
Total Emissions
(lb/hr)
Total Emsission
(g/s)
1-Hr MGLC (mg/m3)
Annual MGLC (mg/m3)
AAC Annual (mg/m3)
% of allowable
AAC
24-Hr MGLC (mg/m3)
AAC 24-hour
(mg/m3)
% of allowable
AAC
15-Min MGLC (mg/m3)
Short (15-min)
Term Limit (mg/m3)
% of allowable
Short Term Limit
Is Refined Modeling
Required ?
Acenaphthene 2.8E-05 4.49E-06 2.55E-04 3.22E-05 1.94E-07 1.55E-08 - - 7.76E-08 0.04 1.87E-04 % 2.56E-07 - - NOAcenaphthylene 1.4E-05 5.39E-08 1.08E-04 1.36E-05 8.21E-08 6.57E-09 - - 3.28E-08 0.12 2.70E-05 % 1.08E-07 - - NOAcetaldehyde 3.1E-02 0.00E+00 2.46E-01 3.10E-02 1.86E-04 1.49E-05 4.55E-03 0.33% 7.46E-05 - - 2.46E-04 4.50 5.47E-03 % NOAcetophenone 8.1E-04 0.00E+00 6.47E-03 8.15E-04 4.91E-06 3.93E-07 - - 1.96E-06 0.12 1.68E-03 % 6.48E-06 - - NOAcrolein 1.58E-02 0.00E+00 1.25E-01 1.57E-02 9.49E-05 7.59E-06 2.00E-05 37.95% 3.80E-05 - - 1.25E-04 0.02 0.55% NOAmmonia 6.43 0.00E+00 5.11E+01 6.43E+00 3.88E-02 3.10E-03 1.00E-01 3.10% 1.55E-02 - - 5.12E-02 2.44 2.10% NOAnthracene 1.14E-05 2.60E-07 9.26E-05 1.17E-05 7.03E-08 5.62E-09 - - 2.81E-08 4.76E-04 5.90E-03 % 9.28E-08 - - NOBenzene 7.06E-02 4.56E-05 5.61E-01 7.06E-02 4.26E-04 3.40E-05 4.55E-04 7.49% 1.70E-04 - - 5.62E-04 1.60 3.52E-02 % NOBenzo(a)anthracene 4.7E-06 8.54E-07 4.40E-05 5.55E-06 3.34E-08 2.67E-09 - - 1.34E-08 4.76E-04 2.81E-03 % 4.41E-08 - - NOBenzo(a)pyrene 2.1E-06 0.00E+00 1.64E-05 2.06E-06 1.24E-08 9.95E-10 - - 4.97E-09 4.76E-04 1.04E-03 % 1.64E-08 - - NOBenzo(b)fluoranthene - 0.00E+00 0.00E+00 0.00E+00 0.00E+00 0.00E+00 - - 0.00E+00 4.76E-04 - 0.00E+00 - - NOBenzo(g,h,i)perylene 2.6E-06 4.81E-07 2.48E-05 3.13E-06 1.88E-08 1.51E-09 - - 7.53E-09 6.21E-04 1.21E-03 % 2.49E-08 - - NOBenzo(g,h,i)pyrene 1.5E-06 0.00E+00 1.16E-05 1.47E-06 8.83E-09 7.07E-10 - - 3.53E-09 6.21E-04 5.69E-04 % 1.17E-08 - - NOBenzo(b,k)fluoranthene 6.0E-06 3.15E-07 4.99E-05 6.29E-06 3.79E-08 3.03E-09 - - 1.52E-08 4.76E-04 3.18E-03 % 5.00E-08 - - NOBenzo(k)fluoranthene - 0.00E+00 0.00E+00 0.00E+00 0.00E+00 0.00E+00 - - 0.00E+00 4.76E-04 - 0.00E+00 - - NOBenzyl chloride 3.8E-02 0.00E+00 3.02E-01 3.80E-02 2.29E-04 1.83E-05 - - 9.16E-05 1.19E-02 0.77% 3.02E-04 0.50 6.05E-02 % NOBiphenyl 9.2E-05 0.00E+00 7.33E-04 9.23E-05 5.56E-07 4.45E-08 - - 2.22E-07 2.38E-03 9.34E-03 % 7.34E-07 - - NObis(2-Ethylhexyl)phthalate 4.0E-03 0.00E+00 3.15E-02 3.96E-03 2.39E-05 1.91E-06 - - 9.55E-06 0.01 8.02E-02 % 3.15E-05 1.00 3.15E-03 % NOBromoform 2.1E-03 0.00E+00 1.68E-02 2.12E-03 1.28E-05 1.02E-06 7.00E-02 1.46E-05 % 5.10E-06 - - 1.68E-05 - - NOButane - 0.00E+00 0.00E+00 0.00E+00 0.00E+00 0.00E+00 - - 0.00E+00 5.66 - 0.00E+00 - - NO2-Butanone (MEK) 2.1E-02 0.00E+00 1.68E-01 2.12E-02 1.28E-04 1.02E-05 5.00 2.04E-06 % 5.10E-05 - - 1.68E-04 88.47 1.90E-04 % NOCarbon disulfide 7.1E-03 0.00E+00 5.60E-02 7.06E-03 4.25E-05 3.40E-06 0.70 4.86E-06 % 1.70E-05 - - 5.61E-05 9.33 6.02E-04 % NOChlorobenzene 1.2E-03 0.00E+00 9.48E-03 1.19E-03 7.20E-06 5.76E-07 - - 2.88E-06 0.83 3.45E-04 % 9.50E-06 - - NOChloroform 3.2E-03 0.00E+00 2.54E-02 3.20E-03 1.93E-05 1.54E-06 4.35E-04 0.36% 7.72E-06 - - 2.55E-05 24.00 1.06E-04 % NOChloromethane 2.9E-02 0.00E+00 2.28E-01 2.88E-02 1.73E-04 1.39E-05 - - 6.94E-05 0.49 1.41E-02 % 2.29E-04 41.40 5.53E-04 % NO2-Chloroacetophenone 3.8E-04 0.00E+00 3.02E-03 3.80E-04 2.29E-06 1.83E-07 3.01E-05 0.61% 9.16E-07 - - 3.02E-06 - - NOChrysene 5.4E-06 5.07E-07 4.71E-05 5.94E-06 3.58E-08 2.86E-09 - - 1.43E-08 4.76E-04 3.00E-03 % 4.72E-08 - - NOCumene 2.9E-04 0.00E+00 2.28E-03 2.88E-04 1.73E-06 1.39E-07 0.40 3.47E-07 % 6.94E-07 - - 2.29E-06 - - NOCyanide 1.4E-01 0.00E+00 1.08E+00 1.36E-01 8.18E-04 6.54E-05 - - 3.27E-04 5.80E-04 56.41% 1.08E-03 - - NODibenzo(a,h)anthracene 2.0E-06 3.56E-07 1.83E-05 2.31E-06 1.39E-08 1.11E-09 - - 5.56E-09 4.76E-04 1.17E-03 % 1.84E-08 - - NODichlorobenzene - 0.00E+00 0.00E+00 0.00E+00 0.00E+00 0.00E+00 - - 0.00E+00 1.07 - 0.00E+00 - - NODimethyl sulfate 2.6E-03 0.00E+00 2.07E-02 2.61E-03 1.57E-05 1.26E-06 - - 6.28E-06 1.19E-02 0.053% 2.07E-05 - - NO7,12-Dimethylbenz(a)anthracen - 0.00E+00 0.00E+00 0.00E+00 0.00E+00 0.00E+00 - - 0.00E+00 4.76E-04 - 0.00E+00 - - NO2,4-Dinitrotoluene 1.5E-05 0.00E+00 1.21E-04 1.52E-05 9.16E-08 7.33E-09 - - 3.66E-08 3.57E-03 1.03E-03 % 1.21E-07 - - NO
Organics
Completed by: LMG 1/17/08 Checked by: SAK 1/17/08

Prevention of Significant Deterioration Air Permit Application January 17, 2008 Plant Washington, Power4Georgians, LLC
070007.2201 6-4
Table 6-2 Toxic Emissions Summary (continued)
PollutantMain Boiler (g/s)
Auxiliary Boiler (g/s)
Total Emissions
(lb/hr)
Total Emsission
(g/s)
1-Hr MGLC (mg/m3)
Annual MGLC (mg/m3)
AAC Annual (mg/m3)
% of allowable
AAC
24-Hr MGLC (mg/m3)
AAC 24-hour
(mg/m3)
% of allowable
AAC
15-Min MGLC (mg/m3)
Short (15-min)
Term Limit (mg/m3)
% of allowable
Short Term Limit
Is Refined Modeling
Required ?
Ethane - 0.00E+00 0.00E+00 0.00E+00 0.00E+00 0.00E+00 - - 0.00E+00 2.93 - 0.00E+00 - - NOEthylbenzene 5.1E-03 1.35E-05 4.06E-02 5.12E-03 3.08E-05 2.47E-06 1.00 2.47E-06 % 1.23E-05 - - 4.07E-05 54.27 7.50E-05 % NOEthyl Chloride 2.3E-03 0.00E+00 1.81E-02 2.28E-03 1.37E-05 1.10E-06 10.00 1.10E-05 % 5.50E-06 - - 1.81E-05 - - NOEthylene dichloride 2.2E-03 0.00E+00 1.72E-02 2.17E-03 1.31E-05 1.05E-06 - - 5.23E-06 0.10 5.43E-03 % 1.73E-05 - - NOEthylene dibromide 6.5E-05 0.00E+00 5.17E-04 6.52E-05 3.93E-07 3.14E-08 - - 1.57E-07 0.37 4.29E-05 % 5.18E-07 23.07 2.25E-06 % NOFluoranthene 3.9E-05 1.03E-06 3.14E-04 3.96E-05 2.38E-07 1.91E-08 - - 9.54E-08 0.01 1.38E-03 % 3.15E-07 - - NOFluorene 4.9E-05 9.52E-07 4.00E-04 5.04E-05 3.03E-07 2.43E-08 - - 1.21E-07 4.76E-04 0.025% 4.01E-07 - - NOFormaldehyde 3.86E-02 7.03E-03 3.62E-01 4.56E-02 2.75E-04 2.20E-05 7.69E-04 2.86% 1.10E-04 - - 3.63E-04 0.25 0.15% NOHexane 3.6E-03 0.00E+00 2.89E-02 3.64E-03 2.19E-05 1.75E-06 0.20 8.79E-04 % 8.77E-06 - - 2.89E-05 352.47 8.21E-06 % NOHydrogen chloride 65.17 0.00E+00 5.17E+02 6.52E+01 3.93E-01 3.14E-02 0.02 157.43% 1.57E-01 - - 5.18E-01 0.70 74.03% YESIndeno(1,2,3,c,d)pyrene 3.3E-06 0.00E+00 2.63E-05 3.31E-06 2.00E-08 1.60E-09 - - 7.98E-09 4.76E-04 1.68E-03 % 2.63E-08 - - NOIsophorone 3.2E-02 0.00E+00 2.50E-01 3.15E-02 1.90E-04 1.52E-05 - - 7.59E-05 0.33 0.023% 2.50E-04 2.83 8.86E-03 % NOMethyl Bromide 8.69E-03 0.00E+00 6.90E-02 8.69E-03 5.23E-05 4.19E-06 - - 2.09E-05 9.24E-03 0.23% 6.91E-05 8.00 8.64E-04 % NOMethyl hydrazine 9.2E-03 0.00E+00 7.33E-02 9.23E-03 5.56E-05 4.45E-06 - - 2.22E-05 - - 7.34E-05 0.04 0.21% NOMMA 1.1E-03 0.00E+00 8.62E-03 1.09E-03 6.54E-06 5.23E-07 0.70 7.48E-05 % 2.62E-06 - - 8.64E-06 40.95 2.11E-05 % NO2-Methylnaphthalene - 0.00E+00 0.00E+00 0.00E+00 0.00E+00 0.00E+00 - - 0.00E+00 6.93E-03 - 0.00E+00 - - NO3-Methylchloranthrene - 0.00E+00 0.00E+00 0.00E+00 0.00E+00 0.00E+00 - - 0.00E+00 - - 0.00E+00 - - NOMTBE 1.9E-03 0.00E+00 1.51E-02 1.90E-03 1.15E-05 9.16E-07 3.00 3.05E-05 % 4.58E-06 - - 1.51E-05 - - NOMethylene chloride 1.6E-02 0.00E+00 1.25E-01 1.57E-02 9.49E-05 7.59E-06 1.33E-03 0.57% 3.80E-05 - - 1.25E-04 43.38 2.89E-04 % NONaphthalene 1.3E-03 2.41E-04 1.24E-02 1.56E-03 9.41E-06 7.53E-07 3.01E-03 2.50E-02 % 3.77E-06 - - 1.24E-05 7.86 1.58E-04 % NO5-Methyl chrysene 1.2E-06 0.00E+00 9.48E-06 1.19E-06 7.20E-09 5.76E-10 - - 2.88E-09 4.76E-04 0.00% 9.50E-09 - - NOOCDD 3.6E-09 0.00E+00 2.88E-08 3.63E-09 2.18E-11 1.75E-12 - - 8.74E-12 6.90E-02 1.27E-08 % 2.88E-11 - - NOPhenanthrene 1.5E-04 2.24E-06 1.18E-03 1.49E-04 8.97E-07 7.17E-08 - - 3.59E-07 4.76E-04 7.53E-02 % 1.18E-06 - - NOPhenol 8.7E-04 0.00E+00 6.90E-03 8.69E-04 5.23E-06 4.19E-07 - - 2.09E-06 4.52E-02 4.63E-03 % 6.91E-06 6.00 1.15E-04 % NOPropane - 0.00E+00 0.00E+00 0.00E+00 0.00E+00 0.00E+00 - - 0.00E+00 4.29 - 0.00E+00 - - NOPropionaldehyde 2.1E-02 0.00E+00 1.64E-01 2.06E-02 1.24E-04 9.95E-06 - - 4.97E-05 0.11 4.39E-02 % 1.64E-04 - - NOPyrene 1.8E-05 9.05E-07 1.49E-04 1.88E-05 1.13E-07 9.07E-09 - - 4.54E-08 4.76E-04 9.53E-03 % 1.50E-07 - - NOStyrene 1.4E-03 0.00E+00 1.08E-02 1.36E-03 8.18E-06 6.54E-07 - - 3.27E-06 - - 1.08E-05 85.20 1.27E-05 % NOSulfuric Acid (H2SO4)
1 5.23 0.00E+00 4.15E+01 5.23E+00 3.15E-02 2.52E-03 - - 1.26E-02 2.38E-03 529.18% 4.16E-02 - - YESTetrachloroethylene 2.3E-03 0.00E+00 1.85E-02 2.34E-03 1.41E-05 1.13E-06 - - 5.63E-06 1.61 3.49E-04 % 1.86E-05 135.60 1.37E-05 % NOToluene 1.3E-02 1.32E-03 1.14E-01 1.44E-02 8.65E-05 6.92E-06 5.00 1.38E-04 % 3.46E-05 - - 1.14E-04 113.10 1.01E-04 % NO1,1,1-Trichloroethane 1.1E-03 5.03E-05 9.02E-03 1.14E-03 6.85E-06 5.48E-07 - - 2.74E-06 4.52 6.05E-05 % 9.04E-06 190.00 4.76E-06 % NOVinyl acetate 4.1E-04 0.00E+00 3.28E-03 4.13E-04 2.49E-06 1.99E-07 0.20 9.97E-05 % 9.95E-07 - - 3.28E-06 5.28 6.21E-05 % NOXylene 2.0E-03 4.05E-05 1.63E-02 2.05E-03 1.23E-05 9.88E-07 0.10 9.73E-04 % 4.94E-06 - - 1.63E-05 65.13 2.50E-05 % NO
Completed by: LMG 1/17/08 Checked by: SAK 1/17/08

Prevention of Significant Deterioration Air Permit Application January 17, 2008 Plant Washington, Power4Georgians, LLC
070007.2201 6-5
Table 6-2 Toxic Emissions Summary (continued)
PollutantMain Boiler (g/s)
Auxiliary Boiler (g/s)
Total Emissions
(lb/hr)
Total Emsission
(g/s)
1-Hr MGLC (mg/m3)
Annual MGLC (mg/m3)
AAC Annual (mg/m3)
% of allowable
AAC
24-Hr MGLC (mg/m3)
AAC 24-hour
(mg/m3)
% of allowable
AAC
15-Min MGLC (mg/m3)
Short (15-min)
Term Limit (mg/m3)
% of allowable
Short Term Limit
Is Refined Modeling
Required ?
Antimony 9.78E-04 0.00E+00 7.76E-03 9.78E-04 5.89E-06 4.71E-07 - - 2.36E-06 1.19E-03 0.20% 7.77E-06 - - NOArsenic 2.23E-02 1.19E-04 1.78E-01 2.24E-02 1.35E-04 1.08E-05 2.33E-07 4638.95% 5.39E-05 - - 1.78E-04 2.00E-04 89.00% YESBarium - 8.94E-05 7.10E-04 8.94E-05 5.39E-07 4.31E-08 4.90E-04 - 2.16E-07 - - 7.11E-07 - - NOBeryllium 1.14E-03 0.00E+00 9.05E-03 1.14E-03 6.87E-06 5.50E-07 4.17E-06 13.19% 2.75E-06 - - 9.07E-06 - - NOCadmium 2.77E-03 8.94E-05 2.27E-02 2.86E-03 1.72E-05 1.38E-06 5.56E-06 24.80% 6.89E-06 - - 2.27E-05 - - NOChromium, total 1.41E-02 8.94E-05 1.13E-01 1.42E-02 8.56E-05 6.85E-06 - - 3.42E-05 2.38E-03 1.44% 1.13E-04 - - NOChromium, hexavalent 4.29E-03 0.00E+00 3.41E-02 4.29E-03 2.58E-05 2.07E-06 8.33E-08 2481.17% 1.03E-05 - - 3.41E-05 - - YESCobalt 5.43E-03 0.00E+00 4.31E-02 5.43E-03 3.27E-05 2.62E-06 - - 1.31E-05 2.38E-04 5.50% 4.32E-05 - - NOCopper 9.83E-04 1.79E-04 9.22E-03 1.16E-03 7.00E-06 5.60E-07 - - 2.80E-06 2.38E-04 1.18% 9.24E-06 - - NOLead 2.28E-02 2.68E-04 1.83E-01 2.31E-02 1.39E-04 1.11E-05 - - 5.56E-05 1.19E-04 46.71% 1.84E-04 - - NOMercury 1.61E-03 8.94E-05 1.35E-02 1.70E-03 1.02E-05 8.17E-07 3.00E-04 0.27% 4.09E-06 - - 1.35E-05 1.00E-02 0.13% NOMagnesium 5.97E-01 0.00E+00 4.74E+00 5.97E-01 3.60E-03 2.88E-04 - - 1.44E-03 0.02 6.05% 4.75E-03 - - NOManganese 2.66E-02 1.79E-04 2.13E-01 2.68E-02 1.61E-04 1.29E-05 4.90E-05 26.35% 6.46E-05 - - 2.13E-04 0.50 4.26E-02 % NOMolybdenum - 0.00E+00 0.00E+00 0.00E+00 0.00E+00 0.00E+00 - - 0.00E+00 3.57E-02 - 0.00E+00 - - NONickel 1.52E-02 8.94E-05 1.21E-01 1.53E-02 9.21E-05 7.37E-06 - - 3.69E-05 2.38E-03 1.55% 1.22E-04 - - NOSelenium 7.06E-02 4.47E-04 5.64E-01 7.10E-02 4.28E-04 3.42E-05 - - 1.71E-04 4.76E-04 35.95% 5.65E-04 - - NOVanadium - 0.00E+00 0.00E+00 0.00E+00 0.00E+00 0.00E+00 - - 0.00E+00 1.19E-04 - 0.00E+00 1.00E-02 - NOZinc 6.55E-04 1.19E-04 6.15E-03 7.74E-04 4.67E-06 3.73E-07 - - 1.87E-06 4.76E-03 3.92E-02 % 6.16E-06 1.00 6.16E-04 % NO
Metals
Completed by: LMG 1/17/08 Checked by: SAK 1/17/08

Prevention of Significant Deterioration Air Permit Application January 17, 2008 Plant Washington, Power4Georgians, LLC
070007.2201 6-6
Table 6-3 ISCST3 Toxics Modeling Results
Arsenic: Annual Average Period Year of Model Run Maximum Concentration
(µg/m3) Location of Receptors
(UTM) 1974 5.00E-05 340137 3657911 1975 4.00E-05 333000 3660000 1976 5.00E-05 340137 3657811 1977 5.00E-05 333000 3660000 1978 5.00E-05 333000 3659500
Maximum Concentration: 5.00E-05 µg/m3 Allowable Concentration: 2.33E-04 µg/m3 % of Allowable AAC: 21.46 %
Hexavalent Chromium: Annual Average Period Year of Model Run Maximum Concentration
(µg/m3) Location of Receptors
(UTM) 1974 1.00E-05 340137 3657911 1975 1.00E-05 333000 3660000 1976 1.00E-05 340137 3657811 1977 1.00E-05 333000 3660000 1978 1.00E-05 333000 3659500
Maximum Concentration: 1.00E-05 µg/m3 Allowable Concentration: 8.33E-05 µg/m3 % of Allowable AAC: 12.00 %
Hydrogen Chloride: Annual Average Period Year of Model Run Maximum Concentration
(µg/m3) Location of Receptors
(UTM) 1974 0.098 341237 3662111 1975 0.084 332500 3660000 1976 0.091 342000 3656500 1977 0.099 333000 3660000 1978 0.103 332500 3659500
Maximum Concentration: 0.103 µg/m3 Allowable Concentration: 20 µg/m3 % of Allowable AAC: 0.52 %
Sulfuric Acid: 24 Hour Average Period Year of Model Run Maximum Concentration
(µg/m3) Location of Receptors
(UTM) 1974 0.295 336537 3660811 1975 0.371 338181 3659773 1976 0.277 340237 3661411 1977 0.295 336237 3659311 1978 0.302 336137 3659911
Maximum Concentration: 0.371 µg/m3 Allowable Concentration: 2.38 µg/m3 % of the Allowable AAC: 15.59 %
Completed by: LMG 1/17/08 Checked by: SAK 1/17/08
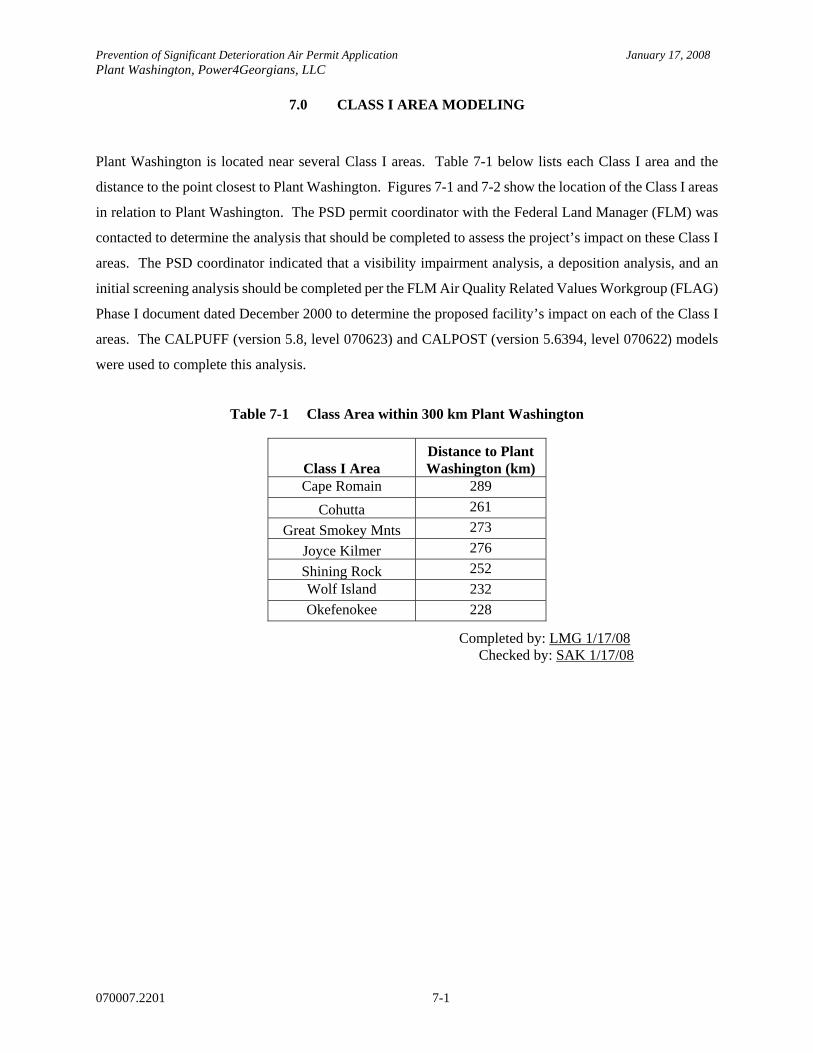
Prevention of Significant Deterioration Air Permit Application January 17, 2008 Plant Washington, Power4Georgians, LLC
070007.2201 7-1
7.0 CLASS I AREA MODELING
Plant Washington is located near several Class I areas. Table 7-1 below lists each Class I area and the
distance to the point closest to Plant Washington. Figures 7-1 and 7-2 show the location of the Class I areas
in relation to Plant Washington. The PSD permit coordinator with the Federal Land Manager (FLM) was
contacted to determine the analysis that should be completed to assess the project’s impact on these Class I
areas. The PSD coordinator indicated that a visibility impairment analysis, a deposition analysis, and an
initial screening analysis should be completed per the FLM Air Quality Related Values Workgroup (FLAG)
Phase I document dated December 2000 to determine the proposed facility’s impact on each of the Class I
areas. The CALPUFF (version 5.8, level 070623) and CALPOST (version 5.6394, level 070622) models
were used to complete this analysis.
Table 7-1 Class Area within 300 km Plant Washington
Class I Area Distance to Plant Washington (km)
Cape Romain 289 Cohutta 261
Great Smokey Mnts 273 Joyce Kilmer 276 Shining Rock 252 Wolf Island 232 Okefenokee 228
Completed by: LMG 1/17/08 Checked by: SAK 1/17/08

Prevention of Significant Deterioration Air Permit Application January 17, 2008 Plant Washington, Power4Georgians, LLC
070007.2201 7-2
Figure 7-1 Relative Location Map of Site to the Class I Area
Prepared by: FC 1/17/08 Checked by: SAK 1/17/08

Prevention of Significant Deterioration Air Permit Application January 17, 2008 Plant Washington, Power4Georgians, LLC
070007.2201 7-3
Figure 7-2 Relative Location Map of Site to the Class I Area
Prepared by: FC 1/17/08 Checked by: SAK 1/17/08
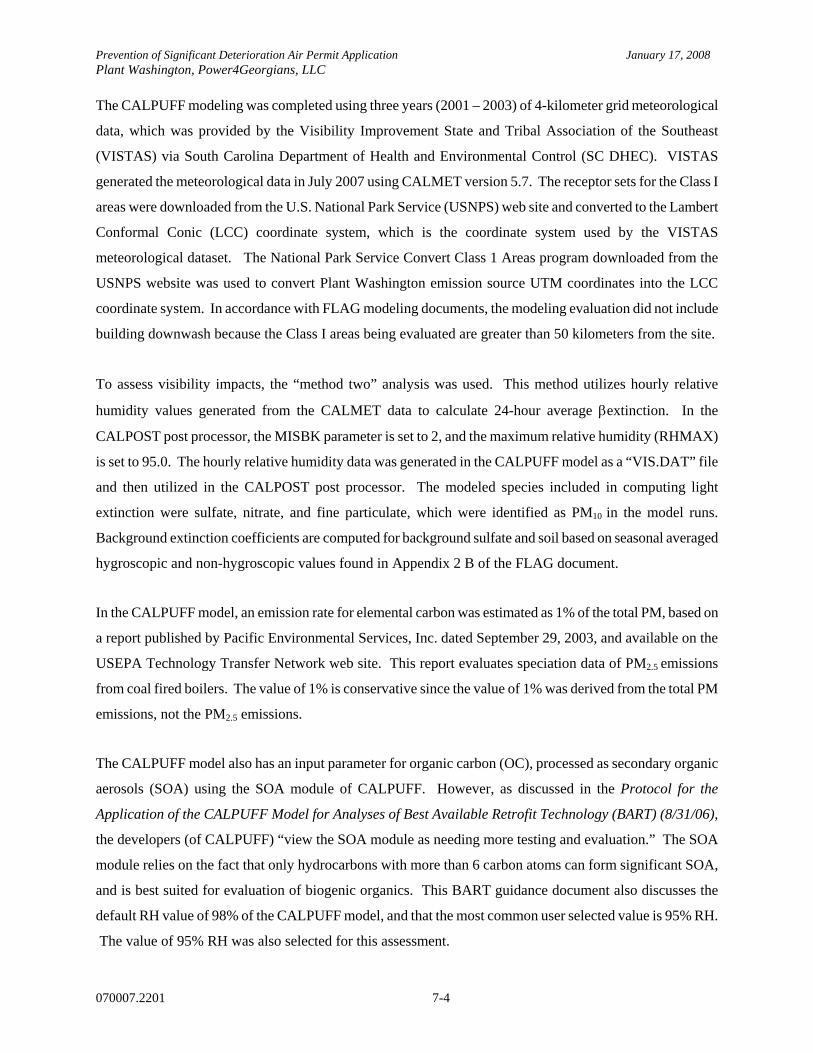
Prevention of Significant Deterioration Air Permit Application January 17, 2008 Plant Washington, Power4Georgians, LLC
070007.2201 7-4
The CALPUFF modeling was completed using three years (2001 – 2003) of 4-kilometer grid meteorological
data, which was provided by the Visibility Improvement State and Tribal Association of the Southeast
(VISTAS) via South Carolina Department of Health and Environmental Control (SC DHEC). VISTAS
generated the meteorological data in July 2007 using CALMET version 5.7. The receptor sets for the Class I
areas were downloaded from the U.S. National Park Service (USNPS) web site and converted to the Lambert
Conformal Conic (LCC) coordinate system, which is the coordinate system used by the VISTAS
meteorological dataset. The National Park Service Convert Class 1 Areas program downloaded from the
USNPS website was used to convert Plant Washington emission source UTM coordinates into the LCC
coordinate system. In accordance with FLAG modeling documents, the modeling evaluation did not include
building downwash because the Class I areas being evaluated are greater than 50 kilometers from the site.
To assess visibility impacts, the “method two” analysis was used. This method utilizes hourly relative
humidity values generated from the CALMET data to calculate 24-hour average βextinction. In the
CALPOST post processor, the MISBK parameter is set to 2, and the maximum relative humidity (RHMAX)
is set to 95.0. The hourly relative humidity data was generated in the CALPUFF model as a “VIS.DAT” file
and then utilized in the CALPOST post processor. The modeled species included in computing light
extinction were sulfate, nitrate, and fine particulate, which were identified as PM10 in the model runs.
Background extinction coefficients are computed for background sulfate and soil based on seasonal averaged
hygroscopic and non-hygroscopic values found in Appendix 2 B of the FLAG document.
In the CALPUFF model, an emission rate for elemental carbon was estimated as 1% of the total PM, based on
a report published by Pacific Environmental Services, Inc. dated September 29, 2003, and available on the
USEPA Technology Transfer Network web site. This report evaluates speciation data of PM2.5 emissions
from coal fired boilers. The value of 1% is conservative since the value of 1% was derived from the total PM
emissions, not the PM2.5 emissions.
The CALPUFF model also has an input parameter for organic carbon (OC), processed as secondary organic
aerosols (SOA) using the SOA module of CALPUFF. However, as discussed in the Protocol for the
Application of the CALPUFF Model for Analyses of Best Available Retrofit Technology (BART) (8/31/06),
the developers (of CALPUFF) “view the SOA module as needing more testing and evaluation.” The SOA
module relies on the fact that only hydrocarbons with more than 6 carbon atoms can form significant SOA,
and is best suited for evaluation of biogenic organics. This BART guidance document also discusses the
default RH value of 98% of the CALPUFF model, and that the most common user selected value is 95% RH.
The value of 95% RH was also selected for this assessment.
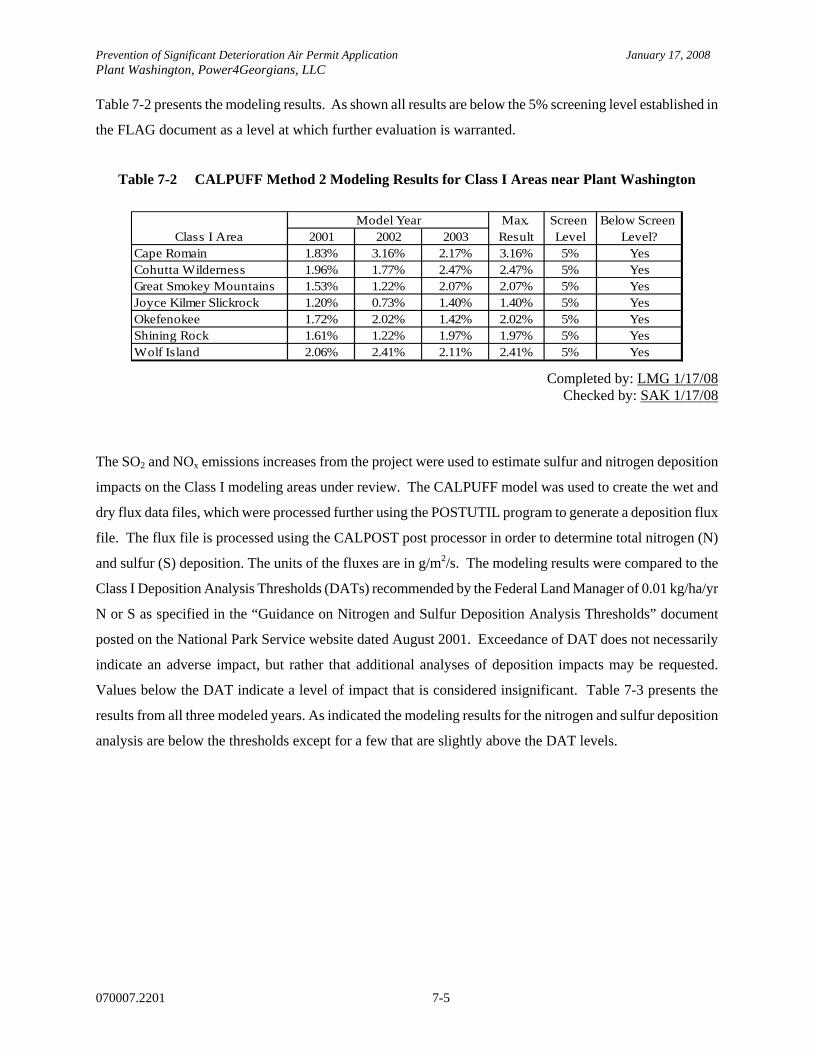
Prevention of Significant Deterioration Air Permit Application January 17, 2008 Plant Washington, Power4Georgians, LLC
070007.2201 7-5
Table 7-2 presents the modeling results. As shown all results are below the 5% screening level established in
the FLAG document as a level at which further evaluation is warranted.
Table 7-2 CALPUFF Method 2 Modeling Results for Class I Areas near Plant Washington
2001 2002 2003Cape Romain 1.83% 3.16% 2.17% 3.16% 5% YesCohutta Wilderness 1.96% 1.77% 2.47% 2.47% 5% YesGreat Smokey Mountains 1.53% 1.22% 2.07% 2.07% 5% YesJoyce Kilmer Slickrock 1.20% 0.73% 1.40% 1.40% 5% YesOkefenokee 1.72% 2.02% 1.42% 2.02% 5% YesShining Rock 1.61% 1.22% 1.97% 1.97% 5% YesWolf Island 2.06% 2.41% 2.11% 2.41% 5% Yes
Class I AreaModel Year Below Screen
Level?Screen Level
Max. Result
Completed by: LMG 1/17/08
Checked by: SAK 1/17/08
The SO2 and NOx emissions increases from the project were used to estimate sulfur and nitrogen deposition
impacts on the Class I modeling areas under review. The CALPUFF model was used to create the wet and
dry flux data files, which were processed further using the POSTUTIL program to generate a deposition flux
file. The flux file is processed using the CALPOST post processor in order to determine total nitrogen (N)
and sulfur (S) deposition. The units of the fluxes are in g/m2/s. The modeling results were compared to the
Class I Deposition Analysis Thresholds (DATs) recommended by the Federal Land Manager of 0.01 kg/ha/yr
N or S as specified in the “Guidance on Nitrogen and Sulfur Deposition Analysis Thresholds” document
posted on the National Park Service website dated August 2001. Exceedance of DAT does not necessarily
indicate an adverse impact, but rather that additional analyses of deposition impacts may be requested.
Values below the DAT indicate a level of impact that is considered insignificant. Table 7-3 presents the
results from all three modeled years. As indicated the modeling results for the nitrogen and sulfur deposition
analysis are below the thresholds except for a few that are slightly above the DAT levels.

Prevention of Significant Deterioration Air Permit Application January 17, 2008 Plant Washington, Power4Georgians, LLC
070007.2201 7-6
Table 7-3 Class I Increment Deposition Results
2001 2002 2003 2001 2002 2003Cape Romain 3.25E-03 2.45E-03 1.92E-03 1.21E-02 1.06E-02 8.58E-03Cohutta Wilderness 3.01E-03 4.26E-03 4.07E-03 8.86E-03 1.40E-03 1.20E-02Great Smokey Mountains 2.84E-03 2.80E-03 3.94E-03 9.11E-03 8.83E-03 1.14E-02Joyce Kilmer Slickrock 2.84E-03 3.09E-03 3.42E-03 8.58E-03 9.24E-03 1.04E-02Okefenokee 1.46E-03 1.50E-03 7.44E-04 5.36E-03 5.20E-03 2.83E-03Shining Rock 2.95E-03 2.89E-03 4.57E-03 8.99E-03 9.08E-03 1.20E-02Wolf Island 2.62E-03 1.69E-03 7.35E-04 9.78E-03 7.40E-03 4.83E-03DAT Level: 0.01 kg/ha/yr
Class I AreaN Increment Results kg/ha/yr S Increment Results kg/ha/yr
Completed by: LMG 1/17/08
Checked by: SAK 1/17/08
An initial screening analysis was done to determine whether Plant Washington will have a significant impact
on the concentration of pollutants in the ambient air at the seven Class I areas under evaluation. The
CALPUFF model included all emission sources at the proposed Plant Washington site (point and fugitive
sources). The CALPUFF model created concentration data files, which were processed using the CALPOST
post processor to determine the maximum concentration at all receptors within the Class I areas. Tables 7-4,
7-5, and 7-6 present the Class I screening analysis results for PM10, SO2 and NOx respectively, for all
averaging periods and for all three years of meteorological data. Each of the computed maximum
concentrations for each pollutant’s averaging periods was below their respective significant impact levels
currently established by USEPA, except for the 24-hr concentration for SO2 at Wolf Island. A refined SO2
PSD increment modeling analysis for Wolf Island was therefore completed.
In accordance with FLM guidelines an emission database of all SO2 increment consuming sources within 300
km of Wolf Island was created with data received from Florida Department of Environmental Protection,
South Carolina Department of Health and Environmental Control and Georgia Environmental Protection
Division. As is allowed for PSD increment modeling, some of the sources were modeled at their actual
emissions based on their emission rates in the Georgia and National Emission Inventories (NEI). Because the
CALPUFF model is unable to run with more than 200 emission sources at a time the emission sources were
split into six groups of 200 or less. All of the individual models were then combined using the CALSUM
utility. These results are summarized in Table 7-7 and as indicated the results are below the Class I PSD SO2
increment levels.

Prevention of Significant Deterioration Air Permit Application January 17, 2008 Plant Washington, Power4Georgians, LLC
070007.2201 7-7
Table 7-4 CALPUFF Class I PM10 Screening Analysis
2001 2002 2003Cape Romain 2.32E-03 2.53E-03 2.40E-03 2.53E-03 0.2 YesCohutta Wilderness 1.35E-03 1.81E-03 1.84E-03 1.84E-03 0.2 YesGreat Smokey Mountains 1.02E-03 1.12E-03 1.56E-03 1.56E-03 0.2 YesJoyce Kilmer Slickrock 9.88E-04 1.18E-03 1.44E-03 1.44E-03 0.2 YesOkefenokee 1.43E-03 1.65E-03 1.01E-03 1.65E-03 0.2 YesShining Rock 1.35E-03 1.53E-03 1.87E-03 1.87E-03 0.2 YesWolf Island 1.97E-03 2.11E-03 1.85E-03 2.11E-03 0.2 Yes
2001 2002 2003Cape Romain 2.77E-02 3.88E-02 4.23E-02 4.23E-02 0.3 YesCohutta Wilderness 2.93E-02 2.90E-02 3.54E-02 3.54E-02 0.3 YesGreat Smokey Mountains 2.43E-02 1.95E-02 4.09E-02 4.09E-02 0.3 YesJoyce Kilmer Slickrock 2.14E-02 1.81E-02 4.31E-02 4.31E-02 0.3 YesOkefenokee 3.63E-02 3.35E-02 2.62E-02 3.63E-02 0.3 YesShining Rock 3.32E-02 3.19E-02 3.79E-02 3.79E-02 0.3 YesWolf Island 3.45E-02 3.48E-02 5.70E-02 5.70E-02 0.3 Yes
Below Screening
Level?Max. Conc.
(µg/m3)Screening
Level (µg/m3)
Annual PM10 Screening Results
24-Hour PM10 Screening Results
Class I Area
Model Year
Class I Area
Model YearMax. Conc.
(µg/m3)Screening
Level (µg/m3)
Below Screening
Level?
Prepared by: LMG 1/17/08 Checked by: SAK 1/17/08

Prevention of Significant Deterioration Air Permit Application January 17, 2008 Plant Washington, Power4Georgians, LLC
070007.2201 7-8
Table 7-5 CALPUFF Class I SO2 Screening Analysis
2001 2002 2003Cape Romain 7.90E-03 7.83E-03 7.85E-03 7.90E-03 0.1 YesCohutta Wilderness 3.97E-03 4.84E-03 4.57E-03 4.84E-03 0.1 YesGreat Smokey Mountains 2.41E-03 2.37E-03 2.91E-03 2.91E-03 0.1 YesJoyce Kilmer Slickrock 2.41E-03 2.52E-03 2.78E-03 2.78E-03 0.1 YesOkefenokee 4.68E-03 5.10E-03 3.00E-03 5.10E-03 0.1 YesShining Rock 3.67E-03 3.36E-03 4.42E-03 4.42E-03 0.1 YesWolf Island 7.38E-03 8.10E-03 7.56E-03 8.10E-03 0.1 Yes
2001 2002 2003Cape Romain 0.109 0.16 0.15 0.16 0.2 YesCohutta Wilderness 0.126 0.11 0.14 0.14 0.2 YesGreat Smokey Mountains 9.91E-02 7.59E-02 8.24E-02 0.10 0.2 YesJoyce Kilmer Slickrock 7.41E-02 6.34E-02 6.56E-02 0.07 0.2 YesOkefenokee 0.11 0.11 0.10 0.11 0.2 YesShining Rock 0.16 0.12 0.157 0.16 0.2 YesWolf Island 0.18 0.18 0.30 0.30 0.2 No
2001 2002 2003Cape Romain 0.34 0.44 0.50 0.50 1 YesCohutta Wilderness 0.57 0.74 0.50 0.74 1 YesGreat Smokey Mountains 0.28 0.31 0.55 0.55 1 YesJoyce Kilmer Slickrock 0.28 0.26 0.30 0.30 1 YesOkefenokee 0.67 0.42 0.37 0.67 1 YesShining Rock 0.41 0.36 0.60 0.60 1 YesWolf Island 0.43 0.57 0.62 0.62 1 Yes
Max. Conc. (µg/m3)
Screening Level (µg/m3)
Below Screening
Level?
Max. Conc. (µg/m3)
Screening Level (µg/m3)
Below Screening
Level?
3-Hour SO2 Results
Class I Area
Model Year
Class I Area
Model Year24-Hour SO2 Results
Max. Conc. (µg/m3)
Screening Level (µg/m3)
Below Screening
Level?Class I Area
Model YearAnnual SO2 Results
Prepared by: LMG 1/17/08 Checked by: SAK 1/17/08

Prevention of Significant Deterioration Air Permit Application January 17, 2008 Plant Washington, Power4Georgians, LLC
070007.2201 7-9
Table 7-6 CALPUFF Class I NOx Screening Analysis
2001 2002 2003Cape Romain 1.05E-03 1.33E-03 1.19E-03 1.33E-03 0.1 YesCohutta Wilderness 5.76E-04 1.08E-03 9.03E-04 1.08E-03 0.1 YesGreat Smokey Mountains 3.65E-04 3.77E-04 5.16E-04 5.16E-04 0.1 YesJoyce Kilmer Slickrock 3.00E-04 4.18E-04 5.59E-04 5.59E-04 0.1 YesOkefenokee 8.53E-04 7.97E-04 5.28E-04 8.53E-04 0.1 YesShining Rock 7.24E-04 6.06E-04 5.58E-04 7.24E-04 0.1 YesWolf Island 1.37E-03 1.92E-03 1.70E-03 1.92E-03 0.1 Yes
Annual NOX Increment Results
Class I Area
Model Year Below Screening
Level?Screening Level
(µg/m3)Max. Conc.
(µg/m3)
Completed by: JDC 1/17/08
Checked by: SAK 1/17/08
Table 7-7 CALPUFF SO2 PSD Increment Modeling Results for Wolf Island Class I Area
2nd High Concentrations (Except For Annual) Averaging Period 2001 (µg/m3) 2002 (µg/m3) 2003 (µg/m3)
Class 1 PSD Increment (µg/m3)
3-hr 10.7 10.3 11.5 25.0 24-hr 3.4 3.5 3.5 5.0
Annual 0.0 0.0 0.0 2.0
Completed by: JDC 1/17/08 Checked by: SAK 1/17/08

Prevention of Significant Deterioration Air Permit Application January 17, 2008 Plant Washington, Power4Georgians, LLC
070007.2201 8-1
8.0 OTHER IMPACT ANALYSIS
In addition to evaluating the project’s air quality impacts, the permit application addresses other
potential impacts. This included impacts on local Class II visibility, secondary impacts on soils
and vegetation, demographic impacts, and construction impacts as required by the PSD
guidelines. In addition, this evaluation includes an evaluation of the projects impact on water
consumption as well as on green house gas (GHG) emissions.
8.1 CLASS II VISIBILITY
The proposed project’s impacts on Class II visibility were evaluated as part of the permit
application. Class II visibility analyses only have to be performed for Regional airports, state or
national parks, or state historical sites located within 50 km of the source. The largest municipal
airport within 50 km of the Plant Washington is Louisville Municipal Airport (approximately 35
km east of the site). A review of the area did not find any state or federal parks or state historical
sites within 50 km of the site.
The VISCREEN visibility model was used to model the impacts from the plant’s potential
emissions. A Level I Analysis was initially done in order to provide a conservative estimate of
plume visual impacts. These impacts would be larger than those calculated with more realistic
input and modeling assumptions. To conduct a Level I analysis, VISCREEN is run by setting the
observer distance equal to the closest sensitive receptor and on-site source (the plant) while using
Level I defaults, and a worst-case meteorological condition of F class stability and a wind speed
of 1.0 m/s. This worst-case meteorological condition is assumed to persist for 12 hours, with a
wind direction that would transport the plume in the direction of the observer. The Level I
Analysis found that Plant Washington’s visibility impacts would exceed the screening threshold
for the Class II Area, therefore a Level II VISCREEN Analysis was completed.
Level II Analysis determines the worst-day plume dispersion characteristic using the method
described in the Tutorial Package for the VISCREEN Model. In order to conduct the Level II
analysis, it is necessary to determine the dispersion condition (wind speed and stability class of
the wind in the direction of the Class II area) that has a 1% cumulative frequency of occurrence.
This 1% level is a conservative approach that is expected to represent the worst case dispersion
condition. For this analysis, a 22.5° wind sector directed towards the sensitive area by 6-hour

Prevention of Significant Deterioration Air Permit Application January 17, 2008 Plant Washington, Power4Georgians, LLC
070007.2201 8-2
time block of each day is ranked in sequence of increasing value of sigmaz times the wind speed
of the condition under evaluation. The variable sigma is the Pasquill-Gifford vertical diffusion
coefficient for a given stability class and downwind distance along the stable plume trajectory.
Pasquill-Gifford vertical diffusion coefficient values were obtained from the Handbook of Air
Pollution Control and Engineering and Technology1. Figures 8-1 depicts the 22.5° wind sector
directed towards Louisville Municipal Airport.
1 Mycock , John C., McKenna, John D., and Theodore, Louis. Handbook of Air Pollution Control Engineering and Technology. New York, NY: CRC Press, Inc., 1995 (Figure 4, pg 328).

Prevention of Significant Deterioration Air Permit Application January 17, 2008 Plant Washington, Power4Georgians, LLC
070007.2201 8-3
Figure 8-1 22.5º Wind Sector Directed Towards Louisville Municipal Airport
Prepared by: FC 1/17/08 Checked by: JDF 1/17/08

Prevention of Significant Deterioration Air Permit Application January 17, 2008 Plant Washington, Power4Georgians, LLC
070007.2201 8-4
For the Level II analysis, it is also assumed that steady state plume conditions will not persist for
more than 12 hours because plume material would become more dispersed than a standard
Gaussian plume model. Therefore, calms (time periods in the meteorological data where wind
speeds are 0 m/s) were not evaluated.
Meteorological data files for surface data for the Macon Airport meteorological station and upper
air data from the Centreville, Alabama meteorological station for 1974-1978 five-year period
were obtained from the Georgia EPD website. Table 8-1 shows a summary table of the
meteorological condition for each year that that has a 1% cumulative frequency of occurrence at
Louisville Municipal Airport. Tables C-6 through C-10 in Appendix C show the results of this
analysis for each 6-hour block of time within the five years of meteorological data to determine
the dispersion condition that has a 1% cumulative frequency.
Table 8-1 Summary Table of Meteorological Conditions Resulting in a 1 Percent Cumulative Frequency of Occurrence at Louisville Municipal Airport
Meteorological Condition Year
Stability Class Wind Speed
1974 E 6
1975 D 4
1976 D 4
1977 D 4
1978 D 4
Prepared by: LMG 1/17/08 Checked by: SAK 1/17/08
The VISCREEN model was then run for these determined 1% worst case modeling conditions.
The VISCREEN model results for these conditions indicate that the plume will not be visible at
the airport. The Model runs for this Level II analysis are shown in Appendix D.
Prevention of Significant Deterioration Air Permit Application January 17, 2008 Plant Washington, Power4Georgians, LLC
070007.2201 8-5
8.2 SECONDARY IMPACTS ON SOIL AND VEGETATION
PSD regulations require an assessment of other possible impacts, including any secondary
impacts on soils and vegetation. An analysis was completed to assess the potential impact of
vegetative stress in the area of the proposed plant as outlined in the USEPA document “A
Screening Procedure for the Impact of Air Pollution sources on Plants, Soils, and Animals”. This
document provides ambient concentration levels of SO2, NOx, CO, Fluorine, Beryllium and Lead
which can be used for screening levels to determine if there is a potential for vegetative stress.
As a first step an intensive surveillance of the area surrounding the proposed plant site was
conducted. The proposed plant is located in a rural area which is surrounded by wooded tracts
and small farms. The vegetation present was identified and compared to the listing presented in
the guidance document as being potentially sensitive to the compounds of concern (Tables B.1
through B.4 of the USEPA Screening document). No plant species were identified as being
sensitive to nitrogen dioxide, however, there were species identified that are sensitive to sulfur
dioxide and ozone. The area is in attainment with the ozone air quality standard and the proposed
plant is not expected to change the attainment status of the area so the only species that could
potentially be impacted are those identified as being sensitive for SO2. The following is a listing
of the sensitive vegetation found:
Crop Species sensitive to Sulfur Dioxide:
Blackberry (not a planted crop, only present as wild species)
Natural Vegetation sensitive to Sulfur Dioxide:
Ash
Tulip Tree (Tulip Poplar a.k.a. Yellow Poplar (liriodendeon tulipifera))
Black Willow
Some Natural Vegetation with Intermediate sensitivity to Sulfur Dioxide:
Boxelder
American Elm
White Oak

Prevention of Significant Deterioration Air Permit Application January 17, 2008 Plant Washington, Power4Georgians, LLC
070007.2201 8-6
Some Natural Vegetation Resistant to Sulfur Dioxide:
Black gum
Dogwood
Red Oak
American Sycamore
Because vegetation is present that could potentially be stressed, an evaluation was completed
using the modeled emissions calculated in the previous sections. Table 8-2 below summarizes
the modeled concentrations for each pollutant and compares them to the screening level as taken
from Table 3.1 of the USEPA screening procedure document. As indicated in Table 8-2, the
maximum ground level concentrations for all pollutants for all averaging periods are well below
the screening levels. With this demonstration it is apparent that not only is existing vegetation
safe from potential vegetative stress but also any potential new crops that may be planted in the
area will be as well.

Prevention of Significant Deterioration Air Permit Application January 17, 2008 Plant Washington, Power4Georgians, LLC
070007.2201 8-7
Table 8-2 Screening Concentrations for Exposure to Ambient Air Concentrations
Pollutant Basis 1987 1988 1989 1990 1991SO2 1-hr 1 PSD Screening Modeling 49.7 50.9 45.3 42 38.8 50.9 225 276 917 Yes
3-hr PSD Screening Modeling 31.2 28.4 32.5 31.4 30.4 32.5 187 220 786 YesAnnual PSD Screening Modeling 1.06 1.03 1.17 1.02 1.01 1.17 8 9 18 Yes
NOx 4 hr PSD Screening Modeling 11.6 11.5 13.2 12.0 12.0 13.2 112 125 3760 Yes8 hr PSD Screening Modeling 9.2 10.7 11.8 10.8 10.0 11.8 98.9 111 3760 Yes
1 mo2 Conversion from PSD Screening Modeling 4.8 4.8 5.5 5.0 5.0 5.5 46.6 52.1 564 Yes1 yr PSD Screening Modeling 0.59 0.57 0.65 0.57 0.56 0.65 11.3 12.0 94 Yes
CO3 1 wk Conversion from PSD Screening Modeling 52.2 53.4 47.6 44.1 40.8 53.4 5,371 5,424 1,800,000 YesFluorine4,5 10 days Conversion from PSD Screening Modeling 0.019 0.018 0.018 0.018 0.018 0.019 0.019 0.5 YesBeryllium 2,7 1 mo Toxics Modeling 1.49E-04 1.52E-04 1.35E-04 1.06E-04 1.16E-04 1.52E-04 3.00E-05 1.82E-04 1.00E-02 YesLead 8 3 mo PSD Screening Modeling 0.007 0.007 0.006 0.006 0.005 0.007 0.008 0.015 1.5 Yes
8. Background concentration for lead based on maximum result for the closest lead monitor to the site (Milledgeville) for 2006.
7. Background concentration for beryllium based on the maximum result for all beryllium monitors in the state of Georgia for 2006. The AERMOD model does not allow for 1 month averaging modeling. The result from the 1-hour modeling was converted to 1 month averaging period modeling by using a conversion factor (0.33).
6. The background SO2 and NOX concentrations were provided by the Georgia EPD. The 1-hr concentration for SO2 background was converted from the 3-hour background using the 0.83 time averaging conversion factor. The conversion factors from 1-hr to annual (0.08), from 1-hr to 4-hr (0.79), from 1-hr to 8-hr (0.70), and from 1-hr to monthly (0.33) were used to convert the NOX annual background to 4-hour and 8-hour averages.
Averaging Period
2. The AERMOD model does not allow for 1 month averaging modeling. The results from the 4-hour average modeling was converted to 1-hr average using the 0.79 conversion factor (1-hr to 4-hr) and then converted to a 1 month average using a 0.33 (1-hr to monthly) conversion factor. This factor was derived using the equation on page 55 of the EPA screening guidance. 3. The AERMOD model does not allow for 1 week averaging modeling. The results from the 1-hour average modeling was converted to the 7-day average using a 0.42 (1-hr to 7-day) conversion factor. This factor was derived using the equation on page 55 of the EPA screening guidance. The same value was used to convert the 1-hour background concentration data, which was provided by the Georgia EPD documentation "2006 Georgia Annual Air Quality Report."
1. The 1-hour background concentration for SO2 was calculated by dividing the 3-hour background concentration provided by the Georgia EPD by the 0.83 time averaging conversion factor for converting from 1 hr to 3 hr averages.
Screening Level (µg/m3)
Below Screening
Level ?
5. No data was availible for the Fluorine background concentration.
4. The AERMOD model does not allow for 10 day averaging modeling. The results from the PSD screening completed for flourides was therefore converted to 10 day by using the 0.58 (1-hr to 24-hr) conversion factor to convert the results to 1 hour concentrations and then converted to 10 day results using the 0.39 (1-hr to 10-day) conversion factor. Both conversion factors come from Table A.2 from the EPA screening document.
Modeled Result (µg/m3)Maximum Modeled
Result (µg/m3)
Background Concentration
(µg/m3)
Maximum Modeled
Concentration plus
Background (µg/m3) 6
Prepared by: JDC 1/17/08 Checked by: SAK 1/17/08

Prevention of Significant Deterioration Air Permit Application January 17, 2008 Plant Washington, Power4Georgians, LLC
070007.2201 8-8
The USEPA Screening documents also outlines an evaluation for metals impacts. All these
metals along with all other known toxics being emitted from the boiler were evaluated as part of
the Georgia Air Toxics program in Section 7 of the permit application. The conclusion of that
evaluation was that the plant demonstrates compliance with the Georgia toxics program,
therefore, no further evaluation is being conducted in this section.
8.3 DEMOGRAPHICS
The proposed plant is expected to employ an estimated 100 to 150 people during operation. This
workforce is expected to come from local communities, therefore, growth impacts are expected to
be minimal and should not adversely affect the ambient air quality in the surrounding area. No
additional automobile roadways are planned for the project.
8.4 CONSTRUCTION IMPACTS
During the construction phase of the proposed plant, there will be two primary sources of air
emissions: 1) pollutants emitted from construction equipment and 2) fugitive dust emissions
associated with the construction activities.
Typically, large gasoline and diesel powered construction equipment emit small amounts of
VOCs, CO, SO2, NOx, and PM. Emissions due to the operation of this equipment are expected to
cause only localized increases in pollutant levels. These increases will be only temporary and are
not expected to cause any long-term adverse impacts on the construction area or the surrounding
communities.
The fugitive dust emissions created from the construction activities will be more visible than the
other pollutant emissions from the equipment. Site grading and preparation activities will create
dust emissions. The greatest impact of the fugitive dust emissions will be confined to the
construction site, and the effects on the surrounding properties are expected to be minimal. The
extent of fugitive emissions will vary day to day, depending on the amount of construction
activity and the weather. Standard engineering and construction practices will be implemented in
order to minimize fugitive dust emissions (such as watering haul roads).
Prevention of Significant Deterioration Air Permit Application January 17, 2008 Plant Washington, Power4Georgians, LLC
070007.2201 8-9
8.5 MINIMIZATION OF WATER USE
A coal-fired power plant like any other power generating facility burns fuel to produce electricity.
This is accomplished by producing steam in a boiler and then having that steam pass through
turbines which in turn generates electricity.
The plant will have three main uses of water: 1) boiler makeup and blowdown; 2) the flue gas
desulfuring units (wet scrubbers); and 3) non-contact cooling. The water used to feed the boiler
to produce steam is actually the smallest demand for water the plant since most of the steam is
collected condensed and re-circulated back into the boiler. The only water required for this
purpose is a relatively small amount of make-up water necessary to replace that lost in the steam
handling process and for boiler blowdown. This is estimated to be approximately 120,000 gpd.
The second highest demand for water is for operation of the wet scrubber that is used to remove
SO2 from the flue gases (wet flue gas desulfurization). There is a constant feed of water into this
control device that replenishes the scrubant (pulverized slurried limestone) in the flue gas
desulfuring units. Here, SO2 reacts with the limestone to form gypsum (CaSO4 2HO). The
amount of water used in this application is approximately 1.44 million gallons per day (mgd).
The third (and largest) use will be for non-contact cooling water supplied to the cooling towers.
Steam is condensed in the power generation process. The resulting condensate will be
recirculated (recycled) back into the boiler to conserve heat and water. Steam itself can not be
injected back into the boiler so it needs to be condensed back into water for that purpose. The
heat generated from the condensing steam is dissipated in the cooling towers by evaporation of
water. The cooling towers will use on the average approximately 12.6 MGD of water, of which
approximately 10.8 MGD of water is will be evaporated in the cooling towers with the remainder
being discharged to the river.
It should be noted that typical existing power plants use more water per unit of power generated
than what is being proposed for this plant, which has a much more efficient design.
Unfortunately the process of producing power does not convert all of the energy from burning the
coal into electrical energy. Modern plants are only 31 to 34 percent efficient in the energy
conversion process. The remainder portion of the heat is either vented out the stack or lost in the
cooling tower. Plant Washington will be a supercritical unit that operates at much higher
temperatures and pressures and consequently will be more efficient (estimated to be 36 to 39%
efficient). This means that this plant will use approximately 15 percent less water than a

Prevention of Significant Deterioration Air Permit Application January 17, 2008 Plant Washington, Power4Georgians, LLC
070007.2201 8-10
comparable existing plant. Also consequently 15% less pollutants will be generated including
green house gases on a per unit of power basis.
A potential technology exists that could further reduce water consumption called “dry cooling”.
In dry cooling steam is condensed by passing it through a finned heat exchanger similar to a
radiator used in automobiles. Rather than cooling by evaporation the steam is condensed in heat
exchangers which are cooled by blowing ambient across the fins and exhausting the sensible heat
directly to the atmosphere. Dry cooling technology is not common and only a few such
operations for coal fired generation plants are either being planned or under construction. None
are currently operational so it is a technology yet to be demonstrated for this application. One
such facility being planned is the Touquop Power Plant which is proposed to be built in Lincoln
County Nevada. The proposed project consists of a supercritical unit similar to this project but of
slightly smaller design (750 MW). A hybrid dry and wet cooling system is being proposed which
would consist of a large hyperbolic cooling tower that encloses the fin radiators and air blowers.
Due to the high temperature in the southwest during the summer months, the ambient air must be
pre-cooled prior to being introduced into the cooling tower in order for the system to be effective.
This cooling is accomplished using water sprays and consequently cools the air by evaporation.
Approximately 2.5 million gallons per day is expected to be used for this purpose. So in this case
‘dry cooling’ means a reduction in water use, but not its elimination.
Dry cooling comes at a cost however. An engineering study was conducted to determine its
feasibility for Plant Washington. The results of this study indicate that the use of a dry cooling
system would result in a 41 to 44 MW reduction in the net output of the plant (due to the fact the
system would cause back pressure on the turbines essentially de-rating their capabilities). In
addition, these systems would add $142 to $148 million in capital system cost additions and $45
to $51 million in incremental operational and maintenance (O&M) cost. If actually installed this
cost would have to be passed on to the customer increasing the power rate and the additional
power lost by operating the system would be unavailable to customers and have to be generated
elsewhere. If this 41 to 44 MW “lost power” were to be provided by another power plant or by
increasing the size of Plant Washington even more air emissions would result (roughly equivalent
to 34 TPY PM10, 164 TPY SO2, 92 TPY NOx and 272 TPY CO). .
Power4Georgians takes seriously the need to conserve water in any operation. To that end a
water conservation plan is being developed to look at recycling waste streams, utilize stormwater

Prevention of Significant Deterioration Air Permit Application January 17, 2008 Plant Washington, Power4Georgians, LLC
070007.2201 8-11
that falls on the site and to use mine dewatering water from local kaolin mines to reduce the
consumption of surface water (from rivers) or groundwater. The overall plan is to use surface
water when river flows are above a predetermined minimum level then switch to groundwater
when river flows are below that cutoff point. In this way, surface water will only be used when
there is adequate availability and groundwater will be used intermittently to avoid depletion of
this resource.
8.6 GREENHOUSE GAS (GHG) MINIMIZATION
Coal fired power plants are major producers of GHG’s primarily in the form of carbon dioxide.
There is no proven technology that prevents this. The Department of Energy is currently funding
a project that will attempt to inject the carbon dioxide back into the earth. This project called
“Future Gen” is still undergoing permitting but if given the permission to proceed is scheduled to
be on line in 2012. The pilot testing is expected to take another 5 years before conclusive results
are found regarding the feasibility of this technology. Until this occurs other methods must be
found to minimize the formation of GHG’s. Power4Georgians being comprised of a consortium
of member Georgia EMCs already have in place programs for their customers to conserve energy
and in that way promote reduction of GHGs. These programs are ongoing and will become even
more innovative as opportunities present themselves. The member companies see this opportunity
to construct a new state-of-the-art power plant as being a part of a solution to the GHG problem
by constructing a more efficient plant that will produce power that will emit less GHG on a per
unit basis then existing comparable units. However, other options are also being developed.
These options include: Carbon Footprint Reduction Program (CFRP), Home Energy Efficiency
Program (HEEP), Solar Photovoltaic Program (SPVP), Carbon Sequestering Program (CSP) and
others that are described below:
Carbon Footprint Reduction Program (CFRP)
Power4Georgians EMC will begin working with its customers to develop and implement a
carbon footprint reduction program. The CFRP will be designed to help residential customers
quantify their household carbon footprint and then provide those customers with the opportunity
to reduce their carbon footprint through a number of programs, services and activities. The
quantification of a customer’s household carbon footprint will take into account the number of
people living in the household, the amount of electricity, natural gas and fuel oil consumed in the
house, the amount of waste produced within the house and the vehicular miles driven by members

Prevention of Significant Deterioration Air Permit Application January 17, 2008 Plant Washington, Power4Georgians, LLC
070007.2201 8-12
of the household and the average fuel economy of the vehicles. Once a customer quantifies their
household carbon footprint, the CFRP program will offer a number of avenues to help the
customer either reduce or possibly even eliminate their carbon footprint. These mechanisms
include participating in Power4Georgians Carbon Sequestering Program (CSP),
Power4Georgians EMC’s Solar Photovoltaic Program (SPP), and/or Power4Georgians EMC’s
Carbon Sequestering Program (CSP).
Home Energy Efficiency Program (HEEP)
Customers can reduce the carbon footprint of their household energy consumption by
implementing various energy efficiency projects in and around their home. Power4Georgians
will develop informational sheets for the following energy efficiency measures: ceiling insulation,
energy efficient windows, window film, caulking and weather-stripping, compact fluorescent
lamps, programmable thermostats and high efficiency air conditioning and heat pump systems.
Each measure will be quantified as its estimated reduction of carbon footprint. In addition, the
customer’s local EMC may offer or provide access to programs that provide financing for
selected energy efficiency measures, including: ceiling insulation, energy efficient windows and
high efficiency air conditioning and heat pump systems.
Solar Photovoltaic Program (SPP)
Customers can reduce the carbon footprint of their household energy consumption by satisfying a
portion of their electrical usage with renewable solar energy. Power4Georgians EMC will work
with the customer’s local EMC to develop an incentive program for solar photovoltaic cells. The
solar photovoltaic system will reduce consumption of electricity and thereby, reduce the home’s
carbon footprint.
Carbon Sequestering Program (CSP)
Customers will also be offered a carbon-sequestering program, which can be used to offset some
or their entire carbon footprint. Power4Georgians CSP will provide an opportunity to invest in
sustainable pine forests. Working in conjunction with customer’s local EMC, Power4Georgians
will offer customers the opportunity to buy blocks of trees in Georgia that are sustainable and will
consume carbon produced by the household.

Prevention of Significant Deterioration Air Permit Application January 17, 2008 Plant Washington, Power4Georgians, LLC
070007.2201 8-13
Beneficial Reuse of Fly Ash and Gypsum will reduce GHG from Cement and Wallboard Plant use
The Power4Georgians supports reuse of waste materials from our processes. Fly ash is a
prominent component in the making of cement. Power4Georgians will retain and store fly ash on
site for use by cement manufactures. Additionally, our process produces a gypsum product that
can be used in the manufacture of wallboard or dry wall. We will retain these materials on site
until a suitable partner can be found. Both of these efforts could reduce cement and gypsum
manufactures from producing GHG in the production of like materials.
Reduction of Open Burning:
Power4Georgians will work with the Washington County Economic Development Authority and
County Officials on the issue of open burning which contributes to particulate emissions in the
area as well as GHG’s. Potential ideas include spraying versus burning for forest brush clearing,
landfill collection versus burning of leaves and other creative ideas.
Providing SE Georgia Firefighting Support to avert Wildfires
During 2007 wildfires in the Okefenokee national forest and other areas of southeast Georgia
contributed immense quantities of particulate and GHG’s to Georgia’s air quality.
Power4Georgians will contribute fire fighting equipment to the appropriate fire fighting
departments for use in containing future fires in attempts to prevent such disasters from re-
occurring.
Participation in Available Bio-Mass Projects
Some members of Power4Georgians will participate in the Yellow Pine Bio-Mass project that is
expected to be built near Ft. Gaines, Georgia. When in commercial operation, this plant will
produce approximately 110 MW of power using wood chips as the primary fuel source.
Develop Improvements in Technical Training and Emission Control
Power4Georgians will work with local technical schools to develop training programs that focus
on environmental and emissions technology. In addition, Power4Georgians will work with

Prevention of Significant Deterioration Air Permit Application January 17, 2008 Plant Washington, Power4Georgians, LLC
070007.2201 8-14
Georgia’s University System to establish a research program on improving emissions control
technology.

Prevention of Significant Deterioration Air Permit Application January 17, 2008 Plant Washington, Power4Georgians, LLC
070007.2201 9-1
9.0 GEORGIA EPD FORMS


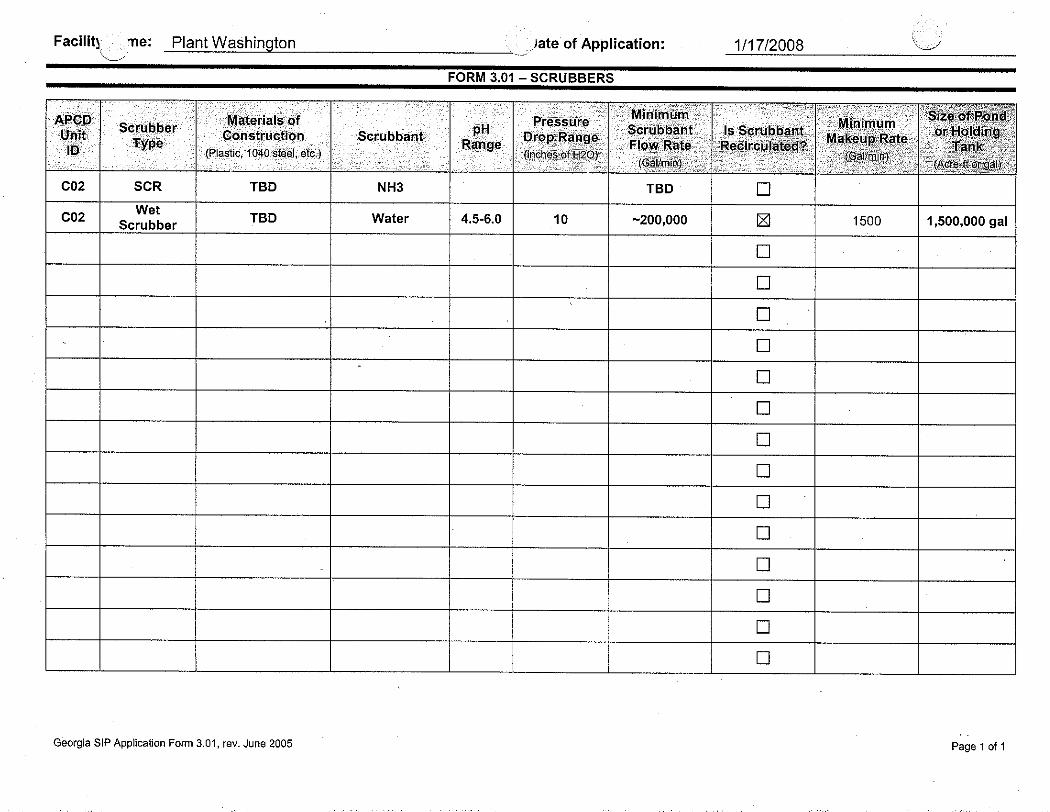

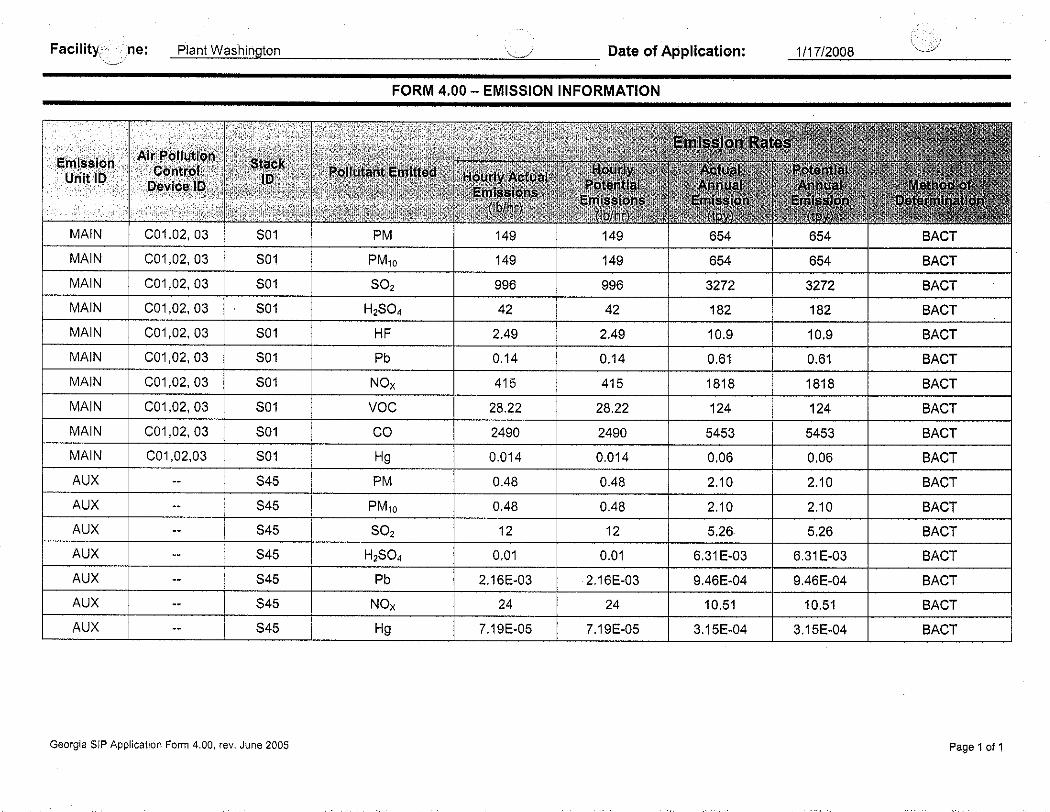


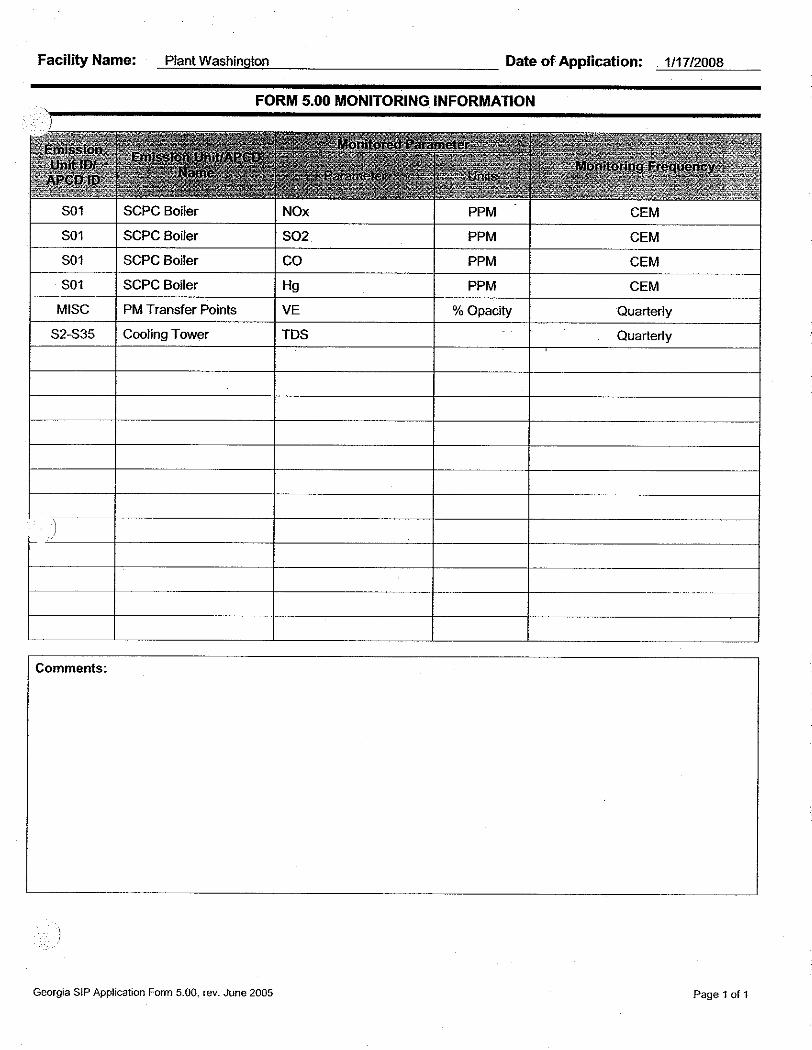

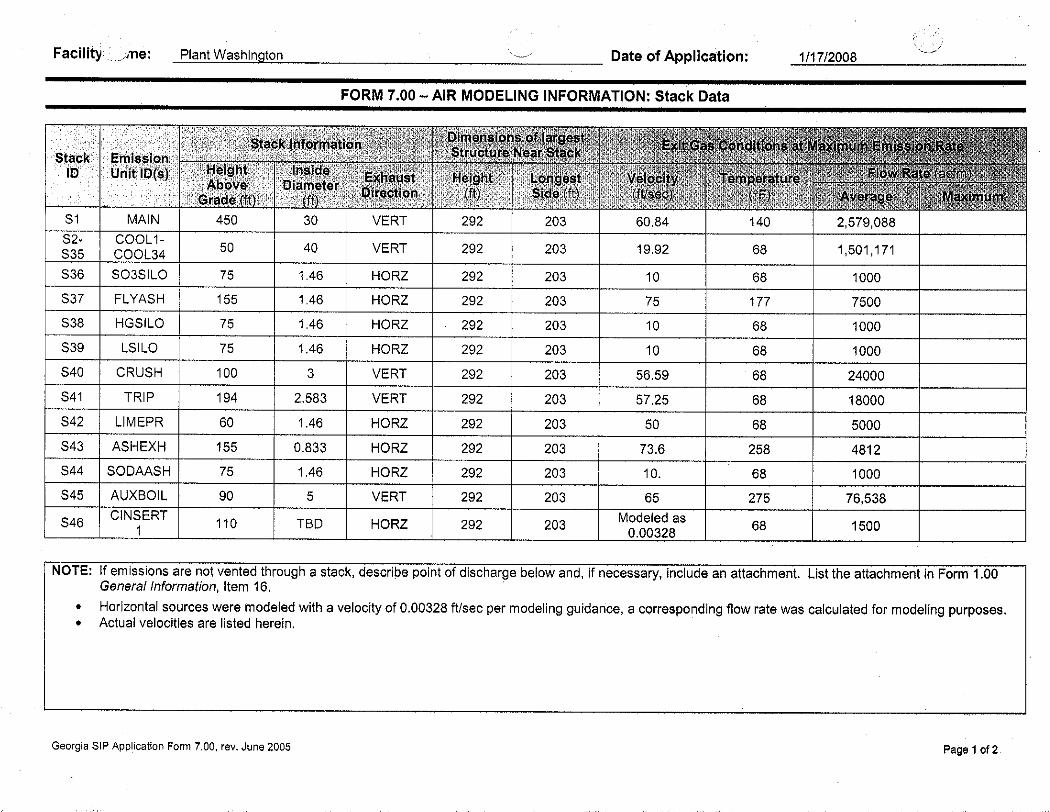


General Sandersville/Washington County Information County Organization Washington County Board of Commissioners P.O. Box 271 – Courthouse Square Sandersville, Georgia 31082 Phone: 478-552-2325 Fax: 478-552-7424 City Mayor Mayor James W. (Jimmy) Andrews 738 W. Church St. Sandersville, Georgia 31082 478-552-5480 Mayor Pro Tem Jeffery T. Smith 220 E. Church St. Sandersville, Georgia 31082 Draft/Public Review Contact S. Lee Lord, Clerk Washington County Board of Commissioners P.O. Box 271 – Courthouse Square Sandersville, Georgia 31082 County Board of Commissioners Mr. Horace M. Daniel – Chairman P.O. Box 271 – Courthouse Square Sandersville, Georgia 31082 Phone: 478-552-2325 Fax: 478-552-7424

Prevention of Significant Deterioration Air Permit Application January 17, 2008 Plant Washington, Power4Georgians, LLC
070007.2201 10-1
10.0 REFERENCES Georgia Environmental Protection Division (EPD), June 1998, ”Guideline for Ambient Impact
Assessment of Toxic Air Pollutant Emissions” Hoffman, J, Ratafia-Brown, R, (SAIC), 2003, “Preliminary Cost Estimate of Activated Carbon
Injection for. Controlling Mercury Emissions from an Un-Scrubbed 500 MW. Coal-Fired Power Plant” Final Report
Page, Stephen, Director EPA’s Office of Air Quality, Planning and Standards, Letter to E3
Consulting, LLC, December 13, 2005, “Best Available Control Technology Requirements for Proposed Coal-Fired Power Plant Projects:
Schnell, KB, Brown, CA, 2002, “Air Pollution Control Technology”, CRC Press Schwalb, AM, Withum JA , “The Evolution of Mercury From Coal Combustion Materials and
By-Products”, 2003, Mercury Control Technology R&D Program Review Meeting Srivastava, RK. 2005, “Controlling SO2 Emissions: An Update 2005” US Environmental
Protection Agency, RTP EPA/600/R-00/093 US EPA, 1980, “A Screening Procedure for the Impacts of Air Pollution Sources on Plants, Soils
and Animals”, OAQPS Publication EPA 450/2-81-0078, NTIS US EPA Air Pollution Training Institute: “Electrostatic Precipitator Plan Review” (http://www.epa.gov/air/oaqps/eog/course_name.html#e) US EPA Coal Utility Environmental Cost (CUECost) Model Version 1.0,
(http://www.epa.gov/ttn/catc/products.html#cccinfo) US EPA Cyclones Fact Sheet 2003
(http://www.epa.gov/ttn/catc/products.html#aptecfacts) US EPA, DRAFT 1990, “New Source Review Workshop Manual, Prevention of Significant
Deterioration and Nonattainment Area Permitting”. US EPA DRY ESP Fact Sheet, 2003 (http://www.epa.gov/ttn/catc/products.html#aptecfacts) US EPA Fabric Filter Fact Sheet, 2003
(http://www.epa.gov/ttn/catc/products.html#aptecfacts) US Federal Land Managers, December 2000, “Air Quality Related Values Workgroup (FLAG) –
Phase I Report”, US Forest Service, National Park Service, US Fish and Wildlife Service
Prevention of Significant Deterioration Air Permit Application January 17, 2008 Plant Washington, Power4Georgians, LLC
070007.2201 10-2
US EPA Flue Gas Desulfurization (FGD) Fact Sheet - Wet, Spray Dry, and Dry Scrubbers (2003) (http://www.epa.gov/ttn/catc/products.html#aptecfacts)
US EPA New Source Review Technology Transfer Network
(http://www.epa.gov/ttn/nsr/) US EPA, November 2007, Coal-fired Utility NSR Spreadsheet,
(http://www.epa.gov/ttn/catc/dir1/natlcoal.xls) US EPA OAQPS, June 26, 1987, “Operational Guidance on Control Technology for New and
Modified Municipal Waste Combustors (MWCs)” US EPA Promulgated Stack Test Methods
(http://www.epa.gov/ttn/emc/promgate.html) US EPA RACT/BACT/LAER Clearinghouse (RBLC)
(http://cfpub.epa.gov/rblc) US EPA SCR Fact Sheet (2003)
(http://www.epa.gov/ttn/catc/products.html#aptecfacts) US EPA SNCR Fact Sheet (2003)
(http://www.epa.gov/ttn/catc/products.html#aptecfacts) US EPA TANKS Program (version 4.0.9d)
(http://www.epa.gov/ttn/chief/software/tanks/index.html) US EPA, Tutorial Package for the VISCREEN Model
(http://www.epa.gov/scram001/guidance/tutor/read3.txt) US EPA Wet ESP Fact Sheet, 2003
(http://www.epa.gov/ttn/catc/products.html#aptecfacts) US EPA, 2005, “Control of Mercury Emissions From Coal Fired Electric Utility Boilers: An
Update (2005)” VISTAS, Revised 2006, :Protocol for the Application of the CALPUFF Model for Analyses of
Best Available Retrofit Technology (BART)” Hoden, W (PES), 2003, Letter to Ron Ryan (EPA Emission Factor and Inventory Group),
September 29