Çöpler gold mine · 2014. 9. 25. · world‐class mine with significant, consistent low‐cost...
TRANSCRIPT

Site Visit Presentation – September 2014
Çöpler Gold Mine
Slide 1
For
per
sona
l use
onl
y

Slide 2
FORWARD‐LOOKING STATEMENTS Except for statements of historical fact relating to Alacer Gold Corp. (“Alacer”), certain statements contained in this presentation constituteforward‐looking information, future oriented financial information, or financial outlooks (collectively "forward‐looking information") within the meaning of Canadian securitieslaws. Forward‐looking information may be contained in this presentation and Alacer's public filings. Forward‐looking information often relates to Alacer's future outlook andanticipated events or results and, in some cases, can be identified by terminology such as "may", "will", “could”, "should", "expect", "plan", "anticipate", "believe", "intend","estimate", “projects”, "predict", "potential", "targeted", "possible", "continue", "objective" or other similar expressions concerning matters that are not historical facts. Forward‐looking information contained in this presentation and other Alacer filings which may prove to be incorrect, include statements concerning, among other things, the generation offree cash flow and payment of dividends; matters relating to proposed exploration; production guidance and ability to target high grade ore bodies; the study, development andconstruction of proposed mines and process facilities; and the preparation and dissemination of technical studies. Such forward‐looking statements are based on a number ofmaterial factors and assumptions, which Alacer believes are reasonable, including, but not limited in any manner, to those to disclosed in any other of Alacer’s public filings, andinclude the inherent speculative nature of exploration results; the ability to explore; governmental relations; commodity prices; the ultimate determination of and realization ofmineral reserves; existence or realization of mineral resources; the development approach; availability and final receipt of required approvals, titles, licenses and permits; andsupplies; foreign currency exchange rates; interest rates; access to capital markets and associated cost of funds; availability of a qualified work force; ability to negotiate, finalizeand execute relevant agreements; lack of social opposition to the mines or facilities; lack of legal challenges with respect to the property of Alacer; the timing and amount offuture production and ability to meet production targets; timing and ability to produce studies and analyses; capital and operating expenditures; availability of sufficient financing;the ultimate ability to mine, process and sell mineral products on economically favorable terms and any and all other timing, exploration, development, operational, financial,budgetary, economic, legal, social, regulatory and political factors that may influence future events or conditions. Actual results may vary from such forward‐looking informationfor a variety of reasons, including but not limited to risks and uncertainties disclosed in other Alacer filings at www.sedar.com. Forward‐looking statements are based uponmanagement’s beliefs, estimate and opinions on the date the statements are made and, other than as required by law, Alacer does not intend, and undertakes no obligation toupdate any forward‐looking information to reflect, among other things, new information or future events.
The exploration results, Mineral Resources and Mineral Reserves disclosure in this presentation have been compiled and approved by Mr. James Francis, BSc (Hons) Geology andMSc Mining Geology, GM ‐ Technical of Alacer. Mr. Francis has sufficient experience which is relevant to the style of mineralization and type of deposit under consideration and tothe activity which is being undertaken to qualify as a Competent Person as defined in the 2004 Edition of the “Australasian Code for Reporting of Exploration Results, MineralResources and Ore Reserves” and a Qualified Person pursuant to NI 43‐101. He consents to the inclusion in this presentation of the matters based on this information in the formand context in which it appears.
This presentation does not represent a solicitation or offer to sell securities. All dollars in this presentation are US$’s.
Cautionary StatementsF
or p
erso
nal u
se o
nly

Çöpler Gold MineWelcome
Slide 3
For
per
sona
l use
onl
y

Standalone projects
Become multi‐mine producer
High quality targets identified
Additional oxides Low capital cost High margin Significant cash flow Leverage existing
infrastructure
Sulfide project
Positioned to Capitalize on Multi‐Mine Strategy
Attractive Organic Growth Opportunities
2
1
3
Significant and scalable low‐cost, long‐term production
Strong and growing cash position (~$300M) to pursue organic growth
Positioned to Capitalize on Excellent Organic Growth Potential Organic Growth Potential
Çöpler Gold Mine
Slide 4
For
per
sona
l use
onl
y
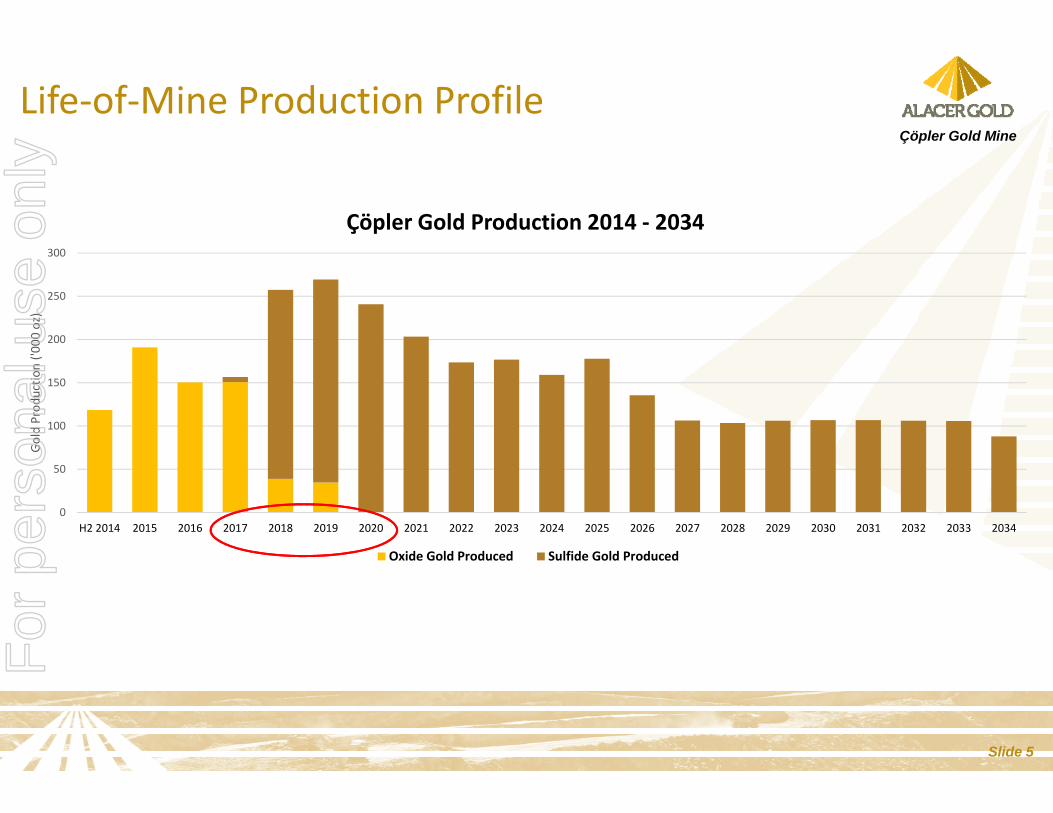
Life‐of‐Mine Production Profile
Slide 5
Çöpler Gold Mine
0
50
100
150
200
250
300
H2 2014 2015 2016 2017 2018 2019 2020 2021 2022 2023 2024 2025 2026 2027 2028 2029 2030 2031 2032 2033 2034
Gold Prod
uctio
n ('0
00 oz)
Çöpler Gold Production 2014 ‐ 2034
Oxide Gold Produced Sulfide Gold Produced
For
per
sona
l use
onl
y

Slide 6
Çöpler Gold Mine
High‐Value, Near‐Term Oxide OpportunitiesÇöpler heap leach pad expansion
Sulfide project DFS mine plan includes 4.2Mt at 1.2 gpt of heap leachable material currently classified as waste
Study well progressed to expand existing heap leach pad capacity beyond current 50Mt Initial results indicate potential to add ~15‐20Mt of additional capacity
Further leachable ore opportunities Reviewing current operating parameters for leachable ore Exploration potential to discover satellite oxide deposit in Çöpler District
Other heap leach pad locations identified
Current 50Mt Heap Leach Facility
Proposed expansion
For
per
sona
l use
onl
y

World‐Class Mine with Significant, ConsistentLow‐Cost Production and Cash Flow
($1,500)
($750)
$0
$750
$1,500
2013
Glo
bal C
ash
Cos
t Cur
ve(U
S$/o
z)
First Quartile Total Cash Costs (C2$/oz)1
Çöpler Gold Mine $429/oz
Average Cash Costs: $721/oz
1st 2nd
3rd 4th
Quartile
Significant Heap Leach Production (koz Au) (100%)
185 189
271
200
185374
645 845 - 870
2011A 2012A 2013A 2014
Guidance
Annual Production Cumulative Production
225
Consistently Delivering Substantial Cash Flow ($M’s) (100%)
$60
$45 $43
$26
$55
$41$50
$38$30
$12
$47
$28 $27
$11
$36
$11
$29 $31 $25
$7
Q1 Q2 Q3 Q4 Q1 Q2 Q3 Q4 Q1 Q2
2012 2013 2014Operating Cash Flow Free Cash Flow2
3
World‐Class Mine with Significant,Low‐Cost Production and Cash Flow Çöpler Gold Mine
1 Source: SNL Financial.2 Free Cash Flow is defined as Operating Cash Flow less capital expenditures (including capitalized exploration)3 Q2 '14 Free Cash Flow affected by several annual cash outflows occurring in Q2 and will not reoccur again this year
Slide 7
For
per
sona
l use
onl
y

Life‐of‐Mine Production Profile
Slide 8
Çöpler Gold Mine
July 2014 to Dec 2017Heap Leach
Only
2018 to 2022
First 5 years of POX
2023 to 2034
Remainder of LOM
Total(100%)
MiningOxide Ore to Heap Leach Pad Mt 21.8 1.5 0 23.2Sulfide Ore Mt 6.31 13.7 8.9 28.9Waste Mt 85.8 51.4 24.1 161.2Total Tonnes Mined Mt 113.8 66.5 33.0 213.3Strip Ratio 3.1 3.4 2.7 3.1ProcessingOxide Ore Mt 21.8 1.5 0 23.2Oxide Head Grade g/t gold 1.30 1.46 0 1.31Oxide Gold Produced ‘000 oz 611 73 0 684Sulfide Ore Mt 0.04 9.0 22.6 31.7Sulfide Head Grade g/t gold 5.20 3.90 2.18 2.67Sulfide Gold Produced ‘000 oz 6 1,071 1,478 2,555Total Gold Production ‘000 oz 616 1,144 1,478 3,239
Rounding differences will occur
1 Sulfide tonnes mined are planned to be stockpiled prior to commissioning of the sulfide processing plant
For
per
sona
l use
onl
y

Çöpler Gold MineOverview
Slide 9
For
per
sona
l use
onl
y

Outline of Presentation & Mine Tours• Location & Ownership• People & Administration• Health, Safety & Environment• Community Relations• Pits & Infrastructure• Geology• Resources and Reserves• Mining & Processing• Projects• Costs & Outlook• Sulfide Project
Slide 10
Çöpler Gold Mine
Welcome to Çöpler Gold Mine!
For
per
sona
l use
onl
y

Corporate Head OfficeDenver, Colorado
Turkey
Corporate Overview Corporate / Asset Location
Sariçayiryayla
Dursunbey (50%)
Yelekkaya
Ïvrindi
Yahyali
Akoluk
KabadüzFol-ken
Kurttepe
GuvemlïKazikbeli
Cevïzlïdere (50%)
Anagold JV(Lidya Mining)
80%
Tunçpınar JV(Lidya Mining)
50%
Polimetal JV
Kartaltepe JV(Lidya Mining)
Certain ÇöplerDistrict Licenses
4 Projects
TurkeyRegional
Exploration
3 Projects
CertainÇöpler District
Licenses
5 Projects
50% 20%1
Çöpler Gold Mine
Tunçpınar JV
Erzincan
Istanbul
1 Alacer has the right to “claw back” up to a 50% interest in individual projects within the Polimetal JV.
TurkeyRegional
Exploration
11 Projects
World-class gold mine, several attractive projects and extensive land package in Turkey
SinMalmisÇöpler District
Polimetal JV(Lidya Mining)
Turkey OfficeAnkara
Çöpler Gold MineCompany Snapshot
Slide 11
For
per
sona
l use
onl
y

Çöpler Licenses Held in Two Joint Ventures
Slide 12
Çöpler Gold Mine
For
per
sona
l use
onl
y

People
Slide 13
Çöpler Gold MineTurkish Business UnitOrganizational Structure
For
per
sona
l use
onl
y

Human Resources - Employees
Slide 14
Çöpler Gold Mine
Skill Levels of Employees in Çöpler Project ‐ as per Recruitment Places as of 31.Aug.2014
Recruitment PlaceUnskilled Semi‐skilled Skilled Total
# % # % # % # %
Çöpler 10 9% 27 6% 18 6% 55 6%
Sabırlı 11 10% 31 7% 5 2% 47 6%
Bağıştaş ‐ Dostal ‐ Bahçe ‐ ‐ 4 1% 2 1% 6 1%
İliç Centre 74 68% 332 81% 88 27% 494 59%
Other Villages of İliç 4 3% 9 2% 4 1% 16 2%
Erzincan 7 6% 2 0% 21 7% 29 3%
Other Cities 4 4% 6 1% 176 55% 186 22%
Other Countries ‐ ‐ ‐ ‐ 9 3% 9 1%
Grand Total 110 410 323 842Note: This table includes both ANAGOLD's and Contractors' employees who work for Copler Project. Numbers are full‐month equivalents.
For
per
sona
l use
onl
y

Health & Safety Performance
Slide 15
Çöpler Gold Mine
1. Meeting or exceeding legal requirements and international standards
2. Creating and maintaining a safe, healthy and positive working environment
3. Educating and training employees and contractors in HSE best practice and procedures in the spirit of “Safe Production”
Health & Safety Strategy
CY7 CY8 CY9 CY10 CY11 CY 2012 CY 2013 Q1 2014 Q2 2014
Çöpler LTI 1 2 1 6 3 5 1 0 0
0
1
2
3
4
5
6
7
LTIs
Çöpler Gold Mine LTIs Over 550 Days without LTI &
4.05 million hours since last LTI(end of August)
For
per
sona
l use
onl
y

Environmental Performance
Slide 16
Çöpler Gold Mine
1. Meeting or exceeding legal requirements and international environmental standards
2. Maintaining and improving the environmental management system to align with the requirements of ISO 14001
3. Educating and training employees in environmental practices and procedures to develop an environmental sensitive culture
Environmental Strategy
CY7 CY8 CY9 CY10 CY11 CY 2012 CY2013 Q1 2014 Q2 2014
Copler RI's 0 0 0 1 0 1 0 0 1
0
1
2
3
4
5
6
7
Inci
dent
s &
Gov
ernm
ent
Rep
orta
ble
Inci
dent
’s
Çöpler Gold MineReportable Environmental Incidents
Spills contained and remediated
For
per
sona
l use
onl
y

Community Relations
Slide 17
Çöpler Gold Mine
• Social policies, procedures and plans implemented in accordance with IFCGuidelines, Company Social Impact Assessment and Relocation Action Plan.
• Communication with the local community and the Governmental officials byholding regular visits.
• Community Development Programs by working with AgriculturalDepartments, Governorship, Universities, Development Agencies, and otherrelated parties.
• “Community Relations, Cultural Sensitivity and Awareness Training” for allcompany and contractor employees.
• Scholarship programs for high school and university students from İliç and allstudents of Mine Technology department of İliç Vocational High School.
• Communication with local media agencies.• Alacer Gold has agreed to donate US$2.8M for the construction of a PrimarySchool in İliç.
For
per
sona
l use
onl
y

Community Relations
Slide 18
Çöpler Gold Mine
New Primary SchoolCapacity building & socialprograms for women
Mine site tours for locals, officials, students, etc.
Community awarenessprograms like cyanide
brochures
Some CR activity statistics to date:• 1,444 consultation meetings held• 224 grievances conveyed by the community
have been resolved• 498 community projects (excluding the school)
were funded for ≈US$1.6MFor
per
sona
l use
onl
y
Community Relations
Slide 19
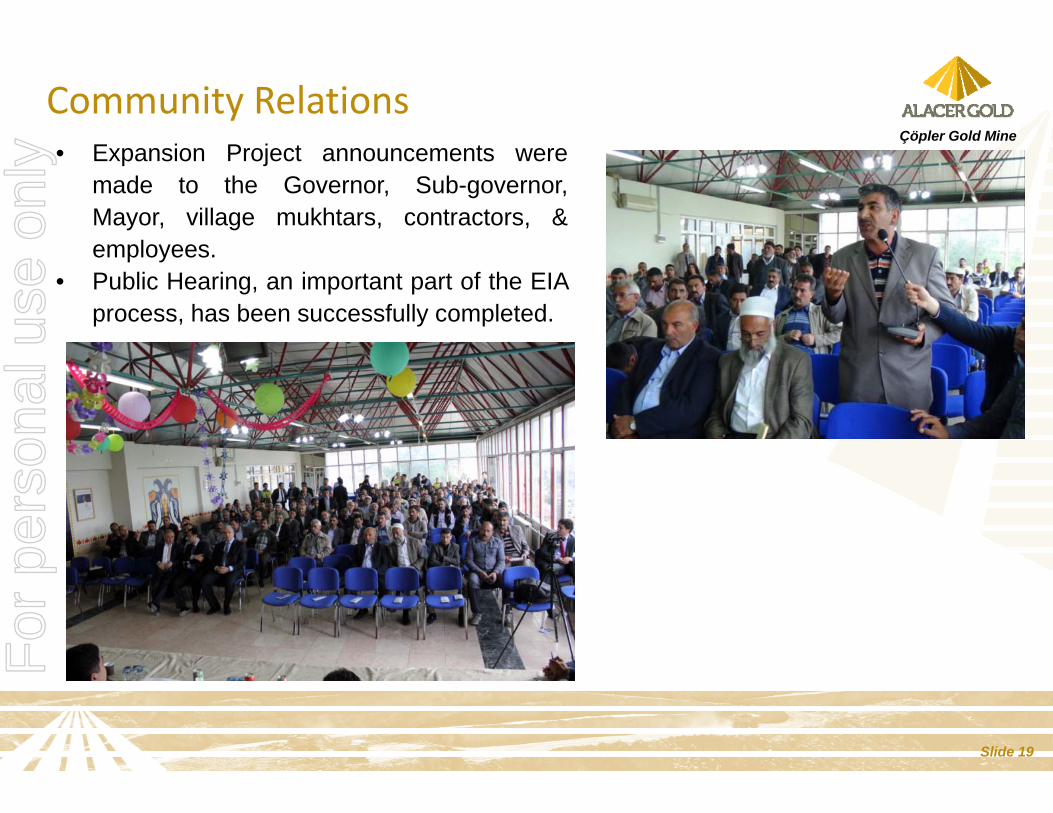
Çöpler Gold Mine• Expansion Project announcements were
made to the Governor, Sub-governor,Mayor, village mukhtars, contractors, &employees.
• Public Hearing, an important part of the EIAprocess, has been successfully completed.
For
per
sona
l use
onl
y
Slide 20
Çöpler Gold Mine
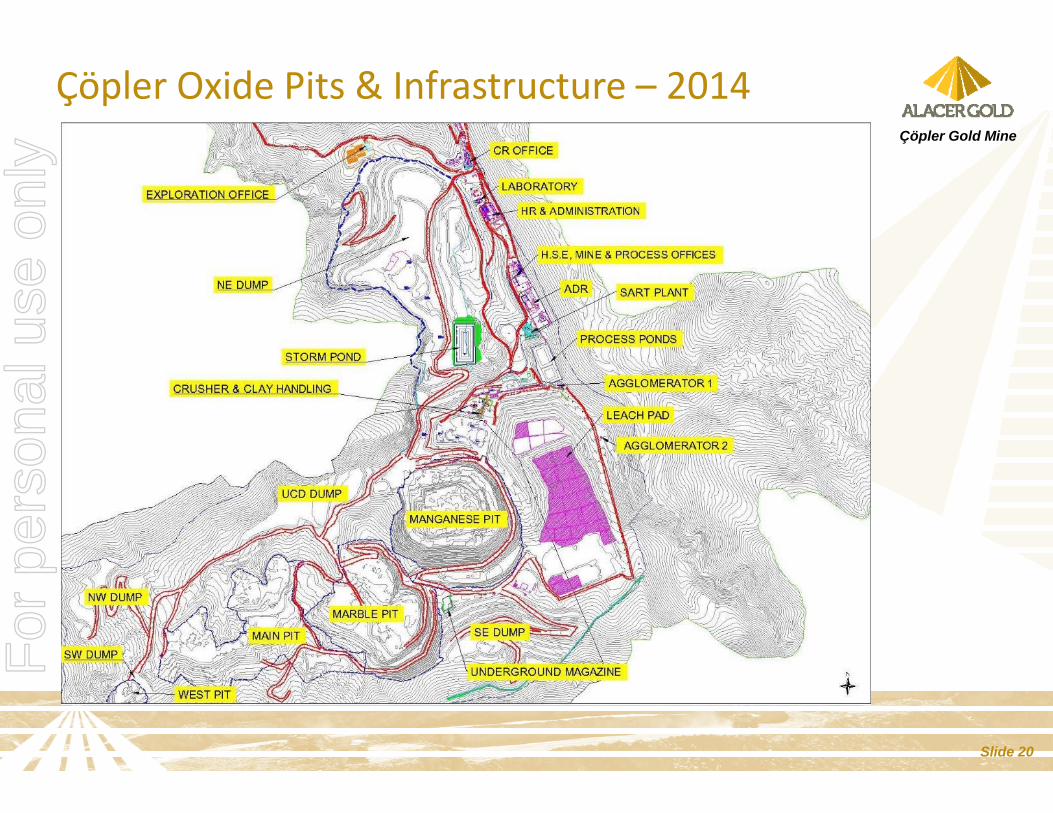
Çöpler Oxide Pits & Infrastructure – 2014F
or p
erso
nal u
se o
nly

Overview of Çöpler Mine
Slide 21
SE Waste Dump
Manganese Pit
Marble Pit
Main Pit
Crusher & Clay‐Handling
SART ADR
Leach Pad
PondsAgglomeration & Conveying
Çöpler Gold Mine
For
per
sona
l use
onl
y

Çöpler Gold MineGeology
Slide 22
For
per
sona
l use
onl
y

Exceptional Exploration Potential
Slide 23
Çöpler Gold Mine
18 years in Turkey gives Alacer early mover advantage Tethyan Belt is historically under‐explored and has excellent mineral potentialF
or p
erso
nal u
se o
nly
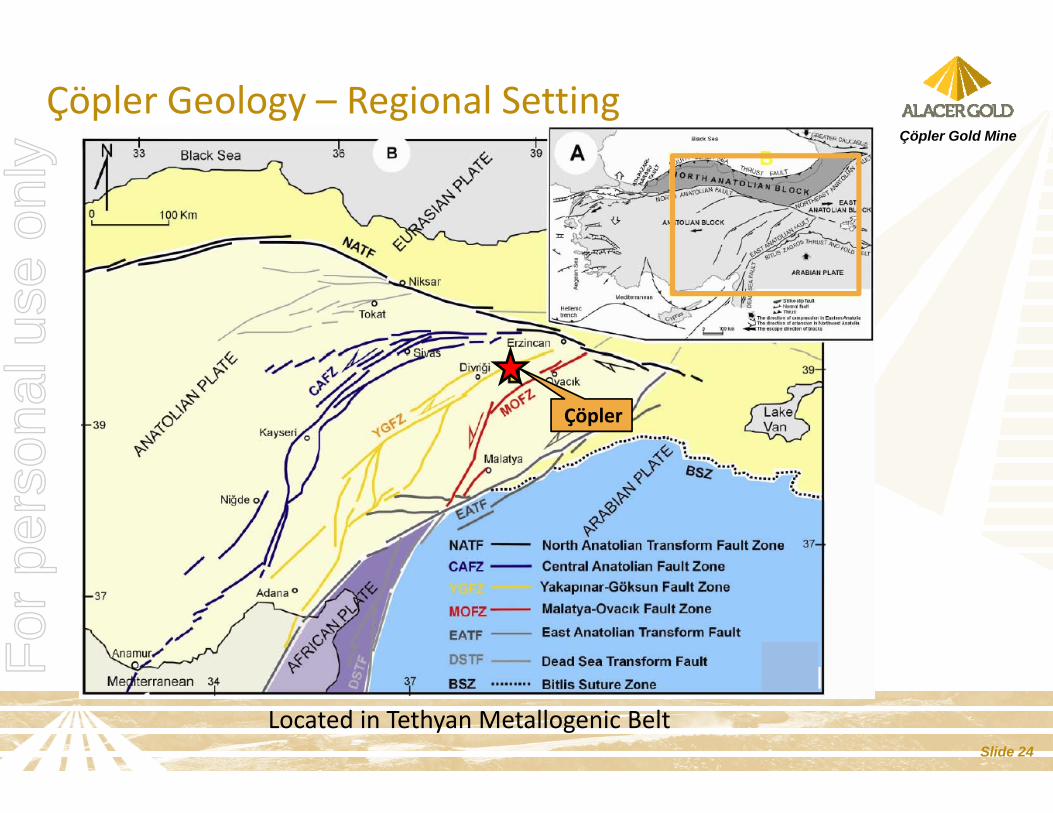
Çöpler Geology – Regional Setting
Located in Tethyan Metallogenic Belt
Çöpler
Slide 24
Çöpler Gold Mine
For
per
sona
l use
onl
y

Çöpler District Geology & Licenses
25 km
15 k
m
Mining License (942 hectares)
is surrounded by Exploration Licenses
Slide 25
Çöpler Gold Mine
For
per
sona
l use
onl
y

Çöpler Geology – Key Rock Types
Limestone
Marble
Metasediments Intrusive
Old workingson contacts
Looking west across Çöpler deposit Slide 26
Çöpler Gold Mine
For
per
sona
l use
onl
y

Çöpler Geology – Plan of Deposit
3 km long ore zone Slide 27
Çöpler Gold Mine
For
per
sona
l use
onl
y
Çöpler Geology – Mineralization Styles
Çöpler is an intermediate sulfidation epithermal deposit
Sulfide mineralization exhibits three principal styles:• Disseminated sulfides in stock work quartz‐veined metasediments and diorite (Main Zone, Marble Zone)
• Disseminated sulfides in clay altered, brecciated and carbonitized diorite (Manganese Zone)
• Massive sulfide replacement bodies along the marble contacts (Main Zone contacts, Marble Zone, Manganese Zone)
Slide 28
Çöpler Gold Mine
For
per
sona
l use
onl
y

Çöpler District – Priorities for 2014
Slide 29
Çöpler Gold Mine
Identify supplementary oxide ore within trucking distance of Çöpler infrastructure
Discover standalone projects in the extensive mineralized system
Continue target generation and prioritization
$11.1M 2014 Budget (100%)
For
per
sona
l use
onl
y

Çöpler District – 2013 Target Generation
Slide 30
Çöpler Gold Mine
For
per
sona
l use
onl
y

Strong Targets Identified in Highly Prospective Çöpler District
Slide 31
Çöpler Gold Mine
Bayramdere (50%)21m at 1.5g/t Au from 27m5m at 1.7g/t Au from 37m5m at 1.7g/t Au from 28m
Yakuplu (50%)7m at 4.6g/t Au from surface10m at 1.0g/t Au from 6m14m at 1.1g/t Au from 42m12m at 1.2g/t Au from 48m
Anagold Yakuplu (80%)17m at 1.7g/t Au from 55m6m at 4.7g/t Au from 55m14m at 1.6g/t Au from 1m17m at 2.7g/t Au from 73m
Dursunbey
For
per
sona
l use
onl
y

Çöpler Gold MineMineral Resources and Reserves
Slide 32
For
per
sona
l use
onl
y

Çöpler Resource Continues to Grow
Slide 33
Çöpler Gold Mine
‐
2
4
6
8
10
12
14Feb 10
Dec 11
June
12
June
13
Dec 13
Million ou
nces of gold
Çöpler Resource + Mined Ounces (100%)
Inferred
Measured + Indicated
Contained Ounces Mined
For
per
sona
l use
onl
y

Ongoing Resource Reconciliation Study
Slide 34
Çöpler Gold Mine
• Resource reconciliation work has significantly upgraded the quality of the reserve
• Changed modelling method from Ordinary Kriging to Probability Assigned Constrained Kriging (PACK), utilized because it allows better calibration of the resource model to historical mining results
• Completed exploration database audit:
– Ensured integrity of data, confirmed error rate of <1% on assay results
• Completed discreet 1,000m twin hole drilling program using triple wall PQ core tubing:
– Original drilling had some poor core recovery in some high‐grade zones
– New triple wall PQ drilling provided consistent high core recoveries
• Completed blast hole data audit and confirmed historical data is accurate
• Resource reconciliation study ongoingFor
per
sona
l use
onl
y

Block Model ComparisonManganese Pit – Section 4,364,360N
2014 Resource Model• Probability Assisted Constrained Kriging (PACK) calibrated to historical mining
results provides better definition of mineralization
2013 Resource Model• Previous modelling by geology
restricted ore definitions
Block Color Legend
2013
2014
2010
2013 Pit
2013 Pit
2013 Pit2010 Resource Model
• Ordinary Kriging & no historical comparisons
Çöpler Gold Mine
Slide 35
For
per
sona
l use
onl
y

Manganese Pit Geology
Slide 36
Çöpler Gold Mine
Manganese Pit “Ring of Fire”
Diorite intrusion contact zone (white ring around intrusion)
Poor drilling recoveries along contact
High-grade ore mined along contact
For
per
sona
l use
onl
y
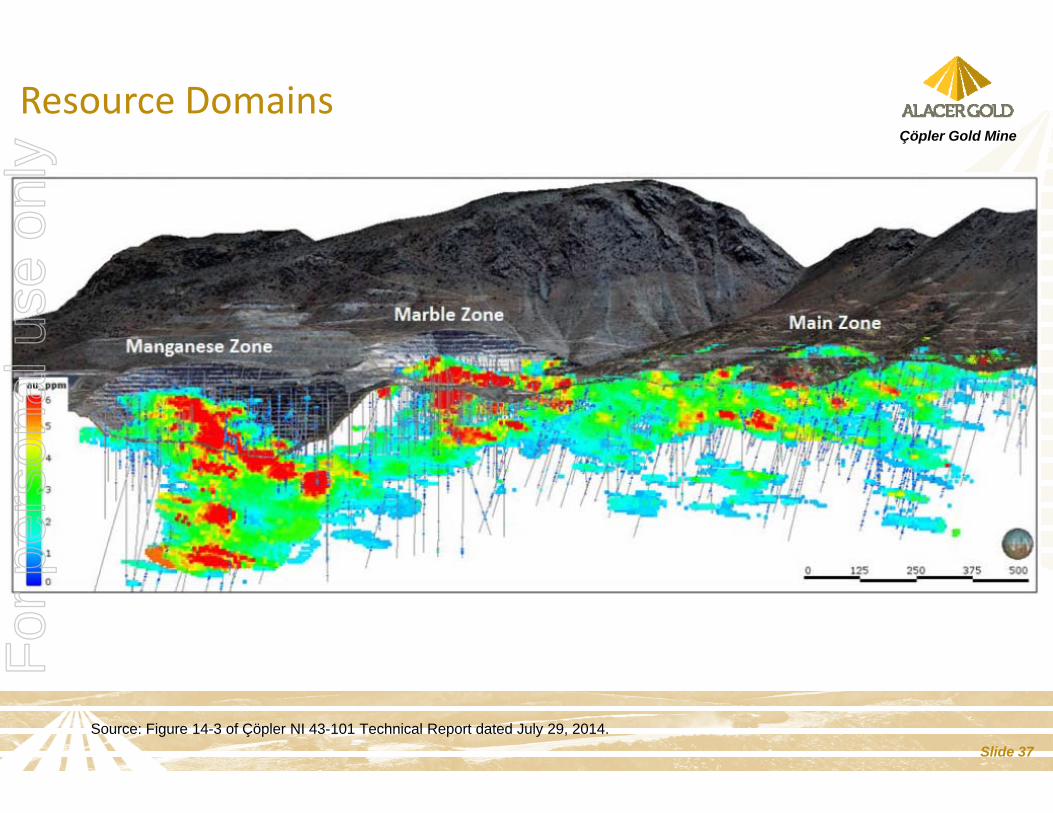
Resource Domains
Slide 37
Çöpler Gold Mine
Source: Figure 14-3 of Çöpler NI 43-101 Technical Report dated July 29, 2014.
For
per
sona
l use
onl
y
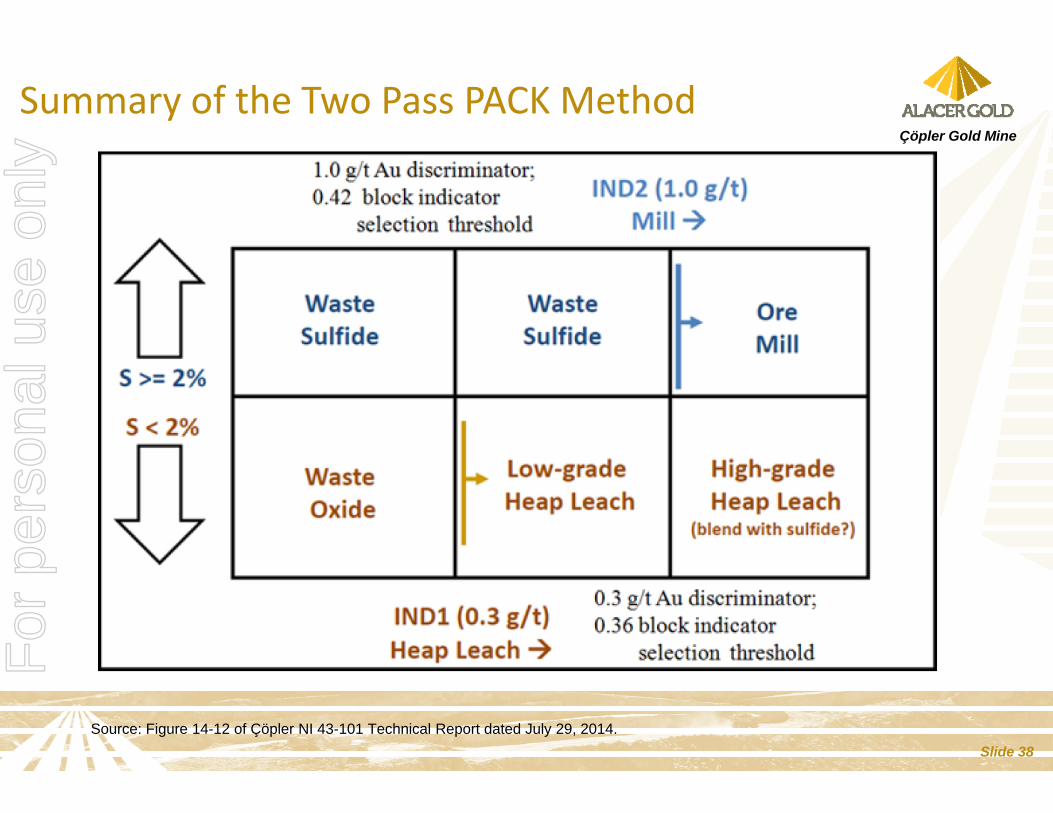
Summary of the Two Pass PACK Method
Slide 38
Çöpler Gold Mine
Source: Figure 14-12 of Çöpler NI 43-101 Technical Report dated July 29, 2014.
For
per
sona
l use
onl
y

Resource Classification
Slide 39
Çöpler Gold Mine
Plan of Resource Classification Showing Indicated (Green) with Inferred (Blue) Material Forming a Ring around the Indicated Material
Source: Figure 14-16 of Çöpler NI 43-101 Technical Report dated July 29, 2014.
For
per
sona
l use
onl
y

Whittle Pit Optimizations
Slide 40
Çöpler Gold Mine
Source: Figure 16-2 of Çöpler NI 43-101 Technical Report dated July 29, 2014.
For
per
sona
l use
onl
y

Çöpler Mineral Resource
Slide 41
Çöpler Gold Mine
Updated Mineral Resources for the Ҫӧpler Deposit (As of December 31, 2013)
Gold Cut‐off Grade (g/t) Material Type
Resource Category Material
Tonnes (x1000) Au (g/t) Ag (g/t) Cu (%) Contained Au
(oz x 1000)
Variable Oxide
Measured ‐ ‐ ‐ ‐ ‐Indicated 69,512 1.08 2.78 0.15 2,421Stockpile ‐ Indicated 18 3.19 ‐ ‐ 2Measured + Indicated 69,530 1.08 2.78 0.15 2,422Inferred 28,893 0.97 4.58 0.11 904
1.0 Sulfide
Measured ‐ ‐ ‐ ‐ ‐Indicated 81,854 1.95 5.64 0.11 5,135 Stockpile ‐ Indicated 1,536 4.84 9.81 0.11 239Measured + Indicated 83,390 2.00 5.71 0.11 5,374 Inferred 22,884 1.92 10.85 0.15 1,411
Variable Stockpiles Indicated 1,554 4.82 ‐ ‐ 241
Variable Total
Measured ‐ ‐ ‐ ‐ ‐Indicated 152,920 1.59 4.38 0.13 7,796 Measured + Indicated 152,920 1.59 4.38 0.13 7,796 Inferred 51,778 1.39 7.35 0.13 2,315
M+I Resources total 7.8M contained ounces of gold
Note: Resources are quoted after mining depletion and are inclusive of reserves. Resources are shown on a 100% basis, of which Alacer Gold owns 80%. Rounding errors will occur. Further information on this resource estimate is in the NI43-101 Technical Report dated July 29, 2014.
For
per
sona
l use
onl
y

Çöpler Mineral Reserve
Slide 42
Çöpler Gold Mine
Updated Mineral Reserves for the Ҫӧpler Deposit (As of December 31, 2013)
Reserve Category Material Tonnes (x1000)
Au (g/t)
Ag(g/t)
Cu(%)
Contained Au Ounces
Recoverable Au Ounces
Proven ‐ Oxide In‐Situ ‐ ‐ ‐ ‐ ‐ ‐Probable ‐ Oxide In‐Situ 26,207 1.32 2.88 0.13 1,114,700 770,900Probable ‐ Oxide Stockpile 18 3.19 ‐ ‐ 1,800 1,200Total ‐ Oxide 26,224 1.32 2.88 0.13 1,116,500 772,100Proven ‐ Sulfide In‐Situ ‐ ‐ ‐ ‐ ‐ ‐Probable ‐ Sulfide In‐Situ 30,139 2.56 6.88 0.12 2,482,500 2,330,200Probable ‐ Sulfide Stockpile 1,536 4.84 9.81 0.11 239,000 225,100Total ‐ Sulfide 31,675 2.67 7.02 0.12 2,721,500 2,555,300Proven ‐ Oxide + Sulfide + Stockpile ‐ ‐ ‐ ‐ ‐ ‐
Probable ‐ Oxide + Sulfide 57,899 2.06 5.14 0.12 3,838,000 3,327,400Total ‐ Oxide + Sulfide 57,899 2.06 5.14 0.12 3,838,000 3,327,400
Mineral Reserves total 3.8M contained ounces of gold
Note: Reserves are shown on a 100% basis, of which Alacer Gold owns 80%. Rounding differences will occur. Further information on this resource estimate is in the NI 43‐101 Technical Report dated July 29, 2014.
For
per
sona
l use
onl
y

Reserve Comparison
Slide 43
Çöpler Gold Mine
Ҫӧpler ‐Mineral Reserve Comparison (100% Basis)Previous Reserve
(as at December 31, 2013)New (updated) Reserve
(as at December 31, 2013) Change
Reserve Category Material Tonnes (x1000) Au (g/t) Contained Au
OuncesTonnes (x1000) Au (g/t) Contained Au
OuncesTonnes (%) Au (%) Contained Au
Ounces (%)
Proven ‐ Oxide In‐Situ 28,155 0.97 876,400 ‐ ‐ ‐ ‐100% ‐100% ‐100%Probable ‐ Oxide In‐Situ 9,571 1.03 316,600 26,207 1.32 1,114,700 174% 29% 252%Probable ‐ Oxide Stockpile 18 3.19 1,800 18 3.19 1,800 0% 0% 0%Total ‐ Oxide 37,743 0.98 1,194,800 26,224 1.32 1,116,500 ‐31% 34% ‐7%Proven ‐ Sulfide In‐Situ 22,690 2.15 1,570,800 ‐ ‐ ‐ ‐100% ‐100% ‐100%Probable ‐ Sulfide In‐Situ 8,111 2.39 623,900 30,139 2.56 2,482,500 272% 7% 298%Probable ‐ Sulfide Stockpile 1,536 4.84 239,000 1,536 4.84 239,000 0% 0% 0%Total ‐ Sulfide 32,337 2.34 2,433,700 31,675 2.67 2,721,500 ‐2% 14% 12%Proven ‐ Oxide + Sulfide + Stockpile 52,399 1.60 2,688,000 ‐ ‐ ‐ ‐100% ‐100% ‐100%Probable ‐ Oxide + Sulfide 17,682 1.65 940,500 57,899 2.06 3,838,000 227% 25% 308%Total ‐ Oxide + Sulfide 70,081 1.61 3,628,500 57,899 2.06 3,838,000 ‐17% 28% 6%
• M+I Resources have increased by 0.62Moz (+9%) to 7.80Moz of contained gold• Mineral Reserves increased by 0.21Moz (+6%) to 3.84Moz of contained gold• Oxide grade has increased by 34% to 1.32g/t gold • Sulfide grade has increased by 14% to 2.67g/t gold
For
per
sona
l use
onl
y

Çöpler Gold MineMining
Slide 44
For
per
sona
l use
onl
y
Mining ‐ Overview
Slide 45
Çöpler Gold Mine
• Mine plans and designs are prepared by Anagold Engineering.• Staged open‐pit development• 4 oxide pits within large sulfide pit
• Drilling & blasting and loading & hauling is by a contractor.• Bench height = 5m• Blast hole pattern = 3.50m x 3.50m• Blast hole diameter = 102mm• Explosives factor = 0.16 kg/t• Explosives – ANFO
• Samples are taken from each hole to be assayed for Au. Ore tonnage and grade is determined from computer analysis. Boundaries are provided to surveyors.
• Assays from the blast holes are reconciled against the geological block model.• Mining activities are directed by Anagold Mine shift engineers to ensure compliance
with all company policies and government regulations.
For
per
sona
l use
onl
y

Mining – Contractor Mining FleetÇöpler Gold Mine
• 72 Mercedes Haul Trucks (38 tonne capacity)• 2 Volvo Articulated Haul Truck (35 tonne capacity)• 11 CAT Excavators (5m³)• 1 CAT Excavator (3.5m³)• 1 CAT Excavator (2.5m³)• 2 CAT Excavators (2.25m³)
(Rock Breakers)• 7 Atlas Copco Drills• 6 Cat Wheel Loaders• 3 CAT Graders• 7 CAT Bulldozers• 2 CAT Compactors• 5 Mercedes Water Trucks• 2 Motorin Delivery Trucks• 2 Maintenance Trucks
Mining Contractor ‐ Çiftay İnşaat Taahhüt Tic AŞ
Slide 46
For
per
sona
l use
onl
y
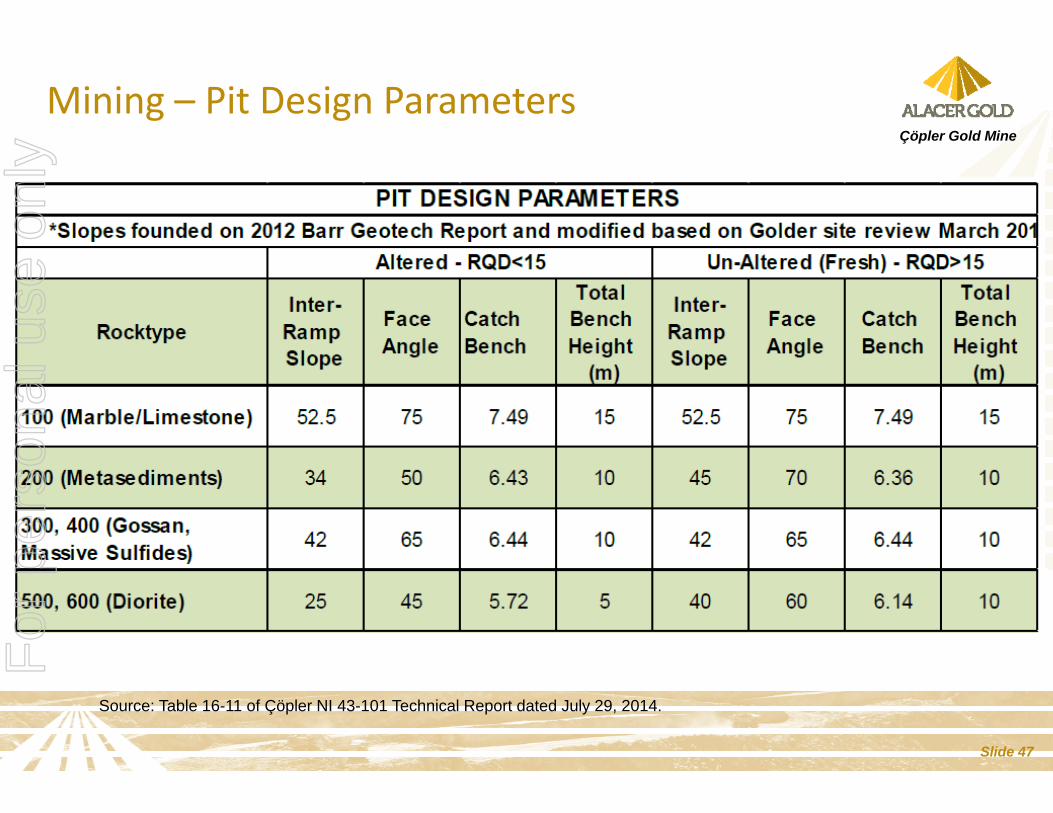
Mining – Pit Design ParametersÇöpler Gold Mine
Slide 47
Source: Table 16-11 of Çöpler NI 43-101 Technical Report dated July 29, 2014.
For
per
sona
l use
onl
y
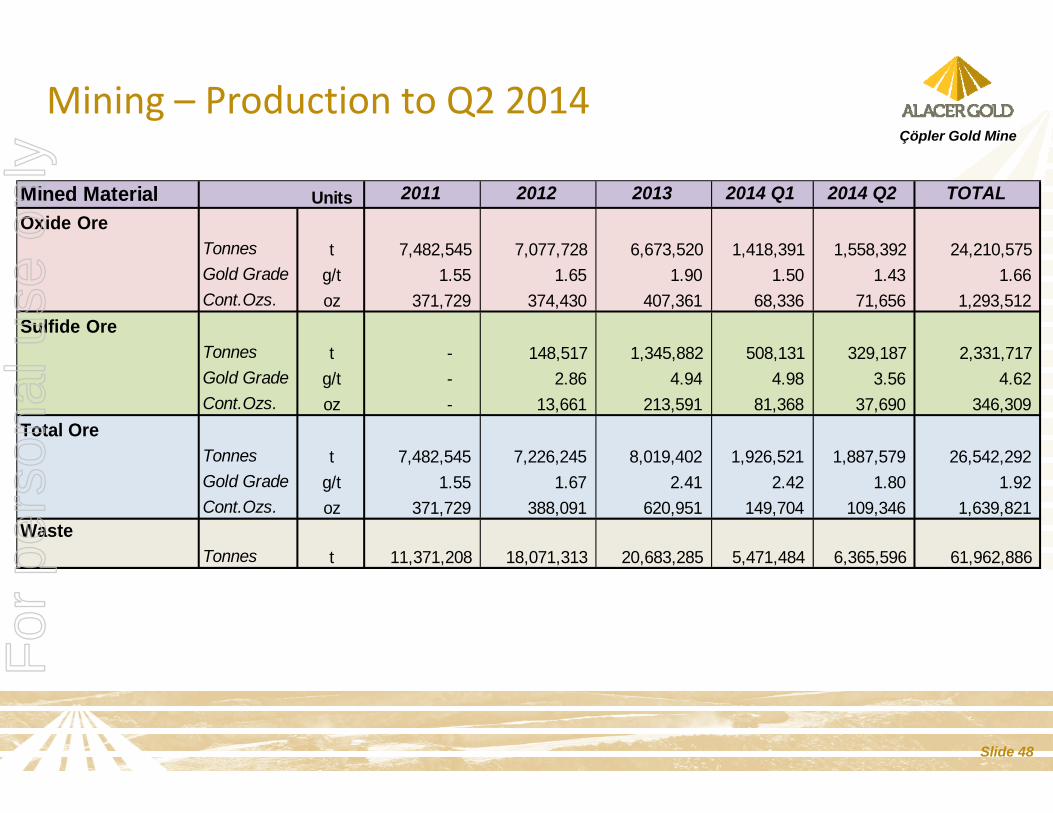
Mining – Production to Q2 2014Çöpler Gold Mine
Slide 48
Mined Material Units 2011 2012 2013 2014 Q1 2014 Q2 TOTALOxide Ore
Tonnes t 7,482,545 7,077,728 6,673,520 1,418,391 1,558,392 24,210,575 Gold Grade g/t 1.55 1.65 1.90 1.50 1.43 1.66 Cont.Ozs. oz 371,729 374,430 407,361 68,336 71,656 1,293,512
Sulfide OreTonnes t - 148,517 1,345,882 508,131 329,187 2,331,717 Gold Grade g/t - 2.86 4.94 4.98 3.56 4.62 Cont.Ozs. oz - 13,661 213,591 81,368 37,690 346,309
Total OreTonnes t 7,482,545 7,226,245 8,019,402 1,926,521 1,887,579 26,542,292 Gold Grade g/t 1.55 1.67 2.41 2.42 1.80 1.92 Cont.Ozs. oz 371,729 388,091 620,951 149,704 109,346 1,639,821
WasteTonnes t 11,371,208 18,071,313 20,683,285 5,471,484 6,365,596 61,962,886
For
per
sona
l use
onl
y
Çöpler Gold MineProcessing
Slide 49
For
per
sona
l use
onl
y

Processing ‐ Overview
Slide 50
Çöpler Gold Mine
Nominal plant throughput = 6.2Mtpa or 17,000tpd:• Primary gyratory & secondary/tertiary cone crushing circuit for rock ore supply.• Sizer circuit for clay ore supply.• Approximately equal split of clay to rock ore supply (nominal crush size to minus 12mm/25mm).
• Cement added for alkalinity & agglomeration.• Conveyed to heap leach pads via ‘grasshopper’ stackers.• Nominal 8m lifts on heap leach pads.• Dilute sodium cyanide solution distributed via drip system.
Adsorption, Desorption & Refinery (“ADR”) Plant:• Pregnant solution flows to two trains of 6 carbon‐in‐column (“CIC”) tanks.• Loaded carbon then stripped & regenerated.• Electro‐winning circuit removes gold from solution onto steel cathodes.• Induction furnace produces gold dore (average 60‐65% Au, 15‐20% Ag).
For
per
sona
l use
onl
y

Processing – Flow Sheet
Slide 51
Çöpler Gold Mine
For
per
sona
l use
onl
y

Processing – Production Performance
Slide 52
Çöpler Gold Mine
2011 2012 2013
Q (average) Q (average) Q (average) Q1 Q2
Stacked Ore ton 471,527 1,074,257 1,447,149 1,384,123 1,524,013
Grade g/t 2.50 1.97 2.08 1.48 1.46
ROM ton 1,350,520 694,690 227,052 ‐ ‐
Grade g/t 1.16 0.94 0.81 ‐ ‐
Total Ore to HL ton 1,822,046 1,768,946 1,674,120 1,384,123 1,524,013
Grade g/t 1.49 1.65 1.91 1.48 1.46
Gold Poured oz 46,398 47,189 68,338 52,919 49,795
2014
For
per
sona
l use
onl
y
Processing – Initiatives and Projects
Slide 53
Çöpler Gold Mine
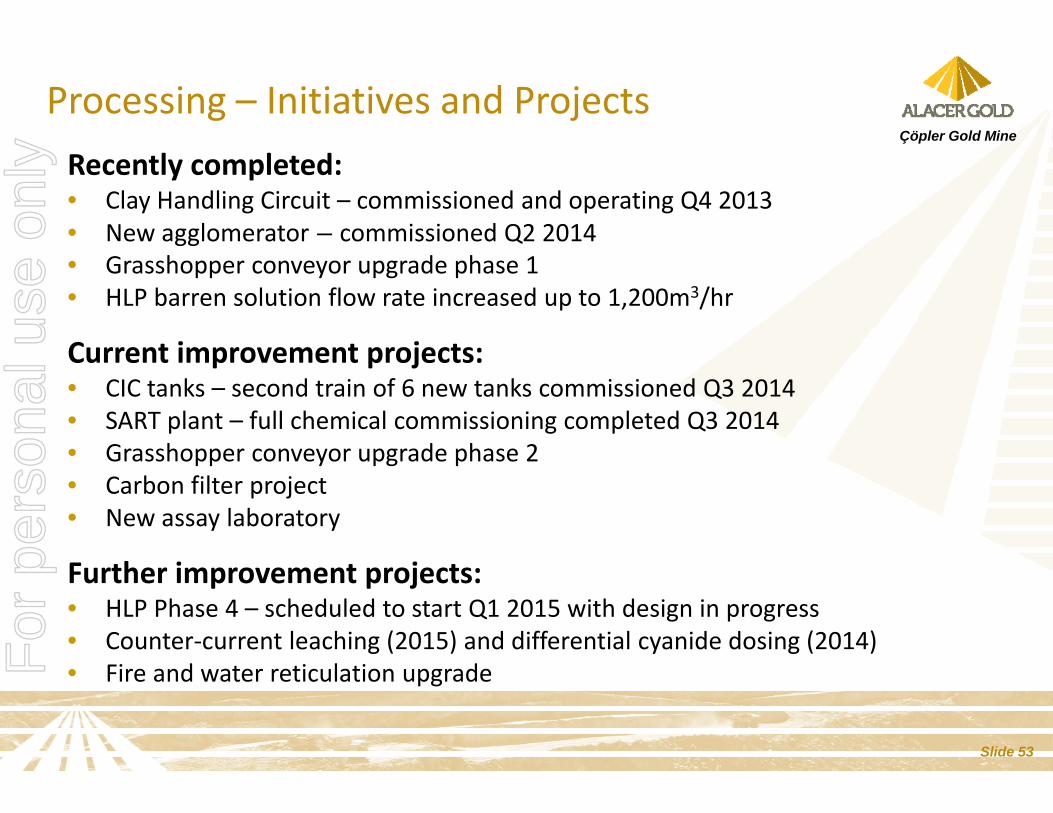
Recently completed:• Clay Handling Circuit – commissioned and operating Q4 2013• New agglomerator – commissioned Q2 2014• Grasshopper conveyor upgrade phase 1• HLP barren solution flow rate increased up to 1,200m3/hr
Current improvement projects:• CIC tanks – second train of 6 new tanks commissioned Q3 2014• SART plant – full chemical commissioning completed Q3 2014• Grasshopper conveyor upgrade phase 2• Carbon filter project• New assay laboratory
Further improvement projects:• HLP Phase 4 – scheduled to start Q1 2015 with design in progress• Counter‐current leaching (2015) and differential cyanide dosing (2014)• Fire and water reticulation upgradeF
or p
erso
nal u
se o
nly

Çöpler Gold MineProjects
Slide 54
For
per
sona
l use
onl
y

$6M spent Increases capacity of circuit to handle
ore with high clay content Construction and commissioning
completed during Q2 2014 Transferred to operations end Q2 2014
$4M spent Provides ability to contain potential
high rain or snow fall events, due to larger heap leach pads
Construction completed in July 2014 and transferred to operations
$31M spent Produces a saleable copper product
and cyanide is recycled to gold recovery process
Completed dry commissioning during Q4 2013 with wet commissioning and operation planned in Q3 2014 when copper threshold is met
Clay‐Handling Circuit
SART Plant
Agglomerator Upgrade
Over $60 million invested in optimization and process improvement projects
Explosives Magazine
HL Pad Phase 3 Expansion $13M spent Designed to improve processing of ore
with high clay content Work completed in October 2013 and
commissioned for immediate operation in November 2013
$7M spent Increased total leach pad capacity to
42 Mt of ore Overliner completed in 2013 and
stacking commenced in Q4 2013 Phase 4 Expansion to commence in
2014 and finish in 2015
$3M spent State‐of‐the‐art underground
explosives storage magazine with a designed life of 50 years
75 tonne explosive storage capacity Transferred to operations in Q1 2014
New Storm Pond
Substantial Capital Invested to Optimize Operations Over Past Three Years Çöpler Gold Mine
Slide 55
For
per
sona
l use
onl
y

SART PlantÇöpler Gold Mine
SART Plant ‐ Process Design Criteria
Design Throughput 380 m3/hour (PLS or BLS)
Plant Availability 92%
Feed Solution Copper 383 mg/L (average)
Copper Recovery 93.7% (average)
Discharge Solution Copper 24 mg/L (average)
Copper Production 3.3 tpd Cu (average)
Precipitate Production 4.8 tpd dry (average)
Gypsum Production 22.4 tpd dry (average)
Slide 56
Full Chemical commissioning of SART Plant completed in August 2014 as copper‐in‐solution levels increased towards 250 ppm Cu thresholdF
or p
erso
nal u
se o
nly

New CIC Circuit – Overview and Design CriteriaÇöpler Gold Mine
Slide 57
New CIC Circuit Design CriteriaDesigned Capacity 582m³/hour
Maximum Capacity 600m³/hour
Capacity Increase with Introduction of New CIC Circuit 400m³/hour
Total CIC Capacity After Upgrade 1000 m³/hourFor
per
sona
l use
onl
y

Çöpler Gold MineCosts and Outlook
Slide 58
For
per
sona
l use
onl
y

Summary – Operating Costs
Slide 59
Çöpler Gold Mine
2011 2012 2013 Q1 2014 Q2 2014
Operating Statistics ‐ 100%:
Waste tonnes mined 11,371,206 18,071,316 20,683,286 5,471,484 6,365,596
Oxide ore mined ‐ tonnes 7,443,854 7,036,221 6,673,520 1,418,391 1,558,392
Oxide ore mined ‐ grade (g/t) 1.54 1.61 1.90 1.50 1.43
Oxide ore mined ‐ ounces 368,319 364,000 407,390 68,336 71,656
Sulfide ore mined ‐ tonnes ‐ 190,024 1,345,882 508,131 329,187
Sulfide ore mined ‐ grade (g/t) ‐ 4.16 4.94 4.98 3.56
Sulfide ore stockpiled ‐ ounces ‐ 25,413 213,592 81,368 37,689
Oxide ore treated ‐ tonnes 7,568,380 7,077,727 6,697,209 1,384,124 1,524,013
Oxide ore treated ‐ head grade (g/t) 1.54 1.65 1.91 1.48 1.46
Ratio between gold produced and contained gold in ore stacked 49% 50% 66% 80% 70%
Gold ounces produced 185,418 188,756 271,063 52,919 49,795
Gold ounces sold 166,777 202,851 273,352 55,128 49,455
Attributable Production: (2011 ‐ 5% ownership, all other periods 80% )
Gold ounces produced 176,147 151,005 216,850 42,335 39,836
Gold ounces sold 158,438 162,281 218,682 44,102 39,564
Cash Operating Costs/ounce sold $ 322 $ 335 $ 414 $ 515 $ 552
Total Cash Costs/ounce sold $ 369 $ 375 $ 429 $ 541 $ 568
All‐in Sustaining Costs/ounce sold, N/A N/A $ 820 $ 680 $ 714
All‐in Costs/ounce sold, N/A N/A $ 864 $ 739 $ 806
Average realized gold price $ 1,644 $ 1,664 $ 1,379 $ 1,302 $ 1,288 For
per
sona
l use
onl
y

Costs will remain near the lowest in the industry
Capex includes $9M of non-recurring sustaining Capex
2014 Guidance
1 Attributable gold ounces and attributable capital expenditures are reduced by the 20% non-controlling interest at Çöpler.2 All-in Costs are non-IFRS financial performance measures with no standardized definition under IFRS and does not include post-43-101 sulfide growth capital.
For further information, see the “Non-IFRS Measures” section of the MD&A for the three month period ended June 30, 2014.
Çöpler Mine 2014 GuidanceWaste tonnes mined (100%) (millions) 25Oxide ore tonnes treated (millions) 6.2Oxide ore grade (g/t gold) 1.6Heap-leach gold ounces produced (100%) (‘000’s) 200,000 to 225,000Heap-leach gold ounces produced (attributable1) (‘000’s) 160,000 to 180,000
Capital expenditure (attributable1) (millions) 17General and Administrative (millions) 15All-in Costs2 ($/oz) 730 to 780
Çöpler Gold Mine
Slide 60
For
per
sona
l use
onl
y
Çöpler Gold MineSulfide Project
Slide 61
For
per
sona
l use
onl
y
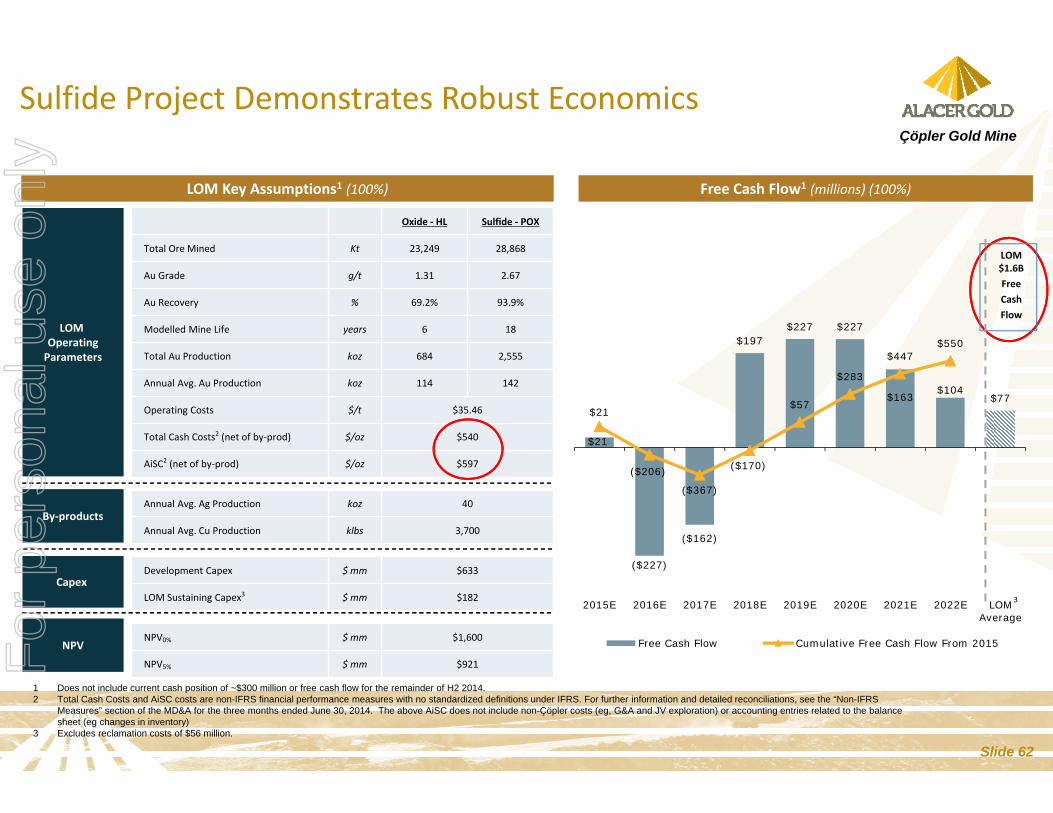
Sulfide Project Demonstrates Robust Economics
Slide 62
Çöpler Gold Mine
Oxide ‐ HL Sulfide ‐ POX
Total Ore Mined Kt 23,249 28,868
Au Grade g/t 1.31 2.67
Au Recovery % 69.2% 93.9%
Modelled Mine Life years 6 18
Total Au Production koz 684 2,555
Annual Avg. Au Production koz 114 142
Operating Costs $/t $35.46
Total Cash Costs2 (net of by‐prod) $/oz $540
AiSC2 (net of by‐prod) $/oz $597
Annual Avg. Ag Production koz 40
Annual Avg. Cu Production klbs 3,700
Development Capex $ mm $633
LOM Sustaining Capex3 $ mm $182
NPV0% $ mm $1,600
NPV5% $ mm $921
LOM OperatingParameters
By‐products
NPV
Capex
LOM Key Assumptions1 (100%) Free Cash Flow1 (millions) (100%)
$21
($227)
($162)
$197 $227 $227
$163 $104
$77 $21
($206)
($367)
($170)
$57
$283
$447 $550
2015E 2016E 2017E 2018E 2019E 2020E 2021E 2022E LOMAverage
Free Cash Flow Cumulative Free Cash Flow From 2015
LOM $1.6BFreeCashFlow
1 Does not include current cash position of ~$300 million or free cash flow for the remainder of H2 2014.2 Total Cash Costs and AiSC costs are non-IFRS financial performance measures with no standardized definitions under IFRS. For further information and detailed reconciliations, see the “Non-IFRS
Measures” section of the MD&A for the three months ended June 30, 2014. The above AiSC does not include non-Çöpler costs (eg, G&A and JV exploration) or accounting entries related to the balance sheet (eg changes in inventory)
3 Excludes reclamation costs of $56 million.
3
For
per
sona
l use
onl
y

Procurement – Equipment: Q1 2015 to Q3 2016
Procurement – Bulk Materials: Q4 2015 to Q3 2017
Sulfide Project Development Timeline
Supplemental Environmental Impact Assessment: application submitted April 2014; approval expected in late 2014 Builds on current Çöpler approved EIA – minimal need for
additional baseline studiesSocio‐Economic Impact Assessment: expected to be finalized in December 2014Land Permit Approvals: expected Q1 2015
Basic & Detailed Engineering: Q3 2014 to Q2 2016 Key items include the tailings storage facility and POX plant
2014 2015 2016 2017 2018
Çöpler Sulfides 43‐101
Permitting
Board Construction Decision
Engineering
Procurement
Construction
Commissioning
Commercial Production
Project Schedule
Build Project Team
Build Project Team: July 2014 to March 2015 Project Director position filled Recruit Owner’s Construction Team Project Operations Manager position filled Continue to build Operations Team through life of project
Sulfide Project Development TimelineÇöpler Gold Mine
Slide 63
For
per
sona
l use
onl
y

Overview of Sulfide Processing Facility Proven technology
Slide 64
Çöpler Gold Mine
• Proven technology used for 38% of global gold production• Autoclave circuit comprised of seven individual pressure vessels• Temperature of 220o C (430o F), Pressure of 2,900 kPag (420 psi)• Sulfur grade averages 4.2%, providing the heat required to maintain the chemical reaction • Achieves near‐complete oxidation of fine‐grained, gold‐bearing sulfides• Overall gold recoveries of 94% from sulfide ore confirmed by pilot plant testingF
or p
erso
nal u
se o
nly

Çöpler Sulfide Process Schematic
Slide 65
Çöpler Gold Mine
Source: Figure17-11 of Çöpler NI 43-101 Technical Report dated July 29, 2014
For
per
sona
l use
onl
y
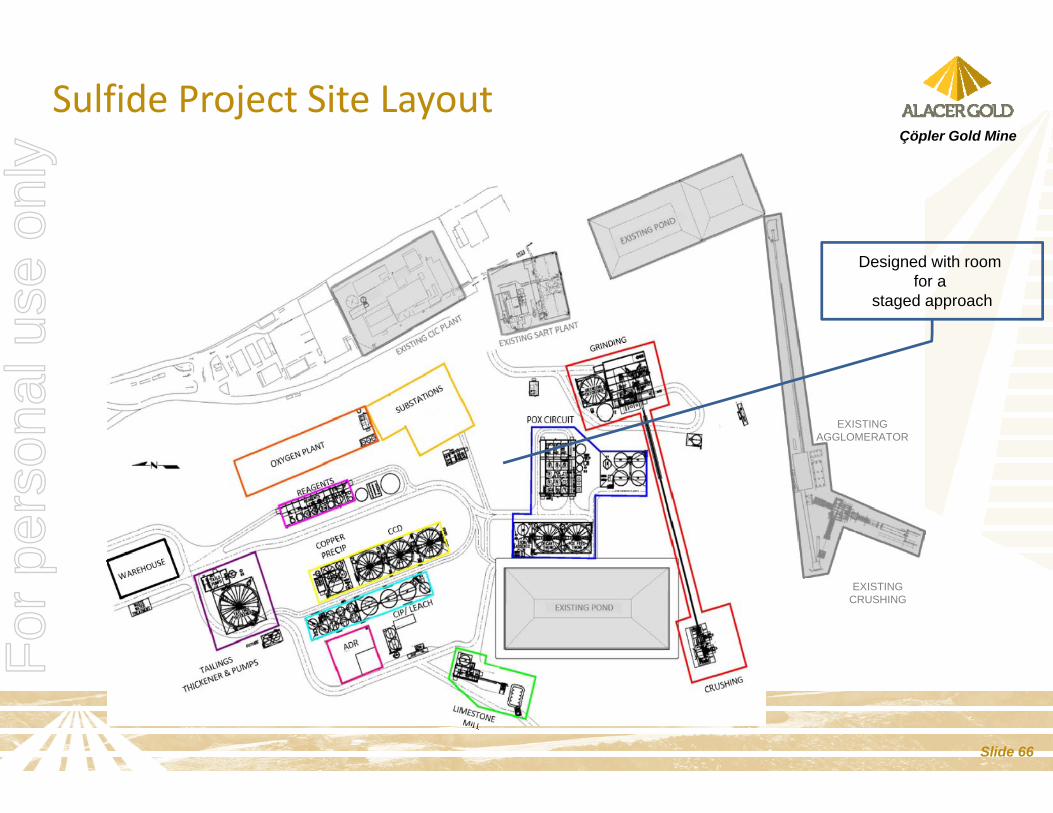
Sulfide Project Site Layout
EXISTING CRUSHING
EXISTING AGGLOMERATOR
Çöpler Gold Mine
Slide 66
Designed with room for a
staged approach
For
per
sona
l use
onl
y

Sulfide Project Capital Cost & Risk Management
Slide 67
Çöpler Gold Mine
• Project Management– Recruitment of the owner’s team– Leverage local knowledge and experience– Set clear and achievable milestones
• Disciplined Cost and Capital Management– Pursue EPC strategy– Explore cost price protection– Funding flexibility– Continue to de‐risk the project
Crushing and Grinding Equipment $70
Autoclaves and Ancillary Equipment $170
Metal Recovery (incl. ADR) $74
Tailings Storage Facility $102
Reagent Handling $21
Facilities and Infrastructure $108
Owner’s Costs & Other $25
Contingency $63
Total Pre-Production Capital $633
LOM Sustaining Capital Costs (oxide + sulfide) $182
Capital Cost Summary1 (millions)
1 43-101 – Çöpler Sulfide Project + Heap Leach.
Initial Capital Costs Funded by Existing Cash and Future Cash Flow Generation from Çöpler
For
per
sona
l use
onl
y

Sulfide Project Capital Schedules
Slide 68
Çöpler Gold Mine
$Millions Total 2014 2015 2016 2017 2018
Plant 571.1 15.1 82.2 236.7 203.5 33.7
Tailing Facility 49.3 0.0 10.4 25.9 13.0 0.0
Social and Permitting 12.3 0.8 1.2 4.5 5.7 0.0
Total Pre‐Production Capital 632.8 15.9 93.8 267.2 222.2 33.7
$ Millions Total '18 '19 '20 '21 '22 '23 '24 '25 '26 '27 '28 '29 '30 '31 '32 '33 '34
TSF Phased Construction 147.7 16.6 16.6 0.7 5.4 25.8 9.2 0.0 0.0 4.4 18.8 11.9 0.0 0.0 11.0 25.4 1.9 0.0
Plant Related 16.1 0.6 0.6 0.6 0.7 0.6 3.5 0.6 0.6 0.7 0.6 3.5 0.6 0.6 0.8 0.6 0.6 0.6
Total Sustaining 163.8 17.2 17.2 1.3 6.1 26.4 12.6 0.6 0.6 5.1 19.4 15.4 0.6 0.6 11.8 26.0 2.4 0.6
Rounding differences will occur.
Pre‐Production Capital Expenditure
Sustaining Capital Expenditure
For
per
sona
l use
onl
y

3.3
6.4 6.45.7
0.9 0.6
3.9
1.8 1.4 1.0 1.2 1.3 1.7 1.3
2014E 2015E 2016E 2017E 2018E 2019E 2020E 2021E 2022E LOMAverage
Oxide Throughput Oxide Grade
H22014
Average annual gold production of >150 koz at Total Cash Costs1 of $540/oz
Tonnes Processed and Grade (100%) Production and Total Cash Costs1 (C2) (100%)
0.0
1.51.8 1.9 1.9 1.9 1.8
5.24.9
4.2 4.23.5 3.0 2.7
2014E 2015E 2016E 2017E 2018E 2019E 2020E 2021E 2022E LOMAverage
Sulfide Throughput Sulfide Grade
H2 2014
1 Total Cash Costs is a non-IFRS financial performance measures with no standardized definition under IFRS. For further information and detailed reconciliation, see the “Non-IFRS Measures” section of the MD&A for the three months ended June 30, 2014.
119
191
150 157
257269
241
203
174
154
$540
2014E 2015E 2016E 2017E 2018E 2019E 2020E 2021E 2022E LOMAverage
Production (koz) C2 Cash Costs (US$/oz)$
Sulfide Project to Deliver Significant GrowthÇöpler Gold Mine
Slide 69
For
per
sona
l use
onl
y

Sulfide Ore Mined by Year
Slide 70
Çöpler Gold Mine
*in 2026 low-grade ore mined will be 37,600 tonnes; mid-grade ore mined will be 12,800 tonnes and high-grade ore mined will be 1,700 tonnes.This table does not include sulfide ore stockpiled prior to 2014. As of December 31, 2013, 1,536,000 tonnes at 4.84 gpt gold grade had been mined to stockpile.Rounding differences will occur;
1 Sulfide tonnes mined are planned to be stockpiled prior to commissioning of the sulfide processing plant in 2017.
Sulfide Ore Total 20141 20151 20161 20171 2018 2019 2020 2021 2022 2023 2024 2025 2026
Low‐Grade (1.4‐2.3 g/t) Mined (Mt) 15.7 0.9 0.9 1.0 0.8 1.3 2.4 1.6 0.8 0.6 1.6 1.4 2.4 0.0*
Low‐Grade Gold Grade (g/t) 1.86 1.82 1.85 1.88 1.84 1.85 1.89 1.88 1.88 1.87 1.85 1.80 1.88 1.89
Low‐Grade Sulfur Grade (%) 4.36 4.37 4.15 3.73 4.36 4.62 4.51 4.38 4.61 4.30 4.42 4.49 4.20 3.72
Mid‐Grade (2.3‐3.1 g/t) Mined (Mt) 7.9 0.6 0.5 0.8 0.3 0.5 1.5 0.5 0.6 0.3 0.7 0.3 1.1 0.0*
Mid‐Grade Gold Grade (g/t) 2.65 2.65 2.65 2.68 2.65 2.66 2.67 2.63 2.65 2.63 2.65 2.60 2.63 2.79
Mid‐Grade Sulfur Grade (%) 4.50 4.46 4.59 3.90 4.73 4.55 4.73 4.62 4.65 4.86 4.53 4.58 4.22 3.54
High‐Grade (>3.1 g/t) Mined (Mt) 6.5 0.6 0.4 0.6 0.3 0.3 1.7 0.6 0.4 0.3 0.5 0.1 0.7 0.0*
High‐Grade Gold Grade (g/t) 4.15 4.44 3.89 3.91 4.47 3.68 4.23 4.70 3.90 4.31 4.16 3.91 3.81 3.27
High‐Grade Sulfur Grade (%) 4.93 4.95 4.52 4.16 5.35 4.64 5.30 5.38 5.09 4.61 4.62 4.75 4.78 3.25
Total Sulfide Ore Mined (Mt) 30.1 2.1 1.7 2.4 1.4 2.2 5.7 2.9 1.8 1.2 2.8 1.8 4.2 0.0*
Average Gold Grade (All) (g/t) 2.56 2.76 2.54 2.65 2.62 2.34 2.81 2.63 2.57 2.68 2.45 2.09 2.40 2.15
Average Sulfur Grade (%) 4.52 4.55 4.35 3.89 4.67 4.61 4.81 4.64 4.72 4.52 4.48 4.52 4.30 3.66
For
per
sona
l use
onl
y
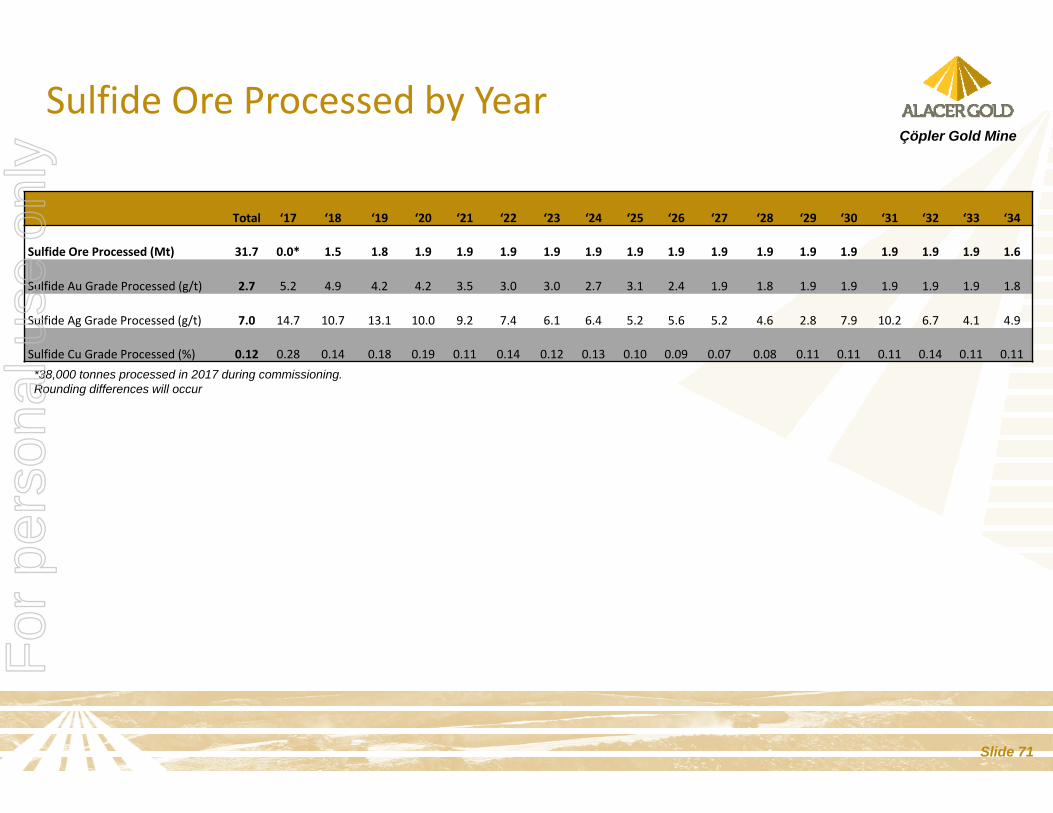
Sulfide Ore Processed by Year
Slide 71
Çöpler Gold Mine
*38,000 tonnes processed in 2017 during commissioning.Rounding differences will occur
Total ‘17 ‘18 ‘19 ‘20 ‘21 ‘22 ‘23 ‘24 ‘25 ‘26 ‘27 ‘28 ‘29 ‘30 ‘31 ‘32 ‘33 ‘34
Sulfide Ore Processed (Mt) 31.7 0.0* 1.5 1.8 1.9 1.9 1.9 1.9 1.9 1.9 1.9 1.9 1.9 1.9 1.9 1.9 1.9 1.9 1.6
Sulfide Au Grade Processed (g/t) 2.7 5.2 4.9 4.2 4.2 3.5 3.0 3.0 2.7 3.1 2.4 1.9 1.8 1.9 1.9 1.9 1.9 1.9 1.8
Sulfide Ag Grade Processed (g/t) 7.0 14.7 10.7 13.1 10.0 9.2 7.4 6.1 6.4 5.2 5.6 5.2 4.6 2.8 7.9 10.2 6.7 4.1 4.9
Sulfide Cu Grade Processed (%) 0.12 0.28 0.14 0.18 0.19 0.11 0.14 0.12 0.13 0.10 0.09 0.07 0.08 0.11 0.11 0.11 0.14 0.11 0.11
For
per
sona
l use
onl
y

Sulfide Project Operating Costs
Slide 72
Çöpler Gold MineLOM Cash Operating Costs1 Summary
Unit Cost Mining Per tonne mined $1.85Rehandle Per tonne rehandled $1.16Heap Leach Processing Per tonne heap leach
processed$9.79
POX Processing Per tonne POX processed $34.55Site Support and Offsite Per tonne processed $3.54
Cash Operating Costs1 Per ounce $601By‐product Credits Per ounce ($85)Cash Operating Costs1 net of By‐products Per ounce $516Royalties Per ounce $23Total Cash Costs1 Per ounce $540Sustaining Capex Per ounce $58All‐in Sustaining Costs1 Per ounce $597Sulfide Project Pre‐Production Capital Per ounce $195Reclamation Costs Per ounce $17All‐in Costs1 Per ounce $810
LOM Cash Costs Remain In Line With Low Historical Cash Costs Achieved
Source: Table 21-5 of Çöpler NI 43-101 Technical Report dated July 29, 2014.1 Cash Operating Costs, Total Cash Costs, All-in Sustaining Costs and All-in Costs are non-IFRS financial performance measures with no standardized definitions under
IFRS. For further information and detailed reconciliation, see the “Non-IFRS Measures” section of the MD&A for the three months ended June 30, 2014. The above AiSCdoes not include non-Çöpler costs (eg, G&A and JV exploration) or accounting entries related to the balance sheet (eg changes in inventory)
Rounding differences will occur
For
per
sona
l use
onl
y

Total Crushing & Milling$65/oz15%
Total Pressure Oxidation$170/oz
40%
Total CCD/Leach/CIP/Cu Precip/ADR
$115/oz27%
Total CN Detox, Neutralization &
Tailings$34/oz
8%
Total Utilities$44/oz10%
LOM($/t ore
processed) ($/oz)
Mining Contract / Support $7.18 $121.85
Rehandle
Heap Leach $0.06 $0.96
Sulfide Ore $0.61 $10.39
Processing
Heap Leach $4.14 $70.24
POX $19.93 $337.86
Site Support $2.67 $45.34
Offsite $0.86 $14.67
Total $35.46 $601.30
By-Product Credit ($85.11)
Total Net of By-Products $516.19
LOM Cash Costs Summary
Source: Section 21.8 of Çöpler NI 43-101 Technical Report dated July 29, 2014. - Tables 21-4, 21-6 and 21-7.
POX Processing Costs by Component
POX Processing Costs by Area
Labour$53/oz12%
Wear Materials$20/oz
5%
Grinding Media$15/oz
3%
Reagents$178/oz
42%
Repair Supplies$18/oz
4%
G&A Supplies$14/oz
3%
Electric Power$109/oz
26%
Fuel Oil$15/oz
3%
Mobile Equipment Fuel
$7/oz2%
Sulfide Project Operating CostsÇöpler Gold Mine
Slide 73
Forecast reagent usage:Average hydrated lime consumption = 25.4 kg/tonne of ore Average limestone consumption = 5.9 kg/tonne of oreAverage cyanide consumption = 1.25 kg /tonne of oreAssumed cyanide cost = $2.73/kgF
or p
erso
nal u
se o
nly

Base Case Financial Metrics – An Incremental Analysis
Slide 74
Çöpler Gold Mine
Financial Metrics (as of July 1, 2014)
Base Case(Oxide Only)A
DFS Case(Heap Leach +
POX)B
IncrementalB – A
LOM cash flow (millions) $323 $1,600 $1,250NPV at 5% (millions) $299 $921 $622IRR % N/A N/A 20.5Payback from start of sulfide gold production
Years N/A 1.7
• Gold price of $1,300 per ounce based on bank and industry consensus• Copper price of $3.29 per pound• Silver price of $22 per ounce• US$/Turkish Lira exchange rate: 2.2• Electricity ($/kWh): 0.09• Diesel cost: $2.12/litreF
or p
erso
nal u
se o
nly

Reduced Execution Risk
Slide 75
Çöpler Gold Mine
Brownfield project with well understood orebody: Mined Çöpler orebody for over 3 years Stockpiled >2.3 Mt of sulfide ore at 4.62g/t Existing infrastructure
Exhaustive studies and reviews completed: Extensive metallurgical peer reviews 4 pilot plant tests confirming 94% recovery
Strong local base and relationships: 18 years in Turkey successfully exploring, permitting, constructing and
operating Long-standing local JV partner Permitting process already underway – Supplemental EIA submission
process commenced in April 2014For
per
sona
l use
onl
y

September 2014
Thank you for your interest
Çöpler Gold Mine
Slide 76
For
per
sona
l use
onl
y