polar lows as arctic hurricanes
TRANSCRIPT
Tel/us (1989), 41A, 1-17
Polar lows as arctic hurricanes
By KERRY A. EMANUEL, Center for Meteorology and Physical Oceanography, MassachusettsInstitute of Technology, Cambridge, MA 02139, USA and RICHARD ROTUNNO, National Center for
Atmospheric Research, Boulder, CO 80307-3000, USA
(Manuscript received 12 October 1987; in final form 10 March 1988)
ABSTRACT
Satellite observations of the polar oceans have revealed the presence of small, intense vorticesthat often resemble hurricanes, having clear central eyes surrounded by deep convectiveclouds. Recent aircraft and dropsonde data also show that these storms, like hurricanes, occurwithin deep moist adiabatic atmospheres and possess warm cores. We propose that at leastsome polar lows are indeed arctic hurricanes. Using a recently developed theoretical model ofthe mature hurricane, we show that the observed difference between the moist entropy of thetroposphere and that representing saturation at sea surface temperature can sustainmoderately intense hurricanes. Unlike the environments of tropical hurricanes, much of thismoist entropy difference results from an air-sea temperature difference. Numerical exper-iments using an axisymmetric nonhydrostatic model confirm that intense hurricanes candevelop in environments typical of those in which polar lows are observed to develop. Due tothe relatively large values of the Coriolis parameter, these storms have smaller diameters thando hurricanes. The experiments also show that the deep, cold cut-off lows which createfavorable thermodynamic environments for polar lows also inhibit their development becauseof the large intertial stability of their circulations. Finally, we show that, like hurricanes,surface flux-driven polar lows cannot arise spontaneously, but require an independent andpresumably non-axisymmetric dynamical mechanism for their initiation.
1. Introduction sors (Businger, 1985). Many polar lows appear todevelop near, if not at, the location of the centerof deep, cut-off cyclones (Rasmussen, 1985;
Bergeron (1954) was perhaps the first to re- Businger, 1985), while other small-scale vorticesmark on the special properties of cyclogenesis appear to form in polar air within strong zonalover relatively warm water in winter. Noting that flow aloft (Reed, 1979). While it is agreed that all.certain occluded cyclones were rejuvenated while such cyclones form within convectively activepassing over the North Sea and Baltic, he coined polar air, the variety of baroclinic environmentsthe term "ex~ra1ropical hurricane" to describe in which the storms originate has led to athese oceanic cyclones. Bergeron's early intuition proliferation of both terminology to describeis well served by recent satellite observations them and theories for their case. Some, such as(e.g., see Rasmussen, 1985) that reveal small, Reed (1979) and Harrold and Browning (1969)intense vortices with clear eyes surrounded by have argued that baroclinic instability is thedeep cumulonimbi, and by research aircraft ob- principle mechanism, with the reduced staticservations (Shapiro et al., 1987) which show that stability of the low-level atmosphere responsiblelike their tropical cousins, polar lows have warm, for both the small scales and rapid time evolutionhigh e. cores. of the cyclones (Staley and Gall, 1977). Others,
On the other hand, storms of this kind nearly such .as Rasmussen (1979, 1985), proposed thatalways form in hig!1ly baroclinic environments polar lows are the result of conditional instabilityand, unlike in the case of tropical cyclones, are of the second kind (CISK), perhaps acting inpreceded by powerful upper tropospheric precur- conjunction with baroclinic processes.
Tenus 41A (1989), 1

2 K. A. EMANUEL AND R. ROTUNNO
The importance of both baroclinic processes It seems likely that the convection observed inand surface fluxes has been highlighted in recent the environment of polar lows similarly serves tonumerical simulations of polar lows. Sardie and maintain a nearly moist adiabatic lapse rate, withWarner (1985) used the NCAR/PSU mesoscale no substantial stored convective available poten-model to simulate observed polar lows over both tial energy. Soundings near polar lows confirmthe Atlantic and Pacific Oceans. They concluded this supposition (Shapiro et al., 1987). At thethat (moist) baroclinic processes were operative same time, the saturation moist entropy of the seain each case and dominated the development of surface may be considerably higher than that ofthe Pacific cyclone, while surface heat fluxes the atmosphere, as in the tropics, though in thewere essential in producing a disturbance of the case of the polar low environment much of this isobserved amplitude in the Atlantic case. Grenas due to an actual sea-air temperature difference.et al. (1987) used the operational numerical These observations lead us to ask whetherweather prediction model of the Norwegian hurricanes might be possible over the polarMeteorological Institute to simulate several oceans in winter. In the following section, weobserved cases of polar lows near Scandinavia. extend the steady-state theory of Emanuel (1986)In those cases in which sensitivity studies to account for sensible as well as latent heat inputwere carried out, the absence of surface fluxes from the sea and calculate the minimum sustain-led to somewhat weaker cyclones, though usually able central pressure of polar lows resultingsome disturbance developed, presumably through purely from air-sea interaction. We use a polar(moist) baroclinic instability. low proximity sounding to estimate the central
There is evidently more than one mechanism pressure of an observed low and compare thisoperating to produce the spectrum of phenomena estimate with observations in Section 3. Incalled polar lows, although one mechanism may Section 4 we present the results of numericaldominate the other in a particular circumstance. experiments using the nonhydrostatic axisym-One of these mechanisms is certainly baroclinic metric model of Rotunno and Emanuel (1987). Ainstability while the other(s) involve CISK or air- discussion of these results and inferences regard-sea interaction. The authors have recently argued ing the role of other processes such as baroclinicagainst CISK as a mechanism for tropical instability are presented in Section 5.cyclogenesis (Emanuel, 1986; Rotunno andEmanuel, 1987). In the first place, when viewedin the proper thermodynamic framework, thetropical atmosphere is very nearly neutral to deepmoist convection (Betts, 1982), presumably being 2. The maximum sustainable pressure dropmaintained in the convectively adjusted state by due to sea-air heat fluxconvection itself. The reservoir of availablepotential energy assumed by Charney and The gradient of pressure between the core andEliassen (1964) and Ooyama (1964) in their exterior of a cyclone represents a reservoir oforiginal concept of CISK apparently does not potential energy. Bernoulli's equation may beexist in the tropical atmosphere. Secondly, used to show that in a steady circulation, the totaltropical cyclones can be maintained in intense pressure drop balances frictional dissipation insteady states without ambient conditional insta- the boundary layer. Following a streamline nearbility (Emanuel, 1986) and can intensify under the sea surface from the outermost closed isobarthe same conditions, provided a starting disturb- of a circulation into the storm center, Bernoulli'sance of sufficient amplitude exists (Rotunno and equation may be writtenEmanuel, 1987). The finite-amplitude nature of 10[ ( 1 ) ]the tropical cyclone viewed as an air-sea inter- d 2 V2 + (Xdp + gdz - F.dl = 0, (1)
action instability is in good accord with the '.observation that tropical cyclones always arise where V is the magnitude of the velocity, (X thefrom pre-existing disturbances such as easterly specific volume, p the pressure and F is thewaves; this contrasts with the linear nature of frictional force per unit mass. Since, by defi-CISK. nition, we take V = 0 at the outer radius ro and
Tellus 41A (1989), 1

POLAR LOWS AS ARCTIC HURRICANES 3
since V also vanishes at r = 0 the above reduces - - - - - - - - - - - - . - - - - -:: , 01
to - - - - - - --:, Jf o f o t ..' . o'
(Xdp = F.d/. (2) I (
" "
The validity of the above does not depend onany assumption to the effect that boundary layerair actually penetrates all the way into the center.For example, the air may actually flow outwardfrom the center to the eyewall and there meet up cwith inflowing air. Since pressure and velocity " ,-
must be continuous at the radius where the two Fig. 1. The integral path for the Camot cycle. Points 0streams meet, (I) and (2) are still valid. and 0' are taken to lie at very large radius.
Emanuel (1986) showed how Carnot's theoremcan be used to find the boundary layer frictionaldissipation in (2). This was done by assumingthat the mechanical energy generated by theCarnot cycle is used in the steady state to balance moist entropy, flows out to large radius, anddissipation in the boundary layer and at large descends while losing entropy through radiationradii in the outflow, where an exchange of to space. To close the cycle, the parcel eventuallyangular momentum must take place to allow the returns to the surface with its original moistoutflow to match the environment. This treat- entropy. While the last leg of the cycle is some-ment has been extended by Emanuel (1988) to what artificial, it is not necessary to view theaccount for fully reversible thermodynamics. The parcel as actually following a closed cycle, sinceestimate of central pressure thus obtained Bernoulli's equation is also valid when integrateddepends only on the assumptions of steadiness along a vortex line, which in this case corre-and small dissipation except in the aforemen- sponds to an angular momentum surface.tioned regions. (An assumption of axisymmetry is The Carnot theorem can be easily derived fromnecessary only to estimate work done by the (I) and the first law of thermodynamics. If (I) isoutflow, which was shown by Emanuel (1986) to integrated around the whole circuit in Fig. I, theusually be small compared to boundary layer result isdissipation.) Here we wish to further generalize,{ ,{the development by accounting for sensible as j (Xdp = j F.d/. (3)
well as latent heat flux from the sea surface. It ispossible to formulate an exact expression for Neglecting effects of water substance on heatminimum sustainable pressure following along capacity and density, the first law of thermo-the lines of Emanuel (1988), but for the sake of dynamics may be written (see the Appendix):br~vi~y w~ pre~ent a simplified treatment here. In Tds = C dT+ L dw - (Xd , (4)thIs sImplIficatIon, we neglect the effects of water pd v P
substance on density and the work done against where s is the moist entropy for saturated orfriction in the outflow. The former should be a unsaturated air, Cpd the heat capacity of dry air atgood approximation at the low temperatures in constant pressure, Lv the heat of vaporization (orwhich polar lows form, while the latter is valid in sublimation, if the phase change is betweenproportion to the smallness of the storm diameter vapor and ice) and w is the vapor mixing ratio.(Emanuel, 1986). These two approximations have Eliminating f(Xdp between (4) and (3) givesopposing effects on the central pressure estimate.,{ ,{
Consider a cross-section through a hypotheti- j T ds = - j F. d/, (5)
cally steady polar low as shown in Fig. I. Followa parcel inward along the sea surface from which which is Carnot's statement that the total heatit extracts sensible and latent heat. The parcel input must balance frictional dissipation in athen rises through the system, conserving its steady heat engine.
Tellus 41A (1989), I

4 K. A. EMANUEL AND R. ROTUNNO
Under the simplifying assumption that all dis- (11) into (10), with these approximations, wesipation occurs in the boundary layer, (5) reduces obtainto ( T. Lv(w. - w.) Pc
),( Ic Tout Cpdln-+-Rdln-j Tds = - F.dl. (6) T. Tc P.. = Cpd(Tc - T.) + Lv(wc - w.). (12)
Since moist entropy is gained from the surface For convenience, we define a thermodynamicand lost between points (0) and (a) in Fig. 1, (6) efficiency, e:can be written T - Te = c out
( 13 )I c I c T '
Tds- T (s -s ) = - F.dl (7) .out c . ,. . and we assume that the temperature difference. . T - T is small enough thatwhere Tout IS an entropy-weighted mean outflow . .
temperature: Tc T. - T.In-~ .
1 I. T. TcT =- Tds. (8) . .out sc - s. c UsIng these and w ~ (Rd/Rv)e/p (where e IS the
vapor pressure), (12) can be writtenIf we now use (2) to eliminate the frictionaldissipation in (7), the result is In x = - ~ - B, (14)
xIc T ds - T ou,(sc - s.) = - Ic cx dp. (9) where. .
Finally, we once again use (4) to eliminate J~ cx dp x =~,from (9), arriving at P.
Tou'(sc - s.) = Cpd(Tc - T.) + (Lv w)c - (Lv w)., (10) A = 2 [~ ~ ],P. l-e RvTc
where the subscripts c and a denote evaluation atthe lo~ center and in the ambient environment, B=~ [ ~~ ] -~ [ ~~ ] .respectively. T 1 - e R P I - e R T. d. v.
As derived in the Appendix, an expressionfor moist entropy valid for both saturated and The term A/x in (14) reflects the pressureunsaturated air is: dependence of the water vapor mixing ratio while
L the first term in B above represents part of thes = (C + C Q) In T + ~ sensible heat input from the ocean. The sum of
pd' T A/x and the last term in B is the latent heat input.
- R 1 - R 1 RH (11) The expression (14) yields the central pressured n Pd w v n , of a cyclone maintained entirely by surface heat
where C, is the heat capacity of liquid water, Q is fluxes, given the central surface air temperaturethe total water content, Pd the partial pressure of and relative humidity as well as those quan-dry air, Rv the gas constant for water vapor and tities evaluated in the ambient environment, andRH is the relative humidity. Consistent with our the entropy-weighted mean outflow temperatureprevious neglect of the effects of water substance as defined by (8). While (14) is implicit for theon density and heat capacity, we neglect C,and ratio Pc/P.(=x), it is easily solved iteratively.the difference between Pd and pin (11) as well as (Emanuel, 1988, showed that (14) has no sol-the temperature dependence of Lv in (10) and utions under certain conditions, but this will not(11). Consistency also requires us to neglect the be a problem in the present investigation.) Thevariability of temperature in the denominator of maximum sustainable pressure drop is obtainedthe term Lv wiT and the last term on the right- by setting Tc equal to the sea surface temperaturehand side of (11) (see the Appendix). Substituting and RHc = 1.
Tellus 41A (1989), 1

POLAR LOWS AS ARCTIC HURRICANES 5
3. Comparison with observations of a polar cyclone apparently formed 24-36 hours precedinglow this time somewhere just southwest of Bear
Island (the station reporting a temperature ofA beautiful example of a polar low that -8°C and dewpoint of -9°C). Satellite imagery
occurred in the Barents Sea north of Norway has presented by Rasmussen (1985) shows that thebeen described by Rasmussen (1985). This case is clear central eye had become less well defined byparticularly suited to comparison with theory this time, but the central pressure was wellsince its environment was sampled by rawin- known due to the proximity of a ship. The polarsonde observations within 200 km of the low low formed in a region of generally low surfacecenter and since ship observations were made pressure associated with the cyclones at thevery close to the low center. The cyclone was eastern edge of the map. The ship near the polartypical of polar lows near Scandinavia, with a low center is reporting a south wind of 20 m S-I, aclear eye surrounded by deep convective clouds. pressure of 980.2 mb and snow showers. ItsLike many polar lows, this one formed near the temperature (DOC) and dewpoint (- I°C) arecenter of a deep cut-off cyclone aloft. significantly higher than those of surrounding
The surface analysis at 0000 GMT on 14 stations. If we assume that the wind field is inDecember 1982 is reproduced in Fig. 2. The solid body rotation between the location of the
985
'
Fig. 2. Surface analysis for 00 GMT 14 December 1982, from Rasmussen (1985). Bear Island is near 75°N, 19°Ereporting a temperature of -8°C.
Tellus 41A (1989), 1

6 K, A. EMANUEL AND R. ROTUNNO
ship and the storm center, then cyclostrophicbalance gives a central pressure of 975-980 mb(independent of the distance between the stormcenter and the ship). ,
The Carnot cycle theorem developed in the ("previous section gives the pressure change "'"
between the storm center and the outermost ,;"closed isobar, where the air is considered to begin! ,If> "'"its inward movement toward the center, Because! ""the polar low in this case formed in a region of ~ ""
substantial ambient pressure gradient, an unam- ~ ,tf' "',biguous estimate of the outer pressure is not '--,possible, Based on the analysis shown in Fig, 2 '--"and on surface analyses over the preceding 24 ",
hours, we take the outer pressure to be 993 mb,The Bear Island sounding taken 12 hours ,,0before the analysis time of Fig. 2 is reproduced '
in Fig, 3, At this time, satellite imagery (seeRasmussen, 1985) shows a clear central eye about75 km in diameter located roughly halfway -between Bear Island and the northern Norwegian TEMPERATURE (.CI
coast, The Bear Island sounding was taken just Fig, 3, Bear Island sounding at 12 GMT 13 Decemberinside the northern limit of the cloud shield 1982, (See Fig, 2 for location of Bear Island.) Solid linesassociated with the polar low. show temperature sounding; dotted lines are dew point
The sounding in Fig, 3 exhibits a nearly moist temperature, The modifications HD and WM discussedd . b ' in the text are shown by dashed lines (temperature) and
a la atlc temperature lapse rate between 830 mb d tt d I' (d . t) CD ' ' d t 'I t h I, 0 e Illes ew porn, IS I en Ica 0 t e actua
an~ the ~ropo~aus~ at 410 mb, perhaps refle~tln~ sounding, The quantities used at the lowest grid pointsmoIst adIabatic adjustment by deep cumulommbl of the numerical model are shown by x 's,a short distance south over the open ocean, Anearly isothermal layer extends from the surfaceto 830 mb, reflecting arctic air that has travelledsouthward over ice. Bear Island is located at the While surface heating can lead to rapid modifi-southern extremity of the sea ice at this time. cation of the sounding below this level, once an
Two obvious difficulties in using this or any adiabatic lapse rate is established from 830 mbother sounding as a reflection of the polar low downward, further surface heating will lead toenvironment are that the sounding is apt to be turbulent fluxes over a much deeper layer (essen-changing in time, even away from the cyclone, tially the whole troposphere) with a correspond-and the environment varies spatially as one ingly much slower change in temperature andmoves around the perimeter of the disturbance, moisture, Inspection of Figs. 2 and 3 reveals thatIn this particular case, the polar low occurred the only surface air that is capable of risingnear (but not necessarily at) the center of a deep buoyantly above 830 mb is air very close to thecut-off low aloft so that the temperature does not polar low center, We therefore feel confident invary much in the horizontal above about 800 mb, assuming that the Bear Island sounding (Fig. 3)But, as is clear in Fig. 2, a large north-south accurately reflects the polar low environmenttemperature gradient exists near the surface in above 830 mb.association with the ice edge, Our strategy for dealing with the environment
The structure of the Bear Island sounding does below 830 mb is simply to perform three separatesuggest, on the other hand, that most of the calculations based on three assumptions abouttemporal and spatial variability of the atmos- the environment at low levels. These arepheric thermodynamic structure in the environ- described as follows.ment of the polar low will occur below 830 mb. (I) Cold and Dry ("CD"). This assumes that
Tellus 41A (1989), I

POLAR LOWS AS ARCTIC HURRICANES 7
the low-level environment is that of the Bear while the largest will obtain from HD. On theIsland soundings shown in Fig. 3. Since this is other hand, the greatest difference betweenprobably the coldest air at that distance from the ambient and central temperature and vaporlow center, this represents an extreme estimate on pressure will occur in sounding CD, These effectsthe cold side. tend to cancel each other in the calculation of
(2) Warm, Moist ("WM"). Here we assume central pressure using (14).that the surface air has the temperature and Estimates of the central pressure made fromdewpoint (-8°C, -9°C) of Bear Island at the the three soundings are listed in Table I, assum-analysis time of Fig, 2, and that the sounding is ing an ambient pressure of 993 mb. The estimatesadiabatic from the surface upward to the point at made using sounding WM and HD are very closewhich the relevant moist adiabat intersects the 12 to the observed central pressure of about 978 mb,GMT Bear Island sounding, This represents our although the estimate from sounding CD is not"best estimate" of the low-level environment at far off, It is evident that the difference in0000 GMT 14 December. soundings at low levels has a noticeable, but not
(3) Hot, Dry ("HD"). Here we take the lower large, effect on the storm's intensity. The goodatmosphere to be dry adiabatic from the 830 mb agreement between the estimates of central press-level (Fig, 3) down to the surface, with a lifting ure made using (14) and observations suggests,condensation level of 830 mb. This represents but does not entirely prove that surface sensiblean extreme estimate on the warm side. These and latent heat fluxes were instrumental in themodifications are shown in Fig. 3. development of this polar low. It could be argued
Each of these soundings yields the environ- that the high temperature and water vapormental estimates needed to calculate central content near the low center were the result ofpressure using (14). The central temperature and horizontal advection, as in a purely baroclinicvapor pressure are taken from the 0000 GMT disturbance, but inspection of Fig. 2 and previousAMI ship observation near the low center (Fig. 2) surface analyses (Rasmussen, 1985) shows that nowhich recorded a temperature of O°C and air with similar values of (Je could be found in thedewpoint of -1°C, (A continuous time series of environment (though a tongue of high (Je air maytemperature from ship AMI actually shows that have slipped between the surface observations),the temperature increased to nearly 1°C as the The last entry in Table I shows the centralcyclone passed the ship (see Rasmussen, 1985) pressure that would have resulted if the air nearbut the dewpoint fell to -2°C indicating almostno change in (Je')
Calculation of the thermodynamic efficiency, ,e, requires knowledge of the mean outflow tem- Table 1. Estlm~tes of central pres~urefrom eq. (14)perature defined by (8). This is estimated, as in for three environmental soundings (see text);Emanuel (1986), by assuming that air flows out of assumed ambient pressure is 993 mb
the low at its level of neutral buoyancy with T e T e Prespect to the environment. To calculate Tout Sounding (oq (~b) (oq (:nb) f: (~b)defined by (8), we begin by lifting ambient surfaceair to its level of neutral buoyancy (which may be CD 0 5,68 -12 2,45 0,0788 974at the surface) and finding the temperature at WM 0 5,68 -8 3,10 0,0912 978that level. Then the (Je of the surface air is HD 0 5,68 0 3,10 0,2123 979increased by a small increment (we choose 2°C) WM" '7' 'lo.oi ' -':'8' 3.10 '0.i81 '922
and the new temperature at the new neutral 918-buoyancy level is found. This procedure is re-peated until we achieve the observed (Je of the air Tc = central surface air temperature,at the low center. The resulting temperatures are T. = ambient surface air temperature.then averaged to find T and thus e as defined ec = central surface vapor pressure,
out' b' t'b (13) e. = am lent surtace vapor pressure.y . ",' Calculated using latent heat of sublimation. ValuesClearly, the smallest estimate of e will occur In of Pc estimated above are the same to within 1 mb when
sounding CD due to the small value of surface (Je' heat of sublimation is used,
Tenus 41A (1989), 1

8 K. A. EMANUEL AND R. ROTUNNO
the polar low center had warmed up to and system with uniform grid spacing in the radialbecome saturated at the observed sea surface and vertical directions. The model equationstemperature of about 7°C. This represents the consist of conservation laws for momentum,minimum sustainable pressure permitted by the mass, heat, water vapor and liquid water. TheCamot cycle mechanism. Its value of 922 mb is microphysical scheme differs from that used insimilar to minimum sustainable pressure esti- hurricane simulations in that all condensed watermates of tropical hurricanes. This shows that the is assumed to be in the form of snow. As a result,thermodynamic potential for hurricanes is large we add the latent heat of sublimation and permitin the polar low environment although, to be no evaporation. Condensate in excess of 1 gkg-1sure, the kinematic structure of the ambient is taken to fall at a constant terminal velocity ofenvironment is very different from that observed 1 ms-l. The turbulence scheme employs an eddyin hurricane genesis regions. We will show, in viscosity which depends on the local rate ofSection 3, that this might be an important deformation and Richardson number. Surfacedifference. Since polar lows in this region typi- fluxes are represented by bulk aerodynamic for-cally spend less than 2 days over relatively warm mulae with wind-dependent exchange coef-water it is not surprising that their central press- ficients. A sponge layer placed in the stratosphereures do not approach the minimum value allowed well above the region containing the main circu-by the Camot cycle. lation controls gravity wave reflections there
It is a straightforward matter to calculate the while a wave radiation condition at the outerrelative magnitudes of the sensible and latent boundary minimizes the amplitude of reflectedheat input from the ocean for each of the ambient waves. Radiation is neglected. Moist convectionsoundings listed in Table 1 and using the ship is explicitly, albeit crudely, simulated by theobservations for thermodynamic data near the model. Particular values of the parameters usedlow center. The ratios of sensible to latent heat in the simulations are listed in Table 2.input for soundings CD and WM are 2.6 and 2.2, In estimating the initial thermodynamic en-respectively, showing that the sensible heating is vironment we once again assume that the Beardominant. The ratio for sounding "HD" is 0.3 Island sounding shown in Fig. 3 is representativewith all the sensible heating due to isothermal of the polar low environment above 830 mb andexpansion. For the minimum sustainable pressure perform three separate experiments correspond-calculation, the sensible-to-latent heat ratio is 1.7. ing to the soundings WM, HD and CD. The
The thermodynamic calculations presentedhere demonstrate that sea-air heat fluxes canindeed account for much of the energetics of Table 2. Model parameterspolar lows. In the following section we explorethe dynamics of polar lows resulting from air-sea Parameter Value Descriptioninteraction.
10 200 m mixing lengthIH 2000 m horizontal mixing length
. . . V I ms-1 terminal velocity of frozen4. Numerical simulations water (= 0 if q,< I gkg-l)
TR 00 no radiative dampingIn designing numerical experiments suitable c. 30 ms-1 wave speed for open
for examining the extent to which polar lows can boundary conditiondevelop through air-sea interaction, it is desir- Z,pong, 12.5 km bott~m of "sponge" layer.
. IX 0.013 S-I maxImum value of dampmgable to exclude other physical processes that ma, in "sponge" la ermight lead to cyclogenesis. For this purpose, we Zto 15 km domain top y
employ a tropical cyclone model whose axisym- roo:, 1500 km domain outer radiusmetry precludes the operation of baroclinic or 11Z I km vertical grid sizebarotropic instability. We use the model de- 11r 10 km horizontal grid sizescribed by Rotunno and Emanuel (1987). Briefly, 11t 20 s tim~ s~ep
. . ... f 0.000136 S-I Conolls parameter at 700Nthe model Integrates the nonhydrostatlc pnmltlve I t't dequations expressed in a cylindrical coordinate a I u e
Tellus 41A (1989), 1

POLAR LOWS AS ARCTIC HURRICANES 9
differences between these soundings affect only vma. VI. t Experiments A-Ethe lowest thermodynamic grid points in the 50 (0)
model; these modifications are shown in Fig. 3. 40- -.. 7
4.1. Experiments with noftow aloft :g 30
In the first set of experiments we begin with a ~ 20kinematic environment similar to that associated> ...
with hurricane formation; that is, with no sub- 10
stantial flow aloft. In Subsection 4.2 we will 0examine the effects of an initial cold-core cyclone 50 (b)
in the upper troposphere. 40As a starting vortex we specify an azimuthal ~
~wind field of the form oS 30( x,~( Z ) g 20 " > ~ ~ I - - for z ~ Zt " G ,, Zt ',,'
10 -- " ---'V= V;F.(r) ---~ " ' E -H( )( Z - Z) ---I Zt fi > - -- - orz z 0z H H - Z t' 0 20 40 60 80
t t(15) t (h)
Fig. 4. Maximum azimuthal velocity (vm.,) as a func-where tion of time for experiments A-C (a) and D-G (b).
2r/r max
F.(r)=I+(/ )2'r rma. which shows various fields averaged over the
The temperature field is then determined by period between 80 and 90 h after initialization.integrating the thermal wind equation outward The fields bear a strong resemblance to thosefrom the center where the temperature is speci- characteristic of hurricanes except that the circu-fied as discussed above. The initial circulation lation is shallower and the thermal structurethus consists of a warm core vortex with shows a warm ring near the surface in additionmaximum wind V; occurring at the surface at a to the warm core aloft. The former arises as aradius of rma. and decaying linearly with height to consequence of the strong sensible heat transferzero at z = Zt. The part of the flow above Zt is from the sea surface which is absent in truedesigned so that oV/oz (and thus oe/ox) is hurricanes. As a result of this warm ring struc-continuous across Zt and such that V vanishes at ture, the azimuthal velocity contours slopeZ = H. In practice it results in a weak anti- inwards at low levels near the center. Thecyclonic flow between Zt and H. condensate distribution reveals a ring of deep
In a "control" experiment, hereafter denoted convection surrounding a clear central eye with.. A", we use sounding WM and set V; = 10 ms-1, considerable convective activity extending out to
rma. = 50 km, and Zt = 6.5 km. The time evolution large radii. The ee field (Fig. 5g) bears a strongof the maximum azimuthal wind is shown in resemblance to the ee cross-sections through theFig. 4. After an initial period of adjustment the polar lows that appear in the mesoscale numeri-cyclone intensifies from about 8 ms-1 to hurri- cal simulations described by Gr0nas et al. (1987)cane force during the 24-h period beginning 10 hand Nordeng (1987).after initialization. Also shown in Fig. 4 is the As in our earlier simulations of hurricanes, theevolution of maximum wind for two experiments development of polar lows in our model is sensi-identical to A but using soundings HD and CD tive to the amplitude and geometric size of the(denoted experiments Band C, respectively). As starting vortex. We performed a number of ex-in the steady state theory, there is little difference periments in which the size and amplitude of thein the final intensity of the storms. initial vortex are varied; these are summarized
The structure of the mature stage of the in Table 3 and the evolution of the velocitycyclone of experiment A is highlighted in Fig. 5 maximum with time is shown in Fig. 4b. In
Tellus 4lA (1989), 1

10 K. A. EMANUEL AND R. ROTUNNO
Experiment A Steady-State Fieldsa) v b) p'
12
E~N
0d) r'
12
E~N
0
12
- - - - - - - - , -0.1
I ---, ---- "e
~..
00) 9. h) M
12
E~N
fI0
600 150 300 450 600 750r(km) r(km) .
Fig. 5. The 80-90 h average fields for the nearly steady state reached by the control run (experiment A). AJIstippled regions indicate negative values of the fields. (a) Azimuthal velocity, contour interval 10 ms-l; (b) pressuredeviation from initial state, contour interval 5 mb; (c) radial velocity, contour interval 3 ms-l; (d) temperatureperturbation from initial state, contour interval 3 C; (e) vertical velocity, contour interval 0.2 ms-1; (f) water vapormixing ratio (q,) and snow mixing ratio (qt>. Light shading denotes 1 < q, < 3 gkg-l, dark shading indicates q, > 3gkg-l. Snow contours are 0.1 gkg-1 (dashed) and I gkg-1 (solid); (g) equivalent potential temperature, contourinterval 5°C; (h) angular momentum in dimensionless units such that M Ir = rout,,] = 100, contour interval 2.
TeJIus 41A (1989), I

POLAR LOWS AS ARCTIC HURRICANES 11
Table 3. Initial conditions used in the numerical Exp.rim.n~)Gya' 'o60h
experiments 12
rmo. V; rm VmExperiment (km) (ms-1) (km) (ms-1) Sounding
EA 50 10 0 WM :;;B 50 10 0 HDC 50 10 0 CDD 50 5 0 WME 50 2 0 WM 0
F 100 10 0 WM 12 -, .G 100 5 0 WMH 50 10 500 20 WMI 100 10 500 20 WMJ 50 5 500 20 WM E
:;;r mo. = radius of maximum surface winds.V; = maximum surface winds.r m = radius of maximum winds at tropopause.V m = maximum winds at tropopause. 0
c) uI
experiments 0 and E, the maximum velocity ofthe initial vortex is reduced to 5 and 2 ms-l, Erespectively. The former intensified to an ampli- ~tude similar to that reached by A, whereas thelatter did not amplify significantly. For thisinitial vortex size, the "critical amplitude" liessomewhere between 2 and 5 ms-l. The sensi- r(km) 450
tivity to initial amplitude is restricted to a Fig. 6. The velocity fields at 60 h for experiment G. (a)determination of whether or not there is Azimuthal velocity, contour interval 3 ms-l; (b) verti-amplification; given an initial vortex of sufficient cal velocity, contour interval 0.2 ms-1; (c) radial vel-intensity, there will be amplification to a quasi- ocity, contour interval 2 ms-1. Stippling indicates nega-steady state which is not itself sensitive to the tive values.magnitude of the starting vortex.
Experiments F and G begin with a vortex not have any feedback on the surface fluxes. Thiswhose radius of maximum winds lies at 100 km. can be better understood by examining the re-When the initial amplitude is 10 ms-1 (exper- sponse of the circulation in the r - z plane to aiment F), the cyclone intensifies to almost the specified heat source, using the Boussinesq formmagnitude of the control experiment, whereas of the Sawyer-Eliassen equation in cylindricalexperiment G, beginning with half the amplitude coordinates:?f F, d~s not intensify. to the extent of ~. Closer 1 OM2 1 02'" 0 (1 0"') oQ inspectIon of the velocity fields of expenment G 3- 0 -- 0 2 +N2 _0 -- 0 =-0 ' (16)
. . r rrz rrr rreveals that the surface winds hardly Increase atall; the increase of velocity shown in Fig. 4 occurs where Q is proportional to the heating, N is thein the upper part of the vortex (see Fig. 6). buoyancy frequency (assumed constant), '" is theApparently, the ring of convection develops at a streamfunction in the r - z plane, and M is thelarger radius and, as a consequence, the inward angular momentum per unit mass, defined asbranch of the outflow aloft spins up a vortex M = V + I 2inside the ring of convection at higher levels. The - r Ilr ,
energy available from the Carnot cycle is used up where I is the Coriolis parameter. For simplicity,in amplifying the circulation aloft, which does we examine solutions to the above for the case
Tellus 41A (1989), I

12 K, A, EMANUEL AND R. ROTUNNO
that V is a linear function of , (in which case compared with those outside the heating maxi-(1/,3)fJM2/fJ, is a constant), and Q is a delta mum, Since the spin up of a constant vorticityfunction in , and is sinusoidal in z: vortex is directly proportional to u we infer that
. nz for sufficiently small x most of the velocityQ = Qo 0(', '0) Sin H' (17) changes will be outside the heating maximum. In
h Q ' H ' h d h f h the nonlinear regime the cyclonic velocities willwere 0 IS a constant, IS t e ept 0 t e ,.,
, 1 . d ' h d ' h ' h h always exceed the antIcyclonIc so that a rIng ofclrcu atlon an '0 IS t e ra IUS at w IC t e, ,
, ,', ,. heating at small x will produce strong surfaceheating IS applied. Analytic solutions can be 1 , fl d k t . 1 '
fl 1 £t, .. cyc ornc ow an wea an ICYC ornc ow a 0 ,obtained for this system In terms of Bessel func- " ,
, Of ' 1 ' . h d . ' b ' f thus facIlitating strong feedback through surfacetlons. partlcu ar Interest IS t e Istn utlon 0 . .
d ' 1 1 , h . h h d . , 1 heat fluxes. If x IS too large, however, the radialra la ve oclty u w IC c anges Iscontlnuous y tfl 1 ft ' 11 ' 1 t '
1 t, , ,. ou ow a 0 WI Spin up a re a Ive y s rongacross '0' reaching maximum magnItudes Just on , , , ,, h ' d f Th . R f h d ' 1 1 , cyclone inside the heating maximum aloft and
elt er Sl e 0 '0' e ratio I' 0 t e ra la ve oclty .. ., " d h . .d ' less energy WIll flow Into the surface cyclone withJust InSI e '0 to t at Just OUtSI e '0 IS ,
correspondingly less feedback from surfacep = II(x) Ko(x) (18) fluxes. In the foregoing experiments, the effective
KI(x)Io(x)' Rossby radius, NH/n'1, ~ (0.01 s-I)(6500 m)/where x is the ratio of, to the deformation n(I.36 x 10-4 s-I)~230 km. Since the initialradius: 0 heating is near 'max' we infer that x ~ 0.22 in the
n'1 ~o?~rol run, In ~xpe~iment G, h~wever, x ~ 0.44x = '0 NH' initially and, as IS evident from Fig. 6, expands to
x ~ 1,0, which is a decidedly unfavorable situ-and '1 is the absolute vorticity which is constant ation. We believe that this is the reason thatin this case, In and Kn are modified Bessel func- initial vortices with large radii of maximumtions of order n of the first and second kinds, winds do not amplify. This also might explainrespectively. why polar lows generally have smaller diameters
A graph of p as a function of x is displayed in than hurricanes, since the Coriolis parameter isFig, 7, For x less than about 0.3, the radial larger and thus x will be larger for a given radius.velocities inside the ring of heating are negligible The time-scale of development of disturbances
in the model is sensitive to the magnitude of thesurface exchange coefficients, A reviewer has
"10 .8 VI, x pointed out that the use of Deacon's formula,
which was developed principally for the tropics,may seriously underestimate the fluxes in thehighly unstable boundary layers typical of thepolar low environment. We therefore made anattempt to incorporate more realistic formu-lations of surface fluxes that include the wind-dependence of the surface roughness length and
.8 the bulk stability. A review of the literature onthis subject unfortunately reveals a wide spec-trum of results; there does not even appear to beagreement on whether the surface exchange co-efficients for heat and moisture increase or de-crease with wind speed. We did attempt to usethe formulation of Louis (1979) to calculate thesurface exchange coefficients of heat and mo-
O mentum as a function of the bulk Richardson0 2 4 6 8 I
)( number and surface roughness length, the latterFig, 7, The parameter pas a function of x, See text for of which was estimated using Charnock's relationexplanation. with a coefficient of 0.032. We found, rather
Tellus 41A (1989), 1
POLAR LOWS AS ARCTIC HURRICANES 13
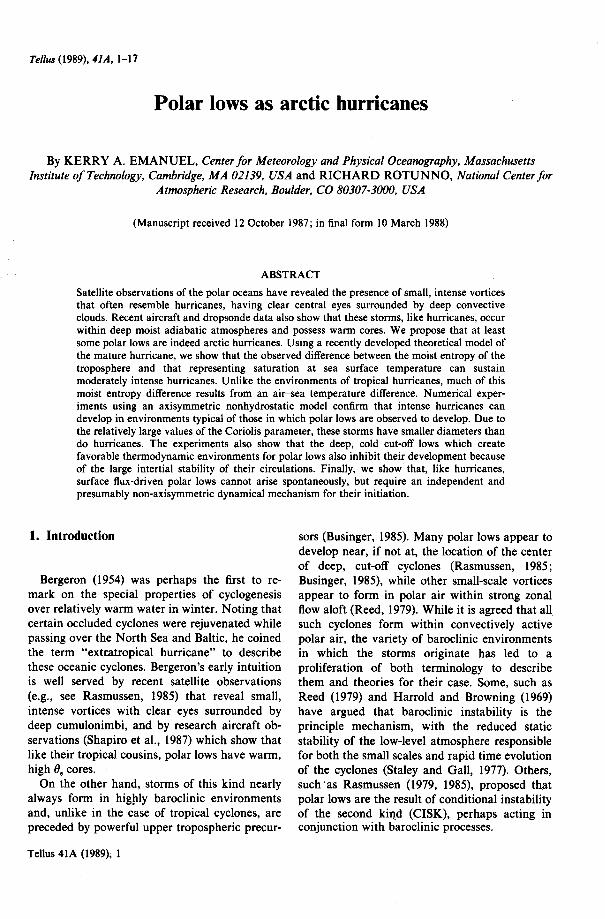
remarkably, that the results were very similar to where Vm is the maximum velocity of the coldthose given by Deacon's formula, At high wind core cyclone andspeeds, the Richardson number is small and the ( / P )wind-dependence of the surface roughness yields f(r) = (Xp r prm ,
results similar to Deacon's formula, At small 1 + (r/pprm)P
wind speeds, the Richardson number is large but wherethe surface roughness is small and again thedependence on wind speed is close to that given (X = Pby Deacon. Moreover, all the coefficients were P-(p-l)I-I/P'reasonably close to those measured by Large and andPond (1982) under unstable conditions.
We are discomfitted by the foregoing. Pp = (p - 1)IIP.
Measurements of surface fluxes under the highly This gives a vortex flow that decays rapidl ithdisequilibrated sea states and thermodynamic radius at large radius but is always in~t:llYstates typically accompanying polar lows are stable, In the experi~ents to be described, wescarce. and we feel that the actual exchange take p = 5. Once again, we specify a velocity fieldcoefficIents may be far larger than current formu- above z = z such that iJv/iJz is continuous acrosslations indicate. To investigate the sensitivity of Zt and V va~ishes at z = H:the model to the exchange coefficients we simplydoubled them. The result is that the model storm V= JI:(!!\ (!!-.=-=-)(1 +~- (!!-.=-=- ))f(r)intensifies about 40% faster than the control run, m ZtJ H - z\ H H - Z\
though it reaches the same intensity, We also ( !!\ ( Z ) ( Z - Z )reran experiment E and found no significant + ~ ~J 1 - H i:::- F.(r)
difference up to 40 h; by 80 h some higher winds Z\ Z\developed as convection broke out over a large for Z > Zt. (20)area of the domain, but no coherent vortex Th t t I . .t ' I I ' t fi Id ' h . F '
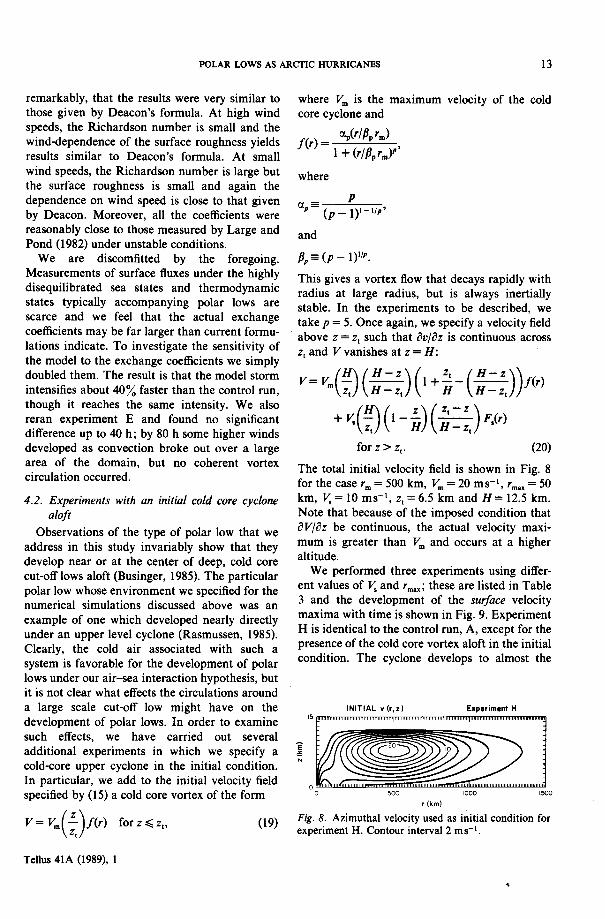
8, . e 0 a Inl la ve OCI y e IS s own In Ig.cIrculatIon occurred. .. th - 500k Tf - 20 -I - 50lor ecaserm- m, "m- ms ,rma.-4.2, Experiments with an initial cold core cyclone km, ~ = 10 ms-l, Zt = 6,5 km and H= 12.5 km.
aloft Note that because of the imposed condition thatObservations of the type of polar low that we iJV/iJz,be continuous, the actual velocity ~axi-
address in this study invariably show that they m~m IS greater than V m and occurs at a hIgherdevelop near or at the center of deep, cold core altitude, ., ,cut-off lows aloft (Businger, 1985), The particular We performed three expenment~ USIn~ dlffer-polar low whose environment we specified for the ent values of ~ and rma.; these are listed In Ta~lenumerical simulations discussed above was an 3 and the development of the surface velocityexample of one which developed nearly directly maxima with time is shown in Fig. 9. Experimentunder an upper level cyclone (Rasmussen, 1985). H is identical to the control run, A, e~cept f~r, t~eClearly, the cold air associated with such a prese.n.ce of the cold core vortex aloft In the InitIalsystem is favorable for the development of polar condItIon. The cyclone develops to almost the
lows under our air-sea interaction hypothesis, butit is not clear what effects the circulations arounda large scale cut-off low might have on the INITIAL v (r,z) Experiment Hdevelopment of polar lows. In order to examine 15
such effects, we have carried out severaladditional experiments in which we specify a! ~~~~ 10
cold-core upper cyclone in the initial condition. N
In particular, we add to the initial velocity field0specified by (15) a cold core vortex of the form 0 500 1000 1500
r (km)
V= JI:( ":' ) f(r) forz ~ Z (19) Fig, 8, Azimuthal velocity used as initial condition form Zt ~ t' experiment H. Contour interval 2 ms-I,
Tellus 41A (1989), 1
..

14 K. A. EMANUEL AND R. ROTUNNO
; 50 ,"; Vma. vi. t" Experimentl H-J tropical atmosphere in regions susceptible tohurricanes. In both cases, fluxes of sensible
40 and/or latent heat from the underlying ocean- surface can lead to substantial warming of a deepi 30 layer of the atmosphere. The particular environ-
i 20 ment of a polar low investigated by Rasmussen> (1985) was shown to be capable of sustaining a
_1 -- b10 - - :--=--:- - ,'--':'-':"--= ':-'; pressure drop of up to 70 m. Moreover,J -- '-'
0 measurements of e. near the low center are0 20 40 60 80 consistent with the observed pressure drop.
t(h) N . 1 . 1 . . h . .umenca Slmu atl0ns WIt an axIsymmetrIc
Fig. 9. Development of maximum azimuthal velocity at h d t t . d 1 h th t . sea.nterac... non y ros a IC mo e s ow a au- I -lowest gnd pOInts for expenments H-J. . d 1 h .
tlon can pro uce cyc ones w ose structure ISconsistent with observations, but whose intensity
same amplitude as A. The fields averaged is somewhat larger. The reasons for the differentbetween 80 and 90 h for experiment H are intensity are not clear, but several points comedisplayed in Fig. 10 and should be compared to to mind. Sea surface temperatures near Norwaythose of A (Fig. 5). The surface cyclone is much (e.g., see Rasmussen (1985» are relatively highmore concentrated in the presence of the cut-off only in a narrow tongue just west of the coast.low aloft and the latter has been destroyed The rapidly moving polar low simply may notbetween about 90 and 170 km from the center. In remain over warm water long enough to achievethis case, the upper cyclone does not appear to its potential intensity. The effect of the disturb-have inhibited development of the polar low. ances on the sea surface temperature is notInspection of Fig. 9 reveals, however, that the known, but the strong winds and cyclonic circu-surface cyclone of experiment I, which is identi- lation may induce enough mixing and upwellingcal to F except for the cut-off low in the initial to have a noticeable influence on the oceancondition, does not develop at all, in contrast temperature, as is observed with many tropicalwith F. Nor did experiment J which can be hurricanes. It is also true that only a few percentcompared to D. Close inspection of the velocity of all hurricanes intensify to the upper boundfields in these cases (not shown) reveals that the given by the Camot theorem, but the reasons forlack of surface development appears to be for the this remain elusive.same reasons we elaborated on in the case of We emphasize that, as in the case of tropicalexperiment G; namely, that much of the energy cyclones, the polar low environment appears toavailable from the Camot cycle flows into the be stable to small amplitude axisymmetricdevelopment of a cyclone aloft, inside the perturbations; disturbances of substantial ampli-convective ring, where it cannot feedback tude are apparently necessary to initiate intensifi-through the surface fluxes. This more readily cation by air-sea interaction. To the extent thatoccurs in the presence of an initial cyclone aloft this is a valid finding, it points to the necessitybecause the deformation radius is smaller and of some presumably non-axisymmetric dynamicalthus x is larger for a given radius (see eq. (18) and process that operates in the early stages ofFig. 7). For this reason, the "critical" initial cyclogenesis. Baroclinic instability is one obviousradius of maximum surface winds is smaller, and candidate since baroclinicity is almost alwaysthe critical velocity at fixed rma. larger when an present to some degree in the pre-cyclone en-upper level vortex is present initially. vironment. It is conceivable that the baroclinic
mechanism operates cooperatively with air-seainteraction; if not, the development of polar lows
5. Discussion might be thought of as a two-stage process. Otherdisturbances, such as topographically generated
We have shown, in Section 3, that there is a cyclones, might also act as starting disturbances.certain thermodynamic similarity between polar The nature of the amplitude conditions forair masses over relatively warm water and the growth by the air-sea interaction mechanism is
Tellus 41A (1989), I

POLAR LOWS AS ARCTIC HURRICANES 15
Experiment H Steady-State Fields01 v '
12 c_,
E~N
0cl u dJ r'
I
E~N
0 I
fl q.. ~12
E~N
0gl9 hI M
12 ~ 290 ~ ~""./---\~ 28V
~,~50 r0 150 300 450 600 750 0 150 300 450 600 750
r (kml r (kmlFig. 10. Same as Fig. 5 but for experiment H.
the subject of on-going investigation by the particular, the large inertial stability associatedauthors. with cut-off lows aloft makes it necessary to start
Experiments with the numerical model show with a surface cyclone of higher amplitude and/orthat the development of axisymmetric polar lows smaller radius of maximum winds; otherwise, theis sensitive to the initial kinematic as well as surface fluxes act to amplify the cyclone aloftthermodynamic state of the atmosphere and to rather than at the surface where it can feedbackthe formulation of the surface fluxes. In on the surface fluxes.
Tellus 41A (1989), 1

16 K. A. EMANUEL AND R. ROTUNNO I,...
6. Acknowledgements The last term of (A2) vanishes since reversiblechanges in w can only occur at RH = 1. The
The contribution of Kerry Emanuel was sup- temperature dependence of Lv is given byported by National Science Foundation Grant dL = (C - C)dTATM-85I387I and the Office of Naval Research v pv (. ,
under contract NOOOI4-87-K-O29I. We should where Cpv is the heat capacity of water vapor atlike to thank Joel Sloman for typing the constant pressure. Also, the Clausius-Clapeyronmanuscript and Isabelle Kole for drafting several equation may be written:of the figures. dT de. (de dRH )L -=R T-=R T ---v T v e. v e RH'
since e. = e/RH. Using these two expressions in
(A2) givesTds = (Cpd + wCpd +tCJdT+ Lvdw
7. Appendix Rd T de
--dpd-wRvT-. (A3)An expression for moist entropy valid in saturated Pd eand unsaturated air Finally, we note that since w = CXd/CXv, where cxd
The following quantity can be shown to be con- and CXv are the spec.ific volumes of dry .air andserved during reversible moist or dry adiabatic water vapor, respectively, (A3) can be written
expansion: Tds = (Cpd + wCpv +tCJdT+ Lvdw - cxddp, (A4)
s=(C +QC)lnT+~ which is a direct statement of the first law ofpd (. T thermodynamics written as entropy changes per
- R lnp - wR In RH (AI) unit mass of dry air. This proves that (AI) is ad d v , uniformly valid expression for entropy of moist
where Cpd and C(. are the heat capacities of dry air.air and liquid water, respectively, Q is the total In the relatively cold environments of polarwate~ content, Lv is the heat of vaporizati~n. (a lows we neglect the effect of water substance onfunction of temperature), w the vapor mixIng heat capacity and on density. If one followsratio, Rd and Rv are the gas constants for dry air through the derivation of (A4), it can be seen thatand .water ~a~or, respectively, and RH is the consistency demands that we neglect the tem-
relat!ve hu~I~lty.. perature dependence of Lv/T in the second termDifferentiation of (AI) Yields on the right of (AI), the last term in (AI), and the
Rd T difference between p and Pd' Thus a consistentTds = (Cpd + QCJdT+ Lvdw- -dpd low temperature approximation to (AI) is
PdL w LvO
+wdL --!.-dT-wR TdlnRH s~CpdlnT+-w-Rdlnp, (A5)v T v To
- Rv Tin RH dw. (A2) where Lvo and To are constants.
REFERENCES
Bergeron, T. 1954. Reviews of tropical hurricanes. Charney, J. G. and Eliassen, A. 1964. On the growthQuart. J. Roy. Met. Soc. 80, 131-164. of the hurricane depression. J. Atmos. Sci. 21, 68-
Betts, A. K. 1982. Saturation point analysis of moist 75.convective overturning. J. Atmos. Sci. 39, 1484-1505. Emanuel, K. A. 1986. An air-sea interaction theory for
Businger, S. 1985. The synoptic climatology of polar tropical cyclones. Part I: Steady-state maintenance.low outbreaks. Te//us 37 A,419-432. J. Atmos. Sci. 43, 585-604.
Tellus 41A (1989), I

POLAR LOWS AS ARCTIC HURRICANES 17
Emanuel, K. A. 1988. The maximum intensity of CISK disturbance. Quart. J. Roy. Met. Soc. 105, 531-hurricanes. J. Atmos. Sci. 45, 1143-1155. 549.
Gr0nas, S., Foss, A. and Lystad, M. 1987. Numerical Rasmussen, E. 1985. A case study of a polar lowsimulations of polar lows in the Norwegian Sea. development over the Barents Sea. Tellus 37 A, 407-Tel/us 39A, 334-353. 418.
Harrold, I. W. and Browning, K. A. 1969. The polar Reed, R. I. 1979. Cyclogenesis in polar airstreams.low as a baroclinic disturbance. Quart. J. Roy. Met. Mon. Weather Rev. 107, 38-52.Soc. 95, 710-723. Rotunno, R. and Emanuel, K. A. 1987. An air-sea
Large, W. G. and Pond, S. 1982. Sensible and latent interaction theory for tropical cyclones. Part II:heat flux measurements over the ocean. J. Phys. Evolutionary study using a nonhydrostatic axisym-Ocean. 12,464-482. metric numerical model. J. Atmos. Sci. 44, 542-561.
Louis, I.-F. 1979. A parametric model of vertical eddy Sardie, I. M. and Warner, T. T. 1985. A numericalfluxes in the atmosphere. Boundary Layer Meteorol. study of the development mechanism of polar lows.17, 187-202. Tel/us 37A, 460--477.
Nordeng, T. E. 1987. The effect of vertical and slant- Shapiro, M. A., Fedor, L. S. and Hampel, T. 1987.wise convection on the simulation of polar lows. Research aircraft measurements of a polar low overTel/us 39A, 354-375. the Norwegian Sea. Tel/us 39A, 272-306.
Ooyama, K. 1964. A dynamical model for the study of Staley, D. O. and Gall, R. L. 1977. On the wavelengthtropical cyclone development. Geofis. Int. 4, 187-198. of maximum baroclinic instability. J. Atmos. Sci. 34,
Rasmussen, E. 1979. The polar low as an extratropical 1679-1688.
Tellus 41A (1989), I