policy and program developments - state.gov · development assistance appear to have resulted in...
TRANSCRIPT

9
POLICY AND PROGRAM DEVELOPMENTS

INCSR 2006 Volume I
10

Policy and Program Development
11
Overview for 2005 Vigorous international drug control efforts kept the drug trade on the defensive in 2005. Our long-standing, international campaign to curb the flow of cocaine and heroin to the United States advanced significantly during the year. Coordinated international enforcement programs limited drug crop expansion, strengthened interdiction efforts, destroyed processing facilities, and weakened major trafficking organizations. Drug seizures set new records for cocaine interdiction in the Western Hemisphere. Better enforcement and judicial reforms led to the arrest of several long-sought drug kingpins, while tougher enforcement of chemical control and money laundering laws in key countries further hobbled the major trafficking organizations’ ability to refine drugs and bank their profits.
The Drug Threat Cocaine, heroin, marijuana, and synthetic amphetamine-type stimulants (ATS) are the drugs that most threaten the United States. Cutting off their supply has been and will continue to be our primary international counternarcotics goal. Although U.S. cocaine consumption has been declining recently, cocaine continues to be our greatest concern. An estimated 300 metric tons or more of cocaine hydrochloride (HCl) enter the country annually, feeding addiction, fueling crime, and damaging the economic and social health of the United States. As all cocaine originates in the Andean countries of Colombia, Peru, and Bolivia, we have channeled a significant portion of our international resources toward eliminating coca cultivation, disrupting cocaine production, and preventing the drug from reaching the United States.
Coca and Cocaine Colombia—the source of roughly 90 percent of the cocaine destined for the U.S. and other world markets—leads the world in coca cultivation. Peru and Bolivia lag behind, a distant second and third respectively. The USG has directed a large share of its counternarcotics resources to attacking Colombian coca cultivation, while helping to thwart a resurgence of coca cultivation in Peru and Bolivia. In 2005, USG-supported Colombian police units reported eliminating over 170,000 hectares of coca. Aerial eradication removed 138,775 hectares of this amount, while manual eradication destroyed the other 31,285 hectares. If harvested and refined, the coca eradicated could have yielded over 150 metric tons of cocaine with a street value of over $15 billion.
Bolivia and Peru, which had drastically reduced their coca cultivation in the past five years, now face campaigns to roll back these achievements. The challenge comes from increasingly active cocalero (coca grower) associations that link coca cultivation to issues of cultural identity and national pride. These farmer’s unions, often exploited by trafficking interests, glorify coca cultivation and consumption as ancient and sacred indigenous traditions that must be protected against international efforts to destroy them. They portray coca reduction programs as a means for a mainly white, urban governing minority to limit the economic advancement of a rural indigenous majority.
Cocalero influence has been greatest in Bolivia, where the Bolivian cocaleros’ founder and leader, Evo Morales, won the country’s presidency in the December 2005 Bolivian Election. Bolivia’s coca cultivation grew by eight percent in 2005 to 25,500 hectares, thanks in part to cocalero activism and the government’s desire to avoid violent confrontation. It was the fourth year in succession that the figure has risen. Between 2001 to 2005, coca cultivation in Bolivia has gradually expanded by 36 percent, from 19,500 to 26,500 hectares. Though this amount is half of Bolivia’s peak cultivation figure of 52,000 hectares in 1989, the trend is disquieting, as it shows no signs of being reversible in the short run.

INCSR 2006 Volume I
12
In Peru, though government programs surpassed their 2005 coca eradication goal, they still may not have kept pace with expanding coca cultivation. Cocaleros in those rural valleys, where in previous years the violent Sendero Luminoso guerrillas held sway, have become more violent and better organized. New terrorist groups claiming an affiliation with Sendero Luminoso have openly identified with coca growers and drug traffickers. They have organized increasingly violent ambushes of police and intimidation of alternative development teams in coca growing areas.
USG estimates of coca cultivation for 2005 were not available at time of publication. The Government of Peru’s Office of Drug Control, however, has accepted as accurate the United Nation’s June 2005 estimate of 50,000 hectares of coca under cultivation in Peru.
Interdiction: Cocaine seizures in the Western hemisphere set new records in 2005. Colombian interdiction programs seized 228 metric tons of cocaine in the course of the year, a record for any country, including the United States. Of this amount, the Colombian National Police secured 94 metric tons, while the remaining 124 metric tons were seized by the Army, Navy, and Air Force. Colombian forces destroyed 104 HCl and 773 base labs.
Other important drug-affected countries in the Hemisphere also reported seizing impressive amounts of cocaine: Bolivia, 10.7 metric tons; Peru, 15.6 metric tons; Venezuela, 54.2 metric tons; Mexico, 21 metric tons. In all, these countries seized approximately 329 metric tons of cocaine, more than the estimated 300 metric tons that enter the United States every year. Its retail value on the streets of the U.S. would have been approximately $33 billion.
Opium and Heroin Opium poppy is the source of heroin. Containing its cultivation presents its own set of challenges. Unlike coca, which currently grows in significant amounts in only three Andean countries, opium poppy is cultivated in nearly every region of the world. In contrast to coca, a perennial which takes at least a year to mature into usable leaf, opium poppy is an easily planted annual crop with as many as three harvests per year. The gum is harvestable in less than six months. It is therefore much harder to eliminate.
Most of the heroin used in the United States comes from poppies grown in Colombia and Mexico, though their opium gum production accounts for less than four percent of the world’s total production. Mexico’s geographical location allows Mexican growers and refiner to supply some 30 to 40 percent of the U.S. heroin market, mostly west of the Mississippi River. Colombia supplies most of the remainder of the states east of the Mississippi. Since eliminating poppy cultivation in Colombia and Mexico is crucial to reducing U.S.-bound heroin flows, we have had long-standing joint eradication programs in both countries.
Colombian law enforcement and alternative development programs eradicated 2,000 hectares of opium poppy in 2005. Of these, 1,624hectares were sprayed and 376 hectares uprooted through voluntary manual eradication programs. The 2005 cultivation and production data were not available at the time of publication.
In Mexico, in the first 11 months of 2005, the Government of Mexico (GOM) reported eradicating slightly over 20,000 hectares of opium poppy, approximately the same annual level of opium eradication that Mexican authorities have reported in previous years. The 2005 cultivation and production data were not available at time of publication.
Burma is the world’s second largest producer of illicit opium after Afghanistan, accounting for most of Southeast Asian heroin. In 2005, Burma produced an estimated 380 metric tons of opium, less than
Policy and Program Development
13
eight percent of the opium produced in Afghanistan. Burma’s opium poppy is grown predominantly in the “Golden Triangle” border region of Shan State—in areas near the borders of China, Laos, and Thailand controlled by former insurgent groups (less than one percent of Burma’s poppy crop is grown outside of Shan State).
The remaining 90-plus percent of the world’s opium gum production occurs in Afghanistan. Afghanistan supplies all but a small amount of the heroin going to Europe and Russia. Because of the limited reach of Afghan law enforcement, endemic corruption, and a weak judicial system, the Afghan Government has been unable to enforce a total ban against opium cultivation. Low opium prices after a large harvest last year, threats of destruction and appeals from President Karzai to the provincial governors and the people of Afghanistan to forego the planting of opium in return for alternative development assistance appear to have resulted in major reductions in overall poppy cultivation in 2005, most notably in Nangarhar Province. The latest USG crop survey, released in November 2005, revealed that approximately 107,400 hectares of poppy were cultivated during the 2005 crop season, 48 percent less than in 2004. The crop had an estimated potential yield of 4,475 metric tons of opium, down only ten percent because favorable weather increased yields.
Synthetic Drugs Amphetamine-Type Stimulants. Global demand for Amphetamine-Type Stimulants (ATS), such as methamphetamine, amphetamine, and MDMA (“ecstasy’), has steadily increased throughout both the industrialized and the developing world. ATS drugs have displaced cocaine as the stimulant of choice in many countries, especially in those of Central and Northern Europe, and Southeast Asia. The relative ease and low cost of manufacturing ATS drugs from readily available chemicals appeals as much to small drug entrepreneurs as to the large international syndicates. Since they do not rely on organic sources such as coca and opium poppy, synthetics allow individual trafficking organizations to control the whole process, from manufacture to sale on the street. Synthetics can be made anywhere and offer enormous profit margins.
Methamphetamine. Methamphetamine abuse remains the fastest-growing drug threat in the United States today. Transnational drug trafficking organizations, based in Mexico and California, control a large percentage of the U.S. methamphetamine trade. Mexico is the principal foreign supplier of methamphetamine and most frequently used transit country for ATS precursors (especially Pseudoephedrine-PSE) destined for the United States. USG drug enforcement authorities believe that PSE imported into Canada continues to be diverted to the United States for illegal drug manufacture. Since Canada enacted regulations in 2002 to control PSE and other precursor and essential chemicals, a drop in seizures suggests that flows are diminishing.
Methamphetamine has displaced heroin as the principal trafficked drug in Burma and Thailand. Almost every country chapter in this year’s INCSR indicates a rise in methamphetamine or other ATS drug trafficking and consumption. Methamphetamine production in the U.S. shows no sign of slowing, as demonstrated by DEA’s National Clandestine Drug Data reporting of the seizure of several thousand U.S. methamphetamine laboratories in 2004, with the largest numbers in Missouri (2,707), and Tennessee (1,259).
Ecstasy. There continues to be substantial global demand for MDMA (ecstasy), the amphetamine analogue 3, 4-methylenedioxymethamphetamine. Clandestine laboratories in the Netherlands, and to a lesser extent in Belgium, are the principal suppliers of MDMA to the international market, but there also seems to be a good deal of production in Canada. The Netherlands took notable steps against the ecstasy trade in 2005, as highlighted in November when Dutch authorities dismantled the largest MDMA laboratory ever discovered in that country. Labs in Poland are major suppliers of amphetamines to the European market, with the United Kingdom and the Nordic countries among the heaviest consumers of amphetamine. In the United States, however, over the past five years ecstasy

INCSR 2006 Volume I
14
use has plummeted among the teenage population most at risk. According to the December 2005 Monitoring the Future report, annual prevalence rates among teenagers are between a half and a third of what they were in early 2001.
Cannabis (Marijuana) Cannabis (marijuana) production and consumption is a problem in nearly every country, not least in the United States. Drug organizations in Mexico and Canada produce more than 5,000 metric tons of marijuana, which is then marketed to more than 20 million users in the United States. Colombia, Jamaica, and Paraguay also export marijuana to the United States. Of greatest concern to the USG is the high potency cannabis produced on a large scale in Canada. Plants are grown in laboratory conditions using specialized timers, ventilation, moveable lights on tracks, nutrients sprayed on exposed roots and special fertilizer that maximize THC levels. The result is a particularly powerful, dangerous, and addictive drug. The higher the THC content, the greater is the danger. Despite suggestions that marijuana use has no long-term consequences, the latest scientific information indicates that marijuana is associated with learning difficulties as well as memory disturbances and may contribute to schizophrenia.
Attacking Trafficking Organizations. The drug trade depends upon reliable and efficient distribution systems to get its product to market. While most illicit distribution systems have short-term back-up channels to compensate for temporary law enforcement disruptions, a network under intense enforcement pressure cannot function for long. Working closely with our neighbors and allies, our strategy targets the leadership of the main trafficking groups, focusing on the operations along the network that bring drugs to the United States. Our goal is not simply to disrupt these organizations, but to remove the leadership, the facilitators who launder money and provide the chemicals needed for the production of illicit drugs, and their networks. By capturing the leaders of trafficking organizations, we demonstrate both to the criminals and to the governments fighting them that even the most powerful drug syndicates are vulnerable to concerted action by U.S. and host-government authorities.
Mexican drug syndicates oversee much of the drug trafficking in the United States. They have a strong presence in most of the primary U.S. distribution centers, directing the movement of cocaine, heroin, ATS drugs, and marijuana. Three years ago, in 2003, USG and Mexican officials developed a common targeting plan against major drug trafficking organizations in both countries. We also implemented secure mechanisms for data sharing. As a result, Mexican Federal enforcement and military authorities inflicted serious damage on several important trafficking organizations.
Mexican authorities struck at the leadership and key operating figures in major drug syndicates. These included: Juan Jose Alvarez Tostado, the financial mastermind of the Carrillo Fuentes Organization; Gulf Cartel principal operator Guadalupe Eugenio Rivera “El Gordo” Mata; Jose Gustavo “El Chapulin” Contreras Lopez, the leader of an Arellano Felix Organization (AFO) cell, based in the border region of Tijuana (Baja California), and engaged in kidnappings and murders related to drug trafficking. The top target was the Sinaloa cartel of Joaquin “El Chapo” Guzman Loera, one of Mexico’s best-known drug lords and a key figure in moving cocaine from Colombia to Mexico and on to the United States. In 2005, Mexican authorities arrested Guzman Loera’s son, Archivaldo, Guzman’s brother, Miguel Angel, and an important enforcer for “El Chapo’s” organization, Joaquin Angel Rios Felix. In November in Mexico City, Mexican federal agents arrested Ricardo (“The Doctor”) Garcia Urquiza, an important drug trafficker, money launderer, and associate of Vicente Carrillo Fuentes. Mexican authorities have described him as one of the most important drug traffickers arrested in Mexico in 2005.

Policy and Program Development
15
In 2005, as in previous years, Sensitive Investigative Units (SIUs) within the Mexican Federal Investigative Agency served as effective mechanisms for sharing sensitive intelligence data in both directions without compromise. They played an important role in successful investigations against drug trafficking organizations on both sides of the border.
Institutional Reform A pivotal element of USG international drug control policy has been to help governments strengthen their enforcement, judicial, and financial institutions to narrow the opportunities for infiltration by the drug trade. In drug source and transit countries, law enforcement agencies often arrest influential drug criminals only to see them released following a questionable or inexplicable decision by a single judge.
This still occurs, but not as often. Each year, there are fewer of these abuses, as governments work for basic reforms involving transparency, efficiency, and better pay for police and judges. Reform efforts advanced in 2005. For example, the Mexican government proposed ambitious justice sector reforms to re-organize federal law enforcement agencies, introduce oral testimony at criminal trials, and create a more professional public defender system. In Colombia, USG agencies have provided training, technical assistance, and equipment to enhance the system’s capacity and capabilities and to make it more transparent to the public. Chile completed its multi-year, nationwide criminal justice reform project in June 2005, adopting a new adversarial judicial system relying on oral trials rather than document-based legal proceedings. There are similarly encouraging developments outlined in many of the country chapters of this report.
Extradition Extradition to the United States is still the sanction international drug criminals fear most. The host of notorious foreign drug criminals serving long prison terms in the U.S. is a sober reminder to the most powerful international criminals of what can happen when they can no longer use bribes and intimidation to manipulate the local judicial process. Over the past decade, governments have been increasingly willing to risk domestic political repercussions and extradite drug kingpins to the United States.
Colombia and Mexico now extradite drug criminals to the United States on a regular basis. The number of extraditions from Colombia to the United States has increased significantly in recent years. In President Uribe’s administration, extraditions have increased dramatically, with 304 Colombian nationals and 11 nonnationals extradited by the end of 2005.
In early 2005, Colombia extradited FARC leader Anayibe Rojas Valderama (aka “Comandante Sonia”) and other criminal associates for drug trafficking and terrorism charges. Colombia also extradited Cali Cartel leader Miguel Rodriguez Orejuela in 2005. Other high-ranking drug trafficking targets arrested and/or extradited include Consolidated Priority Targets and members of the North Valley Cartel’s Top 10 list, such as Gabriel Puerta Parra, Jose Rendon Ramirez, John Cano Carrera, and Dagaberto Florez
In 2005 for the fourth consecutive year, Mexican authorities extradited a record number of fugitives to the United States. As of mid December, Mexico had extradited 40 fugitives to the United States, up from 34 in 2004, 31 in 2003, and 25 in 2002. These included Mexican citizens and narcotics and money laundering defendants.
In a watershed decision in late 2005, the Mexican Supreme court removed a significant obstacle to the extradition of fugitives facing life imprisonment in the United States for major drug trafficking and violent crimes. Reversing a 2004 decision, the court ruled that life in prison without the possibility of

INCSR 2006 Volume I
16
parole did not violate the Mexican Constitution’s prohibition on cruel and unusual punishment. Criminals subject to the death penalty in the United States, however, cannot be extradited since the Mexican Constitution prohibits capital punishment.
In another departure from past practice, the Afghan Government for the first time permitted the extradition of one of its citizens for drug trafficking to a foreign country. Afghanistan will extradite Haji Baz Mohammad under the 1988 UN Drug Convention to the U.S. to stand trial on narcotics charges. Other countries that extradited criminals to the U.S. in 2005 for prosecution were the Dominican Republic, El Salvador, Ghana, and Paraguay.
Controlling Drug Processing Chemicals Cocaine, heroin and synthetic drugs cannot be manufactured without certain critical chemicals, many of which are subject to international controls. Cocaine and heroin refining operations generally require widely available essential chemicals. Substitutes for unavailable chemicals can be used for most of the chemicals used in the manufacturing process, but there are some indispensable chemicals—potassium permanganate for cocaine and acetic anhydride for heroin—for which there are few readily obtainable substitutes. Synthetic drug manufacture requires even more specific precursor chemicals, such as ephedrine, pseudoephedrine, or phenylpropanolamine. These chemicals, used mainly for pharmaceutical purposes, have important but specific legitimate uses. They are commercially traded in smaller quantities to discrete users. Governments must have efficient legal and regulatory regimes to control such chemicals, without placing undue burdens on legitimate commerce. The United States, other major chemical trading countries, and the UN’s International Narcotics Control Board worked in 2005 to improve controls on cocaine and heroin processing chemicals, and those used for manufacturing synthetic drugs.
Bilaterally, we continued to work closely with the Canadian government in 2005 to curtail the diversion of drug processing chemicals to criminal interests in the United States. Pseudoephedrine (PSE), a common cold remedy and the main component in the manufacturing of methamphetamine, is legally imported into Canada from China, India, and Germany. U.S. counternarcotics authorities assess that a portion of those imports is diverted to the United States for the production of illicit drugs. Other precursor chemicals available in Canada and used in the production of synthetic drugs are sassafras oil, piperonal, and gamma butyrolactone (GBL). These precursors are used in the manufacturing of ecstasy (medthylenedioxymethamphetamine or MDMA), methylenedioxy-amphetamine (MDA), and gamma hydroxybutyrate (GHB).
In November 2005, the Canadian Government implemented the first major amendments to augment the 2003 Precursor Control Regulations. These changes strengthen verification of import and export licensing procedures, require that companies requesting those licenses provide additional detail in their initial requests provide guidelines on the suspension and revocation of licenses for abusers, and add controls of six chemicals that can be used to produce GHB and/or methamphetamine.
Controlling Supply The USG’s goal is to reduce and ultimately cut off the flow of illegal drugs to the United States. Our strategy targets drug supply at critical points along a five-point grower-to-user chain that links the consumer in the United States to the grower in a source country. In the case of cocaine or heroin, the chain starts with the growers cultivating coca or opium poppies, for instance, in the Andes or Afghanistan. It ends with the cocaine or heroin user in a U.S. town or city. The intermediate links are the processing (drug refining), transit (transport), and wholesale distribution stages.
Our international programs target the first three links of the grower-to-user chain: cultivation, processing, and transit. The closer we can attack to the source, the better are our chances of halting the

Policy and Program Development
17
flow of drugs altogether. Crop control is the most cost-effective means of cutting supply. Drugs cannot enter the system from crops that have been destroyed or left unharvested. It is the equivalent of removing a malignant growth before it can spread uncontrollably into the rest of the system. In theory, with no drug crops to harvest, there would be no cocaine or heroin for distribution, nor would there be any need for costly enforcement and interdiction operations.
In the real world, however, theory falters. Widespread (aerial and chemical) eradication is not legal in many countries. Even when eradication is feasible, destroying a lucrative crop, even an illegal one, carries enormous political, economic and social consequences for the producing country. In most cases, it means threatening the livelihood of the poorest sector of the population. Democratic governments that take away vital income without any viable quid pro quo seldom survive for long. Developing, implementing, and reaping the benefits of practical, long-term alternatives for the affected population can take decades. So we also must focus upon the succeeding links: the processing and distribution stages of laboratory destruction and interdiction of drug shipments.
Our programs can shift resources to those links where we can achieve both an immediate impact and long-term results. The right combination of effective law enforcement actions and alternative development programs can deliver truly remarkable results, as coca reductions in the Andean region demonstrate. We work closely with the governments of the coca-growing countries to find the best way to eliminate illegal coca within the context of each country’s individual circumstances. Alternative development programs play a vital role in countries seeking to free their agricultural sector from reliance on the drug trade by offering farmers opportunities to abandon illegal activities and join the legitimate economy. In the Andean countries, such programs provide funds and technical assistance to strengthen public and private institutions, expand rural infrastructure; improve natural resources management, introduce alternative legal crops, and develop local and international markets for these products.
Illegal Drugs, Spraying, and the Environment Questions inevitably arise over the environmental risks of regular use of herbicides on illegal drug crops. Colombia is currently the only country that allows regular aerial spraying of coca and opium poppy. The Colombian government has approved the herbicide that is being used to conduct aerial eradication in the growing areas. The only active ingredient in the herbicide used in the aerial eradication program is glyphosate, one of the most widely used agricultural herbicides in the world. It has been tested widely in the United States, Colombia, and elsewhere in the world. The U.S. Environmental Protection Agency (EPA) approved glyphosate for general use in 1974 and re-registered it in September 1993. EPA has approved its use on food croplands, forests, residential areas, and around aquatic areas. It is one of the top five pesticides, including herbicides, used in the United States.
Environmental Consequences of Illicit Coca Cultivation The environmental impact of approved herbicides must be weighed against the devastating potential of all aspects of coca cultivation. Coca cultivation in the Andean region has led to the destruction of approximately six million acres of rainforest in the past twenty years. Working in remote areas beyond settled populations, coca growers routinely slash and burn virgin forestland to make way for their illegal crops. Tropical rains quickly erode the thin topsoil of the fields, increasing soil runoff, depleting soil nutrients, and, by destroying timber and other resources that would otherwise be available for more sustainable uses, decreasing biological diversity. The destructive cycle continues, as growers regularly abandon nonproductive parcels to prepare new plots. At the same time, traffickers destroy jungle forests to build clandestine landing strips and laboratories for processing raw coca and poppy into cocaine and heroin.

INCSR 2006 Volume I
18
Illicit coca growers tend to be negligent and indiscriminate in their use of fertilizers and pesticides. Largely ignorant about the consequences of indiscriminate use of strong chemicals, they dump large quantities of highly toxic herbicides and fertilizers on their crops. These chemicals include paraquat and endosulfan, both of which qualify under the U.S. Environmental Protection Agency’s highest classification for toxicity (Category I) and are legally restricted for sale within Colombia and the United States.
The most toxic chemicals are those used at each stage of cocaine production. USG studies conducted in the early 1990s in Bolivia and Peru indicated that one kilogram of cocaine base required the use of three liters of concentrated sulfuric acid, 10 kilograms of lime, 60 to 80 liters of kerosene, 200 grams of potassium permanganate, and one liter of concentrated ammonia. These toxic pesticides, fertilizers, and processing chemicals are then dumped into the nearest waterway or on the ground. They saturate the soil and contaminate waterways and poison water systems and dependent species in the process.
Interdiction in the Transit Zone Despite the international community’s best efforts to attack the drug supply within source countries, the United States and our allies must continue to provide an effective presence in the transit zone, specifically for cocaine moving north out of South America. This has required a well-coordinated effort between transit zone countries and USG agencies including DOD, DHS, and DOJ. Source country intelligence combined with post seizure intelligence has improved dramatically in the last several years to yield better actionable intelligence within the transit zone. The Joint Inter-Agency Task Force-South with billeted international partners from throughout the Caribbean Basin has focused on intelligence to detect and monitor maritime drug movements while maneuvering interdiction assets into position to effect a seizure. The USG’s efforts to create and expand authorities based on bilateral agreements with Caribbean and Latin American countries have eased the burden on these countries’ law enforcement assets to conduct at sea boardings and search for contraband. These bilateral agreements have also allowed the USG to gain jurisdiction over cases and remove the corrosive pressure from large Trafficking Organizations on some foreign governments. This team effort led to unprecedented success by removing over 150 metric tons of cocaine from the maritime transit zone in 2005 by USG assets. Continued success will depend on the allocation of tightly constrained resources to improve on the inroads and agreements reached in the last several years.
Fighting Corruption Though corruption may seem a less obvious threat than the challenge of armed insurgents, the weakening of government institutions through bribery and intimidation ultimately poses just as great a danger to democratic governments. Terrorist groups or guerrilla armies overtly seek to topple and replace governments through violence. Drug syndicates, however, work behind the scenes, seeking to subvert governments in order to guarantee themselves a secure operating environment by co-opting key officials. Unchecked, the drug trade is capable of taking de facto control of a country by essentially buying off a majority of key government officials, including a president. With a president, defense chief, and interior minister secretly on its payroll, a criminal organization can operate with near impunity behind the façade of sovereign legitimate government. While this has yet to happen, there have been several close calls in the recent past. By keeping the focus on eliminating corruption, we can prevent the nightmare of a government entirely manipulated by drug lords from becoming a reality.
Fighting the drug trade is a dominant element in a broader struggle against corruption. Drug organizations possess and wield the ultimate instrument of corruption: money. The drug trade has access to almost unimaginable quantities of it. No commodity is so widely available, so cheap to produce, and as easily renewable as illegal drugs. They offer dazzling profit margins that allow
Policy and Program Development
19
criminals to generate illicit revenues on a scale without historical precedent. For example, assuming an average U.S. retail street price of one hundred dollars a gram, a metric ton of pure cocaine is worth $100 million on the streets of the United States—twice as much if the drug is cut with additives. That same metric ton typically would have cost around $3,000,000 ($3,000 per kilogram) when it left Colombia. Few legitimate businesses can boast of a 30-fold return. At $100 per gram, the 329 metric tons of cocaine seized in Mexico and Latin America in 2005 could in theory be worth as much as $30 billion to the drug trade, more than the gross domestic product of many of the countries of Central America. If only a portion of these profits flows back to the drug syndicates, we are still speaking of hundreds of millions, if not billions, of dollars.
To put these sums into perspective, in FY 2005 the State Department’s budget for international drug control operations was approximately $1.2 billion. That equates to roughly 12 metric tons of cocaine. The drug syndicates have lost that amount in a single shipment, with no serious consequences, except to the unfortunate subordinate responsible for the loss.
Next Steps The international drug trade is a complex, dynamic organism that learns quickly from its mistakes. It is nothing if not adaptable. Every time we score a major success-and over the past decade and a half we have had many-the drug trade learns from it. Successful operations weed out the weaker elements, leaving the more agile and sophisticated criminals in place. In time, this selection process eventually leaves us with a very astute adversary.
The drug trade itself also evolves naturally, like any business in a competitive market place. We are now dealing with second or even third-generation transnational drug syndicates. They embrace modern management techniques, employ state-of-the-art communications, and hire the best technical and financial expertise.
The drug trade, however, has an inherent weakness: it is simultaneously a criminal organization and a business. It has to straddle two worlds. As a criminal organization, it operates in the shadows with virtual impunity. But to prosper as a business, it must emerge into the legitimate commercial world and lose its protective cover. Once in the legitimate world, it becomes vulnerable. It needs raw materials, processing chemicals, transportation networks, and, most important of all, a means of getting its profits into legitimate commercial and financial channels.
In the past twenty years, working with our international partners, we have successfully increased pressures on the drug trade and narrowed opportunities at every stage of their operations, from cultivation and production to transport and marketing. Without lessening pressure at all these points, we must now intensify our efforts to strike at the critical point-the financial end. Just as a business that cannot reinvest its profits soon fails, without a steady flow of funds, the drug trade cannot function effectively. Since governments individually control domestic access the global financial system, working together they have the potential to make it all but impossible for drug profits to enter the legitimate international financial system. Our goal is to transform that potential into a reality and reduce the drug trade from serious threat to a common nuisance.
Demand Reduction Drug “demand reduction” aims to reduce worldwide use and abuse of illicit drugs worldwide. The need for demand reduction is reflected in escalating drug use that takes a devastating toll on health, welfare, security and economic stability of all countries. Recognizing this problem, the National Security Presidential Directive (NSPD#25) on International Drug Control Policy urges the Secretary
INCSR 2006 Volume I
20
of State “to expand U.S. international demand reduction assistance and information sharing programs in key source and transit countries”. As opposed to drug production and trafficking, the NSPD addresses rising global demand for drugs as the principal threat to the U.S. As outlined in the NSPD, drug trafficking organizations and their linkages to international terrorist groups also constitute a serious threat to U.S. national security by generating money that increasingly threatens global peace and stability. Demand reduction assistance has subsequently evolved as a key foreign policy tool to address the inter-connected threats of drugs, crime, and terrorism. More recently it is recognized as a key complimentary component in efforts to stop the spread of HIV/AIDS, particularly in countries with high intravenous drug users.
Foreign countries recognize the vast U.S. experience and efforts in reducing drug demand. In return for cooperation with supply reduction efforts, many drug producing and transit countries request U.S. assistance with demand reduction technology, since drug consumption also has debilitating effects on their society and children. Demand reduction assistance thereby helps secure foreign country support for U.S. driven supply reduction efforts, while at the same time reducing consumption in that country and reducing a major source of terrorist financing.
Our demand reduction strategy encompasses a wide range of initiatives to address the needs and national security threat posed by the illicit drug trade. These include efforts to prevent the onset of use, intervention at “critical decision points” in the lives of vulnerable populations to prevent both first use and further use, and effective treatment programs for the addicted. Other aspects encompass education and community coalition development efforts to increase public awareness of the deleterious consequences of drug use/abuse. This latter effort involves the development of coalitions of private/public social institutions, the faith community, and law enforcement entities to mobilize national and international opinion against the drug trade and to encourage governments to develop and implement strong counternarcotics policies and programs. The demand reduction program also provides for evaluations of the effectiveness of these efforts and for “best practice” research studies to use these findings to improve similar services provided in the U.S. and around the world.
In 2005, INL’s assistance targeted the cocaine producing and transit countries in Latin America, addressed the amphetamine-type stimulant (ATS) epidemic in Southeast Asia, and addressed the heroin threat from Asia, Afghanistan and Colombia. It also focused on countries in Southeast Asia and Africa where intravenous drug use is fueling an HIV/AIDS epidemic. INL continued to fund bilateral training at various locations throughout the world on topics such as community/grassroots coalition building and networking, U.S. policies and programs, science-based drug prevention programming, and treatment within the criminal justice system. As a result of INL’s training assistance, the first counternarcotics community coalition network outside the United States was established in Peru. INL funded a symposium on Drug Demand Reduction in Kabul, Afghanistan that was attended by over 500 of the country’s senior religious leaders and resulted in a major Fatwa against drug production, trafficking and abuse in that country. INL’s training targeting predominantly Muslim populations also resulted in the establishment of mosque-based outreach drug treatment centers in 25 provinces throughout Afghanistan, 12 centers in Indonesia religious schools and a total of 6 in Pakistan, Southern Philippines and Malaysia.
INL funding has provided new updated curricula to 24 Drug Abuse Resistance Education (D.A.R.E.) programs in Latin America and Asia. INL funding also supported drug treatment training in Vietnam to address the connection between intravenous drug use and HIV/AIDS, and to reduce overall drug consumption. INL funded comprehensive multi-year scientific studies on pilot projects and programs developed from INL-funded training to learn how these initiatives can help assist U.S.-and foreign-based demand reduction efforts. An outcome-based evaluation of INL-funded, school-based D.A.R.E. training in Colombia revealed that drug use was reduced from 54 percent to 10 percent in the eight target cities participating in the program. Other recent research on the long-term impact of INL-funded treatment training in Peru revealed that overall drug use was reduced from 90 percent to 34 percent in

Policy and Program Development
21
the targeted population. A leading journal on drug addiction, Journal of Teaching in the Addictions, devoted its entire November 2005 edition to “best practices” in drug abuse treatment that resulted from INL assistance to Southeast Asia, Latin America, and Eastern Europe.
Methodology for Estimating Illegal Drug Production
How Much Do We Know? The INCSR contains a variety of illicit drug-related data. These numbers represent the United States Government’s best effort to sketch the current dimensions of the international drug problem. Some numbers are more certain than others. Drug cultivation figures are relatively hard data derived by proven means, such as imagery with ground truth confirmation. Other numbers, such as crop production and drug yield estimates, become softer as more variables come into play. As we do every year, we publish these data with an important caveat: the yield figures are potential, not final numbers. Although they are useful for determining trends, even the best are ultimately approximations.
Each year, we revise our estimates in the light of field research. The clandestine, violent nature of the illegal drug trade makes such field research difficult. Geography is also an impediment, as the harsh terrain on which many drugs are cultivated is not always easily accessible. This is particularly relevant given the tremendous geographic areas that must be covered, and the difficulty of collecting reliable information over diverse and treacherous terrain.
What We Know With Reasonable Certainty. The number of hectares under cultivation during any given year is our most solid statistic. For nearly twenty years, the United States Government has estimated the extent of illicit cultivation in a dozen nations using proven statistical methods similar to those used to estimate the size of licit crops at home and abroad. We can therefore estimate the extent of cultivation with reasonable accuracy.
What We Know With Less Certainty. How much of a finished product a given area will produce is difficult to estimate. Small changes in factors such as soil fertility, weather, farming techniques, and disease can produce widely varying results from year to year and place to place. To add to our uncertainty, most illicit drug crop areas are not easily accessible to the United States Government, making scientific information difficult to obtain. Therefore, we are estimating the potential crop available for harvest. Not all of these estimates allow for losses, which could represent up to a third or more of a crop in some areas for some harvests. The value in estimating the size of the potential crop is to provide a consistent basis for a comparative analysis from year to year.
Harvest Estimates. We have gradually improved our yield estimates. Our confidence in coca leaf yield estimates, as well as in the finished product, has risen in the past few years, based upon the results of field studies conducted in Latin America. In all cases, however, multiplying average yields times available hectares indicates only the potential, not the actual final drug crop available for harvest. The size of the harvest depends upon the efficiency of farming practices and the wastage caused by poor practices or difficult weather conditions during and after harvest. Up to a third or more of a crop may be lost in some areas during harvests.
In addition, mature coca (two to six years old) is more productive than immature or aging coca. Variations such as these can dramatically affect potential yield and production. Additional information and analysis is allowing us to make adjustments for these factors. Similar deductions for local consumption of unprocessed coca leaf and opium may be possible as well through the accumulation of additional information and research.
INCSR 2006 Volume I
22
Processing Estimates. The wide variation in processing efficiency achieved by traffickers complicates the task of estimating the quantity of cocaine or heroin that could be refined from a crop. Differences in the origin and quality of the raw material used, the technical processing method employed, the size and sophistication of laboratories, the skill and experience of local workers and chemists, and decisions made in response to enforcement pressures obviously affect production.
Figures Change as Techniques and Data Quality Improve. Each year, research produces revisions to United States Government estimates of potential drug production. This is typical of annualized figures for most other areas of statistical tracking that must be revised year to year, whether it be the size of the U.S. wheat crop, population figures, or the unemployment rate. For the present, these illicit drug statistics represent the state of the art. As new information becomes available and as the art improves, so will the precision of the estimates.

Policy and Program Development
23
Worldwide Illicit Drug Cultivation 1998–2005 (All Figures in Hectares)
2005 2004 2003 2002 2001 2000 1999 1998 Opium
Afghanistan 107,000 206,700 61,000 30,750 1,685 64,510 51,500 41,720
India
Iran
Pakistan 3,100 622 213 515 1,570 3,030
Total SW Asia 107,000 209,800 61,000 31,372 1,898 65,025 53,070 44,750
Burma 40,000 30,900 47,130 78,000 105,000 108,700 89,500 130,300
China
Laos 5,600 10,000 18,900 23,200 22,000 23,150 21,800 26,100
Thailand 750 820 890 835 1,350
Vietnam 1,000 2,300 2,300 2,100 3,000
Total SE Asia 45,600 40,900 66,030 102,950 130,120 135,040 114,235 160,750
Colombia 2,100 4,400 4,900 6,500 7,500 7,500 6,100
Lebanon
Guatemala 330
Mexico 3,500 4,800 2,700 4,400 1,900 3,600 5,500
Total Other 5,930 9,200 7,600 10,900 9,400 11,100 11,600
Total Opium 152,600 256,630 136,230 141,922 142,918 209,465 178,405 217,100
Coca
Bolivia 26,500 24,600 23,200 21,600 19,900 14,600 21,800 38,000
Colombia1 114,100 113,850 144,450 169,800 136,200 122,500 101,800
Peru 38,000 27,500 29,250 34,700 34,000 34,200 38,700 51,000
Ecuador
Total Coca 64,500 166,200 166,300 200,750 223,700 185,000 183,000 190,800
Cannabis
Mexico 3,900 3,900 3,900 3,700 4,600
Colombia 5,000 5,000 5,000 5,000 5,000 5,000 5,000
Jamaica
Total Cannabis 5,000 5,000 8,900 8,900 8,900 8,700 9,600
1 Colombian coca cultivation survey results for 2005 will not be available until the spring of 2006.

INCSR 2006 Volume I
24
Worldwide Illicit Drug Cultivation 1990–1997 (All Figures in Hectares)
1997 1996 1995 1994 1993 1992 1991 1990
Opium
Afghanistan 39,150 37,950 38,740 29,180 21,080 19,470 17,190 12,370
India 2,050 3,100 4,750 5,500 4,400
Iran
Pakistan 4,100 3,400 6,950 7,270 6,280 8,170 8,205 8,220
Total SW Asia 45,300 44,450 50,440 41,950 31,760 27,640 25,395 20,590
Burma 155,150 163,100 154,070 154,070 146,600 153,700 160,000 150,100
China 1,275 1,965
Laos 28,150 25,250 19,650 19,650 18,520 25,610 29,625 30,580
Thailand 1,650 2,170 1,750 2,110 2,110 2,050 3,000 3,435
Total SE Asia 6,150 3,150 177,795 167,230 181,360 192,625 184,185
Colombia 191,100 193,670 176,745 1,160
Lebanon 6,600 6,300 6,540 20,000 20,000 20,000 3,400 3,200
Guatemala 90 150 440 na 1,145 845
Mexico 39 50 438 730 3,765 5,450
Vietnam 4,000 5,100 5,050 5,795 3,960 3,310
Total Other 10,600 11,490 11,779 25,845 24,838 24,040 9,470 9,495
Total Opium 247,000 249,610 238,964 245,590 223,828 233,040 227,490 214,200
Coca
Bolivia 45,800 48,100 48,600 48,100 47,200 45,500 47,900 50,300
Colombia 79,500 67,200 50,900 45,000 39,700 37,100 37,500 40,100
Peru 68,800 94,400 115,300 108,600 108,800 129,100 120,800 121,300
Ecuador 40 120
Total Coca 194,100 209,700 214,800 201,700 195,700 211,700 206,240 211,820
Cannabis
Mexico 4,800 6,500 6,900 10,550 11,220 16,420 17,915 35,050
Colombia 5,000 5,000 5,000 4,986 5,000 2,000 2,000 1,500
Jamaica 317 527 305 308 744 389 950 1,220
Total Cannabis 10,117 12,027 12,205 15,844 16,964 18,809 20,865 37,770

Policy and Program Development
25
Worldwide Potential Illicit Drug Production 1998–2005 (All Figures in Metric Tons)
2005 2004 2003 2002 2001 2000 1999 1998 Opium Gum
Afghanistan 4,475 4,950 2,865 1,278 74 3,656 2,861 2,340 India Iran Pakistan 70 5 5 11 37 66
Total SW Asia 4,475 5,020 2,865 1,283 79 3,667 2,898 2,406 Burma 380 292 484 630 865 1,085 1,090 1,750 China Laos 28 49 200 180 200 210 140 140 Thailand 9 6 6 6 16 Vietnam 10 15 15 11 20
Total SE Asia 408 341 684 829 1,086 1,316 1,247 1,926 Colombia 30 63 68 75 61 Lebanon Guatemala 12 Mexico 73 101 58 71 21 43 60
Total Other 115 164 126 71 21 118 121
Total Opium 4,883 5,476 3,713 2,238 1,236 5,004 4,263 4,453 Coca Leaf
Bolivia1 18,800 17,500 17,210 16,600 20,200 26,800 22,800 52,900 Colombia 108,000 115,500 147,918 583,000 521,400 437,600 Peru 56,300 48,800 52,300 59,600 52,600 54,400 69,200 95,600 Ecuador
Total Coca 75,100 174,300 185,010 224,118 72,800 664,200 613,400 586,100 Cannabis
Mexico 10,440 13,500 7,900 7,400 7,000 3,700 8,300 Colombia 4,000 4,000 4,000 4,000 4,000 4,000 Jamaica Belize Others 3,500 3,500 3,500 3,500 3,500 3,500 3,500
Total Cannabis 17,940 17,000 15,400 14,900 14,500 11,200 15,800
1 Beginning in 2001, USG surveys of Bolivian coca take place cover the period June to June.

INCSR 2006 Volume I
26
Worldwide Potential Illicit Drug Production 1990–1997 (All Figures in Metric Tons)
1997 1996 1995 1994 1993 1992 1991 1990 Opium Gum
Afghanistan 2,184 2,174 1,250 950 685 640 570 415
India 30 47 77 90
Iran
Pakistan 85 75 155 160 140 175 180 165
Total SW Asia 2,299 2,296 1,482 1,200 825 815 750 580
Burma 2,365 2,560 2,340 2,030 2,575 2,280 2,350 2,255
China 19 25
Laos 210 200 180 85 180 230 265 275
Thailand 25 30 25 17 42 24 35 40
Vietnam 45 25
Total SE Asia 2,645 2,815 2,564 2,157 2,797 2,534 2,650 2,570
Colombia 66 63 65
Lebanon 1 1 4 34 32
Guatemala 11 13
Mexico 46 54 53 60 49 40 41 62
Total Other 112 118 119 60 53 40 86 107
Total Opium 5,056 4,285 4,165 3,417 3,675 3,389 3,486 3,257
Coca Leaf
Bolivia 70,100 75,100 85,000 89,800 84,400 80,300 78,000 77,000
Colombia 347,000 302,900 229,300 35,800 31,700 29,600 30,000 32,100
Peru 130,200 174,700 183,600 165,300 155,500 223,900 222,700 196,900
Ecuador 100 100 40 170
Total Coca 547,300 552,700 497,900 290,900 271,700 333,900 330,740 306,170
Cannabis
Mexico 8,600 11,700 12,400 5,540 6,280 7,795 7,775 19,715
Colombia 4,133 4,133 4,133 4,138 4,125 1,650 1,650 1,500
Jamaica 214 356 206 208 502 263 641 825
Belize 49 60
Others 3,500 3,500 3,500 3,500 3,500 3,500 3,500 3,500
Total 16,447 19,689 20,239 13,386 14,407 13,208 13,615 25,600

Policy and Program Development
27
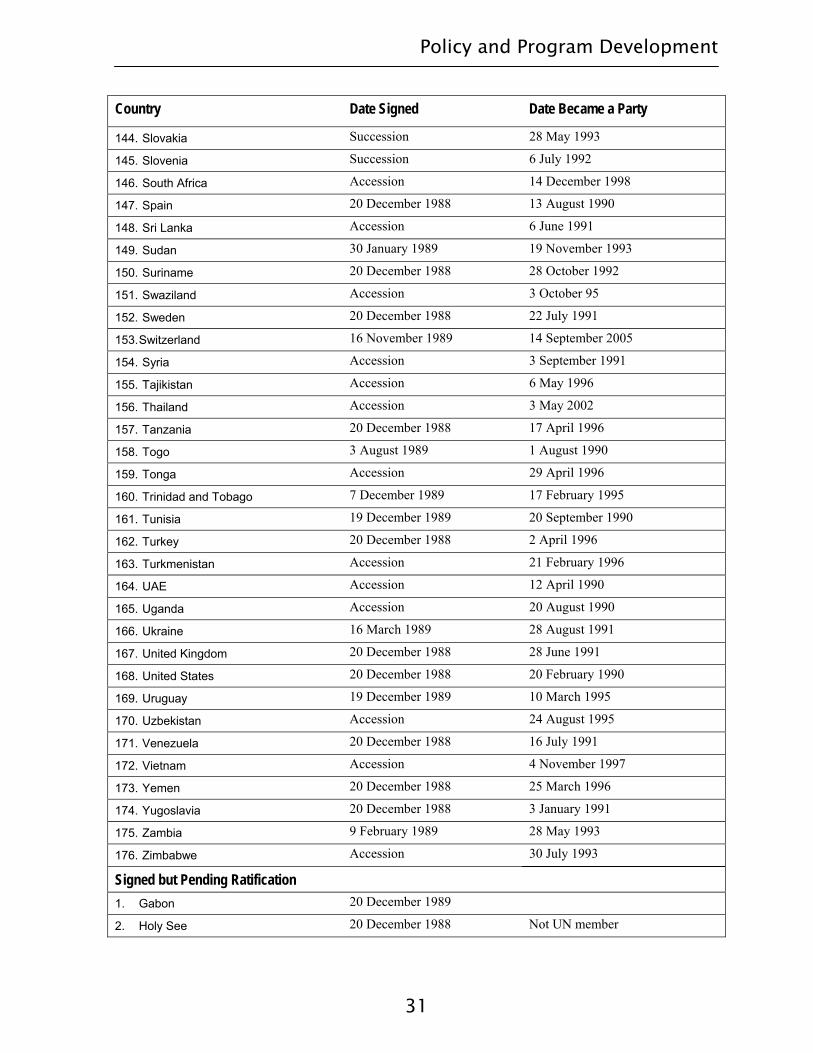
Parties to the 1988 UN Convention
Country Date Signed Date Became a Party
1. Afghanistan 20 December 1988 14 February 1992
2. Albania Accession 27 June 2001
3. Algeria 20 December 1988 9 May 1995
4. Andorra Accession 23 July 1999
5. Angola Accession 26 October 2005
6. Antigua and Barbuda Accession 5 April 1993
7. Argentina 20 December 1988 28 June 1993
8. Armenia Accession 13 September 1993
9. Australia 14 February 1989 16 November 1992
10. Austria 25 September 1989 11 July 1997
11. Azerbaijan Accession 22 September 1993
12. Bahamas 20 December 1988 30 January 1989
13. Bahrain 28 September 1989 7 February 1990
14. Bangladesh 14 April 1989 11 October 1990
15. Barbados Accession 15 October 1992
16. Belarus 27 February 1989 15 October 1990
17. Belgium 22 May 1989 25 October 1995
18. Belize Accession 24 July 1996
19. Benin Accession 23 May 1997
20. Bhutan Accession 27 August 1990
21. Bolivia 20 December 1988 20 August 1990
22. Bosnia and Herzegovina Succession 01 September 1993
23. Botswana Accession 13 August 1996
24. Brazil 20 December 1988 17 July 1991
25. Brunei Darussalam 26 October 1989 12 November 1993
26. Bulgaria 19 May 1989 24 September 1992
27. Burkina Faso Accession 02 June 1992
28. Burundi Accession 18 February 1993
29. Cambodia Accession 7 July 2005
30. Cameroon 27 February 1989 28 October 1991
31. Canada 20 December 1988 05 July 1990
32. Cape Verde Accession 08 May 1995
33. Central African Republic Accession 15 October 2001
34. Chad Accession 09 June 1995

INCSR 2006 Volume I
28
Country Date Signed Date Became a Party
35. Chile 20 December 1988 13 March 1990
36. China 20 December 1988 25 October 1989
37. Colombia 20 December 1988 10 June 1994
38. Comoros Accession 1 March 2000
39. Congo, Democratic Republic of 20 December 1988 28 October 2005
40. Costa Rica 25 April 1989 8 February 1991
41. Cote d’Ivoire 20 December 1988 25 November 1991
42. Croatia Succession 26 July 1993
43. Cuba 7 April 1989 12 June 1996
44. Cyprus 20 December 1988 25 May 1990
45. Czech Republic Succession 30 December 1993
46. Denmark 20 December 1988 19 December 1991
47. Djibouti Accession 22 February 2001
48. Dominica Accession 30 June 1993
49. Dominican Republic Accession 21 September 1993
50. Ecuador 21 June 1989 23 March 1990
51. Egypt 20 December 1988 15 March 1991
52. El Salvador Accession 21 May 1993
53. Eritrea Accession 30 January 2002
54. Estonia Accession 12 July 2000
55. Ethiopia Accession 11 October 1994
56. European Economic Community 8 June 1989 31 December 1990
57. Fiji Accession 25 March 1993
58. Finland 8 February 1989 15 February 1994
59. France 13 February 1989 31 December 1990
60. Gambia Accession 23 April 1996
61. Georgia Accession 8 January 1998
62. Germany 19 January 1989 30 November 1993
63. Ghana 20 December 1988 10 April 1990
64. Greece 23 February 1989 28 January 1992
65. Grenada Accession 10 December 1990
66. Guatemala 20 December 1988 28 February 1991
67. Guinea Accession 27 December 1990
68. Guinea-Bissau Accession 27 October 1995
69. Guyana Accession 19 March 1993
70. Haiti Accession 18 September 1995
71. Honduras 20 December 1988 11 December 1991

Policy and Program Development
29
Country Date Signed Date Became a Party
72. Hungary 22 August 1989 15 November 1996
73. Iceland Accession 2 September 1997
74. India Accession 27 March 1990
75. Indonesia 27 March 1989 23 February 1999
76. Iran 20 December 1988 7 December 1992
77. Iraq Accession 22 July 1998
78. Ireland 14 December 1989 3 September 1996
79. Israel 20 December 1988 20 May 2002
80. Italy 20 December 1988 31 December 1990
81. Jamaica 2 October 1989 29 December 1995
82. Japan 19 December 1989 12 June 1992
83. Jordan 20 December 1988 16 April 1990
84. Kazakhstan Accession 29 April 1997
85. Kenya Accession 19 October 1992
86. Korea Accession 28 December 1998
87. Kuwait 2 October 1989 3 November 2000
88. Kyrgyz Republic Accession 7 October 1994
89. Lao Peoples Democratic Republic Accession 1 October 2004
90. Latvia Accession 24 February 1994
91. Lebanon Accession 11 March 1996
92. Lesotho Accession 28 March 1995
93. Liberia Accession 16 September 2005
94. Libyan Arab Jamahiriya Accession 22 July 1996
95. Lithuania Accession 8 June 1998
96. Luxembourg 26 September 1989 29 April 1992
97. Macedonia, Former Yugoslav Rep. Accession 18 October 1993
98. Madagascar Accession 12 March 1991
99. Malawi Accession 12 October 1995
100. Malaysia 20 December 1988 11 May 1993
101. Maldives 5 December 1989 7 September 2000
102. Mali Accession 31 October 1995
103. Malta Accession 28 February 1996
104. Mauritania 20 December 1988 1 July 1993
105. Mauritius 20 December 1988 6 March 2001
106. Mexico 16 February 1989 11 April 1990

INCSR 2006 Volume I
30
Country Date Signed Date Became a Party
107. Micronesia, Federal States of Accession 6 July 2004
108. Moldova Accession 15 February 1995
109. Monaco 24 February 1989 23 April 1991
110. Mongolia Accession 25 June 2003
111. Morocco 28 December 1988 28 October 1992
112. Mozambique Accession 8 June 1998
113. Myanmar (Burma) Accession 11 June 1991
114. Nepal Accession 24 July 1991
115. Netherlands 18 January 1989 8 September 1993
116. New Zealand 18 December 1989 16 December 1998
117. Nicaragua 20 December 1988 4 May 1990
118. Niger Accession 10 November 1992
119. Nigeria 1 March 1989 1 November 1989
120. Norway 20 December 1988 14 November 1994
121. Oman Accession 15 March 1991
122. Pakistan 20 December 1988 25 October 1991
123. Panama 20 December 1988 13 January 1994
124. Paraguay 20 December 1988 23 August 1990
125. Peru 20 December 1988 16 January 1992
126. Philippines 20 December 1988 7 June 1996
127. Poland 6 March 1989 26 May 1994
128. Portugal 13 December 1989 3 December 1991
129. Qatar Accession 4 May 1990
130. Romania Accession 21 January 1993
131. Russia 19 January 1989 17 December 1990
132. Rwanda Accession 13 May 2002
133. St. Kitts and Nevis Accession 19 April 1995
134. St. Lucia Accession 21 August 1995
135. St. Vincent and the Grenadines Accession 17 May 1994
136. Samoa Accession 19 August 2005
137. San Marino Accession 10 October 2000
138. Sao Tome and Principe Accession 20 June 1996
139. Saudi Arabia Accession 9 January 1992
140. Senegal 20 December 1988 27 November 1989
141. Seychelles Accession 27 February 1992
142. Sierra Leone 9 June 1989 6 June 1994
143. Singapore Accession 23 October 1997
Policy and Program Development
31
Country Date Signed Date Became a Party
144. Slovakia Succession 28 May 1993
145. Slovenia Succession 6 July 1992
146. South Africa Accession 14 December 1998
147. Spain 20 December 1988 13 August 1990
148. Sri Lanka Accession 6 June 1991
149. Sudan 30 January 1989 19 November 1993
150. Suriname 20 December 1988 28 October 1992
151. Swaziland Accession 3 October 95
152. Sweden 20 December 1988 22 July 1991
153. Switzerland 16 November 1989 14 September 2005
154. Syria Accession 3 September 1991
155. Tajikistan Accession 6 May 1996
156. Thailand Accession 3 May 2002
157. Tanzania 20 December 1988 17 April 1996
158. Togo 3 August 1989 1 August 1990
159. Tonga Accession 29 April 1996
160. Trinidad and Tobago 7 December 1989 17 February 1995
161. Tunisia 19 December 1989 20 September 1990
162. Turkey 20 December 1988 2 April 1996
163. Turkmenistan Accession 21 February 1996
164. UAE Accession 12 April 1990
165. Uganda Accession 20 August 1990
166. Ukraine 16 March 1989 28 August 1991
167. United Kingdom 20 December 1988 28 June 1991
168. United States 20 December 1988 20 February 1990
169. Uruguay 19 December 1989 10 March 1995
170. Uzbekistan Accession 24 August 1995
171. Venezuela 20 December 1988 16 July 1991
172. Vietnam Accession 4 November 1997
173. Yemen 20 December 1988 25 March 1996
174. Yugoslavia 20 December 1988 3 January 1991
175. Zambia 9 February 1989 28 May 1993
176. Zimbabwe Accession 30 July 1993
Signed but Pending Ratification
1. Gabon 20 December 1989
2. Holy See 20 December 1988 Not UN member

INCSR 2006 Volume I
32
3. Zaire 20 December 1988
Other
1. Anguilla Not UN member
2. Aruba Not UN member
3. Bermuda
4. BVI Not UN member
5. Congo
6. Djibouti
7. DPR Korea
8. Hong Kong Not UN member
9. Liechtenstein
10. Marshall Islands
11. Namibia
12. Papua New Guinea
13. Taiwan Not UN member
14. Turks & Caicos Not UN member
15. Vanuatu