politecnico di milanopolitecnico di milano master of science in mechanical engineering...
TRANSCRIPT

POLITECNICO DI MILANO
Master of Science in Mechanical Engineering
Thermo-Mechanical cycling of Thin Ni-Ti Shape Memory Wires
Supervisor: Prof. MAURIZIO VEDANI
Co-Supervisor: Ing. RICCARDO CASATI
By:
FARSHAD SAGHAFI 78197
Academic Year 2014-2015
Acknowledgements
The author wishes to express his most heartfelt thanks to his family, for their constant support along the years and especially along this three year abroad experience.
To Professor Maurizio Vedani, Riccardo Casati and Ausonio Tuissi for their patience, guidance and encouragement which made this project possible. To National Research Council - Institute for Energetics and Interphases (CNR-IENI) for their collaboration during this project.
Finally, to Politecnico di Milano and the Mechanical Engineering Department for their enriching Master of Science program.
Farshad Saghafi
3
Contents
Chapter 1: Introduction ............................................................................................................................... 10
1.1 Shape Memory Effect .......................................................................................................................... 10
1.1.1 De-Twinning .................................................................................................................................. 11
1.1.2 One Way and Two Ways Shape Memory Effect ........................................................................... 12
1.2 Super-elasticity .................................................................................................................................... 13
1.3 High Performance Shape Memory Effect (HP-SME) ............................................................................ 14
1.4 Discovery and Applications .................................................................................................................. 14
1.4.1 SMA Actuators .............................................................................................................................. 17
1.5 Functional/Structural Fatigue .............................................................................................................. 18
Chapter 2: Aim of the Thesis ...................................................................................................................... 20
Chapter 3: Materials and experimental methods .................................................................................. 21
3.1 Materials .............................................................................................................................................. 21
3.2 DSC Test ............................................................................................................................................... 21
3.3 Tensile Test .......................................................................................................................................... 22
3.4 Experimental apparatus for fatigue and actuation tests ..................................................................... 23
Aluminum structure ............................................................................................................................ 24
Clamping System ................................................................................................................................. 24
Insulation Plate .................................................................................................................................... 25
Displacement Measuring Device ......................................................................................................... 26
System for impact prevention ............................................................................................................. 27
Load Bar ............................................................................................................................................... 28
Weights ................................................................................................................................................ 29
Programmable power supplier ............................................................................................................ 29
Data Acquisition Package (DAQ) and PC.............................................................................................. 30
3.4.1 Actuation Tests ............................................................................................................................. 31
3.4.2 Thermo-mechanical fatigue tests ................................................................................................. 35
3.5 Fractography ........................................................................................................................................ 37
Chapter 4: Results and Discussion ............................................................................................................. 38
4.1 Actuation Tests .................................................................................................................................... 38
SME wire .................................................................................................................................................. 38
HP-SME .................................................................................................................................................... 41
Comparison between SME and HP-SME wires ........................................................................................ 45
4.2 Resistivity ............................................................................................................................................. 48

4
4.3 Thermo-Mechanical Fatigue Tests ....................................................................................................... 51
4.4 Actuation tests during TMC ................................................................................................................. 54
4.5 DSC Test ............................................................................................................................................... 59
4.6 Tensile Test .......................................................................................................................................... 64
4.7 Fractography ........................................................................................................................................ 66
Conclusion ..................................................................................................................................................... 68
References ..................................................................................................................................................... 70

5
List of Figures
Figure 1. Martensite fracture vs. characteristic temperatures of shape memory alloys [3] ............. 11
Figure 2. De-Twining Process. ............................................................................................................ 12
Figure 3. Typical loading and unloading behavior of super-elastic NiTi [21] ..................................... 13
Figure 4. Biocompatible stents ........................................................................................................... 15
Figure 5. DuraFLEX eyeglasses. .......................................................................................................... 17
Figure 6. Chevrons of engine .............................................................................................................. 18
Figure 7. TA INSTRUMENT Q100 DSC test machine ........................................................................... 22
Figure 8. MTS Alliance RT/100 tensile test machine .......................................................................... 23
Figure 9. Assembled structure of the rig and other components of the apparatus ........................... 24
Figure 10. The shape memory wire blocked inside the clamp ........................................................... 25
Figure 11. Aluminum upper mounting plate Figure 12. Plastic insulating plate ............... 26
Figure 13. Short range distance sensor .............................................................................................. 26
Figure 14.The laser is placed axially under the weight and the light beam is concentrated to the
center of the weight ........................................................................................................................... 27
Figure 15. Impact prevention mechanism with adjustable Al profile connected to the structure .... 28
Figure 16. Load bar ............................................................................................................................ 28
Figure 17. Example of weight ............................................................................................................. 29
Figure 18. DC power supplier ............................................................................................................. 30
Figure 19. National Instrument data acquisition device .................................................................... 31
Figure 20: Schematic definition of the variables in equation 1.......................................................... 32
Figure 21: Rear panel of the labview program written for actuation tests ....................................... 33
Figure 22: Front panel of the labview program written for actuation tests ...................................... 33
Figure 23: Rear panel of the labview program written for fatigue test ............................................. 35
Figure 24: Front panel of the labview program written for fatigue tests .......................................... 36
Figure 25: Scanning electron microscope (SEM) ................................................................................ 37
Figure 26. Comparison between actuation behaviors of the SME wire at 1.2 A, 4% of stroke and
different applied stress (200MPa, 400MPa, 600MPa and 700MPa). ................................................ 38
Figure 27. Comparison between actuation behaviors of the SME wire at 4% of stroke, 200MPa of
stress and different currents (0.8A, 1A and 1.2A). ............................................................................. 39
6
Figure 28. Comparison between actuation behaviors of the SME wire at 1.2 A, 200MPa of stress
and different strokes (1%, 2%, 3% and 4%). ...................................................................................... 40
Figure 29. Comparison between actuation behaviors of the SME wire at 4%, 200MPa of stress and
different types of ramp signals (0.075V/s, 0.37V/s and 0.75 V/s). .................................................... 41
Figure 30. Comparison between actuation behaviors of the HP-SME wire at 1.2 A, 4% of stroke and
different applied stress (200MPa, 400MPa, 600MPa and 700MPa). ................................................ 42
Figure 31. Comparison between actuation behaviors of the HP-SME wire at 4% of stroke, 600MPa
of stress and different currents (0.8A, 1A and 1.2A). ......................................................................... 43
Figure 32. Comparison between actuation behaviors of the HP-SME wire at 1.2 A, 600MPa of stress
and different strokes (1%, 2%, 3% and 4%). ...................................................................................... 43
Figure 33. Comparison between actuation behaviors of the HP-SME wire at 4%, 600MPa of stress
and different types of ramp signals (0.075V/s, 0.37V/s and 0.75 V/s). ............................................. 44
Figure 34: Comparison between actuation behaviors of the HP-SME and SME wires at 4% of stroke
and 200MPa of stress. ........................................................................................................................ 45
Figure 35: Comparison between actuation behaviors of the HP-SME and SME wires at 4% of stroke
and 400MPa of stress. ........................................................................................................................ 46
Figure 36: Comparison between actuation behaviors of the HP-SME and SME wires at 4% of stroke
and 600MPa of stress. ........................................................................................................................ 47
Figure 37: Comparison between actuation behaviors of the HP-SME and SME wires at 4% of stroke
and 700MPa of stress. ........................................................................................................................ 47
Figure 38. Resistivity and actuation path of the SME wire vs. Time .................................................. 48
Figure 39: Resistivity of the SME wire vs Strain ................................................................................. 49
Figure 40. Resistivity and actuation path of the HP-SME wire vs. Time ............................................ 49
Figure 41: Resistivity of the HP-SME wire vs Strain ........................................................................... 50
Figure 42. Comparison between resistivity of the HP-SME and SME wires upon heating ................. 50
Figure 43: Maximum and minimum strains of the SME wire during fatigue test ............................. 52
Figure 44: Maximum and minimum strains of the HPSME wire during fatigue test ......................... 53
Figure 45. Comparison between actuation behaviors of the SME wire after different number of
cycles .................................................................................................................................................. 54
Figure 46. Comparison between actuation behaviors of the SME wire after different number of
cycles (peaks are zoomed) ................................................................................................................. 55

7
Figure 47. Comparison between actuation behaviors of the HP-SME wire after different number of
cycles .................................................................................................................................................. 56
Figure 48. Comparison between actuation behaviors of the HP-SME wire after different number of
cycles (peaks are zoomed) ................................................................................................................. 56
Figure 49. Comparison between actuation behaviors of HP-SME and SME wires before TMC ......... 57
Figure 50. Comparison between actuation behaviors of HP-SME and SME wires after 100 cycles .. 58
Figure 51. Comparison between actuation behaviors of HP-SME and SME wires after 1000 cycles 58
Figure 52. Comparison between actuation behaviors of HP-SME and SME wires after 7500 cycles 59
Figure 53. DSC thermogram of the SME wire before TMC ................................................................. 60
Figure 54. DSC thermogram of SME wire after TMC ......................................................................... 61
Figure 55. Comparison between DSC thermograms of SME wire before and after TMC .................. 61
Figure 56. DSC thermogram of the HP-SME wire before TMC ........................................................... 62
Figure 57: DSC thermogram of the HP-SME wire after TMC ............................................................. 63
Figure 58: Comparison between DSC thermogram of HP-SME wire before and after TMC .............. 63
Figure 59. Comparison between stress-strain curves of the SME wire upon loading/unloading
(before and after TMC) ...................................................................................................................... 64
Figure 60. Stress-strain curve of the HP-SME wire upon loading/unloading (before TMC) .............. 65
Figure 61. Fracture surface of the HP-SME wire ................................................................................ 66
Figure 62. Crack initiation and propagation from the proximity of the external surface. ................. 67
Figure 63. Ductile fracture surface characterized by micro-void coalescence ................................... 67

8
ABSTRACT
Shape memory alloys (SMAs) are widely used in technological applications due to their
unique properties. Recently, many investigations have been done to improve the
performance of SMA wires as thermal actuators. Near-equiatomic Nickel-Titanium
alloys are the most employed materials for this purpose because of their cycling
stability and their large recoverable strain values. Consequently, a comprehensive
evaluation of their actuation behavior and their fatigue resistance could be very useful
for their optimal use. In doing so, an experimental rig able to perform this purpose was
constructed. In particular, the changes in actuation response of the SMA wires were
studied by varying the functioning parameters such as stress, strain, current and shape
of the current pulse (step and ramp). The thermo-mechanical fatigue tests were
carried out on SMA wires to study the changes of functional properties of the wires.
During the fatigue test, the actuation behaviors of the wires were compared within
different number of cycles (1st, 100th, 1000th and 7500th). Tensile tests in the pseudo-
elastic regime were done on SMA wires before and after cycling in order to observe
the noticeable changes in stress-strain curve. Changes in resistivity of the wires during
the heating process were investigated and compared. The DSC scans were performed
on SMA wires before and after cycling in order to observe the transformation
temperature changes. Finally fracture surfaces were analyzed by scanning electron
microscope.
Keywords: Shape memory alloys, SMA, thermo-mechanical cycling, functional fatigue, NiTi.

9
SOMMARIO
Le leghe a memoria di forma (SMA), grazie alle loro uniche proprietà, sono
ampiamente utilizzate in molte applicazioni tecnologiche. Recentemente, molti studi
sono stati effettuati per migliorare le prestazioni di fili SMA utilizzati come attuatori
termici. Le leghe quasi-equiatomiche di Nichel-Titanio sono i materiali più utilizzati a
questo scopo per via della loro stabilità al ciclaggio e le loro capacità di recuperare
grandi valori di deformazione. Di conseguenza, una valutazione completa della loro
risposta quando attuati elettricamente e la loro resistenza a fatica potrebbe essere
molto utile per il loro uso ottimale. Quindi, un apparato sperimentale in grado di
effettuare tale tipologie di prove è stato progettato e costruito. In particolare, i
cambiamenti nella risposta di fili SMA sono stati studiati variando i parametri di
attuazione come stress, strain recuperato, intensità di corrente e la forma dell'impulso
elettrico. Prove di fatica termo-meccanica sono state effettuate su fili SMA per
studiare le variazioni delle loro proprietà funzionali. Durante le prova di fatica, i
comportamenti dei fili soggetti ad attuazione tramite stimolo elettrico sono stati
confrontati dopo un diverso numero di cicli (1, 100, 1000 e 7500 cicli). Prove di
trazione e DSC prima e dopo il ciclaggio termomeccanico sono stati fatti su fili SMA per
osservare i notevoli cambiamenti delle proprietà termiche e meccaniche indotti dal
ciclaggio. Infine, variazioni resistività dei fili durante il processo di riscaldamento sono
stati studiati e confrontati.
Parole chiave: leghe a memoria di forma, SMA, ciclaggio termo-meccanico, fatica
funzionale, NiTi.
10
Chapter 1: Introduction
A shape memory alloy (SMA) is a metallic material that can memorize its original
shape. When these materials are deformed under an external load, they are able to re-
store their pre-deformed shape upon heating (shape memory effect) or unloading
(super-elastic effect) [1]. These two effects will be discussed in the following sub-
chapters.
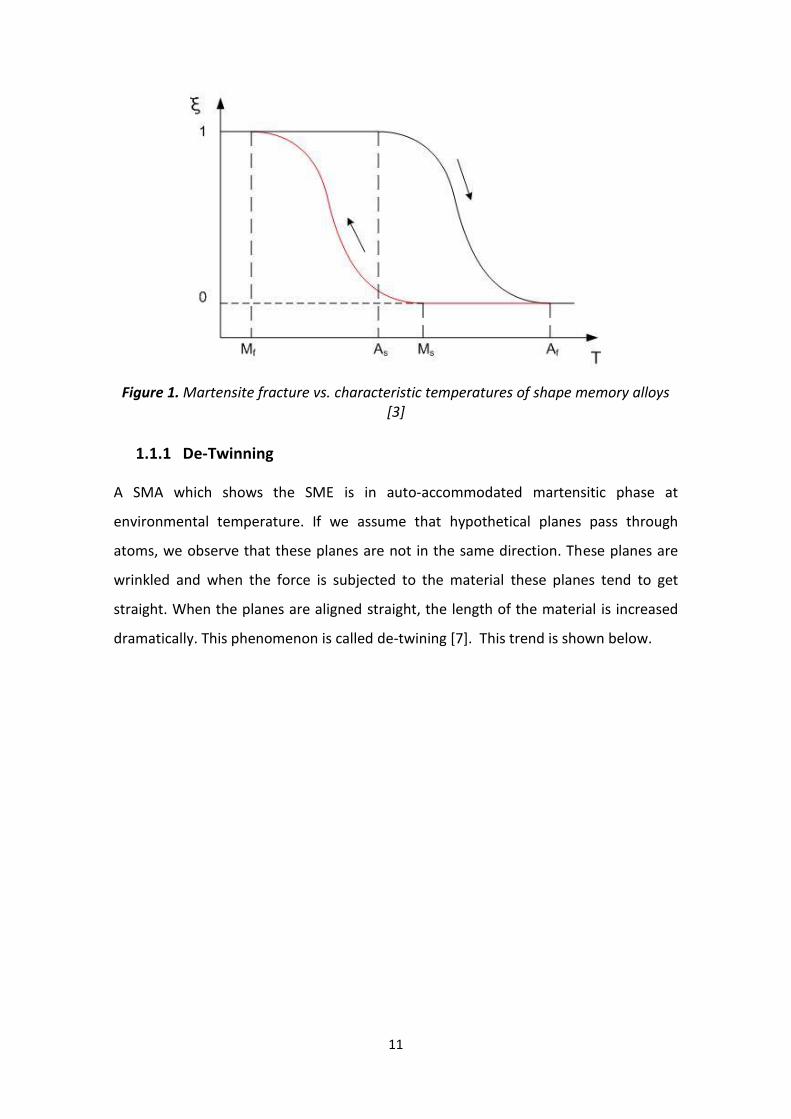
1.1 Shape Memory Effect
A shape memory alloy is in austenitic phase at high temperatures and in martensitic
phase at low temperatures. If at room temperature a SMA is martensitic, it shows the
so-called Shape Memory Effect (SME). When a martensitic SMA at room temperature
is subjected to an external force, then it is deformed. So, angles and distances
between atoms change but the material still remains in martensitic phase. This
phenomenon is called de-twinning of martensite, and will be described in subchapter
1.1.1. When the material is heated above the “austenite start” temperature ( ), it
starts to transform from martensitic phase towards the austenitic phase. This process
is continued while the whole amount of martensitic phase is transformed into the
austenitic one. The temperature that all the martensitic phase is transformed into
austenitic phase is called “austenite finish” temperature ( ) [1]. In the new
microstructural configuration the whole macroscopic deformation is recovered. If the
material in austenitic phase is cooled the martensitic phase appears again. The
temperatures in which the martensite starts creating until completion of the
transformation are named (Martensite start) and (Martensite finish)
respectively. See figure 1.
11
Figure 1. Martensite fracture vs. characteristic temperatures of shape memory alloys [3]
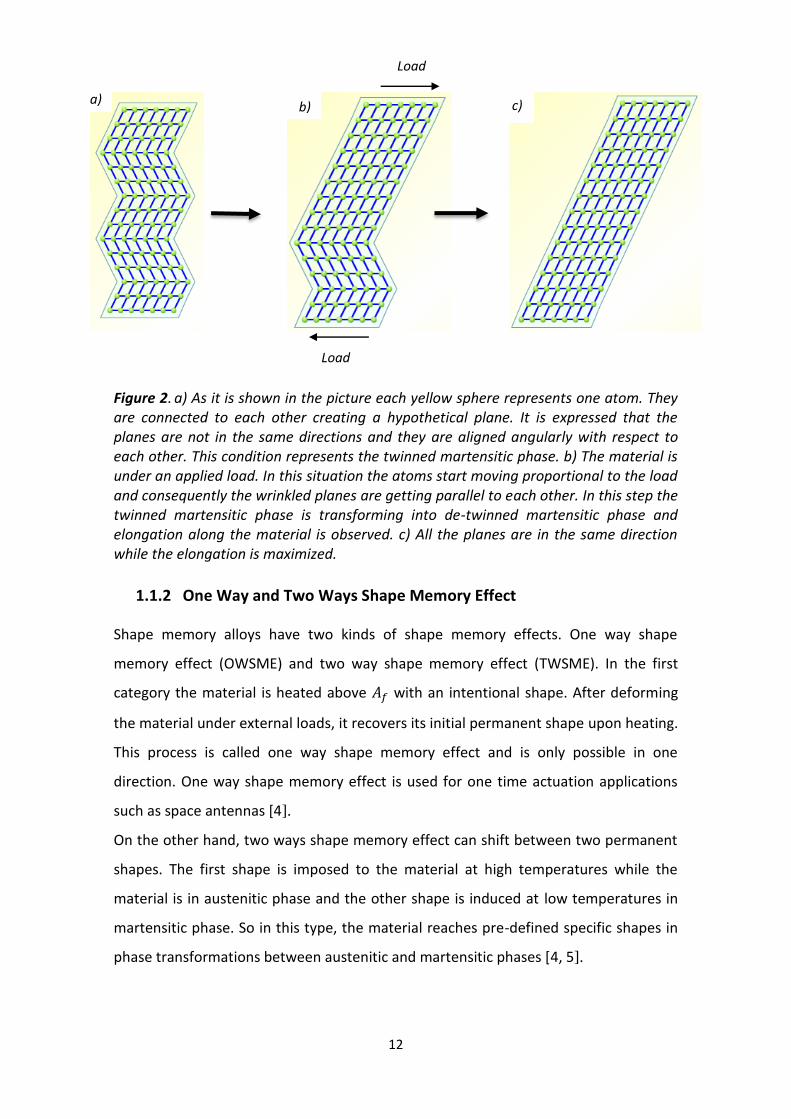
1.1.1 De-Twinning
A SMA which shows the SME is in auto-accommodated martensitic phase at
environmental temperature. If we assume that hypothetical planes pass through
atoms, we observe that these planes are not in the same direction. These planes are
wrinkled and when the force is subjected to the material these planes tend to get
straight. When the planes are aligned straight, the length of the material is increased
dramatically. This phenomenon is called de-twining [7]. This trend is shown below.
12
Figure 2. a) As it is shown in the picture each yellow sphere represents one atom. They are connected to each other creating a hypothetical plane. It is expressed that the planes are not in the same directions and they are aligned angularly with respect to each other. This condition represents the twinned martensitic phase. b) The material is under an applied load. In this situation the atoms start moving proportional to the load and consequently the wrinkled planes are getting parallel to each other. In this step the twinned martensitic phase is transforming into de-twinned martensitic phase and elongation along the material is observed. c) All the planes are in the same direction while the elongation is maximized.
1.1.2 One Way and Two Ways Shape Memory Effect
Shape memory alloys have two kinds of shape memory effects. One way shape
memory effect (OWSME) and two way shape memory effect (TWSME). In the first
category the material is heated above with an intentional shape. After deforming
the material under external loads, it recovers its initial permanent shape upon heating.
This process is called one way shape memory effect and is only possible in one
direction. One way shape memory effect is used for one time actuation applications
such as space antennas [4].
On the other hand, two ways shape memory effect can shift between two permanent
shapes. The first shape is imposed to the material at high temperatures while the
material is in austenitic phase and the other shape is induced at low temperatures in
martensitic phase. So in this type, the material reaches pre-defined specific shapes in
phase transformations between austenitic and martensitic phases [4, 5].
Load
Load
a) b) c)
13
1.2 Super-elasticity
The other property of shape memory materials is the super-elasticity, which is also
called pseudo-elasticity. Pseudo-elastic materials have the capability to restore their
original shape after removal of the external forces. When these materials are under an
external force they are subjected to be deformed. These kinds of materials have the
ability to recover high value deformations (up to 10%) [16-20, 22]. The shape memory
materials have a pseudo-elastic behavior when they are in austenitic phase at the
operating temperatures. In this condition, i.e. temperature above , the material is
deformed under an external load and the austenitic phase is transformed towards the
stress-induced-martensite (SIM). In the other words, the driving force for this
transformation is the stress applied. Upon unloading due to the instability of the
martensite in temperatures above , the reverse phase transformation occurs. So the
material recovers its pre-deformed shape and super-elastic behavior is observed [2].
Actually, when the pseudo-elastic material reverts to its pre-deformed shape, it does
not totally recover the shape and some defects are introduced in the lattice. In the
stress-induced martensite condition if the excessive strain is applied, the material goes
through the plastic region and reforming process will be irreversible [10].
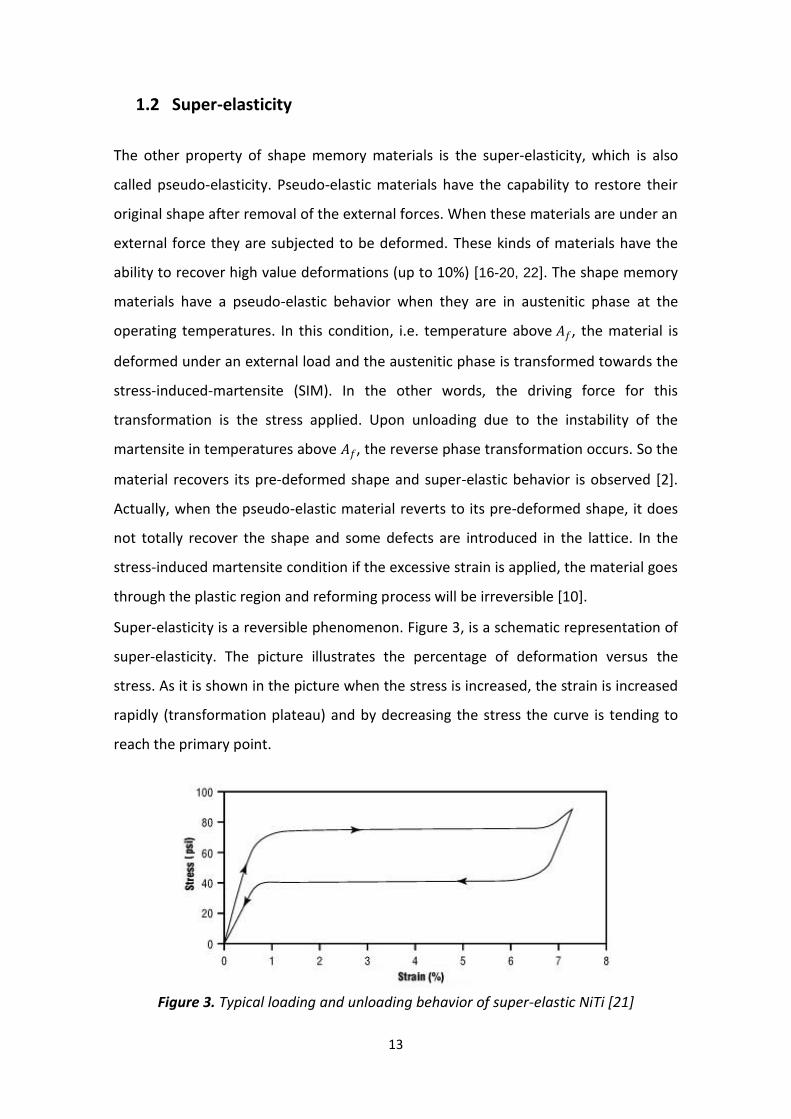
Super-elasticity is a reversible phenomenon. Figure 3, is a schematic representation of
super-elasticity. The picture illustrates the percentage of deformation versus the
stress. As it is shown in the picture when the stress is increased, the strain is increased
rapidly (transformation plateau) and by decreasing the stress the curve is tending to
reach the primary point.
Figure 3. Typical loading and unloading behavior of super-elastic NiTi [21]

14
1.3 High Performance Shape Memory Effect (HP-SME)
As above-mentioned, SMAs are typically classified into two classes in absence of
external load and environmental temperature condition.
1) Martensitic SMAs at room temperature. These types of the SMAs show a shape
memory effect (SME) in their attributes and they are mostly employed in actuators.
2) Austenitic SMAs at room temperature. Super-elastic behavior is observed and they
are mainly used in biomedical field and damping applications [23].
NiTi alloys are the most common SMAs. The chemical composition has the greatest
effect on the phase transition temperature. So that, this temperature could be
controlled by increase and decrease the Ni-content. Ni-rich alloys exhibit austenitic
phase at RT while Ti-rich alloys show a martensitic phase. To be precise if the Ni
content is lower than 50.4% the martensitic phase is observed at RT.
Recently, it has been shown that the Ni-rich SMAs with a fully austenitic phase at RT
can be used as actuators exploiting a new phenomenon called high performance shape
memory effect (HP-SME). By HP-SME, high functional performances can be achieved
(ability to recover strain up to 5-6% under a constant stress (1GPa)), much higher
those shown by conventional shape memory alloys (SME). When the material in
austenitic phase is under stress at RT, by exceeding the stress from a critical level, the
phase is transformed into stress induced martensitic phase (SIM. By increasing the
temperature the SIM is transformed to austenitic phase and pre-deformed shape of
the material is appeared. When the material is cooled down to RT due to the applied
stress the SIM is re-produced again. This is the thermo-mechanical cycle exploited by
HP-SME [23].
1.4 Discovery and Applications
The NiTi was first discovered in Naval Ordnance Laboratory by Buehler and coworkers
in 1963 while they were researching on useful materials and their utilization for heat
shielding systems used in missiles cone [8]. NiTi is also known as NiTiNOL. The term
“NOL” is added to NiTi in order to show the honor of this discovery by Naval Ordnance
Laboratory. NiTiNOL alloys have very good mechanical properties while they have a
shape recovery behavior in their attributes. So, this is the reason that they are used in
a large number of applications and also as shape memory wires. In 1965 studies

15
showed that if a third element is added to NiTi alloys the transformation temperature
is decreased dramatically. In doing so, Co and Fe were added to NiTi and the first
industrial application of shape memory alloys created. For the first time SMAs were
used in the piping system of a fighter airplane F-14. The pipes had a very low
transformation temperature. So, first they were floated in liquid Nitrogen then
coupled into each other at room temperature. When the pipes were heated in the
environment, they started a transformation from martensitic phase to austenitic
phase and consequently the pipes were fixed into each other [9].
As we know shape memory alloys have the capability to recover their original shape
after deformations. This behavior causes tens of applications performed by these
alloys in fields of automotive, medical, aerospace and etc. One of the practical
applications of SMAs is super-elastic stents. These stents have an excellent
biocompatibility and corrosion resistance. For this reason, they are mostly used in
medical applications where a hole or duct needs to be held open inside the body.
Stents are in martensitic phase at room temperature and capable to be tightly
compressed while being guided into the body. After positioning the stent in the proper
location, due to high temperature inside the body they spring back to their larger
shape and widen block passages in the body of patient [10].
Figure 4. Biocompatible stents
The other commercial use of SMAs is self-heating vehicle where the shape memory
material is embedded in the structure of the bumper. In accidents when the bumper is
damaged it can detect the damage and regain its original shape after heating.

16
Nowadays due to their high response time shape memory alloys are used in low
frequency cyclic applications. High frequency applications could be achieved by
reducing the dimension of the SMA material e.g. wire diameter or using another class
of SMAs called magnetic shape memory alloys. Magnetic shape memory alloys
(MSMAs) or ferromagnetic shape memory alloys (FMSMAs) are a class of materials
that exhibit large strains (up to 9%) when they are under an applied magnetic field
[11]. In comparison with the typical shape memory alloys, MSMAs have the possibility
to actuate in high frequency applications while the operating temperature is quite low.
They are very brittle and only recommended for actuation force applications [1].
The advantages of SMAs such as lower cost, higher manufacturability, and easy
machining methods, are the reasons that made shape memory alloys a good candidate
for different range of applications. Some of their applications are nominated as air
conditioning systems, actuating systems, vibration dampers, electronic cable
connectors and a variety of other applications. The other groups of applications are in
aerospace and oil industries while the environmental temperature is high. So, another
class of SMAs is introduced as HTSMAs (high temperature shape memory alloys) while
the transformation temperature is more than 100 °C in this type of the applications
[9].
SMAs are also widely used in aerospace industries. The helicopter blades and aircraft
wings have the main role in maneuverability and controllability of the airplane. So,
they would be able to change their shape while SMAs are used in the surfaces of the
components and consequently the mentioned factors and parameters such as drag, lift
and twist could be manipulated [12, 13]. Space antennas are the other groups of
applications in aerospace field. Shape memory alloys are used in their substructures.
Through their manufacturing process they are first deformed at low temperatures.
When the antenna is launched into space the solar heating increases the temperature
above transformation temperature and it recovers its permanent shape [14, 15].
One of the commercial applications of SMAs is observed in DuralFLEX eyeglasses. The
frame of these glasses is shaped at temperature slightly above the transformation
temperature and after removal the stress due to phase transformations between
stress induced martensitic phase and austenitic phase it reverts to its pre-deformed
shape immediately [9].

17
Figure 5. DuraFLEX eyeglasses.
1.4.1 SMA Actuators
Shape memory effect is used in SMA actuators in order to produce motion in response
to temperature changes [10]. Based on how the thermal energy is provided, SMA
actuators can be classified into two categories:
1) The SMA actuators which show the shape change after an increase in temperature
of the environment.
2) The SMA actuators which are heated purposely to complete the desired action.
Mostly electrical current, hot fluid or gas is used as thermal energy resource [24].
A unique combination of properties in shape memory actuators such as high
power/weight ratio, silent operation, long stroke and small size lead to a large range of
applications for NiTi actuators [24, 25]. However, most of the aforementioned
actuators are linear i.e. the output of displacement is equal to the deformation of the
shape memory material [26]. To design the SMA actuators, wires with diameter of tens
of microns could be employed. Recently they are proposed to produce mechanical
autofocus and optical image stabilization devices for small cameras [27]. In aerospace
field, SMA actuators could be applied as an important component of future space
vehicles, aircrafts and helicopters. For instance, they could be used as thrust vector
adjusting systems or altitude control of manned or unmanned space vehicles [28].
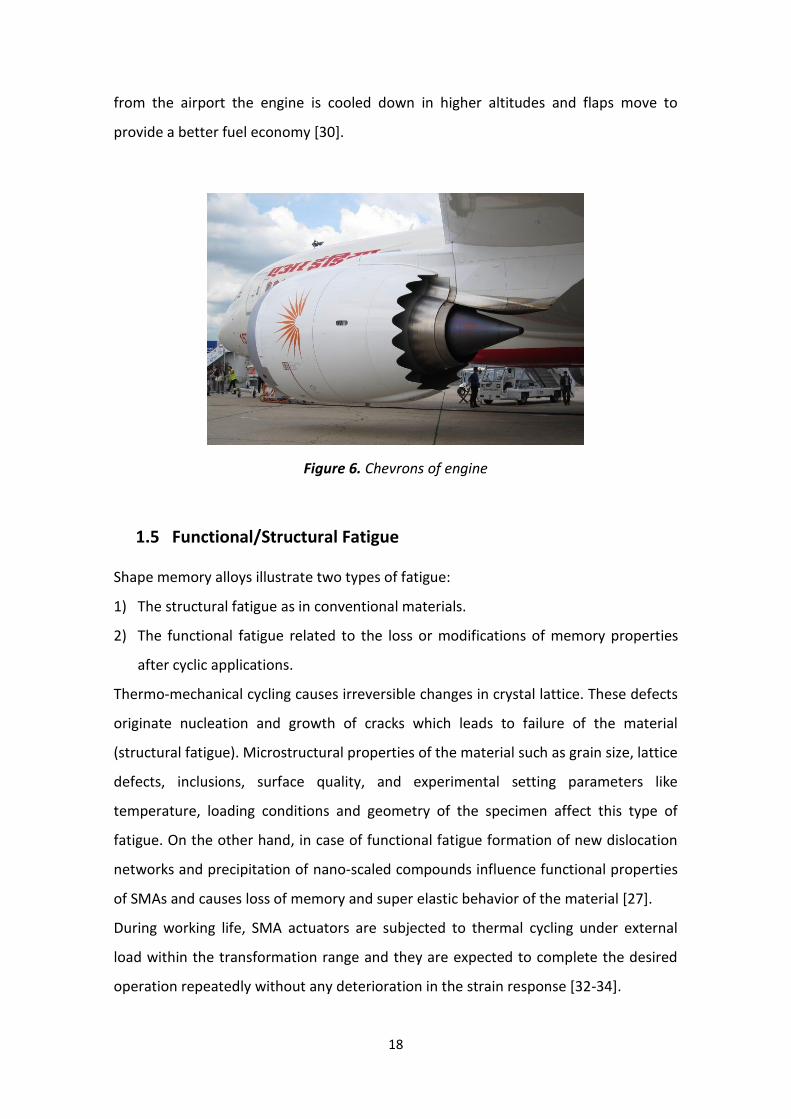
Nowadays, the Boing Company applied SMA actuators on small chevrons of the trailing
edge of the engine. The chevrons move with varying the temperature. On take of
when the engine is working with almost maximum power, the chevrons move into a
position which makes the engine run more quietly. The transportation of chevrons is
due to high temperature of the engine. On the other hand when the airplane is away
18
from the airport the engine is cooled down in higher altitudes and flaps move to
provide a better fuel economy [30].
Figure 6. Chevrons of engine
1.5 Functional/Structural Fatigue
Shape memory alloys illustrate two types of fatigue:
1) The structural fatigue as in conventional materials.
2) The functional fatigue related to the loss or modifications of memory properties
after cyclic applications.
Thermo-mechanical cycling causes irreversible changes in crystal lattice. These defects
originate nucleation and growth of cracks which leads to failure of the material
(structural fatigue). Microstructural properties of the material such as grain size, lattice
defects, inclusions, surface quality, and experimental setting parameters like
temperature, loading conditions and geometry of the specimen affect this type of
fatigue. On the other hand, in case of functional fatigue formation of new dislocation
networks and precipitation of nano-scaled compounds influence functional properties
of SMAs and causes loss of memory and super elastic behavior of the material [27].
During working life, SMA actuators are subjected to thermal cycling under external
load within the transformation range and they are expected to complete the desired
operation repeatedly without any deterioration in the strain response [32-34].

19
In recent years, several methods were proposed to stabilize shape memory properties
of wires in order to reduce the effects of functional fatigue. Defects are introduced
intentionally in crystal lattice by thermic and/or mechanical treatments [34]. Hence,
fatigue of SMAs and their training are strictly correlated and the goal consists in
finding an appropriate microstructure and a right balance between lattice defects and
precipitates in order to obtain excellent shape memory properties and an acceptable
fatigue behavior [27].
20
Chapter 2: Aim of the Thesis
The shape memory wires are used as thermal actuators and subjected to thermo-
mechanical cycling (TMC). Consequently a comprehensive evaluation on their fatigue
behavior could be much useful on the way of their optimization. In addition, several
are the parameters to set in order to exploit at best the shape memory properties of
SMA wires for actuators, i.e. the applied stress, the recoverable strain, the applied
current, the restoring time, etc. Then, the study of the actuation cycle could be
interesting for a better use of SMA in actuators.
That said, this thesis is aimed at designing and assembling a machine able to study the
functional and structural fatigue of SMA wires and to investigate their actuation
response when they are subjected to actuation cycles under different working
conditions. The following subjects were investigated in this thesis:
Actuation behavior of HP-SME and SME wires changing the functioning parameters
such as applied stress, strain, current and current pulse type (step or ramp).
Changes in strain recovered of HP-SME and SME wires through thermo-mechanical
fatigue tests.
Changes in actuation behavior of HP-SME and SME wires after different number of
thermo-mechanical cycles.
Resistivity changes of HP-SME and SME wires during heating process.
Changes of stress-strain curve of shape memory wires before and after TMC.
Changes of phase transformation temperatures in HP-SME and SME wires before
and after TMC.
Fracture surface analyses.

21
Chapter 3: Materials and experimental methods
3.1 Materials
In our experiments, two types of shape memory wires i.e. Ni-rich NiTi (HP-SME) and Ti-
rich NiTi (SME) were used. The diameter of both types of wires was equal to 300µm
and their length of the samples at the beginning of each test was ranging between
85mm to 110mm. The wires were covered by oxide.
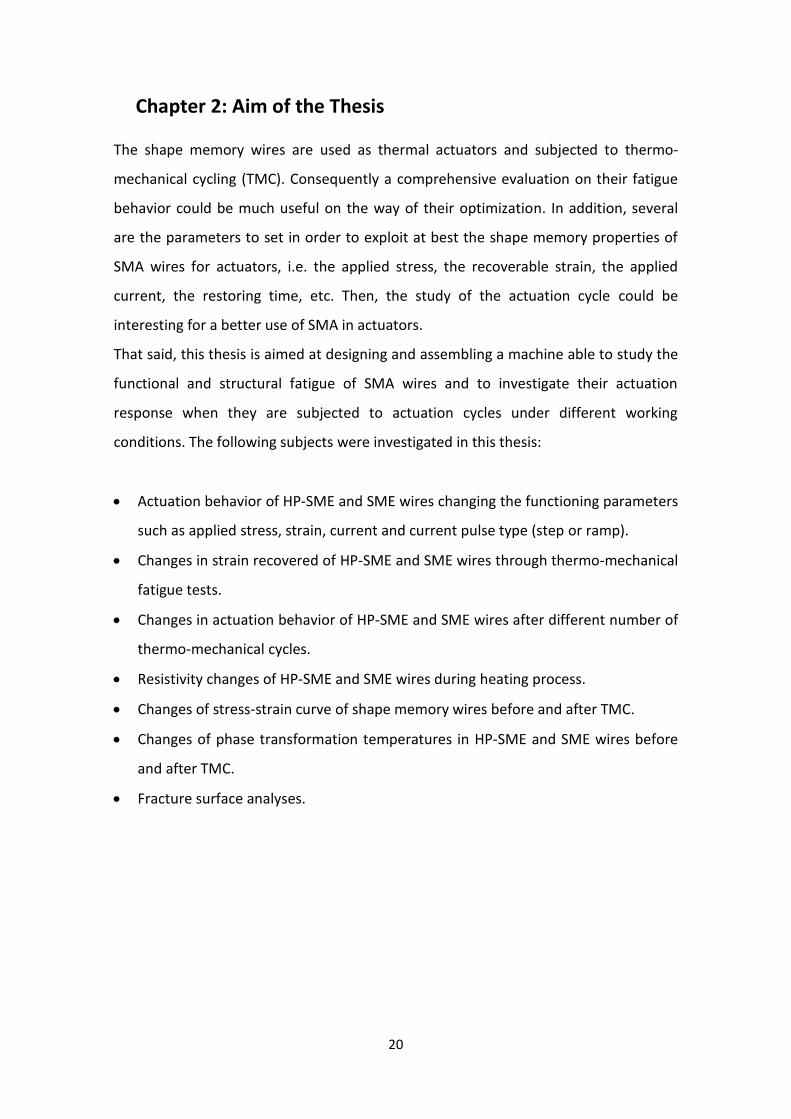
3.2 DSC Test
Differential scanning calorimetry analysis (DSC) was performed on both HP-SME and
SME wires before and after TMC. A TA INSTRUMENT Q100 shown in figure 7 was used
for this purpose. The differential scanning calorimeter (DSC) is a fundamental tool in
thermal analysis. It can be used in many industries such as pharmaceuticals and
polymers, nano-materials and food products [35]. Differential scanning calorimetry or
DSC is a thermoanalytical technique in which the difference in the amount of heat
required to increase the temperature of a sample and reference is measured as a
function of temperature. Both the sample and reference are maintained at nearly the
same temperature throughout the experiment. Generally, the temperature program
for a DSC analysis is designed such that the sample holder temperature increases
linearly as a function of time. The reference sample should have a well-defined heat
capacity over the range of temperatures to be scanned [36]. To perform the DSC test,
about 20mg of both wires were cut into very small pieces and located in an aluminum
pan. An empty aluminum pan and the one including the sample were placed in the test
machine. The DSC test machine varied the temperature from -150°C to 150°C and the
amount of heat needed to increase the temperature of the sample over the range of
temperatures was obtained.
22
Figure 7. TA INSTRUMENT Q100 DSC test machine
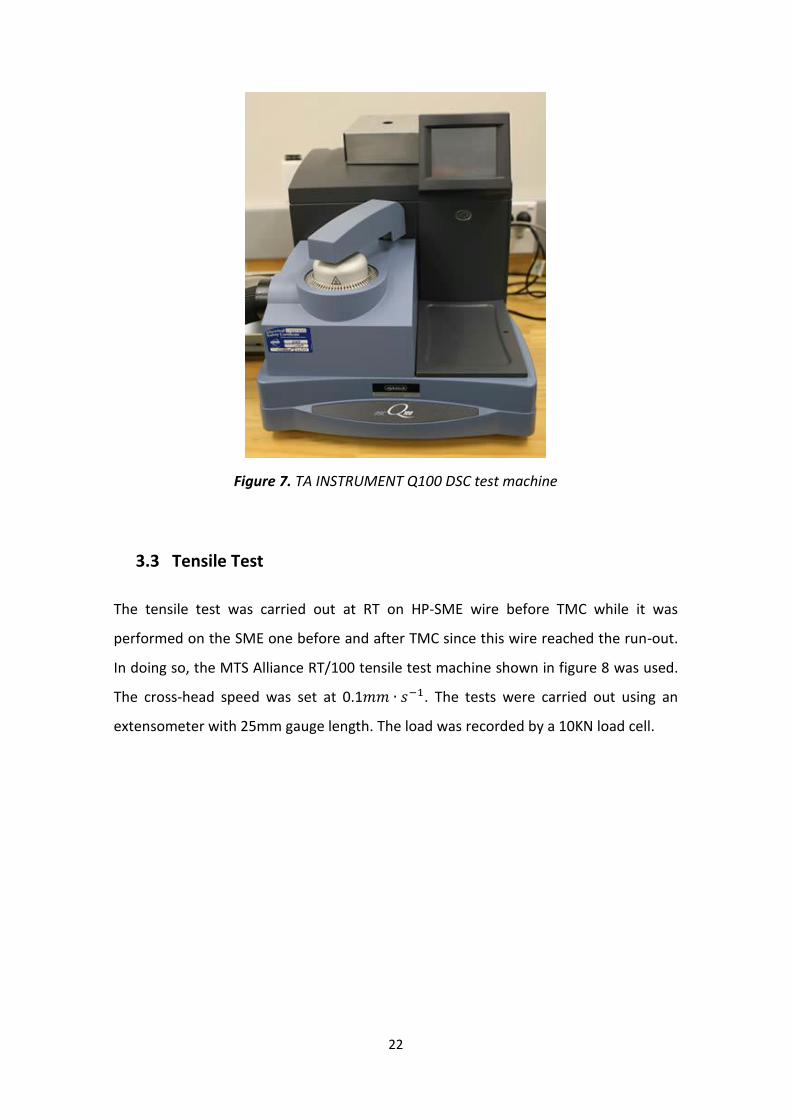
3.3 Tensile Test
The tensile test was carried out at RT on HP-SME wire before TMC while it was
performed on the SME one before and after TMC since this wire reached the run-out.
In doing so, the MTS Alliance RT/100 tensile test machine shown in figure 8 was used.
The cross-head speed was set at 0.1 . The tests were carried out using an
extensometer with 25mm gauge length. The load was recorded by a 10KN load cell.
23
Figure 8. MTS Alliance RT/100 tensile test machine
3.4 Experimental apparatus for fatigue and actuation tests
Since the main aim of the thesis consisted in design and building an experimental
apparatus to perform fatigue tests and actuation tests on SMA wires. The
experimental rig was made up of the following parts:
Aluminum structure
Clamping system
Insulation plate
Displacement measuring device
System for impact prevention
Load bar
Programmable power supplier
Data acquisition system and PC
The physical characteristics of the components are described hereunder.

24
Aluminum structure
The structure of the machine is made of seven Al profiles ranging from 300mm to
550mm length. They were assembled as shown in figure 7.
Figure 9. Assembled structure of the rig and other components of the apparatus
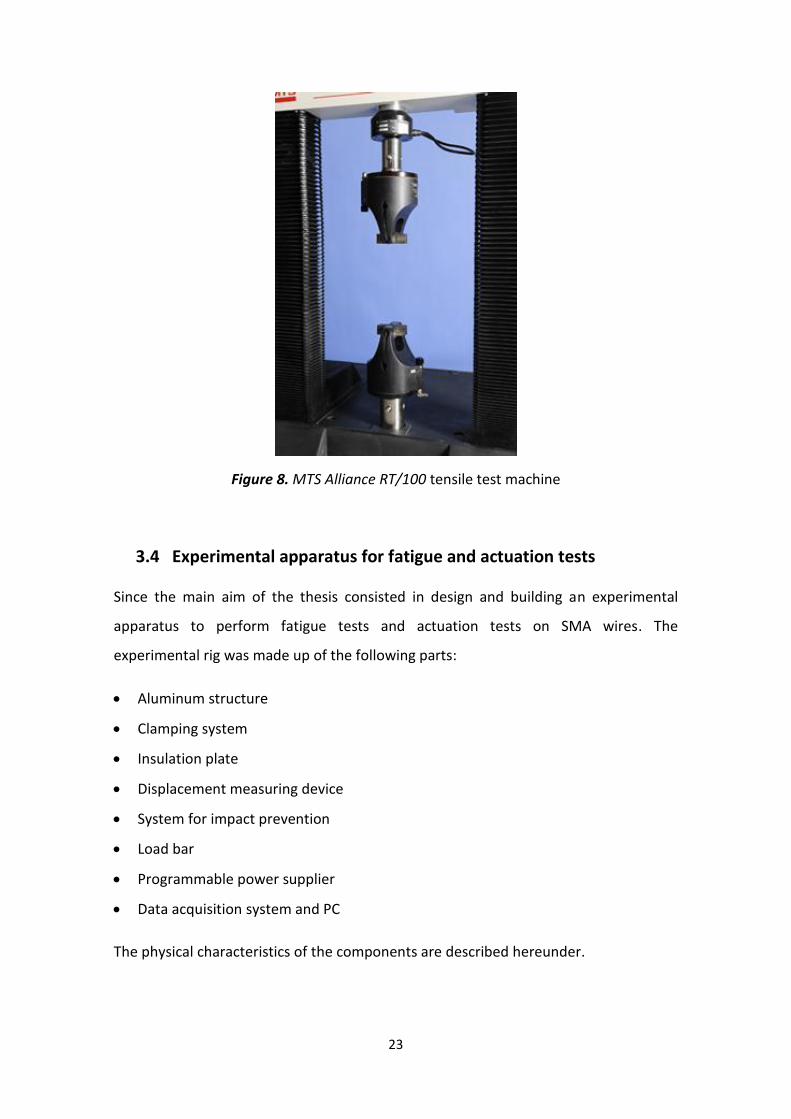
Clamping System
There are several difficulties in clamping a thin wire. For this application, the wire
should be properly fixed from its two ends. In this condition, the stress is imposed to
the wire by the use of a weight. Therefore, the clamping force to the thin wire should
be as low as possible in order to prevent deformation and occurrence of damages of
the wire. On the other hand, the wire should be well constraint in the clamp in order
to prevent its sliding during the experiment. To achieve this goal the clamp in Figure 10
was designed and produced.
25
Figure 10. The shape memory wire blocked inside the clamp
As it is shown in the picture, the wire is blocked in the slot. When the screw is fastened
the sufficient force to hold the wire is provided. By leaving a space between the screw
and slot, a double safety mechanism was introduced that consisted in a bolt with two
washers. In this way, the wire is fixed from two points with negligible damages around
the clamping surfaces. To send the current to the wire, the output cable of the power
supplier was contacted to the clamp. So, the clamp was made of aluminum to conduct
the current to the wire. Two different clamps were designed and prepared for light
and heavy weight experiments.
Insulation Plate
An aluminum plate is mounted on the profile (structure of the machine) by the use of
four bolts. There are two threaded holes on this plate with different diameters in
order to fasten different types of clamps according to the applied load. The plate is
isolated from structure by the use of a plastic insulation plate. This plate prevents the
electrical current to be passed from the shape memory wire sample to the structure.
See figures 11 and 12.

26
Displacement Measuring Device
As discussed in chapter 1, the shape memory wire sample is contracted and expanded
while the current is passing through it. Consequently, to have a comprehensive survey
on strains, we need a device to measure these displacements. In doing so, a short
range distance laser sensor with analogue voltage output and effective measuring
range of 20mm-50mm was used (SICK, OD1-B035H15U14). The proximity sensor was
connected to the data acquisition board (DAQ) via the connecting cable (DOL-0804-
W05M). See figure 13. A DC power supplier (Siemens, 24V) was used for feeding the
laser sensor.
Figure 13. Short range distance sensor with connecting cable
Figure 11. Aluminum upper mounting plate Figure 12. Plastic insulating plate
27
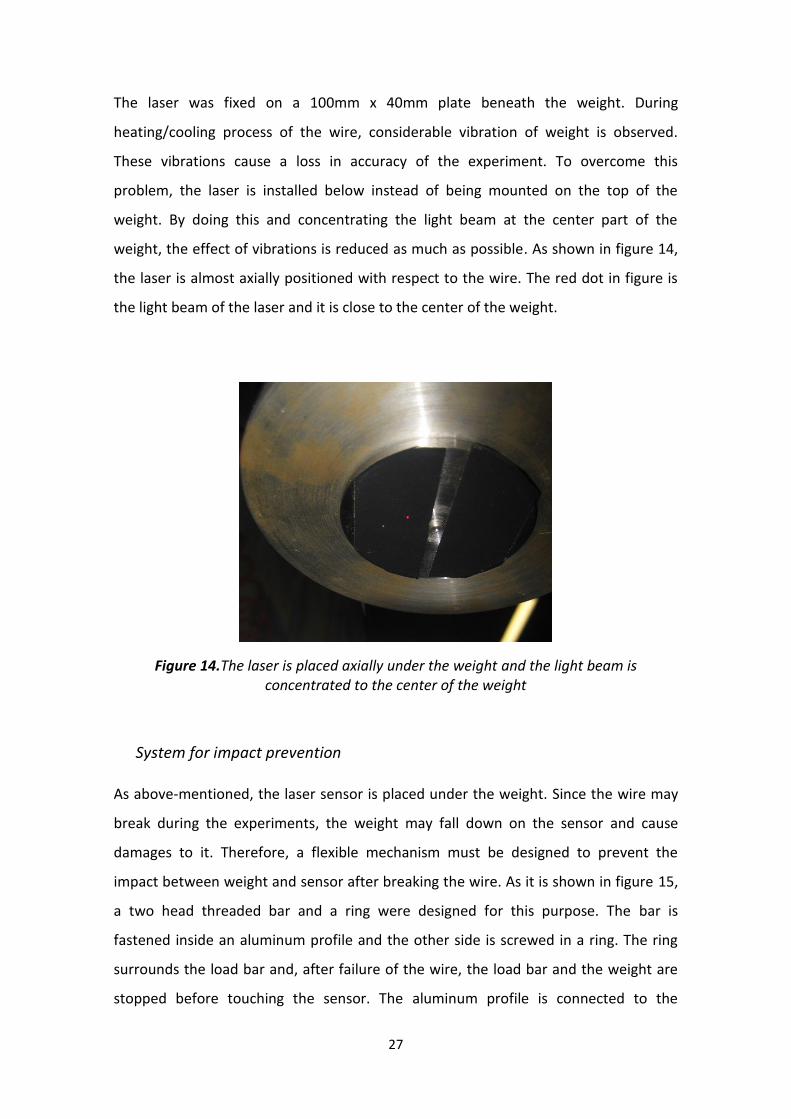
The laser was fixed on a 100mm x 40mm plate beneath the weight. During
heating/cooling process of the wire, considerable vibration of weight is observed.
These vibrations cause a loss in accuracy of the experiment. To overcome this
problem, the laser is installed below instead of being mounted on the top of the
weight. By doing this and concentrating the light beam at the center part of the
weight, the effect of vibrations is reduced as much as possible. As shown in figure 14,
the laser is almost axially positioned with respect to the wire. The red dot in figure is
the light beam of the laser and it is close to the center of the weight.
Figure 14.The laser is placed axially under the weight and the light beam is concentrated to the center of the weight
System for impact prevention
As above-mentioned, the laser sensor is placed under the weight. Since the wire may
break during the experiments, the weight may fall down on the sensor and cause
damages to it. Therefore, a flexible mechanism must be designed to prevent the
impact between weight and sensor after breaking the wire. As it is shown in figure 15,
a two head threaded bar and a ring were designed for this purpose. The bar is
fastened inside an aluminum profile and the other side is screwed in a ring. The ring
surrounds the load bar and, after failure of the wire, the load bar and the weight are
stopped before touching the sensor. The aluminum profile is connected to the

28
structure and consequently the position of the ring could be adjusted by moving the
profile.
Load Bar
The load bar is a two head threaded shaft. One head is screwed to the clamp while the
other head is connected to a small disk where the weights are placed. In this regard,
see figure 16.
Figure 16. Load bar
Figure 15. Impact prevention mechanism with adjustable Al profile connected to the structure
29
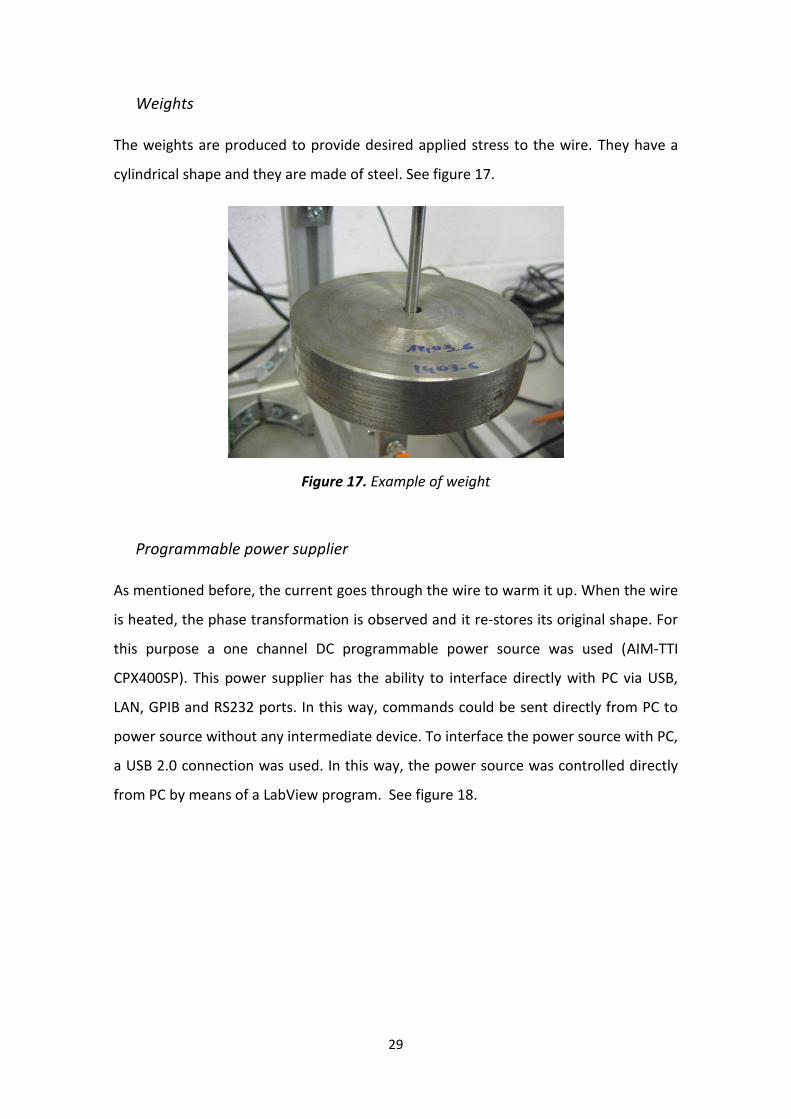
Weights
The weights are produced to provide desired applied stress to the wire. They have a
cylindrical shape and they are made of steel. See figure 17.
Figure 17. Example of weight
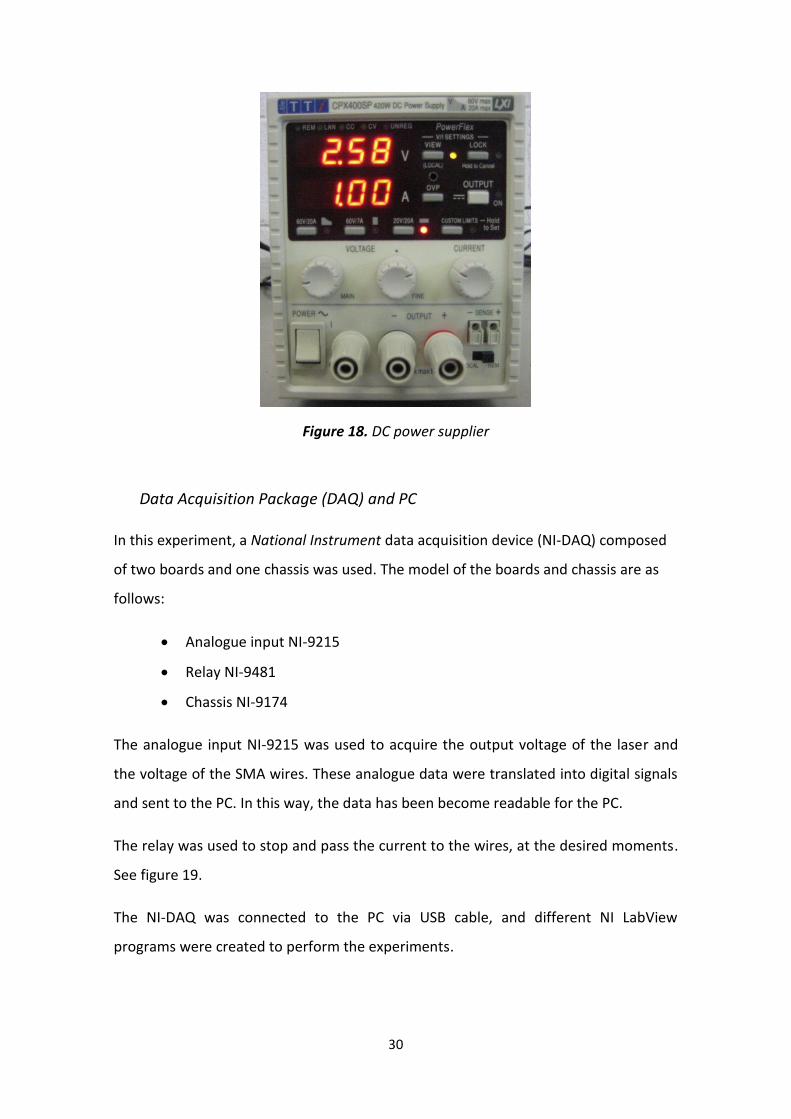
Programmable power supplier
As mentioned before, the current goes through the wire to warm it up. When the wire
is heated, the phase transformation is observed and it re-stores its original shape. For
this purpose a one channel DC programmable power source was used (AIM-TTI
CPX400SP). This power supplier has the ability to interface directly with PC via USB,
LAN, GPIB and RS232 ports. In this way, commands could be sent directly from PC to
power source without any intermediate device. To interface the power source with PC,
a USB 2.0 connection was used. In this way, the power source was controlled directly
from PC by means of a LabView program. See figure 18.
30
Figure 18. DC power supplier
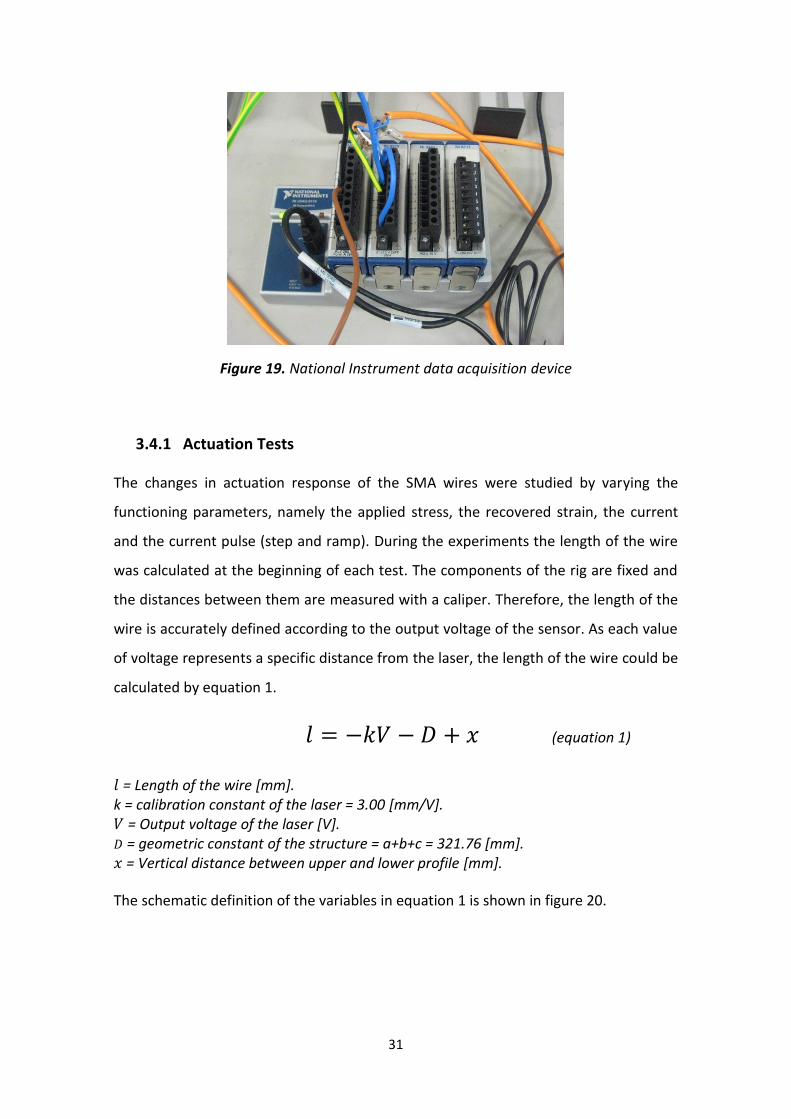
Data Acquisition Package (DAQ) and PC
In this experiment, a National Instrument data acquisition device (NI-DAQ) composed
of two boards and one chassis was used. The model of the boards and chassis are as
follows:
Analogue input NI-9215
Relay NI-9481
Chassis NI-9174
The analogue input NI-9215 was used to acquire the output voltage of the laser and
the voltage of the SMA wires. These analogue data were translated into digital signals
and sent to the PC. In this way, the data has been become readable for the PC.
The relay was used to stop and pass the current to the wires, at the desired moments.
See figure 19.
The NI-DAQ was connected to the PC via USB cable, and different NI LabView
programs were created to perform the experiments.
31
Figure 19. National Instrument data acquisition device
3.4.1 Actuation Tests
The changes in actuation response of the SMA wires were studied by varying the
functioning parameters, namely the applied stress, the recovered strain, the current
and the current pulse (step and ramp). During the experiments the length of the wire
was calculated at the beginning of each test. The components of the rig are fixed and
the distances between them are measured with a caliper. Therefore, the length of the
wire is accurately defined according to the output voltage of the sensor. As each value
of voltage represents a specific distance from the laser, the length of the wire could be
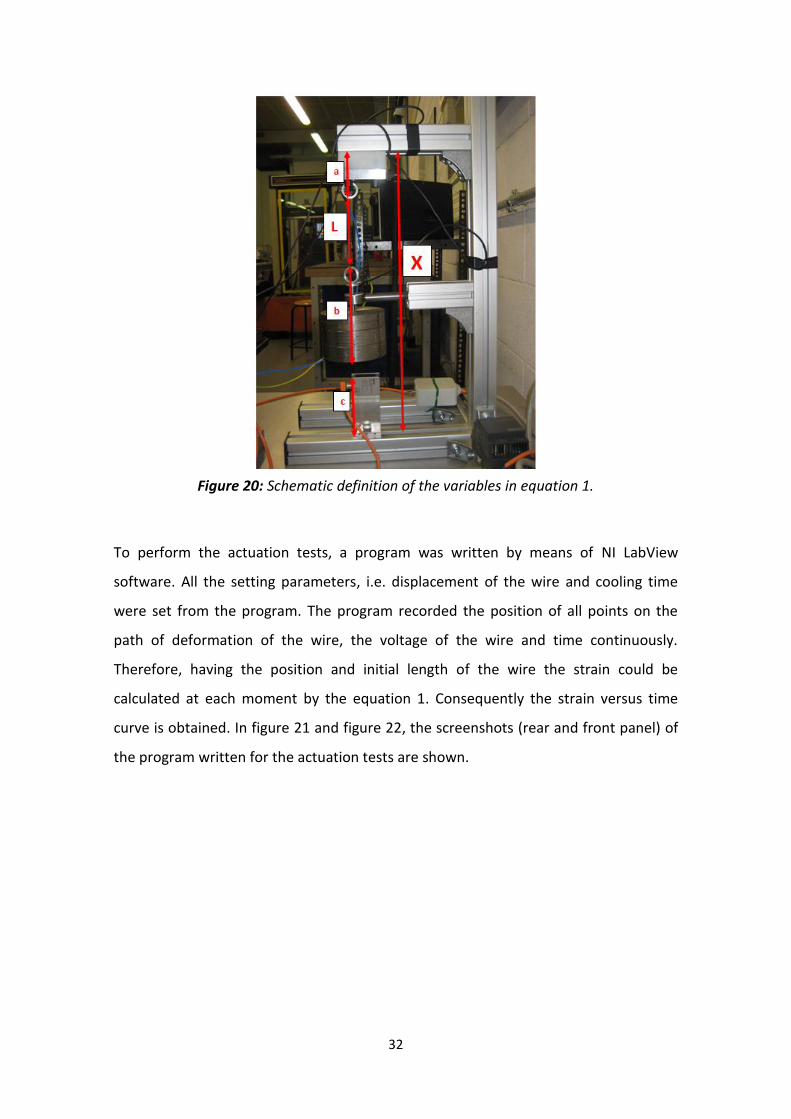
calculated by equation 1.
(equation 1)
= Length of the wire [mm]. k = calibration constant of the laser = 3.00 [mm/V]. = Output voltage of the laser [V]. = geometric constant of the structure = a+b+c = 321.76 [mm]. = Vertical distance between upper and lower profile [mm].
The schematic definition of the variables in equation 1 is shown in figure 20.
32
Figure 20: Schematic definition of the variables in equation 1.
To perform the actuation tests, a program was written by means of NI LabView
software. All the setting parameters, i.e. displacement of the wire and cooling time
were set from the program. The program recorded the position of all points on the
path of deformation of the wire, the voltage of the wire and time continuously.
Therefore, having the position and initial length of the wire the strain could be
calculated at each moment by the equation 1. Consequently the strain versus time
curve is obtained. In figure 21 and figure 22, the screenshots (rear and front panel) of
the program written for the actuation tests are shown.

33
Figure 21: Rear panel of the labview program written for actuation tests
Figure 22: Front panel of the labview program written for actuation tests

34
Another outcome of the actuation test is the change in resistivity of the HP-SME and
SME wires during the heating process. The voltage was recorded continuously during
the heating and the resistivity of the wires was calculated according to equation 2:
(equation 2)
: Resistivity [Ω.m] : Voltage [V] : Current [A] : Diameter [m] : Length [m]
The actuation tests were performed on as received SME and HP-SME wires in order to
evaluate the effect of the different experimental parameters on the functional
properties of the SMA wires. The length of the SME and HP-SME wires was 94.3mm
and 87.8mm, respectively. Step pulse with current equal to 0.8, 1 and 1.2A was used to
actuate the wires under an applied stress of 600 MPa and 200MPa for the HP-SME and
the SME wire, respectively. For this kind of test the strain was constant and equal to
4%. Furthermore, by keeping constant the electrical pulse, a set of tests were carried
out changing the recoverable strain (1%, 2%, 3% and 4%). For this test the applied
stress was 200MPa for the SME wire and 600MPa for the HP-SME wire. The effect of
the applied stress (200MPa, 400MPa, 600MPa and 700MPa) was indeed investigated
by keeping constant the current and the recovered strain at 1,2A and 4%, respectively.
Furthermore, other tests were carried out using a ramp voltage pulses. The voltage
rates were 0.075, 0.37, 0.75 V/s. Stress was constant and equal to 200MPa for the SME
wire and equal to 600MPa for the HP-SME wire. Recovered strain was 4%.
In addition, actuation tests were performed at different stage of thermo-mechanical
fatigue test in order to evaluate the effect of TMC on the actuation behavior of the
SMA wires. In particular, tests were performed after the 1st, 100th, 1000thand 7500th
thermo-mechanical cycle. The recovered strain was 2.3% and the applied stress was
200MPa for the SME wire and 600MPa for the HP-SME one.
35
3.4.2 Thermo-mechanical fatigue tests
The thermo-mechanical fatigue tests were performed on two types of shape memory
wires i.e. SME and HP-SME wires. For this purpose, another Labview program was
written to perform these experiments. The same as the actuation test program, all the
operational parameters, i.e. the displacement of the wire and the cooling time, were
set in the front panel of the LabView program. The difference between program for
actuation test and fatigue one is the type of data that are recorded. As mentioned
before, the actuation test program recorded the length of the wire continuously, while
in case fatigue test, the program only save the maximum and minimum length of the
wire for each heating/cooling cycle. By obtaining the lengths of the wire, the strain is
calculated and the trend of strain versus number of cycles can be investigated. In
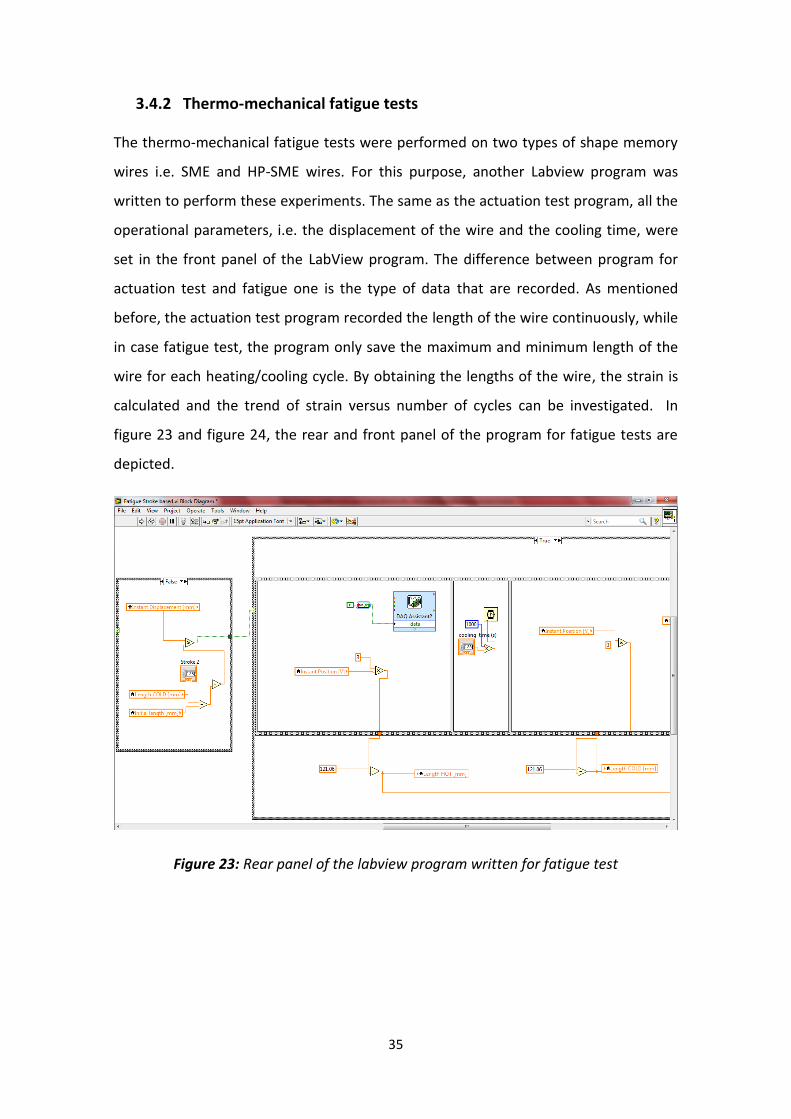
figure 23 and figure 24, the rear and front panel of the program for fatigue tests are
depicted.
Figure 23: Rear panel of the labview program written for fatigue test

36
Figure 24: Front panel of the labview program written for fatigue tests
The length of the SME wire was equal to 86.9mm, the applied stress was 200MPa, and
current was 1A (step pulse). Moreover, the recovered strain was 2.3%. The wire was
cooled down for 10s in order to let it transform back to its martensite phase. The
length of the HP-SME wire was equal to 108mm, the applied stress was 600MPa and
current was 1A (step pulse). As in the previous case, the wire was cooled down for 10s
after that 2.3% of strain was recovered.
The displacement is defined as changes in the length of the wire after heating/cooling
cycles. The strain could be calculated in different ways. In our experiment, the strain
was defined based on the initial length of the wire at RT under the constant applied
stress:
(equation 3)
= Instantaneous length of the wire [mm]
= Initial length of the wire [mm]

37
3.5 Fractography
After failure, the fracture surface of the HP-SME wire was observed by SEM. A
scanning electron microscope (SEM) is a type of electron microscope that produces
images of a sample by scanning it with a focused beam of electrons. The electrons
interact with atoms in the sample, producing various signals that can be detected and
that contain information about the sample's surface topography and composition.
Specimens can be observed in high vacuum, in low vacuum, in wet conditions (in
environmental SEM) [37]. In figure 25, the scanning electron microscope used for
these experiments is illustrated.
Figure 25: Scanning electron microscope (SEM)
38
Chapter 4: Results and Discussion
4.1 Actuation Tests
SME wire
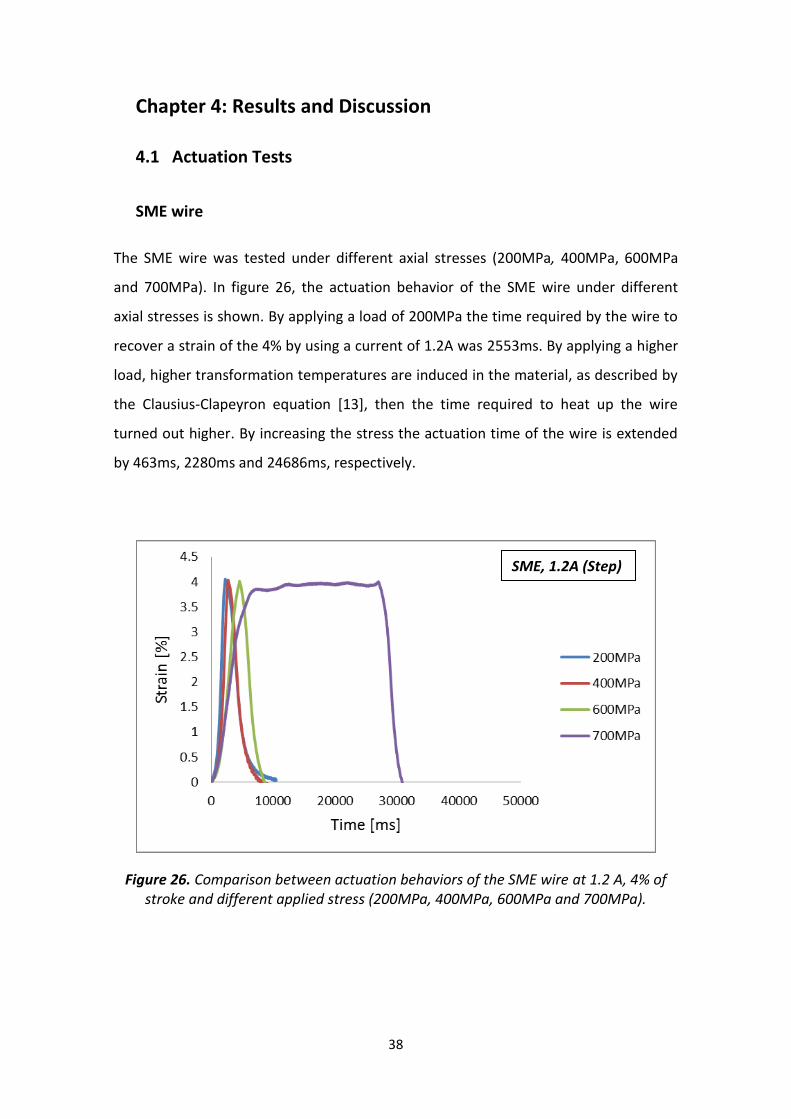
The SME wire was tested under different axial stresses (200MPa, 400MPa, 600MPa
and 700MPa). In figure 26, the actuation behavior of the SME wire under different
axial stresses is shown. By applying a load of 200MPa the time required by the wire to
recover a strain of the 4% by using a current of 1.2A was 2553ms. By applying a higher
load, higher transformation temperatures are induced in the material, as described by
the Clausius-Clapeyron equation [13], then the time required to heat up the wire
turned out higher. By increasing the stress the actuation time of the wire is extended
by 463ms, 2280ms and 24686ms, respectively.
Figure 26. Comparison between actuation behaviors of the SME wire at 1.2 A, 4% of stroke and different applied stress (200MPa, 400MPa, 600MPa and 700MPa).
SME, 1.2A (Step)
39
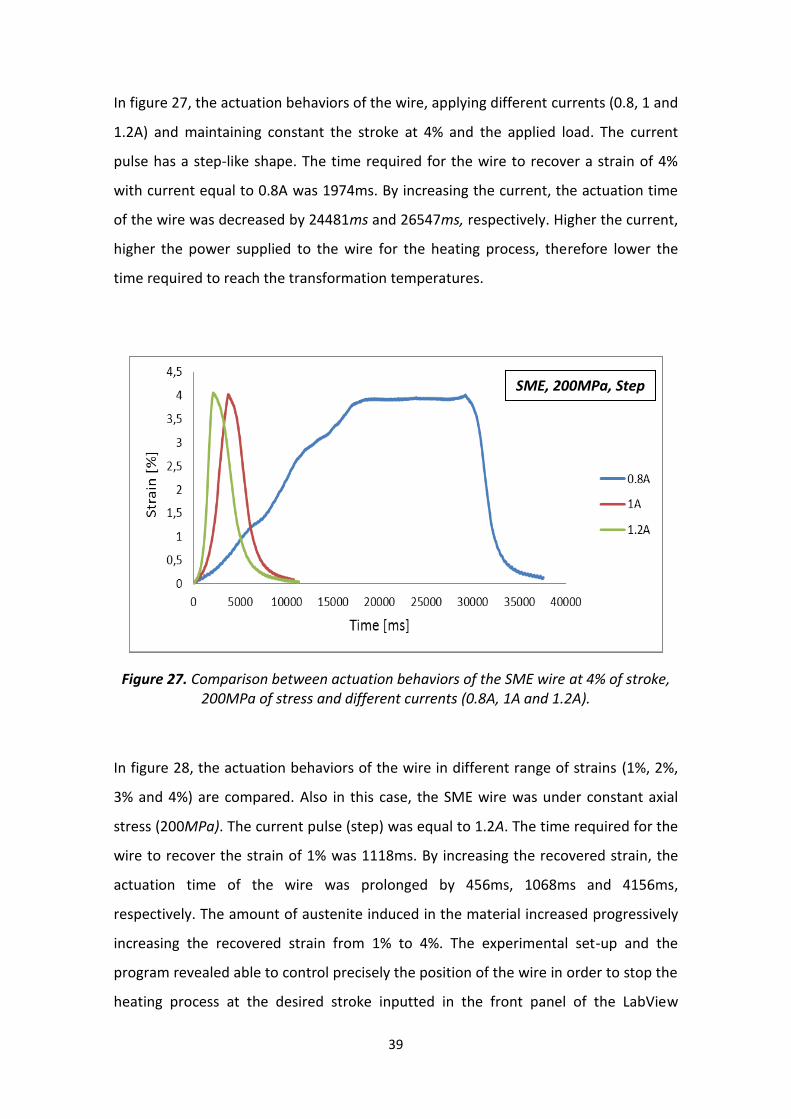
In figure 27, the actuation behaviors of the wire, applying different currents (0.8, 1 and
1.2A) and maintaining constant the stroke at 4% and the applied load. The current
pulse has a step-like shape. The time required for the wire to recover a strain of 4%
with current equal to 0.8A was 1974ms. By increasing the current, the actuation time
of the wire was decreased by 24481ms and 26547ms, respectively. Higher the current,
higher the power supplied to the wire for the heating process, therefore lower the
time required to reach the transformation temperatures.
Figure 27. Comparison between actuation behaviors of the SME wire at 4% of stroke, 200MPa of stress and different currents (0.8A, 1A and 1.2A).
In figure 28, the actuation behaviors of the wire in different range of strains (1%, 2%,
3% and 4%) are compared. Also in this case, the SME wire was under constant axial
stress (200MPa). The current pulse (step) was equal to 1.2A. The time required for the
wire to recover the strain of 1% was 1118ms. By increasing the recovered strain, the
actuation time of the wire was prolonged by 456ms, 1068ms and 4156ms,
respectively. The amount of austenite induced in the material increased progressively
increasing the recovered strain from 1% to 4%. The experimental set-up and the
program revealed able to control precisely the position of the wire in order to stop the
heating process at the desired stroke inputted in the front panel of the LabView
SME, 200MPa, Step
40
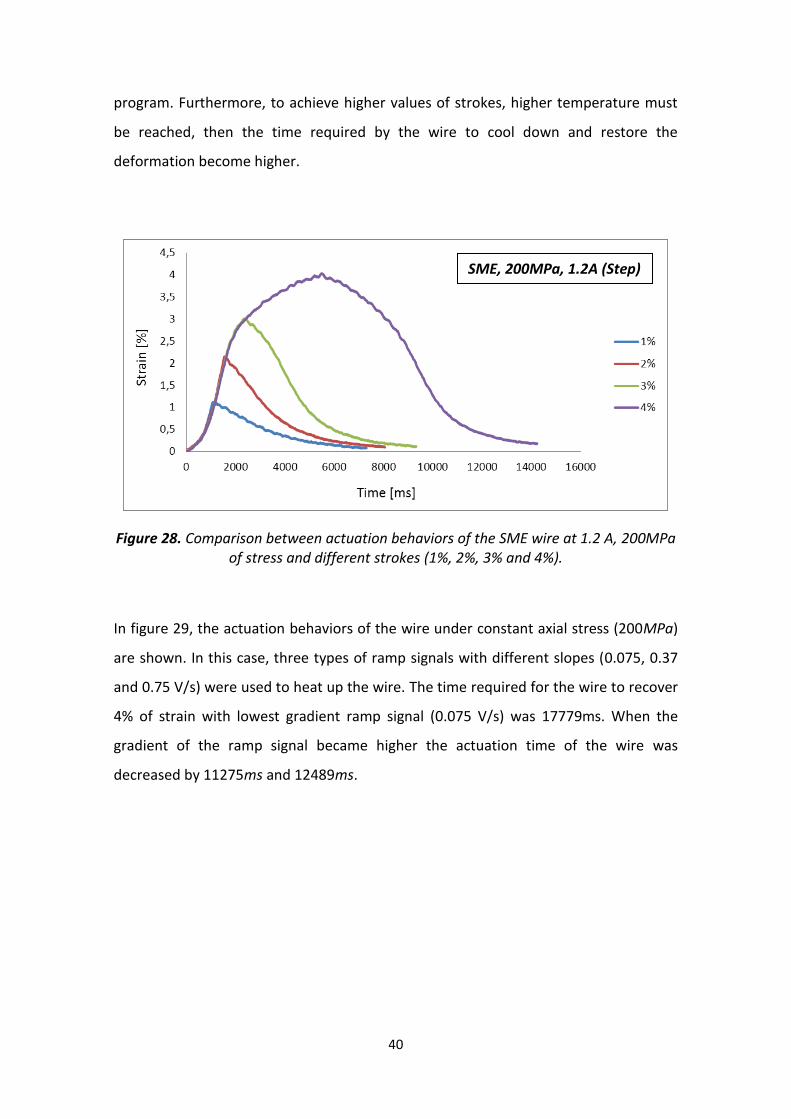
program. Furthermore, to achieve higher values of strokes, higher temperature must
be reached, then the time required by the wire to cool down and restore the
deformation become higher.
Figure 28. Comparison between actuation behaviors of the SME wire at 1.2 A, 200MPa of stress and different strokes (1%, 2%, 3% and 4%).
In figure 29, the actuation behaviors of the wire under constant axial stress (200MPa)
are shown. In this case, three types of ramp signals with different slopes (0.075, 0.37
and 0.75 V/s) were used to heat up the wire. The time required for the wire to recover
4% of strain with lowest gradient ramp signal (0.075 V/s) was 17779ms. When the
gradient of the ramp signal became higher the actuation time of the wire was
decreased by 11275ms and 12489ms.
SME, 200MPa, 1.2A (Step)

41
Figure 29. Comparison between actuation behaviors of the SME wire at 4%, 200MPa of stress and different types of ramp signals (0.075V/s, 0.37V/s and 0.75 V/s).
HP-SME
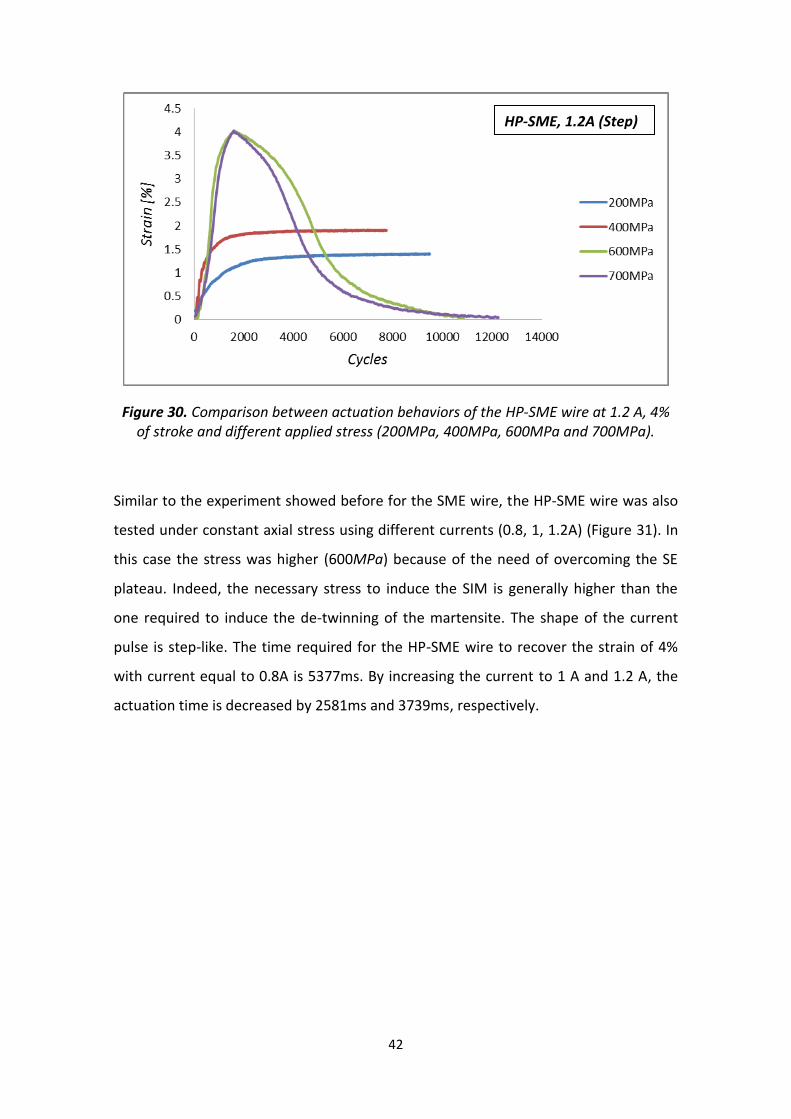
The HP-SME wire was tested under different axial stresses (200MPa, 400MPa, 600MPa
and 700MPa). In figure 30, the actuation behavior of the HP-SME wire is shown. By
applying stresses of 200MPa and 400MPa (loads under the starting load of the SE
plateau) the wire was not able to recover strain of 4%. When the applied stress
increased to 600MPa (above SE plateau) the time required by the HP-SME wire to
recover a strain of the 4% was 1390ms. By increasing the stress to 700MPa the
actuation time of the wire was expanded by 10ms. Also in this case the reason of the
extension in time is the increase in transformation temperature due to the Clausius-
Clapeyron equation [13].
42
Figure 30. Comparison between actuation behaviors of the HP-SME wire at 1.2 A, 4% of stroke and different applied stress (200MPa, 400MPa, 600MPa and 700MPa).
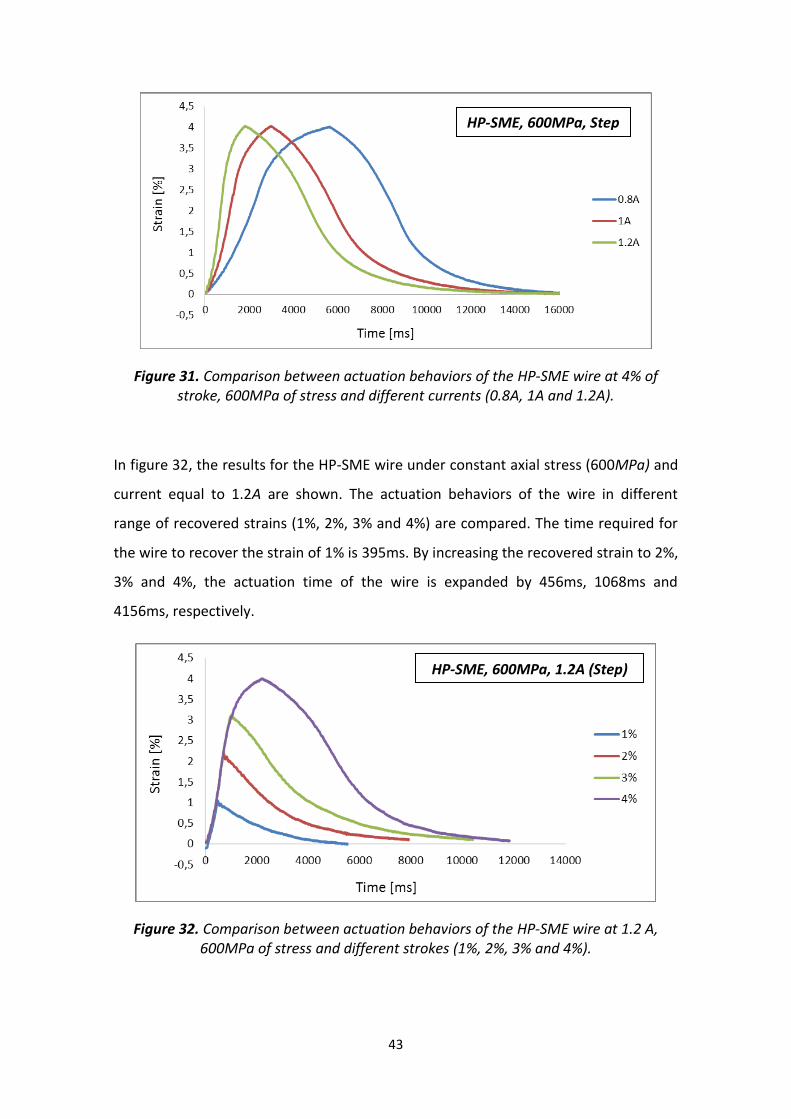
Similar to the experiment showed before for the SME wire, the HP-SME wire was also
tested under constant axial stress using different currents (0.8, 1, 1.2A) (Figure 31). In
this case the stress was higher (600MPa) because of the need of overcoming the SE
plateau. Indeed, the necessary stress to induce the SIM is generally higher than the
one required to induce the de-twinning of the martensite. The shape of the current
pulse is step-like. The time required for the HP-SME wire to recover the strain of 4%
with current equal to 0.8A is 5377ms. By increasing the current to 1 A and 1.2 A, the
actuation time is decreased by 2581ms and 3739ms, respectively.
HP-SME, 1.2A (Step)
43
Figure 31. Comparison between actuation behaviors of the HP-SME wire at 4% of stroke, 600MPa of stress and different currents (0.8A, 1A and 1.2A).
In figure 32, the results for the HP-SME wire under constant axial stress (600MPa) and
current equal to 1.2A are shown. The actuation behaviors of the wire in different
range of recovered strains (1%, 2%, 3% and 4%) are compared. The time required for
the wire to recover the strain of 1% is 395ms. By increasing the recovered strain to 2%,
3% and 4%, the actuation time of the wire is expanded by 456ms, 1068ms and
4156ms, respectively.
Figure 32. Comparison between actuation behaviors of the HP-SME wire at 1.2 A, 600MPa of stress and different strokes (1%, 2%, 3% and 4%).
HP-SME, 600MPa, Step
HP-SME, 600MPa, 1.2A (Step)

44
The actuation behavior of the HP-SME wire was also tested using a ramp pulse under
constant axial stress (600MPa). Three types of ramp signals with different slopes
(0.075, 0.37 and 0.75 V/s) are used to heat the wire. In figure 33, the actuation
behaviors of the wire are compared. The time required for the wire to recover 4% of
strain with the lowest gradient ramp signal (0.075 V/s) is 18947ms. When the slope of
the ramp signal becomes higher, the actuation time of the wire is decreased by
14461ms and 14420ms. It was shown in previous a literature work [25], that the ramp
pulse can improve the functional fatigue properties of the wire.
Figure 33. Comparison between actuation behaviors of the HP-SME wire at 4%, 600MPa of stress and different types of ramp signals (0.075V/s, 0.37V/s and 0.75 V/s).

45
Comparison between SME and HP-SME wires
The actuation behaviors of the HP-SME and SME wires are compared in this
subchapter with each other. In figure 34 and figure 35, the results of the tests in which
both types of wires were actuated under constant axial stress (200MPa and 400MPa,
respectively) and heated up with a current of 1.2A are shown. The applied stress is
lower than the stress of the SE plateau and consequently the HP-SME wire is not able
to recover the 4% of strain.
Figure 34: Comparison between actuation behaviors of the HP-SME and SME wires at 4% of stroke and 200MPa of stress.
200MPa
46
Figure 35: Comparison between actuation behaviors of the HP-SME and SME wires at 4% of stroke and 400MPa of stress.
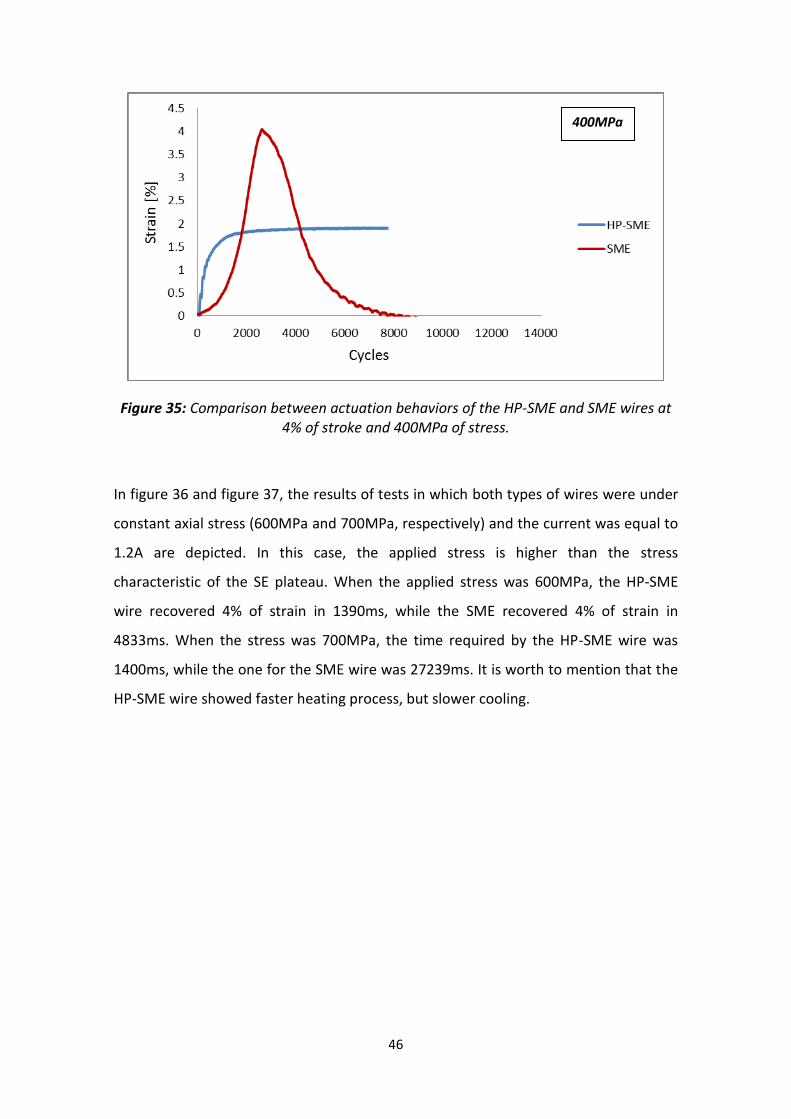
In figure 36 and figure 37, the results of tests in which both types of wires were under
constant axial stress (600MPa and 700MPa, respectively) and the current was equal to
1.2A are depicted. In this case, the applied stress is higher than the stress
characteristic of the SE plateau. When the applied stress was 600MPa, the HP-SME
wire recovered 4% of strain in 1390ms, while the SME recovered 4% of strain in
4833ms. When the stress was 700MPa, the time required by the HP-SME wire was
1400ms, while the one for the SME wire was 27239ms. It is worth to mention that the
HP-SME wire showed faster heating process, but slower cooling.
400MPa

47
Figure 36: Comparison between actuation behaviors of the HP-SME and SME wires at 4% of stroke and 600MPa of stress.
Figure 37: Comparison between actuation behaviors of the HP-SME and SME wires at 4% of stroke and 700MPa of stress.
600MPa
700MPa

48
4.2 Resistivity
In figure 38, the resistivity and recovered strain up to 2.3% are plotted versus time for
the SME wire. The resistivity of the wire is increased until the strain recovered reaches
0.5%. From 0.5% to 2.3% the resistivity is decreased. In the cooling process the voltage
is equal to zero and consequently the resistivity is zero.
Figure 38. Resistivity and actuation path of the SME wire vs. Time
In figure 39, changes in resistivity of the SME wire during heating, versus strain is
shown. The wire recovered a strain of 2.3% and the values of resistivity during the
recovery process varied between 102μΩ cm to 94μΩ cm. The resistivity of the SME
wire increases until the strain of 0.5% and decreases almost linearly till the strain of
2.3%. These changes are due to martensitic phase transformation. During heating, the
material transforms from SIM (B19’) to austenite (B2). The two phases are
characterized by different conductivity. Moreover, also the temperature affects the
resistivity value of the material.

49
Figure 39: Resistivity of the SME wire vs Strain
In figure 40, the resistivity and recovered strain of the HP-SME wire are plotted. The
resistivity of the HP-SME wire is decreased almost linearly until the strain of 2.3%. In
figure 41, Changes in resistivity of the HP-SME wire during heating, versus strain is
shown. In this case, the resistivity of the HP-SME wire decreases almost linearly till the
strain of 2.3%. Resistivity changes in HP-SME wire during heating vary between
123μΩ cm to 111μΩ cm. The same as SME wire, changes in resistivity are due to the
phase transformation and to the increase in temperature.
Figure 40. Resistivity and actuation path of the HP-SME wire vs. Time
50
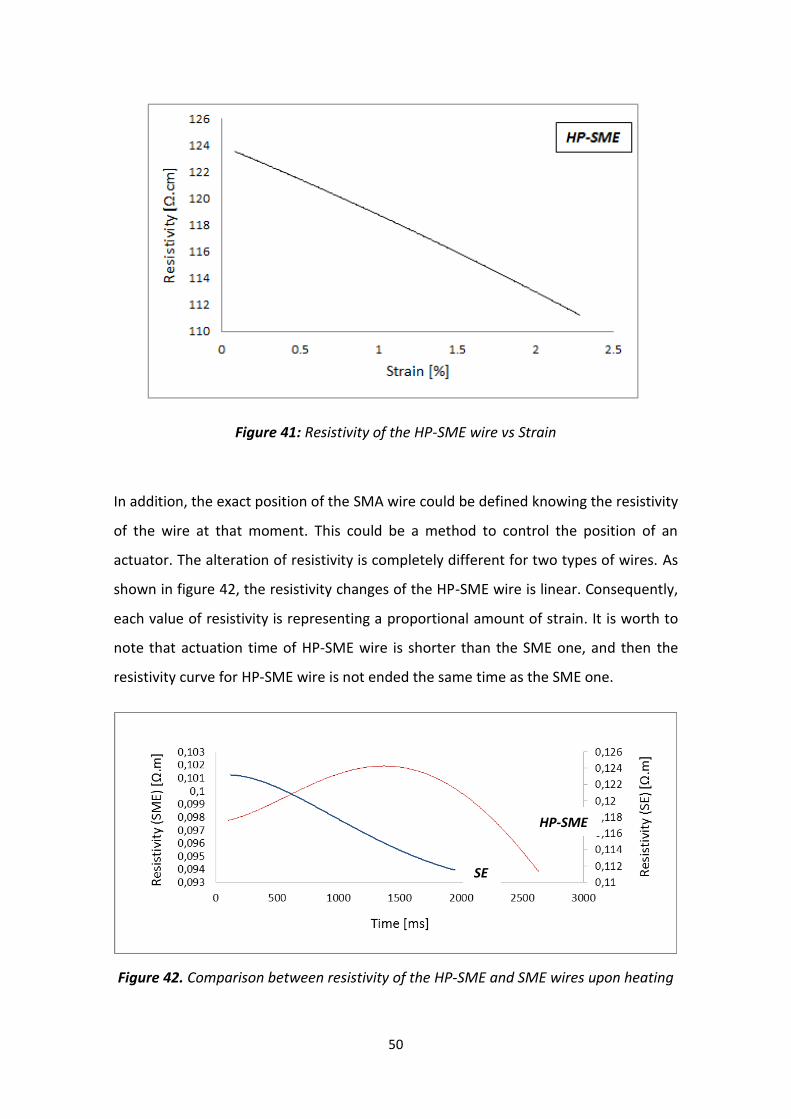
Figure 41: Resistivity of the HP-SME wire vs Strain
In addition, the exact position of the SMA wire could be defined knowing the resistivity
of the wire at that moment. This could be a method to control the position of an
actuator. The alteration of resistivity is completely different for two types of wires. As
shown in figure 42, the resistivity changes of the HP-SME wire is linear. Consequently,
each value of resistivity is representing a proportional amount of strain. It is worth to
note that actuation time of HP-SME wire is shorter than the SME one, and then the
resistivity curve for HP-SME wire is not ended the same time as the SME one.
Figure 42. Comparison between resistivity of the HP-SME and SME wires upon heating
SE
HP-SME

51
4.3 Thermo-Mechanical Fatigue Tests
The thermo-mechanical fatigue test was carried out on SME and HPSME wire for 7500 cycles. We
chose this value, because from previous literature works it is well known that in the first
thousands of cycles the wires accumulate lot of plastic deformation [2,6,25]. The HP-SME wire was
tested under constant axial stress of 600MPa and current equal to 1.2A was used to heat up the
wire. On the other hand, the stress of the SME wire was taking a constant at 200MPa. The current
sent to the SME wire was 1A.
In figure 43, the trends of the maximum and minimum strains of the SME wire are plotted as
function of the number of cycles. The maximum strain value at the beginning of the test was 2.3%,
while after 7500 cycles it reached -2.27%. The minimum strain value before and after thermo-
mechanical cycling (TMC) were 0% and 0.03% respectively. Decrease in maximum strain recovered
by the sample due to TMC, is about 1% after 7500 cycles. This commercial wire was already
subjected to a “training” procedure, which is a trade secret of each producer. Without this process
the wire would have accumulated much more plastic deformation [2,6,25]. While, it is possible to
assert that the wire showed a very stable behavior, even at the very first cycles.

52
Figure 43: Maximum and minimum strains of the SME wire during fatigue test
In figure 44, the trends of the maximum and minimum strains of the HP-SME wire are
plotted as function of the number of cycles. The change in strain values of the wire
was more intense in the first cycles.
The maximum strain value at the beginning of the test was -2.3%, while after 7500
cycles it reached -2.2%. The minimum strain value before and after TMC were 0% and
+0.1%, respectively. Decrease in maximum strain recovered by the sample due to
TMC, is about 3.5% after 7500 cycles. These changes in strain values are due to the
elongation of the wire and accumulation of the plastic deformation induced by TMC
[25].
Minimum Strain
Maximum Strain
SME

53
The HP-SME wire was cycled until failure, which occurred at the 10345th cycle. The
trend in strain of the cycles between the 7500th and the failure is not reported in this
work.
Figure 44: Maximum and minimum strains of the HPSME wire during fatigue test
HP-SME
Minimum Strain
Maximum Strain
54
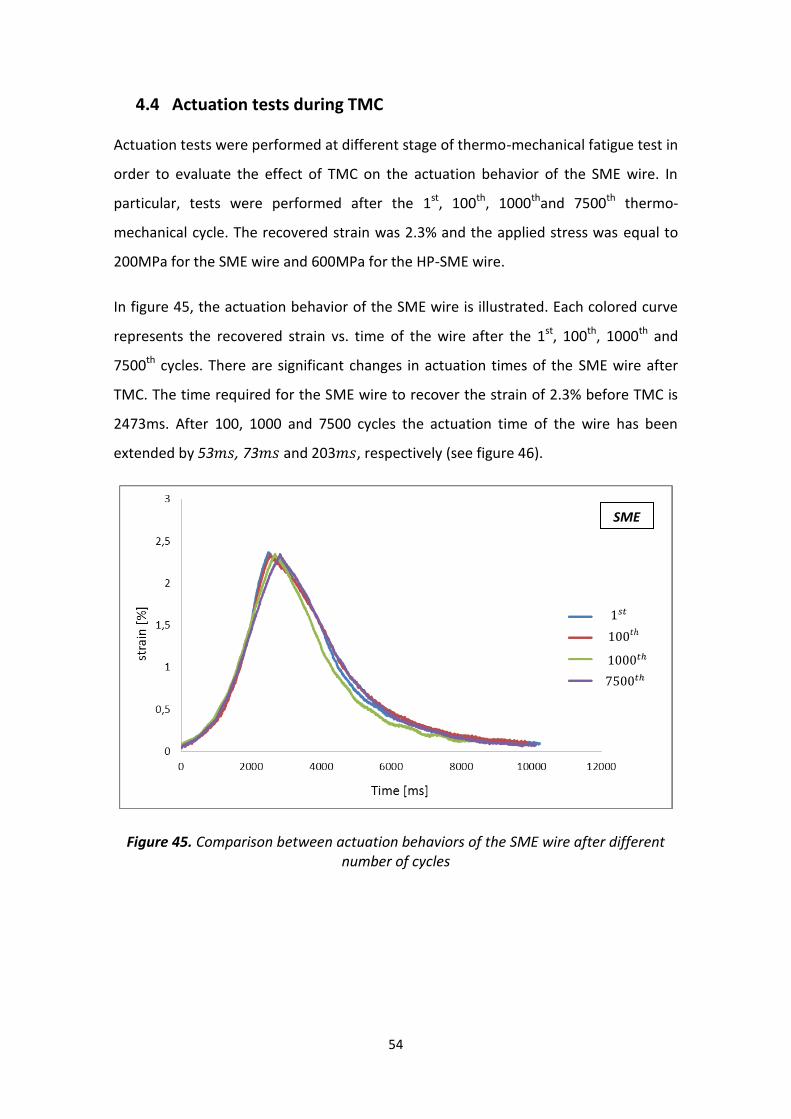
4.4 Actuation tests during TMC
Actuation tests were performed at different stage of thermo-mechanical fatigue test in
order to evaluate the effect of TMC on the actuation behavior of the SME wire. In
particular, tests were performed after the 1st, 100th, 1000thand 7500th thermo-
mechanical cycle. The recovered strain was 2.3% and the applied stress was equal to
200MPa for the SME wire and 600MPa for the HP-SME wire.
In figure 45, the actuation behavior of the SME wire is illustrated. Each colored curve
represents the recovered strain vs. time of the wire after the 1st, 100th, 1000th and
7500th cycles. There are significant changes in actuation times of the SME wire after
TMC. The time required for the SME wire to recover the strain of 2.3% before TMC is
2473ms. After 100, 1000 and 7500 cycles the actuation time of the wire has been
extended by 53 , 73 and 203 , respectively (see figure 46).
Figure 45. Comparison between actuation behaviors of the SME wire after different number of cycles
SME
1𝑠𝑡
100𝑡ℎ
1000𝑡ℎ
7500𝑡ℎ
55
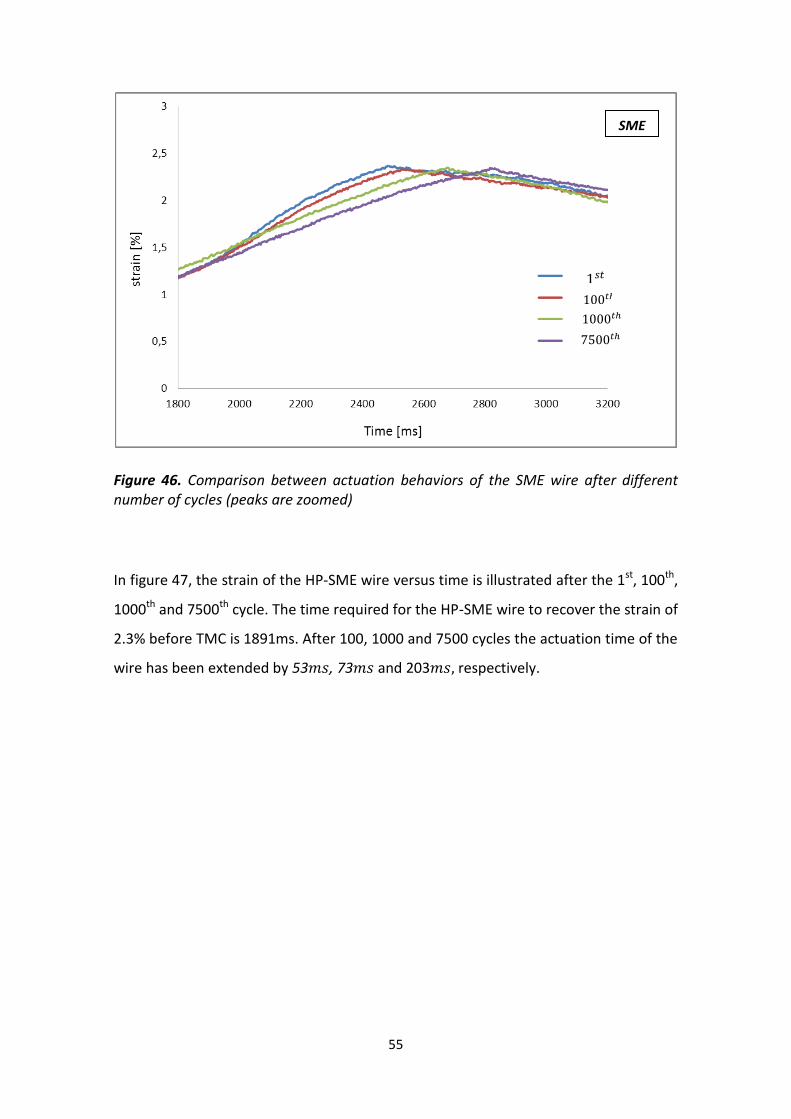
Figure 46. Comparison between actuation behaviors of the SME wire after different number of cycles (peaks are zoomed)
In figure 47, the strain of the HP-SME wire versus time is illustrated after the 1st, 100th,
1000th and 7500th cycle. The time required for the HP-SME wire to recover the strain of
2.3% before TMC is 1891ms. After 100, 1000 and 7500 cycles the actuation time of the
wire has been extended by 53 , 73 and 203 respectively.
SME
100𝑡ℎ
1000𝑡ℎ
7500𝑡ℎ
1𝑠𝑡

56
Figure 47. Comparison between actuation behaviors of the HP-SME wire after different number of cycles
In figure 48, the peaks are zoomed for a better clarification.
Figure 48. Comparison between actuation behaviors of the HP-SME wire after different number of cycles (peaks are zoomed)
The TMC leads to a modification in the microstructure of the SME and HPSME wire by
inducing dislocations. These lattice defects have an effect on the transformation
temperature of the material. During cycling, transformation temperatures are moved
toward higher temperatures [13]. Therefore, higher amount of time is required by the
wire to be heated up above the transformation temperatures.
0
0.5
1
1.5
2
2.5
0 2000 4000 6000 8000 10000 12000 14000 16000
Stra
in [
%]
Time [ms]
1𝑠𝑡
HP-SME
100𝑡ℎ
1000𝑡ℎ
7500𝑡ℎ
1𝑠𝑡
100𝑡ℎ
1000𝑡ℎ
7500𝑡ℎ
HP-SME
57
Thermo-mechanical cycling has a very significant effect on functioning properties of the
SMA wires; that should be considered in design of the shape memory actuators.
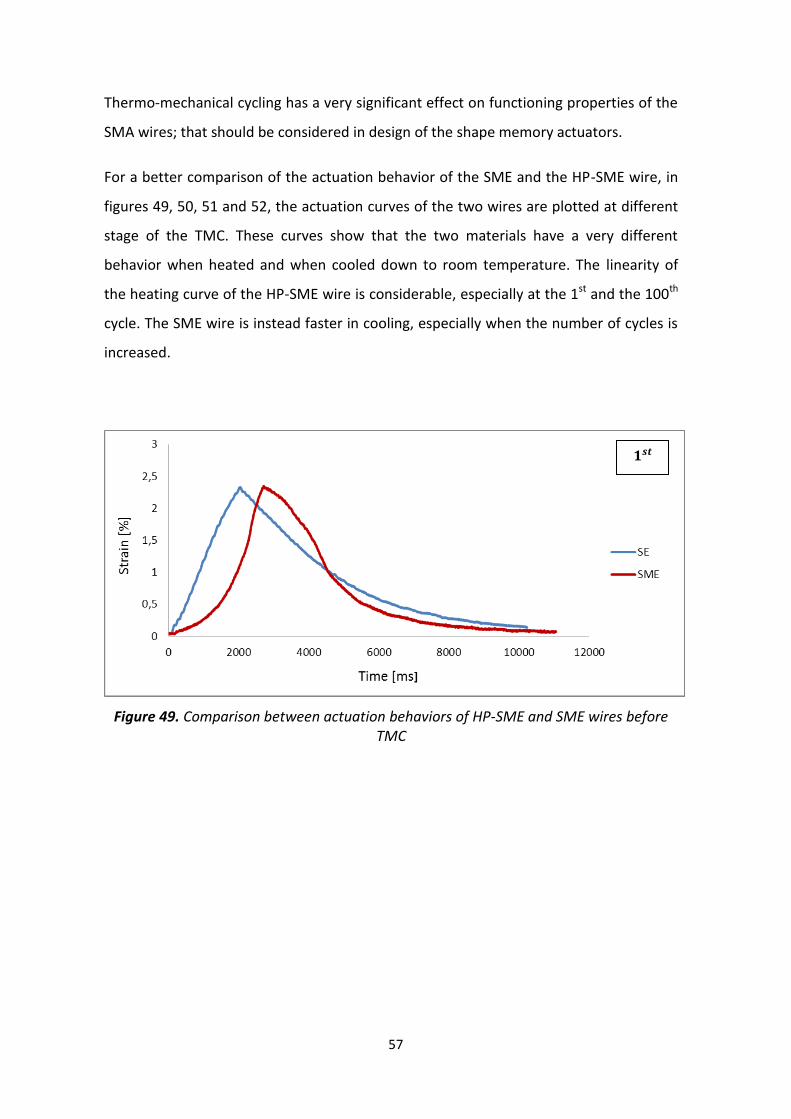
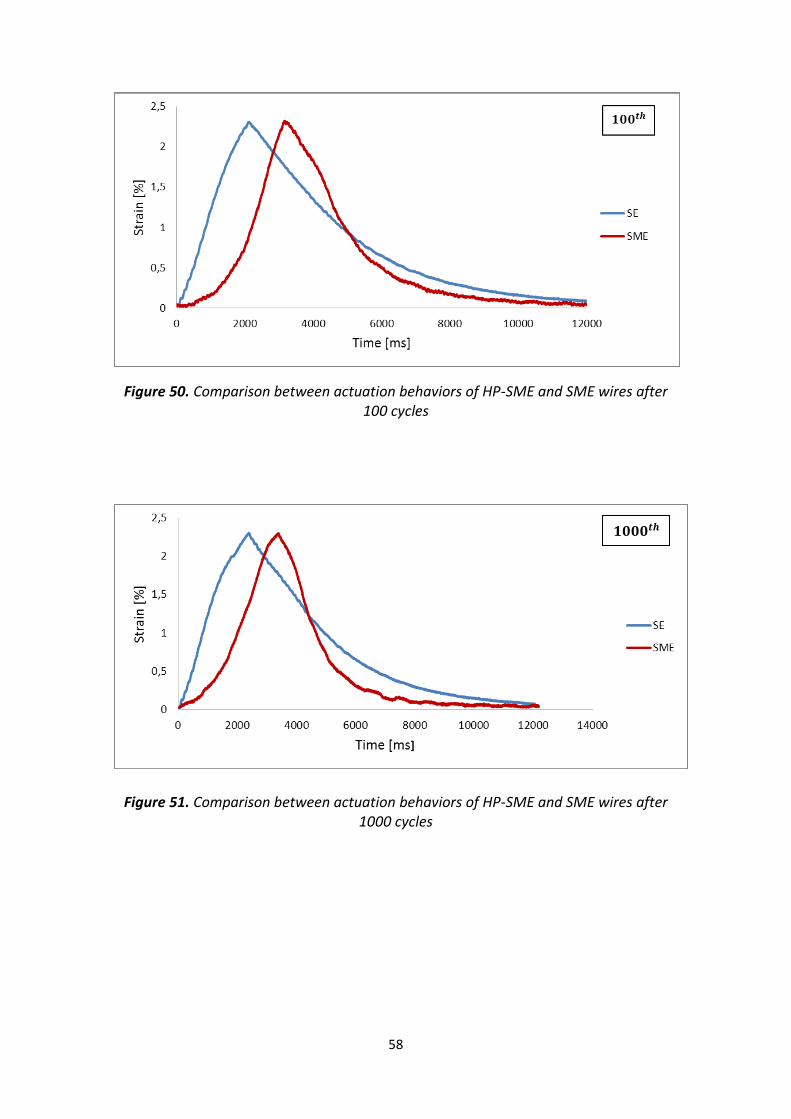
For a better comparison of the actuation behavior of the SME and the HP-SME wire, in
figures 49, 50, 51 and 52, the actuation curves of the two wires are plotted at different
stage of the TMC. These curves show that the two materials have a very different
behavior when heated and when cooled down to room temperature. The linearity of
the heating curve of the HP-SME wire is considerable, especially at the 1st and the 100th
cycle. The SME wire is instead faster in cooling, especially when the number of cycles is
increased.
Figure 49. Comparison between actuation behaviors of HP-SME and SME wires before TMC
𝟏𝒔𝒕
58
Figure 50. Comparison between actuation behaviors of HP-SME and SME wires after 100 cycles
Figure 51. Comparison between actuation behaviors of HP-SME and SME wires after 1000 cycles
𝟏𝟎𝟎𝟎𝒕𝒉

59
Figure 52. Comparison between actuation behaviors of HP-SME and SME wires after 7500 cycles
4.5 DSC Test
In figure 53, the DSC thermogram of the SME wire before TMC with the extrapolated
transformation temperatures is shown. According to the DSC thermogram a two stage
direct transformation during cooling (B2RB19’) and a single stage direct
transformation (B19’B2) during heating occurs. The material is completely in
austenitic phase, i.e. above Af temperature, at temperatures higher than 73.7°C. On
the other hand, the martensitic and R phase are present at lower temperatures. The
material is completely in martensitic phase at temperatures below Mf (3.6°C). The R
phase exists between 75.3°C and 52.2°C during cooling. Therefore, if the material is
cooled, at RT the DSC thermogram shows that the material has a dual structure made
up of martensite and R-phase.
𝟕𝟓𝟎𝟎𝒕𝒉

60
Figure 53. DSC thermogram of the SME wire before TMC
In figure 54, the DSC thermogram of the SME wire after TMC with the extrapolated
transformation temperatures is shown. Based on the DSC thermogram after TMC a
one stage direct transformation during cooling (B2B19’) and a single stage direct
transformation (B19’B2) during the heating occur. The material is in fully martensitic
phase at RT. The transformation temperatures of the SME wire after TMC have been
shifted to the right side. As explained in the previous subchapter, an increase of the
transformation temperature leads to an increase of the actuation time.
For a better comparison, the two above mentioned curves are plotted together in
figure 55.

61
Figure 54. DSC thermogram of SME wire after TMC
Figure 55. Comparison between DSC thermograms of SME wire before and after TMC

62
In figure 56, the DSC thermogram of the HP-SME wire, before TMC is shown. It shows
a two stage direct transformation during cooling (B2R 1 ) and a two stage
reverse transformation 1 RB2) during the heating. The material at RT is in fully
austenitic phase (Rs is 14.3°C and Af is 13.5°C)
Figure 56. DSC thermogram of the HP-SME wire before TMC
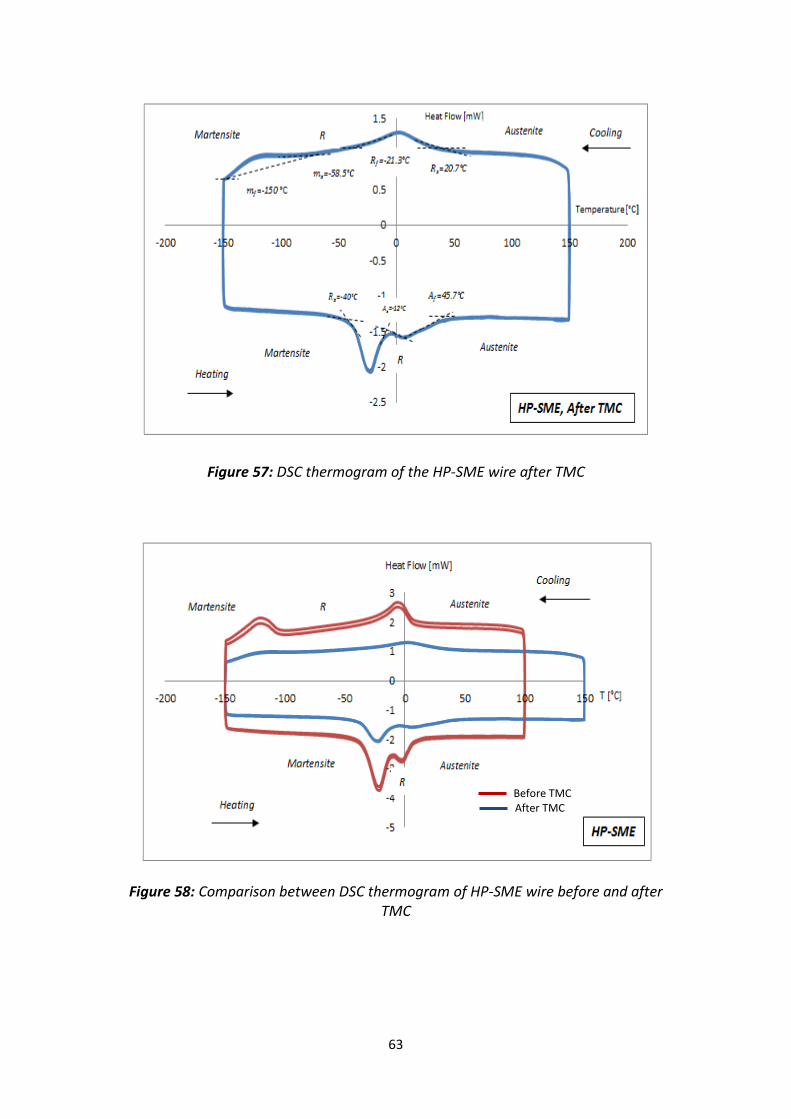
In figure 57, the DSC thermogram of the HP-SME wire, after TMC with the
extrapolated transformation temperatures is shown. Also in this case, a double-stage
transformation is noticeable during cooling and heating. At RT the wire has a dual
structure (austenite and R-phase).
For a better comparison, the two curves of the HP-SME wire before and after fatigue
are plotted together in figure 58. After fatigue, the transformation peaks are definitely
more smooth and slightly shifted to the higher temperatures.
63
Figure 57: DSC thermogram of the HP-SME wire after TMC
Figure 58: Comparison between DSC thermogram of HP-SME wire before and after TMC
Before TMC After TMC

64
4.6 Tensile Test
In figure 59, the stress-strain curves of the SME wire before and after TMC are compared.
Before TMC, the SME wire has an almost linear behavior upon loading. The stress
imposed to the SME wire to reach the 6% of strain was about 1000MPa. When
unloaded, the wire recovered the 2.3% of strain. Such high recovery upon unloading is
not a characteristic behavior of the SME wire before cycling, it is probably an effect
derived from the “training” procedure performed at the end of the production
process. After TMC, the stress imposed to the wire is almost 600MPa to reach 6% of
strain. The 4.7% of strain was recovered after unloading. The TMC leads to a
modification in the microstructure of the SME wire by inducing dislocations. So that,
occurrence of these defects in the crystal structure of the material had led to these
particular behaviors.
Figure 59. Comparison between stress-strain curves of the SME wire upon loading/unloading (before and after TMC)
SME
65
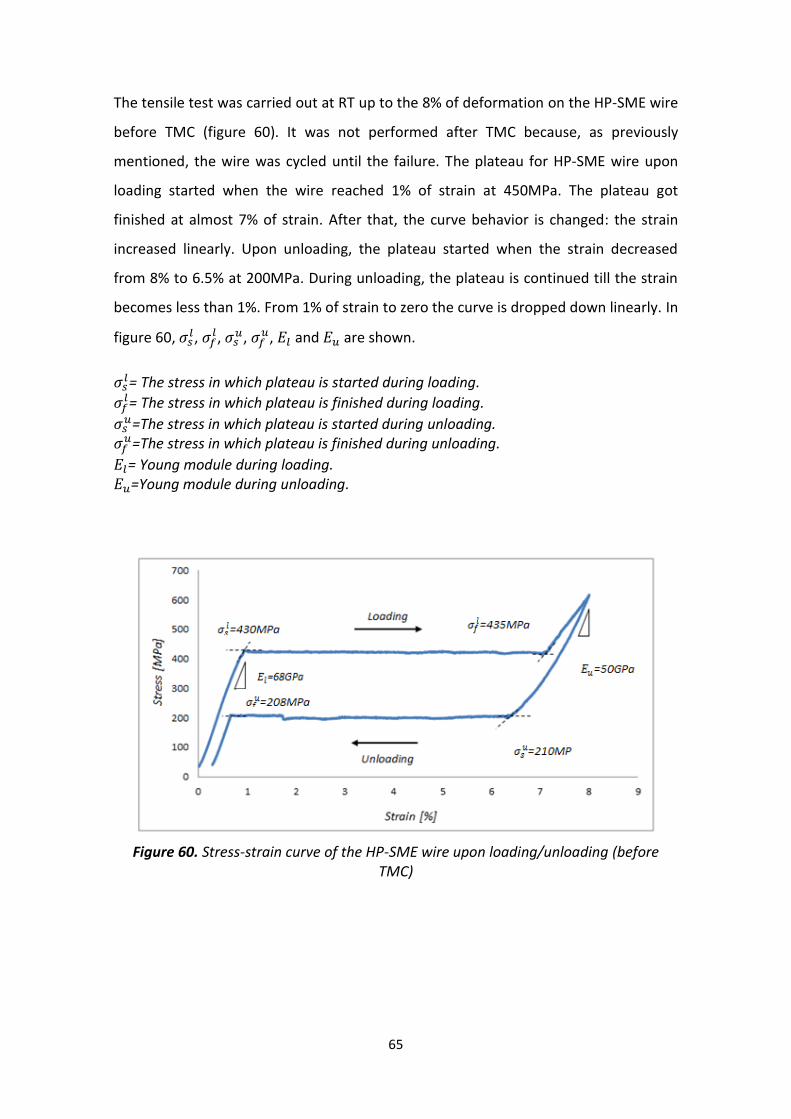
The tensile test was carried out at RT up to the 8% of deformation on the HP-SME wire
before TMC (figure 60). It was not performed after TMC because, as previously
mentioned, the wire was cycled until the failure. The plateau for HP-SME wire upon
loading started when the wire reached 1% of strain at 450MPa. The plateau got
finished at almost 7% of strain. After that, the curve behavior is changed: the strain
increased linearly. Upon unloading, the plateau started when the strain decreased
from 8% to 6.5% at 200MPa. During unloading, the plateau is continued till the strain
becomes less than 1%. From 1% of strain to zero the curve is dropped down linearly. In
figure 60, ,
, ,
, and are shown.
= The stress in which plateau is started during loading.
= The stress in which plateau is finished during loading.
=The stress in which plateau is started during unloading.
=The stress in which plateau is finished during unloading.
= Young module during loading. =Young module during unloading.
Figure 60. Stress-strain curve of the HP-SME wire upon loading/unloading (before
TMC)
66
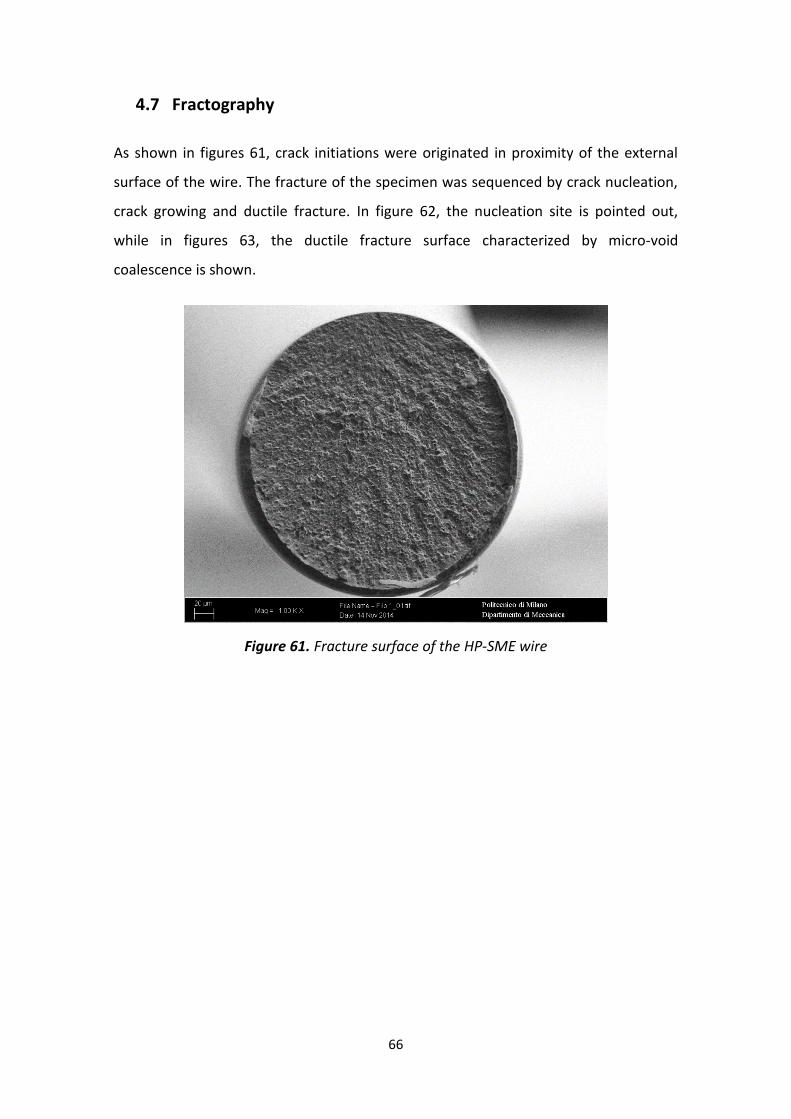
4.7 Fractography
As shown in figures 61, crack initiations were originated in proximity of the external
surface of the wire. The fracture of the specimen was sequenced by crack nucleation,
crack growing and ductile fracture. In figure 62, the nucleation site is pointed out,
while in figures 63, the ductile fracture surface characterized by micro-void
coalescence is shown.
Figure 61. Fracture surface of the HP-SME wire

67
Figure 62. Crack initiation and propagation from the proximity of the external surface.
Figure 63. Ductile fracture surface characterized by micro-void coalescence
68
Conclusion
In order to study the behavior of thin NiTi shape memory wires under different
experimental conditions, an experimental rig was designed and assembled. The
manufactured apparatus has the ability to carry out different types of tests on SMA
wires. A wide range of operating parameters, such as current, stress, strain and the
shape of the signal (ramp or step) can be set. Thermo-mechanical fatigue and
actuation tests were executed on HP-SME and SME wires and the outcome results of
were analyzed in this work.
The thermo-mechanical cycling test was carried out on 300µm HP-SME and SME wires.
It caused significant changes in functional properties of the wires. The maximum strain
recovered by the HP-SME and SME wires after cycling has been decreased by 3.5% and
1% respectively. Moreover, TMC promoted an increase in actuation time of the wires.
Lattice defects created during cycling have an influence on the transformation
temperatures of the material, which move towards the higher temperatures. Hence,
the SMA wires are necessitated to have a higher amount of heating time in order to
reach their transformation temperatures.
Changes in resistivity of the SME and HPSME wires upon the heating process were
compared and their alteration trends were completely different. The SME wire
showed a parabolic resistivity curve, while the resistivity of the HP-SME wire
decreased linearly during heating. These changes are probably motivated by the phase
transformations and temperatures arise. Since, the conductivity of material in
austenite and martensite differs, thus, the resistivity of the SMA wires are changing
upon heating process.
The DSC thermogram performed on SMA wires before and after cycling showed that
the HP-SME wire is in a fully austenitic phase at RT, while the SME one is partially in
martensite and in R-phase. Besides, the DSC test showed that, the characteristic
temperatures of both types of the SMA wires after TMC are moved towards the higher
temperatures. Additionally, a two stage direct transformation during cooling
(B2RB19’) and a single stage direct transformation (B19’B2) during heating was
observed for the SME wire before TMC. The two stage phase transformation of the
69
SME wire upon cooling was modified by a one stage direct transformation (B2B19’)
after TMC. In case of the HP-SME wire, the phase transformations during
cooling/heating were kept as the double stage transformations.
The tensile test carried out on SME wire before and after TMC expressed noticeable
variations in stress-strain curves. The strain recovered upon unloading was increased
dramatically (up to 4.7%) after TMC and the stress induced to the wire upon loading
was decreased by 400MPa. Such high amount of recovery upon unloading is not a
common behavior of the SME wires. Thus, this phenomenon could be justified by the
so called “training” operation executed on SMA wires in the producer company and to
the TMC. Moreover, the tensile test done on the HP-SME wire indicated a classical SE
behavior with two evident plateaus during loading/unloading processes. The HP-SME
wire recovered almost the whole amount of elongation after unloading.
Fracture surface of HPSME subjected to fatigue test was analyzed by electron
microscope; crack initiations in proximity of the external surface and ductile fracture
surface characterized by micro-void coalescence were observed.
All the results obtained, showed notable effects of TMC on shape memory wires that
should be strongly considered in design and optimization of SMA actuators.
70
References
1. Jani, J. M., Leary, M., Subic, A., Gibson, M. A. (2013). “A Review of Shape Memory
Alloy Research, Applications and Opportunities”. Materials & Design.
2. Casati, R., Vedani M., Tuissia A. (2011). “Thermal cycling of stress-induced
martensite for high-performance shape memory effect”. Scripta MATERIALIA.
3. Wu, S., Wayman, C. (1987). "Martensitic transformations and the shape-memory
effect in Ti50Ni10Au40 and Ti50Au50 alloys".
4. Lagoudas, D. C. (2008). “Shape Memory Alloys - Modeling and Engineering
Applications”. Springer.
5. de Haan, J. (1994). “Geheugenwerking bij NiTi-legeringen”. Optoelectronics and
advanced materials. Retrieved 06 2011, from
alexandria.tue.nl:http://alexandria.tue.nl/repository/books/642146.pdf
6. Funakubo, H. (1984).” Shape memory alloys”, University of Tokyo, pp. 7, 176.
7. Duerig, T., Pelton, A., Trepanier, C. Withers, N. (2014). "Magnificent Molecules -
Nitinol"
8. Kumar, P. K., Lagoudas, D. C. (2008). “Introduction to Shape Memory Alloys”.
Springer.
9. 2004-2013 University of Cambridge.
http://www.doitpoms.ac.uk/tlplib/superelasticity/superelasticity1.php
10. Kiefer, B. Lagoudas, D. C. (2008). "Magnetic field-induced martensitic variant
reorientation in magnetic shape memory alloys". Philosophical Magazine.
11. Noor, A. K., Venneri, S. L., Paul, D. B., Hopkins, M. A. (1999, 01 10). “Structures
technology for future aerospace systems”. Production economist.
12. Djavareshkian, M., Esmaeli, A. and Parsani, A. (2011). “Aerodynamics of smart flap
underground effect” International Journal of Engineering and Technology (IJET).
13. Otsuka, K., Wayman, C. (1998). “Shape Memory Materials”. Cambridge University
Press.
14. Peng, F., Jiang, X.-X., Hu, Y.-R., & Ng, A. (2008). “Actuation precision control of SMA
actuators used for shape control of inflatable SAR antenna”. Acta Astronautica.

71
15. Liang, C. Rogers, C. A. (1990). "One-Dimensional Thermomechanical Constitutive
Relations for Shape Memory Materials" Journal of Intelligent Material Systems and
Structures.
16. Miyazaki, S. Otsuka, K. Suzuki, Y. "Transformation Pseudoelasticity and
Deformation Behavior in a Ti-50.6at%Ni Alloy" Scripta Metallurgica.
17. Tanaka, K. Kobayashi, S. Sato, Y. (1986). "Thermomechanics of transformation
pseudoelasticity and shape memory effect in alloys" International journal of
plasticity.
18. Kamita, T. Matsuzaki, Y. (1998). "One-dimensional pseudoelastic theory of shape
memory alloys". Smart Mater”. Smart Mater.
19. Y, Yamada. (1992). "Theory of pseudoelasticity and the shape-memory effect".
Phys.
20. Johnson Matthey medical components. http://jmmedical.com/resources/122/How-
Does-Nitinol-Work%3F-All-About-Nitinol-Shape-Memory-and-Superelasticity.html
21. Huo, Y. Müller, I. (1993). "Nonequilibrium thermodynamics of pseudoelasticity".
Continuum Mechanics and Thermodynamics.
22. Jiang, T. (2012). “Design of High Performance NiTi-based Shape Memory Alloys for
Automotive Actuator Applications”. NORTHWESTERN UNIVERSITY.
23. Peng, F. Jiang, X. Hu, Y. (2008). “Actuation precision control of SMA actuators used
for shape control of inflatable SAR antenna”. Acta Astronautica.
24. Chang-jun, Q. Pei-sun, M. Qin, Y. (2004). “A prototype micro-wheeled-robot using
SMA actuator”. Sensors and actuators.
25. Casati, R., Tuissi, A. (2011). “Effect of Current Pulses on Fatigue of Thin NiTi Wires
for Shape Memory Actuators”. Engineering Procedia.
26. Zhenyun, S. Tianmiao, W. Da, L. Chen, M. Xiangnan, Y. (2014). “A fuzzy PID-
controlled SMA actuator for a two-DOF joint”. Chinese Journal of Aeronautics.
27. University of Cambridge.
http://www.doitpoms.ac.uk/tlplib/superelasticity/uses.php
28. Ataalla, T. Leary, M. Subic, A. (2012). “Functional Fatigue of Shape Memory Alloys”.
Springer.
72
29. Saikrishna, SN. Venkata Ramaiah, K. Bhaumik, SK. (2006). “Effects of thermo-
mechanical cycling on the strain response of Ni-Ti-Cu shape memory alloy wire
actuator”. Material science and engineering.
30. Suzuki, Y. Tamura, H. (1997). “Engineering Aspects of shape memory alloys”. pp.
256–266. In: Duerig TW, Melton KN, Stockel D, Wayman CM Editors.
31. Besseghini, S. Mirri, L. Tuissi, A. “Proceedings of the SMST-94” pp. 201–206. In:
Pelton AR, Hodgson D, Duerig T Editors.
32. Hornbogen, E. “Thermo-mechanical fatigue of shape memory alloys”. Journal of
materials science 2004, 39:385-399.
33. http://www.perkinelmer.com/CMSResources/Images/4474542GDE_DSCBeginners
Guide.pf
34. Dumas, J.P. Zeraouli, Y. Strub, M. (1994). “Heat transfer inside emulsions.
Determination of the DSC thermograms. Part 2. Melting of the crystallized
droplets”. Thermochimica Acta.
35. Uchil, J. Mahesh, K.K. Kumara, K.Ganesh. (2002). “Electrical resistivity and strain
recovery studies on the effect of thermal cycling under constant stress on R-phase
in NiTi shape memory alloy”. Physica B: Condensed Matter.
36. Johari, O. Bhattacharyya, S. (1969). “The application of scanning electron
microscopy for the characterization of powders”. Power technology.