political activism as a determinant of clientelistic ... 2017 uttar pradesh state elections in order...
TRANSCRIPT
WP 2018-01 January 2018
Working Paper Department of Applied Economics and Management Cornell University, Ithaca, New York 14853-7801 USA
POLITICAL ACTIVISM AS A DETERMINANT OF CLIENTELISTIC TRANSFERS: Evidence from an Indian Public Works Program
Nancy Chau, Yanyan Liu and Vidhya Soundararajan

It is the Policy of Cornell University actively to support equality of
educational and employment opportunity. No person shall be denied
admission to any educational program or activity or be denied
employment on the basis of any legally prohibited discrimination
involving, but not limited to, such factors as race, color, creed, religion,
national or ethnic origin, sex, age or handicap. The University is
committed to the maintenance of affirmative action programs which will
assure the continuation of such equality of opportunity.

Political Activism as a Determinant of Clientelistic Transfers:
Evidence from an Indian Public Works Program∗
Nancy H. Chau† Yanyan Liu‡ Vidhya Soundararajan§
January 2018
Abstract: Are political activists preferentially targeted by politicians engaging in clientelis-tic transfers to bolster political support? We provide the first model to highlight two possiblerationales for such transfers: to mobilize support from the activists themselves, or to mobi-lize support from electors these activists have influence over. Using novel household data onex ante political affiliation and jobs received subsequent to large-scale decentralized workfareprogram in India, we find that activists are indeed preferentially targeted, and furthermore,such transfers are more pronounced in locations where citizen political involvement is lesscommon, and in remote and less connected areas where activists’ role in information trans-fers is most critical. We argue that the evidence is consistent with the use of transfers toleverage the influence of activists over the decision-making of other electors. Our results arenot driven by self selection, reverse causality, and other program transfers, and are robustto alternate definitions of “activism”.
JEL Classification: D7, H5.
Keywords: Political Clientelism, Political Activism, NREGS, India.
∗We gratefully acknowledge the funding support from 3ie (International Initiative for Impact Evaluation)and CGIAR-Policies, Institutions and Markets (PIM) Program. We thank Siwan Anderson, Kate Ambler,Maria Casanova, Mausumi Das, Upasak Das, Sylvan Herskowitz, Vegard Iversen, Jordan Kyle, Diego Maio-rano, Dilip Mookherjee, Danielle Resnick, Megan Sheahan, Rohini Somanathan and seminar audience atCornell University, Indian Institute of Management Bangalore, Delhi School of Economics, Indian Statisti-cal Institute Delhi, California State University Fullerton, Eastern Economics Association Conference 2017,Indian Institute of Technology Kanpur, Soceity for Economics Research in India, and International FoodPolicy Research Institute for discussions and feedback. All errors are our own.
†Cornell University. Email:[email protected]‡International Food Policy Research Institute. Email:[email protected]§Indian Institute of Management Bangalore. Email:[email protected]

1 Introduction
Political parties are known to strategically redirect public resources through decentralized
programs to secure and expand their party base. In a large and long-standing literature,
such activities have been referred to as tactical redistribution and/or political clientelism
(Downs, 1957; Wright, 1974; Wyatt, 2013; Dixit and Londregan, 1996). In classic probability
voting models, politicians target swing voters, who are closest to the center of the political
spectrum, because transfers to this group lead to a greater increase in political support
than transfers to groups with more extreme ideological attachments (Lindbek and Weibull,
1987; Dixit and Londregan, 1996, 1998; Stokes, 2005). Preferential targeting is also based
on other elector characteristics such as political affiliation (Cox and McCubbins, 1986) and
the tendency for reciprocal behavior (Finan and Schechter, 2012). Notably, citizens in these
earlier studies play an exclusively passive role: they simply receive political transfers and
choose party allegiance, and are otherwise not involved in politics. However, this limited
role is inconsistent with a multitude of other activities in which electors may be involved;
thus, it does not tell the whole story.
In this study, we examine “political activists”, or politically active citizens, who under-
take administrative and advocacy tasks such as campaigning, promoting candidates, attend-
ing party meetings, and assisting with party administration, among others. These activists
convey crucial information to their fellow citizens, help set the tenor and tone of public
campaigns, and can potentially effectively shape public opinion. To the extent that citizen
political activism can raise/alter public awareness about politics and politicians, it is natural
for politicians to woo activists in order to engender political support from other citizens or
from activists themselves.1 Further, given the new and emerging evidence regarding the role
1 Examples of such focussed electoral social engineering abound. A recent and relevant one is that of theBharatiya Janata Party (BJP) in India, which wooed the upper caste voters (specifically the Brahmins) inthe 2017 Uttar Pradesh state elections in order to engender larger support because although Brahmins onlyheld 10 percent of the electorate, they frame a disproportionately large share of the public discourse, andtheir votes were often referred to as the “first vote”. “In the local media, at the chai shop, amongst thechattering classes, Brahmins have power to influence the sense of the political hawa” (Vij, 2016).
1
of information and education in shaping voter preferences (Grossman and Helpman 1996;
Wantchekon 2003; Vincente 2014; Banerjee et al, 2011), the potential role of activists as
messengers of political information is crucial and begs investigation.
We introduce a model of political clientelism in which a distinction is made between two
types of citizen identities: (i) citizens who choose political allegiance when presented with
transfers and/or information, and (ii) citizen political activists whose political participation
can change the political allegiance of other citizens. Given the opportunity, do politicians
opt to make clientelistic transfers to undecided/swing voters to directly influence them, or do
they make clientelistic transfers to activists to influence them and their political messages
to others? These two distinctive channels of influence through clientelistic transfers are
referred to here as the direct and spillover effects, respectively. To explicitly capture the
spillover effects, the model innovates by spelling out the interaction between activists and
non-activists as a result of a Poisson matching process. This allows us to examine how
the political allegiance of non-activists can be shaped by the cumulative effect of all their
encounters with activists. In doing so, our model makes the intuitive prediction that if
the spillover effect is present, the size of preferential transfers to activists rises with the
fraction of politically inactive individuals in a jurisdiction.2 In addition to political activism,
the model also incorporates a set of other determinants of clientelistic transfers that have
received attention in the literature, including income (Dixit and Londregan 1996; Stokes
2005) and party affiliation (Cox and McCubbins 1986).
We offer empirical evidence on this issue in the context of a decentralized public works
program, specifically the National Rural Employment Guarantee Scheme (NREGS) in India,
arguably one of the largest workfare programs in the developing world. We examine whether
village leaders in the southern Indian state of Andhra Pradesh practice clientelism in allo-
cating NREGS jobs and payment based on the household adult male’s political affiliation
2 There could be other channels of information spillover from activists to other electors. For example,activists may be more influential in remote areas where people has fewer other methods of informationcommunication. We explore more such spillover channels in the empirical model.
2
and/or activism level.3
Our core dataset is from a primary household survey conducted in Andhra Pradesh by
the World Bank in August-October 2006, right after the start of NREGS Phase I (February
2006). We focus on villages governed by leaders (henceforth, sarpanch) affiliated with the
United Progressive Alliance (UPA), a coalition of parties led by the Indian National Congress
(INC). During our study period, the INC held power both at the state-level (Andhra Pradesh)
and at the federal-level and accrued much political clout at that time.
We estimate the effects of political affiliation and activism in 2006 on NREGS work and
payments received cumulatively in 2006 and 2007 using a Tobit model for UPA-sarpanch
villages. The timing of our survey uniquely captures adult male’s political affiliation and
activism level (which we henceforth call the household’s political affiliation and activism)
before or around the commencement of the NREGS program. It thus allows us to address
the reverse causality problem which concerns most previous studies. We use a rich set of
explanatory variables to account for heterogeneity at the household level and use village
fixed effects to capture village level unobservable variables from both the supply and the
demand sides such as available NREGS projects, weather conditions, and the situation of
the rural labor market.
A main identification concern stems from households’ self-selection into NREGS works.
However, there exists widely reported evidence of administrative rationing for NREGS work
especially in the initial years of the program implementation (eg., Ravi and Engler, 2015;
Maiorano, 2014). This supply-driven feature of NREGS suggests that the self-selection con-
cern is largely mitigated. To test if this is the case, we use job-card ownership as a proxy
for desire to work under NREGS to show that desire to work is not correlated with politi-
cal affiliation or activism, after controlling for village fixed effects and household observed
3 Andhra Pradesh is interesting for the dichotomy it offers. On the one hand, the state implementedseveral measures to ensure accountability of the NREGS through real-time availability of data and improvedchannels for public vigilance and civil society participation (Aiyar and Samji, 2009; Subbarao et al. 2013).On the other hand, the state leads Indian states in terms of the total money seized during elections, aphenomenon particularly acute in local elections (Centre for Media Studies, 2014). It is worthwhile toexamine the presence and nature of clientelism within these two parallel worlds.
3
characteristics.4 We also conduct a falsification test using data from non-UPA sarpanch vil-
lages to show that our results are not driven by other unobserved demand-side confounding
factors.5
Although the timing of our survey addresses most reverse causality concerns, some con-
cerns still remain in phase-I villages, where some households may have received benefits or
the promise of benefits between program commencement (February 2006) and the survey
(August 2006); this could in turn influence their political affiliation and/or activism.6 To
address this concern, we show that our results remain robust by repeating our analysis after
separately dropping households that received NREGS benefits, and dropping households that
received a job-card (in response to the promise of benefits) between February 2006 and their
interview month. We conduct additional robustness exercises to show that our results are
not driven by other concurrent factors such as split of Telangana from Andhra Pradesh and
household participation in other public programs. Our results also hold under alternative
definitions of political activism and for inclusion of different sets of control variables.
Our results reveal two distinctly striking patterns. First, in villages governed by a
UPA-sarpanch, politically active households affiliated to UPA and UPA-rival households
obtained significantly higher days of work and payment cumulatively in 2006 and 2007 than
politically inactive households in the respective parties. Using insights from our theoretical
model, we explore the mechanisms that drive the preferential treatment of political activists,
by interacting the binary variable for “political activist” with the share of politically active
households within the village. Notably, and consistent with the model with spillover effects,
active households living in villages with a larger share of politically inactive households
receive more benefits. Furthermore, activists are rewarded with more benefits in remote and
4 Indeed, job-card ownership could be considered a proxy for desire to work because a job-card is thefirst step in obtaining NREGS benefits; the card is also free of charge and is straightforward to obtainwithout requiring approvals from upper power echelons. We also show robustness by considering only thejob-card-holding households.
5 Unlike UPA sarpanch, the non-UPA sarpanch lacks the resources and the political will to engage inclientelism (Gupta and Mukhopadhyay, 2016).
6 This concern does not exist for phase-II villages, in which the NREGS program started after our survey.
4

less-connected villages where they may play a dominant role as information providers, and
in villages with a higher share of households belonging to the same or lower caste as activists
in which case they may act as powerful influencers in the caste-based network (Vij, 2016).
Second, inactive households affiliated with the rival party or those unaffiliated with any
party are preferentially targeted compared to UPA party loyalists, indicating that the UPA-
sarpanch is following an expansionist strategy to increase the party’s support base. The
extent of clientelistic transfers to political groups in villages dominated by non-UPA house-
holds is higher than in villages dominated by UPA households, supporting the expansionist
motive of the UPA-sarpanch.
Our paper contributes to the literature in at least two aspects. First, it adds to the
theoretical literature on political clientelism by introducing political activism as a key voter
characteristic and highlighting information spillover as a channel for activists to be targeted
to government programs by politicians. To our knowledge, no previous model has addressed
the channel of information spillover through activists in clientelistic transfers. We provide
empirical evidence to support the findings of the model.7
Second, our result that households affiliated with the rival party or unaffiliated with
any party are preferentially targeted provides a stark contrast to other studies in the Indian
context which have shown that leaders patronize loyalist households. It also distinguishes
from the general literature on clientelistic transfers which suggests either the loyalists or the
swing-voters are targeted. Various micro-level studies empirically demonstrate clientelistic
transfers in multiple settings, mostly concluding that preferential transfers are offered to
political allies or politician households. See Markussen and Tarp (2011) on land improvement
investment in Vietnam; Besley, Pande and Rao (2012) and Markussen (2011) on below-
poverty-line (BPL) card in south India; Das (2015) on NREGS jobs and Bardhan et al.
7 Our paper also relates to the literature which studies how politicians target the so-called “politicalbrokers”, who are hired because of their deep knowledge of the electoral preferences (Marcolongo 2017;Stokes et al. 2013). In the parlance of this literature, our sarpanch, carrying out the party’s wishes ofbolstering and expanding the party base, could be considered the broker of the party who is familiar withthe village members’ preferences and demographics.
5
(2009) on a host of recurring private benefits in West Bengal. Similar conclusions were
drawn concerning fund and resource allocation at the aggregate level (Schady, 2002; Case,
2000; Sheahan et al., 2016; Gupta and Mukhopadhyay, 2016; Dahlberg and Johansson, 2002;
Asher and Novosad, 2015; Khemani, 2004; Himanshu et al., 2015; Fried, 2012).8
We attribute our distinct finding that the rival-party affiliates are preferentially targeted
to three aspects of our study. First, we address critical reverse causality issues, unlike previ-
ous studies, which focused on the correlation between party affiliation and program benefits.
Second, there is immense diversity in the institutions and the political environment across
states in India. The UPA, due to its uniquely powerful position during our study period, may
have deployed an expansionist strategy in Andhra Pradesh, unlike other relatively weaker
parties which followed a more secure strategy by supporting their own loyalists and securing
the party stronghold in other parts of the country other studies are based on. Third, our
study in the context of a public works program differs from welfare programs considered in
most previous studies. Beneficiaries of public works programs are offered job opportunities,
not cash transfers or other “free” benefits like welfare programs. Thus, following an aggres-
sive expansionist strategy to target rival affiliates are probably less offensive to loyalists than
typical welfare programs.
Three key aspects of our analysis are worth pointing out here. First, while other pub-
lic programs also provide potential channels for clientelism, preferential targeting through
the NREGS is sizeable and could potentially be dominant because, unlike other programs,
NREGS delegates a large amount of resources and discretion to local village leaders. Sec-
ond, unlike in some prior studies, we do not study clientelistic vote-buying surrounding an
election, but instead we study support buying as a practice of decentralized governments,
8 A parallel set of studies shows that firms also benefit from political ties through higher stock marketvaluations, credit and revenue (Fisman, 2001 (Indonesia); Khwaja and Mian, 2005 (Pakistan); Faccio, 2006(multi-country); Cingano and Pinotti 2013 (Italy)). Evidence also shows that clientelism operates throughthe channel of social identity, in which leaders show preference towards their own social group (such as caste,ethnicity, or religion) at the expense of others. This preference takes the form of providing larger targetedtransfers to their own group (Burgess et al. 2015; Munshi and Rosenzweig, 2015), focusing on public goodsthat the leader’s group cares about (Banerjee and Somanathan, 2007), or indirectly inhibiting the efficientfunctioning of public programs that benefit the needy (Anderson et al. 2015).
6

undermining long-term functioning of democratic politics and development (Bardhan and
Mookherjee 2012 and Khemani 2015). Third, our analysis is carried out at the micro-level,
rather than at the aggregate level, in order to explicitly capture the role of political ac-
tivists. Also, micro-studies can potentially offer alternate perspectives to those shown in
aggregate-level studies, even within the same context.9
The next section introduces the NREGS program both in India as a whole and in Andhra
Pradesh. Section 3 describes the theoretical model, while section 4 describes our data and
section 5 presents our methodology. We present the results in section 6 and conclude in
section 7.
2 Andhra Pradesh and the National Rural Employ-
ment Guarantee Scheme
The NREGS was a flagship program of the UPA, a coalition of center-left political parties
that governed India for two consecutive five-year terms spanning 2004 to 2009 and 2009 to
2014. During our study period, the UPA held power both at the center and in the state of
Andhra Pradesh. In the 2004 state elections in Andhra Pradesh, UPA members included the
Indian National Congress (INC), Telangana Rashtra Samithi (TRS), Communist Party of
India (CPI), CPI (Marxist), and Majlis-e-Ittehadul Muslimeen (MIM). The non-UPA parties
in the 2004 state elections included the Telugu Desam Party (TDP) and the Barathiya
Janata Party (BJP). The NREGS obtained constitutional recognition and came into force
as a law in September 2005. In 2012-2013, the program generated 2.3 billion person-days
of employment for 49.9 million households nationwide, from a budget of US$ 47.93 million.
Under this program, adults in rural households can work up to 100 days; this number of
9 This is particularly the case for decentralized programs because local village bodies form the lowestlevel of governance and the point of contact for potential beneficiary households, the factors influencing suchbodies to favor one household over the other under clientelistic programs may differ from those influencinga bureaucrat, for instance, to allocate program funds across different states, districts, or other higher-levelgoverning bodies.
7
allowable workdays is shared among household’s adult individuals.
Panel A in Figure 1 represents various stakeholders and within-state work flows under
the NREGS as per federal guidelines. Households first request and obtain a job-card, which
forms the basis of identification and is the legal document on which the number of days
worked are recorded in order to claim wages. Job-card holders can then seek jobs from the
Gram Panchayat (GP), the village-level body headed by the sarpanch, stating the duration
for which work is sought. The GP consolidates work requests from households into a shelf
of projects. From there, the GP’s plan goes up to the block, district, and state levels for
evaluation of technical feasibility, fund approval, and fund release.10
In the villages of Andhra Pradesh, a state-appointed field assistant (FA) also administers
the scheme, in addition to the sarpanch (Panel B in Figure 1). While guidelines suggest that
the FA assists the GP secretary in maintaining registers and in measuring work done, in
reality, the FA plays a more central role in program implementation (Chamorro et al. 2010).11
However, despite the FA’s prominence, the sarpanch still has an important stake in the
implementation of NREGS — to demonstrate performance and/or to appease constituents
- arising from the leader’s need to renew the position of power. In fact, since the sarpanch
short-lists and assists in choosing the FA (Government of Andhra Pradesh, 2006), the former
may potentially control or even ally with the latter.12 Particularly, the UPA-sarpanch and
the FA are natural partners in action because the FAs are appointed by the state, which
10 Infrastructure projects related to water conservation and water harvesting; drought-proofing, includingafforestation; irrigation works; restoration of traditional water bodies; land development; flood control; ruralconnectivity, and other works notified by the government, are some important works permissible under thescheme’s radar. Further, the act sets a minimum limit to the wages to be paid on a time-rate basis oron a piece-rate basis, without gender discrimination. Certain transparency and accountability measuresare supposed to be in place, through mechanisms like “squaring of accounts”, conducting social audits toensure accountability through public vigilance and participation of civil society, and maintaining records andensuring their availability for evaluation and scrutiny.
11 Maiorano (2014) notes that FAs provide job-cards and jobs and decide on the list of projects, all ofwhich are duties of the GP (of which the sarpanch is a member) as per the operational guidelines.
12 Data from a GP survey show that “for the first and the most recent FA, the village council had the mainsay in FA appointments in at least 80 per cent of the GPs. In about 40 per cent of appointments, villagecouncils controlled the entire selection process with no mandal level and is therefore well positioned to fudgematerial expenditures in connivance with other staff (viz., Assistant Engineers, Technical Assistants and/orthe suppliers). Hence, the village council and its leader are accountable both for ensuring efficient deliveryof program benefits and for the labor and material expenditures on NREGA projects.”(Afridi et al. 2017).
8

is governed by the UPA itself (Maiorano 2014). As per the party’s wish, both partners
may plausibly work toward achieving the same political objectives — that is, securing or
expanding UPA’s support base (Afridi et al. 2017).
In what follows, we theoretically model the problem of the local ruling politician (the
UPA-sarpanch in our case) who is carrying out the party’s goal of bolstering and expanding
political support through the tactical distribution of NREGS benefits. Our objective is to
extend canonical models of political support to account for voter-level characteristics that
may alter the pattern of political clientelism.
3 A Simple Model of Political Clientelism
Consider a model of political clientelism with two political parties: the ruling party (o) and
the rival party (r). The electorate contains a large number (N) of heterogeneous citizens.
Citizen heterogeneity originates from three sources: differences in (i) political preferences p,
(ii) propensity to participate in political activities k, and (iii) income y. 13 Each citizen,
characterized by the triplet {p, k, y}, chooses a political affiliation a ∈ {o, r, u}, to support
the ruling party (o), support the rival party (r), or remain unaffiliated (u).
There are three types of political preferences p ∈ {o, r, u}, respectively representing pro-
ruling party (o), pro-rival party (r), and neutral preferences (u). Let θpa denote a parameter
that reflects the political preference p of a citizen with party affiliation a. We assume
that political preference induces an ordering of the choices a ∈ {o, r, u} such that θpp =
max{θpo , θpr , θpu}, for p ∈ {o, r, u}. The fraction of citizens in the electorate with political
preference p is given by φp ∈ (0, 1), with∑
p=o,r,u φp = 1.
The N citizens embrace different degrees of political activism k, which takes on one of
two values: k = k > 1 for politically active individuals and k = 1 otherwise. In our data,
politically active individuals are those who participate in political campaigns, attend political
13In our empirical analysis, we include a vector of socio-economic characteristics in addition to income.These are discussed in detail in Section 4.
9

meetings, give speeches, write pamphlets, attend political rallies and / or offer donations.
We denote φok≥ 0 and φr
k≥ 0 as the share of politically active citizens with party preference
p = o and r, respectively. The rest of the citizens, φo1 = φo − φok
and φr1 = φr − φrk, are not
politically active (k = 1). Citizens with neutral political preferences naturally do not engage
in political activities, and thus φu1 = φu and φuk
= 0.14
To capture income heterogeneity, we denote G(y) as the cumulative distribution function
of income. Across theN citizens, income is independent and identically distributed regardless
of party preference and political activism.15
The utility of each citizen {p, k, y}, henceforth ωpk(a; y), depends furthermore on that
citizen’s choice of political affiliation a in the following way:
ωpk(a; y) = y + kγθpa. (1)
where γ ≥ 0.16
As a benchmark scenario in which politically motivated transfers are absent, it follows
directly from (1) that the utility maximizing political affiliation (a) depends only on political
preferences p, since maxa ωpk(a; y) = ωpk(p, y), p = {o, r, u}. Thus, the number of citizens who
prefer political affiliations a = o, r, and u are, respectively, φo, φr and φu.
Political Clientelism in a Heterogeneous Citizen Pool
The ruling politician targets public funds to bolster political support based on the observable
characteristics of a citizen prior to any transfers {p, k, y}.17 We follow the approach of the
14Thus, political activism is an attribute at the individual level. We are agnostic about the reason indi-viduals differ in k, and our specification accommodate situations in which political activism is driven by theintensity of an individuals’ political preference, is commissioned by political parties, or both.
15It is straightforward to incorporate political preference or political activism specific income distribution.Doing so does not alter the conclusions we report.
16 The parameter γ ≥ 0 captures two potential types of scenarios. When inequality is strict, citizen-cum-political activists put greater preference weights on the consequences of their party affiliation choices thaninactive individuals. By contrast if γ = 0, citizen utility is independent of political activism. The former isconsistent with political activism driven by strong political preferences. The latter is consistent with partycommissioned political activities, for example.
17 From (1), a citizen’s political preference is revealed by his/her (observable) choice of political affiliation
10

long-standing literature starting with Wright (1974), in which targeted transfers are taken
to induce a change in a citizen’s preference ordering over which party to support. Our model
innovates on this previous work by capturing two distinct routes that clientelistic transfers
can take.
First, we allow political preferences to vary with the transfers that a citizen receives
directly from the politician – we call this the direct effect of targeted transfers. Second,
we allow party affiliation preference to vary when politically inactive citizens encounter
politically active citizens who are themselves under the influence of targeted transfers from
the ruling politician – we call this the spillover effect of targeted transfers.18
Denote bpk(y) as the transfer to citizen {p, k, y}, and bpk
as the menu of transfers to
politically active citizens with preference p over all income levels y. In the context of the
NREGS program, these transfers take the form of the total number of days of NREGS
employment and the total wage payment received. Because transfers are the products of the
ruling politician’s flagship program, we assume that only the utility associated with ruling
party affiliation is affected by the transfers. Specifically:
ωpk(a; y, bpk(y)) = y + bpk(y) + kγθpa, if a 6= o
= y + bpk(y) + kγθpo
+upk(bpk(y); y) + Ik
(V o(bok) + V r(brk)
)+ ε, if a = o. (2)
For all individuals receiving transfers, income increases by bpk(y) to y+ bpk(y). We assume
that the political affiliation of an individual cannot be contracted conditional on transfers
ex ante,19 and as such, the preferred party affiliation of citizens will not change subsequent
prior to any targeted transfers.18 Arguably, clientelistic transfers to political activists may affect the tenor and information content of
political campaigns. Furthermore, clientelistic transfers may change the intensity of political activities de-pending on the recipient activist’s party affiliation. Our “spillover effect” terminology aims to accommodatethe possibility of one or both of these effects of clientelistic transfers to activists.
19This assumption can be justified on the grounds that contracts struck due to political clientelism do notreceive protection in the court of law and that the timing of transfers particularly in a workfare program arenot always in synch with political cycles.
11
to transfers, unless political preferences can be influenced by transfers.
In (2), political preference can change due to three reasons: upk(bpk(y); y), V o(bo
k) +V r(br
k),
and ε. Respectively, these refer to the direct effect of transfers, the spillover effect of transfers,
and a random preference shifter. Specifically, ε is a uniformly distributed random variable on
[−ε, ε] which reflects any random shifts in the status quo political preference (θpo) occurring
due to other exogenous shifts in preferences that are outside of the realm of the ruling politi-
cian’s influence.20 The ruling politician can also play an active role in mobilizing support by
directing transfers depending on their direct and spillover effects. We turn to these effects
next.
The Direct Effect of Targeted Transfers
The term upk(bpk(y), y) in (2) reflects the direct effect of targeted transfers on the utility
associated with ruling party affiliation. In particular, direct transfers mobilize support for
the ruling party if and only if upk(b) is increasing in b. The effectiveness of transfers in
mobilizing support, ∂upk/∂b, may be moderated by other citizen-specific characteristics. For
example, if political activism implies relative immunity to political support buying (Lindbeck
and Weibull 1987), then ∂upk/∂b is decreasing in k. Furthermore, if a high income status
also renders individuals immune to political support buying because of diminishing marginal
utility of income (Dixit and Londregan 1996, Stokes 2005), then ∂upk/∂b is decreasing in y.
To capture these potential features of upk(b) in a tractable way, henceforth we approximate
upk(·) by the following quadratic function:
upk(b; y) =(αpb + αpkk + αpyy − αbbb/2
)b ≡ (αp(k, y)− αbbb/2) b, (3)
where the sign of αpb shows the direction and strength of the direct effect of transfers, while
αpk and αpy show respectively the importance of political activism and income as moderating
20 It is straightforward to extend the model to include ranges of ε that are political preference specific[−ε, ε]. As will be evident in the following sections, doing so does not change any of the qualitative resultsobtained here.
12

factors. We assume that αbb is strictly positive to reflect diminishing marginal effectiveness
of transfers in eliciting change in political preference.
The Spillover Effect of Targeted Transfers
To incorporate the spillover effect of clientelistic transfers, which leverages the influence that
political activists may have over the political preference of the politically inactive citizens
with whom they interact, we denote Ik as an indicator variable that takes on the value 1 for
politically inactive individuals, and 0 otherwise. The terms V o(bok) and V r(br
k) in (2) reflect
the direction and size of the spillover effect.
We assume that the more frequent a politically inactive citizen encounters political ac-
tivists with political preference p, the greater the spillover effect, if any. Thus, let np, p = o, r
denote the number of such encounters. We assume that no and nr are Poisson distributed
random variables, by which the average number of meetings per citizen is given by the
population share of the two types of politically active citizens φok/N and φr
k/N .
The size of the spillover effect furthermore depends on the actual amount of transfers that
the political activists receive. Because political activists as a group exhibit different political
preferences (p) and a continuum of income levels (y), the size and sign of the spillover effect
can potentially differ at each encounter with activists depending on the activists’ individual
p and y. We assume that each one of the n = 0, ..., np encounters is a random draw from the
distribution of transfers bpk(yn) received by political activists with preference p and income
yn. With these motivations in mind, the spillover effect is taken to measure the cumulative
influence of the no and nr number of encounters, respectively, with political activists from
the two parties on the political preference of a citizen, p = o, r:
V o(bok) ≡
no∑n=0
βobok(yn), V r(brk) ≡
nr∑n=0
βrbrk(yn). (4)
where the sign and magnitude of the parameters βo and βr show the direction and importance
13

of the spillover effect through encounters with politically active individuals representing the
ruling and rival parties respectively.21 A greater transfer to political activists increases sup-
port for the ruling politician through the spillover effect if and only if βp is positive. At the
level of the individual citizen, therefore, the spillover effect is a random variable that depends
on citizen-specific realizations of the number of meetings with activists np, the income yn of
these activists at each draw n = 0, ..., np, and thus the transfers that the activists receive
bpk(yn).
Party Affiliation in the Presence of Targeted Transfers
Denote Spk(b, y) as the expected fraction of citizens with individuals characteristics {p, k, y}
and receiving transfers b for whom a political affiliation with the ruling party maximizes util-
ity, where the expectation is taken over all possible income levels yn of politically active citi-
zens, and all possible number of encounters with politically active individuals np = 0, ...,∞.
Using (2) - (4), it is straightforward to determine that:22
Spk(b, y) = spk +1
2ε(αp(k, y)− αbbb/2) b+
Ik2ε
∑p=o,r
φpkβpbp
k/N, (5)
where bpk
denotes the average amount of targeted transfers received by politically active
21We assume that any effect of political activism, when unadulterated by preferential transfers, is alreadyembodied in the preference parameters θpo ; as such, we assume that vp(0) = 0.
22To see this, note, for example, that a politically inactive rival party citizen receiving transfers b will prefer
to affiliate with the ruling party if and only if ε > (θrr − θro)− (αp(1, y)− αbbb/2) b−∑
p=o,r
∑np
n=0 βpbp
k. The
associated fraction of individuals who prefer the ruling party is
1
2− 1
2ε
((αp(1, y) + αbbb/2) b+
∑p=o,r
np∑n=0
βpbpk− (θrr − θro)
)
Rewrite∑np
n=0 βpbp
k(yn)as npβp
∑np
n=0 bp
k(yn)/np. It follows that the fraction of ruling party affiliates in the
rival party depends on the random number of encounters with politically active individuals (np), and the
average transfers these individuals receive (∑np
n=0 bp
k/np). Because the expectation of np is simply φp
k/N
with Poisson arrivals, and sampling among political activists is assumed to be unbiased, the expectation of∑np
n=0 bp
k/np is just the population mean, as displayed in (5).
14
citizens with preference p:
bpk
=
∫y
bpk(y)dG(y). (6)
spk is a constant, given by:23
sok =1
2− kγ(max{θor , θou} − θoo)
2ε, srk =
1
2− kγ(θrr − θro)
2ε,
and
su1 =1
2− θuu − θro
2ε.
The two other terms in (5) display the direct and spillover effects of targeted transfers.
Political Clientelism with Citizen Activism
The ruling politician chooses targeted transfers bpk(y) to citizens with characteristics p, k,
and y in order to maximize the total citizen support, measured by the aggregate number of
ruling party affiliates, accounting for the cost of doing so:
maxbpk(y)
∫y
∑p=o,r,u
∑k=k,1
φpk (ρSpk(bpk(y), y)− λbpk(y)) dG(y), (7)
where ρ reflects the money equivalent gains from a unit increase in aggregate political sup-
port, and λ ≥ 1 denotes the marginal cost of public funds. Using (2) - (6), the solution to
(7) is given by:
bp1(y) = max{ 1
αbb(αp(1, y)− 2λε/ρ) , 0} (8)
bpk(y) = max{ 1
αbb
(αp(k, y)− 2λε/ρ+ (1− (φok + φrk)/N)βp
), 0}, (9)
where, to recall, αp(1, y) measures the direct effect of transfers to individuals with political
23 We assume henceforth that interior solutions apply.
15
preference p, activism k and income y:
αp(k, y) = αpb + αpkk + αpyy
The spillover effect of transfers to political activists with political preference p is
(1− (φok + φrk)/N)βp
. Naturally, (8) and (9) together admit a range of potential ordering of clientelistic transfers
over citizen type p, k, and y, as proposition 1 illustrates:
Proposition 1 In an interior equilibrium with bpk(y) > 0, clientelistic transfers
1. to citizens (regardless of political preference and activism) decrease in income y if and
only if there is diminishing marginal utility of income αpy < 0;
2. to non-activists favor rival and neutral affiliates, in that order, (br1(y) > bu1(y) > bo1(y)),
if and only if the ranking of direct effects is αr(1, y) > αu(1, y) > αo(1, y);
3. to activists over non-activists are positive bpk(y)−bp1(y) > 0 if either αpk > 0 and βp = 0,
or αpk = 0 and βp > 0, or αpk < 0 and βp >> 0;
4. to activists over non-activists decrease with the fraction of politically active citizens
(φpk) in the village if and only if the spillover effect is positive (βp > 0).
Let us start with income as a determinant of the direct effect αp(k, y). All else being
equal, the ruling politician preferentially targets low-income individuals if and only if αpy < 0,
as in Dixit and Londregan (1996) and Stokes (2005), for example, where the effectiveness of
transfers in influencing political preference decreases with the individual’s income. Thus, an
NREGS program that succeeds in preferentially targeting the poor may in fact have been
motivated by political gains in the presence of diminishing marginal utility of income.
16
Across individuals with different political preferences, all else being equal, politically
inactive citizens with pro-rival and neutral political preferences receive favorable preferential
transfers compared to pro-ruling party supporters if and only if,
αpb + αpk + αpyy > αob + αok + αoyy, p = r, u (10)
This simply implies that the direct effect of a rupee spent gives rise to a higher increase
in the support from rival party citizens, accounting for the moderating effects of political
activism and income.
Next, consider whether the politician will target political activists for their deep knowl-
edge of electoral preferences and their ability to influence political affiliation (Marcolongo
2017; Stokes et al. 2013). From (8) and (9), all else being equal, transfers to activists over
non-activists is
bpk(y)− bp1(y) =
1
αbb
(αpk(k − 1) + (1− (φok + φrk)/N)βp
).
It follows that transfers may favor political activists for a combination of reasons. First, con-
trary to Lindbeck and Weibull (1987), politically active individuals may be more susceptible
to the influence of political support buying (αpk > 0). Second, even when political activism
has no impact on the direct effect, αpk = 0, a positive spillover effect, βp > 0, may be present.
Third, consistent with Lindbeck and Weibull (1987), politically active individuals may be
less susceptible to the direct influence of political support buying αpk < 0, but the spillover
effect may be sufficiently large. To the extent that the signs of both βp and αpk are unknown,
empirical evidence on the preferential targeting of political activists may imply either that
spillover effects are present via βp > 0, or that political activists are relatively susceptible
to political support buying via αpk > 0 as part of the direct effect of targeted transfers to
political activists.
To resolve this ambiguity, note from (9) that the magnitude of the spillover effects is
17
inversely related to the share of politically active citizens (φok
+ φrk)/N , whereas the direct
effect is unaffected by this population share. Thus, if spillover effects are indeed present,
we should expect that such effects are greater in locations where political activism is less
common.24
We take these implications of the model to the data in the sections that follow. The
empirical relationships between clientelistic transfers and citizen characteristics will be taken
as evidence of the validity of a number of assumptions about the nature of political prefer-
ences, including the existence of direct and spillover effects, and the role of income, political
affiliation, and political activism as mediating factors (as stated in Proposition 1).
4 Data Description
Our dataset encompasses 1,673 households from villages governed by a UPA affiliated sarpanch
in Andhra Pradesh. Our core dataset was collected from a primary field survey conducted
between August and October 2006. It spans four districts: Kadapa, Nellore, Warangal, and
Nalgonda (the first three belong to phase-I of NREGS implementation, and the last belongs
to phase-II). The latter two districts currently belong to Telangana, a state that seceded
from Andhra Pradesh in 2014; Kadapa and Nellore are still a part of Andhra Pradesh.25
The survey collected job-card numbers for all participating households, enabling us to
merge publicly available administrative data (available at http://nrega.ap.gov.in/) into our
survey. The administrative data provides information on NREGS workdays and payments
for each job card.26 Muralidharan, Niehaus, and Sukhtankar (2016) compared NREGS
24 Across citizens, transfers decrease with the spread of citizens 2ε, because the same amount of transferswill give rise to a smaller increase in support when ε is large. Transfers also decrease in the marginal costof public funds λ and increase in the money equivalent gains of political support ρ as perceived by theruling politician. All three of these factors are likely to be jurisdiction-specific, which is accounted for in ourempirical analysis through village fixed effects.
25 In section 6, we show that clientelistic patterns are similar across Telangana and non-Telangana districthouseholds, implying that the politics of Telangana’s secession do not influence our results.
26 We are able to merge 97 percent of the households who reported to possess job cards with the admin-istrative data based on household-reported job card numbers. The remaining three percent households thatwe fail to merge with the administrative data are excluded from our final sample.
18
payments from their household survey data with those from the administrative data based
on household-reported job card numbers in Andhra Pradesh and did not find any project
leakages.27 This result is consistent with the results from the verification exercises in Sheahan
et al. (2016).28 Both studies support that the data we collected yield reliable information
on NREGS participation.
Our survey also collected data on household affiliation with a particular political party,
if any, which we code into alliances: UPA, UPA-rival, and unaffiliated (the last category
implies no affiliation with any party or affiliation with a few fringe parties), based on the
coalition definitions stated earlier.29 Political affiliation of the village sarpanch is not directly
available because elections to the GP do not run on party labels. However, we were able
to deduce the sarpanch’s party affiliation from households’ response to the three questions
in our survey: (i) Did you vote for the winner in the last GP election? (ii) If so, was that
vote for party affiliation reasons? (iii) With which party are you affiliated?. We found mixed
responses regarding the sarpanch’s affiliation across households, reflecting that many villagers
are unaware of this information about their sarpanch. Considering this heterogeneity in
reporting, we assigned each village sarpanch’s party affiliation to be the one that more
than 50 percent of the sampled households reported. In villages without this majority,
27 Muralidharan, Niehaus, and Sukhtankar (2016) found leakages in NREGS in Andhra Pradesh throughtwo channels: 1. Ghost beneficiaries who did not exist; 2. Fake job cards created by local officials forreal households for stealing NREGS money. However in the second case, the households usually do notknow about the existence of these job cards. Since our NREGS work data is collected based on the jobcard numbers reported by the sample households, the information on NREGS participation collected usingour method is less subject to these concerns on mismatch and leakages. In fact, Muralidharan, Niehaus,and Sukhtankar (2016) compared NREGS payments between the administrative data and their survey databased on household-reported job cards and did not find any project leakage in subdistricts which formed thecontrol group of their study (which evaluates the Smartcard initiative program in India).
28 Sheahan et al. (2016), who also used the same administrative dataset as in our paper, verified thatthe NREGS participation information collected in our way is reliable: “Household interviews on wagesearned and work done by job-card holders match entries in post-office or bank books wherever these wereavailable. Likewise individual recall data on the type of work done and number of days are also consistentwith administrative data, as are the list of assets created since inception.”
29 The same set of questions was administered to females and males in the household, however in ourstudy, we use data reported by males because females tend to participate less in politics, are less politicallyinfluential, and make fewer household economic decisions than men. There could be a concern that becauseparty affiliation is self-declared, it may not reflect actual voting behavior but rather a desire to show gratitudeto the GP leaders. However, this is not a concern here because the survey was conducted in the interviewee’shouse by enumerators; and Panchayat leaders are not expected to see the information in the survey.
19

we left the affiliation blank. Households stating affiliation with a particular party were
also questioned about political activities in which they were involved. We recoded these
activities as either “Politically Active” (campaigning, attending meetings, giving speeches
and writing pamphlets, attending rallies, and offering donations), or “Politically Inactive”
(No participation).30
Table 1 provides the distribution of households in our sample based on a variety of char-
acteristics. Over one-third (39.93 percent) of households are UPA-affiliated and politically
inactive; 19.25 percent are UPA-affiliated and politically active, 10.64 percent are UPA-rival
affiliated and politically inactive, 5.98 percent are UPA-rival affiliated and politically active,
and the rest (24.21 percent) are unaffiliated.
The highest representation is by Other Backward Caste (41.06 percent), followed by
Scheduled Caste (25.52 percent), Forward Caste (19.90 percent), and Scheduled Tribe (13.51
percent). The “Poorest of the Poor” category represents 36.40 percent of the sample, followed
by “Poor” (30.36 percent), “Not so poor” (25.22 percent), and “Non-poor” (8.01 percent)
households.31
Among household heads, 59.18 percent are not formally literate (they may have received
informal education), about a quarter (24.63 percent) received secondary education or be-
low, and about 16.20 percent received high school education. The most popular occupation
is casual work in agriculture and other sectors (44.29 percent), followed by salaried work
in agriculture and other sectors (30.78 percent) and business ownership or self-employment
in agriculture and other sectors (12.25 percent). Non-working adults (typically pension-
ers/rentiers, dependents, students and those focusing on households chores) form 7.59 per-
30 We test the robustness of our results to alternative definitions of coding these activities in section 6.31 Household poverty status was determined by a state-wide effort of “participatory identification of the
poor” that added vulnerability and social exclusion to quantitative indicators from the 2001 national censusand duly ratified by village assemblies. Each household was assigned to one of the four categories: “Poorestof the poor” (those who have food only when they get work, lack shelter, proper clothing, respect, and oftencannot send children to school), “Poor” (those who have no land, live on daily wages, and may need to sendschool-age children to work in times of crisis), “Not so poor” (those who have some land and proper shelter,send children to public schools, and have access to bank credit and public services), and “Non-poor” (thosewho own at least five acres of land, can hire laborers, send children to private schools, use private hospitals,lend money, and have high status).
20

cent of the sample; 3.77 percent own common property resources and manage livestock and
1.32 percent are engaged in other occupations. Over three-quarters (77.64 percent) of the
sample households have non-literate spouses, 16.98 percent have spouses with secondary ed-
ucation or below (completed grade 10 or below) and 5.38 percent have spouses who have
graduated from high school (completed grade 11 or grade 12). The average proportion of
adults in a household is about 60 percent and the average hours of newspaper reading per
week is 3.97.
In terms of number of people in each household, 12.97 percent of households have two
or fewer members, 15.25 percent have three members, 30.54 percent have four members,
and 41.24 percent have five or more members. The majority of farmers (71.55 percent)
have less than one acre land, 11.06 percent have between one and two acres of land, 6.28
percent have between two and three acres of land, 5.02 percent have between three and five
acres of land, and 6.1 percent have more than five acres of land. Around one-third (33.29
percent) of households dwell in a hamlet. Regarding access to electricity, 16.80 percent
of households have no electricity connection, 54.87 percent of households have an official
electricity connection, and 28.33 percent of households have unofficial electricity connection.
Table 2 describes the cumulative NREGS benefits in 2006 and 2007 in UPA sarpanch
villages. Column 1 indicates that UPA-active households obtained the highest proportion
of job-cards (42.54 percent), followed by UPA-inactive households (39.37 percent), UPA-
rival active households (38.00 percent), Unaffiliated households (35.30 percent), and UPA-
rival inactive households (31.46 percent). Columns 2 and 3 report averages of days worked
and payment received for job-card holders only. Average days worked and payments were
highest among UPA-active households (37.03 days and 3,160 Indian Rupees [henceforth,
INR]) followed by unaffiliated (35.23 days and 2,672 INR), UPA-inactive (35.11 days and
2,791 INR), UPA-rival inactive (33.33 days and 2,883 INR), and UPA-rival active (23.15
days and 1,911 INR).
21
5 Empirical Methodology
To empirically examine whether households obtain higher or lower NREGS benefits based
on political coalition affiliation and level of political activism, as shown in the theoretical
framework, we estimate a Tobit model in which the latent variable is specified as:
yiv = γ1PolCategoriesiv + γ2Xiv + γv + εiv, (11)
where yiv, the latent variable determined by the above process, in turn yields two observable
outcomes for household i at village v : (i) log(days+1), or the logarithm of days worked
in NREGS, and (ii) log(amount earned+1), or the logarithm of amount earned through
NREGS, both cumulative over 2006 and 2007.32 εiv is the error term.
In (11), PolCategoriesiv is a vector that interacts a household’s political affiliation (UPA,
UPA-Rival, or unaffiliated) and activism (active or inactive). The interaction gives five polit-
ical categories: 1) UPA-inactive, 2) UPA-active, 3) UPA-rival Inactive, 4) UPA-rival Active,
and 5) Unaffiliated. Xiv refers to the following socio-demographic and economic indicators in
2006: caste, poverty status, household size, proportion of adults, primary occupation, edu-
cation of the household head, education of the spouse, land ownership categories, availability
of electricity connection, location in a hamlet, and hours spent reading newspapers in the
past week. The poverty status, having been developed from a combination of quantitative
and participatory qualitative methods, is unique and precisely captures each household’s
economic status. We include village fixed effects, γv, to capture supply side unobservables
(eg., the availability of NREGS jobs and funds at the village level) and demand side fac-
tors (eg., rainfall, ratio of land owners versus landless, non-farm opportunities). We cluster
standard errors at the village level. The parameter of interest is γ1, which indicates whether
political party membership and activism were considered in the allocation of NREGS work
and benefits.
32 We set days worked and payments of non-participating households to 0.
22

There exist several concerns for the identification of the effects of political affiliation and
activism in (11). First, households may self-select into the program based on unobserved
characteristics (such as desire to work under NREGS) which may be correlated with politi-
cal affiliation and activism. However, this issue is alleviated largely by the well-documented
unmet demand for NREGS work (Gaiha et al. 2010, Dutta et al. 2012, Maiorano 2014,
Narayanan and Das 2014, Das 2015, Sheahan et al. 2016, and Sukhtankar 2016). In Andhra
Pradesh, the percentage of households that sought but did not receive work was 25 percent
in 2009-10 (Liu and Barrett, 2015), and 21 percent, particularly for medak district in 2009
(Ravi and Engler 2015). Rationing was higher in earlier years of the program: 43 percent
in 2007 (Ravi and Engler 2015). Narayanan et al. (2016) further argue that the administra-
tive rationing itself may be underestimated because individuals who wish to participate in
NREGS may be discouraged from job seeking due to extensive rationing. The supply-driven
nature of NREGS is particularly prominent during the initial years of the program (which is
our study period), because NREGS wage was almost universally higher than the prevailing
rural wage in the initial years of the program.
To test whether the supply-driven feature of NREGS has indeed mitigated the self-
selection concern, we use job-card ownership as a proxy for desire to work under NREGS
and examine if job-card ownership is correlated with political affiliation and activism in the
below Probit specification:
Prob(Jobcardiv = 1) = Φ(η1PolCategoriesiv + η2Xiv + ηv + εiv), (12)
where Jobcardiv indicates household job-card ownership and Φ(.) is cumulative distribution
function of the standard normal distribution. All the control variables are the same as in
(11). We consider job-card ownership as a good indicator of household’s inclination to work
in NREGS, because (i) owning a job-card is a prerequisite for NREGS employment; and (ii)
job-card issuance in Andhra Pradesh is free of charge and straightforward. We test the null
23
hypothesis, η1 = 0. We would expect η1 6= 0 if desire to work is correlated with political
affiliation and activism after controlling for the observables. Accordingly, if we fail to reject
η1 = 0, we are less concerned about this omitted variable issue. In addition, we re-estimate
(11) using a restricted sample of only the job-card-holding households to check the robustness
of our estimation. We also follow Das (2015) who employs the Heckman selection correction
methodology to correct for sample selection bias in the restricted sample.33
Second, one may be concerned that other demand-side unobservables at the household
level may bias our estimation. For example, activists may be engaged in job seeking more
aggressively and, as a result, obtain more NREGS benefits. To deal with this concern, we
conduct a falsification test using data from non-UPA sarpanch villages. Our main set of
analysis focus on UPA-sarpanch villages. We expect clientelistic transfers of NREGS to
be minimal for non-UPA sarpanch villages for three reasons. First, the non-UPA sarpanch
lacks the resources for engaging in clientelism and/or is not able to ally with or dominate
state-appointed FAs who likely belong to UPA, in order to achieve common political objec-
tives. Second, because the NREGS program was originally conceived by the INC-led UPA
government in 2006, there may be “leakage of goodwill” for non-UPA parties to engage in
vote/support buying using the NREGS (Gupta and Mukhopadhyay 2016). Finally, non-
UPA-sarpanches may not engage in clientelism using NREGS funds because of the rational
expectation that electors strongly identify the NREGS with the UPA and may not credit
the non-UPA sarpanch with the transfers (Sheahan et al. 2016).34 If activists or specific
party affiliates are targeted due to unobservable characteristics beyond clientelism, such as
their ability to demand for NREGS jobs, significant targeting towards these groups should
33 We follow Das (2015) to use the “Proportion of working adults in the household” as the exclusionrestriction for the first stage equation of the Heckman model. Das (2015) argues that households with highernumber of working members are more likely to seek work but not necessarily be allotted more work, especiallyafter controlling for other socio-demographic characteristics. We use this method to check robustness of ourresults, having in mind that the exclusion restriction may have limitations.
34 Sheahan et al. (2016) show that sub-district-level NREGS spending before 2008-2009 positively in-fluenced UPA votes in the federal elections of 2009, but did not significantly affect votes for the actualincumbent sub-district leader, hinting that electors perhaps identify the NREGS with the UPA, and creditthe UPA for the NREGS benefits they receive even if their leader belongs to a non-UPA party.
24
be present even in non-UPA sarpanch villages. We test this hypothesis (γ1 = 0) for (11) in
non-UPA sarpanch villages.
Third, reverse causality may arise if party affiliation or activism is a result of benefits
received or promised under NREGS. For phase-1 villages (where the program started in
February 2006), we measure political affiliation in the survey months of August to October,
just after the commencement of NREGS. In phase-2 villages, our survey captures political
affiliation before the program started in April 2007, thus making identification cleaner here.
However, in phase 1 villages where households in our sample may have received work or
promise of work, there is a lapse of six months between when the program started and when
we measure political affiliation. Figure 2 presents a timeline of these events. To rule out
reverse causality concerns, we conduct a robustness check by repeating the analysis after
removing households that received jobs or job-cards (a proxy for seeking work in response
to a promise) during these six months.
Fourth, there could be concerns that party affiliation and activism may have been shaped
by other program transfers which are correlated with NREGS transfers. We check robustness
of our results by controlling for transfers from other village-level public programs, such as
the Public Distribution System (PDS) and the Mid-Day Meals (MDM). Our study period
is concurrent with the 2004-2010 Telangana protests which sought to separate Telangana
districts into a separate state from Andhra Pradesh. There may be a concern that the
politics surrounding the secession of Telangana could be driving our results. To alleviate
this concern, we interact the binary variable “Residing in a Telangana district” with the
political categories to see whether our findings are consistent between Telangana and non-
Telangana districts. Since political affiliation and activism are correlated with household
socio-economic characteristics which affect NREGS allocation, one may concern that our
results may be driven by inclusion or exclusion of certain socio-economic characteristics in the
specification. To address this concern, we show robustness of our results while sequentially
adding different socio-economic characteristics in the the control.
25
In addition, we examine if our empirical results are sensitive to our definition of political
activism by redefining the political activism categories as very-active and less-active. In the
new definition, only extremely active citizens who are strongly expected to engage in and
influence political campaigns and shape public opinion are placed in the very-active group.
These activists are individuals involved with campaigning, giving speeches and writing pam-
phlets. Those citizens engaged in less extreme activities, such as attending rallies, speeches,
and meetings, giving donations, or those not involved in any activity were placed in the
less-active group.35
6 Results
In section 6.1, we show how NREGS benefits are targeted based on political activism and af-
filiation. In section 6.2, we show results from several falsification tests and robustness checks
to support the identification of our empirical strategy. We further explore the underlying
mechanisms of the observed clientelistic transfers in section 6.3.
6.1 Targeting NREGS Benefits based on Political Affiliation and
Activism
Table 3 presents the Tobit regression results of NREGS work days and payments on political
affiliation and political activism in UPA-sarpanch villages, from (11). The results indicate
that political affiliation and activism play a significant role in explaining NREGS days worked
and payments received (columns 1 and 2, respectively). We have two main findings. First,
within each of the UPA and UPA-rival groups, activists are targeted significantly more than
inactive electors.36 Second, among inactive voters, the unaffiliated and rival groups get
significantly more benefits than UPA affiliates. Among the active electors, the rival group
35 Only four households offered donations in our sample. Our results are robust when we assign these fourhouseholds who giving donations to the “very-active” group.
36 The F-test results are reported at the bottom of Table 3.
26

gets significantly more than the UPA group.37 These results indicate potentially that the
UPA-sarpanch is pursuing clientelistic practices in order to elicit support responses from
particular target groups outside of his/her party, thus following an expansionist strategy.
The marginal effects on the observed outcomes give a sense of the magnitude of transfers.
Compared to the UPA-inactive group, the UPA-sarpanch allocates 21 percent more days and
57 percent more payment to the UPA-active group, 16 percent more days and 34 percent
more payment to the UPA-rival inactive group, 40 percent more days and 130 percent more
payment to the UPA-rival active group, and 16 percent more days and 35 percent more
payment to the unaffiliated group.38
Engaging in political clientelism depends crucially on the sarpanch’s awareness about the
electorate’s political preferences, affiliation, and activism levels, which in turn requires strong
social networks with village members. Considering the close-knit community that tends to
exist in Indian villages, such awareness levels are conceivable.39 We relate these findings to
the literature on how NREGS played a positive role in UPA’s victory in the federal elections
in 2009 (Elliott 2011; Ramani 2009; Zimmermann 2015, Sheahan et al. 2016). Although our
study does not explicitly examine whether individuals receiving clientelistic transfers voted
in favor of UPA in future elections, the findings in this literature strengthen our case by
demonstrating that politicians have an incentive to use the NREGS for vote buying if they
are rational and aim to maximize votes.
The order of benefits delivered to each political category is different from those presented
in the descriptive statistics in Table 2, raising the possibility that the political categories
may be correlated with household socio-economic characteristics. To check if our results
are sensitive to inclusion/exclusion of certain socio-economics characteristics, we examine in
37 Pair-wise F tests between coefficients of the political variables, reported in Table 3, suggest the corre-sponding differences of the coefficients are statistically significant at the 1 percent level.
38 The marginal effects on log days and log payment are in columns 1 and 2 of Table A1.39 Typically each village has a large main settlement where the majority of the population lives, and
perhaps a few hamlets housing small communities. In our sample, about 83 percent of the sarpanches live inthe main settlement, giving them a chance to engage with and learn about the bulk of the village residents’political preferences.
27
Table A2, the results for days and payment without any control variables (column 1), and
after including additional control variables in subsequent regressions (columns 2-8). While
column 1 mirrors the descriptive statistics (although all the differences are not significant),
the addition of village fixed effects simply changes the results to be consistent with the
sarpanch’s expansionist strategy and targeting of activists, as seen in Table 3. Addition
of control variables does not change the results qualitatively, assuring us that household
characteristics do not drive our results. We also present the distribution of the sample by
poverty status and caste group for each political category in Table A3, showing that they
are not vastly different across political categories.
Despite political affiliation and activism playing important roles, needs-based variables
also significantly influence NREGS work and benefits with expected signs. To give a few ex-
amples, households whose heads are casual workers (the most vulnerable of the categories),
households whose heads and their spouses are not literate and did not receive any formal
education, the poorest-of-the-poor households, and households belonging to the historically
backward castes receive the most jobs and payments.40 Similar results on the importance of
need-based variables in public program targeting have also been observed by prior studies.41
These results are also consistent with the prediction of our theoretical model which suggests
that ruling politician preferentially targets low-income individuals motivated by political
gains in the presence of diminishing marginal utility of income (Proposition 1). Our results
on clientelism do not implicate the performance of the NREGS in helping the target popula-
tion, but they are consistent with the larger problems facing decentralization in developing
countries (Bardhan and Mookherjee 2012).
40 Scheduled Tribe (ST) households, however, receive less work than Forward Caste households, contraryto expectations of higher needs emerging from this former group (Deshpande, 2001; Srinivasan and Mohanty,2004). This is perhaps because tribal settlements tend to be isolated, with fewer visiting officers and withrocky soil, making it hard to implement or build infrastructure projects (Maiorano and Buddha, 2014). Theseattributes of tribal settlements perhaps do not get sufficiently captured by the binary variable indicating“residence in a hamlet”.
41 See, for example, Das (2015) and Sheahan et al. (2016) for coverage of NREGS program in India, andMarkussen (2011) and Besley, Pande, Rao (2005, 2012) for coverage of Below Poverty Line card provision inIndia.
28
6.2 Falsification Tests and Robustness checks
To examine if our estimation is biased by household self-selection into NREGS works, we
use job-card ownership to proxy for desire to work and run a probit regression of job-card
ownership on household characteristics in UPA-sarpanch villages, as in (12). The results are
presented in Table 4. The political variables are jointly insignificant at any conventional
level. This alleviates our concerns about the missing variable of unobserved desire to work
in (11).
Following a different strategy, in Table A4, we restrict our sample to job-card holders
only and show that our results on clientelism are consistent (columns 1 and 2). However,
these results may suffer a potential sample selection bias. To address this, we employ the
Heckman selection correction methodology. Following Das (2015), we use the “Proportion
of working adults in the household” as the exclusion restriction for the first stage equation
which determines job-card seeking (proxy for desire to work) but not actual work done or
payment in the main estimating equation.42 This method also yields qualitatively consistent
results (columns 3 and 4 of Table A4).
To alleviate the concern that other demand-side unobservables at the household level
may have biased our estimation, we conduct a falsification test for (11) using the sample in
non-UPA sarpanch villages.43 The results are presented in Table 5. The political variables
are individually and jointly insignificant for both NREGS workdays and payments, indicating
that our findings in UPA-sarpanch villages are not driven by other unobserved demand-side
factors (such as activists having higher ability to demand for NREGS work).44
To alleviate our concerns of reverse causality, we conduct robustness checks by repeating
42 Das (2015) used ”number of working adults” as the exclusion restriction, arguing that householdswith higher number of working members are more likely to seek work but not necessarily be allotted morework, especially after controlling for other socio-demographic characteristics. Our exclusion restriction iscomparable to Das (2015) because we also controlled for household size.
43 Table A5 presents the descriptive statistics in non-UPA-sarpanch villages.44 We conducted similar analysis exclusively for UPA-rival sarpanches (comprising only BJP or TDP
party sarpanches) and found no support for clientelism. These results are not presented in this paper butare available upon request.
29

the analysis in (11) after removing the households that received jobs or job-cards (a proxy for
seeking work in response to a promise) during the six months between the commencement
of phase-I NREGS (February 2006) and our survey (August-October 2006). Our results
remain qualitatively robust after excluding households that received jobs during this period
(columns 1 and 2 in Table A6), and alternately excluding households that received a job-card
during this period (columns 3 and 4 in Table A6).
Our results are robust after controlling for transfers from the Public Distribution Sys-
tem (columns 1-2 in Table A7) and the Mid-Day Meals (columns 3-4 in Table A7). Further,
columns 1-4 in Table A8 present the marginal effects of political categories separately for
Telangan and non-Telangana districts. The results remain qualitatively robust across both
sets of districts (in comparison with overall marginal effects presented in Table A1), in-
dicating that what we see in Table 3 is not influenced by activities specific to Telangana
or non-Telangana movement-driven politics. Our results are also robust to the modified
definition of activism (shown in Table A9).
6.3 Mechanisms
The empirical results (Table 3) suggest that, in UPA-sarpanch villages (i) politically active
households are offered relatively more NREGS jobs and benefits than inactive households;
and (ii) Unaffiliated and rival party-affiliated households are preferentially targeted compared
to loyalists. In this section, we further explore the underlying mechanisms related to these
results.
6.3.1 Spillover Effects through Activists
Following the theoretical model, the finding that political active households are targeted
may result from two reasons: (i) activists are easily susceptible to transfers (αpk > 0) or (ii)
positive spillover effects (βp > 0) exist from active to inactive households and the politician
expects to tap into those effects. Between these two possible mechanisms, we examine if the
30

spillover effects play a major role by testing whether politically active households receive
fewer benefits in areas with a higher fraction of politically active citizens (as predicted in
Proposition 1). To do this, we interact the share of politically active households in the village
(ShareActivev) with a binary variable indicating political activism (Activevi) and run the
following regression:
yiv = ξ1PolCategoriesiv + ξ2Activeiv ∗ ShareActivev + ξ3Xiv + ξv + εiv (13)
Note that in (13), we do not include ShareActivev because it is absorbed by the village fixed
effects and thus cannot be identified. Our parameter of interest is:
ξ2 =∂E(y)
∂ShareActive|Active=1, (14)
which is predicted to be negative if and only if spillover effects exist and are positive (Propo-
sition 1).
In columns 1 and 2 of Table 6, we show results from (13) and note that the coefficient
estimate of the interaction term of being politically active and the proportion of politically
active households is negative and significant at the 1 percent level. Thus, UPA-sarpanches
appear to target transfers to political activists, depending on the scale of the influence of
political activists in the village. The results imply that a 1 percent increase in the share
of politically active households in the population decreases days worked and payments for
activists by 0.74 percent and 1.54 percent respectively. This finding is consistent with the
prediction of Proposition 1, suggesting that positive spillover effects are the underlying mech-
anism through which the NREGS benefits are targeted. In other words, our results support
that politically active households are targeted in order for them to carry the political goodwill
of the ruling party and to influence others.
We next provide supporting results for spillover effects by testing our motivating example
in the introduction of this paper, wherein political parties sometimes target brahmins (the
31
highest caste group) in India, in order to indirectly influence other voters because brahmins
are often looked up to in Indian rural societies (Vij, 2016). We interact the binary variable
for activism with the share of households belonging to activists’ own- and lower-castes com-
bined as an additional control variable. If the coefficient of this interaction is positive, it
indicates that activists are rewarded relatively more benefits if they can influence a larger
number of individuals through caste networks, and particularly the lower caste groups by
acting as role models. Results from columns 3 and 4 in Table 6 show that the coefficient
of the interaction term is indeed positive and significant, which supports the mechanism on
information spillover through activists.
Stokes et al. (2013) argue that the usage of middlemen in carrying out party services
tends to be stronger in areas where other channels of information spillover are absent and
where communication technologies are weaker. To test this, we interact the binary variable
for activism and a proxy for availability of communication technology or remoteness of the
village and include these separately in our estimating equation. Results from Table 7 show
that activists living in remote areas (measured by distance and bus-fare to the nearest town)
and those living in areas without telephone connections or fewer telephone lines or those
without a community TV are provided relatively more NREGS work days.45 Similar results
are obtained for payments received by households and are presented in Table A10. While
these results are not direct predictions from the theoretical model, they provide important
supporting evidence for spillover effects from active to inactive voters being an important
reason for which activists are targeted.
6.3.2 Targeting Rival Party Affiliates through an Expansionist Strategy
Unaffiliated and rival party-affiliated households are preferentially targeted compared to loy-
alists, indicating an expansionist strategy pursued by UPA-sarpanches. If the UPA-sarpanch
is indeed engaged in an expansionist strategy to attract rival affiliates, we could expect the
45 The sample size varies across specifications because of the missing values of the control variable whichworks as proxy for availability of communication technology or remoteness of the village.
32

extent of clientelism to be higher in villages with a high proportion of non-UPA households.
To test this, we create a variable at the village level, UPADominancev, which takes the
value of 1 if a particular village has higher than the median share of UPA households in the
sample villages and 0 otherwise.46 In a separate regression, we include the interaction of
UPADominancev with the political categories:47
yiv = δ1PolCategoriesiv + δ2UPADominancev ∗ PolCategoriesiv + δ3Xiv + δv + εiv. (15)
If the sarpanch follows an expansionist strategy, we expect δ1 and δ2 to have opposite signs
so that the absolute value of (δ1 + δ2) (the marginal effects of PolCategoriesiv on yiv in
villages with a higher proportion of UPA households) would be smaller than the absolute
value of δ1 (the corresponding marginal effects in villages with a lower proportion of UPA
households).
In columns 1 and 2 of Table 8, the coefficients on the interactions of UPA-dominance
and political categories are negative and significant at the 1 percent level, indicating that
the marginal effects of these political categories on the latent variables for UPA-dominant
villages are significantly lower than those for the villages with higher share of non-UPA-
households. This finding supports that UPA-sarpanches employ clientelism to expand their
party base. In columns 3 and 4 of Table 8, we repeat the analysis in UPA-sarpanch villages
with closer political profiles (villages whose share of UPA-affiliated households ranges be-
tween 0.25 and 0.75), in order for similar villages to be compared with each other. These
results are consistent with those in columns 1 and 2.
Our results on the sarpanch favoring rival party-affiliated and unaffiliated households
differ from other studies in the Indian context which have found that local leaders patronize
loyalists by offering them relatively more benefits.48 These differential findings could be
46 The median share of UPA households across all vilages is 0.30.47 We do not include UPADominancev because it cannot be identified when village fixed effects are
included in the regression.48 Prior literature on India, as noted in the introduction, found that party loyalists and members are given
preference in welfare programs (Das, 2015; Bardhan et al. 2009; Besley, Pande and Rao, 2012; Markussen,
33
explained by our focus on addressing reverse causality issues and by the unique position
of power of the INC-led UPA government in Andhra Pradesh, which led the sarpanches to
employ such expansionist strategies. Our results are also different from those of Sheahan et
al. (2016), which employed sub-district-level data and found no partisan-influenced spending
in Andhra Pradesh before the 2009 state assembly election, but a modest role of political
leaning in distributing funds after 2009. This contrast strengthens the initial motivation for
our work – the fact that within-village household-level benefit allocation patterns could be
different from aggregate-level resource allocation patterns.
6.3.3 Ruling Out Other Mechanisms: Voters and Non-Leader Politicians
Political activists could be targeted because they are likely to be politicians who are perhaps
receiving favors from the village sarpanch. To check if this mechanism holds, in (11), we
control for a binary variable indicating whether a politician lives in the household.49 Our
results do not change after the inclusion of this variable, indicating that this is unlikely a
mechanism at play (columns 1 and 2 for days and payments, respectively in Table 9).
Activists or UPA-rival affiliates could be more likely targeted because they may go out
and vote more compared to non-activists or UPA affiliates. But this is not a big concern
because our data indicate that voting behavior is universal and very similar across the five
political categories, and is not particularly high for activists or any party affiliates.50 We
control for a binary variable on voting in recent elections in (11) and present the results in
columns 3 and 4 for days and payment respectively in Table 9. Our results on activists and
UPA-rival affiliates being targeted are robust to the inclusion of this variable.
2011.)49 We define politician here as sarpanch, vice sarpanch, ward member, member of Mandal Parishad
Territorial Constituencies, mandal vice-president, mandal president, member of Zilla Parishad TerritorialConstituencies, Zilla Parishad vice-chairman, Zilla Parishad chairman, or other political position holder.
50 About 95 percent households voted among the UPA-inactive category; 98 percent voted among theUPA-active category; 93 percent voted among the UPA-rival inactive category; 94 percent voted amongthe UPA-rival active category; 94 percent voted among the Unaffiliated category. We also run additionalregressions to show that political variables are not individually and jointly significantly correlated to votingbehavior. These results are available in Table A11.
34

7 Conclusion
This paper contributes to the literature by developing a model of political clientelism based
on an under-explored citizen attribute – political activism, in addition to two other at-
tributes: political affiliation and income. The model uncovers the role of “politically active”
individuals in their ability to influence and shape opinion, as well as the inclination of politi-
cians to offer targeted transfers to this group in order to indirectly influence other voters
(ie., activists or undecided voters).
We take these model predictions to data and examine the clientelistic practices of local
village leaders under the National Rural Employment Guarantee Program (NREGS) in In-
dia, a public works program operating with unprecedented levels of decentralized funding.
We exploit the unique timing of our survey to address critical reverse causality issues in
estimating the effects of political affiliation and activism on receiving program benefits. We
conduct falsification tests and robustness checks to address identification concerns arising
from households’ self-selection into NREGS work and other concurrent factors such as split
of Telangana from AP and participation of other public programs.
Consistent with the theoretical model, our results provide robust evidence for clientelism
in villages governed by a sarpanch affiliated with the UPA coalition; in these villages, the
sarpanch is able to strategically allocate more resources to politically active households than
to politically inactive households. We show that the active group is targeted because of a
potential information spillover from the active to the inactive group, and not particularly
because the active group is more susceptible to transfers, or because they tend to be more
active job-seekers or earnest voters. We further find that unaffiliated households or rival
party affiliates are offered more benefits compared to loyalists, highlighting an expansionist
strategy employed by the formidable UPA sarpanch. This collective evidence sheds new light
on clientelistic vote buying through the channels of mobilizing support from swing voters
and influencing the behavior of political activists.
35
References
Afridi, Farzana, Vegard Iversen, and M. R. Sharan, “Women Political Leaders, Corruption
and Learning: Evidence from a Large Public Program in India,” Economic Development
and Cultural Change, forthcoming (2017).
Government of Andhra Pradesh, “Andhra Pradesh Employment Guarantee Scheme: Op-
eration Manual,” Commissioner, Rural Development, Government of Andhra Pradesh
(2006).
Aiyar, Yamini and Salimah Samji,“Transparency and Accountability in NREGA A Case
Study of Andhra Pradesh,” Accountability Initiative Working paper No. 1, February
(2009).
Anderson, Siwan, Patrick Francois, and Ashok Kotwal, “Clientelism in Indian Villages,”
American Economic Review 105 (2015): 1780-1816.
Asher, Sam and Paul Novosad, “Politics and Local Economic Growth: Evidence from India,”
Available online at http://www.dartmouth.edu/~novosad/asher-novosad-politicians.
pdf (2015)
Bannerjee, Abhijit, Selvan Kumar, Rohini Pande, and Felix Su, “Do Informed Voters Make
Better Choices? Experimental Evidence from Urban India,” Unpublished working paper
(2011).
Banerjee, Abhijit and Rohini Somanathan, “The Political Economy of Public Goods: Some
Evidence from India,” Journal of Development Economics 82 (2007): 287-314.
Bardhan, Pranab, Sandip Mitra, Dilip Mookherjee and Abhirup Sarkar, “Local Democracy
and Clientelism: Implications for Political Stability in Rural West Bengal,” Economic &
Political Weekly 44(2009): 46-58.
Bardhan, Pranab and Dilip Mookherjee, “Political Clientelism and Capture Theory and
Evidence from West Bengal, India,” UNU-WIDER Working Paper No. 2012/97 (2012).
Besley, Timothy, Rohini Pande and Vijayendra Rao, “Participatory Democracy in Action:
Survey Evidence from South India,” Journal of the European Economic Association 3
(2005): 648-657.
Besley, Timothy, Rohini Pande and Vijayendra Rao, “Just Rewards? Local Politics and
Public Resource Allocation in South India,” World Bank Economic Review 26 (2012):
191-216.
36

Bhattacharyya, Dwaipayan, “Of Control and Factions: The Changing ‘Party-Society’ in
Rural West Bengal,” Economic & Political Weekly 44 (2009): 59-69.
Block, Steven A., “Political Business Cycles, Democratization, and Economic Reform: the
Case of Africa,” Journal of Development Economics 67 (2009): 205-228.
Case, Anne, “Election Goals and Income Redistribution: Recent Evidence from Albania,”
European Economic Review 45 (2001): 405-23.
Centre for Media Studies, “Lure of Money in Lieu of Votes in Lok Sabha and Assembly
Elections The Trend: 2007-2014,” CMS India Corruption Study October (2014).
Chamorro, Mariandrea, Jasmin Cho, Diane Coffey, Dane Erickson, Maria Elena Garcia
Mora, Payal Hathi, Jenny Lah, and Piali Mukhopadhyay, “Holding Government to Ac-
count: The Case of the National Rural Employment Guarantee Act (NREGA) in Andhra
Pradesh, India,” Princeton: Princeton University (2010).
Cole, Shawn, “Fixing Market Failures or Fixing Elections? Agricultural Credit in India,”
American Economic Journal: Applied Economics 1 (2009): 219-50.
Cox, Gary W., and Matthew D. McCubbins, “Electoral Politics as a Redistributive Game,”
Journal of Politics 48 (1986): 370-389.
Dahlberg, Matz, and Eva Johansson, “On the Vote-Purchasing Behavior of Incumbent Gov-
ernments,” American Political Science Review 96(2002): 27-40.
Das, Upasak, “Does Political Connections and Affiliation Affect Allocation of Benefits in
the Rural Employment Guarantee Scheme: Evidence from West Bengal, India,” World
Development 67 (2015): 202-217.
Dasgupta, Rajarshi,“The CPI(M) Machinery in West Bengal: Two Village Narratives from
Koch Bihar and Malda,” Economic & Political Weekly 44 (2009): 70-81.
Deshpande, Ashwini, “Caste at Birth? Redefining Disparity in India,” Review of Develop-
ment Economics 5 (2001): 130-44.
Dixit, Avinash and John Londregan, “The Determinants of Success of Special Interests in
Redistributive Politics,” Journal of Politics 58 (1996): 1132-1155.
Dixit, Avinash and John Londregan, “Ideology, Tactics, and Efficiency in Redistributive
Politics,” Quarterly Journal of Economics 113 (1998): 497-529.
Downs. Anthony, “An Economic Theory of Political Action in a Democracy,” Journal of
Political Economy 65 (1957): 135-150.
Dutta, Puja, Rinku Murgai, Martin Ravallion, and Dominique van de Walle, “Does India’s
37
Employment Guarantee Scheme Guarantee Employment?,” World Bank Policy Research
Discussion Paper 6003 (2012).
Elliott, Carolyn, “Moving from Clientelist Politics Toward a Welfare Regime: Evidence
from the 2009 Assembly Election in Andhra Pradesh,” Commonwealth and Comparative
Politics 49 (2011): 48-79.
Faccio, Mara, “Politically Connected Firms,” American Economic Review 96 (2006): 369 -
386.
Federico Cingano and Paolo Pinotti, “Politicians At Work: The Private Returns And So-
cial Costs Of Political Connections,” Journal of the European Economic Association 11
(2013): 433-465.
Finan, Frederico and Laura Schechter, “Vote-Buying and Reciprocity,” Econometrica 80
(2012): 863 - 881.
Fisman, Raymond, “Estimating the Value of Political Connections,” American Economic
Review 91 (2001): 1095 - 1102.
Fried, Brian, “Distributive Politics and Conditional Cash Transfers: The Case of Brazil’s
Bolsa Famılia,” World Development 40 (2011): 1042-1053.
Gaiha, Raghav, Shylashri Shankar and Raghbendra Jha, “Targeting Accuracy of the NREG:
Evidence from Rajasthan, Andhra Pradesh and Maharashtra,” The Australia South Asia
Research Centre (ASARC) Working Paper 2010/03 (2010).
Grossman, Gene M. and Elhanan Helpman, “Electoral Competition and Special Interest
Politics,” The Review of Economic Studies 63 (1996): 265-286.
Gupta, Bhanu and Abhiroop Mukhopadhyay, “Local Funds and Political Competition: Ev-
idence from the National Rural Employment Guarantee Scheme in India,” European
Journal of Political Economy 41 (2016): 14-30.
Heckman, James J, “Sample Selection Bias as a Specification Error,” Econometrica 47
(1979): 153-161.
Himanshu, Mukhopadhyay, A, and Sharan, M. R, “The National Rural Employment Guaran-
tee Scheme in Rajasthan: Rationed funds and their allocation across villages,” Economic
and Political Weekly 50 (2015): 52-62.
Johnson, Doug, “How Do Caste, Gender, and Party Affiliation of Locally Elected Leaders
Affect Implementation of NREGA?,” Working Paper 33. Chennai, India: Centre for
Micro Finance at the Institute for Financial Management and Research (2009).
38
Khemani, Stuti, “Political Cycles in a Developing Economy: Effect of Elections in the Indian
States,” Journal of Development Economics 73 (2004): 125-154.
Khemani, Stuti, “Political Capture of Decentralization: Vote-Buying through Grants-Financed
Local Jurisdictions,” Policy Research Working Paper Series 5350, The World Bank
(2010).
Khemani, Stuti, “Buying Votes versus Supplying Public Services: Political Incentives to
Under-invest in Pro-poor Policies?,” Journal of Development Economics 117 (2015):
84-93.
Khwaja, Asim I., and Atif R. Mian, “Do Lenders Favor Politically Connected Firms? Rent
Provision in an Emerging Financial Market,” Quarterly Journal of Economics 120 (2005):
1371-1411.
Kitschelt, Herbert, “Linkages between Citizens and Politicians in Democratic Politics,” Com-
parative Political Studies 33 (2000): 845-879.
Kitschelt Herbert and Steven I. Wilkinson, “Citizen-Politician Linkages: An Introduction,”
In H. Kitchelt, S. Wilkinson (Eds.), Patrons, Clients and Politics: Patterns of Demo-
cratic Accountability and Political Competition, Cambridge University Press, Cambridge
(2007).
Krueger, Anne O. and Ilter Turan, “The Politics and Economics of Turkish Policy Reform
in the 1980s?,” In R.Bates and A. Krueger (Eds), Political and Economic Interactions
in Economic Policy Reform: Evidence from Eight Countries, Basil Blackwell, Oxford
(1993).
Lindbeck, Assar and Jorgen Weibull, “Balanced-budget Redistribution as the Outcome of
Political Competition,” Public Choice 52 (1987): 273-297.
Maiorano, Diego, “The Politics of the Mahatma Gandhi National Rural Employment Guar-
antee Act in Andhra Pradesh,” World Development 58 (2014): 95-105.
Maiorano, Diego and Chakradhar Buddha “MGNREGA in Andhra Pradesh’s Tribal Area,”
Economics and Political Weekly 49 (2014): 15-17.
Majumdar, Manabi, “Democracy in Praxis: Two Non-Left Gram Panchayats in West Ben-
gal,” Economic & Political Weekly 44 (2009): 82-93.
Markussen, Thomas, “Inequality and Political Clientelism: Evidence from South India,”
Journal of Development Studies 47 (2011): 1721-38.
Markussen, Thomas and Finn Tarp, “Political Connections and Investment in Rural Viet-
39

nam,” WIDER working paper, 2011/37 (2011)
Muralidharan, Karthik, Paul Niehaus, and Sandip Sukhtankar, “Building State Capacity:
Evidence from Biometric Smartcards in India,” American Economic Review 106 (2016):
2895?2929.
Moser, Christine, “Poverty Reduction, Patronage, or Vote Buying? The Allocation of Public
Goods and the 2001 Election in Madagascar,”, Economic Development and Cultural
Change 57 (2008): 137-162.
Narayanan, Sudha and Upasak Das,“Women Participation and Rationing in the Employment
Guarantee Scheme,” Economic and Political Weekly 49 (2014): 46-53.
Narayanan, Sudha, Upasak Das, Yanyan Liu and Christopher Barrett. 2016. “The ’Dis-
couraged Worker Effect’ in Public Works Programs: Evidence from the MGNREGA in
India,” (December 7, 2016). Available at SSRN: https://ssrn.com/abstract=2882149
Ramani, Srinivasan, “A Decisive Mandate,”. Economic & Political Weekly 44 (2009): 11-12.
Ravi, Shamika and Monica Engler, “Workfare as an Effective Way to Fight Poverty: The
Case of India’s NREGS,” World Development 67 (2015): 57-71.
Remmer, Karen L, “The Political Economy of Elections in Latin America,” American Po-
litical Science Review 87 (1993): 393-407.
Robinson, James A. and Thierry Verdier, “The Political Economy of Clientelism,” The
Scandinavian Journal of Economics 115 (2013): 260-291.
Schady, Norbert R, “The Political Economy of Expenditures by the Peruvian Social Fund
(FONCODES), 1991-95,” American Political Science Review 94 (2000): 289-304
Shi, Min and Jakob Svensson, “Political Budget Cycles: A Review of Recent Developments,”
Nordic Journal of Political economy 29 (2003): 67-76.
Sheahan,Megan, Yanyan Liu, Christopher B. Barrett, Sudha Narayana, “Preferential Re-
source Spending under an Employment Guarantee: The Political Economy of NREGS
in Andhra Pradesh,” World Bank Economic Review DOI: https://doi.org/10.1093/
wber/lhw044. First published online: August 28, 2016 (2016).
Srinivasan, K., and Sanjay K. Mohanty, “Deprivation of Basic Amenities by Caste and
Religion,” Economic and Political Weekly 39 (2004): 728-735.
Stokes, Susan, “Perverse Accountability: A Formal Model of Machine Politics with Evidence
from Argentina,” American Political Science Review 99 (2005): 315-325.
Stokes, Susan, “Political clientelism,”. C. Boix, S. Stokes (Eds.), Oxford Handbook of Com-
40

parative Politics, Oxford University Press, Oxford (2007).
Stokes, Susan, Thad Dunning, Marcelo Nazareno, and Valeria Brusco, “Brokers, Voters, and
Clientelism: The Puzzle of Distributive Politics,” Cambridge University Press (2013)
Subbarao, Kalanidhi, Carlo del Ninno, Colin Andrews, and Claudia Rodriguez-Alas, “Public
Works as a Safety Net - Design, Evidence, and Implementation,” Technical Report,
World Bank (2013).
Sukhtankar, Sandip, “Sweetening the Deal? Political Connections and Sugar Mills in India,”
American Economic Journal: Applied Economics 4 (2012): 43-63.
Sukhtankar, Sandip, “India’s National Rural Employment Guarantee Scheme: What Do We
Really Know about the World’s Largest Workfare Program?,” India Policy Forum July
12-13, (2016).
Vicente, Pedro C, “Is Vote Buying Effective? Evidence from a Field Experiment in West
Africa,” Economic Journal 124 (2014): 356-387.
Vij, Shivam, “Why Brahmins Hold The Key To The BJP’s Fortunes In Uttar Pradesh,”
Huffington Post. January 23, 2017. Available online http://www.huffingtonpost.in/
2016/05/27/up-elections-brahmins_n_10156966.html last accessed on May 21, 2017
(2016).
Wright, Gavin, “The Political Economy of New Deal Spending: An Econometric Analysis,”
Review of Economics and Statistics 56 (1974): 30-38.
Wyatt, Andre, “Combining Clientelist and Programmatic Politics in Tamil Nadu, South
India,” Commonwealth & Comparative Politics 51 (2013): 27-55.
Wantchekon, Leonard, “Clientelism and Voting Behavior: Evidence from a Field Experiment
in Benin,” World Politics 55 (2003): 399 - 422.
Zimmermann, Laura, “Jai Ho? The Impact of a Large Public Works Program on the Gov-
ernment Election Performance in India,” University of Georgia, Athens GA (2015).
41

Fig
ure
1:Im
ple
men
tati
onan
dIn
stit
uti
onal
Det
ails
ofth
eN
RE
GS
42
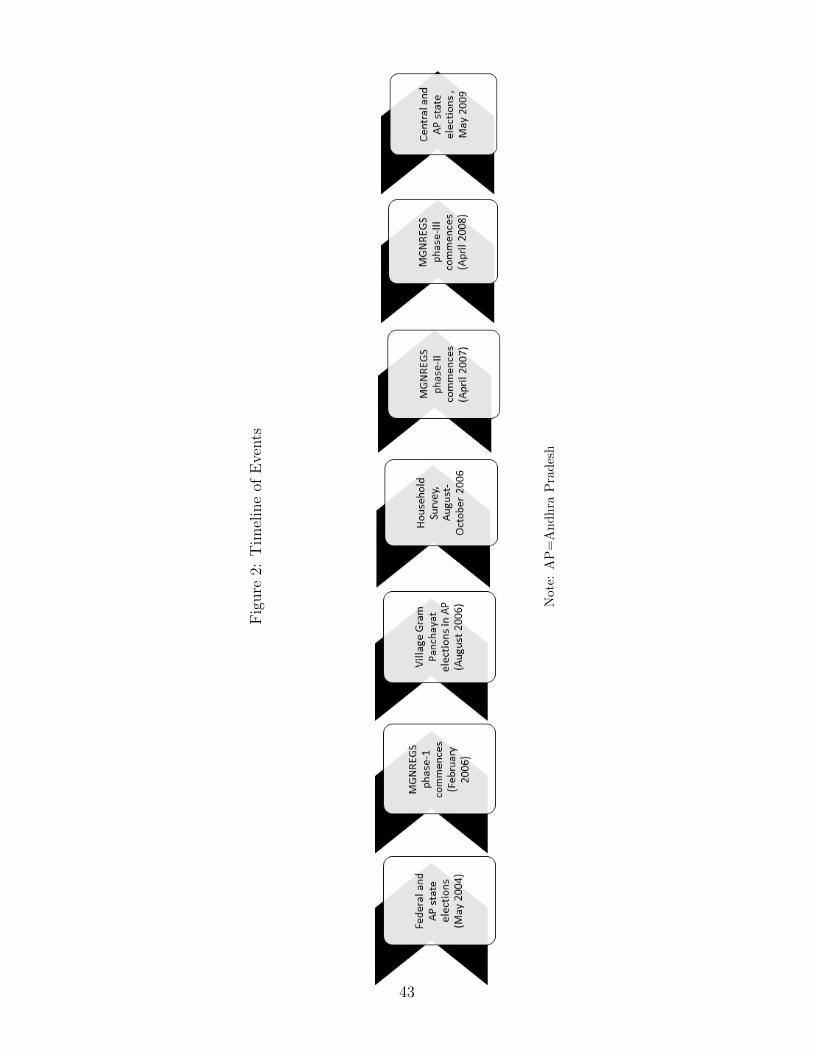
Fig
ure
2:T
imel
ine
ofE
vents
Note
:A
P=
An
dh
raP
rad
esh
43
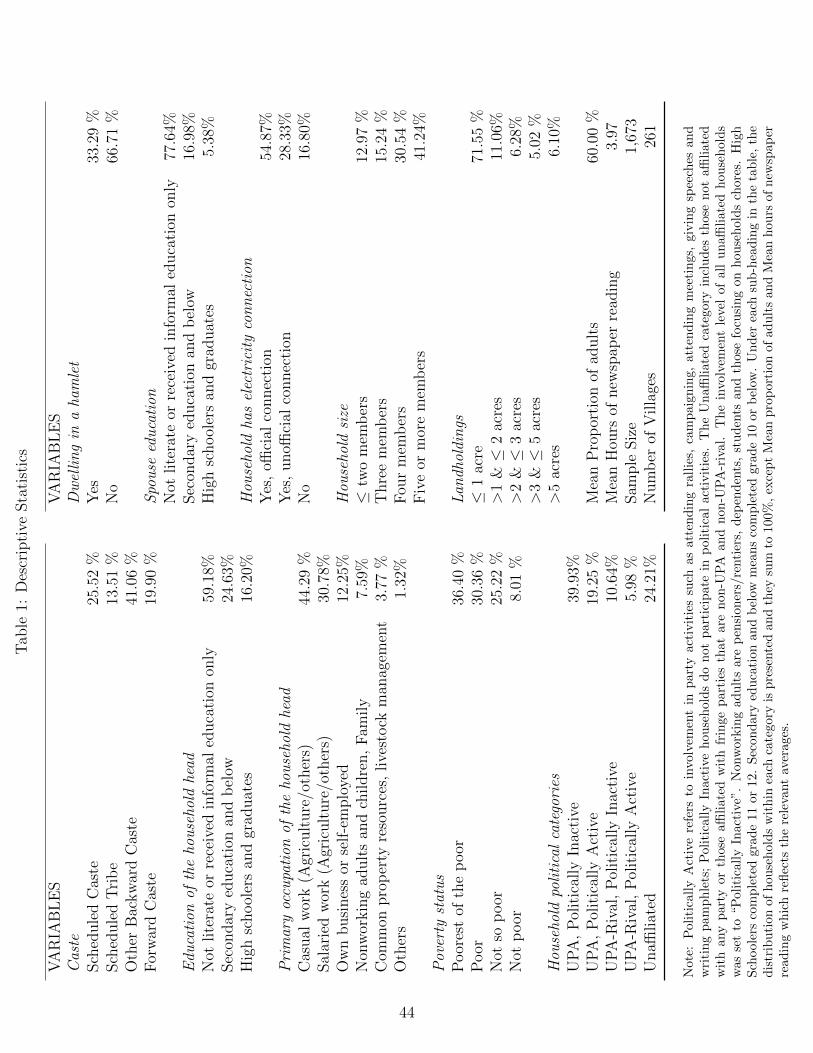
Tab
le1:
Des
crip
tive
Sta
tist
ics
VA
RIA
BL
ES
Cas
teSch
edule
dC
aste
25.5
2%
Sch
edule
dT
rib
e13
.51
%O
ther
Bac
kw
ard
Cas
te41
.06
%F
orw
ard
Cas
te19
.90
%
Edu
cati
onof
the
hou
seho
ldhe
adN
otlite
rate
orre
ceiv
edin
form
aled
uca
tion
only
59.1
8%Sec
ondar
yed
uca
tion
and
bel
ow24
.63%
Hig
hsc
hool
ers
and
grad
uat
es16
.20%
Pri
mar
yoc
cupa
tion
ofth
eho
use
hold
head
Cas
ual
wor
k(A
gric
ult
ure
/oth
ers)
44.2
9%
Sal
arie
dw
ork
(Agr
icult
ure
/oth
ers)
30.7
8%O
wn
busi
nes
sor
self
-em
plo
yed
12.2
5%N
onw
orkin
gad
ult
san
dch
ildre
n,
Fam
ily
7.59
%C
omm
onpro
per
tyre
sourc
es,
live
stock
man
agem
ent
3.77
%O
ther
s1.
32%
Pov
erty
stat
us
Poor
est
ofth
ep
oor
36.4
0%
Poor
30.3
6%
Not
sop
oor
25.2
2%
Not
poor
8.01
%
Hou
seho
ldpo
liti
cal
cate
gori
esU
PA
,P
olit
ical
lyIn
acti
ve39
.93%
UP
A,
Pol
itic
ally
Act
ive
19.2
5%
UP
A-R
ival
,P
olit
ical
lyIn
acti
ve10
.64%
UP
A-R
ival
,P
olit
ical
lyA
ctiv
e5.
98%
Unaffi
liat
ed24
.21%
VA
RIA
BL
ES
Dw
elli
ng
ina
ham
let
Yes
33.2
9%
No
66.7
1%
Spo
use
edu
cati
onN
otlite
rate
orre
ceiv
edin
form
aled
uca
tion
only
77.6
4%Sec
ondar
yed
uca
tion
and
bel
ow16
.98%
Hig
hsc
hool
ers
and
grad
uat
es5.
38%
Hou
seho
ldha
sel
ectr
icit
yco
nn
ecti
onY
es,
offici
alco
nnec
tion
54.8
7%Y
es,
unoffi
cial
connec
tion
28.3
3%N
o16
.80%
Hou
seho
ldsi
ze≤
two
mem
ber
s12
.97
%T
hre
em
emb
ers
15.2
4%
Fou
rm
emb
ers
30.5
4%
Fiv
eor
mor
em
emb
ers
41.2
4%
Lan
dhol
din
gs≤
1ac
re71
.55
%>
1&≤
2ac
res
11.0
6%>
2&≤
3ac
res
6.28
%>
3&≤
5ac
res
5.02
%>
5ac
res
6.10
%
Mea
nP
rop
orti
onof
adult
s60
.00
%M
ean
Hou
rsof
new
spap
erre
adin
g3.
97Sam
ple
Siz
e1,
673
Num
ber
ofV
illa
ges
261
Not
e:P
olit
ical
lyA
ctiv
ere
fers
toin
volv
emen
tin
part
yact
ivit
ies
such
as
att
end
ing
rall
ies,
cam
paig
nin
g,
att
end
ing
mee
tin
gs,
giv
ing
spee
ches
an
dw
riti
ng
pam
ph
lets
;P
olit
ical
lyIn
acti
veh
ouse
hol
ds
do
not
part
icip
ate
inp
oli
tica
lact
ivit
ies.
The
Un
affi
liate
dca
tegory
incl
ud
esth
ose
not
affi
liate
dw
ith
any
par
tyor
thos
eaffi
liat
edw
ith
frin
gep
arti
esth
at
are
non
-UP
Aan
dn
on
-UP
A-r
ival.
Th
ein
volv
emen
tle
vel
of
all
un
affi
liate
dh
ou
seh
old
sw
asse
tto
“Pol
itic
ally
Inac
tive
”.N
onw
orkin
gad
ult
sare
pen
sion
ers/
renti
ers,
dep
end
ents
,st
ud
ents
an
dth
ose
focu
sin
gon
hou
seh
old
sch
ore
s.H
igh
Sch
ool
ers
com
ple
ted
grad
e11
or12
.S
econ
dar
yed
uca
tion
an
db
elow
mea
ns
com
ple
ted
gra
de
10
or
bel
ow.
Un
der
each
sub
-hea
din
gin
the
tab
le,
the
dis
trib
uti
onof
hou
seh
olds
wit
hin
each
cate
gory
isp
rese
nte
dan
dth
eysu
mto
100%
,ex
cep
tM
ean
pro
port
ion
of
ad
ult
san
dM
ean
hou
rsof
new
spap
erre
adin
gw
hic
hre
flec
tsth
ere
leva
nt
aver
ages
.
44

Table 2: Political Categories and NREGS Outcomes in UPA-Sarpanch Villages
(1) (2) (3)Household Affiliation Job-Card
HoldingMean DaysWorked
MeanPaymentReceived(INR)
Job-card holders
UPA, Politically Inactive 39.37% 35.11 2,791UPA, Politically Active 42.54% 37.03 3,160UPA-Rival, Politically Inactive 31.46% 33.33 2,883UPA-Rival, Politically Active 38.00% 23.15 1,911Unaffiliated 35.30% 35.23 2,672
All 38% 34.66 2,798
Note: Politically Active refers to involvement in party activities such as attending rallies, campaign-ing, attending meetings, giving speeches and writing pamphlets; Politically Inactive households donot participate in political activities. The Unaffiliated category includes those not affiliated withany party or those affiliated with fringe parties that are non-UPA and non-UPA-rival. The in-volvement level of all unaffiliated households was set to “Politically Inactive”. Nonworking adultsare pensioners/rentiers, dependents, students and those focusing on households chores. % Job-card holding represents the proportion of households that obtained a job-card either in 2006 or2007. Mean Days worked and Payment Received are averages for each political category based oncumulative benefits received in 2006 and 2007. INR refers to the currency, Indian Rupees.
45

Tab
le3:
Tob
itR
egre
ssio
nof
NR
EG
SB
enefi
tson
Pol
itic
alA
ffiliat
ion
and
Pol
itic
alA
ctiv
ism
inU
PA
-Sar
pan
chV
illa
ges
VA
RIA
BL
ES
(1)
(2)
Log
Days
Log
Paym
ent
Hou
seh
old
Politi
cal
Cate
gory
(base
:U
PA
,P
oliti
cally
Inact
ive)
UP
A,
Politi
cally
Act
ive
0.6
43***
1.4
44***
(0.0
204)
(0.0
447)
UP
A-R
ival,
Politi
cally
Inact
ive
0.4
92***
0.9
59***
(0.0
219)
(0.0
474)
UP
A-R
ival
Politi
cally
Act
ive
1.0
54***
2.5
22***
(0.0
290)
(0.0
637)
Un
affi
liate
d0.4
90***
0.9
79***
(0.0
155)
(0.0
337)
Occ
up
ati
on
of
HH
hea
d(b
ase
:Casu
al
work
-Ag/oth
ers)
Sala
ried
work
-A
g/oth
ers
-0.8
82***
-1.9
73***
(0.0
278)
(0.0
617)
Ow
nb
usi
nes
sor
self
-em
plo
yed
-0.7
20***
-1.6
12***
(0.0
398)
(0.0
883)
Nonw
ork
ing
ad
ult
san
dch
ild
ren
,F
am
ily
-1.2
41***
-2.7
25***
(0.0
204)
(0.0
436)
Com
mon
pro
per
tyre
sou
rces
,lives
tock
man
agem
ent
-0.9
71***
-2.0
60***
(0.0
337)
(0.0
721)
Oth
ers
-1.6
47***
-3.7
77***
(0.0
352)
(0.0
760)
Pover
tyle
vel
of
HH
(base
:Poore
stof
Poor)
Poor
-0.2
10***
-0.4
72***
(0.0
203)
(0.0
449)
Not
soP
oor
-0.5
22***
-1.1
83***
(0.0
314)
(0.0
694)
Not
poor
-0.7
67***
-1.6
40***
(0.0
590)
(0.1
33)
Cast
e(b
ase
:F
orw
ard
Cast
e)
Sch
edu
led
Cast
e0.8
93***
1.9
22***
(0.0
233)
(0.0
519)
Sch
edu
led
Tri
be
-1.2
54***
-2.6
75***
(0.0
250)
(0.0
553)
Oth
erB
ack
ward
Cast
e0.5
48***
1.3
08***
(0.0
257)
(0.0
575)
Ed
uca
tion
of
HH
hea
d(b
ase
:Not-
lite
rate
/In
form
al
Ed
u)
Sec
on
dary
an
db
elow
(com
ple
ted
gra
de
10
or
bel
ow
)0.0
369
0.0
544
(0.0
226)
(0.0
507)
Hig
her
seco
nd
ary
an
dgra
du
ate
(com
ple
ted
gra
de
11
or
12)
-0.3
43***
-0.8
43***
(0.0
527)
(0.1
18)
Ed
uca
tion
of
spou
se(b
ase
:Not-
lite
rate
/In
form
al
Ed
u)
Sec
on
dary
an
db
elow
-0.8
03***
-1.7
47***
(0.0
384)
(0.0
870)
Hig
her
seco
nd
ary
an
dgra
du
ate
-0.7
70***
-2.0
27***
(0.0
559)
(0.1
26)
VA
RIA
BL
ES
(1)
(2)
Log
Days
Log
Paym
ent
Ele
ctri
city
con
nec
tion
(base
:u
noffi
cial
con
nec
tion
)
No
con
nec
tion
0.0
433*
0.2
67***
(0.0
240)
(0.0
532)
Offi
cial
con
nec
tion
-1.0
85***
-2.4
73***
(0.0
263)
(0.0
592)
Nu
mb
erof
hou
seh
old
mem
ber
s(b
ase
:T
wo
or
bel
ow
)
Th
ree
mem
ber
s0.9
30***
2.0
10***
(0.0
208)
(0.0
462)
Fou
rm
emb
ers
1.0
18***
2.2
72***
(0.0
232)
(0.0
519)
Fiv
eor
more
mem
ber
s0.7
68***
1.6
85***
(0.0
230)
(0.0
498)
Lan
dh
old
ings
(base
:≤
1acr
e)
>1
&≤
2acr
es0.2
61***
0.5
04***
(0.0
184)
(0.0
407)
>2
&≤
3acr
es0.0
603*
0.1
38*
(0.0
318)
(0.0
708)
>3
&≤
5acr
es-0
.756***
-1.4
96***
(0.0
394)
(0.0
883)
>5
acr
es-0
.742***
-1.3
35***
(0.0
506)
(0.1
11)
Pro
port
ion
of
ad
ult
s0.5
29***
1.0
81***
(0.0
186)
(0.0
407)
Liv
ing
ina
ham
let
0.1
89***
0.3
55***
(0.0
118)
(0.0
263)
Hou
rsn
ewsp
ap
erre
ad
-0.0
0810***
-0.0
0794
(0.0
0246)
(0.0
0554)
Sig
ma
2.8
13***
6.2
13***
(0.0
0686)
(0.0
156)
F-t
est
of
all
politi
cal
vari
ab
les
505.0
2519.4
1P
-valu
eof
the
F-t
est
0.0
00.0
0
F-t
est
ofγUPA−riv
ala
ctive
1−γUPA−riv
alinactive
1296.0
6472.6
8P
-valu
eof
the
F-t
est
0.0
00.0
0
F-t
est
ofγUPA−riv
ala
ctive
1−γUPAactive
1502.2
1409.2
8P
-valu
eof
the
F-t
est
0.0
00.0
0
Log
Pse
ud
o-L
ikel
ihood
-1467.2
371
-1842.4
879
Pse
ud
oR
20.2
489
0.2
078
Sam
ple
Siz
e1,6
73
1,6
73
Not
e:R
obu
stst
and
ard
erro
rscl
ust
ered
atth
evil
lage
leve
lare
inp
are
nth
eses
.A
llre
gre
ssio
ns
incl
ud
evil
lage
fixed
effec
ts.
HH
issh
ort
form
for
hou
seh
old
.P
olit
ical
lyA
ctiv
ere
fers
toin
volv
emen
tin
part
yact
ivit
ies
such
as
att
end
ing
rall
ies,
cam
paig
nin
g,
att
end
ing
mee
tin
gs,
giv
ing
spee
ches
an
dw
riti
ng
pam
ph
lets
;P
olit
ical
lyIn
acti
veh
ouse
hol
ds
do
not
part
icip
ate
inp
oli
tica
lact
ivit
ies.
The
Un
affi
liate
dca
tegory
incl
ud
esth
ose
not
affi
liate
dw
ith
any
par
tyor
thos
eaffi
liat
edw
ith
frin
gep
arti
esth
at
are
non
-UP
Aan
dn
on
-UP
A-r
ival.
Th
ein
volv
emen
tle
vel
of
all
un
affi
liate
dh
ou
seh
old
sw
asse
tto
“Pol
itic
ally
Inac
tive
”.N
onw
orkin
gad
ult
sare
pen
sion
ers/
renti
ers,
dep
end
ents
,st
ud
ents
an
dth
ose
focu
sin
gon
hou
seh
old
sch
ore
s.H
igh
Sch
ool
ers
com
ple
ted
grad
e11
or12
.S
econ
dar
yed
uca
tion
an
db
elow
mea
ns
com
ple
ted
gra
de
10
or
bel
ow.
Th
eF
-tes
tof
all
poli
tica
lva
riable
sh
as
(4,
1675
)d
egre
esof
free
dom
.F
-tes
tof
the
diff
eren
cein
the
coeffi
cien
td
iffer
ence
sh
as
(1,
1675)
deg
rees
of
free
dom
.
46

Table 4: Probit Regression of Job-Card Ownership on Political Affiliation and Po-litical Activism in UPA-Sarpanch Villages
Job card
Household Political Category (base: UPA, Politically Inactive)
UPA, Politically Active 0.160(0.148)
UPA-Rival, Politically Inactive -0.0333(0.156)
UPA-Rival, Politically Active 0.322(0.264)
Unaffiliated 0.119(0.160)
Chi-square test of all political variables [χ2(4)] 2.62P-value of the F-test 0.6228Log Pseudo-Likelihood -634.678Pseudo R2 0.2549
Sample Size 1,229
Note: Robust standard errors clustered at the village level are in parentheses. All regressionsinclude village fixed effects. Politically Active refers to intense party activities such as attendingrallies, campaigning, attending meetings, giving speeches and writing pamphlets; Politically Inactivehouseholds do not participate in political activities. The Unaffiliated category includes those notaffiliated with any party or those affiliated with fringe parties that are non-UPA and non-UPA-rival. The involvement level of all unaffiliated households was set to “Politically Inactive”. Controlvariables include caste, poverty status, household size categories, proportion of adults, primaryoccupation and education of the household head, education of the spouse, land ownership categories,availability of electricity connection, location in a hamlet, and hours spent reading a newspaper inthe past week.
47

Table 5: Tobit regression of NREGS Benefits on Political Affiliation and Political Activismin non-UPA Sarpanch Villages
(1) (2)Log Days Log Payment
Household Political Category (base: UPA-Rival, Politically Inactive)
UPA-Rival, Politically Active -0.160 -0.518(0.491) (1.089)
UPA, Politically Inactive 0.649 1.052(0.423) (0.928)
UPA, Politically Active 0.595 1.175(0.518) (1.131)
Unaffiliated 0.377 0.739(0.540) (1.192)
Sigma 2.751 5.894(0.203) (0.379)
F-test of all political variables 0.96 0.79P-value of the F-test 0.4313 0.5303Log Pseudo-Likelihood -540.5303 -668.21127Pseudo R2 0.2502 0.2206
Sample Size 602 602
Note: Robust standard errors clustered at the village level are in parentheses. All regressions include villagefixed effects. Politically Active refers to intense party activities such as attending rallies, campaigning,attending meetings, giving speeches and writing pamphlets; Politically Inactive households do not participatein political activities. The Unaffiliated category includes those not affiliated with any party or those affiliatedwith fringe parties that are non-UPA and non-UPA-rival. The involvement level of all unaffiliated householdswas set to “Politically Inactive”. Control variables include caste, poverty status, household size categories,proportion of adults, primary occupation and education of the household head, education of the spouse, landownership categories, availability of electricity connection, location in a hamlet, and hours spent reading anewspaper in the past week. The F-test of all political variables has (4, 484) degrees of freedom.
48
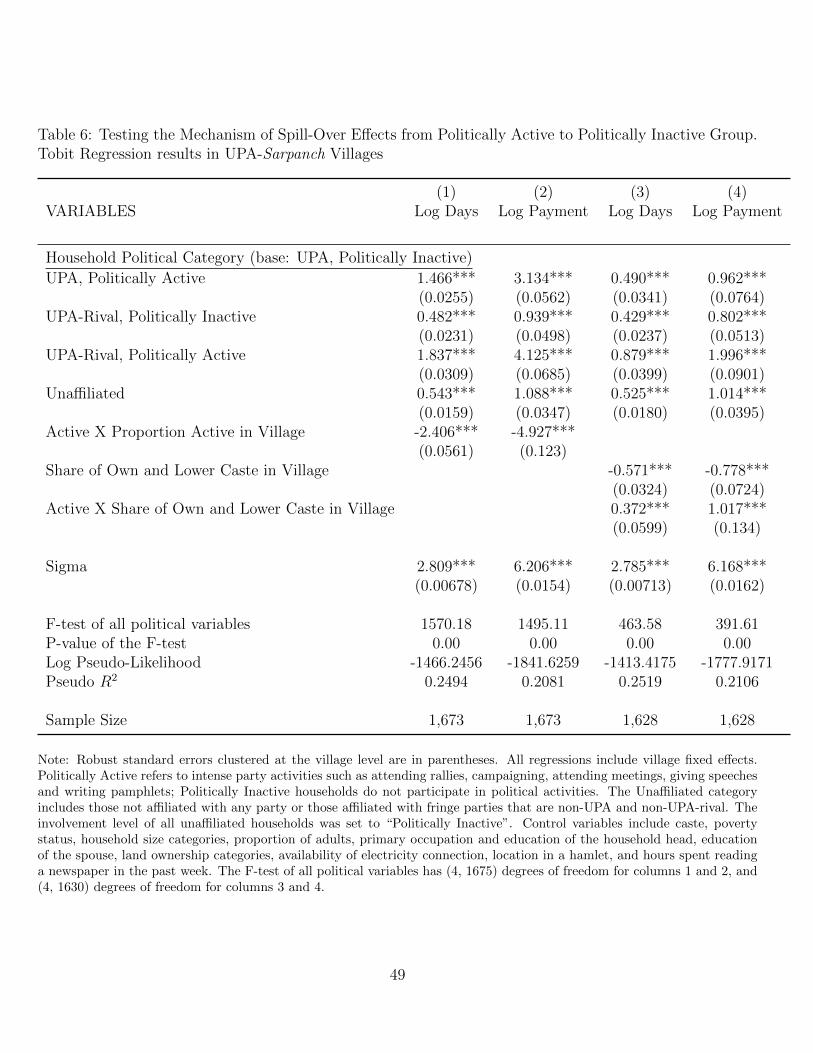
Table 6: Testing the Mechanism of Spill-Over Effects from Politically Active to Politically Inactive Group.Tobit Regression results in UPA-Sarpanch Villages
(1) (2) (3) (4)VARIABLES Log Days Log Payment Log Days Log Payment
Household Political Category (base: UPA, Politically Inactive)
UPA, Politically Active 1.466*** 3.134*** 0.490*** 0.962***(0.0255) (0.0562) (0.0341) (0.0764)
UPA-Rival, Politically Inactive 0.482*** 0.939*** 0.429*** 0.802***(0.0231) (0.0498) (0.0237) (0.0513)
UPA-Rival, Politically Active 1.837*** 4.125*** 0.879*** 1.996***(0.0309) (0.0685) (0.0399) (0.0901)
Unaffiliated 0.543*** 1.088*** 0.525*** 1.014***(0.0159) (0.0347) (0.0180) (0.0395)
Active X Proportion Active in Village -2.406*** -4.927***(0.0561) (0.123)
Share of Own and Lower Caste in Village -0.571*** -0.778***(0.0324) (0.0724)
Active X Share of Own and Lower Caste in Village 0.372*** 1.017***(0.0599) (0.134)
Sigma 2.809*** 6.206*** 2.785*** 6.168***(0.00678) (0.0154) (0.00713) (0.0162)
F-test of all political variables 1570.18 1495.11 463.58 391.61P-value of the F-test 0.00 0.00 0.00 0.00Log Pseudo-Likelihood -1466.2456 -1841.6259 -1413.4175 -1777.9171Pseudo R2 0.2494 0.2081 0.2519 0.2106
Sample Size 1,673 1,673 1,628 1,628
Note: Robust standard errors clustered at the village level are in parentheses. All regressions include village fixed effects.Politically Active refers to intense party activities such as attending rallies, campaigning, attending meetings, giving speechesand writing pamphlets; Politically Inactive households do not participate in political activities. The Unaffiliated categoryincludes those not affiliated with any party or those affiliated with fringe parties that are non-UPA and non-UPA-rival. Theinvolvement level of all unaffiliated households was set to “Politically Inactive”. Control variables include caste, povertystatus, household size categories, proportion of adults, primary occupation and education of the household head, educationof the spouse, land ownership categories, availability of electricity connection, location in a hamlet, and hours spent readinga newspaper in the past week. The F-test of all political variables has (4, 1675) degrees of freedom for columns 1 and 2, and(4, 1630) degrees of freedom for columns 3 and 4.
49

Table 7: Supporting Results for Spill-Over Effects. Tobit Regression of Log Days on Political Categories andInteraction of Active and Village Connectedness Characteristics
VARIABLES (1) (2) (3) (4) (5)
Household Political Category (base: UPA, Politically Inactive)
UPA, Politically Active 0.0808** 0.533*** 0.613*** 0.491*** 0.593***(0.0314) (0.0329) (0.0250) (0.0215) (0.0283)
UPA-Rival, Politically Inactive 0.251*** 0.329*** 0.484*** 0.354*** 0.410***(0.0314) (0.0283) (0.0229) (0.0257) (0.0277)
UPA-Rival, Politically Active 1.064*** 1.427*** 1.027*** 1.388*** 1.458***(0.0385) (0.0404) (0.0311) (0.0313) (0.0369)
Unaffiliated 0.561*** 0.397*** 0.484*** 0.296*** 0.273***(0.0210) (0.0186) (0.0161) (0.0168) (0.0185)
Interactions with Village Connectedness CharacteristicsActive X Distance to Main Road 0.00969***
(0.00135)Active X Bus Fare to the Nearest Town 0.00588*
(0.00309)Active X Non-availability of Community TV 0.0751*
(0.0394)Active X Non-availability of Telephones 2.398***
(0.0370)Active X Number of Telephone Lines -0.00188***
(0.000219)
Sigma 2.807*** 2.784*** 2.813*** 2.792*** 2.776***(0.00888) (0.00720) (0.00686) (0.00721) (0.00725)
Observations 1,206 1,524 1,673 1,537 1,346
50
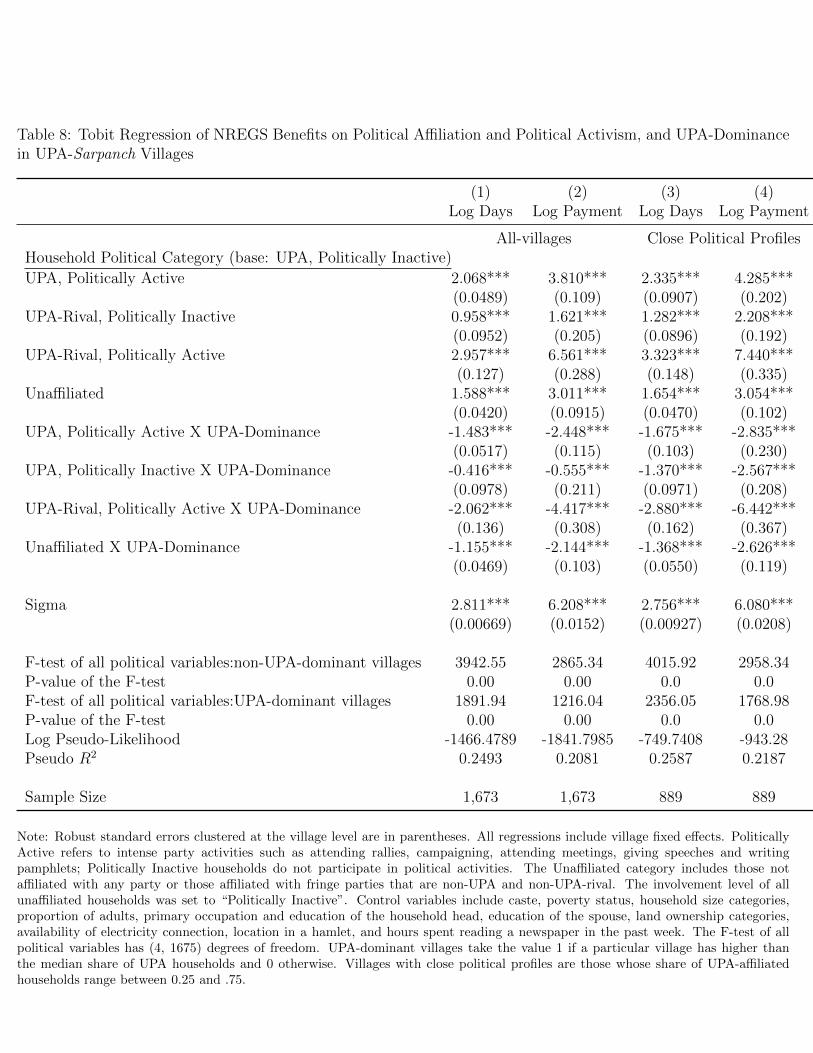
Table 8: Tobit Regression of NREGS Benefits on Political Affiliation and Political Activism, and UPA-Dominancein UPA-Sarpanch Villages
(1) (2) (3) (4)Log Days Log Payment Log Days Log Payment
All-villages Close Political ProfilesHousehold Political Category (base: UPA, Politically Inactive)
UPA, Politically Active 2.068*** 3.810*** 2.335*** 4.285***(0.0489) (0.109) (0.0907) (0.202)
UPA-Rival, Politically Inactive 0.958*** 1.621*** 1.282*** 2.208***(0.0952) (0.205) (0.0896) (0.192)
UPA-Rival, Politically Active 2.957*** 6.561*** 3.323*** 7.440***(0.127) (0.288) (0.148) (0.335)
Unaffiliated 1.588*** 3.011*** 1.654*** 3.054***(0.0420) (0.0915) (0.0470) (0.102)
UPA, Politically Active X UPA-Dominance -1.483*** -2.448*** -1.675*** -2.835***(0.0517) (0.115) (0.103) (0.230)
UPA, Politically Inactive X UPA-Dominance -0.416*** -0.555*** -1.370*** -2.567***(0.0978) (0.211) (0.0971) (0.208)
UPA-Rival, Politically Active X UPA-Dominance -2.062*** -4.417*** -2.880*** -6.442***(0.136) (0.308) (0.162) (0.367)
Unaffiliated X UPA-Dominance -1.155*** -2.144*** -1.368*** -2.626***(0.0469) (0.103) (0.0550) (0.119)
Sigma 2.811*** 6.208*** 2.756*** 6.080***(0.00669) (0.0152) (0.00927) (0.0208)
F-test of all political variables:non-UPA-dominant villages 3942.55 2865.34 4015.92 2958.34P-value of the F-test 0.00 0.00 0.0 0.0F-test of all political variables:UPA-dominant villages 1891.94 1216.04 2356.05 1768.98P-value of the F-test 0.00 0.00 0.0 0.0Log Pseudo-Likelihood -1466.4789 -1841.7985 -749.7408 -943.28Pseudo R2 0.2493 0.2081 0.2587 0.2187
Sample Size 1,673 1,673 889 889
Note: Robust standard errors clustered at the village level are in parentheses. All regressions include village fixed effects. PoliticallyActive refers to intense party activities such as attending rallies, campaigning, attending meetings, giving speeches and writingpamphlets; Politically Inactive households do not participate in political activities. The Unaffiliated category includes those notaffiliated with any party or those affiliated with fringe parties that are non-UPA and non-UPA-rival. The involvement level of allunaffiliated households was set to “Politically Inactive”. Control variables include caste, poverty status, household size categories,proportion of adults, primary occupation and education of the household head, education of the spouse, land ownership categories,availability of electricity connection, location in a hamlet, and hours spent reading a newspaper in the past week. The F-test of allpolitical variables has (4, 1675) degrees of freedom. UPA-dominant villages take the value 1 if a particular village has higher thanthe median share of UPA households and 0 otherwise. Villages with close political profiles are those whose share of UPA-affiliatedhouseholds range between 0.25 and .75.
51
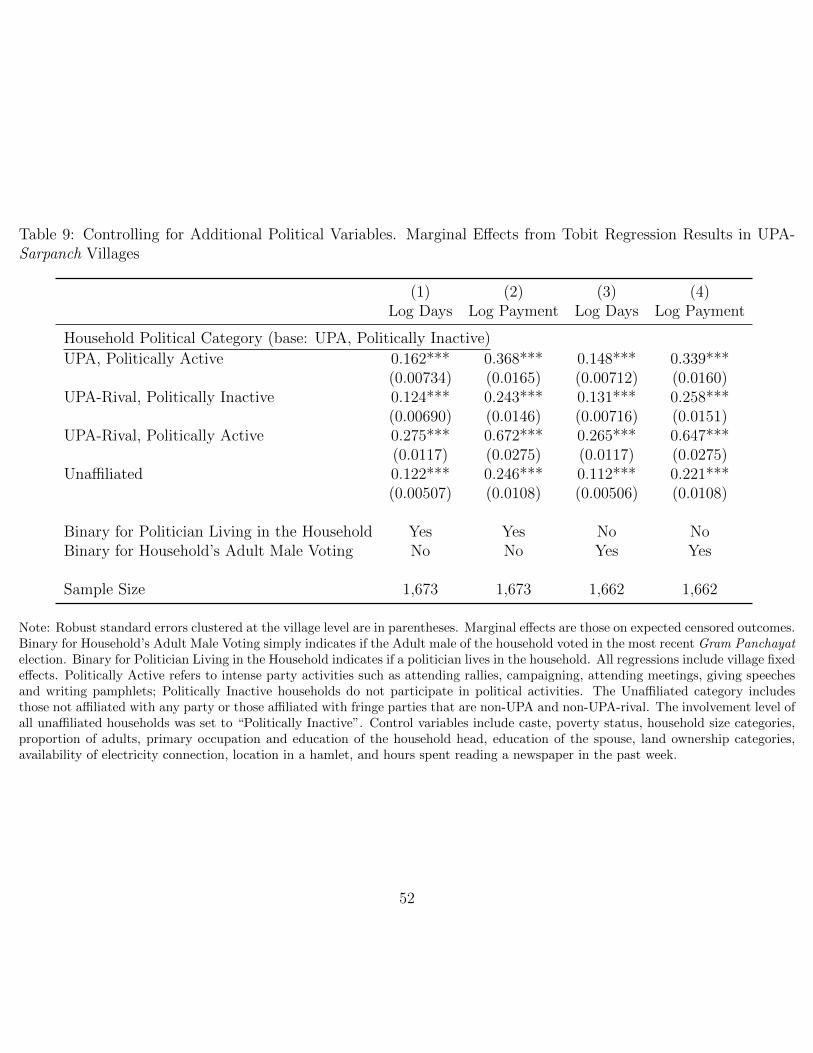
Table 9: Controlling for Additional Political Variables. Marginal Effects from Tobit Regression Results in UPA-Sarpanch Villages
(1) (2) (3) (4)Log Days Log Payment Log Days Log Payment
Household Political Category (base: UPA, Politically Inactive)
UPA, Politically Active 0.162*** 0.368*** 0.148*** 0.339***(0.00734) (0.0165) (0.00712) (0.0160)
UPA-Rival, Politically Inactive 0.124*** 0.243*** 0.131*** 0.258***(0.00690) (0.0146) (0.00716) (0.0151)
UPA-Rival, Politically Active 0.275*** 0.672*** 0.265*** 0.647***(0.0117) (0.0275) (0.0117) (0.0275)
Unaffiliated 0.122*** 0.246*** 0.112*** 0.221***(0.00507) (0.0108) (0.00506) (0.0108)
Binary for Politician Living in the Household Yes Yes No NoBinary for Household’s Adult Male Voting No No Yes Yes
Sample Size 1,673 1,673 1,662 1,662
Note: Robust standard errors clustered at the village level are in parentheses. Marginal effects are those on expected censored outcomes.Binary for Household’s Adult Male Voting simply indicates if the Adult male of the household voted in the most recent Gram Panchayatelection. Binary for Politician Living in the Household indicates if a politician lives in the household. All regressions include village fixedeffects. Politically Active refers to intense party activities such as attending rallies, campaigning, attending meetings, giving speechesand writing pamphlets; Politically Inactive households do not participate in political activities. The Unaffiliated category includesthose not affiliated with any party or those affiliated with fringe parties that are non-UPA and non-UPA-rival. The involvement level ofall unaffiliated households was set to “Politically Inactive”. Control variables include caste, poverty status, household size categories,proportion of adults, primary occupation and education of the household head, education of the spouse, land ownership categories,availability of electricity connection, location in a hamlet, and hours spent reading a newspaper in the past week.
52

Appendix
Table A1: Marginal Effects of Political Categories on NREGS Benefits, and their Corresponding PercentageChanges in UPA-Sarpanch Villages
(1) (2) (3) (4)Marginal Effects Percentage Change
Log Days Log Payment Days Payment
Household Political Category (base: UPA, Politically Inactive)
UPA, Politically Active 0.197*** 0.451*** 21.78% 57.03%(0.00994) (0.0226)
UPA-Rival, Politically Inactive 0.148*** 0.292*** 15.96% 33.93%(0.00899) (0.0190)
UPA-Rival, Politically Active 0.338*** 0.831*** 40.23% 129.72%(0.0160) (0.0378)
Unaffiliated 0.147*** 0.299*** 15.84% 34.86%(0.00679) (0.0144)
Sample Size 1,673
Note: Robust standard errors clustered at the village level are in parentheses. Marginal effects are those on expected censoredoutcomes. Marginal effects and percentages are based on Table 3.
53

Tab
leA
2:T
obit
Reg
ress
ion
ofL
ogD
ays
and
Pay
men
ton
Pol
itic
alC
ateg
orie
sw
ith
and
wit
hou
tC
ontr
olV
aria
ble
s
VA
RIA
BL
ES
(1)
(2)
(3)
(4)
(5)
(6)
(7)
(8)
Dep
enden
tV
aria
ble
:L
ogD
ays
Hou
sehol
dP
olit
ical
Cat
egor
y(b
ase:
UP
A,
Pol
itic
ally
Inac
tive
)
UP
AP
olit
ical
lyA
ctiv
e-0
.124
0.12
4***
0.32
2***
0.24
6***
0.39
3***
0.31
7***
0.35
2***
0.64
3***
(0.4
79)
(0.0
0947
)(0
.015
4)(0
.014
1)(0
.015
7)(0
.015
1)(0
.016
9)(0
.020
4)U
PA
-Riv
al,
Pol
itic
ally
Inac
tive
-0.6
150.
233*
**0.
250*
**0.
277*
**0.
399*
**0.
542*
**0.
543*
**0.
492*
**(0
.525
)(0
.008
86)
(0.0
131)
(0.0
122)
(0.0
148)
(0.0
149)
(0.0
158)
(0.0
219)
UP
A-R
ival
,P
olit
ical
lyA
ctiv
e-0
.250
0.33
1***
0.56
2***
0.55
6***
0.71
9***
0.72
9***
0.78
9***
1.05
4***
(0.6
83)
(0.0
114)
(0.0
164)
(0.0
156)
(0.0
185)
(0.0
172)
(0.0
213)
(0.0
290)
Unaffi
liat
ed-1
.701
***
0.67
4***
0.49
4***
0.39
8***
0.41
0***
0.41
0***
0.43
4***
0.49
0***
(0.4
90)
(0.0
0801
)(0
.011
2)(0
.011
3)(0
.011
6)(0
.013
5)(0
.014
3)(0
.015
5)
Dep
enden
tV
aria
ble
:L
ogP
aym
ent
Hou
sehol
dP
olit
ical
Cat
egor
y(b
ase:
UP
A,
Pol
itic
ally
Inac
tive
)
UP
AP
olit
ical
lyA
ctiv
e-0
.285
0.32
6***
0.75
1***
0.59
0***
0.92
1***
0.75
2***
0.83
1***
1.44
4***
(1.0
53)
(0.0
208)
(0.0
345)
(0.0
313)
(0.0
347)
(0.0
333)
(0.0
373)
(0.0
447)
UP
A-R
ival
,P
olit
ical
lyIn
acti
ve-1
.397
0.42
8***
0.46
1***
0.51
5***
0.78
8***
1.10
2***
1.10
4***
0.95
9***
(1.1
47)
(0.0
193)
(0.0
287)
(0.0
267)
(0.0
318)
(0.0
317)
(0.0
337)
(0.0
474)
UP
A-R
ival
,P
olit
ical
lyA
ctiv
e-0
.452
0.89
3***
1.39
7***
1.37
6***
1.73
5***
1.77
0***
1.90
6***
2.52
2***
(1.5
03)
(0.0
251)
(0.0
364)
(0.0
347)
(0.0
408)
(0.0
379)
(0.0
468)
(0.0
637)
Unaffi
liat
ed-3
.798
***
1.37
9***
0.97
6***
0.75
3***
0.78
5***
0.80
1***
0.85
5***
0.97
9***
(1.0
71)
(0.0
175)
(0.0
246)
(0.0
251)
(0.0
254)
(0.0
296)
(0.0
310)
(0.0
337)
Villa
geF
ixed
Eff
ects
NO
YE
SY
ES
YE
SY
ES
YE
SY
ES
YE
SP
over
tyC
lass
ifica
tion
NO
NO
YE
SY
ES
YE
SY
ES
YE
SY
ES
Cas
teN
ON
ON
OY
ES
YE
SY
ES
YE
SY
ES
Dw
elling
typ
eN
ON
ON
ON
OY
ES
YE
SY
ES
YE
SR
esid
ing
ina
ham
let
NO
NO
NO
NO
NO
YE
SY
ES
YE
SE
duca
tion
,hou
sehol
dhea
dN
ON
ON
ON
ON
ON
OY
ES
YE
SA
llot
her
contr
ols
NO
NO
NO
NO
NO
NO
NO
YE
SO
bse
rvat
ions
2,69
22,
692
2,69
12,
686
2,67
41,
926
1,92
61,
673
Not
e:R
obu
stst
and
ard
erro
rscl
ust
ered
atth
evil
lage
leve
lare
inp
are
nth
eses
.P
oli
tica
lly
Act
ive
refe
rsto
inte
nse
part
yact
ivit
ies
such
as
att
end
ing
rall
ies,
cam
paig
nin
g,
atte
nd
ing
mee
tin
gs,gi
vin
gsp
eech
esan
dw
riti
ng
pam
ph
lets
;P
oli
tica
lly
Inact
ive
hou
seh
old
sd
on
ot
part
icip
ate
inp
oli
tica
lact
ivit
ies.
Th
eU
naffi
liate
dca
tegory
incl
ud
esth
ose
not
affili
ated
wit
han
yp
arty
orth
ose
affili
ated
wit
hfr
inge
part
ies
that
are
non
-UP
Aan
dn
on-U
PA
-riv
al.
Th
ein
volv
emen
tle
vel
of
all
un
affi
liate
dh
ouse
hold
sw
asse
tto
“Pol
itic
ally
Inac
tive
”.T
he
full
set
ofco
ntr
ol
vari
ab
les
incl
ud
eded
inth
ela
stco
lum
nar
eca
ste,
pov
erty
statu
s,hou
sehold
size
cate
gori
es,
pro
port
ion
of
adu
lts,
pri
mar
yocc
up
atio
nan
ded
uca
tion
ofth
eh
ouse
hold
hea
d,
edu
cati
on
of
the
spou
se,
lan
dow
ner
ship
cate
gori
es,
avail
ab
ilit
yof
elec
tric
ity
con
nec
tion
,lo
cati
on
ina
ham
let,
and
hou
rssp
ent
read
ing
an
ewsp
aper
inth
ep
ast
wee
k.
54

Table A3: Political categories by Caste and Poverty Characteristics
VARIABLES (1) (2) (3) (4) (5)UPA-inactive
UPA-active
UPA-Rivalinactive
UPA Rivalactive
Unaffiliated
Poverty CategoriesPoorest of the Poor 35.38% 36.65% 36.52% 26.73% 40.25%Poor 30.58% 25.47% 30.90% 33.66% 32.84%Not So Poor 24.74% 30.12% 23.03% 29.70% 22.22%Not poor 9.30% 7.76% 9.55% 9.90% 4.69%
Caste CategoriesForward caste 23.54% 14.29% 20.22% 22.77% 17.78%Other Backward caste 40.78% 42.24% 44.38% 40.59% 39.26%Scheduled Caste 26.39% 27.33% 22.47% 23.76% 24.20%Scheduled Tribe 9.30% 16.15% 12.92% 12.87% 18.77%
Sample Size 667 322 178 101 405
55
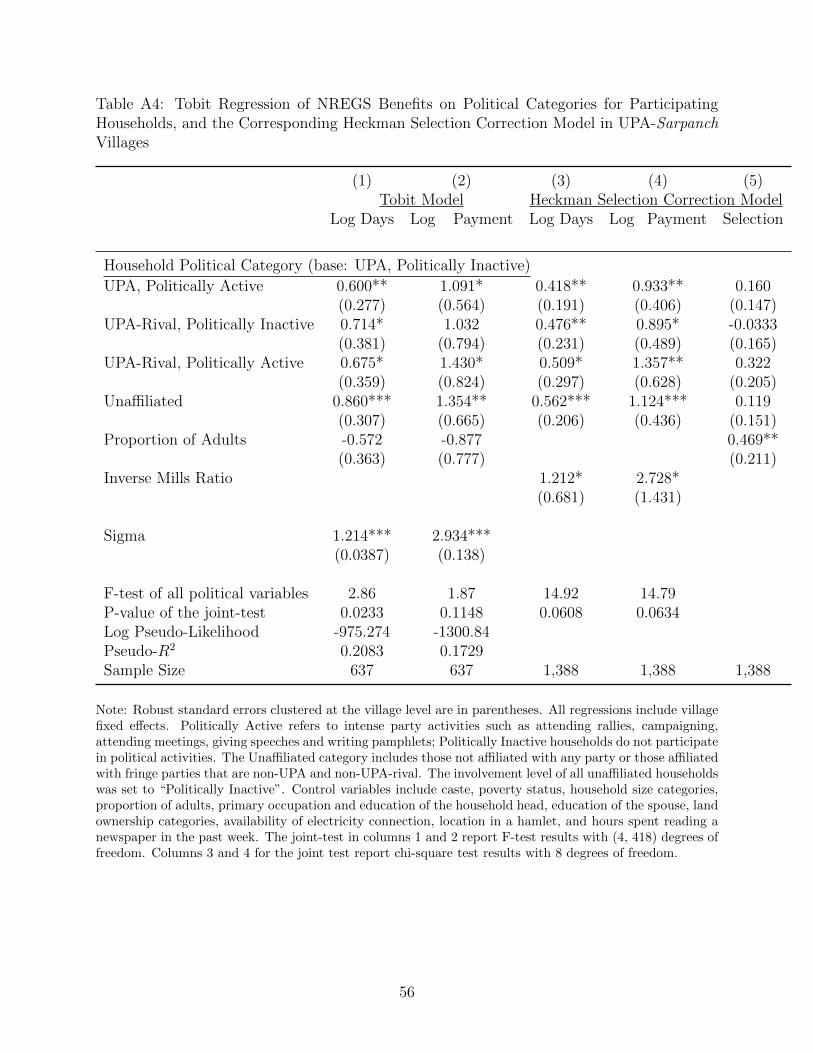
Table A4: Tobit Regression of NREGS Benefits on Political Categories for ParticipatingHouseholds, and the Corresponding Heckman Selection Correction Model in UPA-SarpanchVillages
(1) (2) (3) (4) (5)Tobit Model Heckman Selection Correction Model
Log Days Log Payment Log Days Log Payment Selection
Household Political Category (base: UPA, Politically Inactive)
UPA, Politically Active 0.600** 1.091* 0.418** 0.933** 0.160(0.277) (0.564) (0.191) (0.406) (0.147)
UPA-Rival, Politically Inactive 0.714* 1.032 0.476** 0.895* -0.0333(0.381) (0.794) (0.231) (0.489) (0.165)
UPA-Rival, Politically Active 0.675* 1.430* 0.509* 1.357** 0.322(0.359) (0.824) (0.297) (0.628) (0.205)
Unaffiliated 0.860*** 1.354** 0.562*** 1.124*** 0.119(0.307) (0.665) (0.206) (0.436) (0.151)
Proportion of Adults -0.572 -0.877 0.469**(0.363) (0.777) (0.211)
Inverse Mills Ratio 1.212* 2.728*(0.681) (1.431)
Sigma 1.214*** 2.934***(0.0387) (0.138)
F-test of all political variables 2.86 1.87 14.92 14.79P-value of the joint-test 0.0233 0.1148 0.0608 0.0634Log Pseudo-Likelihood -975.274 -1300.84Pseudo-R2 0.2083 0.1729Sample Size 637 637 1,388 1,388 1,388
Note: Robust standard errors clustered at the village level are in parentheses. All regressions include villagefixed effects. Politically Active refers to intense party activities such as attending rallies, campaigning,attending meetings, giving speeches and writing pamphlets; Politically Inactive households do not participatein political activities. The Unaffiliated category includes those not affiliated with any party or those affiliatedwith fringe parties that are non-UPA and non-UPA-rival. The involvement level of all unaffiliated householdswas set to “Politically Inactive”. Control variables include caste, poverty status, household size categories,proportion of adults, primary occupation and education of the household head, education of the spouse, landownership categories, availability of electricity connection, location in a hamlet, and hours spent reading anewspaper in the past week. The joint-test in columns 1 and 2 report F-test results with (4, 418) degrees offreedom. Columns 3 and 4 for the joint test report chi-square test results with 8 degrees of freedom.
56
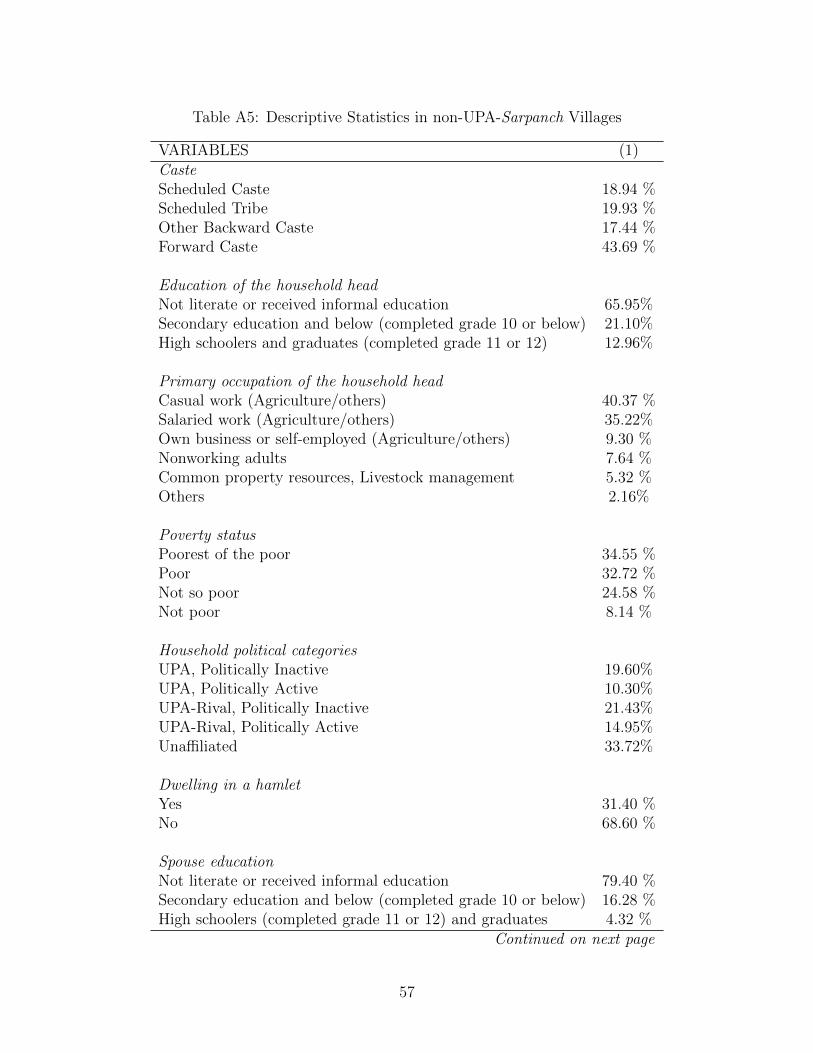
Table A5: Descriptive Statistics in non-UPA-Sarpanch Villages
VARIABLES (1)CasteScheduled Caste 18.94 %Scheduled Tribe 19.93 %Other Backward Caste 17.44 %Forward Caste 43.69 %
Education of the household headNot literate or received informal education 65.95%Secondary education and below (completed grade 10 or below) 21.10%High schoolers and graduates (completed grade 11 or 12) 12.96%
Primary occupation of the household headCasual work (Agriculture/others) 40.37 %Salaried work (Agriculture/others) 35.22%Own business or self-employed (Agriculture/others) 9.30 %Nonworking adults 7.64 %Common property resources, Livestock management 5.32 %Others 2.16%
Poverty statusPoorest of the poor 34.55 %Poor 32.72 %Not so poor 24.58 %Not poor 8.14 %
Household political categoriesUPA, Politically Inactive 19.60%UPA, Politically Active 10.30%UPA-Rival, Politically Inactive 21.43%UPA-Rival, Politically Active 14.95%Unaffiliated 33.72%
Dwelling in a hamletYes 31.40 %No 68.60 %
Spouse educationNot literate or received informal education 79.40 %Secondary education and below (completed grade 10 or below) 16.28 %High schoolers (completed grade 11 or 12) and graduates 4.32 %
Continued on next page
57

Table A5 – Continued from previous pageVARIABLES
Household has electricity connectionUnofficial connection 32.39No 17.11Yes 50.50
Household size≤ two members 13.12 %Three members 14.62 %Four members 27.41 %Five or more members 44.85%
Plot area≤ 1 acre 68.60 %>1 & ≤ 2 acres 11.63 %>2 & ≤ 3 acres 6.98%>3 & ≤ 5 acres 7.31 %>5 acres 5.48%
Mean Proportion of adults 60.54 %Mean Hours of newspaper reading 3.31Sample size 602Number of villages 89
Note: Politically Active refers to involvement in party activities such as attending rallies, campaigning,attending meetings, giving speeches and writing pamphlets; Politically Inactive households do not participatein political activities. The Unaffiliated category includes those not affiliated with any party or those affiliatedwith fringe parties that are non-UPA and non-UPA-rival. The involvement level of all unaffiliated householdswas set to “Politically Inactive”. Nonworking adults are pensioners/rentiers, dependents, students and thosefocusing on households chores. Under each sub-heading in the table, the distribution of households withineach category is presented and they sum to 100%, except Mean proportion of adults and Mean hours ofnewspaper reading which reflects the relevant averages.
58

Table A6: Robustness Check, Dropping Households That Got Jobs or Job-Cards Between February 2006 and theInterview Month. Marginal Effects from Tobit Regression Results in UPA-Sarpanch Villages
(1) (2) (3) (4)Drop Households with Jobs Drop Households with Job-Cards
Log Days Log Payment Log Days Log Payment
Household Political Category (base: UPA, Politically Inactive)
UPA, Politically Active 0.245*** 0.569*** 0.0726*** 0.194***(0.0120) (0.0282) (0.00825) (0.0208)
UPA-Rival, Politically Inactive 0.118*** 0.262*** 0.107*** 0.259***(0.00876) (0.0198) (0.00797) (0.0190)
UPA-Rival, Politically Active 0.413*** 0.991*** 0.170*** 0.373***(0.0192) (0.0462) (0.0166) (0.0380)
Unaffiliated 0.113*** 0.253*** 0.0399*** 0.0814***(0.00660) (0.0150) (0.00483) (0.0109)
Sample Size 1,549 1,549 1,258 1,258
Note: Robust standard errors clustered at the village level are in parentheses. All regressions include village fixed effects. PoliticallyActive refers to intense party activities such as attending rallies, campaigning, attending meetings, giving speeches and writing pam-phlets; Politically Inactive households do not participate in political activities. The Unaffiliated category includes those not affiliatedwith any party or those affiliated with fringe parties that are non-UPA and non-UPA-rival. The involvement level of all unaffiliatedhouseholds was set to “Politically Inactive”. Control variables include caste, poverty status, household size categories, proportion ofadults, primary occupation and education of the household head, education of the spouse, land ownership categories, availability ofelectricity connection, location in a hamlet, and hours spent reading a newspaper in the past week. The F-test of all political variablesin columns 1 and 2 have (4,1551) degrees of freedom, and the those in columns 3 and 4 have (4,1260) degrees of freedom.
59
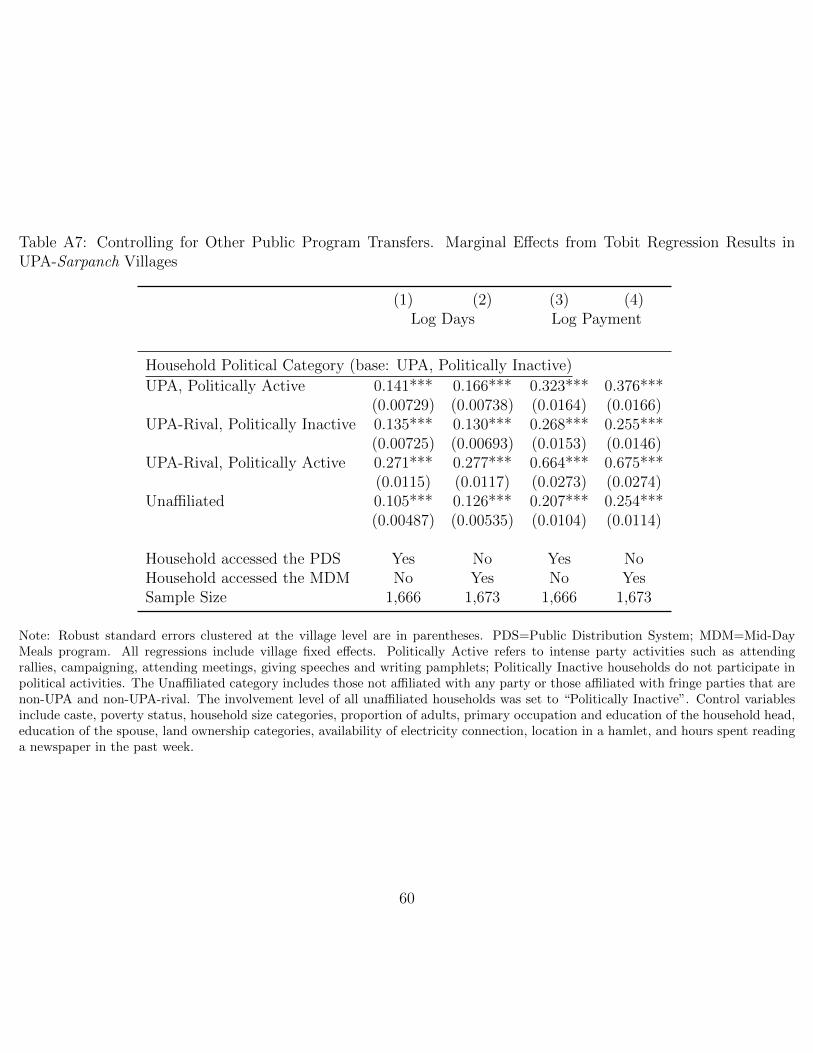
Table A7: Controlling for Other Public Program Transfers. Marginal Effects from Tobit Regression Results inUPA-Sarpanch Villages
(1) (2) (3) (4)Log Days Log Payment
Household Political Category (base: UPA, Politically Inactive)
UPA, Politically Active 0.141*** 0.166*** 0.323*** 0.376***(0.00729) (0.00738) (0.0164) (0.0166)
UPA-Rival, Politically Inactive 0.135*** 0.130*** 0.268*** 0.255***(0.00725) (0.00693) (0.0153) (0.0146)
UPA-Rival, Politically Active 0.271*** 0.277*** 0.664*** 0.675***(0.0115) (0.0117) (0.0273) (0.0274)
Unaffiliated 0.105*** 0.126*** 0.207*** 0.254***(0.00487) (0.00535) (0.0104) (0.0114)
Household accessed the PDS Yes No Yes NoHousehold accessed the MDM No Yes No YesSample Size 1,666 1,673 1,666 1,673
Note: Robust standard errors clustered at the village level are in parentheses. PDS=Public Distribution System; MDM=Mid-DayMeals program. All regressions include village fixed effects. Politically Active refers to intense party activities such as attendingrallies, campaigning, attending meetings, giving speeches and writing pamphlets; Politically Inactive households do not participate inpolitical activities. The Unaffiliated category includes those not affiliated with any party or those affiliated with fringe parties that arenon-UPA and non-UPA-rival. The involvement level of all unaffiliated households was set to “Politically Inactive”. Control variablesinclude caste, poverty status, household size categories, proportion of adults, primary occupation and education of the household head,education of the spouse, land ownership categories, availability of electricity connection, location in a hamlet, and hours spent readinga newspaper in the past week.
60
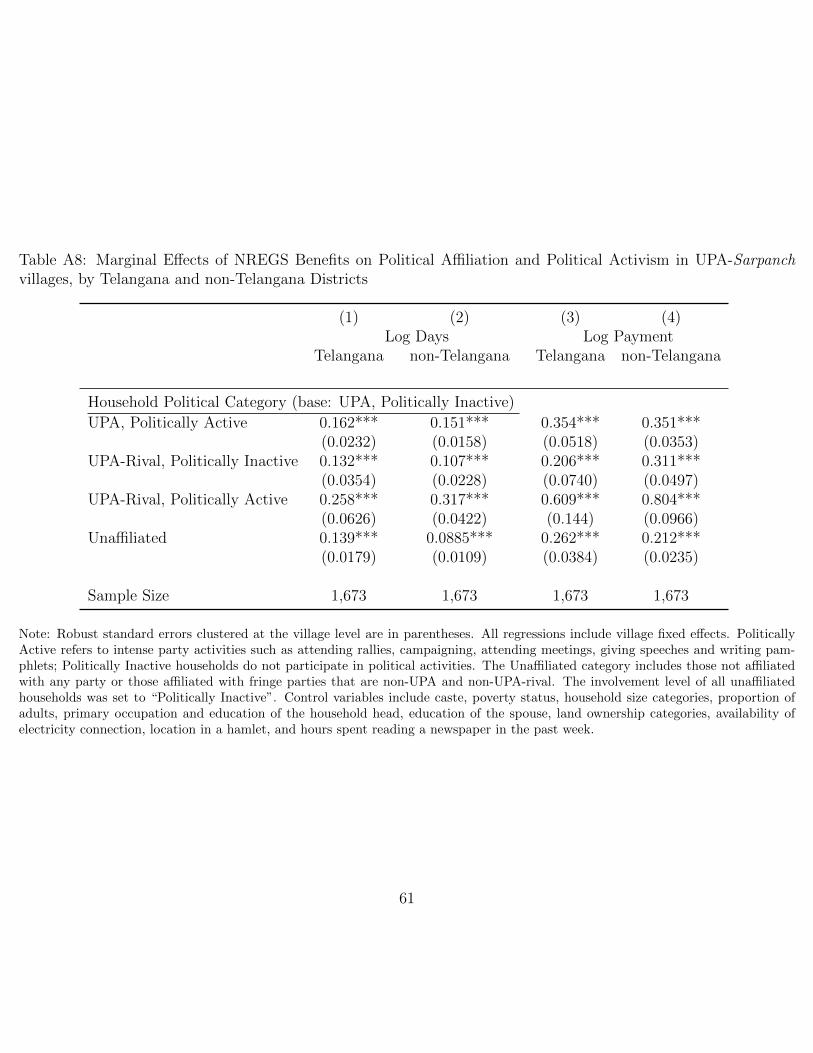
Table A8: Marginal Effects of NREGS Benefits on Political Affiliation and Political Activism in UPA-Sarpanchvillages, by Telangana and non-Telangana Districts
(1) (2) (3) (4)Log Days Log Payment
Telangana non-Telangana Telangana non-Telangana
Household Political Category (base: UPA, Politically Inactive)
UPA, Politically Active 0.162*** 0.151*** 0.354*** 0.351***(0.0232) (0.0158) (0.0518) (0.0353)
UPA-Rival, Politically Inactive 0.132*** 0.107*** 0.206*** 0.311***(0.0354) (0.0228) (0.0740) (0.0497)
UPA-Rival, Politically Active 0.258*** 0.317*** 0.609*** 0.804***(0.0626) (0.0422) (0.144) (0.0966)
Unaffiliated 0.139*** 0.0885*** 0.262*** 0.212***(0.0179) (0.0109) (0.0384) (0.0235)
Sample Size 1,673 1,673 1,673 1,673
Note: Robust standard errors clustered at the village level are in parentheses. All regressions include village fixed effects. PoliticallyActive refers to intense party activities such as attending rallies, campaigning, attending meetings, giving speeches and writing pam-phlets; Politically Inactive households do not participate in political activities. The Unaffiliated category includes those not affiliatedwith any party or those affiliated with fringe parties that are non-UPA and non-UPA-rival. The involvement level of all unaffiliatedhouseholds was set to “Politically Inactive”. Control variables include caste, poverty status, household size categories, proportion ofadults, primary occupation and education of the household head, education of the spouse, land ownership categories, availability ofelectricity connection, location in a hamlet, and hours spent reading a newspaper in the past week.
61

Table A9: Robustness Check, Redefining Political Categories as Very-active and Less-active. Marginal Effects fromTobit Regression Results in UPA-Sarpanch Villages
(1) (2)Log Days Log Payment
Household Political Category (base: UPA, Politically Less Active)
UPA, Politically Very Active 0.0615*** 0.115***(0.00676) (0.0149)
UPA-Rival, Politically Less Active 0.148*** 0.332***(0.00871) (0.0195)
UPA-Rival, Politically Very Active 0.469*** 1.042***(0.0253) (0.0557)
Unaffiliated 0.0828*** 0.149***(0.00524) (0.0110)
Sample Size 1,673 1,673
Note: Robust standard errors clustered at the village level are in parentheses. All regressions include village fixed effects. In the alternatedefinition of political activism used in this regression, Politically Very Active refers to intense party activities such as campaigning,giving speeches and writing pamphlets; Politically Less Active refers to households attending rallies, speeches and meetings, and also notparticipating in political activities. The Unaffiliated category includes those not affiliated with any party or those affiliated with fringeparties that are non-UPA and non-UPA-rival. The involvement level of all unaffiliated households was set to “Politically Inactive”.Control variables include caste, poverty status, household size categories, proportion of adults, primary occupation and education ofthe household head, education of the spouse, land ownership categories, availability of electricity connection, location in a hamlet, andhours spent reading a newspaper in the past week.The F-test of all political variables has (4, 1675) degrees of freedom.
62
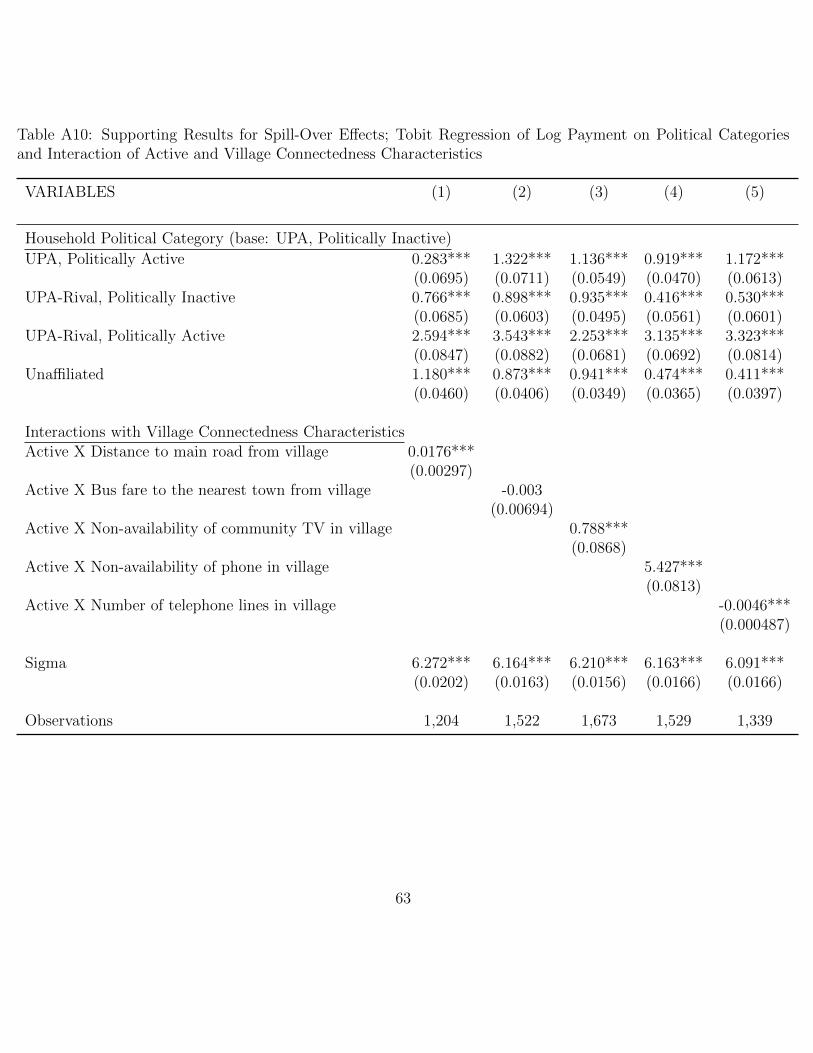
Table A10: Supporting Results for Spill-Over Effects; Tobit Regression of Log Payment on Political Categoriesand Interaction of Active and Village Connectedness Characteristics
VARIABLES (1) (2) (3) (4) (5)
Household Political Category (base: UPA, Politically Inactive)
UPA, Politically Active 0.283*** 1.322*** 1.136*** 0.919*** 1.172***(0.0695) (0.0711) (0.0549) (0.0470) (0.0613)
UPA-Rival, Politically Inactive 0.766*** 0.898*** 0.935*** 0.416*** 0.530***(0.0685) (0.0603) (0.0495) (0.0561) (0.0601)
UPA-Rival, Politically Active 2.594*** 3.543*** 2.253*** 3.135*** 3.323***(0.0847) (0.0882) (0.0681) (0.0692) (0.0814)
Unaffiliated 1.180*** 0.873*** 0.941*** 0.474*** 0.411***(0.0460) (0.0406) (0.0349) (0.0365) (0.0397)
Interactions with Village Connectedness CharacteristicsActive X Distance to main road from village 0.0176***
(0.00297)Active X Bus fare to the nearest town from village -0.003
(0.00694)Active X Non-availability of community TV in village 0.788***
(0.0868)Active X Non-availability of phone in village 5.427***
(0.0813)Active X Number of telephone lines in village -0.0046***
(0.000487)
Sigma 6.272*** 6.164*** 6.210*** 6.163*** 6.091***(0.0202) (0.0163) (0.0156) (0.0166) (0.0166)
Observations 1,204 1,522 1,673 1,529 1,339
63
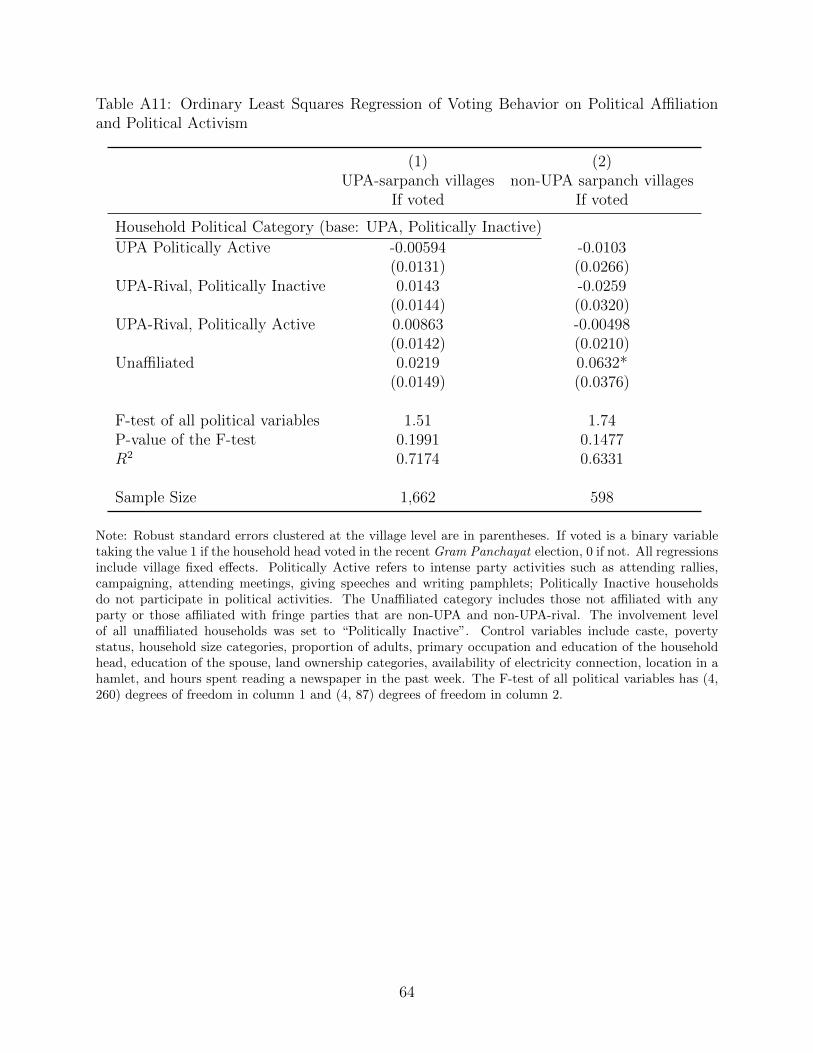
Table A11: Ordinary Least Squares Regression of Voting Behavior on Political Affiliationand Political Activism
(1) (2)UPA-sarpanch villages non-UPA sarpanch villages
If voted If voted
Household Political Category (base: UPA, Politically Inactive)
UPA Politically Active -0.00594 -0.0103(0.0131) (0.0266)
UPA-Rival, Politically Inactive 0.0143 -0.0259(0.0144) (0.0320)
UPA-Rival, Politically Active 0.00863 -0.00498(0.0142) (0.0210)
Unaffiliated 0.0219 0.0632*(0.0149) (0.0376)
F-test of all political variables 1.51 1.74P-value of the F-test 0.1991 0.1477R2 0.7174 0.6331
Sample Size 1,662 598
Note: Robust standard errors clustered at the village level are in parentheses. If voted is a binary variabletaking the value 1 if the household head voted in the recent Gram Panchayat election, 0 if not. All regressionsinclude village fixed effects. Politically Active refers to intense party activities such as attending rallies,campaigning, attending meetings, giving speeches and writing pamphlets; Politically Inactive householdsdo not participate in political activities. The Unaffiliated category includes those not affiliated with anyparty or those affiliated with fringe parties that are non-UPA and non-UPA-rival. The involvement levelof all unaffiliated households was set to “Politically Inactive”. Control variables include caste, povertystatus, household size categories, proportion of adults, primary occupation and education of the householdhead, education of the spouse, land ownership categories, availability of electricity connection, location in ahamlet, and hours spent reading a newspaper in the past week. The F-test of all political variables has (4,260) degrees of freedom in column 1 and (4, 87) degrees of freedom in column 2.
64
WP No Title Author(s)
OTHER A.E.M. WORKING PAPERS
Fee(if applicable)
Political Activism as a Determinant ofClientelistic Transfers: Evidence from andIndian Public Works Program
Chau, N., Liu, Y. & V. Soundararajan2018-01
Too Much to Eat It All: How Package SizeImpacts Food Waste
Petit, O., Lunardo, R. and B. Rickard2017-14
Why Secondary Towns Can Be Important ForPoverty Reduction - A Migrant's Perspective
Ingalaere, B., Christiaensen, L., DeWeerdt, J. and R. Kanbur
2017-13
Citizenship, Migration and Opportunity Kanbur, R.2017-12
The Digital Revolution and Targeting PublicExpenditure for Poverty Reduction
Kanbur, R.2017-11
What is the World Bank Good For? GlobalPublic Goods and Global Institutions
Kanbur, R.2017-10
Sub-Saharan Africa's Manufacturing Sector:Building Complexity
Bhorat, H., Kanbur, R., Rooney, C. andSteenkamp, F.
2017-09
Farmer Productivity By Age Over Eight U.S.Census Years
Tauer, L.W.2017-08
Inequality Indices as Tests of Fairness Kanbur, R. and Snell, A.2017-07
The Great Chinese Inequality Turn Around Kanbur, R., Wang, Y. and Zhang, X.2017-06
A Supply Chain Impacts of Vegetable DemandGrowth: The Case of Cabbage in the U.S.
Yeh, D., Nishi, I. and Gómez, M.2017-05
A systems approach to carbon policy for fruitsupply chains: Carbon-tax, innovation instorage technologies or land-sparing?
Alkhannan, F., Lee, J., Gómez, M. andGao, H.
2017-04
An Evaluation of the Feedback Loops in thePoverty Focus of World Bank Operations
Fardoust, S., Kanbur, R., Luo, X., andSundberg, M.
2017-03
Secondary Towns and Poverty Reduction:Refocusing the Urbanization Agenda
Christiaensen, L. and Kanbur, R.2017-02
Structural Transformation and IncomeDistribution: Kuznets and Beyond
Kanbur, R.2017-01
Paper copies are being replaced by electronic Portable Document Files (PDFs). To request PDFs of AEM publications, write to (be sure toinclude your e-mail address): Publications, Department of Applied Economics and Management, Warren Hall, Cornell University, Ithaca, NY14853-7801. If a fee is indicated, please include a check or money order made payable to Cornell University for the amount of yourpurchase. Visit our Web site (http://dyson.cornell.edu/research/wp.php) for a more complete list of recent bulletins.

Political Activism as a Determinant of Clientelistic Transfers:
Evidence from an Indian Public Works Program∗
Nancy H. Chau† Yanyan Liu‡ Vidhya Soundararajan§
January 2018
Abstract: Are political activists preferentially targeted by politicians engaging in clientelis-tic transfers to bolster political support? We provide the first model to highlight two possiblerationales for such transfers: to mobilize support from the activists themselves, or to mobi-lize support from electors these activists have influence over. Using novel household data onex ante political affiliation and jobs received subsequent to large-scale decentralized workfareprogram in India, we find that activists are indeed preferentially targeted, and furthermore,such transfers are more pronounced in locations where citizen political involvement is lesscommon, and in remote and less connected areas where activists’ role in information trans-fers is most critical. We argue that the evidence is consistent with the use of transfers toleverage the influence of activists over the decision-making of other electors. Our results arenot driven by self selection, reverse causality, and other program transfers, and are robustto alternate definitions of “activism”.
JEL Classification: D7, H5.
Keywords: Political Clientelism, Political Activism, NREGS, India.
∗We gratefully acknowledge the funding support from 3ie (International Initiative for Impact Evaluation)and CGIAR-Policies, Institutions and Markets (PIM) Program. We thank Siwan Anderson, Kate Ambler,Maria Casanova, Mausumi Das, Upasak Das, Sylvan Herskowitz, Vegard Iversen, Jordan Kyle, Diego Maio-rano, Dilip Mookherjee, Danielle Resnick, Megan Sheahan, Rohini Somanathan and seminar audience atCornell University, Indian Institute of Management Bangalore, Delhi School of Economics, Indian Statisti-cal Institute Delhi, California State University Fullerton, Eastern Economics Association Conference 2017,Indian Institute of Technology Kanpur, Soceity for Economics Research in India, and International FoodPolicy Research Institute for discussions and feedback. All errors are our own.
†Cornell University. Email:[email protected]‡International Food Policy Research Institute. Email:[email protected]§Indian Institute of Management Bangalore. Email:[email protected]

1 Introduction
Political parties are known to strategically redirect public resources through decentralized
programs to secure and expand their party base. In a large and long-standing literature,
such activities have been referred to as tactical redistribution and/or political clientelism
(Downs, 1957; Wright, 1974; Wyatt, 2013; Dixit and Londregan, 1996). In classic probability
voting models, politicians target swing voters, who are closest to the center of the political
spectrum, because transfers to this group lead to a greater increase in political support
than transfers to groups with more extreme ideological attachments (Lindbek and Weibull,
1987; Dixit and Londregan, 1996, 1998; Stokes, 2005). Preferential targeting is also based
on other elector characteristics such as political affiliation (Cox and McCubbins, 1986) and
the tendency for reciprocal behavior (Finan and Schechter, 2012). Notably, citizens in these
earlier studies play an exclusively passive role: they simply receive political transfers and
choose party allegiance, and are otherwise not involved in politics. However, this limited
role is inconsistent with a multitude of other activities in which electors may be involved;
thus, it does not tell the whole story.
In this study, we examine “political activists”, or politically active citizens, who under-
take administrative and advocacy tasks such as campaigning, promoting candidates, attend-
ing party meetings, and assisting with party administration, among others. These activists
convey crucial information to their fellow citizens, help set the tenor and tone of public
campaigns, and can potentially effectively shape public opinion. To the extent that citizen
political activism can raise/alter public awareness about politics and politicians, it is natural
for politicians to woo activists in order to engender political support from other citizens or
from activists themselves.1 Further, given the new and emerging evidence regarding the role
1 Examples of such focussed electoral social engineering abound. A recent and relevant one is that of theBharatiya Janata Party (BJP) in India, which wooed the upper caste voters (specifically the Brahmins) inthe 2017 Uttar Pradesh state elections in order to engender larger support because although Brahmins onlyheld 10 percent of the electorate, they frame a disproportionately large share of the public discourse, andtheir votes were often referred to as the “first vote”. “In the local media, at the chai shop, amongst thechattering classes, Brahmins have power to influence the sense of the political hawa” (Vij, 2016).
1

of information and education in shaping voter preferences (Grossman and Helpman 1996;
Wantchekon 2003; Vincente 2014; Banerjee et al, 2011), the potential role of activists as
messengers of political information is crucial and begs investigation.
We introduce a model of political clientelism in which a distinction is made between two
types of citizen identities: (i) citizens who choose political allegiance when presented with
transfers and/or information, and (ii) citizen political activists whose political participation
can change the political allegiance of other citizens. Given the opportunity, do politicians
opt to make clientelistic transfers to undecided/swing voters to directly influence them, or do
they make clientelistic transfers to activists to influence them and their political messages
to others? These two distinctive channels of influence through clientelistic transfers are
referred to here as the direct and spillover effects, respectively. To explicitly capture the
spillover effects, the model innovates by spelling out the interaction between activists and
non-activists as a result of a Poisson matching process. This allows us to examine how
the political allegiance of non-activists can be shaped by the cumulative effect of all their
encounters with activists. In doing so, our model makes the intuitive prediction that if
the spillover effect is present, the size of preferential transfers to activists rises with the
fraction of politically inactive individuals in a jurisdiction.2 In addition to political activism,
the model also incorporates a set of other determinants of clientelistic transfers that have
received attention in the literature, including income (Dixit and Londregan 1996; Stokes
2005) and party affiliation (Cox and McCubbins 1986).
We offer empirical evidence on this issue in the context of a decentralized public works
program, specifically the National Rural Employment Guarantee Scheme (NREGS) in India,
arguably one of the largest workfare programs in the developing world. We examine whether
village leaders in the southern Indian state of Andhra Pradesh practice clientelism in allo-
cating NREGS jobs and payment based on the household adult male’s political affiliation
2 There could be other channels of information spillover from activists to other electors. For example,activists may be more influential in remote areas where people has fewer other methods of informationcommunication. We explore more such spillover channels in the empirical model.
2

and/or activism level.3
Our core dataset is from a primary household survey conducted in Andhra Pradesh by
the World Bank in August-October 2006, right after the start of NREGS Phase I (February
2006). We focus on villages governed by leaders (henceforth, sarpanch) affiliated with the
United Progressive Alliance (UPA), a coalition of parties led by the Indian National Congress
(INC). During our study period, the INC held power both at the state-level (Andhra Pradesh)
and at the federal-level and accrued much political clout at that time.
We estimate the effects of political affiliation and activism in 2006 on NREGS work and
payments received cumulatively in 2006 and 2007 using a Tobit model for UPA-sarpanch
villages. The timing of our survey uniquely captures adult male’s political affiliation and
activism level (which we henceforth call the household’s political affiliation and activism)
before or around the commencement of the NREGS program. It thus allows us to address
the reverse causality problem which concerns most previous studies. We use a rich set of
explanatory variables to account for heterogeneity at the household level and use village
fixed effects to capture village level unobservable variables from both the supply and the
demand sides such as available NREGS projects, weather conditions, and the situation of
the rural labor market.
A main identification concern stems from households’ self-selection into NREGS works.
However, there exists widely reported evidence of administrative rationing for NREGS work
especially in the initial years of the program implementation (eg., Ravi and Engler, 2015;
Maiorano, 2014). This supply-driven feature of NREGS suggests that the self-selection con-
cern is largely mitigated. To test if this is the case, we use job-card ownership as a proxy
for desire to work under NREGS to show that desire to work is not correlated with politi-
cal affiliation or activism, after controlling for village fixed effects and household observed
3 Andhra Pradesh is interesting for the dichotomy it offers. On the one hand, the state implementedseveral measures to ensure accountability of the NREGS through real-time availability of data and improvedchannels for public vigilance and civil society participation (Aiyar and Samji, 2009; Subbarao et al. 2013).On the other hand, the state leads Indian states in terms of the total money seized during elections, aphenomenon particularly acute in local elections (Centre for Media Studies, 2014). It is worthwhile toexamine the presence and nature of clientelism within these two parallel worlds.
3

characteristics.4 We also conduct a falsification test using data from non-UPA sarpanch vil-
lages to show that our results are not driven by other unobserved demand-side confounding
factors.5
Although the timing of our survey addresses most reverse causality concerns, some con-
cerns still remain in phase-I villages, where some households may have received benefits or
the promise of benefits between program commencement (February 2006) and the survey
(August 2006); this could in turn influence their political affiliation and/or activism.6 To
address this concern, we show that our results remain robust by repeating our analysis after
separately dropping households that received NREGS benefits, and dropping households that
received a job-card (in response to the promise of benefits) between February 2006 and their
interview month. We conduct additional robustness exercises to show that our results are
not driven by other concurrent factors such as split of Telangana from Andhra Pradesh and
household participation in other public programs. Our results also hold under alternative
definitions of political activism and for inclusion of different sets of control variables.
Our results reveal two distinctly striking patterns. First, in villages governed by a
UPA-sarpanch, politically active households affiliated to UPA and UPA-rival households
obtained significantly higher days of work and payment cumulatively in 2006 and 2007 than
politically inactive households in the respective parties. Using insights from our theoretical
model, we explore the mechanisms that drive the preferential treatment of political activists,
by interacting the binary variable for “political activist” with the share of politically active
households within the village. Notably, and consistent with the model with spillover effects,
active households living in villages with a larger share of politically inactive households
receive more benefits. Furthermore, activists are rewarded with more benefits in remote and
4 Indeed, job-card ownership could be considered a proxy for desire to work because a job-card is thefirst step in obtaining NREGS benefits; the card is also free of charge and is straightforward to obtainwithout requiring approvals from upper power echelons. We also show robustness by considering only thejob-card-holding households.
5 Unlike UPA sarpanch, the non-UPA sarpanch lacks the resources and the political will to engage inclientelism (Gupta and Mukhopadhyay, 2016).
6 This concern does not exist for phase-II villages, in which the NREGS program started after our survey.
4

less-connected villages where they may play a dominant role as information providers, and
in villages with a higher share of households belonging to the same or lower caste as activists
in which case they may act as powerful influencers in the caste-based network (Vij, 2016).
Second, inactive households affiliated with the rival party or those unaffiliated with any
party are preferentially targeted compared to UPA party loyalists, indicating that the UPA-
sarpanch is following an expansionist strategy to increase the party’s support base. The
extent of clientelistic transfers to political groups in villages dominated by non-UPA house-
holds is higher than in villages dominated by UPA households, supporting the expansionist
motive of the UPA-sarpanch.
Our paper contributes to the literature in at least two aspects. First, it adds to the
theoretical literature on political clientelism by introducing political activism as a key voter
characteristic and highlighting information spillover as a channel for activists to be targeted
to government programs by politicians. To our knowledge, no previous model has addressed
the channel of information spillover through activists in clientelistic transfers. We provide
empirical evidence to support the findings of the model.7
Second, our result that households affiliated with the rival party or unaffiliated with
any party are preferentially targeted provides a stark contrast to other studies in the Indian
context which have shown that leaders patronize loyalist households. It also distinguishes
from the general literature on clientelistic transfers which suggests either the loyalists or the
swing-voters are targeted. Various micro-level studies empirically demonstrate clientelistic
transfers in multiple settings, mostly concluding that preferential transfers are offered to
political allies or politician households. See Markussen and Tarp (2011) on land improvement
investment in Vietnam; Besley, Pande and Rao (2012) and Markussen (2011) on below-
poverty-line (BPL) card in south India; Das (2015) on NREGS jobs and Bardhan et al.
7 Our paper also relates to the literature which studies how politicians target the so-called “politicalbrokers”, who are hired because of their deep knowledge of the electoral preferences (Marcolongo 2017;Stokes et al. 2013). In the parlance of this literature, our sarpanch, carrying out the party’s wishes ofbolstering and expanding the party base, could be considered the broker of the party who is familiar withthe village members’ preferences and demographics.
5

(2009) on a host of recurring private benefits in West Bengal. Similar conclusions were
drawn concerning fund and resource allocation at the aggregate level (Schady, 2002; Case,
2000; Sheahan et al., 2016; Gupta and Mukhopadhyay, 2016; Dahlberg and Johansson, 2002;
Asher and Novosad, 2015; Khemani, 2004; Himanshu et al., 2015; Fried, 2012).8
We attribute our distinct finding that the rival-party affiliates are preferentially targeted
to three aspects of our study. First, we address critical reverse causality issues, unlike previ-
ous studies, which focused on the correlation between party affiliation and program benefits.
Second, there is immense diversity in the institutions and the political environment across
states in India. The UPA, due to its uniquely powerful position during our study period, may
have deployed an expansionist strategy in Andhra Pradesh, unlike other relatively weaker
parties which followed a more secure strategy by supporting their own loyalists and securing
the party stronghold in other parts of the country other studies are based on. Third, our
study in the context of a public works program differs from welfare programs considered in
most previous studies. Beneficiaries of public works programs are offered job opportunities,
not cash transfers or other “free” benefits like welfare programs. Thus, following an aggres-
sive expansionist strategy to target rival affiliates are probably less offensive to loyalists than
typical welfare programs.
Three key aspects of our analysis are worth pointing out here. First, while other pub-
lic programs also provide potential channels for clientelism, preferential targeting through
the NREGS is sizeable and could potentially be dominant because, unlike other programs,
NREGS delegates a large amount of resources and discretion to local village leaders. Sec-
ond, unlike in some prior studies, we do not study clientelistic vote-buying surrounding an
election, but instead we study support buying as a practice of decentralized governments,
8 A parallel set of studies shows that firms also benefit from political ties through higher stock marketvaluations, credit and revenue (Fisman, 2001 (Indonesia); Khwaja and Mian, 2005 (Pakistan); Faccio, 2006(multi-country); Cingano and Pinotti 2013 (Italy)). Evidence also shows that clientelism operates throughthe channel of social identity, in which leaders show preference towards their own social group (such as caste,ethnicity, or religion) at the expense of others. This preference takes the form of providing larger targetedtransfers to their own group (Burgess et al. 2015; Munshi and Rosenzweig, 2015), focusing on public goodsthat the leader’s group cares about (Banerjee and Somanathan, 2007), or indirectly inhibiting the efficientfunctioning of public programs that benefit the needy (Anderson et al. 2015).
6

undermining long-term functioning of democratic politics and development (Bardhan and
Mookherjee 2012 and Khemani 2015). Third, our analysis is carried out at the micro-level,
rather than at the aggregate level, in order to explicitly capture the role of political ac-
tivists. Also, micro-studies can potentially offer alternate perspectives to those shown in
aggregate-level studies, even within the same context.9
The next section introduces the NREGS program both in India as a whole and in Andhra
Pradesh. Section 3 describes the theoretical model, while section 4 describes our data and
section 5 presents our methodology. We present the results in section 6 and conclude in
section 7.
2 Andhra Pradesh and the National Rural Employ-
ment Guarantee Scheme
The NREGS was a flagship program of the UPA, a coalition of center-left political parties
that governed India for two consecutive five-year terms spanning 2004 to 2009 and 2009 to
2014. During our study period, the UPA held power both at the center and in the state of
Andhra Pradesh. In the 2004 state elections in Andhra Pradesh, UPA members included the
Indian National Congress (INC), Telangana Rashtra Samithi (TRS), Communist Party of
India (CPI), CPI (Marxist), and Majlis-e-Ittehadul Muslimeen (MIM). The non-UPA parties
in the 2004 state elections included the Telugu Desam Party (TDP) and the Barathiya
Janata Party (BJP). The NREGS obtained constitutional recognition and came into force
as a law in September 2005. In 2012-2013, the program generated 2.3 billion person-days
of employment for 49.9 million households nationwide, from a budget of US$ 47.93 million.
Under this program, adults in rural households can work up to 100 days; this number of
9 This is particularly the case for decentralized programs because local village bodies form the lowestlevel of governance and the point of contact for potential beneficiary households, the factors influencing suchbodies to favor one household over the other under clientelistic programs may differ from those influencinga bureaucrat, for instance, to allocate program funds across different states, districts, or other higher-levelgoverning bodies.
7

allowable workdays is shared among household’s adult individuals.
Panel A in Figure 1 represents various stakeholders and within-state work flows under
the NREGS as per federal guidelines. Households first request and obtain a job-card, which
forms the basis of identification and is the legal document on which the number of days
worked are recorded in order to claim wages. Job-card holders can then seek jobs from the
Gram Panchayat (GP), the village-level body headed by the sarpanch, stating the duration
for which work is sought. The GP consolidates work requests from households into a shelf
of projects. From there, the GP’s plan goes up to the block, district, and state levels for
evaluation of technical feasibility, fund approval, and fund release.10
In the villages of Andhra Pradesh, a state-appointed field assistant (FA) also administers
the scheme, in addition to the sarpanch (Panel B in Figure 1). While guidelines suggest that
the FA assists the GP secretary in maintaining registers and in measuring work done, in
reality, the FA plays a more central role in program implementation (Chamorro et al. 2010).11
However, despite the FA’s prominence, the sarpanch still has an important stake in the
implementation of NREGS — to demonstrate performance and/or to appease constituents
- arising from the leader’s need to renew the position of power. In fact, since the sarpanch
short-lists and assists in choosing the FA (Government of Andhra Pradesh, 2006), the former
may potentially control or even ally with the latter.12 Particularly, the UPA-sarpanch and
the FA are natural partners in action because the FAs are appointed by the state, which
10 Infrastructure projects related to water conservation and water harvesting; drought-proofing, includingafforestation; irrigation works; restoration of traditional water bodies; land development; flood control; ruralconnectivity, and other works notified by the government, are some important works permissible under thescheme’s radar. Further, the act sets a minimum limit to the wages to be paid on a time-rate basis oron a piece-rate basis, without gender discrimination. Certain transparency and accountability measuresare supposed to be in place, through mechanisms like “squaring of accounts”, conducting social audits toensure accountability through public vigilance and participation of civil society, and maintaining records andensuring their availability for evaluation and scrutiny.
11 Maiorano (2014) notes that FAs provide job-cards and jobs and decide on the list of projects, all ofwhich are duties of the GP (of which the sarpanch is a member) as per the operational guidelines.
12 Data from a GP survey show that “for the first and the most recent FA, the village council had the mainsay in FA appointments in at least 80 per cent of the GPs. In about 40 per cent of appointments, villagecouncils controlled the entire selection process with no mandal level and is therefore well positioned to fudgematerial expenditures in connivance with other staff (viz., Assistant Engineers, Technical Assistants and/orthe suppliers). Hence, the village council and its leader are accountable both for ensuring efficient deliveryof program benefits and for the labor and material expenditures on NREGA projects.”(Afridi et al. 2017).
8

is governed by the UPA itself (Maiorano 2014). As per the party’s wish, both partners
may plausibly work toward achieving the same political objectives — that is, securing or
expanding UPA’s support base (Afridi et al. 2017).
In what follows, we theoretically model the problem of the local ruling politician (the
UPA-sarpanch in our case) who is carrying out the party’s goal of bolstering and expanding
political support through the tactical distribution of NREGS benefits. Our objective is to
extend canonical models of political support to account for voter-level characteristics that
may alter the pattern of political clientelism.
3 A Simple Model of Political Clientelism
Consider a model of political clientelism with two political parties: the ruling party (o) and
the rival party (r). The electorate contains a large number (N) of heterogeneous citizens.
Citizen heterogeneity originates from three sources: differences in (i) political preferences p,
(ii) propensity to participate in political activities k, and (iii) income y. 13 Each citizen,
characterized by the triplet {p, k, y}, chooses a political affiliation a ∈ {o, r, u}, to support
the ruling party (o), support the rival party (r), or remain unaffiliated (u).
There are three types of political preferences p ∈ {o, r, u}, respectively representing pro-
ruling party (o), pro-rival party (r), and neutral preferences (u). Let θpa denote a parameter
that reflects the political preference p of a citizen with party affiliation a. We assume
that political preference induces an ordering of the choices a ∈ {o, r, u} such that θpp =
max{θpo , θpr , θpu}, for p ∈ {o, r, u}. The fraction of citizens in the electorate with political
preference p is given by φp ∈ (0, 1), with∑
p=o,r,u φp = 1.
The N citizens embrace different degrees of political activism k, which takes on one of
two values: k = k > 1 for politically active individuals and k = 1 otherwise. In our data,
politically active individuals are those who participate in political campaigns, attend political
13In our empirical analysis, we include a vector of socio-economic characteristics in addition to income.These are discussed in detail in Section 4.
9

meetings, give speeches, write pamphlets, attend political rallies and / or offer donations.
We denote φok≥ 0 and φr
k≥ 0 as the share of politically active citizens with party preference
p = o and r, respectively. The rest of the citizens, φo1 = φo − φok
and φr1 = φr − φrk, are not
politically active (k = 1). Citizens with neutral political preferences naturally do not engage
in political activities, and thus φu1 = φu and φuk
= 0.14
To capture income heterogeneity, we denote G(y) as the cumulative distribution function
of income. Across theN citizens, income is independent and identically distributed regardless
of party preference and political activism.15
The utility of each citizen {p, k, y}, henceforth ωpk(a; y), depends furthermore on that
citizen’s choice of political affiliation a in the following way:
ωpk(a; y) = y + kγθpa. (1)
where γ ≥ 0.16
As a benchmark scenario in which politically motivated transfers are absent, it follows
directly from (1) that the utility maximizing political affiliation (a) depends only on political
preferences p, since maxa ωpk(a; y) = ωpk(p, y), p = {o, r, u}. Thus, the number of citizens who
prefer political affiliations a = o, r, and u are, respectively, φo, φr and φu.
Political Clientelism in a Heterogeneous Citizen Pool
The ruling politician targets public funds to bolster political support based on the observable
characteristics of a citizen prior to any transfers {p, k, y}.17 We follow the approach of the
14Thus, political activism is an attribute at the individual level. We are agnostic about the reason indi-viduals differ in k, and our specification accommodate situations in which political activism is driven by theintensity of an individuals’ political preference, is commissioned by political parties, or both.
15It is straightforward to incorporate political preference or political activism specific income distribution.Doing so does not alter the conclusions we report.
16 The parameter γ ≥ 0 captures two potential types of scenarios. When inequality is strict, citizen-cum-political activists put greater preference weights on the consequences of their party affiliation choices thaninactive individuals. By contrast if γ = 0, citizen utility is independent of political activism. The former isconsistent with political activism driven by strong political preferences. The latter is consistent with partycommissioned political activities, for example.
17 From (1), a citizen’s political preference is revealed by his/her (observable) choice of political affiliation
10

long-standing literature starting with Wright (1974), in which targeted transfers are taken
to induce a change in a citizen’s preference ordering over which party to support. Our model
innovates on this previous work by capturing two distinct routes that clientelistic transfers
can take.
First, we allow political preferences to vary with the transfers that a citizen receives
directly from the politician – we call this the direct effect of targeted transfers. Second,
we allow party affiliation preference to vary when politically inactive citizens encounter
politically active citizens who are themselves under the influence of targeted transfers from
the ruling politician – we call this the spillover effect of targeted transfers.18
Denote bpk(y) as the transfer to citizen {p, k, y}, and bpk
as the menu of transfers to
politically active citizens with preference p over all income levels y. In the context of the
NREGS program, these transfers take the form of the total number of days of NREGS
employment and the total wage payment received. Because transfers are the products of the
ruling politician’s flagship program, we assume that only the utility associated with ruling
party affiliation is affected by the transfers. Specifically:
ωpk(a; y, bpk(y)) = y + bpk(y) + kγθpa, if a 6= o
= y + bpk(y) + kγθpo
+upk(bpk(y); y) + Ik
(V o(bok) + V r(brk)
)+ ε, if a = o. (2)
For all individuals receiving transfers, income increases by bpk(y) to y+ bpk(y). We assume
that the political affiliation of an individual cannot be contracted conditional on transfers
ex ante,19 and as such, the preferred party affiliation of citizens will not change subsequent
prior to any targeted transfers.18 Arguably, clientelistic transfers to political activists may affect the tenor and information content of
political campaigns. Furthermore, clientelistic transfers may change the intensity of political activities de-pending on the recipient activist’s party affiliation. Our “spillover effect” terminology aims to accommodatethe possibility of one or both of these effects of clientelistic transfers to activists.
19This assumption can be justified on the grounds that contracts struck due to political clientelism do notreceive protection in the court of law and that the timing of transfers particularly in a workfare program arenot always in synch with political cycles.
11

to transfers, unless political preferences can be influenced by transfers.
In (2), political preference can change due to three reasons: upk(bpk(y); y), V o(bo
k) +V r(br
k),
and ε. Respectively, these refer to the direct effect of transfers, the spillover effect of transfers,
and a random preference shifter. Specifically, ε is a uniformly distributed random variable on
[−ε, ε] which reflects any random shifts in the status quo political preference (θpo) occurring
due to other exogenous shifts in preferences that are outside of the realm of the ruling politi-
cian’s influence.20 The ruling politician can also play an active role in mobilizing support by
directing transfers depending on their direct and spillover effects. We turn to these effects
next.
The Direct Effect of Targeted Transfers
The term upk(bpk(y), y) in (2) reflects the direct effect of targeted transfers on the utility
associated with ruling party affiliation. In particular, direct transfers mobilize support for
the ruling party if and only if upk(b) is increasing in b. The effectiveness of transfers in
mobilizing support, ∂upk/∂b, may be moderated by other citizen-specific characteristics. For
example, if political activism implies relative immunity to political support buying (Lindbeck
and Weibull 1987), then ∂upk/∂b is decreasing in k. Furthermore, if a high income status
also renders individuals immune to political support buying because of diminishing marginal
utility of income (Dixit and Londregan 1996, Stokes 2005), then ∂upk/∂b is decreasing in y.
To capture these potential features of upk(b) in a tractable way, henceforth we approximate
upk(·) by the following quadratic function:
upk(b; y) =(αpb + αpkk + αpyy − αbbb/2
)b ≡ (αp(k, y)− αbbb/2) b, (3)
where the sign of αpb shows the direction and strength of the direct effect of transfers, while
αpk and αpy show respectively the importance of political activism and income as moderating
20 It is straightforward to extend the model to include ranges of ε that are political preference specific[−ε, ε]. As will be evident in the following sections, doing so does not change any of the qualitative resultsobtained here.
12

factors. We assume that αbb is strictly positive to reflect diminishing marginal effectiveness
of transfers in eliciting change in political preference.
The Spillover Effect of Targeted Transfers
To incorporate the spillover effect of clientelistic transfers, which leverages the influence that
political activists may have over the political preference of the politically inactive citizens
with whom they interact, we denote Ik as an indicator variable that takes on the value 1 for
politically inactive individuals, and 0 otherwise. The terms V o(bok) and V r(br
k) in (2) reflect
the direction and size of the spillover effect.
We assume that the more frequent a politically inactive citizen encounters political ac-
tivists with political preference p, the greater the spillover effect, if any. Thus, let np, p = o, r
denote the number of such encounters. We assume that no and nr are Poisson distributed
random variables, by which the average number of meetings per citizen is given by the
population share of the two types of politically active citizens φok/N and φr
k/N .
The size of the spillover effect furthermore depends on the actual amount of transfers that
the political activists receive. Because political activists as a group exhibit different political
preferences (p) and a continuum of income levels (y), the size and sign of the spillover effect
can potentially differ at each encounter with activists depending on the activists’ individual
p and y. We assume that each one of the n = 0, ..., np encounters is a random draw from the
distribution of transfers bpk(yn) received by political activists with preference p and income
yn. With these motivations in mind, the spillover effect is taken to measure the cumulative
influence of the no and nr number of encounters, respectively, with political activists from
the two parties on the political preference of a citizen, p = o, r:
V o(bok) ≡
no∑n=0
βobok(yn), V r(brk) ≡
nr∑n=0
βrbrk(yn). (4)
where the sign and magnitude of the parameters βo and βr show the direction and importance
13

of the spillover effect through encounters with politically active individuals representing the
ruling and rival parties respectively.21 A greater transfer to political activists increases sup-
port for the ruling politician through the spillover effect if and only if βp is positive. At the
level of the individual citizen, therefore, the spillover effect is a random variable that depends
on citizen-specific realizations of the number of meetings with activists np, the income yn of
these activists at each draw n = 0, ..., np, and thus the transfers that the activists receive
bpk(yn).
Party Affiliation in the Presence of Targeted Transfers
Denote Spk(b, y) as the expected fraction of citizens with individuals characteristics {p, k, y}
and receiving transfers b for whom a political affiliation with the ruling party maximizes util-
ity, where the expectation is taken over all possible income levels yn of politically active citi-
zens, and all possible number of encounters with politically active individuals np = 0, ...,∞.
Using (2) - (4), it is straightforward to determine that:22
Spk(b, y) = spk +1
2ε(αp(k, y)− αbbb/2) b+
Ik2ε
∑p=o,r
φpkβpbp
k/N, (5)
where bpk
denotes the average amount of targeted transfers received by politically active
21We assume that any effect of political activism, when unadulterated by preferential transfers, is alreadyembodied in the preference parameters θpo ; as such, we assume that vp(0) = 0.
22To see this, note, for example, that a politically inactive rival party citizen receiving transfers b will prefer
to affiliate with the ruling party if and only if ε > (θrr − θro)− (αp(1, y)− αbbb/2) b−∑
p=o,r
∑np
n=0 βpbp
k. The
associated fraction of individuals who prefer the ruling party is
1
2− 1
2ε
((αp(1, y) + αbbb/2) b+
∑p=o,r
np∑n=0
βpbpk− (θrr − θro)
)
Rewrite∑np
n=0 βpbp
k(yn)as npβp
∑np
n=0 bp
k(yn)/np. It follows that the fraction of ruling party affiliates in the
rival party depends on the random number of encounters with politically active individuals (np), and the
average transfers these individuals receive (∑np
n=0 bp
k/np). Because the expectation of np is simply φp
k/N
with Poisson arrivals, and sampling among political activists is assumed to be unbiased, the expectation of∑np
n=0 bp
k/np is just the population mean, as displayed in (5).
14

citizens with preference p:
bpk
=
∫y
bpk(y)dG(y). (6)
spk is a constant, given by:23
sok =1
2− kγ(max{θor , θou} − θoo)
2ε, srk =
1
2− kγ(θrr − θro)
2ε,
and
su1 =1
2− θuu − θro
2ε.
The two other terms in (5) display the direct and spillover effects of targeted transfers.
Political Clientelism with Citizen Activism
The ruling politician chooses targeted transfers bpk(y) to citizens with characteristics p, k,
and y in order to maximize the total citizen support, measured by the aggregate number of
ruling party affiliates, accounting for the cost of doing so:
maxbpk(y)
∫y
∑p=o,r,u
∑k=k,1
φpk (ρSpk(bpk(y), y)− λbpk(y)) dG(y), (7)
where ρ reflects the money equivalent gains from a unit increase in aggregate political sup-
port, and λ ≥ 1 denotes the marginal cost of public funds. Using (2) - (6), the solution to
(7) is given by:
bp1(y) = max{ 1
αbb(αp(1, y)− 2λε/ρ) , 0} (8)
bpk(y) = max{ 1
αbb
(αp(k, y)− 2λε/ρ+ (1− (φok + φrk)/N)βp
), 0}, (9)
where, to recall, αp(1, y) measures the direct effect of transfers to individuals with political
23 We assume henceforth that interior solutions apply.
15

preference p, activism k and income y:
αp(k, y) = αpb + αpkk + αpyy
The spillover effect of transfers to political activists with political preference p is
(1− (φok + φrk)/N)βp
. Naturally, (8) and (9) together admit a range of potential ordering of clientelistic transfers
over citizen type p, k, and y, as proposition 1 illustrates:
Proposition 1 In an interior equilibrium with bpk(y) > 0, clientelistic transfers
1. to citizens (regardless of political preference and activism) decrease in income y if and
only if there is diminishing marginal utility of income αpy < 0;
2. to non-activists favor rival and neutral affiliates, in that order, (br1(y) > bu1(y) > bo1(y)),
if and only if the ranking of direct effects is αr(1, y) > αu(1, y) > αo(1, y);
3. to activists over non-activists are positive bpk(y)−bp1(y) > 0 if either αpk > 0 and βp = 0,
or αpk = 0 and βp > 0, or αpk < 0 and βp >> 0;
4. to activists over non-activists decrease with the fraction of politically active citizens
(φpk) in the village if and only if the spillover effect is positive (βp > 0).
Let us start with income as a determinant of the direct effect αp(k, y). All else being
equal, the ruling politician preferentially targets low-income individuals if and only if αpy < 0,
as in Dixit and Londregan (1996) and Stokes (2005), for example, where the effectiveness of
transfers in influencing political preference decreases with the individual’s income. Thus, an
NREGS program that succeeds in preferentially targeting the poor may in fact have been
motivated by political gains in the presence of diminishing marginal utility of income.
16

Across individuals with different political preferences, all else being equal, politically
inactive citizens with pro-rival and neutral political preferences receive favorable preferential
transfers compared to pro-ruling party supporters if and only if,
αpb + αpk + αpyy > αob + αok + αoyy, p = r, u (10)
This simply implies that the direct effect of a rupee spent gives rise to a higher increase
in the support from rival party citizens, accounting for the moderating effects of political
activism and income.
Next, consider whether the politician will target political activists for their deep knowl-
edge of electoral preferences and their ability to influence political affiliation (Marcolongo
2017; Stokes et al. 2013). From (8) and (9), all else being equal, transfers to activists over
non-activists is
bpk(y)− bp1(y) =
1
αbb
(αpk(k − 1) + (1− (φok + φrk)/N)βp
).
It follows that transfers may favor political activists for a combination of reasons. First, con-
trary to Lindbeck and Weibull (1987), politically active individuals may be more susceptible
to the influence of political support buying (αpk > 0). Second, even when political activism
has no impact on the direct effect, αpk = 0, a positive spillover effect, βp > 0, may be present.
Third, consistent with Lindbeck and Weibull (1987), politically active individuals may be
less susceptible to the direct influence of political support buying αpk < 0, but the spillover
effect may be sufficiently large. To the extent that the signs of both βp and αpk are unknown,
empirical evidence on the preferential targeting of political activists may imply either that
spillover effects are present via βp > 0, or that political activists are relatively susceptible
to political support buying via αpk > 0 as part of the direct effect of targeted transfers to
political activists.
To resolve this ambiguity, note from (9) that the magnitude of the spillover effects is
17

inversely related to the share of politically active citizens (φok
+ φrk)/N , whereas the direct
effect is unaffected by this population share. Thus, if spillover effects are indeed present,
we should expect that such effects are greater in locations where political activism is less
common.24
We take these implications of the model to the data in the sections that follow. The
empirical relationships between clientelistic transfers and citizen characteristics will be taken
as evidence of the validity of a number of assumptions about the nature of political prefer-
ences, including the existence of direct and spillover effects, and the role of income, political
affiliation, and political activism as mediating factors (as stated in Proposition 1).
4 Data Description
Our dataset encompasses 1,673 households from villages governed by a UPA affiliated sarpanch
in Andhra Pradesh. Our core dataset was collected from a primary field survey conducted
between August and October 2006. It spans four districts: Kadapa, Nellore, Warangal, and
Nalgonda (the first three belong to phase-I of NREGS implementation, and the last belongs
to phase-II). The latter two districts currently belong to Telangana, a state that seceded
from Andhra Pradesh in 2014; Kadapa and Nellore are still a part of Andhra Pradesh.25
The survey collected job-card numbers for all participating households, enabling us to
merge publicly available administrative data (available at http://nrega.ap.gov.in/) into our
survey. The administrative data provides information on NREGS workdays and payments
for each job card.26 Muralidharan, Niehaus, and Sukhtankar (2016) compared NREGS
24 Across citizens, transfers decrease with the spread of citizens 2ε, because the same amount of transferswill give rise to a smaller increase in support when ε is large. Transfers also decrease in the marginal costof public funds λ and increase in the money equivalent gains of political support ρ as perceived by theruling politician. All three of these factors are likely to be jurisdiction-specific, which is accounted for in ourempirical analysis through village fixed effects.
25 In section 6, we show that clientelistic patterns are similar across Telangana and non-Telangana districthouseholds, implying that the politics of Telangana’s secession do not influence our results.
26 We are able to merge 97 percent of the households who reported to possess job cards with the admin-istrative data based on household-reported job card numbers. The remaining three percent households thatwe fail to merge with the administrative data are excluded from our final sample.
18

payments from their household survey data with those from the administrative data based
on household-reported job card numbers in Andhra Pradesh and did not find any project
leakages.27 This result is consistent with the results from the verification exercises in Sheahan
et al. (2016).28 Both studies support that the data we collected yield reliable information
on NREGS participation.
Our survey also collected data on household affiliation with a particular political party,
if any, which we code into alliances: UPA, UPA-rival, and unaffiliated (the last category
implies no affiliation with any party or affiliation with a few fringe parties), based on the
coalition definitions stated earlier.29 Political affiliation of the village sarpanch is not directly
available because elections to the GP do not run on party labels. However, we were able
to deduce the sarpanch’s party affiliation from households’ response to the three questions
in our survey: (i) Did you vote for the winner in the last GP election? (ii) If so, was that
vote for party affiliation reasons? (iii) With which party are you affiliated?. We found mixed
responses regarding the sarpanch’s affiliation across households, reflecting that many villagers
are unaware of this information about their sarpanch. Considering this heterogeneity in
reporting, we assigned each village sarpanch’s party affiliation to be the one that more
than 50 percent of the sampled households reported. In villages without this majority,
27 Muralidharan, Niehaus, and Sukhtankar (2016) found leakages in NREGS in Andhra Pradesh throughtwo channels: 1. Ghost beneficiaries who did not exist; 2. Fake job cards created by local officials forreal households for stealing NREGS money. However in the second case, the households usually do notknow about the existence of these job cards. Since our NREGS work data is collected based on the jobcard numbers reported by the sample households, the information on NREGS participation collected usingour method is less subject to these concerns on mismatch and leakages. In fact, Muralidharan, Niehaus,and Sukhtankar (2016) compared NREGS payments between the administrative data and their survey databased on household-reported job cards and did not find any project leakage in subdistricts which formed thecontrol group of their study (which evaluates the Smartcard initiative program in India).
28 Sheahan et al. (2016), who also used the same administrative dataset as in our paper, verified thatthe NREGS participation information collected in our way is reliable: “Household interviews on wagesearned and work done by job-card holders match entries in post-office or bank books wherever these wereavailable. Likewise individual recall data on the type of work done and number of days are also consistentwith administrative data, as are the list of assets created since inception.”
29 The same set of questions was administered to females and males in the household, however in ourstudy, we use data reported by males because females tend to participate less in politics, are less politicallyinfluential, and make fewer household economic decisions than men. There could be a concern that becauseparty affiliation is self-declared, it may not reflect actual voting behavior but rather a desire to show gratitudeto the GP leaders. However, this is not a concern here because the survey was conducted in the interviewee’shouse by enumerators; and Panchayat leaders are not expected to see the information in the survey.
19

we left the affiliation blank. Households stating affiliation with a particular party were
also questioned about political activities in which they were involved. We recoded these
activities as either “Politically Active” (campaigning, attending meetings, giving speeches
and writing pamphlets, attending rallies, and offering donations), or “Politically Inactive”
(No participation).30
Table 1 provides the distribution of households in our sample based on a variety of char-
acteristics. Over one-third (39.93 percent) of households are UPA-affiliated and politically
inactive; 19.25 percent are UPA-affiliated and politically active, 10.64 percent are UPA-rival
affiliated and politically inactive, 5.98 percent are UPA-rival affiliated and politically active,
and the rest (24.21 percent) are unaffiliated.
The highest representation is by Other Backward Caste (41.06 percent), followed by
Scheduled Caste (25.52 percent), Forward Caste (19.90 percent), and Scheduled Tribe (13.51
percent). The “Poorest of the Poor” category represents 36.40 percent of the sample, followed
by “Poor” (30.36 percent), “Not so poor” (25.22 percent), and “Non-poor” (8.01 percent)
households.31
Among household heads, 59.18 percent are not formally literate (they may have received
informal education), about a quarter (24.63 percent) received secondary education or be-
low, and about 16.20 percent received high school education. The most popular occupation
is casual work in agriculture and other sectors (44.29 percent), followed by salaried work
in agriculture and other sectors (30.78 percent) and business ownership or self-employment
in agriculture and other sectors (12.25 percent). Non-working adults (typically pension-
ers/rentiers, dependents, students and those focusing on households chores) form 7.59 per-
30 We test the robustness of our results to alternative definitions of coding these activities in section 6.31 Household poverty status was determined by a state-wide effort of “participatory identification of the
poor” that added vulnerability and social exclusion to quantitative indicators from the 2001 national censusand duly ratified by village assemblies. Each household was assigned to one of the four categories: “Poorestof the poor” (those who have food only when they get work, lack shelter, proper clothing, respect, and oftencannot send children to school), “Poor” (those who have no land, live on daily wages, and may need to sendschool-age children to work in times of crisis), “Not so poor” (those who have some land and proper shelter,send children to public schools, and have access to bank credit and public services), and “Non-poor” (thosewho own at least five acres of land, can hire laborers, send children to private schools, use private hospitals,lend money, and have high status).
20

cent of the sample; 3.77 percent own common property resources and manage livestock and
1.32 percent are engaged in other occupations. Over three-quarters (77.64 percent) of the
sample households have non-literate spouses, 16.98 percent have spouses with secondary ed-
ucation or below (completed grade 10 or below) and 5.38 percent have spouses who have
graduated from high school (completed grade 11 or grade 12). The average proportion of
adults in a household is about 60 percent and the average hours of newspaper reading per
week is 3.97.
In terms of number of people in each household, 12.97 percent of households have two
or fewer members, 15.25 percent have three members, 30.54 percent have four members,
and 41.24 percent have five or more members. The majority of farmers (71.55 percent)
have less than one acre land, 11.06 percent have between one and two acres of land, 6.28
percent have between two and three acres of land, 5.02 percent have between three and five
acres of land, and 6.1 percent have more than five acres of land. Around one-third (33.29
percent) of households dwell in a hamlet. Regarding access to electricity, 16.80 percent
of households have no electricity connection, 54.87 percent of households have an official
electricity connection, and 28.33 percent of households have unofficial electricity connection.
Table 2 describes the cumulative NREGS benefits in 2006 and 2007 in UPA sarpanch
villages. Column 1 indicates that UPA-active households obtained the highest proportion
of job-cards (42.54 percent), followed by UPA-inactive households (39.37 percent), UPA-
rival active households (38.00 percent), Unaffiliated households (35.30 percent), and UPA-
rival inactive households (31.46 percent). Columns 2 and 3 report averages of days worked
and payment received for job-card holders only. Average days worked and payments were
highest among UPA-active households (37.03 days and 3,160 Indian Rupees [henceforth,
INR]) followed by unaffiliated (35.23 days and 2,672 INR), UPA-inactive (35.11 days and
2,791 INR), UPA-rival inactive (33.33 days and 2,883 INR), and UPA-rival active (23.15
days and 1,911 INR).
21

5 Empirical Methodology
To empirically examine whether households obtain higher or lower NREGS benefits based
on political coalition affiliation and level of political activism, as shown in the theoretical
framework, we estimate a Tobit model in which the latent variable is specified as:
yiv = γ1PolCategoriesiv + γ2Xiv + γv + εiv, (11)
where yiv, the latent variable determined by the above process, in turn yields two observable
outcomes for household i at village v : (i) log(days+1), or the logarithm of days worked
in NREGS, and (ii) log(amount earned+1), or the logarithm of amount earned through
NREGS, both cumulative over 2006 and 2007.32 εiv is the error term.
In (11), PolCategoriesiv is a vector that interacts a household’s political affiliation (UPA,
UPA-Rival, or unaffiliated) and activism (active or inactive). The interaction gives five polit-
ical categories: 1) UPA-inactive, 2) UPA-active, 3) UPA-rival Inactive, 4) UPA-rival Active,
and 5) Unaffiliated. Xiv refers to the following socio-demographic and economic indicators in
2006: caste, poverty status, household size, proportion of adults, primary occupation, edu-
cation of the household head, education of the spouse, land ownership categories, availability
of electricity connection, location in a hamlet, and hours spent reading newspapers in the
past week. The poverty status, having been developed from a combination of quantitative
and participatory qualitative methods, is unique and precisely captures each household’s
economic status. We include village fixed effects, γv, to capture supply side unobservables
(eg., the availability of NREGS jobs and funds at the village level) and demand side fac-
tors (eg., rainfall, ratio of land owners versus landless, non-farm opportunities). We cluster
standard errors at the village level. The parameter of interest is γ1, which indicates whether
political party membership and activism were considered in the allocation of NREGS work
and benefits.
32 We set days worked and payments of non-participating households to 0.
22

There exist several concerns for the identification of the effects of political affiliation and
activism in (11). First, households may self-select into the program based on unobserved
characteristics (such as desire to work under NREGS) which may be correlated with politi-
cal affiliation and activism. However, this issue is alleviated largely by the well-documented
unmet demand for NREGS work (Gaiha et al. 2010, Dutta et al. 2012, Maiorano 2014,
Narayanan and Das 2014, Das 2015, Sheahan et al. 2016, and Sukhtankar 2016). In Andhra
Pradesh, the percentage of households that sought but did not receive work was 25 percent
in 2009-10 (Liu and Barrett, 2015), and 21 percent, particularly for medak district in 2009
(Ravi and Engler 2015). Rationing was higher in earlier years of the program: 43 percent
in 2007 (Ravi and Engler 2015). Narayanan et al. (2016) further argue that the administra-
tive rationing itself may be underestimated because individuals who wish to participate in
NREGS may be discouraged from job seeking due to extensive rationing. The supply-driven
nature of NREGS is particularly prominent during the initial years of the program (which is
our study period), because NREGS wage was almost universally higher than the prevailing
rural wage in the initial years of the program.
To test whether the supply-driven feature of NREGS has indeed mitigated the self-
selection concern, we use job-card ownership as a proxy for desire to work under NREGS
and examine if job-card ownership is correlated with political affiliation and activism in the
below Probit specification:
Prob(Jobcardiv = 1) = Φ(η1PolCategoriesiv + η2Xiv + ηv + εiv), (12)
where Jobcardiv indicates household job-card ownership and Φ(.) is cumulative distribution
function of the standard normal distribution. All the control variables are the same as in
(11). We consider job-card ownership as a good indicator of household’s inclination to work
in NREGS, because (i) owning a job-card is a prerequisite for NREGS employment; and (ii)
job-card issuance in Andhra Pradesh is free of charge and straightforward. We test the null
23

hypothesis, η1 = 0. We would expect η1 6= 0 if desire to work is correlated with political
affiliation and activism after controlling for the observables. Accordingly, if we fail to reject
η1 = 0, we are less concerned about this omitted variable issue. In addition, we re-estimate
(11) using a restricted sample of only the job-card-holding households to check the robustness
of our estimation. We also follow Das (2015) who employs the Heckman selection correction
methodology to correct for sample selection bias in the restricted sample.33
Second, one may be concerned that other demand-side unobservables at the household
level may bias our estimation. For example, activists may be engaged in job seeking more
aggressively and, as a result, obtain more NREGS benefits. To deal with this concern, we
conduct a falsification test using data from non-UPA sarpanch villages. Our main set of
analysis focus on UPA-sarpanch villages. We expect clientelistic transfers of NREGS to
be minimal for non-UPA sarpanch villages for three reasons. First, the non-UPA sarpanch
lacks the resources for engaging in clientelism and/or is not able to ally with or dominate
state-appointed FAs who likely belong to UPA, in order to achieve common political objec-
tives. Second, because the NREGS program was originally conceived by the INC-led UPA
government in 2006, there may be “leakage of goodwill” for non-UPA parties to engage in
vote/support buying using the NREGS (Gupta and Mukhopadhyay 2016). Finally, non-
UPA-sarpanches may not engage in clientelism using NREGS funds because of the rational
expectation that electors strongly identify the NREGS with the UPA and may not credit
the non-UPA sarpanch with the transfers (Sheahan et al. 2016).34 If activists or specific
party affiliates are targeted due to unobservable characteristics beyond clientelism, such as
their ability to demand for NREGS jobs, significant targeting towards these groups should
33 We follow Das (2015) to use the “Proportion of working adults in the household” as the exclusionrestriction for the first stage equation of the Heckman model. Das (2015) argues that households with highernumber of working members are more likely to seek work but not necessarily be allotted more work, especiallyafter controlling for other socio-demographic characteristics. We use this method to check robustness of ourresults, having in mind that the exclusion restriction may have limitations.
34 Sheahan et al. (2016) show that sub-district-level NREGS spending before 2008-2009 positively in-fluenced UPA votes in the federal elections of 2009, but did not significantly affect votes for the actualincumbent sub-district leader, hinting that electors perhaps identify the NREGS with the UPA, and creditthe UPA for the NREGS benefits they receive even if their leader belongs to a non-UPA party.
24

be present even in non-UPA sarpanch villages. We test this hypothesis (γ1 = 0) for (11) in
non-UPA sarpanch villages.
Third, reverse causality may arise if party affiliation or activism is a result of benefits
received or promised under NREGS. For phase-1 villages (where the program started in
February 2006), we measure political affiliation in the survey months of August to October,
just after the commencement of NREGS. In phase-2 villages, our survey captures political
affiliation before the program started in April 2007, thus making identification cleaner here.
However, in phase 1 villages where households in our sample may have received work or
promise of work, there is a lapse of six months between when the program started and when
we measure political affiliation. Figure 2 presents a timeline of these events. To rule out
reverse causality concerns, we conduct a robustness check by repeating the analysis after
removing households that received jobs or job-cards (a proxy for seeking work in response
to a promise) during these six months.
Fourth, there could be concerns that party affiliation and activism may have been shaped
by other program transfers which are correlated with NREGS transfers. We check robustness
of our results by controlling for transfers from other village-level public programs, such as
the Public Distribution System (PDS) and the Mid-Day Meals (MDM). Our study period
is concurrent with the 2004-2010 Telangana protests which sought to separate Telangana
districts into a separate state from Andhra Pradesh. There may be a concern that the
politics surrounding the secession of Telangana could be driving our results. To alleviate
this concern, we interact the binary variable “Residing in a Telangana district” with the
political categories to see whether our findings are consistent between Telangana and non-
Telangana districts. Since political affiliation and activism are correlated with household
socio-economic characteristics which affect NREGS allocation, one may concern that our
results may be driven by inclusion or exclusion of certain socio-economic characteristics in the
specification. To address this concern, we show robustness of our results while sequentially
adding different socio-economic characteristics in the the control.
25

In addition, we examine if our empirical results are sensitive to our definition of political
activism by redefining the political activism categories as very-active and less-active. In the
new definition, only extremely active citizens who are strongly expected to engage in and
influence political campaigns and shape public opinion are placed in the very-active group.
These activists are individuals involved with campaigning, giving speeches and writing pam-
phlets. Those citizens engaged in less extreme activities, such as attending rallies, speeches,
and meetings, giving donations, or those not involved in any activity were placed in the
less-active group.35
6 Results
In section 6.1, we show how NREGS benefits are targeted based on political activism and af-
filiation. In section 6.2, we show results from several falsification tests and robustness checks
to support the identification of our empirical strategy. We further explore the underlying
mechanisms of the observed clientelistic transfers in section 6.3.
6.1 Targeting NREGS Benefits based on Political Affiliation and
Activism
Table 3 presents the Tobit regression results of NREGS work days and payments on political
affiliation and political activism in UPA-sarpanch villages, from (11). The results indicate
that political affiliation and activism play a significant role in explaining NREGS days worked
and payments received (columns 1 and 2, respectively). We have two main findings. First,
within each of the UPA and UPA-rival groups, activists are targeted significantly more than
inactive electors.36 Second, among inactive voters, the unaffiliated and rival groups get
significantly more benefits than UPA affiliates. Among the active electors, the rival group
35 Only four households offered donations in our sample. Our results are robust when we assign these fourhouseholds who giving donations to the “very-active” group.
36 The F-test results are reported at the bottom of Table 3.
26

gets significantly more than the UPA group.37 These results indicate potentially that the
UPA-sarpanch is pursuing clientelistic practices in order to elicit support responses from
particular target groups outside of his/her party, thus following an expansionist strategy.
The marginal effects on the observed outcomes give a sense of the magnitude of transfers.
Compared to the UPA-inactive group, the UPA-sarpanch allocates 21 percent more days and
57 percent more payment to the UPA-active group, 16 percent more days and 34 percent
more payment to the UPA-rival inactive group, 40 percent more days and 130 percent more
payment to the UPA-rival active group, and 16 percent more days and 35 percent more
payment to the unaffiliated group.38
Engaging in political clientelism depends crucially on the sarpanch’s awareness about the
electorate’s political preferences, affiliation, and activism levels, which in turn requires strong
social networks with village members. Considering the close-knit community that tends to
exist in Indian villages, such awareness levels are conceivable.39 We relate these findings to
the literature on how NREGS played a positive role in UPA’s victory in the federal elections
in 2009 (Elliott 2011; Ramani 2009; Zimmermann 2015, Sheahan et al. 2016). Although our
study does not explicitly examine whether individuals receiving clientelistic transfers voted
in favor of UPA in future elections, the findings in this literature strengthen our case by
demonstrating that politicians have an incentive to use the NREGS for vote buying if they
are rational and aim to maximize votes.
The order of benefits delivered to each political category is different from those presented
in the descriptive statistics in Table 2, raising the possibility that the political categories
may be correlated with household socio-economic characteristics. To check if our results
are sensitive to inclusion/exclusion of certain socio-economics characteristics, we examine in
37 Pair-wise F tests between coefficients of the political variables, reported in Table 3, suggest the corre-sponding differences of the coefficients are statistically significant at the 1 percent level.
38 The marginal effects on log days and log payment are in columns 1 and 2 of Table A1.39 Typically each village has a large main settlement where the majority of the population lives, and
perhaps a few hamlets housing small communities. In our sample, about 83 percent of the sarpanches live inthe main settlement, giving them a chance to engage with and learn about the bulk of the village residents’political preferences.
27

Table A2, the results for days and payment without any control variables (column 1), and
after including additional control variables in subsequent regressions (columns 2-8). While
column 1 mirrors the descriptive statistics (although all the differences are not significant),
the addition of village fixed effects simply changes the results to be consistent with the
sarpanch’s expansionist strategy and targeting of activists, as seen in Table 3. Addition
of control variables does not change the results qualitatively, assuring us that household
characteristics do not drive our results. We also present the distribution of the sample by
poverty status and caste group for each political category in Table A3, showing that they
are not vastly different across political categories.
Despite political affiliation and activism playing important roles, needs-based variables
also significantly influence NREGS work and benefits with expected signs. To give a few ex-
amples, households whose heads are casual workers (the most vulnerable of the categories),
households whose heads and their spouses are not literate and did not receive any formal
education, the poorest-of-the-poor households, and households belonging to the historically
backward castes receive the most jobs and payments.40 Similar results on the importance of
need-based variables in public program targeting have also been observed by prior studies.41
These results are also consistent with the prediction of our theoretical model which suggests
that ruling politician preferentially targets low-income individuals motivated by political
gains in the presence of diminishing marginal utility of income (Proposition 1). Our results
on clientelism do not implicate the performance of the NREGS in helping the target popula-
tion, but they are consistent with the larger problems facing decentralization in developing
countries (Bardhan and Mookherjee 2012).
40 Scheduled Tribe (ST) households, however, receive less work than Forward Caste households, contraryto expectations of higher needs emerging from this former group (Deshpande, 2001; Srinivasan and Mohanty,2004). This is perhaps because tribal settlements tend to be isolated, with fewer visiting officers and withrocky soil, making it hard to implement or build infrastructure projects (Maiorano and Buddha, 2014). Theseattributes of tribal settlements perhaps do not get sufficiently captured by the binary variable indicating“residence in a hamlet”.
41 See, for example, Das (2015) and Sheahan et al. (2016) for coverage of NREGS program in India, andMarkussen (2011) and Besley, Pande, Rao (2005, 2012) for coverage of Below Poverty Line card provision inIndia.
28

6.2 Falsification Tests and Robustness checks
To examine if our estimation is biased by household self-selection into NREGS works, we
use job-card ownership to proxy for desire to work and run a probit regression of job-card
ownership on household characteristics in UPA-sarpanch villages, as in (12). The results are
presented in Table 4. The political variables are jointly insignificant at any conventional
level. This alleviates our concerns about the missing variable of unobserved desire to work
in (11).
Following a different strategy, in Table A4, we restrict our sample to job-card holders
only and show that our results on clientelism are consistent (columns 1 and 2). However,
these results may suffer a potential sample selection bias. To address this, we employ the
Heckman selection correction methodology. Following Das (2015), we use the “Proportion
of working adults in the household” as the exclusion restriction for the first stage equation
which determines job-card seeking (proxy for desire to work) but not actual work done or
payment in the main estimating equation.42 This method also yields qualitatively consistent
results (columns 3 and 4 of Table A4).
To alleviate the concern that other demand-side unobservables at the household level
may have biased our estimation, we conduct a falsification test for (11) using the sample in
non-UPA sarpanch villages.43 The results are presented in Table 5. The political variables
are individually and jointly insignificant for both NREGS workdays and payments, indicating
that our findings in UPA-sarpanch villages are not driven by other unobserved demand-side
factors (such as activists having higher ability to demand for NREGS work).44
To alleviate our concerns of reverse causality, we conduct robustness checks by repeating
42 Das (2015) used ”number of working adults” as the exclusion restriction, arguing that householdswith higher number of working members are more likely to seek work but not necessarily be allotted morework, especially after controlling for other socio-demographic characteristics. Our exclusion restriction iscomparable to Das (2015) because we also controlled for household size.
43 Table A5 presents the descriptive statistics in non-UPA-sarpanch villages.44 We conducted similar analysis exclusively for UPA-rival sarpanches (comprising only BJP or TDP
party sarpanches) and found no support for clientelism. These results are not presented in this paper butare available upon request.
29

the analysis in (11) after removing the households that received jobs or job-cards (a proxy for
seeking work in response to a promise) during the six months between the commencement
of phase-I NREGS (February 2006) and our survey (August-October 2006). Our results
remain qualitatively robust after excluding households that received jobs during this period
(columns 1 and 2 in Table A6), and alternately excluding households that received a job-card
during this period (columns 3 and 4 in Table A6).
Our results are robust after controlling for transfers from the Public Distribution Sys-
tem (columns 1-2 in Table A7) and the Mid-Day Meals (columns 3-4 in Table A7). Further,
columns 1-4 in Table A8 present the marginal effects of political categories separately for
Telangan and non-Telangana districts. The results remain qualitatively robust across both
sets of districts (in comparison with overall marginal effects presented in Table A1), in-
dicating that what we see in Table 3 is not influenced by activities specific to Telangana
or non-Telangana movement-driven politics. Our results are also robust to the modified
definition of activism (shown in Table A9).
6.3 Mechanisms
The empirical results (Table 3) suggest that, in UPA-sarpanch villages (i) politically active
households are offered relatively more NREGS jobs and benefits than inactive households;
and (ii) Unaffiliated and rival party-affiliated households are preferentially targeted compared
to loyalists. In this section, we further explore the underlying mechanisms related to these
results.
6.3.1 Spillover Effects through Activists
Following the theoretical model, the finding that political active households are targeted
may result from two reasons: (i) activists are easily susceptible to transfers (αpk > 0) or (ii)
positive spillover effects (βp > 0) exist from active to inactive households and the politician
expects to tap into those effects. Between these two possible mechanisms, we examine if the
30

spillover effects play a major role by testing whether politically active households receive
fewer benefits in areas with a higher fraction of politically active citizens (as predicted in
Proposition 1). To do this, we interact the share of politically active households in the village
(ShareActivev) with a binary variable indicating political activism (Activevi) and run the
following regression:
yiv = ξ1PolCategoriesiv + ξ2Activeiv ∗ ShareActivev + ξ3Xiv + ξv + εiv (13)
Note that in (13), we do not include ShareActivev because it is absorbed by the village fixed
effects and thus cannot be identified. Our parameter of interest is:
ξ2 =∂E(y)
∂ShareActive|Active=1, (14)
which is predicted to be negative if and only if spillover effects exist and are positive (Propo-
sition 1).
In columns 1 and 2 of Table 6, we show results from (13) and note that the coefficient
estimate of the interaction term of being politically active and the proportion of politically
active households is negative and significant at the 1 percent level. Thus, UPA-sarpanches
appear to target transfers to political activists, depending on the scale of the influence of
political activists in the village. The results imply that a 1 percent increase in the share
of politically active households in the population decreases days worked and payments for
activists by 0.74 percent and 1.54 percent respectively. This finding is consistent with the
prediction of Proposition 1, suggesting that positive spillover effects are the underlying mech-
anism through which the NREGS benefits are targeted. In other words, our results support
that politically active households are targeted in order for them to carry the political goodwill
of the ruling party and to influence others.
We next provide supporting results for spillover effects by testing our motivating example
in the introduction of this paper, wherein political parties sometimes target brahmins (the
31

highest caste group) in India, in order to indirectly influence other voters because brahmins
are often looked up to in Indian rural societies (Vij, 2016). We interact the binary variable
for activism with the share of households belonging to activists’ own- and lower-castes com-
bined as an additional control variable. If the coefficient of this interaction is positive, it
indicates that activists are rewarded relatively more benefits if they can influence a larger
number of individuals through caste networks, and particularly the lower caste groups by
acting as role models. Results from columns 3 and 4 in Table 6 show that the coefficient
of the interaction term is indeed positive and significant, which supports the mechanism on
information spillover through activists.
Stokes et al. (2013) argue that the usage of middlemen in carrying out party services
tends to be stronger in areas where other channels of information spillover are absent and
where communication technologies are weaker. To test this, we interact the binary variable
for activism and a proxy for availability of communication technology or remoteness of the
village and include these separately in our estimating equation. Results from Table 7 show
that activists living in remote areas (measured by distance and bus-fare to the nearest town)
and those living in areas without telephone connections or fewer telephone lines or those
without a community TV are provided relatively more NREGS work days.45 Similar results
are obtained for payments received by households and are presented in Table A10. While
these results are not direct predictions from the theoretical model, they provide important
supporting evidence for spillover effects from active to inactive voters being an important
reason for which activists are targeted.
6.3.2 Targeting Rival Party Affiliates through an Expansionist Strategy
Unaffiliated and rival party-affiliated households are preferentially targeted compared to loy-
alists, indicating an expansionist strategy pursued by UPA-sarpanches. If the UPA-sarpanch
is indeed engaged in an expansionist strategy to attract rival affiliates, we could expect the
45 The sample size varies across specifications because of the missing values of the control variable whichworks as proxy for availability of communication technology or remoteness of the village.
32

extent of clientelism to be higher in villages with a high proportion of non-UPA households.
To test this, we create a variable at the village level, UPADominancev, which takes the
value of 1 if a particular village has higher than the median share of UPA households in the
sample villages and 0 otherwise.46 In a separate regression, we include the interaction of
UPADominancev with the political categories:47
yiv = δ1PolCategoriesiv + δ2UPADominancev ∗ PolCategoriesiv + δ3Xiv + δv + εiv. (15)
If the sarpanch follows an expansionist strategy, we expect δ1 and δ2 to have opposite signs
so that the absolute value of (δ1 + δ2) (the marginal effects of PolCategoriesiv on yiv in
villages with a higher proportion of UPA households) would be smaller than the absolute
value of δ1 (the corresponding marginal effects in villages with a lower proportion of UPA
households).
In columns 1 and 2 of Table 8, the coefficients on the interactions of UPA-dominance
and political categories are negative and significant at the 1 percent level, indicating that
the marginal effects of these political categories on the latent variables for UPA-dominant
villages are significantly lower than those for the villages with higher share of non-UPA-
households. This finding supports that UPA-sarpanches employ clientelism to expand their
party base. In columns 3 and 4 of Table 8, we repeat the analysis in UPA-sarpanch villages
with closer political profiles (villages whose share of UPA-affiliated households ranges be-
tween 0.25 and 0.75), in order for similar villages to be compared with each other. These
results are consistent with those in columns 1 and 2.
Our results on the sarpanch favoring rival party-affiliated and unaffiliated households
differ from other studies in the Indian context which have found that local leaders patronize
loyalists by offering them relatively more benefits.48 These differential findings could be
46 The median share of UPA households across all vilages is 0.30.47 We do not include UPADominancev because it cannot be identified when village fixed effects are
included in the regression.48 Prior literature on India, as noted in the introduction, found that party loyalists and members are given
preference in welfare programs (Das, 2015; Bardhan et al. 2009; Besley, Pande and Rao, 2012; Markussen,
33

explained by our focus on addressing reverse causality issues and by the unique position
of power of the INC-led UPA government in Andhra Pradesh, which led the sarpanches to
employ such expansionist strategies. Our results are also different from those of Sheahan et
al. (2016), which employed sub-district-level data and found no partisan-influenced spending
in Andhra Pradesh before the 2009 state assembly election, but a modest role of political
leaning in distributing funds after 2009. This contrast strengthens the initial motivation for
our work – the fact that within-village household-level benefit allocation patterns could be
different from aggregate-level resource allocation patterns.
6.3.3 Ruling Out Other Mechanisms: Voters and Non-Leader Politicians
Political activists could be targeted because they are likely to be politicians who are perhaps
receiving favors from the village sarpanch. To check if this mechanism holds, in (11), we
control for a binary variable indicating whether a politician lives in the household.49 Our
results do not change after the inclusion of this variable, indicating that this is unlikely a
mechanism at play (columns 1 and 2 for days and payments, respectively in Table 9).
Activists or UPA-rival affiliates could be more likely targeted because they may go out
and vote more compared to non-activists or UPA affiliates. But this is not a big concern
because our data indicate that voting behavior is universal and very similar across the five
political categories, and is not particularly high for activists or any party affiliates.50 We
control for a binary variable on voting in recent elections in (11) and present the results in
columns 3 and 4 for days and payment respectively in Table 9. Our results on activists and
UPA-rival affiliates being targeted are robust to the inclusion of this variable.
2011.)49 We define politician here as sarpanch, vice sarpanch, ward member, member of Mandal Parishad
Territorial Constituencies, mandal vice-president, mandal president, member of Zilla Parishad TerritorialConstituencies, Zilla Parishad vice-chairman, Zilla Parishad chairman, or other political position holder.
50 About 95 percent households voted among the UPA-inactive category; 98 percent voted among theUPA-active category; 93 percent voted among the UPA-rival inactive category; 94 percent voted amongthe UPA-rival active category; 94 percent voted among the Unaffiliated category. We also run additionalregressions to show that political variables are not individually and jointly significantly correlated to votingbehavior. These results are available in Table A11.
34

7 Conclusion
This paper contributes to the literature by developing a model of political clientelism based
on an under-explored citizen attribute – political activism, in addition to two other at-
tributes: political affiliation and income. The model uncovers the role of “politically active”
individuals in their ability to influence and shape opinion, as well as the inclination of politi-
cians to offer targeted transfers to this group in order to indirectly influence other voters
(ie., activists or undecided voters).
We take these model predictions to data and examine the clientelistic practices of local
village leaders under the National Rural Employment Guarantee Program (NREGS) in In-
dia, a public works program operating with unprecedented levels of decentralized funding.
We exploit the unique timing of our survey to address critical reverse causality issues in
estimating the effects of political affiliation and activism on receiving program benefits. We
conduct falsification tests and robustness checks to address identification concerns arising
from households’ self-selection into NREGS work and other concurrent factors such as split
of Telangana from AP and participation of other public programs.
Consistent with the theoretical model, our results provide robust evidence for clientelism
in villages governed by a sarpanch affiliated with the UPA coalition; in these villages, the
sarpanch is able to strategically allocate more resources to politically active households than
to politically inactive households. We show that the active group is targeted because of a
potential information spillover from the active to the inactive group, and not particularly
because the active group is more susceptible to transfers, or because they tend to be more
active job-seekers or earnest voters. We further find that unaffiliated households or rival
party affiliates are offered more benefits compared to loyalists, highlighting an expansionist
strategy employed by the formidable UPA sarpanch. This collective evidence sheds new light
on clientelistic vote buying through the channels of mobilizing support from swing voters
and influencing the behavior of political activists.
35

References
Afridi, Farzana, Vegard Iversen, and M. R. Sharan, “Women Political Leaders, Corruption
and Learning: Evidence from a Large Public Program in India,” Economic Development
and Cultural Change, forthcoming (2017).
Government of Andhra Pradesh, “Andhra Pradesh Employment Guarantee Scheme: Op-
eration Manual,” Commissioner, Rural Development, Government of Andhra Pradesh
(2006).
Aiyar, Yamini and Salimah Samji,“Transparency and Accountability in NREGA A Case
Study of Andhra Pradesh,” Accountability Initiative Working paper No. 1, February
(2009).
Anderson, Siwan, Patrick Francois, and Ashok Kotwal, “Clientelism in Indian Villages,”
American Economic Review 105 (2015): 1780-1816.
Asher, Sam and Paul Novosad, “Politics and Local Economic Growth: Evidence from India,”
Available online at http://www.dartmouth.edu/~novosad/asher-novosad-politicians.
pdf (2015)
Bannerjee, Abhijit, Selvan Kumar, Rohini Pande, and Felix Su, “Do Informed Voters Make
Better Choices? Experimental Evidence from Urban India,” Unpublished working paper
(2011).
Banerjee, Abhijit and Rohini Somanathan, “The Political Economy of Public Goods: Some
Evidence from India,” Journal of Development Economics 82 (2007): 287-314.
Bardhan, Pranab, Sandip Mitra, Dilip Mookherjee and Abhirup Sarkar, “Local Democracy
and Clientelism: Implications for Political Stability in Rural West Bengal,” Economic &
Political Weekly 44(2009): 46-58.
Bardhan, Pranab and Dilip Mookherjee, “Political Clientelism and Capture Theory and
Evidence from West Bengal, India,” UNU-WIDER Working Paper No. 2012/97 (2012).
Besley, Timothy, Rohini Pande and Vijayendra Rao, “Participatory Democracy in Action:
Survey Evidence from South India,” Journal of the European Economic Association 3
(2005): 648-657.
Besley, Timothy, Rohini Pande and Vijayendra Rao, “Just Rewards? Local Politics and
Public Resource Allocation in South India,” World Bank Economic Review 26 (2012):
191-216.
36

Bhattacharyya, Dwaipayan, “Of Control and Factions: The Changing ‘Party-Society’ in
Rural West Bengal,” Economic & Political Weekly 44 (2009): 59-69.
Block, Steven A., “Political Business Cycles, Democratization, and Economic Reform: the
Case of Africa,” Journal of Development Economics 67 (2009): 205-228.
Case, Anne, “Election Goals and Income Redistribution: Recent Evidence from Albania,”
European Economic Review 45 (2001): 405-23.
Centre for Media Studies, “Lure of Money in Lieu of Votes in Lok Sabha and Assembly
Elections The Trend: 2007-2014,” CMS India Corruption Study October (2014).
Chamorro, Mariandrea, Jasmin Cho, Diane Coffey, Dane Erickson, Maria Elena Garcia
Mora, Payal Hathi, Jenny Lah, and Piali Mukhopadhyay, “Holding Government to Ac-
count: The Case of the National Rural Employment Guarantee Act (NREGA) in Andhra
Pradesh, India,” Princeton: Princeton University (2010).
Cole, Shawn, “Fixing Market Failures or Fixing Elections? Agricultural Credit in India,”
American Economic Journal: Applied Economics 1 (2009): 219-50.
Cox, Gary W., and Matthew D. McCubbins, “Electoral Politics as a Redistributive Game,”
Journal of Politics 48 (1986): 370-389.
Dahlberg, Matz, and Eva Johansson, “On the Vote-Purchasing Behavior of Incumbent Gov-
ernments,” American Political Science Review 96(2002): 27-40.
Das, Upasak, “Does Political Connections and Affiliation Affect Allocation of Benefits in
the Rural Employment Guarantee Scheme: Evidence from West Bengal, India,” World
Development 67 (2015): 202-217.
Dasgupta, Rajarshi,“The CPI(M) Machinery in West Bengal: Two Village Narratives from
Koch Bihar and Malda,” Economic & Political Weekly 44 (2009): 70-81.
Deshpande, Ashwini, “Caste at Birth? Redefining Disparity in India,” Review of Develop-
ment Economics 5 (2001): 130-44.
Dixit, Avinash and John Londregan, “The Determinants of Success of Special Interests in
Redistributive Politics,” Journal of Politics 58 (1996): 1132-1155.
Dixit, Avinash and John Londregan, “Ideology, Tactics, and Efficiency in Redistributive
Politics,” Quarterly Journal of Economics 113 (1998): 497-529.
Downs. Anthony, “An Economic Theory of Political Action in a Democracy,” Journal of
Political Economy 65 (1957): 135-150.
Dutta, Puja, Rinku Murgai, Martin Ravallion, and Dominique van de Walle, “Does India’s
37

Employment Guarantee Scheme Guarantee Employment?,” World Bank Policy Research
Discussion Paper 6003 (2012).
Elliott, Carolyn, “Moving from Clientelist Politics Toward a Welfare Regime: Evidence
from the 2009 Assembly Election in Andhra Pradesh,” Commonwealth and Comparative
Politics 49 (2011): 48-79.
Faccio, Mara, “Politically Connected Firms,” American Economic Review 96 (2006): 369 -
386.
Federico Cingano and Paolo Pinotti, “Politicians At Work: The Private Returns And So-
cial Costs Of Political Connections,” Journal of the European Economic Association 11
(2013): 433-465.
Finan, Frederico and Laura Schechter, “Vote-Buying and Reciprocity,” Econometrica 80
(2012): 863 - 881.
Fisman, Raymond, “Estimating the Value of Political Connections,” American Economic
Review 91 (2001): 1095 - 1102.
Fried, Brian, “Distributive Politics and Conditional Cash Transfers: The Case of Brazil’s
Bolsa Famılia,” World Development 40 (2011): 1042-1053.
Gaiha, Raghav, Shylashri Shankar and Raghbendra Jha, “Targeting Accuracy of the NREG:
Evidence from Rajasthan, Andhra Pradesh and Maharashtra,” The Australia South Asia
Research Centre (ASARC) Working Paper 2010/03 (2010).
Grossman, Gene M. and Elhanan Helpman, “Electoral Competition and Special Interest
Politics,” The Review of Economic Studies 63 (1996): 265-286.
Gupta, Bhanu and Abhiroop Mukhopadhyay, “Local Funds and Political Competition: Ev-
idence from the National Rural Employment Guarantee Scheme in India,” European
Journal of Political Economy 41 (2016): 14-30.
Heckman, James J, “Sample Selection Bias as a Specification Error,” Econometrica 47
(1979): 153-161.
Himanshu, Mukhopadhyay, A, and Sharan, M. R, “The National Rural Employment Guaran-
tee Scheme in Rajasthan: Rationed funds and their allocation across villages,” Economic
and Political Weekly 50 (2015): 52-62.
Johnson, Doug, “How Do Caste, Gender, and Party Affiliation of Locally Elected Leaders
Affect Implementation of NREGA?,” Working Paper 33. Chennai, India: Centre for
Micro Finance at the Institute for Financial Management and Research (2009).
38

Khemani, Stuti, “Political Cycles in a Developing Economy: Effect of Elections in the Indian
States,” Journal of Development Economics 73 (2004): 125-154.
Khemani, Stuti, “Political Capture of Decentralization: Vote-Buying through Grants-Financed
Local Jurisdictions,” Policy Research Working Paper Series 5350, The World Bank
(2010).
Khemani, Stuti, “Buying Votes versus Supplying Public Services: Political Incentives to
Under-invest in Pro-poor Policies?,” Journal of Development Economics 117 (2015):
84-93.
Khwaja, Asim I., and Atif R. Mian, “Do Lenders Favor Politically Connected Firms? Rent
Provision in an Emerging Financial Market,” Quarterly Journal of Economics 120 (2005):
1371-1411.
Kitschelt, Herbert, “Linkages between Citizens and Politicians in Democratic Politics,” Com-
parative Political Studies 33 (2000): 845-879.
Kitschelt Herbert and Steven I. Wilkinson, “Citizen-Politician Linkages: An Introduction,”
In H. Kitchelt, S. Wilkinson (Eds.), Patrons, Clients and Politics: Patterns of Demo-
cratic Accountability and Political Competition, Cambridge University Press, Cambridge
(2007).
Krueger, Anne O. and Ilter Turan, “The Politics and Economics of Turkish Policy Reform
in the 1980s?,” In R.Bates and A. Krueger (Eds), Political and Economic Interactions
in Economic Policy Reform: Evidence from Eight Countries, Basil Blackwell, Oxford
(1993).
Lindbeck, Assar and Jorgen Weibull, “Balanced-budget Redistribution as the Outcome of
Political Competition,” Public Choice 52 (1987): 273-297.
Maiorano, Diego, “The Politics of the Mahatma Gandhi National Rural Employment Guar-
antee Act in Andhra Pradesh,” World Development 58 (2014): 95-105.
Maiorano, Diego and Chakradhar Buddha “MGNREGA in Andhra Pradesh’s Tribal Area,”
Economics and Political Weekly 49 (2014): 15-17.
Majumdar, Manabi, “Democracy in Praxis: Two Non-Left Gram Panchayats in West Ben-
gal,” Economic & Political Weekly 44 (2009): 82-93.
Markussen, Thomas, “Inequality and Political Clientelism: Evidence from South India,”
Journal of Development Studies 47 (2011): 1721-38.
Markussen, Thomas and Finn Tarp, “Political Connections and Investment in Rural Viet-
39

nam,” WIDER working paper, 2011/37 (2011)
Muralidharan, Karthik, Paul Niehaus, and Sandip Sukhtankar, “Building State Capacity:
Evidence from Biometric Smartcards in India,” American Economic Review 106 (2016):
2895?2929.
Moser, Christine, “Poverty Reduction, Patronage, or Vote Buying? The Allocation of Public
Goods and the 2001 Election in Madagascar,”, Economic Development and Cultural
Change 57 (2008): 137-162.
Narayanan, Sudha and Upasak Das,“Women Participation and Rationing in the Employment
Guarantee Scheme,” Economic and Political Weekly 49 (2014): 46-53.
Narayanan, Sudha, Upasak Das, Yanyan Liu and Christopher Barrett. 2016. “The ’Dis-
couraged Worker Effect’ in Public Works Programs: Evidence from the MGNREGA in
India,” (December 7, 2016). Available at SSRN: https://ssrn.com/abstract=2882149
Ramani, Srinivasan, “A Decisive Mandate,”. Economic & Political Weekly 44 (2009): 11-12.
Ravi, Shamika and Monica Engler, “Workfare as an Effective Way to Fight Poverty: The
Case of India’s NREGS,” World Development 67 (2015): 57-71.
Remmer, Karen L, “The Political Economy of Elections in Latin America,” American Po-
litical Science Review 87 (1993): 393-407.
Robinson, James A. and Thierry Verdier, “The Political Economy of Clientelism,” The
Scandinavian Journal of Economics 115 (2013): 260-291.
Schady, Norbert R, “The Political Economy of Expenditures by the Peruvian Social Fund
(FONCODES), 1991-95,” American Political Science Review 94 (2000): 289-304
Shi, Min and Jakob Svensson, “Political Budget Cycles: A Review of Recent Developments,”
Nordic Journal of Political economy 29 (2003): 67-76.
Sheahan,Megan, Yanyan Liu, Christopher B. Barrett, Sudha Narayana, “Preferential Re-
source Spending under an Employment Guarantee: The Political Economy of NREGS
in Andhra Pradesh,” World Bank Economic Review DOI: https://doi.org/10.1093/
wber/lhw044. First published online: August 28, 2016 (2016).
Srinivasan, K., and Sanjay K. Mohanty, “Deprivation of Basic Amenities by Caste and
Religion,” Economic and Political Weekly 39 (2004): 728-735.
Stokes, Susan, “Perverse Accountability: A Formal Model of Machine Politics with Evidence
from Argentina,” American Political Science Review 99 (2005): 315-325.
Stokes, Susan, “Political clientelism,”. C. Boix, S. Stokes (Eds.), Oxford Handbook of Com-
40

parative Politics, Oxford University Press, Oxford (2007).
Stokes, Susan, Thad Dunning, Marcelo Nazareno, and Valeria Brusco, “Brokers, Voters, and
Clientelism: The Puzzle of Distributive Politics,” Cambridge University Press (2013)
Subbarao, Kalanidhi, Carlo del Ninno, Colin Andrews, and Claudia Rodriguez-Alas, “Public
Works as a Safety Net - Design, Evidence, and Implementation,” Technical Report,
World Bank (2013).
Sukhtankar, Sandip, “Sweetening the Deal? Political Connections and Sugar Mills in India,”
American Economic Journal: Applied Economics 4 (2012): 43-63.
Sukhtankar, Sandip, “India’s National Rural Employment Guarantee Scheme: What Do We
Really Know about the World’s Largest Workfare Program?,” India Policy Forum July
12-13, (2016).
Vicente, Pedro C, “Is Vote Buying Effective? Evidence from a Field Experiment in West
Africa,” Economic Journal 124 (2014): 356-387.
Vij, Shivam, “Why Brahmins Hold The Key To The BJP’s Fortunes In Uttar Pradesh,”
Huffington Post. January 23, 2017. Available online http://www.huffingtonpost.in/
2016/05/27/up-elections-brahmins_n_10156966.html last accessed on May 21, 2017
(2016).
Wright, Gavin, “The Political Economy of New Deal Spending: An Econometric Analysis,”
Review of Economics and Statistics 56 (1974): 30-38.
Wyatt, Andre, “Combining Clientelist and Programmatic Politics in Tamil Nadu, South
India,” Commonwealth & Comparative Politics 51 (2013): 27-55.
Wantchekon, Leonard, “Clientelism and Voting Behavior: Evidence from a Field Experiment
in Benin,” World Politics 55 (2003): 399 - 422.
Zimmermann, Laura, “Jai Ho? The Impact of a Large Public Works Program on the Gov-
ernment Election Performance in India,” University of Georgia, Athens GA (2015).
41

Fig
ure
1:Im
ple
men
tati
onan
dIn
stit
uti
onal
Det
ails
ofth
eN
RE
GS
42

Fig
ure
2:T
imel
ine
ofE
vents
Note
:A
P=
An
dh
raP
rad
esh
43

Tab
le1:
Des
crip
tive
Sta
tist
ics
VA
RIA
BL
ES
Cas
teSch
edule
dC
aste
25.5
2%
Sch
edule
dT
rib
e13
.51
%O
ther
Bac
kw
ard
Cas
te41
.06
%F
orw
ard
Cas
te19
.90
%
Edu
cati
onof
the
hou
seho
ldhe
adN
otlite
rate
orre
ceiv
edin
form
aled
uca
tion
only
59.1
8%Sec
ondar
yed
uca
tion
and
bel
ow24
.63%
Hig
hsc
hool
ers
and
grad
uat
es16
.20%
Pri
mar
yoc
cupa
tion
ofth
eho
use
hold
head
Cas
ual
wor
k(A
gric
ult
ure
/oth
ers)
44.2
9%
Sal
arie
dw
ork
(Agr
icult
ure
/oth
ers)
30.7
8%O
wn
busi
nes
sor
self
-em
plo
yed
12.2
5%N
onw
orkin
gad
ult
san
dch
ildre
n,
Fam
ily
7.59
%C
omm
onpro
per
tyre
sourc
es,
live
stock
man
agem
ent
3.77
%O
ther
s1.
32%
Pov
erty
stat
us
Poor
est
ofth
ep
oor
36.4
0%
Poor
30.3
6%
Not
sop
oor
25.2
2%
Not
poor
8.01
%
Hou
seho
ldpo
liti
cal
cate
gori
esU
PA
,P
olit
ical
lyIn
acti
ve39
.93%
UP
A,
Pol
itic
ally
Act
ive
19.2
5%
UP
A-R
ival
,P
olit
ical
lyIn
acti
ve10
.64%
UP
A-R
ival
,P
olit
ical
lyA
ctiv
e5.
98%
Unaffi
liat
ed24
.21%
VA
RIA
BL
ES
Dw
elli
ng
ina
ham
let
Yes
33.2
9%
No
66.7
1%
Spo
use
edu
cati
onN
otlite
rate
orre
ceiv
edin
form
aled
uca
tion
only
77.6
4%Sec
ondar
yed
uca
tion
and
bel
ow16
.98%
Hig
hsc
hool
ers
and
grad
uat
es5.
38%
Hou
seho
ldha
sel
ectr
icit
yco
nn
ecti
onY
es,
offici
alco
nnec
tion
54.8
7%Y
es,
unoffi
cial
connec
tion
28.3
3%N
o16
.80%
Hou
seho
ldsi
ze≤
two
mem
ber
s12
.97
%T
hre
em
emb
ers
15.2
4%
Fou
rm
emb
ers
30.5
4%
Fiv
eor
mor
em
emb
ers
41.2
4%
Lan
dhol
din
gs≤
1ac
re71
.55
%>
1&≤
2ac
res
11.0
6%>
2&≤
3ac
res
6.28
%>
3&≤
5ac
res
5.02
%>
5ac
res
6.10
%
Mea
nP
rop
orti
onof
adult
s60
.00
%M
ean
Hou
rsof
new
spap
erre
adin
g3.
97Sam
ple
Siz
e1,
673
Num
ber
ofV
illa
ges
261
Not
e:P
olit
ical
lyA
ctiv
ere
fers
toin
volv
emen
tin
part
yact
ivit
ies
such
as
att
end
ing
rall
ies,
cam
paig
nin
g,
att
end
ing
mee
tin
gs,
giv
ing
spee
ches
an
dw
riti
ng
pam
ph
lets
;P
olit
ical
lyIn
acti
veh
ouse
hol
ds
do
not
part
icip
ate
inp
oli
tica
lact
ivit
ies.
The
Un
affi
liate
dca
tegory
incl
ud
esth
ose
not
affi
liate
dw
ith
any
par
tyor
thos
eaffi
liat
edw
ith
frin
gep
arti
esth
at
are
non
-UP
Aan
dn
on
-UP
A-r
ival.
Th
ein
volv
emen
tle
vel
of
all
un
affi
liate
dh
ou
seh
old
sw
asse
tto
“Pol
itic
ally
Inac
tive
”.N
onw
orkin
gad
ult
sare
pen
sion
ers/
renti
ers,
dep
end
ents
,st
ud
ents
an
dth
ose
focu
sin
gon
hou
seh
old
sch
ore
s.H
igh
Sch
ool
ers
com
ple
ted
grad
e11
or12
.S
econ
dar
yed
uca
tion
an
db
elow
mea
ns
com
ple
ted
gra
de
10
or
bel
ow.
Un
der
each
sub
-hea
din
gin
the
tab
le,
the
dis
trib
uti
onof
hou
seh
olds
wit
hin
each
cate
gory
isp
rese
nte
dan
dth
eysu
mto
100%
,ex
cep
tM
ean
pro
port
ion
of
ad
ult
san
dM
ean
hou
rsof
new
spap
erre
adin
gw
hic
hre
flec
tsth
ere
leva
nt
aver
ages
.
44

Table 2: Political Categories and NREGS Outcomes in UPA-Sarpanch Villages
(1) (2) (3)Household Affiliation Job-Card
HoldingMean DaysWorked
MeanPaymentReceived(INR)
Job-card holders
UPA, Politically Inactive 39.37% 35.11 2,791UPA, Politically Active 42.54% 37.03 3,160UPA-Rival, Politically Inactive 31.46% 33.33 2,883UPA-Rival, Politically Active 38.00% 23.15 1,911Unaffiliated 35.30% 35.23 2,672
All 38% 34.66 2,798
Note: Politically Active refers to involvement in party activities such as attending rallies, campaign-ing, attending meetings, giving speeches and writing pamphlets; Politically Inactive households donot participate in political activities. The Unaffiliated category includes those not affiliated withany party or those affiliated with fringe parties that are non-UPA and non-UPA-rival. The in-volvement level of all unaffiliated households was set to “Politically Inactive”. Nonworking adultsare pensioners/rentiers, dependents, students and those focusing on households chores. % Job-card holding represents the proportion of households that obtained a job-card either in 2006 or2007. Mean Days worked and Payment Received are averages for each political category based oncumulative benefits received in 2006 and 2007. INR refers to the currency, Indian Rupees.
45

Tab
le3:
Tob
itR
egre
ssio
nof
NR
EG
SB
enefi
tson
Pol
itic
alA
ffiliat
ion
and
Pol
itic
alA
ctiv
ism
inU
PA
-Sar
pan
chV
illa
ges
VA
RIA
BL
ES
(1)
(2)
Log
Days
Log
Paym
ent
Hou
seh
old
Politi
cal
Cate
gory
(base
:U
PA
,P
oliti
cally
Inact
ive)
UP
A,
Politi
cally
Act
ive
0.6
43***
1.4
44***
(0.0
204)
(0.0
447)
UP
A-R
ival,
Politi
cally
Inact
ive
0.4
92***
0.9
59***
(0.0
219)
(0.0
474)
UP
A-R
ival
Politi
cally
Act
ive
1.0
54***
2.5
22***
(0.0
290)
(0.0
637)
Un
affi
liate
d0.4
90***
0.9
79***
(0.0
155)
(0.0
337)
Occ
up
ati
on
of
HH
hea
d(b
ase
:Casu
al
work
-Ag/oth
ers)
Sala
ried
work
-A
g/oth
ers
-0.8
82***
-1.9
73***
(0.0
278)
(0.0
617)
Ow
nb
usi
nes
sor
self
-em
plo
yed
-0.7
20***
-1.6
12***
(0.0
398)
(0.0
883)
Nonw
ork
ing
ad
ult
san
dch
ild
ren
,F
am
ily
-1.2
41***
-2.7
25***
(0.0
204)
(0.0
436)
Com
mon
pro
per
tyre
sou
rces
,lives
tock
man
agem
ent
-0.9
71***
-2.0
60***
(0.0
337)
(0.0
721)
Oth
ers
-1.6
47***
-3.7
77***
(0.0
352)
(0.0
760)
Pover
tyle
vel
of
HH
(base
:Poore
stof
Poor)
Poor
-0.2
10***
-0.4
72***
(0.0
203)
(0.0
449)
Not
soP
oor
-0.5
22***
-1.1
83***
(0.0
314)
(0.0
694)
Not
poor
-0.7
67***
-1.6
40***
(0.0
590)
(0.1
33)
Cast
e(b
ase
:F
orw
ard
Cast
e)
Sch
edu
led
Cast
e0.8
93***
1.9
22***
(0.0
233)
(0.0
519)
Sch
edu
led
Tri
be
-1.2
54***
-2.6
75***
(0.0
250)
(0.0
553)
Oth
erB
ack
ward
Cast
e0.5
48***
1.3
08***
(0.0
257)
(0.0
575)
Ed
uca
tion
of
HH
hea
d(b
ase
:Not-
lite
rate
/In
form
al
Ed
u)
Sec
on
dary
an
db
elow
(com
ple
ted
gra
de
10
or
bel
ow
)0.0
369
0.0
544
(0.0
226)
(0.0
507)
Hig
her
seco
nd
ary
an
dgra
du
ate
(com
ple
ted
gra
de
11
or
12)
-0.3
43***
-0.8
43***
(0.0
527)
(0.1
18)
Ed
uca
tion
of
spou
se(b
ase
:Not-
lite
rate
/In
form
al
Ed
u)
Sec
on
dary
an
db
elow
-0.8
03***
-1.7
47***
(0.0
384)
(0.0
870)
Hig
her
seco
nd
ary
an
dgra
du
ate
-0.7
70***
-2.0
27***
(0.0
559)
(0.1
26)
VA
RIA
BL
ES
(1)
(2)
Log
Days
Log
Paym
ent
Ele
ctri
city
con
nec
tion
(base
:u
noffi
cial
con
nec
tion
)
No
con
nec
tion
0.0
433*
0.2
67***
(0.0
240)
(0.0
532)
Offi
cial
con
nec
tion
-1.0
85***
-2.4
73***
(0.0
263)
(0.0
592)
Nu
mb
erof
hou
seh
old
mem
ber
s(b
ase
:T
wo
or
bel
ow
)
Th
ree
mem
ber
s0.9
30***
2.0
10***
(0.0
208)
(0.0
462)
Fou
rm
emb
ers
1.0
18***
2.2
72***
(0.0
232)
(0.0
519)
Fiv
eor
more
mem
ber
s0.7
68***
1.6
85***
(0.0
230)
(0.0
498)
Lan
dh
old
ings
(base
:≤
1acr
e)
>1
&≤
2acr
es0.2
61***
0.5
04***
(0.0
184)
(0.0
407)
>2
&≤
3acr
es0.0
603*
0.1
38*
(0.0
318)
(0.0
708)
>3
&≤
5acr
es-0
.756***
-1.4
96***
(0.0
394)
(0.0
883)
>5
acr
es-0
.742***
-1.3
35***
(0.0
506)
(0.1
11)
Pro
port
ion
of
ad
ult
s0.5
29***
1.0
81***
(0.0
186)
(0.0
407)
Liv
ing
ina
ham
let
0.1
89***
0.3
55***
(0.0
118)
(0.0
263)
Hou
rsn
ewsp
ap
erre
ad
-0.0
0810***
-0.0
0794
(0.0
0246)
(0.0
0554)
Sig
ma
2.8
13***
6.2
13***
(0.0
0686)
(0.0
156)
F-t
est
of
all
politi
cal
vari
ab
les
505.0
2519.4
1P
-valu
eof
the
F-t
est
0.0
00.0
0
F-t
est
ofγUPA−riv
ala
ctive
1−γUPA−riv
alinactive
1296.0
6472.6
8P
-valu
eof
the
F-t
est
0.0
00.0
0
F-t
est
ofγUPA−riv
ala
ctive
1−γUPAactive
1502.2
1409.2
8P
-valu
eof
the
F-t
est
0.0
00.0
0
Log
Pse
ud
o-L
ikel
ihood
-1467.2
371
-1842.4
879
Pse
ud
oR
20.2
489
0.2
078
Sam
ple
Siz
e1,6
73
1,6
73
Not
e:R
obu
stst
and
ard
erro
rscl
ust
ered
atth
evil
lage
leve
lare
inp
are
nth
eses
.A
llre
gre
ssio
ns
incl
ud
evil
lage
fixed
effec
ts.
HH
issh
ort
form
for
hou
seh
old
.P
olit
ical
lyA
ctiv
ere
fers
toin
volv
emen
tin
part
yact
ivit
ies
such
as
att
end
ing
rall
ies,
cam
paig
nin
g,
att
end
ing
mee
tin
gs,
giv
ing
spee
ches
an
dw
riti
ng
pam
ph
lets
;P
olit
ical
lyIn
acti
veh
ouse
hol
ds
do
not
part
icip
ate
inp
oli
tica
lact
ivit
ies.
The
Un
affi
liate
dca
tegory
incl
ud
esth
ose
not
affi
liate
dw
ith
any
par
tyor
thos
eaffi
liat
edw
ith
frin
gep
arti
esth
at
are
non
-UP
Aan
dn
on
-UP
A-r
ival.
Th
ein
volv
emen
tle
vel
of
all
un
affi
liate
dh
ou
seh
old
sw
asse
tto
“Pol
itic
ally
Inac
tive
”.N
onw
orkin
gad
ult
sare
pen
sion
ers/
renti
ers,
dep
end
ents
,st
ud
ents
an
dth
ose
focu
sin
gon
hou
seh
old
sch
ore
s.H
igh
Sch
ool
ers
com
ple
ted
grad
e11
or12
.S
econ
dar
yed
uca
tion
an
db
elow
mea
ns
com
ple
ted
gra
de
10
or
bel
ow.
Th
eF
-tes
tof
all
poli
tica
lva
riable
sh
as
(4,
1675
)d
egre
esof
free
dom
.F
-tes
tof
the
diff
eren
cein
the
coeffi
cien
td
iffer
ence
sh
as
(1,
1675)
deg
rees
of
free
dom
.
46

Table 4: Probit Regression of Job-Card Ownership on Political Affiliation and Po-litical Activism in UPA-Sarpanch Villages
Job card
Household Political Category (base: UPA, Politically Inactive)
UPA, Politically Active 0.160(0.148)
UPA-Rival, Politically Inactive -0.0333(0.156)
UPA-Rival, Politically Active 0.322(0.264)
Unaffiliated 0.119(0.160)
Chi-square test of all political variables [χ2(4)] 2.62P-value of the F-test 0.6228Log Pseudo-Likelihood -634.678Pseudo R2 0.2549
Sample Size 1,229
Note: Robust standard errors clustered at the village level are in parentheses. All regressionsinclude village fixed effects. Politically Active refers to intense party activities such as attendingrallies, campaigning, attending meetings, giving speeches and writing pamphlets; Politically Inactivehouseholds do not participate in political activities. The Unaffiliated category includes those notaffiliated with any party or those affiliated with fringe parties that are non-UPA and non-UPA-rival. The involvement level of all unaffiliated households was set to “Politically Inactive”. Controlvariables include caste, poverty status, household size categories, proportion of adults, primaryoccupation and education of the household head, education of the spouse, land ownership categories,availability of electricity connection, location in a hamlet, and hours spent reading a newspaper inthe past week.
47

Table 5: Tobit regression of NREGS Benefits on Political Affiliation and Political Activismin non-UPA Sarpanch Villages
(1) (2)Log Days Log Payment
Household Political Category (base: UPA-Rival, Politically Inactive)
UPA-Rival, Politically Active -0.160 -0.518(0.491) (1.089)
UPA, Politically Inactive 0.649 1.052(0.423) (0.928)
UPA, Politically Active 0.595 1.175(0.518) (1.131)
Unaffiliated 0.377 0.739(0.540) (1.192)
Sigma 2.751 5.894(0.203) (0.379)
F-test of all political variables 0.96 0.79P-value of the F-test 0.4313 0.5303Log Pseudo-Likelihood -540.5303 -668.21127Pseudo R2 0.2502 0.2206
Sample Size 602 602
Note: Robust standard errors clustered at the village level are in parentheses. All regressions include villagefixed effects. Politically Active refers to intense party activities such as attending rallies, campaigning,attending meetings, giving speeches and writing pamphlets; Politically Inactive households do not participatein political activities. The Unaffiliated category includes those not affiliated with any party or those affiliatedwith fringe parties that are non-UPA and non-UPA-rival. The involvement level of all unaffiliated householdswas set to “Politically Inactive”. Control variables include caste, poverty status, household size categories,proportion of adults, primary occupation and education of the household head, education of the spouse, landownership categories, availability of electricity connection, location in a hamlet, and hours spent reading anewspaper in the past week. The F-test of all political variables has (4, 484) degrees of freedom.
48

Table 6: Testing the Mechanism of Spill-Over Effects from Politically Active to Politically Inactive Group.Tobit Regression results in UPA-Sarpanch Villages
(1) (2) (3) (4)VARIABLES Log Days Log Payment Log Days Log Payment
Household Political Category (base: UPA, Politically Inactive)
UPA, Politically Active 1.466*** 3.134*** 0.490*** 0.962***(0.0255) (0.0562) (0.0341) (0.0764)
UPA-Rival, Politically Inactive 0.482*** 0.939*** 0.429*** 0.802***(0.0231) (0.0498) (0.0237) (0.0513)
UPA-Rival, Politically Active 1.837*** 4.125*** 0.879*** 1.996***(0.0309) (0.0685) (0.0399) (0.0901)
Unaffiliated 0.543*** 1.088*** 0.525*** 1.014***(0.0159) (0.0347) (0.0180) (0.0395)
Active X Proportion Active in Village -2.406*** -4.927***(0.0561) (0.123)
Share of Own and Lower Caste in Village -0.571*** -0.778***(0.0324) (0.0724)
Active X Share of Own and Lower Caste in Village 0.372*** 1.017***(0.0599) (0.134)
Sigma 2.809*** 6.206*** 2.785*** 6.168***(0.00678) (0.0154) (0.00713) (0.0162)
F-test of all political variables 1570.18 1495.11 463.58 391.61P-value of the F-test 0.00 0.00 0.00 0.00Log Pseudo-Likelihood -1466.2456 -1841.6259 -1413.4175 -1777.9171Pseudo R2 0.2494 0.2081 0.2519 0.2106
Sample Size 1,673 1,673 1,628 1,628
Note: Robust standard errors clustered at the village level are in parentheses. All regressions include village fixed effects.Politically Active refers to intense party activities such as attending rallies, campaigning, attending meetings, giving speechesand writing pamphlets; Politically Inactive households do not participate in political activities. The Unaffiliated categoryincludes those not affiliated with any party or those affiliated with fringe parties that are non-UPA and non-UPA-rival. Theinvolvement level of all unaffiliated households was set to “Politically Inactive”. Control variables include caste, povertystatus, household size categories, proportion of adults, primary occupation and education of the household head, educationof the spouse, land ownership categories, availability of electricity connection, location in a hamlet, and hours spent readinga newspaper in the past week. The F-test of all political variables has (4, 1675) degrees of freedom for columns 1 and 2, and(4, 1630) degrees of freedom for columns 3 and 4.
49

Table 7: Supporting Results for Spill-Over Effects. Tobit Regression of Log Days on Political Categories andInteraction of Active and Village Connectedness Characteristics
VARIABLES (1) (2) (3) (4) (5)
Household Political Category (base: UPA, Politically Inactive)
UPA, Politically Active 0.0808** 0.533*** 0.613*** 0.491*** 0.593***(0.0314) (0.0329) (0.0250) (0.0215) (0.0283)
UPA-Rival, Politically Inactive 0.251*** 0.329*** 0.484*** 0.354*** 0.410***(0.0314) (0.0283) (0.0229) (0.0257) (0.0277)
UPA-Rival, Politically Active 1.064*** 1.427*** 1.027*** 1.388*** 1.458***(0.0385) (0.0404) (0.0311) (0.0313) (0.0369)
Unaffiliated 0.561*** 0.397*** 0.484*** 0.296*** 0.273***(0.0210) (0.0186) (0.0161) (0.0168) (0.0185)
Interactions with Village Connectedness CharacteristicsActive X Distance to Main Road 0.00969***
(0.00135)Active X Bus Fare to the Nearest Town 0.00588*
(0.00309)Active X Non-availability of Community TV 0.0751*
(0.0394)Active X Non-availability of Telephones 2.398***
(0.0370)Active X Number of Telephone Lines -0.00188***
(0.000219)
Sigma 2.807*** 2.784*** 2.813*** 2.792*** 2.776***(0.00888) (0.00720) (0.00686) (0.00721) (0.00725)
Observations 1,206 1,524 1,673 1,537 1,346
50

Table 8: Tobit Regression of NREGS Benefits on Political Affiliation and Political Activism, and UPA-Dominancein UPA-Sarpanch Villages
(1) (2) (3) (4)Log Days Log Payment Log Days Log Payment
All-villages Close Political ProfilesHousehold Political Category (base: UPA, Politically Inactive)
UPA, Politically Active 2.068*** 3.810*** 2.335*** 4.285***(0.0489) (0.109) (0.0907) (0.202)
UPA-Rival, Politically Inactive 0.958*** 1.621*** 1.282*** 2.208***(0.0952) (0.205) (0.0896) (0.192)
UPA-Rival, Politically Active 2.957*** 6.561*** 3.323*** 7.440***(0.127) (0.288) (0.148) (0.335)
Unaffiliated 1.588*** 3.011*** 1.654*** 3.054***(0.0420) (0.0915) (0.0470) (0.102)
UPA, Politically Active X UPA-Dominance -1.483*** -2.448*** -1.675*** -2.835***(0.0517) (0.115) (0.103) (0.230)
UPA, Politically Inactive X UPA-Dominance -0.416*** -0.555*** -1.370*** -2.567***(0.0978) (0.211) (0.0971) (0.208)
UPA-Rival, Politically Active X UPA-Dominance -2.062*** -4.417*** -2.880*** -6.442***(0.136) (0.308) (0.162) (0.367)
Unaffiliated X UPA-Dominance -1.155*** -2.144*** -1.368*** -2.626***(0.0469) (0.103) (0.0550) (0.119)
Sigma 2.811*** 6.208*** 2.756*** 6.080***(0.00669) (0.0152) (0.00927) (0.0208)
F-test of all political variables:non-UPA-dominant villages 3942.55 2865.34 4015.92 2958.34P-value of the F-test 0.00 0.00 0.0 0.0F-test of all political variables:UPA-dominant villages 1891.94 1216.04 2356.05 1768.98P-value of the F-test 0.00 0.00 0.0 0.0Log Pseudo-Likelihood -1466.4789 -1841.7985 -749.7408 -943.28Pseudo R2 0.2493 0.2081 0.2587 0.2187
Sample Size 1,673 1,673 889 889
Note: Robust standard errors clustered at the village level are in parentheses. All regressions include village fixed effects. PoliticallyActive refers to intense party activities such as attending rallies, campaigning, attending meetings, giving speeches and writingpamphlets; Politically Inactive households do not participate in political activities. The Unaffiliated category includes those notaffiliated with any party or those affiliated with fringe parties that are non-UPA and non-UPA-rival. The involvement level of allunaffiliated households was set to “Politically Inactive”. Control variables include caste, poverty status, household size categories,proportion of adults, primary occupation and education of the household head, education of the spouse, land ownership categories,availability of electricity connection, location in a hamlet, and hours spent reading a newspaper in the past week. The F-test of allpolitical variables has (4, 1675) degrees of freedom. UPA-dominant villages take the value 1 if a particular village has higher thanthe median share of UPA households and 0 otherwise. Villages with close political profiles are those whose share of UPA-affiliatedhouseholds range between 0.25 and .75.
51

Table 9: Controlling for Additional Political Variables. Marginal Effects from Tobit Regression Results in UPA-Sarpanch Villages
(1) (2) (3) (4)Log Days Log Payment Log Days Log Payment
Household Political Category (base: UPA, Politically Inactive)
UPA, Politically Active 0.162*** 0.368*** 0.148*** 0.339***(0.00734) (0.0165) (0.00712) (0.0160)
UPA-Rival, Politically Inactive 0.124*** 0.243*** 0.131*** 0.258***(0.00690) (0.0146) (0.00716) (0.0151)
UPA-Rival, Politically Active 0.275*** 0.672*** 0.265*** 0.647***(0.0117) (0.0275) (0.0117) (0.0275)
Unaffiliated 0.122*** 0.246*** 0.112*** 0.221***(0.00507) (0.0108) (0.00506) (0.0108)
Binary for Politician Living in the Household Yes Yes No NoBinary for Household’s Adult Male Voting No No Yes Yes
Sample Size 1,673 1,673 1,662 1,662
Note: Robust standard errors clustered at the village level are in parentheses. Marginal effects are those on expected censored outcomes.Binary for Household’s Adult Male Voting simply indicates if the Adult male of the household voted in the most recent Gram Panchayatelection. Binary for Politician Living in the Household indicates if a politician lives in the household. All regressions include village fixedeffects. Politically Active refers to intense party activities such as attending rallies, campaigning, attending meetings, giving speechesand writing pamphlets; Politically Inactive households do not participate in political activities. The Unaffiliated category includesthose not affiliated with any party or those affiliated with fringe parties that are non-UPA and non-UPA-rival. The involvement level ofall unaffiliated households was set to “Politically Inactive”. Control variables include caste, poverty status, household size categories,proportion of adults, primary occupation and education of the household head, education of the spouse, land ownership categories,availability of electricity connection, location in a hamlet, and hours spent reading a newspaper in the past week.
52

Appendix
Table A1: Marginal Effects of Political Categories on NREGS Benefits, and their Corresponding PercentageChanges in UPA-Sarpanch Villages
(1) (2) (3) (4)Marginal Effects Percentage Change
Log Days Log Payment Days Payment
Household Political Category (base: UPA, Politically Inactive)
UPA, Politically Active 0.197*** 0.451*** 21.78% 57.03%(0.00994) (0.0226)
UPA-Rival, Politically Inactive 0.148*** 0.292*** 15.96% 33.93%(0.00899) (0.0190)
UPA-Rival, Politically Active 0.338*** 0.831*** 40.23% 129.72%(0.0160) (0.0378)
Unaffiliated 0.147*** 0.299*** 15.84% 34.86%(0.00679) (0.0144)
Sample Size 1,673
Note: Robust standard errors clustered at the village level are in parentheses. Marginal effects are those on expected censoredoutcomes. Marginal effects and percentages are based on Table 3.
53

Tab
leA
2:T
obit
Reg
ress
ion
ofL
ogD
ays
and
Pay
men
ton
Pol
itic
alC
ateg
orie
sw
ith
and
wit
hou
tC
ontr
olV
aria
ble
s
VA
RIA
BL
ES
(1)
(2)
(3)
(4)
(5)
(6)
(7)
(8)
Dep
enden
tV
aria
ble
:L
ogD
ays
Hou
sehol
dP
olit
ical
Cat
egor
y(b
ase:
UP
A,
Pol
itic
ally
Inac
tive
)
UP
AP
olit
ical
lyA
ctiv
e-0
.124
0.12
4***
0.32
2***
0.24
6***
0.39
3***
0.31
7***
0.35
2***
0.64
3***
(0.4
79)
(0.0
0947
)(0
.015
4)(0
.014
1)(0
.015
7)(0
.015
1)(0
.016
9)(0
.020
4)U
PA
-Riv
al,
Pol
itic
ally
Inac
tive
-0.6
150.
233*
**0.
250*
**0.
277*
**0.
399*
**0.
542*
**0.
543*
**0.
492*
**(0
.525
)(0
.008
86)
(0.0
131)
(0.0
122)
(0.0
148)
(0.0
149)
(0.0
158)
(0.0
219)
UP
A-R
ival
,P
olit
ical
lyA
ctiv
e-0
.250
0.33
1***
0.56
2***
0.55
6***
0.71
9***
0.72
9***
0.78
9***
1.05
4***
(0.6
83)
(0.0
114)
(0.0
164)
(0.0
156)
(0.0
185)
(0.0
172)
(0.0
213)
(0.0
290)
Unaffi
liat
ed-1
.701
***
0.67
4***
0.49
4***
0.39
8***
0.41
0***
0.41
0***
0.43
4***
0.49
0***
(0.4
90)
(0.0
0801
)(0
.011
2)(0
.011
3)(0
.011
6)(0
.013
5)(0
.014
3)(0
.015
5)
Dep
enden
tV
aria
ble
:L
ogP
aym
ent
Hou
sehol
dP
olit
ical
Cat
egor
y(b
ase:
UP
A,
Pol
itic
ally
Inac
tive
)
UP
AP
olit
ical
lyA
ctiv
e-0
.285
0.32
6***
0.75
1***
0.59
0***
0.92
1***
0.75
2***
0.83
1***
1.44
4***
(1.0
53)
(0.0
208)
(0.0
345)
(0.0
313)
(0.0
347)
(0.0
333)
(0.0
373)
(0.0
447)
UP
A-R
ival
,P
olit
ical
lyIn
acti
ve-1
.397
0.42
8***
0.46
1***
0.51
5***
0.78
8***
1.10
2***
1.10
4***
0.95
9***
(1.1
47)
(0.0
193)
(0.0
287)
(0.0
267)
(0.0
318)
(0.0
317)
(0.0
337)
(0.0
474)
UP
A-R
ival
,P
olit
ical
lyA
ctiv
e-0
.452
0.89
3***
1.39
7***
1.37
6***
1.73
5***
1.77
0***
1.90
6***
2.52
2***
(1.5
03)
(0.0
251)
(0.0
364)
(0.0
347)
(0.0
408)
(0.0
379)
(0.0
468)
(0.0
637)
Unaffi
liat
ed-3
.798
***
1.37
9***
0.97
6***
0.75
3***
0.78
5***
0.80
1***
0.85
5***
0.97
9***
(1.0
71)
(0.0
175)
(0.0
246)
(0.0
251)
(0.0
254)
(0.0
296)
(0.0
310)
(0.0
337)
Villa
geF
ixed
Eff
ects
NO
YE
SY
ES
YE
SY
ES
YE
SY
ES
YE
SP
over
tyC
lass
ifica
tion
NO
NO
YE
SY
ES
YE
SY
ES
YE
SY
ES
Cas
teN
ON
ON
OY
ES
YE
SY
ES
YE
SY
ES
Dw
elling
typ
eN
ON
ON
ON
OY
ES
YE
SY
ES
YE
SR
esid
ing
ina
ham
let
NO
NO
NO
NO
NO
YE
SY
ES
YE
SE
duca
tion
,hou
sehol
dhea
dN
ON
ON
ON
ON
ON
OY
ES
YE
SA
llot
her
contr
ols
NO
NO
NO
NO
NO
NO
NO
YE
SO
bse
rvat
ions
2,69
22,
692
2,69
12,
686
2,67
41,
926
1,92
61,
673
Not
e:R
obu
stst
and
ard
erro
rscl
ust
ered
atth
evil
lage
leve
lare
inp
are
nth
eses
.P
oli
tica
lly
Act
ive
refe
rsto
inte
nse
part
yact
ivit
ies
such
as
att
end
ing
rall
ies,
cam
paig
nin
g,
atte
nd
ing
mee
tin
gs,gi
vin
gsp
eech
esan
dw
riti
ng
pam
ph
lets
;P
oli
tica
lly
Inact
ive
hou
seh
old
sd
on
ot
part
icip
ate
inp
oli
tica
lact
ivit
ies.
Th
eU
naffi
liate
dca
tegory
incl
ud
esth
ose
not
affili
ated
wit
han
yp
arty
orth
ose
affili
ated
wit
hfr
inge
part
ies
that
are
non
-UP
Aan
dn
on-U
PA
-riv
al.
Th
ein
volv
emen
tle
vel
of
all
un
affi
liate
dh
ouse
hold
sw
asse
tto
“Pol
itic
ally
Inac
tive
”.T
he
full
set
ofco
ntr
ol
vari
ab
les
incl
ud
eded
inth
ela
stco
lum
nar
eca
ste,
pov
erty
statu
s,hou
sehold
size
cate
gori
es,
pro
port
ion
of
adu
lts,
pri
mar
yocc
up
atio
nan
ded
uca
tion
ofth
eh
ouse
hold
hea
d,
edu
cati
on
of
the
spou
se,
lan
dow
ner
ship
cate
gori
es,
avail
ab
ilit
yof
elec
tric
ity
con
nec
tion
,lo
cati
on
ina
ham
let,
and
hou
rssp
ent
read
ing
an
ewsp
aper
inth
ep
ast
wee
k.
54

Table A3: Political categories by Caste and Poverty Characteristics
VARIABLES (1) (2) (3) (4) (5)UPA-inactive
UPA-active
UPA-Rivalinactive
UPA Rivalactive
Unaffiliated
Poverty CategoriesPoorest of the Poor 35.38% 36.65% 36.52% 26.73% 40.25%Poor 30.58% 25.47% 30.90% 33.66% 32.84%Not So Poor 24.74% 30.12% 23.03% 29.70% 22.22%Not poor 9.30% 7.76% 9.55% 9.90% 4.69%
Caste CategoriesForward caste 23.54% 14.29% 20.22% 22.77% 17.78%Other Backward caste 40.78% 42.24% 44.38% 40.59% 39.26%Scheduled Caste 26.39% 27.33% 22.47% 23.76% 24.20%Scheduled Tribe 9.30% 16.15% 12.92% 12.87% 18.77%
Sample Size 667 322 178 101 405
55

Table A4: Tobit Regression of NREGS Benefits on Political Categories for ParticipatingHouseholds, and the Corresponding Heckman Selection Correction Model in UPA-SarpanchVillages
(1) (2) (3) (4) (5)Tobit Model Heckman Selection Correction Model
Log Days Log Payment Log Days Log Payment Selection
Household Political Category (base: UPA, Politically Inactive)
UPA, Politically Active 0.600** 1.091* 0.418** 0.933** 0.160(0.277) (0.564) (0.191) (0.406) (0.147)
UPA-Rival, Politically Inactive 0.714* 1.032 0.476** 0.895* -0.0333(0.381) (0.794) (0.231) (0.489) (0.165)
UPA-Rival, Politically Active 0.675* 1.430* 0.509* 1.357** 0.322(0.359) (0.824) (0.297) (0.628) (0.205)
Unaffiliated 0.860*** 1.354** 0.562*** 1.124*** 0.119(0.307) (0.665) (0.206) (0.436) (0.151)
Proportion of Adults -0.572 -0.877 0.469**(0.363) (0.777) (0.211)
Inverse Mills Ratio 1.212* 2.728*(0.681) (1.431)
Sigma 1.214*** 2.934***(0.0387) (0.138)
F-test of all political variables 2.86 1.87 14.92 14.79P-value of the joint-test 0.0233 0.1148 0.0608 0.0634Log Pseudo-Likelihood -975.274 -1300.84Pseudo-R2 0.2083 0.1729Sample Size 637 637 1,388 1,388 1,388
Note: Robust standard errors clustered at the village level are in parentheses. All regressions include villagefixed effects. Politically Active refers to intense party activities such as attending rallies, campaigning,attending meetings, giving speeches and writing pamphlets; Politically Inactive households do not participatein political activities. The Unaffiliated category includes those not affiliated with any party or those affiliatedwith fringe parties that are non-UPA and non-UPA-rival. The involvement level of all unaffiliated householdswas set to “Politically Inactive”. Control variables include caste, poverty status, household size categories,proportion of adults, primary occupation and education of the household head, education of the spouse, landownership categories, availability of electricity connection, location in a hamlet, and hours spent reading anewspaper in the past week. The joint-test in columns 1 and 2 report F-test results with (4, 418) degrees offreedom. Columns 3 and 4 for the joint test report chi-square test results with 8 degrees of freedom.
56

Table A5: Descriptive Statistics in non-UPA-Sarpanch Villages
VARIABLES (1)CasteScheduled Caste 18.94 %Scheduled Tribe 19.93 %Other Backward Caste 17.44 %Forward Caste 43.69 %
Education of the household headNot literate or received informal education 65.95%Secondary education and below (completed grade 10 or below) 21.10%High schoolers and graduates (completed grade 11 or 12) 12.96%
Primary occupation of the household headCasual work (Agriculture/others) 40.37 %Salaried work (Agriculture/others) 35.22%Own business or self-employed (Agriculture/others) 9.30 %Nonworking adults 7.64 %Common property resources, Livestock management 5.32 %Others 2.16%
Poverty statusPoorest of the poor 34.55 %Poor 32.72 %Not so poor 24.58 %Not poor 8.14 %
Household political categoriesUPA, Politically Inactive 19.60%UPA, Politically Active 10.30%UPA-Rival, Politically Inactive 21.43%UPA-Rival, Politically Active 14.95%Unaffiliated 33.72%
Dwelling in a hamletYes 31.40 %No 68.60 %
Spouse educationNot literate or received informal education 79.40 %Secondary education and below (completed grade 10 or below) 16.28 %High schoolers (completed grade 11 or 12) and graduates 4.32 %
Continued on next page
57

Table A5 – Continued from previous pageVARIABLES
Household has electricity connectionUnofficial connection 32.39No 17.11Yes 50.50
Household size≤ two members 13.12 %Three members 14.62 %Four members 27.41 %Five or more members 44.85%
Plot area≤ 1 acre 68.60 %>1 & ≤ 2 acres 11.63 %>2 & ≤ 3 acres 6.98%>3 & ≤ 5 acres 7.31 %>5 acres 5.48%
Mean Proportion of adults 60.54 %Mean Hours of newspaper reading 3.31Sample size 602Number of villages 89
Note: Politically Active refers to involvement in party activities such as attending rallies, campaigning,attending meetings, giving speeches and writing pamphlets; Politically Inactive households do not participatein political activities. The Unaffiliated category includes those not affiliated with any party or those affiliatedwith fringe parties that are non-UPA and non-UPA-rival. The involvement level of all unaffiliated householdswas set to “Politically Inactive”. Nonworking adults are pensioners/rentiers, dependents, students and thosefocusing on households chores. Under each sub-heading in the table, the distribution of households withineach category is presented and they sum to 100%, except Mean proportion of adults and Mean hours ofnewspaper reading which reflects the relevant averages.
58

Table A6: Robustness Check, Dropping Households That Got Jobs or Job-Cards Between February 2006 and theInterview Month. Marginal Effects from Tobit Regression Results in UPA-Sarpanch Villages
(1) (2) (3) (4)Drop Households with Jobs Drop Households with Job-Cards
Log Days Log Payment Log Days Log Payment
Household Political Category (base: UPA, Politically Inactive)
UPA, Politically Active 0.245*** 0.569*** 0.0726*** 0.194***(0.0120) (0.0282) (0.00825) (0.0208)
UPA-Rival, Politically Inactive 0.118*** 0.262*** 0.107*** 0.259***(0.00876) (0.0198) (0.00797) (0.0190)
UPA-Rival, Politically Active 0.413*** 0.991*** 0.170*** 0.373***(0.0192) (0.0462) (0.0166) (0.0380)
Unaffiliated 0.113*** 0.253*** 0.0399*** 0.0814***(0.00660) (0.0150) (0.00483) (0.0109)
Sample Size 1,549 1,549 1,258 1,258
Note: Robust standard errors clustered at the village level are in parentheses. All regressions include village fixed effects. PoliticallyActive refers to intense party activities such as attending rallies, campaigning, attending meetings, giving speeches and writing pam-phlets; Politically Inactive households do not participate in political activities. The Unaffiliated category includes those not affiliatedwith any party or those affiliated with fringe parties that are non-UPA and non-UPA-rival. The involvement level of all unaffiliatedhouseholds was set to “Politically Inactive”. Control variables include caste, poverty status, household size categories, proportion ofadults, primary occupation and education of the household head, education of the spouse, land ownership categories, availability ofelectricity connection, location in a hamlet, and hours spent reading a newspaper in the past week. The F-test of all political variablesin columns 1 and 2 have (4,1551) degrees of freedom, and the those in columns 3 and 4 have (4,1260) degrees of freedom.
59

Table A7: Controlling for Other Public Program Transfers. Marginal Effects from Tobit Regression Results inUPA-Sarpanch Villages
(1) (2) (3) (4)Log Days Log Payment
Household Political Category (base: UPA, Politically Inactive)
UPA, Politically Active 0.141*** 0.166*** 0.323*** 0.376***(0.00729) (0.00738) (0.0164) (0.0166)
UPA-Rival, Politically Inactive 0.135*** 0.130*** 0.268*** 0.255***(0.00725) (0.00693) (0.0153) (0.0146)
UPA-Rival, Politically Active 0.271*** 0.277*** 0.664*** 0.675***(0.0115) (0.0117) (0.0273) (0.0274)
Unaffiliated 0.105*** 0.126*** 0.207*** 0.254***(0.00487) (0.00535) (0.0104) (0.0114)
Household accessed the PDS Yes No Yes NoHousehold accessed the MDM No Yes No YesSample Size 1,666 1,673 1,666 1,673
Note: Robust standard errors clustered at the village level are in parentheses. PDS=Public Distribution System; MDM=Mid-DayMeals program. All regressions include village fixed effects. Politically Active refers to intense party activities such as attendingrallies, campaigning, attending meetings, giving speeches and writing pamphlets; Politically Inactive households do not participate inpolitical activities. The Unaffiliated category includes those not affiliated with any party or those affiliated with fringe parties that arenon-UPA and non-UPA-rival. The involvement level of all unaffiliated households was set to “Politically Inactive”. Control variablesinclude caste, poverty status, household size categories, proportion of adults, primary occupation and education of the household head,education of the spouse, land ownership categories, availability of electricity connection, location in a hamlet, and hours spent readinga newspaper in the past week.
60

Table A8: Marginal Effects of NREGS Benefits on Political Affiliation and Political Activism in UPA-Sarpanchvillages, by Telangana and non-Telangana Districts
(1) (2) (3) (4)Log Days Log Payment
Telangana non-Telangana Telangana non-Telangana
Household Political Category (base: UPA, Politically Inactive)
UPA, Politically Active 0.162*** 0.151*** 0.354*** 0.351***(0.0232) (0.0158) (0.0518) (0.0353)
UPA-Rival, Politically Inactive 0.132*** 0.107*** 0.206*** 0.311***(0.0354) (0.0228) (0.0740) (0.0497)
UPA-Rival, Politically Active 0.258*** 0.317*** 0.609*** 0.804***(0.0626) (0.0422) (0.144) (0.0966)
Unaffiliated 0.139*** 0.0885*** 0.262*** 0.212***(0.0179) (0.0109) (0.0384) (0.0235)
Sample Size 1,673 1,673 1,673 1,673
Note: Robust standard errors clustered at the village level are in parentheses. All regressions include village fixed effects. PoliticallyActive refers to intense party activities such as attending rallies, campaigning, attending meetings, giving speeches and writing pam-phlets; Politically Inactive households do not participate in political activities. The Unaffiliated category includes those not affiliatedwith any party or those affiliated with fringe parties that are non-UPA and non-UPA-rival. The involvement level of all unaffiliatedhouseholds was set to “Politically Inactive”. Control variables include caste, poverty status, household size categories, proportion ofadults, primary occupation and education of the household head, education of the spouse, land ownership categories, availability ofelectricity connection, location in a hamlet, and hours spent reading a newspaper in the past week.
61

Table A9: Robustness Check, Redefining Political Categories as Very-active and Less-active. Marginal Effects fromTobit Regression Results in UPA-Sarpanch Villages
(1) (2)Log Days Log Payment
Household Political Category (base: UPA, Politically Less Active)
UPA, Politically Very Active 0.0615*** 0.115***(0.00676) (0.0149)
UPA-Rival, Politically Less Active 0.148*** 0.332***(0.00871) (0.0195)
UPA-Rival, Politically Very Active 0.469*** 1.042***(0.0253) (0.0557)
Unaffiliated 0.0828*** 0.149***(0.00524) (0.0110)
Sample Size 1,673 1,673
Note: Robust standard errors clustered at the village level are in parentheses. All regressions include village fixed effects. In the alternatedefinition of political activism used in this regression, Politically Very Active refers to intense party activities such as campaigning,giving speeches and writing pamphlets; Politically Less Active refers to households attending rallies, speeches and meetings, and also notparticipating in political activities. The Unaffiliated category includes those not affiliated with any party or those affiliated with fringeparties that are non-UPA and non-UPA-rival. The involvement level of all unaffiliated households was set to “Politically Inactive”.Control variables include caste, poverty status, household size categories, proportion of adults, primary occupation and education ofthe household head, education of the spouse, land ownership categories, availability of electricity connection, location in a hamlet, andhours spent reading a newspaper in the past week.The F-test of all political variables has (4, 1675) degrees of freedom.
62

Table A10: Supporting Results for Spill-Over Effects; Tobit Regression of Log Payment on Political Categoriesand Interaction of Active and Village Connectedness Characteristics
VARIABLES (1) (2) (3) (4) (5)
Household Political Category (base: UPA, Politically Inactive)
UPA, Politically Active 0.283*** 1.322*** 1.136*** 0.919*** 1.172***(0.0695) (0.0711) (0.0549) (0.0470) (0.0613)
UPA-Rival, Politically Inactive 0.766*** 0.898*** 0.935*** 0.416*** 0.530***(0.0685) (0.0603) (0.0495) (0.0561) (0.0601)
UPA-Rival, Politically Active 2.594*** 3.543*** 2.253*** 3.135*** 3.323***(0.0847) (0.0882) (0.0681) (0.0692) (0.0814)
Unaffiliated 1.180*** 0.873*** 0.941*** 0.474*** 0.411***(0.0460) (0.0406) (0.0349) (0.0365) (0.0397)
Interactions with Village Connectedness CharacteristicsActive X Distance to main road from village 0.0176***
(0.00297)Active X Bus fare to the nearest town from village -0.003
(0.00694)Active X Non-availability of community TV in village 0.788***
(0.0868)Active X Non-availability of phone in village 5.427***
(0.0813)Active X Number of telephone lines in village -0.0046***
(0.000487)
Sigma 6.272*** 6.164*** 6.210*** 6.163*** 6.091***(0.0202) (0.0163) (0.0156) (0.0166) (0.0166)
Observations 1,204 1,522 1,673 1,529 1,339
63

Table A11: Ordinary Least Squares Regression of Voting Behavior on Political Affiliationand Political Activism
(1) (2)UPA-sarpanch villages non-UPA sarpanch villages
If voted If voted
Household Political Category (base: UPA, Politically Inactive)
UPA Politically Active -0.00594 -0.0103(0.0131) (0.0266)
UPA-Rival, Politically Inactive 0.0143 -0.0259(0.0144) (0.0320)
UPA-Rival, Politically Active 0.00863 -0.00498(0.0142) (0.0210)
Unaffiliated 0.0219 0.0632*(0.0149) (0.0376)
F-test of all political variables 1.51 1.74P-value of the F-test 0.1991 0.1477R2 0.7174 0.6331
Sample Size 1,662 598
Note: Robust standard errors clustered at the village level are in parentheses. If voted is a binary variabletaking the value 1 if the household head voted in the recent Gram Panchayat election, 0 if not. All regressionsinclude village fixed effects. Politically Active refers to intense party activities such as attending rallies,campaigning, attending meetings, giving speeches and writing pamphlets; Politically Inactive householdsdo not participate in political activities. The Unaffiliated category includes those not affiliated with anyparty or those affiliated with fringe parties that are non-UPA and non-UPA-rival. The involvement levelof all unaffiliated households was set to “Politically Inactive”. Control variables include caste, povertystatus, household size categories, proportion of adults, primary occupation and education of the householdhead, education of the spouse, land ownership categories, availability of electricity connection, location in ahamlet, and hours spent reading a newspaper in the past week. The F-test of all political variables has (4,260) degrees of freedom in column 1 and (4, 87) degrees of freedom in column 2.
64