portugal - food and agriculture organization · 2017-11-28 · fra 2015 – country report,...
TRANSCRIPT

Portugal
GLOBAL FOREST RESOURCES ASSESSMENT 2015
COUNTRY REPORT
Rome, 2014

FAO, at the request of its member countries, regularly monitors the world´s forests and theirmanagement and uses through the Global Forest Resources Assessment (FRA). This country reportis prepared as a contribution to the FAO publication, the Global Forest Resources Assessment 2015(FRA 2015).The content and the structure are in accordance with the recommendations and guidelines given byFAO in the document Guide for country reporting for FRA 2015 (http://www.fao.org/3/a-au190e.pdf).These reports were submitted to FAO as official government documents.
The content and the views expressed in this report are the responsibility of the entity submitting thereport to FAO. FAO may not be held responsible for the use which may be made of the informationcontained in this report.

FRA 2015 – Country Report, Portugal
3
TABLE OF CONTENTSReport preparation and contact persons...............................................................................................................................41. What is the area of forest and other wooded land and how has it changed over time? ................................................. 52. What is the area of natural and planted forest and how has it changed over time? ..................................................... 123. What are the stocks and growth rates of the forests and how have they changed? .....................................................174. What is the status of forest production and how has it changed over time? .................................................................275. How much forest area is managed for protection of soil and water and ecosystem services? ..................................... 356. How much forest area is protected and designated for the conservation of biodiversity and how has it changed overtime? ................................................................................................................................................................................... 407. What is the area of forest affected by woody invasive species? .................................................................................. 438. How much forest area is damaged each year? ............................................................................................................ 469. What is the forest area with reduced canopy cover? ....................................................................................................5010. What forest policy and regulatory framework exists to support implementation of sustainable forest managementSFM? .................................................................................................................................................................................. 5111. Is there a national platform that promotes stakeholder participation in forest policy development? ............................ 5312. What is the forest area intended to be in permanent forest land use and how has it changed over time? .................. 5413. How does your country measure and report progress towards SFM at the national level? ........................................ 5714. What is the area of forest under a forest management plan and how is this monitored? ........................................... 5915. How are stakeholders involved in the management decision making for publicly owned forests? .............................. 6216. What is the area of forest under an independently verified forest certification scheme? .............................................6417. How much money do governments collect from and spend on forests? .....................................................................6618. Who owns and manages the forests and how has this changed? ..............................................................................6819. How many people are directly employed in forestry? ................................................................................................. 7420. What is the contribution of forestry to Gross Domestic Product (GDP)? .................................................................... 7721. What is forest area likely to be in the future ...............................................................................................................78
FRA 2015 – Country Report, Portugal
4
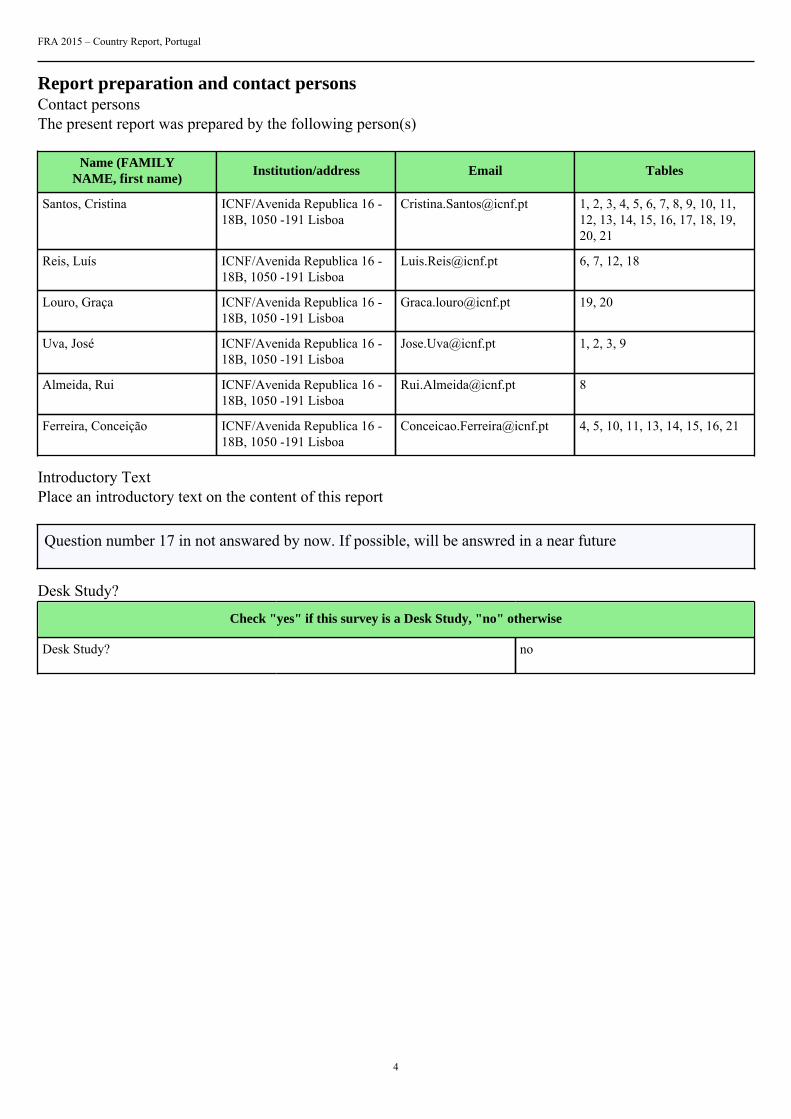
Report preparation and contact personsContact personsThe present report was prepared by the following person(s)
Name (FAMILYNAME, first name)
Institution/address Email Tables
Santos, Cristina ICNF/Avenida Republica 16 -18B, 1050 -191 Lisboa
[email protected] 1, 2, 3, 4, 5, 6, 7, 8, 9, 10, 11,12, 13, 14, 15, 16, 17, 18, 19,20, 21
Reis, Luís ICNF/Avenida Republica 16 -18B, 1050 -191 Lisboa
[email protected] 6, 7, 12, 18
Louro, Graça ICNF/Avenida Republica 16 -18B, 1050 -191 Lisboa
[email protected] 19, 20
Uva, José ICNF/Avenida Republica 16 -18B, 1050 -191 Lisboa
[email protected] 1, 2, 3, 9
Almeida, Rui ICNF/Avenida Republica 16 -18B, 1050 -191 Lisboa
Ferreira, Conceição ICNF/Avenida Republica 16 -18B, 1050 -191 Lisboa
[email protected] 4, 5, 10, 11, 13, 14, 15, 16, 21
Introductory TextPlace an introductory text on the content of this report
Question number 17 in not answared by now. If possible, will be answred in a near future
Desk Study?
Check "yes" if this survey is a Desk Study, "no" otherwise
Desk Study? no
FRA 2015 – Country Report, Portugal
5
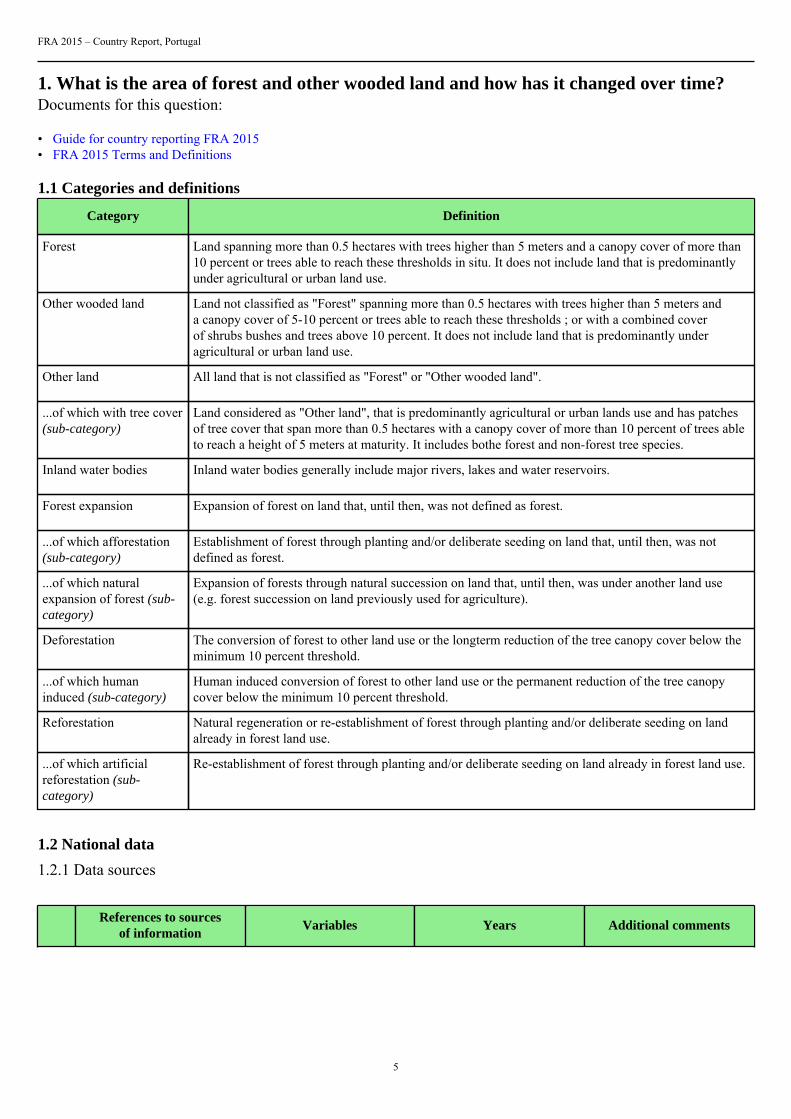
1. What is the area of forest and other wooded land and how has it changed over time?Documents for this question:
• Guide for country reporting FRA 2015• FRA 2015 Terms and Definitions
1.1 Categories and definitions
Category Definition
Forest Land spanning more than 0.5 hectares with trees higher than 5 meters and a canopy cover of more than10 percent or trees able to reach these thresholds in situ. It does not include land that is predominantlyunder agricultural or urban land use.
Other wooded land Land not classified as "Forest" spanning more than 0.5 hectares with trees higher than 5 meters anda canopy cover of 5-10 percent or trees able to reach these thresholds ; or with a combined coverof shrubs bushes and trees above 10 percent. It does not include land that is predominantly underagricultural or urban land use.
Other land All land that is not classified as "Forest" or "Other wooded land".
...of which with tree cover(sub-category)
Land considered as "Other land", that is predominantly agricultural or urban lands use and has patchesof tree cover that span more than 0.5 hectares with a canopy cover of more than 10 percent of trees ableto reach a height of 5 meters at maturity. It includes bothe forest and non-forest tree species.
Inland water bodies Inland water bodies generally include major rivers, lakes and water reservoirs.
Forest expansion Expansion of forest on land that, until then, was not defined as forest.
...of which afforestation(sub-category)
Establishment of forest through planting and/or deliberate seeding on land that, until then, was notdefined as forest.
...of which naturalexpansion of forest (sub-category)
Expansion of forests through natural succession on land that, until then, was under another land use(e.g. forest succession on land previously used for agriculture).
Deforestation The conversion of forest to other land use or the longterm reduction of the tree canopy cover below theminimum 10 percent threshold.
...of which humaninduced (sub-category)
Human induced conversion of forest to other land use or the permanent reduction of the tree canopycover below the minimum 10 percent threshold.
Reforestation Natural regeneration or re-establishment of forest through planting and/or deliberate seeding on landalready in forest land use.
...of which artificialreforestation (sub-category)
Re-establishment of forest through planting and/or deliberate seeding on land already in forest land use.
1.2 National data
1.2.1 Data sources
References to sourcesof information
Variables Years Additional comments

FRA 2015 – Country Report, Portugal
6
1 6.º Inventário FlorestalNacional (6th NationalForest Inventory – NFI6 -preliminary results)
Forest, OWL, inland water,other land, afforestation anddeforestation
2010, 2005 and 1995 Mainland (continentalterritory). The NFI5 areadata were collected in 2005.The field data were collectedmainly in 2005, but also in2006.
2 Inventário Florestal daRegião Autónoma dos Açores(IFRAA) (Azores regionalforest inventory)
Forest, OWL, inland water,other land.
2007 Azores inventory datacollection is a continuousprocess. The reported datareference year is 2007.
3 1.º Inventário Florestalda Região Autónomada Madeira (IFRAM1)(Madeira’s regional forestinventory)
Forest, OWL, inland water,other land.
2004 The Madeira´s area data werecollected in 2004. The fielddata were collected in 2008
4 N/A N/A N/A N/A
1.2.2 Classification and definitions
National class Definition
N/A The national classification and definition for forest are equivalentto those being used by FRA 2010.
N/A N/A
N/A N/A
N/A N/A
1.2.3 Original data
Territory Category Area (1000 ha)
Reference year 1995 2005 2010
Forest 3 352 3 212 3 155
Other woodedland
1 088 1 278 1 500
Other land 4 421 4 242 4 071
Mainland territory
... of which withtree cover
n.a n.a n.a

FRA 2015 – Country Report, Portugal
7
Inland water 48 177 183
Total area 8 909 8 909 8 909
Reference year 2007
Forest 56.0
Other woodedland
3.44
Other land 172
... of which withtree cover
n.a.
Inland water 1.06
AutonomousRegion of Azores
Total area 232
Reference year 2004
Forest 32.7
Other woodedland
1.56
Other land 45.8
... of which withtree cover
n.a.
Inland water 0.11
AutonomousRegion ofMadeira
Total area 80.1
Sources:
Mainland territory (1995, 2005 and 2010):
All variables: NFI5
Autonomous Region of Azores, (2007):
All variables: IFRAA
Autonomous Region of Madeira, (2004):
All variables: IFRAM1
FRA 2015 – Country Report, Portugal
8
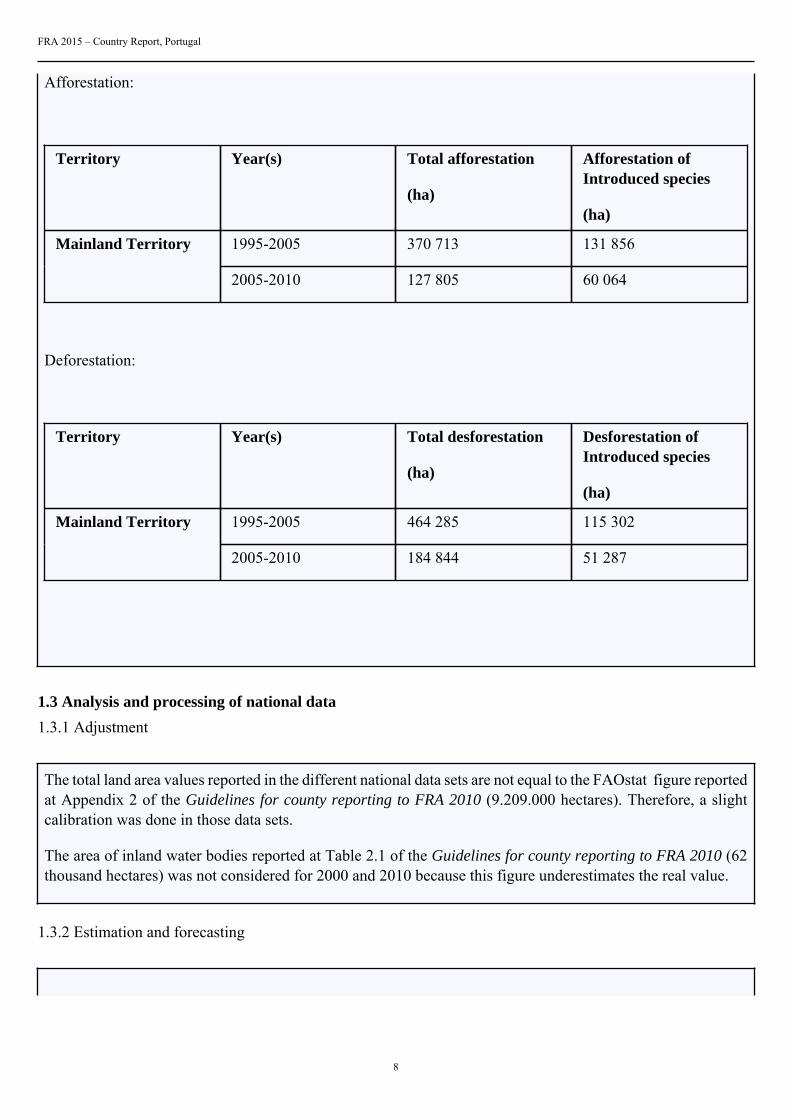
Afforestation:
Territory Year(s) Total afforestation
(ha)
Afforestation ofIntroduced species
(ha)
1995-2005 370 713 131 856Mainland Territory
2005-2010 127 805 60 064
Deforestation:
Territory Year(s) Total desforestation
(ha)
Desforestation ofIntroduced species
(ha)
1995-2005 464 285 115 302Mainland Territory
2005-2010 184 844 51 287
1.3 Analysis and processing of national data
1.3.1 Adjustment
The total land area values reported in the different national data sets are not equal to the FAOstat figure reportedat Appendix 2 of the Guidelines for county reporting to FRA 2010 (9.209.000 hectares). Therefore, a slightcalibration was done in those data sets.
The area of inland water bodies reported at Table 2.1 of the Guidelines for county reporting to FRA 2010 (62thousand hectares) was not considered for 2000 and 2010 because this figure underestimates the real value.
1.3.2 Estimation and forecasting

FRA 2015 – Country Report, Portugal
9
F or the mainland territory , the year 1990 values were extrapolated from the NFI6 (1995) and NFI (2005). Theyear 2000 values were interpolated from the NFI6 (1995) and NFI6 (2005). The year 2015 forest forecastedvalues were extrapolated from the NFI (2005) and NFI6 (2010). The year 2015 inland water bodies figurewas considered to be the same as 2010. Although Portuguese government has recently launched a new damprogramme in which the building of 10 new water dams is planned, none of these is expected to be finishedbefore 2015.
Both AzoresandMadeira’s territories have only one single forest inventory each (IFRAM1 for Madeiraand IFRAA for Azores). Although other sources of information are available for past years, these are notcompletely consistent and are not compatible with FAO definitions. Therefore, for consistency reasons it wasdecided to adopt the forest inventory data of each territory for all reference years. Notice that Azores andMadeira’s contributions for global figures of Portugal are relatively small, since these territories occupy onlyapproximately 3% of the Portuguese total area.
1.3.3 Reclassification
1.4 DataTable 1a
Area (000 hectares)Categories
1990 2000 2005 2010 2015
Forest 3436 3343 3296 3239 3182
Other wooded land 1091 1218 1281 1503 1725
Other land 4633 4522 4454 4284 4119
... of which with tree cover N/A N/A N/A N/A N/A
Inland water bodies 49 126 178 183 183
TOTAL 9209.00 9209.00 9209.00 9209.00 9209.00
Table 1bAnnual forest establishment /loss (000 hectares per year)
...of which of introducedspecies (000 hectares per year)
Categories
1990 2000 2005 2010 1990 2000 2005 2010
Forest expansion N/A N/A 37.1 25.6 N/A N/A 13.2 12
... of which afforestation N/A N/A N/A N/A N/A N/A N/A N/A
... of which naturalexpansion of forest
N/A N/A N/A N/A N/A N/A N/A N/A

FRA 2015 – Country Report, Portugal
10
Deforestation N/A N/A 46.4 37 N/A N/A 11.5 10.3
... of which human induced N/A N/A N/A N/A N/A N/A N/A N/A
Reforestation N/A N/A N/A N/A N/A N/A N/A N/A
... of which artificial N/A N/A N/A N/A N/A N/A N/A N/A
Tiers
Category Tier for status Tier for reported trend
Forest Tier 3 Tier 3
Other wooded land Tier 3 Tier 3
Forest expansion Tier 3 Tier 3
Deforestation Tier 3 Tier 3
Reforestation N/A N/A
Tier criteria
Category Tier for status Tier for reported trend
• Forest• Other wooded land• Afforestation• Reforestation• Natural expansion of forest• Deforestation
Tier 3 : Data sources: Either recent(less than 10 years ago) National ForestInventory or remote sensing, with groundtruthing, or programme for repeatedcompatible NFIs Tier 2 : Data sources:Full cover mapping / remote sensing orold NFI (more than 10 years ago) Tier 1 :Other
Tier 3 : Estimate based on repeatedcompatible tiers 3 (tier for status) Tier 2 :Estimate based on repeated compatible tier2 or combination tier 3 and 2 or 1 (tier forstatus) Tier 1 : Other
1.5 Comments
CategoryComments related todata definitions etc
Comments on the reported trends
Forest N/A N/A
Other wooded land It was decided to consider all shrublandarea as OWL as specified in the 2ndoption of OWL FRA2015 definition(Terms and Definitions). Consequently,the 1990, 2000, 2005 and 2010 valueswere updated
N/A
Other land N/A N/A
Other land with tree cover Not available N/A

FRA 2015 – Country Report, Portugal
11
Inland water bodies N/A During the 1995-2010 period severalwater-dams were constructed (the Alquevadam reservoir alone was responsible for25 thousand hectares of new inland waterarea), and in result, the area of inlandwater bodies has largely increased.
Forest expansion The NFI6 provided new accouratedata as it comprehended the landcoverclassification of the same sample pointsfor 1995, 2005 and 2010. This allowedto estimate the forest expansion area bycomparing classifications of differentyears.
N/A
Deforestation The NFI6 provided new accouratedata as it comprehended the landcoverclassification of the same sample ointsfor 1995, 2005 and 2010. This allowedto estimate the deforestation area bycomparing classifications of differentyears.
N/A
Reforestation Not available N/A
Other general comments to the table
The NFI6 land use/cover data included the classification of 356 thousand sample points for 2010, 2005 and 1995, based on airborneimagery and field surveying. In result, the 1990, 2000 and 2005 national estimations have been updated in FRA2015.
FRA 2015 – Country Report, Portugal
12
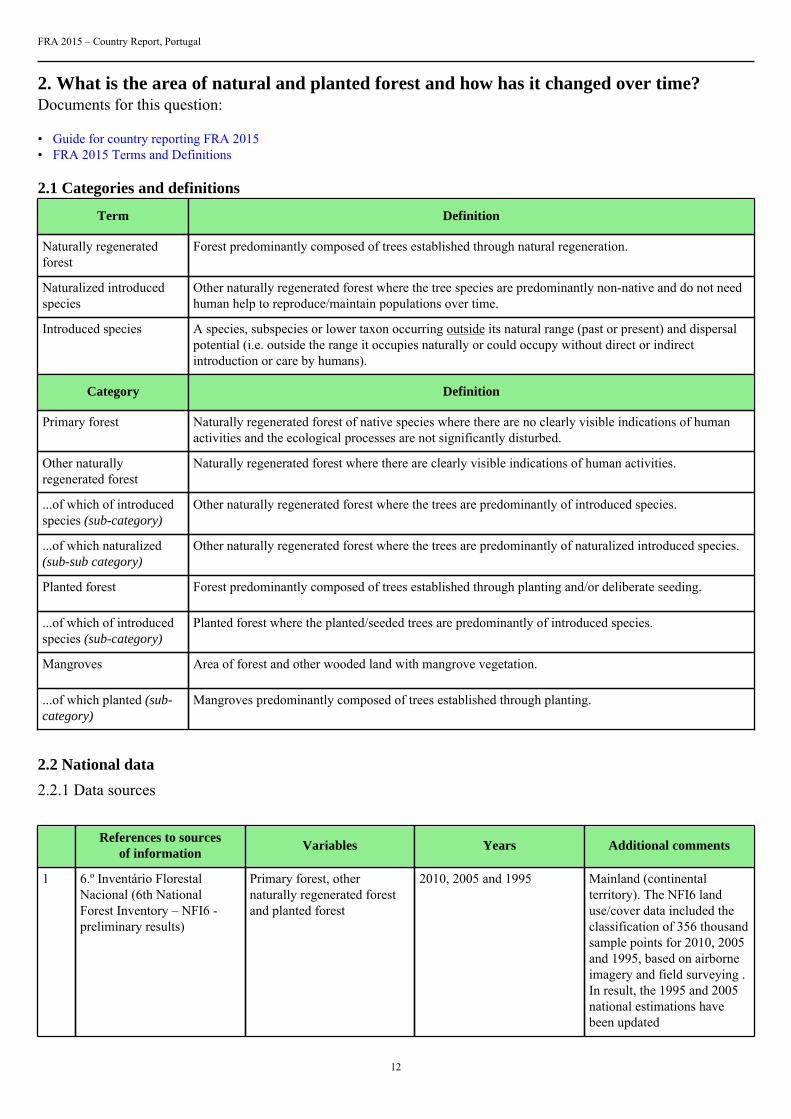
2. What is the area of natural and planted forest and how has it changed over time?Documents for this question:
• Guide for country reporting FRA 2015• FRA 2015 Terms and Definitions
2.1 Categories and definitions
Term Definition
Naturally regeneratedforest
Forest predominantly composed of trees established through natural regeneration.
Naturalized introducedspecies
Other naturally regenerated forest where the tree species are predominantly non-native and do not needhuman help to reproduce/maintain populations over time.
Introduced species A species, subspecies or lower taxon occurring outside its natural range (past or present) and dispersalpotential (i.e. outside the range it occupies naturally or could occupy without direct or indirectintroduction or care by humans).
Category Definition
Primary forest Naturally regenerated forest of native species where there are no clearly visible indications of humanactivities and the ecological processes are not significantly disturbed.
Other naturallyregenerated forest
Naturally regenerated forest where there are clearly visible indications of human activities.
...of which of introducedspecies (sub-category)
Other naturally regenerated forest where the trees are predominantly of introduced species.
...of which naturalized(sub-sub category)
Other naturally regenerated forest where the trees are predominantly of naturalized introduced species.
Planted forest Forest predominantly composed of trees established through planting and/or deliberate seeding.
...of which of introducedspecies (sub-category)
Planted forest where the planted/seeded trees are predominantly of introduced species.
Mangroves Area of forest and other wooded land with mangrove vegetation.
...of which planted (sub-category)
Mangroves predominantly composed of trees established through planting.
2.2 National data
2.2.1 Data sources
References to sourcesof information
Variables Years Additional comments
1 6.º Inventário FlorestalNacional (6th NationalForest Inventory – NFI6 -preliminary results)
Primary forest, othernaturally regenerated forestand planted forest
2010, 2005 and 1995 Mainland (continentalterritory). The NFI6 landuse/cover data included theclassification of 356 thousandsample points for 2010, 2005and 1995, based on airborneimagery and field surveying .In result, the 1995 and 2005national estimations havebeen updated

FRA 2015 – Country Report, Portugal
13
2 Inventário Florestal daRegião Autónoma dos Açores(IFRAA) (regional forestinventory)
Primary forest, othernaturally regenerated forestand planted forest
2007 Autonomous Region ofAzores.
3 1.º Inventário Florestalda Região Autónoma daMadeira (IFRAM1) (regionalforest inventory)
Primary forest, othernaturally regenerated forestand planted forest
2004 Autonomous Region ofMadeira.
4 N/A N/A N/A N/A
2.2.2 Classification and definitions
National class Definition
There is no official or commonly used classification or definitionfor these categories. The FRA definitions were adopted.
N/A
N/A N/A
N/A N/A
N/A N/A
2.2.3 Original data
Territory Category Area (1000 ha)
Reference year 1995 2005 2010
Primary forest 0,00 0,00 0,00
Other naturallyregenerated forest
2557 2389 2306
...of whichof introducedspecies
111 126 131
...of whichnaturalized
3 5 5
Planted forest 748 822 849
...of whichof introducedspecies
748 822 849
Mainland territory
Total 3305 3212 3155

FRA 2015 – Country Report, Portugal
14
Reference year 2007
Primary forest 7.97
Other naturallyregenerated forest
30.12
...of whichof introducedspecies
28.66
Planted forest 17.87
...of whichof introducedspecies
17.87
AutonomousRegion of Azores
Total 56.0
Reference year 2004
Primary forest 16.1
Other naturallyregenerated forest
16.5
...of whichof introducedspecies
16.5
Planted forest 0.00
...of whichof introducedspecies
0.00
AutonomousRegion ofMadeira
Total 32.7
2.3 Analysis and processing of national data
2.3.1 Adjustment
A calibration was required to assure that the sum of areas of different categories matches the forest area reportedin Table T1.

FRA 2015 – Country Report, Portugal
15
2.3.2 Estimation and forecasting
For the mainland territory , the years 2000 values were interpolated/extrapolated from the NFI6 (1995) andNFI5 (2005). The year 2015 forest forecasted values were extrapolated from the NFI6 (2005) and NFI6 (2010).
ForAzoresandMadeira’s territories the respective inventory data were used for every reference years (asexplained at Table 1).
2.3.3 Reclassification
Reclassification was made by forest tree species. A category was assigned for each forest tree species, dependingon the territory considered (mainland, Azores and Madeira).
2.4 DataTable 2a
Forest area (000 hectares)Categories
1990 2000 2005 2010 2015
Primary forest N/A 24.1 24.1 24.1 24.1
Other naturally regeneratedforest
N/A 2517 2433 2350 2267
... of which of introducedspecies
N/A 164 171 176 180
... of which naturalized N/A 3.71 4.72 5.34 5.97
Planted forest N/A 802 839 865 891
... of which of introducedspecies
N/A 802 839 865 891
TOTAL .00 3343.10 3296.10 3239.10 3182.10
Table 2b
Primary forest converted to (000 ha)
1990-2000 2000-2010 2010-2015
Othernatural
regenerationPlanted Other land
Othernatural
regenerationPlanted Other land
Othernatural
regenerationPlanted Other land
0 0 0 0 0 0 0 0 0
Table 2c

FRA 2015 – Country Report, Portugal
16
Area (000 hectares)Categories
1990 2000 2005 2010 2015
Mangroves (forest and OWL) 0 0 0 0 0
... of which planted 0 0 0 0 0
Tiers
Category Tier for status Tier for reported trend
Primary forest Tier 3 Tier 3
Other naturally regenerated forest Tier 3 Tier 3
Planted forest Tier 3 Tier 3
Mangroves Tier 3 Tier 3
Tier Criteria
Category Tier for status Tier for reported trend
Primary forest/Other naturally regeneratedforest/Planted forest
Tier 3 : Data sources: Recent (less than10 years) National Forest Inventory orremote sensing with ground truthing ordata provided by official agencies orprogramme for repeated compatible NFIsTier 2 : Data sources: Full cover mapping/remote sensing or old NFI (more than 10years) Tier 1 : Other
Tier 3 : Estimate based on repeatedcompatible tiers 3 (tier for status) Tier 2 :Estimate based on repeated compatible tier2 or combination tier 3 and 2 or 1 (tier forstatus) Tier 1 : Other
2.5 Comments
CategoryComments related todata definitions etc
Comments on reported trend
Primary forest N/A N/A
Other naturally regenerating forest N/A N/A
Planted forest N/A N/A
Mangroves N/A N/A
Other general comments to the table
The NFI6 land use/cover data included the classification of 356 thousand sample points for 2010, 2005 and 1995, based on airborneimagery and field surveying. In result, the 2000 and 2005 national estimations have been updated in FRA2015.
FRA 2015 – Country Report, Portugal
17
3. What are the stocks and growth rates of the forests and how have they changed?Documents for this question:
• Guide for country reporting FRA 2015• FRA 2015 Terms and Definitions
3.1 Categories and definitions
Category Definition
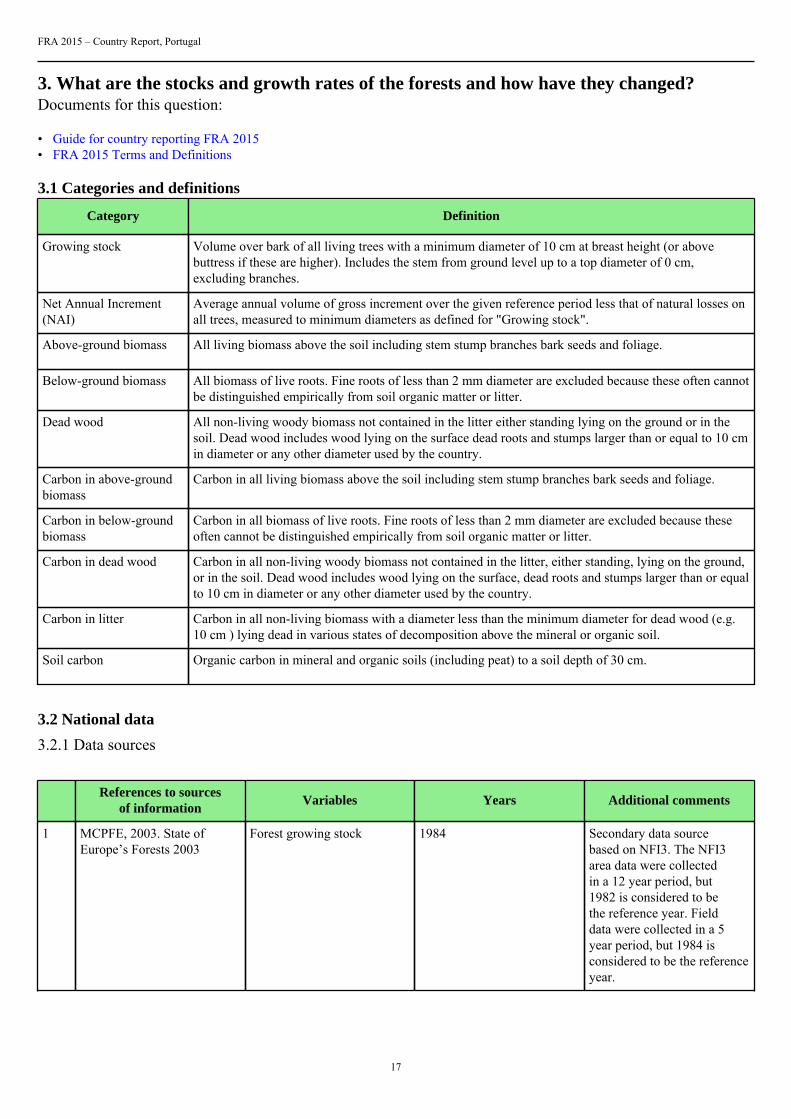
Growing stock Volume over bark of all living trees with a minimum diameter of 10 cm at breast height (or abovebuttress if these are higher). Includes the stem from ground level up to a top diameter of 0 cm,excluding branches.
Net Annual Increment(NAI)
Average annual volume of gross increment over the given reference period less that of natural losses onall trees, measured to minimum diameters as defined for "Growing stock".
Above-ground biomass All living biomass above the soil including stem stump branches bark seeds and foliage.
Below-ground biomass All biomass of live roots. Fine roots of less than 2 mm diameter are excluded because these often cannotbe distinguished empirically from soil organic matter or litter.
Dead wood All non-living woody biomass not contained in the litter either standing lying on the ground or in thesoil. Dead wood includes wood lying on the surface dead roots and stumps larger than or equal to 10 cmin diameter or any other diameter used by the country.
Carbon in above-groundbiomass
Carbon in all living biomass above the soil including stem stump branches bark seeds and foliage.
Carbon in below-groundbiomass
Carbon in all biomass of live roots. Fine roots of less than 2 mm diameter are excluded because theseoften cannot be distinguished empirically from soil organic matter or litter.
Carbon in dead wood Carbon in all non-living woody biomass not contained in the litter, either standing, lying on the ground,or in the soil. Dead wood includes wood lying on the surface, dead roots and stumps larger than or equalto 10 cm in diameter or any other diameter used by the country.
Carbon in litter Carbon in all non-living biomass with a diameter less than the minimum diameter for dead wood (e.g.10 cm ) lying dead in various states of decomposition above the mineral or organic soil.
Soil carbon Organic carbon in mineral and organic soils (including peat) to a soil depth of 30 cm.
3.2 National data
3.2.1 Data sources
References to sourcesof information
Variables Years Additional comments
1 MCPFE, 2003. State ofEurope’s Forests 2003
Forest growing stock 1984 Secondary data sourcebased on NFI3. The NFI3area data were collectedin a 12 year period, but1982 is considered to bethe reference year. Fielddata were collected in a 5year period, but 1984 isconsidered to be the referenceyear.
FRA 2015 – Country Report, Portugal
18
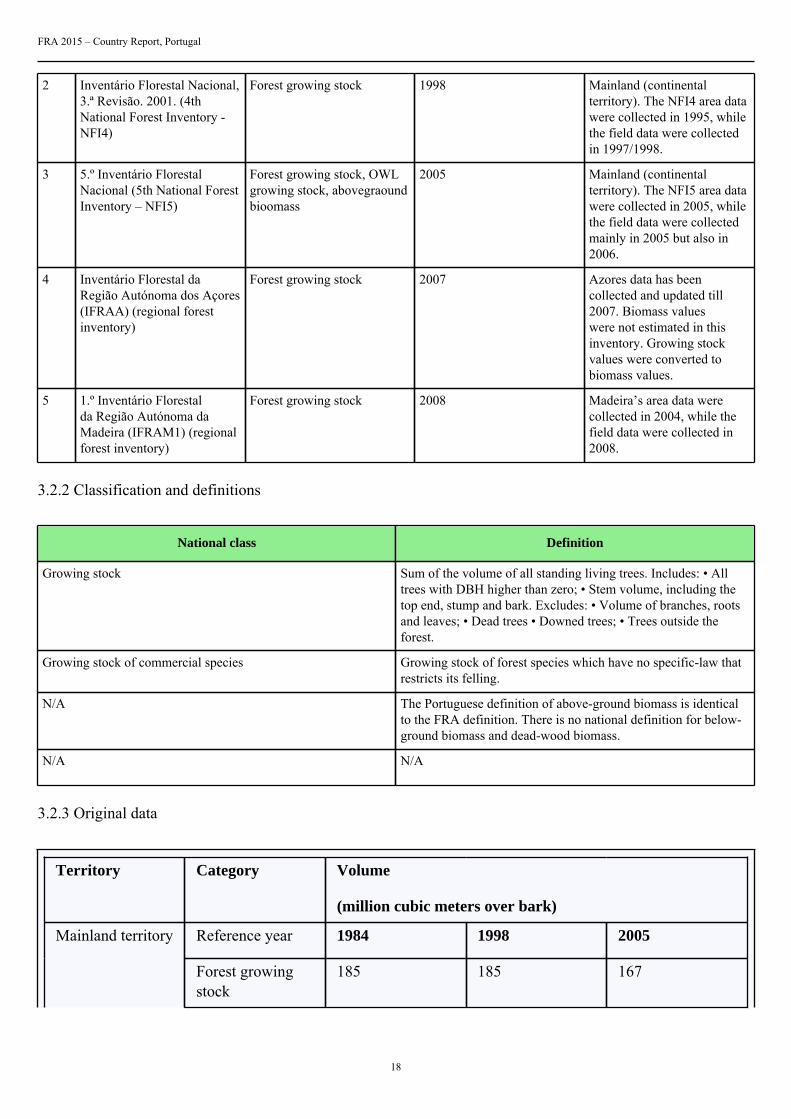
2 Inventário Florestal Nacional,3.ª Revisão. 2001. (4thNational Forest Inventory -NFI4)
Forest growing stock 1998 Mainland (continentalterritory). The NFI4 area datawere collected in 1995, whilethe field data were collectedin 1997/1998.
3 5.º Inventário FlorestalNacional (5th National ForestInventory – NFI5)
Forest growing stock, OWLgrowing stock, abovegraoundbioomass
2005 Mainland (continentalterritory). The NFI5 area datawere collected in 2005, whilethe field data were collectedmainly in 2005 but also in2006.
4 Inventário Florestal daRegião Autónoma dos Açores(IFRAA) (regional forestinventory)
Forest growing stock 2007 Azores data has beencollected and updated till2007. Biomass valueswere not estimated in thisinventory. Growing stockvalues were converted tobiomass values.
5 1.º Inventário Florestalda Região Autónoma daMadeira (IFRAM1) (regionalforest inventory)
Forest growing stock 2008 Madeira’s area data werecollected in 2004, while thefield data were collected in2008.
3.2.2 Classification and definitions
National class Definition
Growing stock Sum of the volume of all standing living trees. Includes: • Alltrees with DBH higher than zero; • Stem volume, including thetop end, stump and bark. Excludes: • Volume of branches, rootsand leaves; • Dead trees • Downed trees; • Trees outside theforest.
Growing stock of commercial species Growing stock of forest species which have no specific-law thatrestricts its felling.
N/A The Portuguese definition of above-ground biomass is identicalto the FRA definition. There is no national definition for below-ground biomass and dead-wood biomass.
N/A N/A
3.2.3 Original data
Territory Category Volume
(million cubic meters over bark)
Reference year 1984 1998 2005Mainland territory
Forest growingstock
185 185 167

FRA 2015 – Country Report, Portugal
19
... of whichconiferous
114 105 84.0
... of whichbroadleaved
71.5 79.7 82.5
Forest Growingstock ofcommercialspecies
149 153 136
OWL Growingstock
1.73
Reference year 2007
Forest growingstock
12.1
... of whichconiferous
6.70
... of whichbroadleaved
5.44
AutonomousRegion of Azores
Forest Growingstock ofcommercialspecies
11.3
Reference year 2008
Forest growingstock
5.90
... of whichconiferous
1.81
... of whichbroadleaved
4.09
AutonomousRegion ofMadeira
Forest Growingstock ofcommercialspecies
4.33
Biomass:
Territory Category Units Year Value
Above-groundbiomass
1000 t 1998 n.a.
FRA 2015 – Country Report, Portugal
20
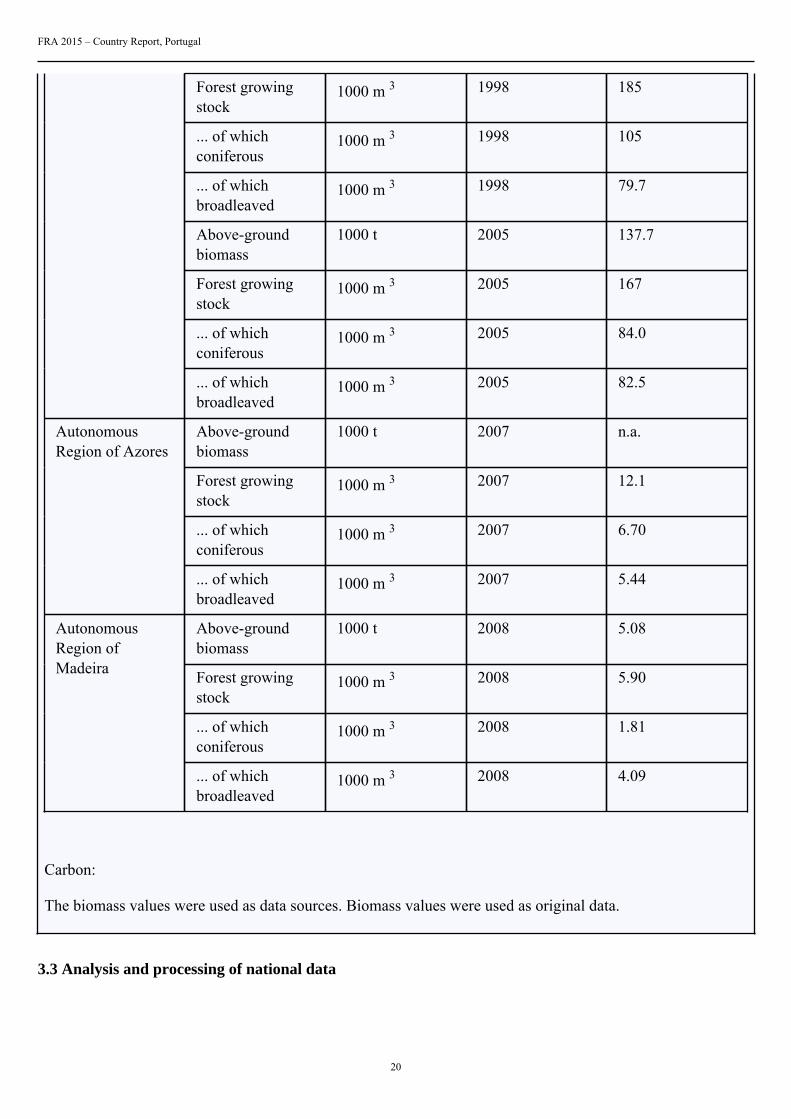
Forest growingstock
1000 m 3 1998 185
... of whichconiferous
1000 m 3 1998 105
... of whichbroadleaved
1000 m 3 1998 79.7
Above-groundbiomass
1000 t 2005 137.7
Forest growingstock
1000 m 3 2005 167
... of whichconiferous
1000 m 3 2005 84.0
... of whichbroadleaved
1000 m 3 2005 82.5
Above-groundbiomass
1000 t 2007 n.a.
Forest growingstock
1000 m 3 2007 12.1
... of whichconiferous
1000 m 3 2007 6.70
AutonomousRegion of Azores
... of whichbroadleaved
1000 m 3 2007 5.44
Above-groundbiomass
1000 t 2008 5.08
Forest growingstock
1000 m 3 2008 5.90
... of whichconiferous
1000 m 3 2008 1.81
AutonomousRegion ofMadeira
... of whichbroadleaved
1000 m 3 2008 4.09
Carbon:
The biomass values were used as data sources. Biomass values were used as original data.
3.3 Analysis and processing of national data

FRA 2015 – Country Report, Portugal
21
3.3.1 Adjustment
Calibration is not required.
3.3.2 Estimation and forecasting
The year 1990 figures were interpolated from the NFI3 (1984) and NFI4 (1998). In similar way, the year 2000figures were interpolated from the NFI4 (1995) and NFI5 (2005).
The year 2010 forest forecasted figures were extrapolated from the NFI3 (1984), NFI4 (1998) and NFI5 (2005)figures.
Both AzoresandMadeira’s territories have only one single forest inventory each (IFRAM1 for Madeiraand IFRAA for Azores). Although other sources of information are available for past years, these are notcompletely consistent and are not compatible with FAO definitions. Therefore, for consistency reasons it wasdecided to adopt the forest inventory data of each territory for all reference years. Notice that Azores andMadeira’s contributions for global figures of Portugal are relatively small, since these territories occupy onlyapproximately 3% of the Portuguese total area.
Azores and Madeira territories do not have data regarding the OWL growing stock. To estimate these variables,the mainland’s average growing stock (per hectare) was used.
Biomass:
The forecasted values for 2010 were obtained assuming the same ratio biomass:growing stock of 2005.
Carbon:
Data was directly obtained by multiplying the biomass values by the default value of carbon fraction ofaboveground forest biomass indicated at Table 5.2 of Appendix 5 of the FRA 2010 Guidelines document.
3.3.3 Reclassification
Reclassification is not required.
3.4 DataTable 3a
Growing stock volume (million m 3 over bark)Category
Forest Other wooded land
FRA 2015 – Country Report, Portugal
22
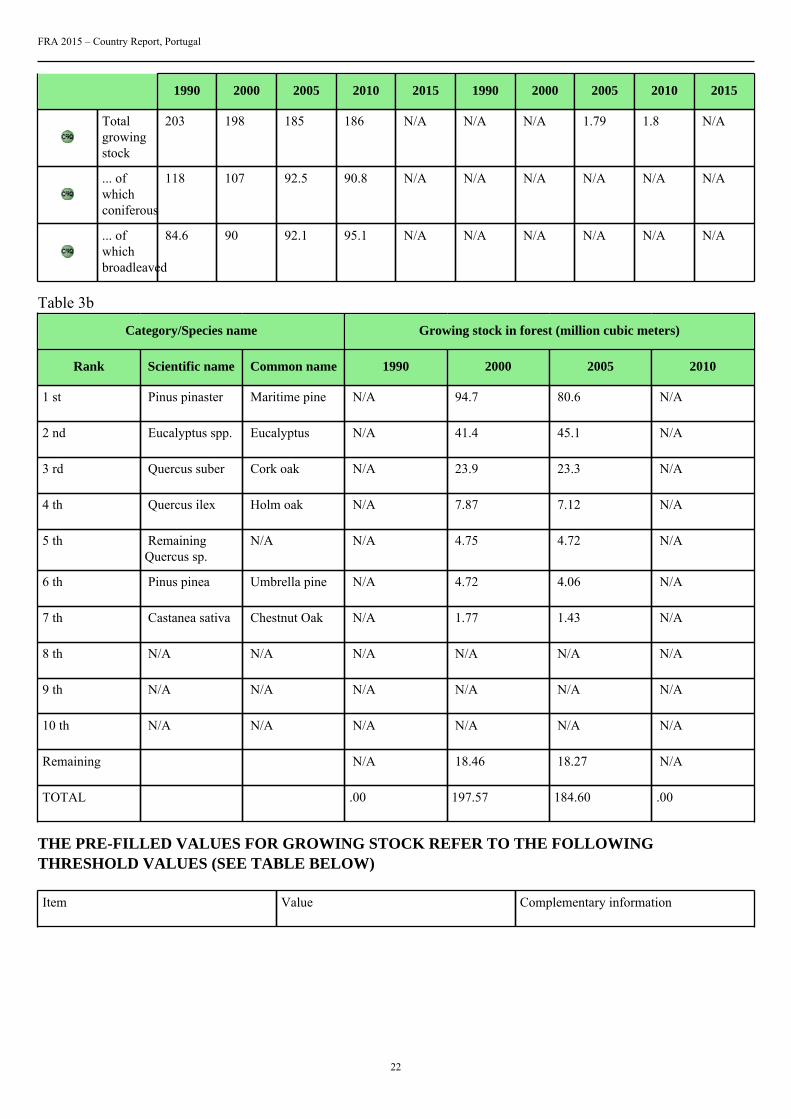
1990 2000 2005 2010 2015 1990 2000 2005 2010 2015
Totalgrowingstock
203 198 185 186 N/A N/A N/A 1.79 1.8 N/A
... ofwhichconiferous
118 107 92.5 90.8 N/A N/A N/A N/A N/A N/A
... ofwhichbroadleaved
84.6 90 92.1 95.1 N/A N/A N/A N/A N/A N/A
Table 3b
Category/Species name Growing stock in forest (million cubic meters)
Rank Scientific name Common name 1990 2000 2005 2010
1 st Pinus pinaster Maritime pine N/A 94.7 80.6 N/A
2 nd Eucalyptus spp. Eucalyptus N/A 41.4 45.1 N/A
3 rd Quercus suber Cork oak N/A 23.9 23.3 N/A
4 th Quercus ilex Holm oak N/A 7.87 7.12 N/A
5 th RemainingQuercus sp.
N/A N/A 4.75 4.72 N/A
6 th Pinus pinea Umbrella pine N/A 4.72 4.06 N/A
7 th Castanea sativa Chestnut Oak N/A 1.77 1.43 N/A
8 th N/A N/A N/A N/A N/A N/A
9 th N/A N/A N/A N/A N/A N/A
10 th N/A N/A N/A N/A N/A N/A
Remaining N/A 18.46 18.27 N/A
TOTAL .00 197.57 184.60 .00
THE PRE-FILLED VALUES FOR GROWING STOCK REFER TO THE FOLLOWINGTHRESHOLD VALUES (SEE TABLE BELOW)
Item Value Complementary information

FRA 2015 – Country Report, Portugal
23
Minimum diameter (cm) at breast heightof trees included in growing stock (X)
0 Although there is a dbh threshold of5/7.5 cm (depending on the specie) formeasuring individual trees, volume ofsmaller trees (dbh<5/7.5 cm) is consideredas well (smaller trees are counted and thecorrespondent average height is recordedfor every sample plot).
Minimum diameter (cm) at the top end ofstem for calculation of growing stock (Y)
0 The reported growing stock includes thevolume of the top end of the stem.
Minimum diameter (cm) of branchesincluded in growing stock (W)
N/A The reported growing stock does notinclude the volume of branches.
Volume refers to above ground (AG) orabove stump (AS)
AG The reported growing stock includes thestump volume.
PLEASE NOTE THAT THE DEFINITION OF GROWING STOCK HAS CHANGED AND SHOULDBE REPORTED AS GROWING STOCK DBH 10 CM INCLUDING THE STEM FROM GROUNDLEVEL UP TO A DIAMETER OF 0 CM, EXCLUDING BRANCHES.
Table 3c
Net annual increment (m 3 per hectare and year)
ForestCategory
1990 2000 2005 2010 2015
Net annualincrement
N/A N/A N/A N/A N/A
... of whichconiferous
N/A N/A N/A N/A N/A
... of whichbroadleaved
N/A N/A N/A N/A N/A
Table 3d
Biomass (million metric tonnes oven-dry weight)
Forest Other wooded landCategory
1990 2000 2005 2010 2015 1990 2000 2005 2010 2015
Abovegroundbiomass
168 164 153 154 N/A N/A N/A N/A N/A N/A
Belowgroundbiomass
69 68 63.3 63.7 N/A N/A N/A N/A N/A N/A
Deadwood
N/A N/A N/A N/A N/A N/A N/A N/A N/A N/A
TOTAL 237.00 232.00 216.30 217.70 .00 .00 .00 .00 .00 .00
Table 3e

FRA 2015 – Country Report, Portugal
24
Carbon (Million metric tonnes)
Forest Other wooded landCategory
1990 2000 2005 2010 2015 1990 2000 2005 2010 2015
Carbonin abovegroundbiomass
79 77 72 72.5 N/A N/A N/A N/A N/A N/A
Carbonin belowgroundbiomass
33 32 29.8 29.9 N/A N/A N/A N/A N/A N/A
SubtotalLivingbiomass
112 109 102 102 N/A N/A N/A N/A N/A N/A
Carbonin deadwood
N/A N/A N/A N/A N/A N/A N/A N/A N/A N/A
Carbonin litter
N/A N/A N/A N/A N/A N/A N/A N/A N/A N/A
SubtotalDeadwoodand litter
N/A N/A N/A N/A N/A N/A N/A N/A N/A N/A
Soilcarbon
N/A N/A N/A N/A N/A N/A N/A N/A N/A N/A
TOTAL 112.00 109.00 101.80 102.40 .00 .00 .00 .00 .00 .00
Tiers
Variable/category Tier for status Tier for trend
Total growing stock Tier 1 Tier 1
Net annual increment N/A N/A
Above ground biomass Tier 1 Tier 1
Below ground biomass Tier 1 Tier 1
Dead wood N/A N/A
Carbon in above-ground biomass Tier 1 Tier 1
Carbon in below ground biomass Tier 1 Tier 1
Carbon in dead wood and litter N/A N/A
Soil carbon N/A N/A
FRA 2015 – Country Report, Portugal
25
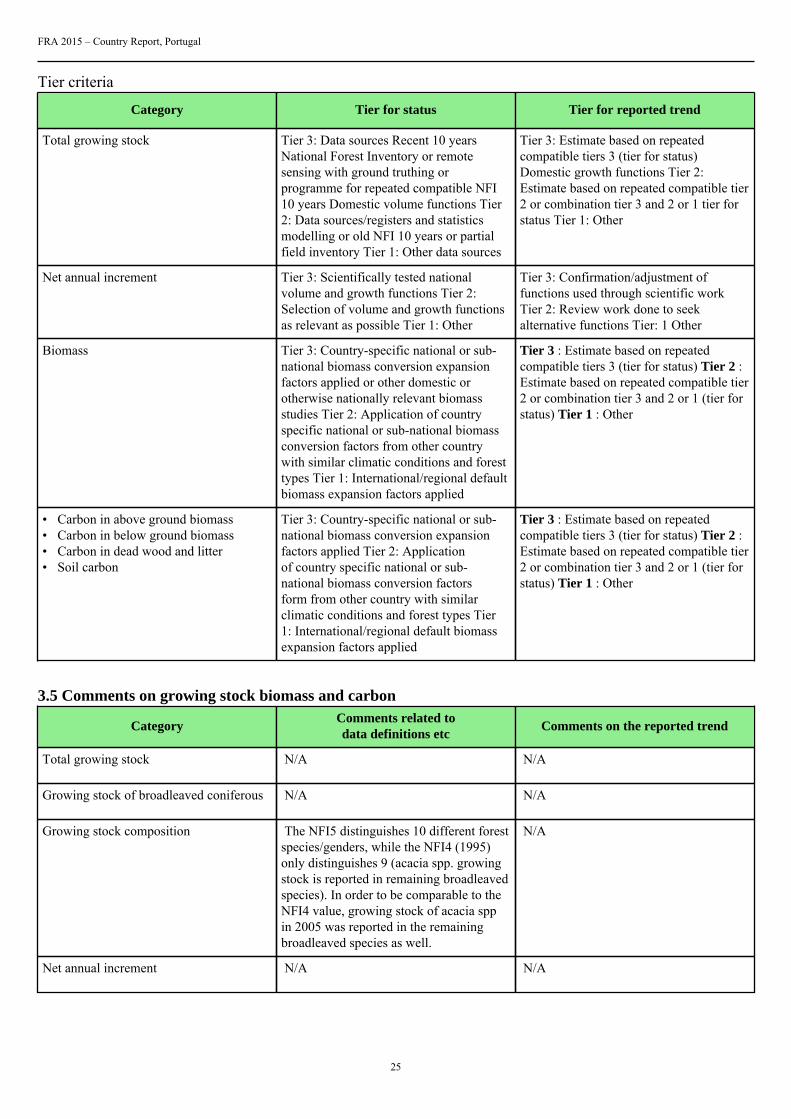
Tier criteria
Category Tier for status Tier for reported trend
Total growing stock Tier 3: Data sources Recent 10 yearsNational Forest Inventory or remotesensing with ground truthing orprogramme for repeated compatible NFI10 years Domestic volume functions Tier2: Data sources/registers and statisticsmodelling or old NFI 10 years or partialfield inventory Tier 1: Other data sources
Tier 3: Estimate based on repeatedcompatible tiers 3 (tier for status)Domestic growth functions Tier 2:Estimate based on repeated compatible tier2 or combination tier 3 and 2 or 1 tier forstatus Tier 1: Other
Net annual increment Tier 3: Scientifically tested nationalvolume and growth functions Tier 2:Selection of volume and growth functionsas relevant as possible Tier 1: Other
Tier 3: Confirmation/adjustment offunctions used through scientific workTier 2: Review work done to seekalternative functions Tier: 1 Other
Biomass Tier 3: Country-specific national or sub-national biomass conversion expansionfactors applied or other domestic orotherwise nationally relevant biomassstudies Tier 2: Application of countryspecific national or sub-national biomassconversion factors from other countrywith similar climatic conditions and foresttypes Tier 1: International/regional defaultbiomass expansion factors applied
Tier 3 : Estimate based on repeatedcompatible tiers 3 (tier for status) Tier 2 :Estimate based on repeated compatible tier2 or combination tier 3 and 2 or 1 (tier forstatus) Tier 1 : Other
• Carbon in above ground biomass• Carbon in below ground biomass• Carbon in dead wood and litter• Soil carbon
Tier 3: Country-specific national or sub-national biomass conversion expansionfactors applied Tier 2: Applicationof country specific national or sub-national biomass conversion factorsform from other country with similarclimatic conditions and forest types Tier1: International/regional default biomassexpansion factors applied
Tier 3 : Estimate based on repeatedcompatible tiers 3 (tier for status) Tier 2 :Estimate based on repeated compatible tier2 or combination tier 3 and 2 or 1 (tier forstatus) Tier 1 : Other
3.5 Comments on growing stock biomass and carbon
CategoryComments related todata definitions etc
Comments on the reported trend
Total growing stock N/A N/A
Growing stock of broadleaved coniferous N/A N/A
Growing stock composition The NFI5 distinguishes 10 different forestspecies/genders, while the NFI4 (1995)only distinguishes 9 (acacia spp. growingstock is reported in remaining broadleavedspecies). In order to be comparable to theNFI4 value, growing stock of acacia sppin 2005 was reported in the remainingbroadleaved species as well.
N/A
Net annual increment N/A N/A
FRA 2015 – Country Report, Portugal
26
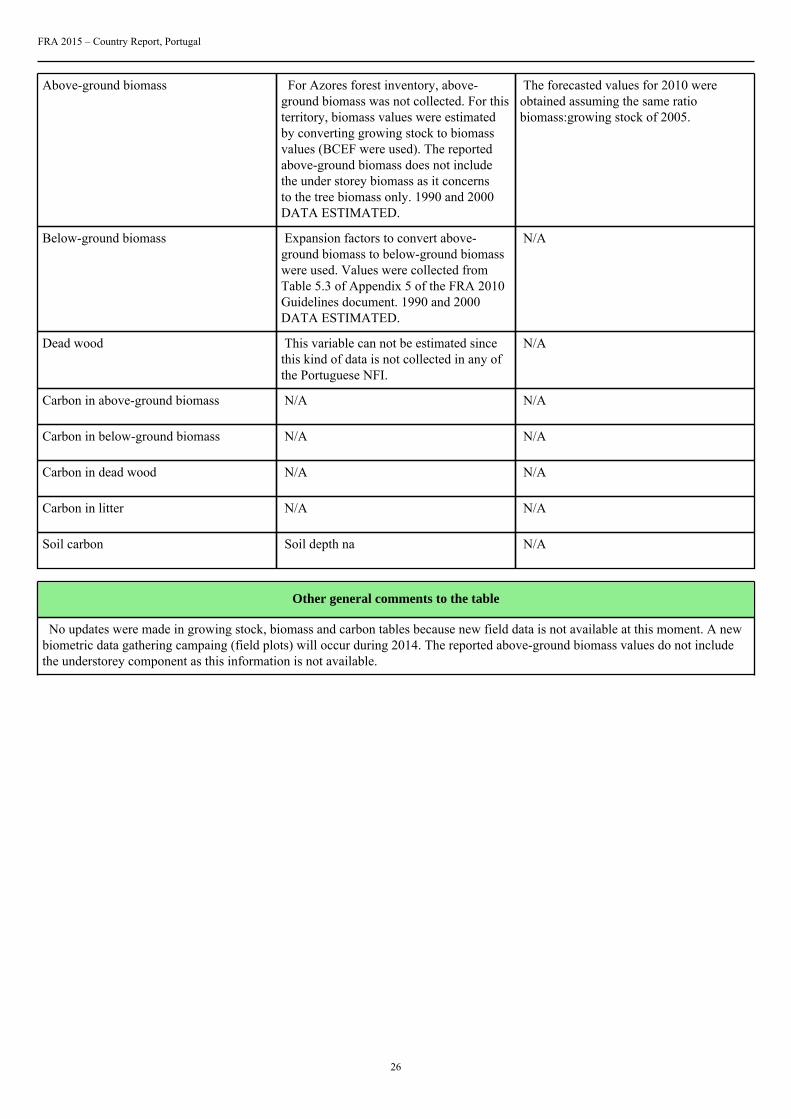
Above-ground biomass For Azores forest inventory, above-ground biomass was not collected. For thisterritory, biomass values were estimatedby converting growing stock to biomassvalues (BCEF were used). The reportedabove-ground biomass does not includethe under storey biomass as it concernsto the tree biomass only. 1990 and 2000DATA ESTIMATED.
The forecasted values for 2010 wereobtained assuming the same ratiobiomass:growing stock of 2005.
Below-ground biomass Expansion factors to convert above-ground biomass to below-ground biomasswere used. Values were collected fromTable 5.3 of Appendix 5 of the FRA 2010Guidelines document. 1990 and 2000DATA ESTIMATED.
N/A
Dead wood This variable can not be estimated sincethis kind of data is not collected in any ofthe Portuguese NFI.
N/A
Carbon in above-ground biomass N/A N/A
Carbon in below-ground biomass N/A N/A
Carbon in dead wood N/A N/A
Carbon in litter N/A N/A
Soil carbon Soil depth na N/A
Other general comments to the table
No updates were made in growing stock, biomass and carbon tables because new field data is not available at this moment. A newbiometric data gathering campaing (field plots) will occur during 2014. The reported above-ground biomass values do not includethe understorey component as this information is not available.
FRA 2015 – Country Report, Portugal
27
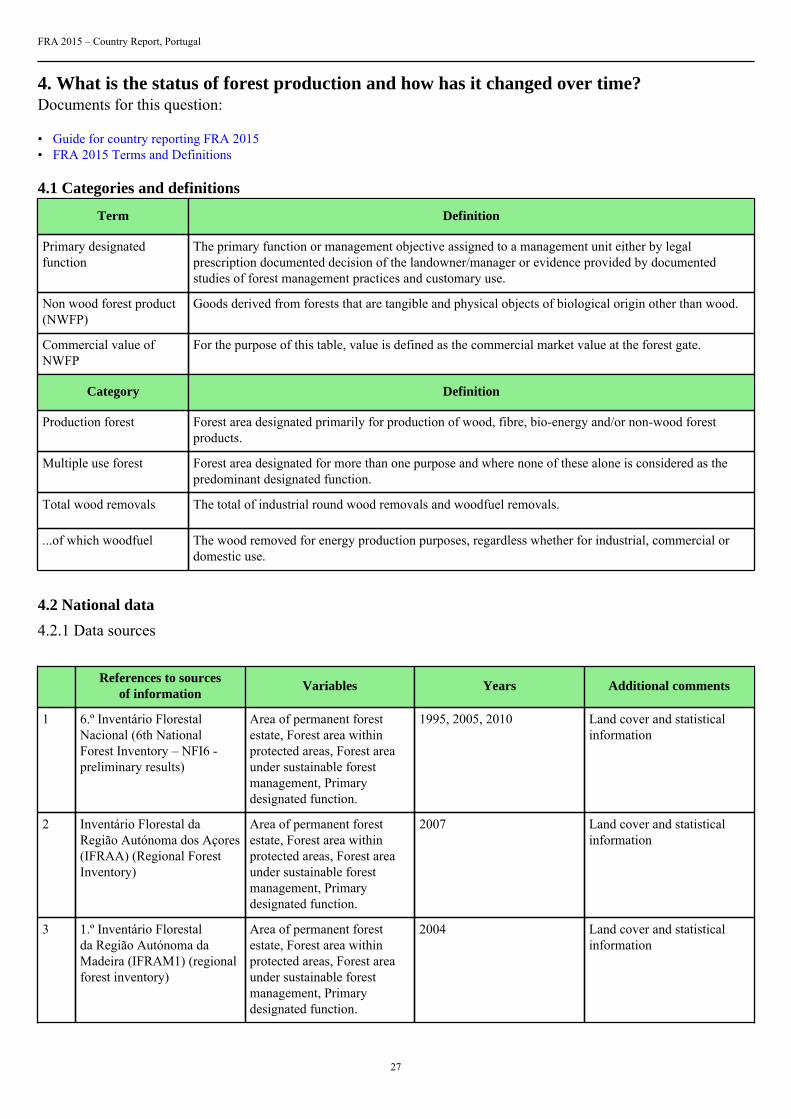
4. What is the status of forest production and how has it changed over time?Documents for this question:
• Guide for country reporting FRA 2015• FRA 2015 Terms and Definitions
4.1 Categories and definitions
Term Definition
Primary designatedfunction
The primary function or management objective assigned to a management unit either by legalprescription documented decision of the landowner/manager or evidence provided by documentedstudies of forest management practices and customary use.
Non wood forest product(NWFP)
Goods derived from forests that are tangible and physical objects of biological origin other than wood.
Commercial value ofNWFP
For the purpose of this table, value is defined as the commercial market value at the forest gate.
Category Definition
Production forest Forest area designated primarily for production of wood, fibre, bio-energy and/or non-wood forestproducts.
Multiple use forest Forest area designated for more than one purpose and where none of these alone is considered as thepredominant designated function.
Total wood removals The total of industrial round wood removals and woodfuel removals.
...of which woodfuel The wood removed for energy production purposes, regardless whether for industrial, commercial ordomestic use.
4.2 National data
4.2.1 Data sources
References to sourcesof information
Variables Years Additional comments
1 6.º Inventário FlorestalNacional (6th NationalForest Inventory – NFI6 -preliminary results)
Area of permanent forestestate, Forest area withinprotected areas, Forest areaunder sustainable forestmanagement, Primarydesignated function.
1995, 2005, 2010 Land cover and statisticalinformation
2 Inventário Florestal daRegião Autónoma dos Açores(IFRAA) (Regional ForestInventory)
Area of permanent forestestate, Forest area withinprotected areas, Forest areaunder sustainable forestmanagement, Primarydesignated function.
2007 Land cover and statisticalinformation
3 1.º Inventário Florestalda Região Autónoma daMadeira (IFRAM1) (regionalforest inventory)
Area of permanent forestestate, Forest area withinprotected areas, Forest areaunder sustainable forestmanagement, Primarydesignated function.
2004 Land cover and statisticalinformation

FRA 2015 – Country Report, Portugal
28
4 Rede Nacional de Matase Perímetros Florestais -RNMPF (national networkof forest areas managed bynational and regional forestagencies)
Area of permanentforest estate, Forest areaunder sustainable forestmanagement, Forest area withmanagement plan, Primarydesignated function
N/A Cartographic information
4.2.2 Classification and definitions
National class Definition
Forest areas within protected areas Forest areas within Rede Natura 2000 and forest areas withinRede Nacional de Áreas Protegidas (national protected areasnetwork).
N/A N/A
N/A N/A
N/A N/A
4.2.3 Original data
Territory Category Area (1000 ha)
Reference year 2005
Production 1997
Protection of soil andwater
187
Conservation ofbiodiversity
145
Multiple use 1018
Other (please specifyin comments below thetable)
0.00
No / unknown 0.00
Mainland territory
Total 3347
Reference year 2007
Production 17.4
Autonomous Region ofAzores
Protection of soil andwater
28.3

FRA 2015 – Country Report, Portugal
29
Conservation ofbiodiversity
9.49
Social use/Multiple use 0.69
Other (please specifyin comments below thetable)
0.00
No / unknown 0.00
Total 56.0
Reference year 2004
Production 0.00
Protection of soil andwater
16.5
Conservation ofbiodiversity
16.1
Multiple use 0.00
Other (please specifyin comments below thetable)
0.00
No / unknown 0.00
Autonomous Region ofMadeira
Total 32.7
Territory Category Area (1000 ha)
Reference year 1995 2005
Area ofpermanent forestestate
1391 1237
Forest area withinprotected areas
616 648
Mainland territory
Forest area undersustainable forestmanagement
1590 1419

FRA 2015 – Country Report, Portugal
30
Reference year 2007
Area ofpermanent forestestate
15.8
Forest area withinprotected areas
23.6
AutonomousRegion of Azores
Forest area undersustainable forestmanagement
20.3
Reference year 2004
Area ofpermanent forestestate
20.9
Forest area withinprotected areas
24.4
AutonomousRegion ofMadeira
Forest area undersustainable forestmanagement
17.5
4.3 Analysis and processing of national data
4.3.1 Adjustment
4.3.2 Estimation and forecasting
The year 1990 values were extrapolated from the NFI6 (1995) and NFI (2005). The year 2000 values wereinterpolated from the NFI6 (1995) and NFI6 (2005). The year 2015 forest forecasted values were extrapolatedfrom the NFI (2005) and NFI6 (2010).
These values were finally interpolated to total national forest refered on tabela 1a), taking in considerationAçores, Madeira e Continental mainland.

FRA 2015 – Country Report, Portugal
31
4.3.3 Reclassification
For the mainland territory , the table T4a figures for the year 2010 were calculated, assuming IFN6 data (1995,2005 e 2010):
- Pinus pinaster, Eucalyptus globulus and other coniferous stands (less Pinus pinea) belong to Production Forestcategories
- Quercus stands, Pinus pinea, Castanea sativa, Ceratonia siliqua and other broadleaves stands belong to MultipleUse Forest categorie
4.4 DataTable 4a
Forest area (000 hectares)Categories
1990 2000 2005 2010 2015
Production forest 1864.008 1766.621 1702.901 1647.837 1586.598
Multiple useforest
1305.293 1309.68 1112.09 1067.573 1071.812
Table 4b
Rank Name of product Key species
Commercial valueof NWFP removals
2010 (value 1000local currency)
NWFP category
1 st Cork Quercus suber 147000 8
2 nd Pinecone fruit Pinus pinea 43076.9 8
3 rd Chestnut Castanea sativa 32668.5 1
4 th Wild mushrooms several species 22750 1
5 th Honey N/A 16857.02 11
6 th Resin Pinus pinaster 6687.6 7
7 th Carob Ceratonia siliqua 6436.25 8
8 th N/A N/A N/A N/A
9 th N/A N/A N/A N/A
10 th N/A N/A N/A N/A
TOTAL 275476.27

FRA 2015 – Country Report, Portugal
32
2010
Name of local currency euro
Category
Plant products / raw material
1 Food
2 Fodder
3 Raw material for medicine and aromatic products
4 Raw material for colorants and dyes
5 Raw material for utensils handicrafts construction
6 Ornamental plants
7 Exudates
8 Other plant products
Animal products / raw material
9 Living animals
10 Hides skins and trophies
11 Wild honey and beewax
12 Wild meat
13 Raw material for medicine
14 Raw material for colorants
15 Other edible animal products
16 Other non-edible animal products
Table 4c Pre-filled data from FAOSTAT
FRA 2015 category (1000 m 3 u.b.)Year
Total wood removals ...of which woodfuel
1990 11205 500
1991 10809 500

FRA 2015 – Country Report, Portugal
33
1992 10278 500
1993 10207 500
1994 9819 500
1995 9350 500
1996 8978 550
1997 8978 550
1998 8548 600
1999 8978 600
2000 10831 600
2001 8946 600
2002 8742 600
2003 9673 600
2004 10869 600
2005 10746.2 600
2006 10804.6 600
2007 10822.9 600
2008 10168.7 600
2009 9564.1 600
2010 9648.4 600
2011 9139.8 600
Tiers
Category Tier for status Tier for reported trend
Production forest Tier 3 Tier 3
Multiple use forest Tier 1 Tier 1
Tier Criteria
Category Tier for status Tier for reported trend
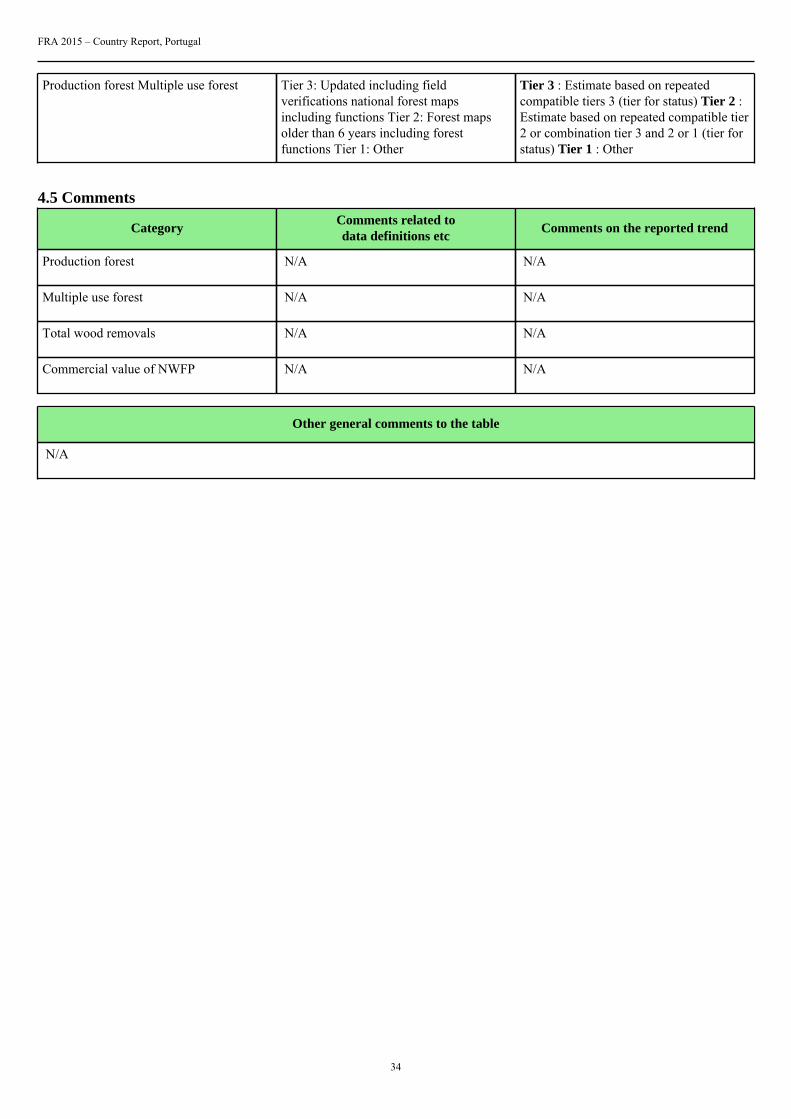
FRA 2015 – Country Report, Portugal
34
Production forest Multiple use forest Tier 3: Updated including fieldverifications national forest mapsincluding functions Tier 2: Forest mapsolder than 6 years including forestfunctions Tier 1: Other
Tier 3 : Estimate based on repeatedcompatible tiers 3 (tier for status) Tier 2 :Estimate based on repeated compatible tier2 or combination tier 3 and 2 or 1 (tier forstatus) Tier 1 : Other
4.5 Comments
CategoryComments related todata definitions etc
Comments on the reported trend
Production forest N/A N/A
Multiple use forest N/A N/A
Total wood removals N/A N/A
Commercial value of NWFP N/A N/A
Other general comments to the table
N/A

FRA 2015 – Country Report, Portugal
35
5. How much forest area is managed for protection of soil and water and ecosystemservices?Documents for this question:
• Guide for country reporting FRA 2015• FRA 2015 Terms and Definitions
5.1 Categories and definitions
Category Definition
Protection of soil andwater
Forest area designated or managed for protection of soil and water
...of which productionof clean water (sub-category)
Forest area primarily designated or managed for water production, where most human uses are excludedor heavily modified to protect water quality.
...of which coastalstabilization (sub-category)
Forest area primarily designated or managed for coastal stabilization.
...of which desertificationcontrol (sub-category)
Forest area primarily designated or managed for desertification control.
...of which avalanchecontrol (sub-category)
Forest area primarily designated or managed to prevent the development or impact of avalanches onhuman life assets or infrastructure.
...of which erosion, floodprotection or reducingflood risk (sub-category)
Forest area primarily designated or managed for protecting communities or assets from the impacts oferosion riparian floods and landslides or for providing flood plain services.
...of which other (sub-category)
Forest area primarily designated or managed for other protective functions.
Ecosystem services,cultural or spiritual values
Forest area primarily designated or managed for selected ecosystem services or cultural or spiritualvalues.
...of which publicrecreation (sub-category)
Forest area designated or managed for public recreation.
...of which carbon storageor sequestration (sub-category)
Forest area designated or managed for carbon storage or sequestration.
...of which spiritual orcultural services (sub-category)
Forest area designated or managed for spiritual or cultural services.
...of which other (sub-category)
Forest area designated or managed for other ecosystem services.
5.2 National data
5.2.1 Data sources
References to sourcesof information
Variables Years Additional comments
1 6 º Inventário FlorestalNacional (IFN6)
Forest 2010 Mainland (continentalterritorial). The NIF6 areadata were collected in 2012

FRA 2015 – Country Report, Portugal
36
2 N/A N/A N/A N/A
3 N/A N/A N/A N/A
4 N/A N/A N/A N/A
5.2.2 Classification and definitions
National class Definition
N/A N/A
N/A N/A
N/A N/A
N/A N/A
5.2.3 Original data
5.3 Analysis and processing of national data
5.3.1 Adjustment
Portugal doesn´t have forest stands specifically managed towards the targets above presented.Therefore, weconsider that is adequate to consider that:
- "Forest area primarily designated or managed for coastal stabilization", the forested coastal area, includingthe dune sites.
- "Forest area primarily designated or managed for protecting communities or assets from the impacts of erosionriparian floods and landslides or for providing flood plain services",the forest area sites that have slope above30% plus forest mountain areas (altitude above 800 meters) and forest installed to protect river and hidric lines,as well as public water reservoirs.
The above mentioned values are refered to mainland territory (continental).
On what concerns Azores and Madeira, a estimation of 28300 ha (Açores) and 16500 ha (Madeira), concerningforest for protection of soil and water, was added to "Protection of soil and water" total, along the period (1990to 2015).

FRA 2015 – Country Report, Portugal
37
5.3.2 Estimation and forecasting
- "Forest area primarily designated or managed for coastal stabilization" - it is assumed that the this forestcategory is much stabilized along the last decades. So the value from 1990 to 2010 is the same and the trend to2015 is also the same, because is not expected to have changes on this forest category.
5.3.3 Reclassification
5.4 DataTable 5a
Forest area (1000 hectares)Categories
1990 2000 2005 2010 2015
Protection of soiland water
309.699 309.699 354.009 380 380
... of whichproduction ofclean water
N/A N/A N/A N/A N/A
... of whichcoastalstabilization
43 43 43 43 43
... of whichdesertificationcontrol
N/A N/A N/A N/A N/A
... of whichavalanchecontrol
0 0 0 0 0
... of whicherosion, floodprotection orreducing floodrisk
266.699 266.699 311.009 337 337
... of which other(please specifyin commentsbelow the table)
N/A N/A N/A N/A N/A
Other

FRA 2015 – Country Report, Portugal
38
N/A
Table 5b
Forest area (1000 hectares)Categories
1990 2000 2005 2010 2015
Ecosystem services,cultural or spiritualvalues
N/A N/A N/A N/A N/A
...of which publicrecreation
N/A N/A N/A N/A N/A
...of whichcarbon storage orsequestration
N/A N/A N/A N/A N/A
...of which spiritualor cultural services
N/A N/A N/A N/A N/A
...of which other(please specify incomments belowthe table)
N/A N/A N/A N/A N/A
Tiers
Category Tier for reported trend Tier for status
Protection of soil and water Tier 3 Tier 3
Ecosystem services, cultural or spiritualvalues
N/A N/A
Tier criteria
Category Tier for status Tier for reported trend
Protection of soil and water Tier 3: High reliability data derived eitherfrom high intensity sample survey or dataobtained from national or state agenciesresponsible for regulations or legislationrelating to soil and water protection. Tier2: Approaches based on low intensityor incomplete sample-based surveys orstudies that provide data for specific areasthat is extrapolated through statisticalanalysis to national level estimates. Tier 1:Other
Tier 3 : Estimate based on repeatedcompatible tiers 3 (tier for status) Tier 2 :Estimate based on repeated compatible tier2 or combination tier 3 and 2 or 1 (tier forstatus) Tier 1 : Other

FRA 2015 – Country Report, Portugal
39
• Cultural or spiritual values• Public recreation• Spiritual or cultural services• Other
Tier 3: High reliability data derivedeither from high intensity sample surveyor data obtained from national or stateagencies responsible for regulations. Tier2: Approaches based on low intensityor incomplete sample-based surveys orstudies that provide data for specific areasthat is extrapolated through statisticalanalysis to national level estimates. Tier 1:Other
Tier 3 : Estimate based on repeatedcompatible tiers 3 (tier for status) Tier 2 :Estimate based on repeated compatible tier2 or combination tier 3 and 2 or 1 (tier forstatus) Tier 1 : Other
5.5 Comments
CategoryComments related todata definitions etc
Comments on the reported trend
Protection of soil and water N/A N/A
Production of clean water N/A N/A
Coastal stabilization N/A N/A
Desertification control N/A N/A
Avalanche control N/A N/A
Erosion, flood protection or reducing floodrisk
N/A N/A
Other protective functions N/A N/A
Ecosystem services, cultural or spiritualvalues
N/A N/A
Public recreation N/A N/A
Carbon storage or sequestration N/A N/A
Spiritual or cultural services N/A N/A
Other ecosystem services N/A N/A
Other general comments to the table
N/A
FRA 2015 – Country Report, Portugal
40
6. How much forest area is protected and designated for the conservation of biodiversityand how has it changed over time?Documents for this question:
• Guide for country reporting FRA 2015• FRA 2015 Terms and Definitions
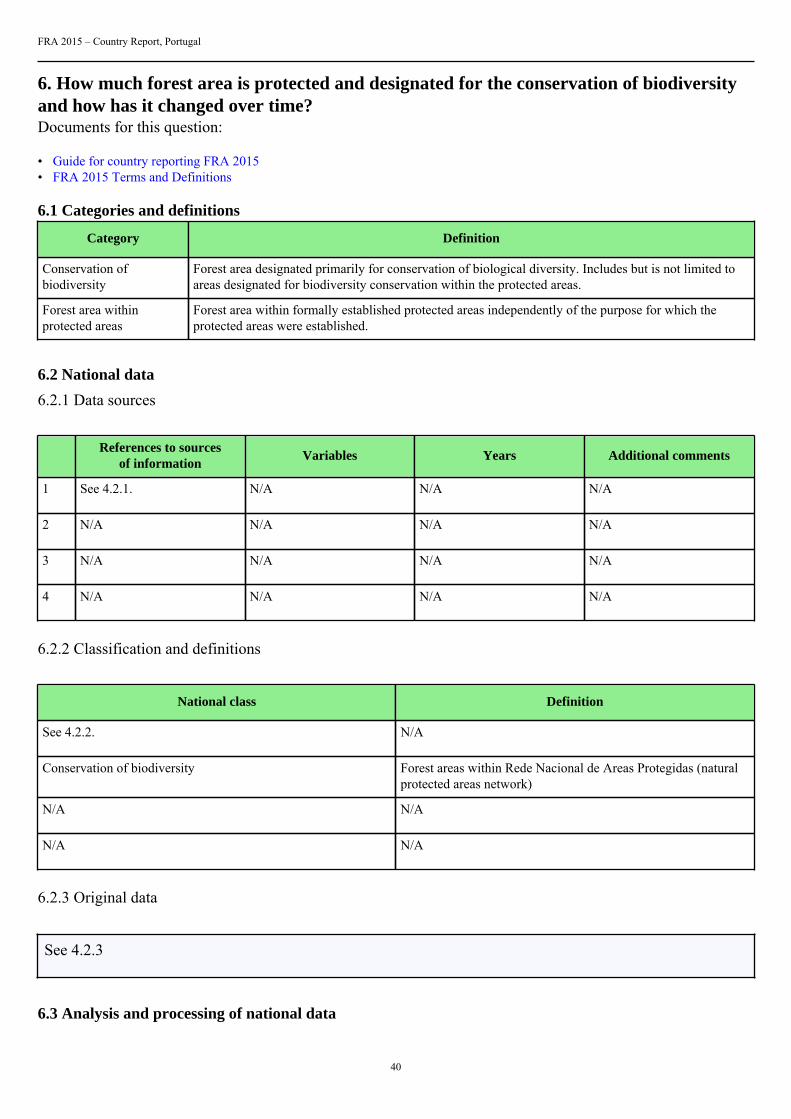
6.1 Categories and definitions
Category Definition
Conservation ofbiodiversity
Forest area designated primarily for conservation of biological diversity. Includes but is not limited toareas designated for biodiversity conservation within the protected areas.
Forest area withinprotected areas
Forest area within formally established protected areas independently of the purpose for which theprotected areas were established.
6.2 National data
6.2.1 Data sources
References to sourcesof information
Variables Years Additional comments
1 See 4.2.1. N/A N/A N/A
2 N/A N/A N/A N/A
3 N/A N/A N/A N/A
4 N/A N/A N/A N/A
6.2.2 Classification and definitions
National class Definition
See 4.2.2. N/A
Conservation of biodiversity Forest areas within Rede Nacional de Areas Protegidas (naturalprotected areas network)
N/A N/A
N/A N/A
6.2.3 Original data
See 4.2.3
6.3 Analysis and processing of national data

FRA 2015 – Country Report, Portugal
41
6.3.1 Adjustment
6.3.2 Estimation and forecasting
See 4.2.3
6.3.3 Reclassification
6.4 DataTable 6
Forest area (000 hectares)Categories
1990 2000 2005 2010 2015
Conservation ofbiodiversity
N/A N/A 170 186.59 186.59
Forest areawithin protectedareas
N/A 681 697 672.75 672.75
Tiers
Category Tier for status Tier for reported trend
Conservation of biodiversity Tier 3 Tier 3
Forest area within protected areas Tier 3 Tier 3
Tier criteria
Category Tier for status Tier for reported trend
• Conservation of biodiversity• Forests within protected areas
Tier 3: Data obtained from national orstate agencies responsible for conservationand protected area or legislation relatingto area protection. Tier 2: Studies thatprovide data for specific areas that isextrapolated through statistical analysis tonational level estimates Tier 1 Other
Tier 3 : Estimate based on repeatedcompatible tiers 3 (tier for status) Tier 2 :Estimate based on repeated compatible tier2 or combination tier 3 and 2 or 1 (tier forstatus) Tier 1 : Other
6.5 Comments
CategoryComments related todata definitions etc
Comments on the reported trend
Conservation of biodiversity Mainland/continenta territorial valuesplus Azores and Madeira areas
N/A
FRA 2015 – Country Report, Portugal
42
Forest area within protected areas Mainland/continenta territorial valuesplus Azores and Madeira areas
N/A
Other general comments to the table
Forest area has decreased in 2010 due to a high rate of forest fires in previous years. Not expected that such a high rate of forestfires will occur again
FRA 2015 – Country Report, Portugal
43
7. What is the area of forest affected by woody invasive species?Documents for this question:
• Guide for country reporting FRA 2015• FRA 2015 Terms and Definitions
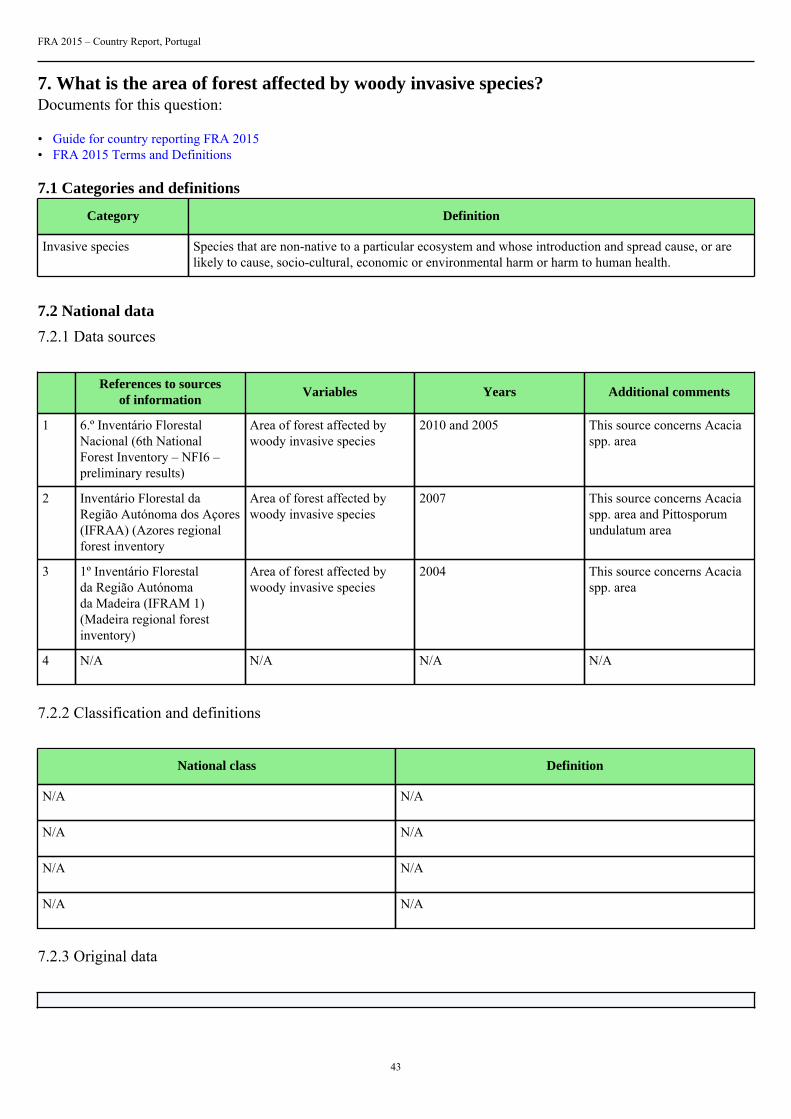
7.1 Categories and definitions
Category Definition
Invasive species Species that are non-native to a particular ecosystem and whose introduction and spread cause, or arelikely to cause, socio-cultural, economic or environmental harm or harm to human health.
7.2 National data
7.2.1 Data sources
References to sourcesof information
Variables Years Additional comments
1 6.º Inventário FlorestalNacional (6th NationalForest Inventory – NFI6 –preliminary results)
Area of forest affected bywoody invasive species
2010 and 2005 This source concerns Acaciaspp. area
2 Inventário Florestal daRegião Autónoma dos Açores(IFRAA) (Azores regionalforest inventory
Area of forest affected bywoody invasive species
2007 This source concerns Acaciaspp. area and Pittosporumundulatum area
3 1º Inventário Florestalda Região Autónomada Madeira (IFRAM 1)(Madeira regional forestinventory)
Area of forest affected bywoody invasive species
2004 This source concerns Acaciaspp. area
4 N/A N/A N/A N/A
7.2.2 Classification and definitions
National class Definition
N/A N/A
N/A N/A
N/A N/A
N/A N/A
7.2.3 Original data

FRA 2015 – Country Report, Portugal
44
7.3 Analysis and processing of national data
7.3.1 Adjustment
7.3.2 Estimation and forecasting
7.3.3 Reclassification
7.4 DataTable 7
Forest area affected (000 ha)Scientific name of
woody invasive species2005 2010
Acacia spp. 14.5 15.2
Pittosporum undulatum 29.9 29.9
N/A N/A N/A
N/A N/A N/A
N/A N/A N/A
N/A N/A N/A
N/A N/A N/A
N/A N/A N/A
N/A N/A N/A
N/A N/A N/A
Total 44.4 45.1
Tiers
Category Tier for status Tier for reported trend
Invasive species Tier 3 Tier 3
Tier Criteria
Category Tier for status Tier for reported trend

FRA 2015 – Country Report, Portugal
45
Invasive species Tier 3: Systematic assessment in forestinventory or other survey (e.g. byconservation department) within the last5 years) Tier 2: Systematic assessment inforest inventory or other survey (e.g. byconservation department conducted morethan 5 years ago) Tier 1: Other
Tier 3 : Estimate based on repeatedcompatible tiers 3 (tier for status) Tier 2 :Estimate based on repeated compatible tier2 or combination tier 3 and 2 or 1 (tier forstatus) Tier 1 : Other
7.5 Comments
CategoryComments related todata definitions etc
Comments on the reported trend
Invasive species N/A N/A
Other general comments to the table
N/A

FRA 2015 – Country Report, Portugal
46
8. How much forest area is damaged each year?Documents for this question:
• Guide for country reporting FRA 2015• FRA 2015 Terms and Definitions
8.1 Categories and definitions
Category Definition
Number of fires Number of fires per year
Burned area Area burned per year
Outbreaks of insects A detectable reduction in forest health caused by a sudden increase in numbers of harmful insects.
Outbreaks of diseases A detectable reduction in forest health caused by a sudden increase in numbers of harmful pathogens,such as bacteria, fungi, phytoplasma or virus.
Severe weather events Damage caused severe weather events, such as snow, storm, drought, etc.
8.2 National data
8.2.1 Data sources
References to sourcesof information
Variables Years Additional comments
1 ICNF/Forest FocusRegulation
Disturbances areas; Majoroutbreaks
1990, 2000, 2003, 2004,2005, 2006, 2007, 2007,2008, 2009, 2010, 2011, 2012
N/A
2 ICNF/Severe weather events Disturbances areas 2013 N/A
3 N/A N/A N/A N/A
4 N/A N/A N/A N/A
8.2.2 Classification and definitions
National class Definition
Number of fires of which forest area burned Number of fires with burned forest area exclusively
Area damaged by Pinewood Nematode (PWN) /Bursaphelenchus xylophilus
Area of coniferous stands damaged by PWN
Area damaged by Gonipterus spp. Area of damaged Eucalyptus stands
N/A N/A

FRA 2015 – Country Report, Portugal
47
8.2.3 Original data
8.3 Analysis and processing of national data
8.3.1 Adjustment
8.3.2 Estimation and forecasting
8.3.3 Reclassification
On what concerns PWN, in 2005, Portugal has submited 519 000 hectares which reflected the territorial area with intervention (Setubal Peninsula and Centro) where disease showed up.
In 2010, the area now submited is 193.000 hectares which reflects the area of coniferous stands damaged byPWN.
In 2005, the area of coniferous stands damaged by PWN was 47 335 hectares.
8.4 DataTable 8a
000 ha, number of fires
2003 2004 2005 2006 2007Category
000 ha # 000 ha # 000 ha # 000 ha # 000 ha #
Totalland areaburned
426 26219 130 22165 339 35823 76 20444 33 20316
... ofwhichforestareaburned
286 6705 56 5382 214 9187 36 4349 10 2853
2008 2009 2010 2011 2012Category
000 ha # 000 ha # 000 ha # 000 ha # 000 ha #
Totalland areaburned
18 14930 87 26136 133 22028 74 25222 110 21179

FRA 2015 – Country Report, Portugal
48
... ofwhichforestareaburned
5 2089 24 3924 46 3523 20 4440 48 4385
Table 8b
Outbreak category Description/name Year(s) of latest outbreak Area damaged (000 hectares)
1 Gonipterus spp. 2012 130
2 Pinewood Nematode (PWN) /Bursaphelenchus xylophilus
2012 193
3 Storm, January 2013 2013 28
N/A N/A N/A N/A
N/A N/A N/A N/A
N/A N/A N/A N/A
N/A N/A N/A N/A
N/A N/A N/A N/A
N/A N/A N/A N/A
N/A N/A N/A N/A
Outbreak category
1 Insects
2 Diseases
3 Severe weather events
Tiers
Category Tier for status Tier for trend
Area affected by fire N/A N/A
• Insects• Diseases• Severe weather events
N/A N/A
Tier criteria
Category Tier for status Tier for reported trend

FRA 2015 – Country Report, Portugal
49
Burned area Tier 3 : National fire monitoring routinesTier 2 : Remote sensing surveys Tier 1 :Other
Tier 3 : Estimate based on repeatedcompatible tiers 3 (tier for status) Tier 2 :Estimate based on repeated compatible tier2 or combination tier 3 and 2 or 1 (tier forstatus) Tier 1 : Other
• Insects• Diseases• Severe weather events
Tier 3 : Systematic survey (e.g. viainventory or aerial damage assessment)Tier 2 : Management records Tier 1 :Other
Tier 3 : Estimate based on repeatedcompatible tiers 3 (tier for status) Tier 2 :Estimate based on repeated compatible tier2 or combination tier 3 and 2 or 1 (tier forstatus) Tier 1 : Other
8.5 Comments
CategoryComments related todata definitions etc
Comments on the reported trend
Burned area N/A N/A
Insects Gonipterus spp. N/A
Diseases Pinewood Nematode (PWN)/Bursaphelenchus xylophilus
N/A
Severe weather events Area affected in mainland by a severeweather event (January 2013). A stom thatoccured mainly during 18th and 19th ofJanuary with winds that reached 140 km.
N/A
Other general comments to the table
N/A
FRA 2015 – Country Report, Portugal
50
9. What is the forest area with reduced canopy cover?Documents for this question:
• Guide for country reporting FRA 2015• FRA 2015 Terms and Definitions
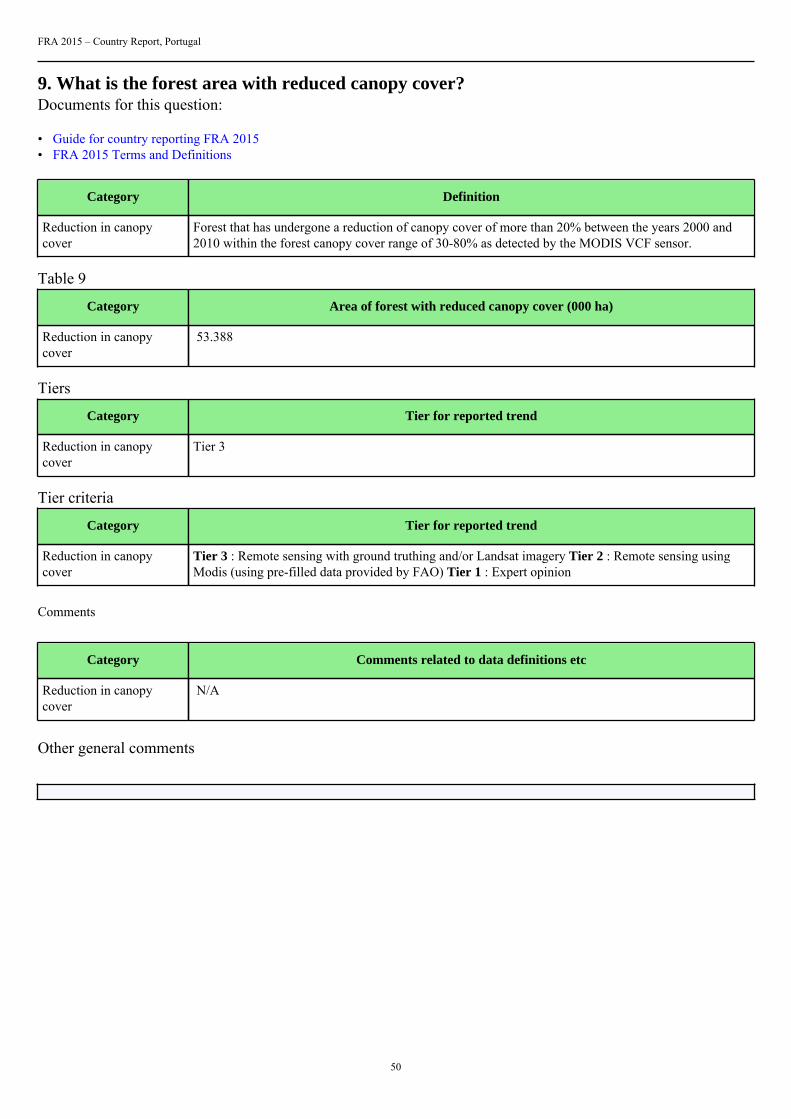
Category Definition
Reduction in canopycover
Forest that has undergone a reduction of canopy cover of more than 20% between the years 2000 and2010 within the forest canopy cover range of 30-80% as detected by the MODIS VCF sensor.
Table 9
Category Area of forest with reduced canopy cover (000 ha)
Reduction in canopycover
53.388
Tiers
Category Tier for reported trend
Reduction in canopycover
Tier 3
Tier criteria
Category Tier for reported trend
Reduction in canopycover
Tier 3 : Remote sensing with ground truthing and/or Landsat imagery Tier 2 : Remote sensing usingModis (using pre-filled data provided by FAO) Tier 1 : Expert opinion
Comments
Category Comments related to data definitions etc
Reduction in canopycover
N/A
Other general comments

FRA 2015 – Country Report, Portugal
51
10. What forest policy and regulatory framework exists to support implementation ofsustainable forest management SFM?Documents for this question:
• Guide for country reporting FRA 2015• FRA 2015 Terms and Definitions
10.1 Categories and definitions
Category Definition
Policies supportingsustainable forestmanagement
Policies or strategies that explicitly encourage sustainable forest management.
Legislation andregulations supportingsustainable forestmanagement
Legislation and regulations that govern and guide sustainable forest management, operations and use.
10.2 National data
10.2.1 Data sources
References to sourcesof information
Variables Years Additional comments
1 N/A N/A N/A N/A
2 N/A N/A N/A N/A
3 N/A N/A N/A N/A
4 N/A N/A N/A N/A
10.2.2 Classification and definitions
National class Definition
N/A N/A
N/A N/A
N/A N/A
N/A N/A
10.2.3 Original data
10.3 Data
FRA 2015 – Country Report, Portugal
52
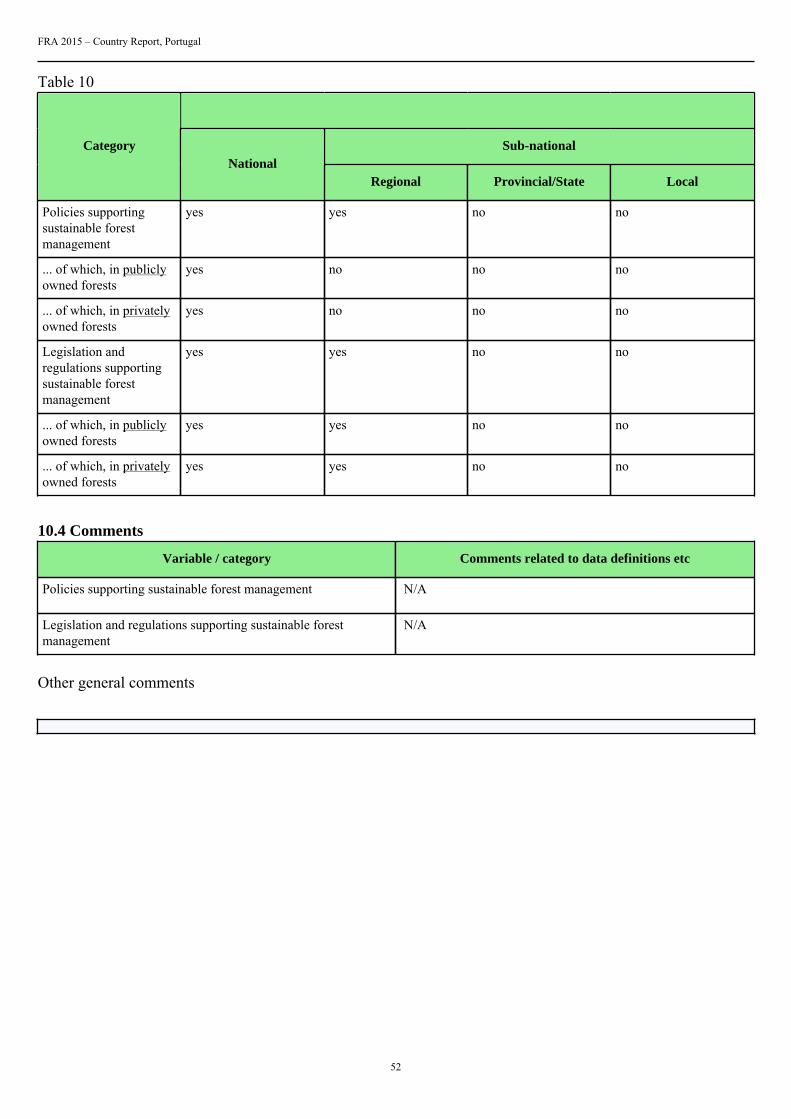
Table 10
Sub-nationalCategoryNational
Regional Provincial/State Local
Policies supportingsustainable forestmanagement
yes yes no no
... of which, in publiclyowned forests
yes no no no
... of which, in privatelyowned forests
yes no no no
Legislation andregulations supportingsustainable forestmanagement
yes yes no no
... of which, in publiclyowned forests
yes yes no no
... of which, in privatelyowned forests
yes yes no no
10.4 Comments
Variable / category Comments related to data definitions etc
Policies supporting sustainable forest management N/A
Legislation and regulations supporting sustainable forestmanagement
N/A
Other general comments
FRA 2015 – Country Report, Portugal
53
11. Is there a national platform that promotes stakeholder participation in forest policydevelopment?Documents for this question:
• Guide for country reporting FRA 2015• FRA 2015 Terms and Definitions
11.1 Categories and definitions
Category Definition
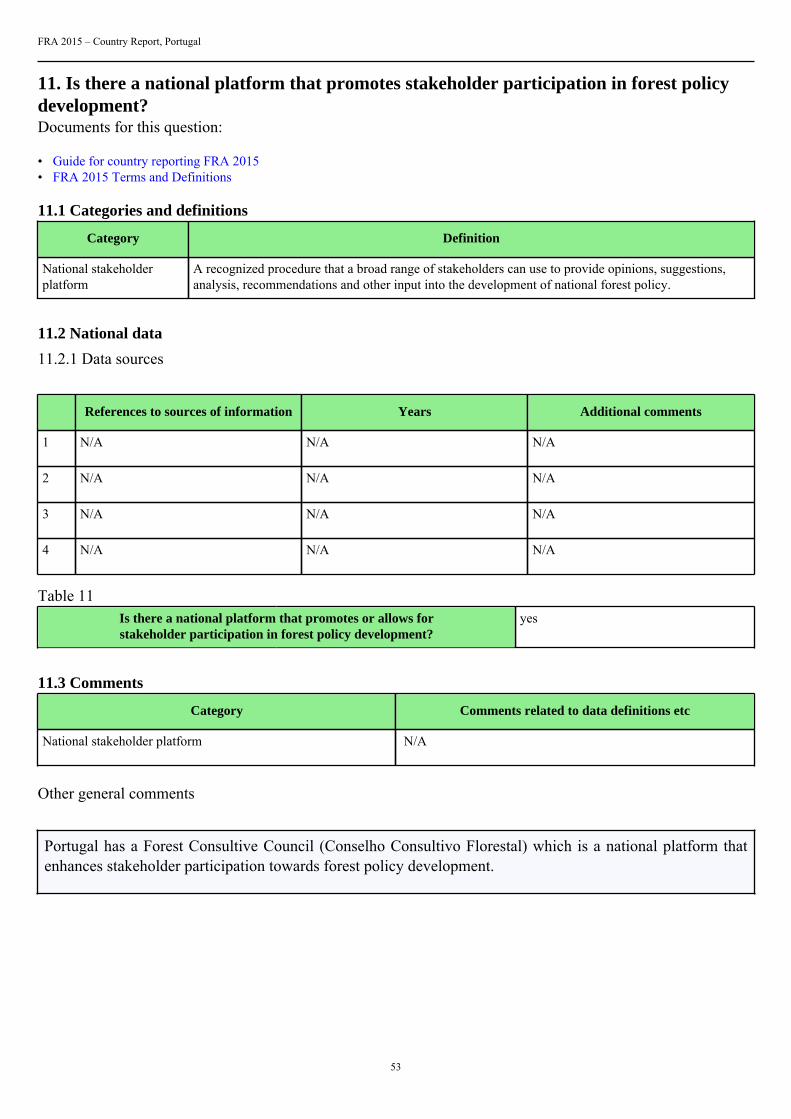
National stakeholderplatform
A recognized procedure that a broad range of stakeholders can use to provide opinions, suggestions,analysis, recommendations and other input into the development of national forest policy.
11.2 National data
11.2.1 Data sources
References to sources of information Years Additional comments
1 N/A N/A N/A
2 N/A N/A N/A
3 N/A N/A N/A
4 N/A N/A N/A
Table 11Is there a national platform that promotes or allows forstakeholder participation in forest policy development?
yes
11.3 Comments
Category Comments related to data definitions etc
National stakeholder platform N/A
Other general comments
Portugal has a Forest Consultive Council (Conselho Consultivo Florestal) which is a national platform thatenhances stakeholder participation towards forest policy development.
FRA 2015 – Country Report, Portugal
54
12. What is the forest area intended to be in permanent forest land use and how has itchanged over time?Documents for this question:
• Guide for country reporting FRA 2015• FRA 2015 Terms and Definitions
12.1 Categories and definitions
Category Definition
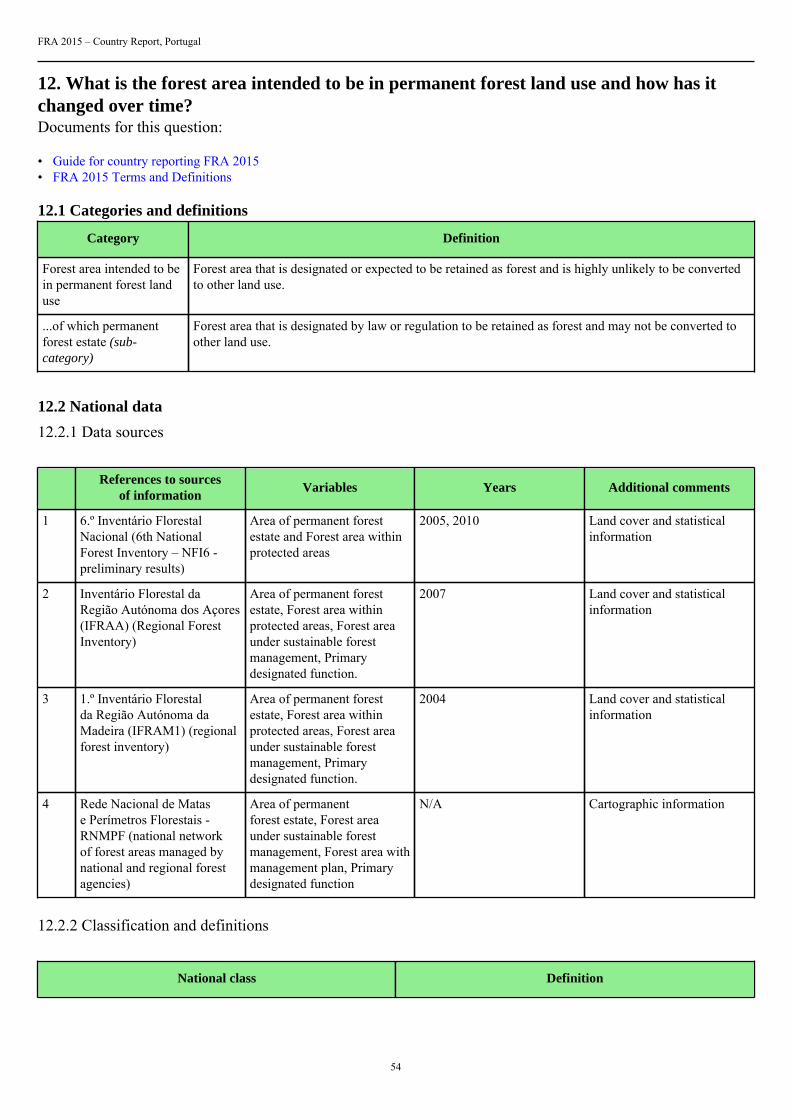
Forest area intended to bein permanent forest landuse
Forest area that is designated or expected to be retained as forest and is highly unlikely to be convertedto other land use.
...of which permanentforest estate (sub-category)
Forest area that is designated by law or regulation to be retained as forest and may not be converted toother land use.
12.2 National data
12.2.1 Data sources
References to sourcesof information
Variables Years Additional comments
1 6.º Inventário FlorestalNacional (6th NationalForest Inventory – NFI6 -preliminary results)
Area of permanent forestestate and Forest area withinprotected areas
2005, 2010 Land cover and statisticalinformation
2 Inventário Florestal daRegião Autónoma dos Açores(IFRAA) (Regional ForestInventory)
Area of permanent forestestate, Forest area withinprotected areas, Forest areaunder sustainable forestmanagement, Primarydesignated function.
2007 Land cover and statisticalinformation
3 1.º Inventário Florestalda Região Autónoma daMadeira (IFRAM1) (regionalforest inventory)
Area of permanent forestestate, Forest area withinprotected areas, Forest areaunder sustainable forestmanagement, Primarydesignated function.
2004 Land cover and statisticalinformation
4 Rede Nacional de Matase Perímetros Florestais -RNMPF (national networkof forest areas managed bynational and regional forestagencies)
Area of permanentforest estate, Forest areaunder sustainable forestmanagement, Forest area withmanagement plan, Primarydesignated function
N/A Cartographic information
12.2.2 Classification and definitions
National class Definition
FRA 2015 – Country Report, Portugal
55
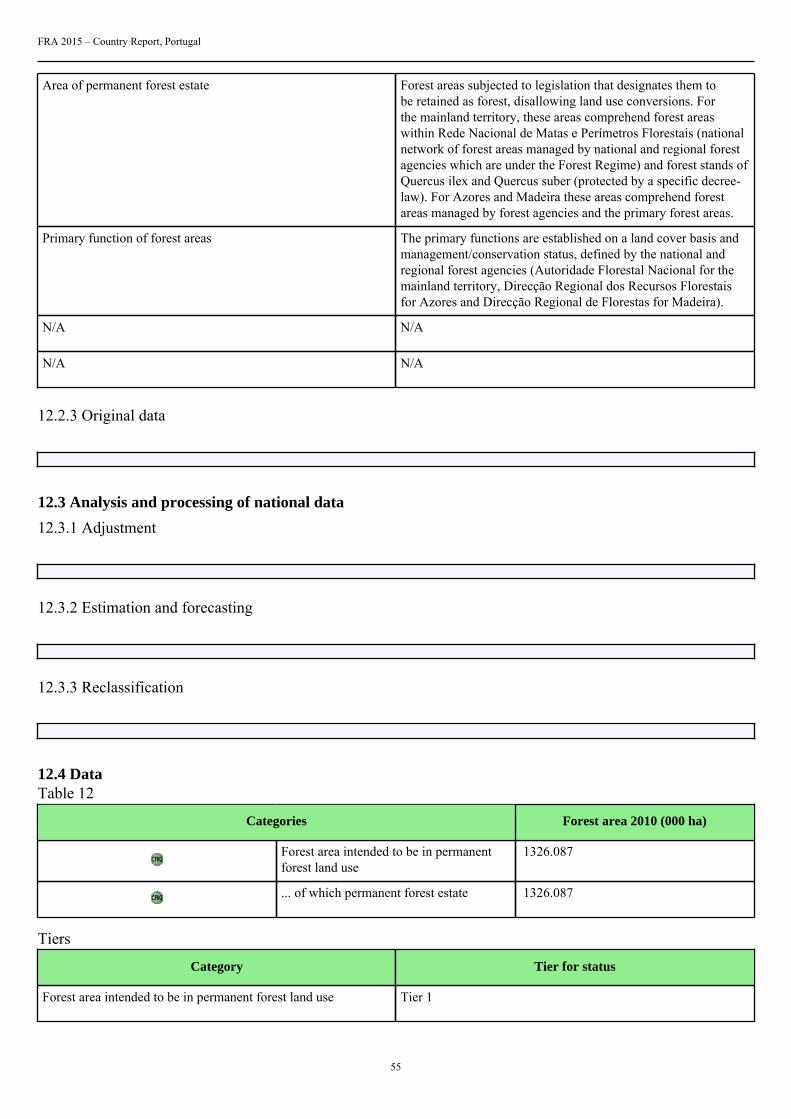
Area of permanent forest estate Forest areas subjected to legislation that designates them tobe retained as forest, disallowing land use conversions. Forthe mainland territory, these areas comprehend forest areaswithin Rede Nacional de Matas e Perímetros Florestais (nationalnetwork of forest areas managed by national and regional forestagencies which are under the Forest Regime) and forest stands ofQuercus ilex and Quercus suber (protected by a specific decree-law). For Azores and Madeira these areas comprehend forestareas managed by forest agencies and the primary forest areas.
Primary function of forest areas The primary functions are established on a land cover basis andmanagement/conservation status, defined by the national andregional forest agencies (Autoridade Florestal Nacional for themainland territory, Direcção Regional dos Recursos Florestaisfor Azores and Direcção Regional de Florestas for Madeira).
N/A N/A
N/A N/A
12.2.3 Original data
12.3 Analysis and processing of national data
12.3.1 Adjustment
12.3.2 Estimation and forecasting
12.3.3 Reclassification
12.4 DataTable 12
Categories Forest area 2010 (000 ha)
Forest area intended to be in permanentforest land use
1326.087
... of which permanent forest estate 1326.087
Tiers
Category Tier for status
Forest area intended to be in permanent forest land use Tier 1

FRA 2015 – Country Report, Portugal
56
Permanent forest estate Tier 1
Tier Criteria
Category Tier for status
Forest area intended to be in permanent forest land use Tier 3 : National or sub-national land use plans strategydocuments or other reports within the past 10 years Tier 2 :National or sub-national land use plans strategy documents orother reports within the past 20 years Tier 1 : Other
Permanent forest estate Tier 3 : National or sub-national land use plans strategydocuments or other reports within the past 10 years Tier 2 :National or sub-national land use plans strategy documents orother reports within the past 20 years Tier 1 : Other
12.5 Comments
Category Comments related to data definitions etc
Forest area intended to be in permanent forest land use N/A
Permanent forest estate N/A
Other general comments
FRA 2015 – Country Report, Portugal
57
13. How does your country measure and report progress towards SFM at the nationallevel?Documents for this question:
• Guide for country reporting FRA 2015• FRA 2015 Terms and Definitions
13.1 Categories and definitions
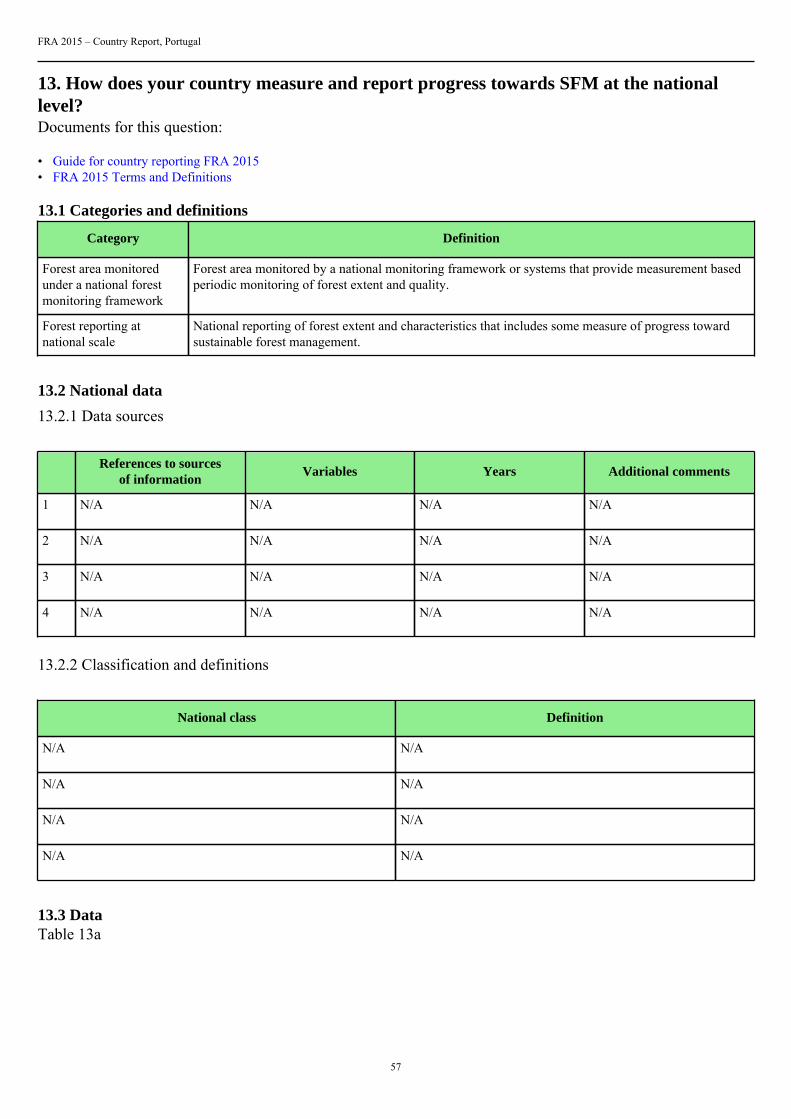
Category Definition
Forest area monitoredunder a national forestmonitoring framework
Forest area monitored by a national monitoring framework or systems that provide measurement basedperiodic monitoring of forest extent and quality.
Forest reporting atnational scale
National reporting of forest extent and characteristics that includes some measure of progress towardsustainable forest management.
13.2 National data
13.2.1 Data sources
References to sourcesof information
Variables Years Additional comments
1 N/A N/A N/A N/A
2 N/A N/A N/A N/A
3 N/A N/A N/A N/A
4 N/A N/A N/A N/A
13.2.2 Classification and definitions
National class Definition
N/A N/A
N/A N/A
N/A N/A
N/A N/A
13.3 DataTable 13a

FRA 2015 – Country Report, Portugal
58
Check all boxes that apply
Category% of totalforest area
Mostrecent year
Continuous PeriodicPermanent
groundplots
Temporaryground
plots
Aerial/remotesensingsamplebased
Aerial/remote
sensing fullcoverage
Forestinventory
100 2010 no yes no yes no yes
Other fieldassessments
N/A N/A yes no no no no no
Updatesto othersources
N/A N/A
Expertestimate
N/A N/A
Table 13b
Type of forest reporting used at national scale Check boxes that apply
1 Criteria and Indicators reporting yes
2 Periodic national state of the forest report yes
3 Other (please document) no
4 None no
Other type of forest reporting
N/A
13.4 Comments
Category Comments
N/A N/A
N/A N/A
N/A N/A
Other general comments

FRA 2015 – Country Report, Portugal
59
14. What is the area of forest under a forest management plan and how is this monitored?Documents for this question:
• Guide for country reporting FRA 2015• FRA 2015 Terms and Definitions
14.1 Categories and definitions
Category Definition
Forest area withmanagement plan
Forest area that has a long-term documented management plan, aiming at defined management goalswhich is periodically revised
...of which for production(sub-category)
Forest management plan mainly focused on production
...of which forconservation (sub-category)
Forest management plan mainly focused on conservation
Monitoring of forestmanagement plans
Government monitoring of forest management plan implementation conducted through field visits oraudits of forest management plan performance
14.2 National data
14.2.1 Data sources
References to sourcesof information
Variables Years Additional comments
1 ICNF / Forest areas withmanagement plan
Area with forest managementplan
2010 statistical information
2 N/A N/A N/A N/A
3 N/A N/A N/A N/A
4 N/A N/A N/A N/A
14.3 DataTable 14a
Forest plan type Forest area 2010 (000 ha)
Forest area with management plan 726
... of which for production 686
... of which for conservation 40
Table 14b
Indicate which (if any) of the following are required in forest management plans in your country
1 Soil and water management yes

FRA 2015 – Country Report, Portugal
60
2 High conservation value forest delineation yes
3 Social considerations community involvement yes
Table 14c
Percent of area under forest management plan that is monitored annually 5.01
Tiers
Category Tier for status
Forest area with management plan Tier 2
Percent of area under forest management plan that is monitoredannually
Tier 2
Tier criteria
Category Tier for status
Forest area with management plan Tier 3 : Reports that describe national records 5 years old or lessthat contain long-term forest monitoring plans Tier 2 : Industryor other records indicating the presence of a long-term forestmanagement plan Tier 1 : Other
Percent of area under forest management plan that is monitoredannually
Tier 3 : Government documentation of monitoring extent Tier 2: Reports from forest managers or other documental sources Tier1 : Other
14.4 Comments
Category Comments
Percent of area under forest management plan that is monitoredannually
There is no legal requirement for the government to monitorforest management plans (annually or not). However, the mainforestry operations require prior licensing and accordingly mustbe monitored / audited. In the case of forest management plansfor the Forest Estates, these are subject to continuous monitoring.
Forest area with management plan Forest areas with management plan comprehend forest areaswhich have a forest management plan approved by forestauthorities. In this definition we include private forest areas withmanagement plan and public forest estates under National ForestAuthority management.
N/A N/A
Other general comments
- Table 14b - 3 Social considerations community involvement - applyed only to forest management areas ofnational estates, communitary areas and to areas integrated in Forest Intervention Zones (ZIF).
- It is somehow "reducing" to divide forest area between "conservation aimed" and "production aimed". This isemphasized on the mediterranean forest ecossystems where both functions are usually linked.
FRA 2015 – Country Report, Portugal
61
Nevertheless, an adaptation to Portuguese reality was made:
Conservation - forest stands inside national protected areas
Production - the rest of national forest stands (includes multifunction stands)

FRA 2015 – Country Report, Portugal
62
15. How are stakeholders involved in the management decision making for publiclyowned forests?Documents for this question:
• Guide for country reporting FRA 2015• FRA 2015 Terms and Definitions
15.1 Categories and definitions
Category Definition
Stakeholder involvement Stakeholder involvement is defined as significant inputs into at least one aspect of forest management atthe operational scale
Table 15
Please indicate the type of stakeholder involvement in forest management decision making required in your country
1. Planning phase yes
2. Operations phase no
3. Review of operations no
Tiers
Category Tier for status
Type of stakeholder inputs Tier 3
Tier criteria
Category Tier for status
Type of stakeholder inputs Tier 3 : Government (national or sub-national) documentation ofstakeholder inputs Tier 2 : Government (national or subnational)requirement but stakeholder inputs not documented Tier 1 :Other
15.2 Comments
Category Comments
N/A N/A
N/A N/A
N/A N/A
FRA 2015 – Country Report, Portugal
63
Other general comments
All public forest areas ought to have a forest management plan (PGF) and are submitted to a public consultationprocess before being aproved. In this phase, it is supposed that stakeholders state their opinion about PGF.
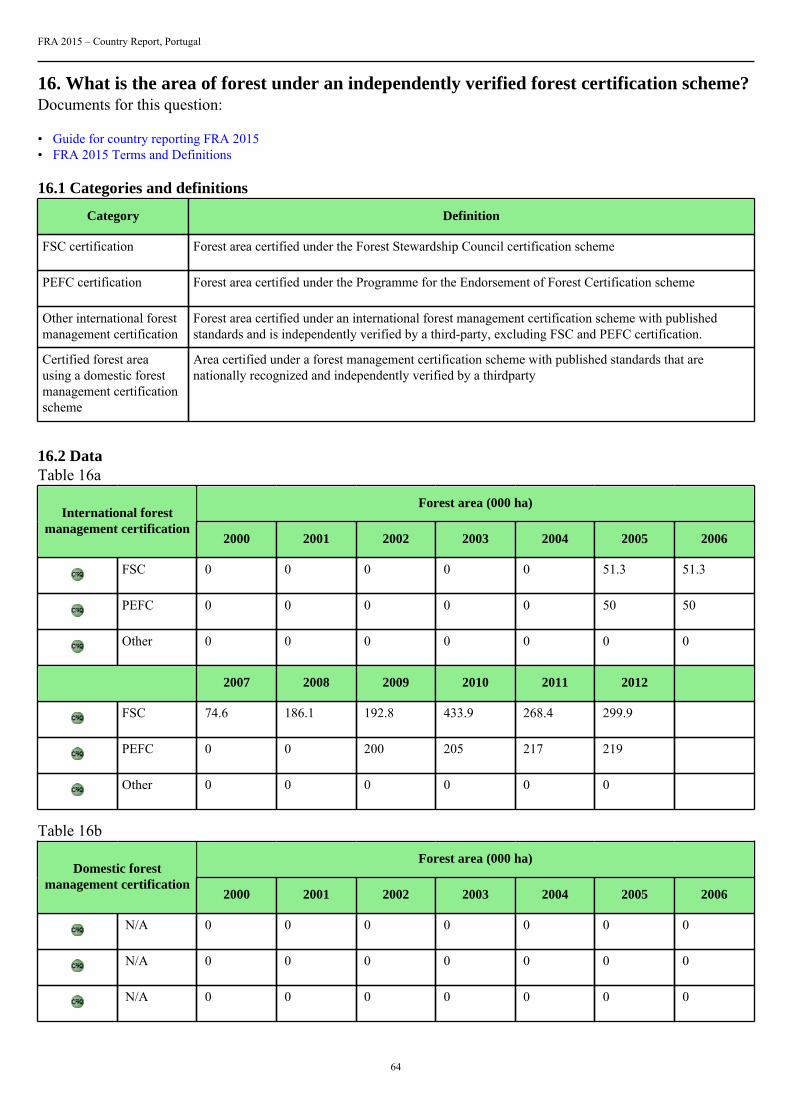
FRA 2015 – Country Report, Portugal
64
16. What is the area of forest under an independently verified forest certification scheme?Documents for this question:
• Guide for country reporting FRA 2015• FRA 2015 Terms and Definitions
16.1 Categories and definitions
Category Definition
FSC certification Forest area certified under the Forest Stewardship Council certification scheme
PEFC certification Forest area certified under the Programme for the Endorsement of Forest Certification scheme
Other international forestmanagement certification
Forest area certified under an international forest management certification scheme with publishedstandards and is independently verified by a third-party, excluding FSC and PEFC certification.
Certified forest areausing a domestic forestmanagement certificationscheme
Area certified under a forest management certification scheme with published standards that arenationally recognized and independently verified by a thirdparty
16.2 DataTable 16a
Forest area (000 ha)International forest
management certification2000 2001 2002 2003 2004 2005 2006
FSC 0 0 0 0 0 51.3 51.3
PEFC 0 0 0 0 0 50 50
Other 0 0 0 0 0 0 0
2007 2008 2009 2010 2011 2012
FSC 74.6 186.1 192.8 433.9 268.4 299.9
PEFC 0 0 200 205 217 219
Other 0 0 0 0 0 0
Table 16b
Forest area (000 ha)Domestic forest
management certification2000 2001 2002 2003 2004 2005 2006
N/A 0 0 0 0 0 0 0
N/A 0 0 0 0 0 0 0
N/A 0 0 0 0 0 0 0

FRA 2015 – Country Report, Portugal
65
2007 2008 2009 2010 2011 2012
0 0 0 0 0 0
0 0 0 0 0 0
0 0 0 0 0 0
Tier criteria
Category Tier for status
International forest management certification Tier 3: International forest management scheme recordsmaintained by the certifying organization for the reporting yearTier 2: International forest management scheme records reportedby the certifying organization for a period 2 years prior to thereporting year Tier: 1 Other
Domestic forest management certification Tier 3: National registry reports for domestic forest managementcertification maintained by the certifying organization for thereporting year Tier 2: Domestic forest management schemerecords reported by the certifying organization for a period 2years prior to the reporting year Tier: 1 Other
Tiers
Category Tier for status
International forest management certification Tier 3
Domestic forest management certification N/A
16.3 Comments
Category Comments related to data definitions etc
Certified forest area using an international forest managementcertification scheme
N/A
Domestic forest management certification N/A
Other general comments
For the time being, there are no domestic forest management certification schemes.
Annual values provided by FSC and PEFC are based on reports for July in each year. Values change frommonth to month which is why July was used for all reports.

FRA 2015 – Country Report, Portugal
66
17. How much money do governments collect from and spend on forests?Documents for this question:
• Guide for country reporting FRA 2015• FRA 2015 Terms and Definitions
17.1 Categories and definitions
Category Definition
Forest revenue All government revenue collected from the domestic production and trade of forest products andservices. For this purpose revenue include:• Goods : roundwood; sawnwood; biomass; woodbased panels; pulp and paper and non-wood forest
products.• Services : including concession fees and royalties, stumpage payments, public timber sales revenue
taxes and charges based on forest area or yield, taxes on domestic trade and export of forest products,special levies on forestry activities and payments into forest related funds, other miscellaneousinspection, licence and administrative fees levied by forest administrations, permit and licence feesfor recreation and other forest related activities.
Public expenditure onforestry
All government expenditure on forest related activities.
17.2 National data
17.2.1 Data sources
References to sourcesof information
Variables Years Additional comments
1 N/A N/A N/A N/A
2 N/A N/A N/A N/A
3 N/A N/A N/A N/A
4 N/A N/A N/A N/A
17.3 DataTable 17
Revenues / expenditures (000 local currency)Category
2000 2005 2010
Forest revenue N/A N/A N/A
Public expenditure on forestry N/A N/A N/A
2000 2005 2010
Name of Local Currency N/A N/A N/A
FRA 2015 – Country Report, Portugal
67
17.4 Comments
Category Comments related to data definitions etc
Forest revenue N/A
Public expenditure on forestry N/A
Other general comments N/A
Other general comments
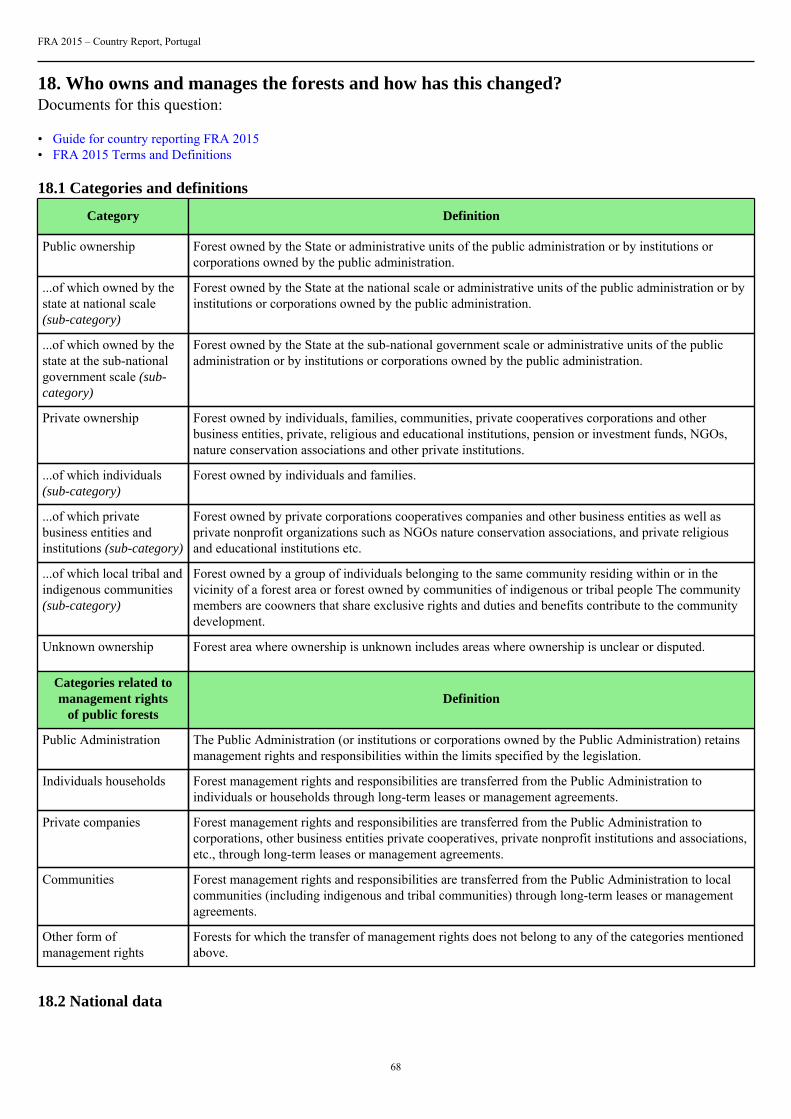
FRA 2015 – Country Report, Portugal
68
18. Who owns and manages the forests and how has this changed?Documents for this question:
• Guide for country reporting FRA 2015• FRA 2015 Terms and Definitions
18.1 Categories and definitions
Category Definition
Public ownership Forest owned by the State or administrative units of the public administration or by institutions orcorporations owned by the public administration.
...of which owned by thestate at national scale(sub-category)
Forest owned by the State at the national scale or administrative units of the public administration or byinstitutions or corporations owned by the public administration.
...of which owned by thestate at the sub-nationalgovernment scale (sub-category)
Forest owned by the State at the sub-national government scale or administrative units of the publicadministration or by institutions or corporations owned by the public administration.
Private ownership Forest owned by individuals, families, communities, private cooperatives corporations and otherbusiness entities, private, religious and educational institutions, pension or investment funds, NGOs,nature conservation associations and other private institutions.
...of which individuals(sub-category)
Forest owned by individuals and families.
...of which privatebusiness entities andinstitutions (sub-category)
Forest owned by private corporations cooperatives companies and other business entities as well asprivate nonprofit organizations such as NGOs nature conservation associations, and private religiousand educational institutions etc.
...of which local tribal andindigenous communities(sub-category)
Forest owned by a group of individuals belonging to the same community residing within or in thevicinity of a forest area or forest owned by communities of indigenous or tribal people The communitymembers are coowners that share exclusive rights and duties and benefits contribute to the communitydevelopment.
Unknown ownership Forest area where ownership is unknown includes areas where ownership is unclear or disputed.
Categories related tomanagement rights
of public forestsDefinition
Public Administration The Public Administration (or institutions or corporations owned by the Public Administration) retainsmanagement rights and responsibilities within the limits specified by the legislation.
Individuals households Forest management rights and responsibilities are transferred from the Public Administration toindividuals or households through long-term leases or management agreements.
Private companies Forest management rights and responsibilities are transferred from the Public Administration tocorporations, other business entities private cooperatives, private nonprofit institutions and associations,etc., through long-term leases or management agreements.
Communities Forest management rights and responsibilities are transferred from the Public Administration to localcommunities (including indigenous and tribal communities) through long-term leases or managementagreements.
Other form ofmanagement rights
Forests for which the transfer of management rights does not belong to any of the categories mentionedabove.
18.2 National data
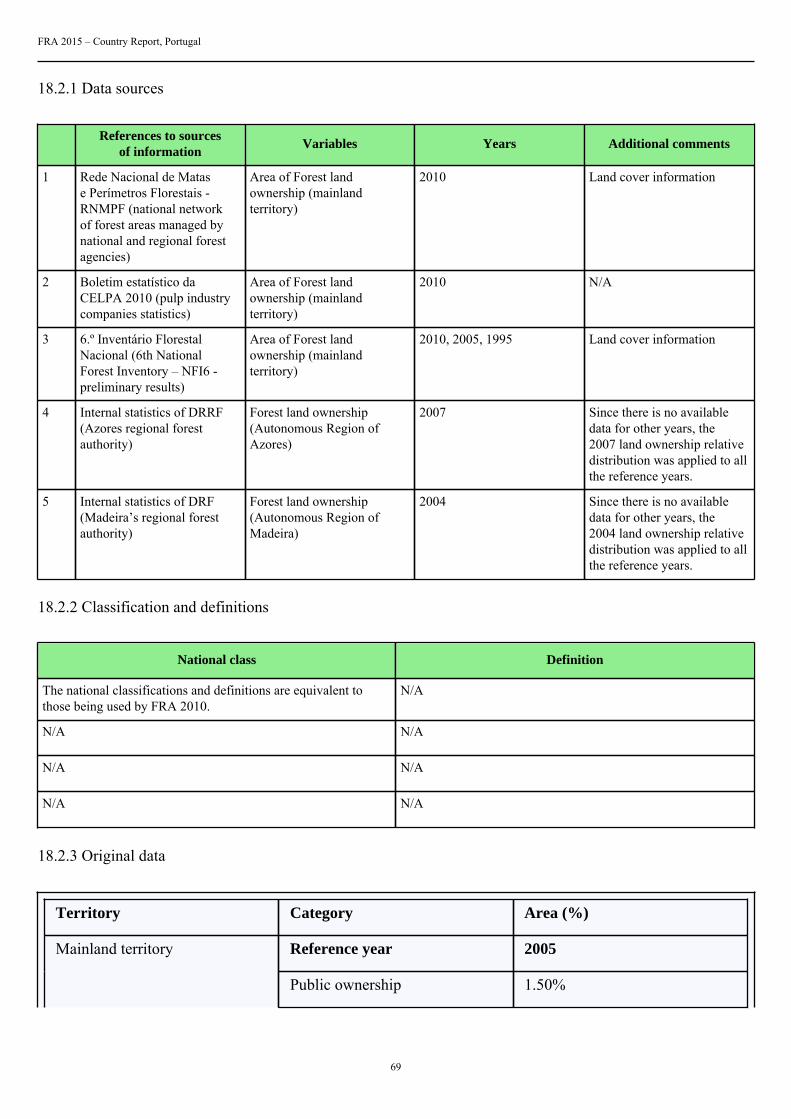
FRA 2015 – Country Report, Portugal
69
18.2.1 Data sources
References to sourcesof information
Variables Years Additional comments
1 Rede Nacional de Matase Perímetros Florestais -RNMPF (national networkof forest areas managed bynational and regional forestagencies)
Area of Forest landownership (mainlandterritory)
2010 Land cover information
2 Boletim estatístico daCELPA 2010 (pulp industrycompanies statistics)
Area of Forest landownership (mainlandterritory)
2010 N/A
3 6.º Inventário FlorestalNacional (6th NationalForest Inventory – NFI6 -preliminary results)
Area of Forest landownership (mainlandterritory)
2010, 2005, 1995 Land cover information
4 Internal statistics of DRRF(Azores regional forestauthority)
Forest land ownership(Autonomous Region ofAzores)
2007 Since there is no availabledata for other years, the2007 land ownership relativedistribution was applied to allthe reference years.
5 Internal statistics of DRF(Madeira’s regional forestauthority)
Forest land ownership(Autonomous Region ofMadeira)
2004 Since there is no availabledata for other years, the2004 land ownership relativedistribution was applied to allthe reference years.
18.2.2 Classification and definitions
National class Definition
The national classifications and definitions are equivalent tothose being used by FRA 2010.
N/A
N/A N/A
N/A N/A
N/A N/A
18.2.3 Original data
Territory Category Area (%)
Reference year 2005Mainland territory
Public ownership 1.50%
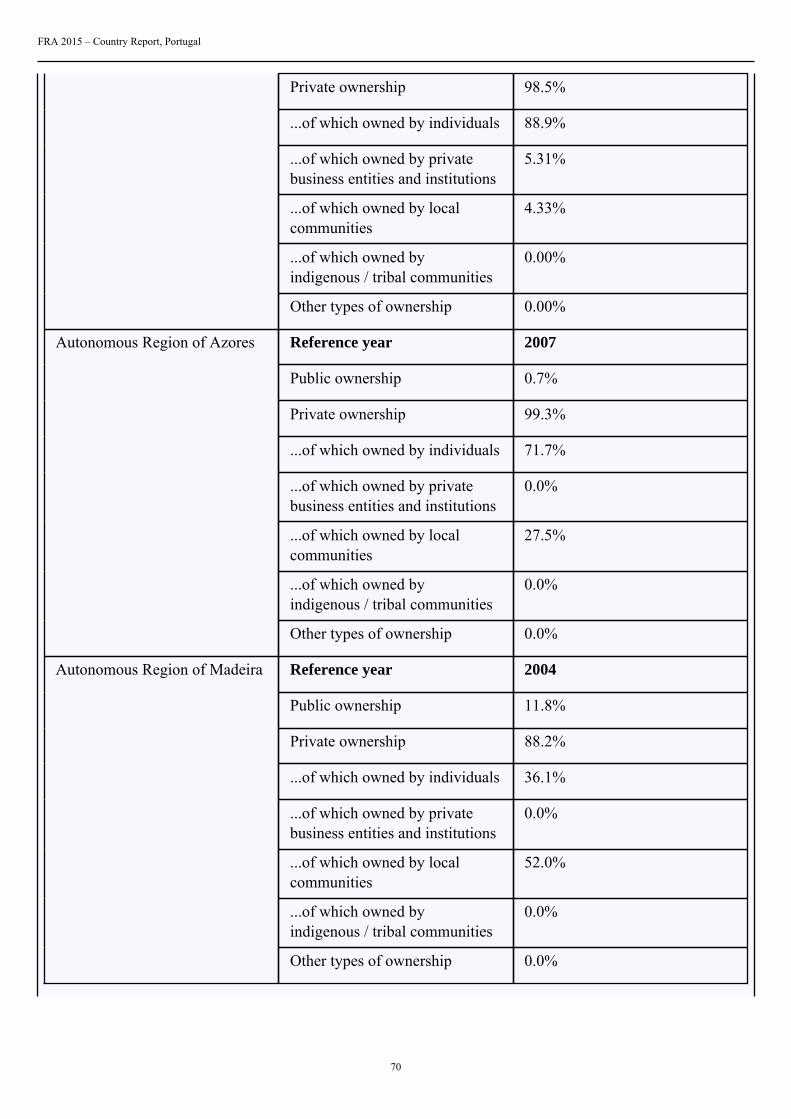
FRA 2015 – Country Report, Portugal
70
Private ownership 98.5%
...of which owned by individuals 88.9%
...of which owned by privatebusiness entities and institutions
5.31%
...of which owned by localcommunities
4.33%
...of which owned byindigenous / tribal communities
0.00%
Other types of ownership 0.00%
Reference year 2007
Public ownership 0.7%
Private ownership 99.3%
...of which owned by individuals 71.7%
...of which owned by privatebusiness entities and institutions
0.0%
...of which owned by localcommunities
27.5%
...of which owned byindigenous / tribal communities
0.0%
Autonomous Region of Azores
Other types of ownership 0.0%
Reference year 2004
Public ownership 11.8%
Private ownership 88.2%
...of which owned by individuals 36.1%
...of which owned by privatebusiness entities and institutions
0.0%
...of which owned by localcommunities
52.0%
...of which owned byindigenous / tribal communities
0.0%
Autonomous Region of Madeira
Other types of ownership 0.0%

FRA 2015 – Country Report, Portugal
71
18.3 Analysis and processing of national data
18.3.1 Adjustment
Calibration is not required because relative proportions were used. These values were multiplied by the totalforest area of each reference year, which were already calibrated, as explained in Table 1 comments.
18.3.2 Estimation and forecasting
Estimation and forecasting was not required because relative proportions were used. These values weremultiplied by the total forest area of each reference year, which were already estimated (interpolated for mid-years, between data-source years), as explained in Table 1 comments.
18.3.3 Reclassification
18.4 DataTable 18a
Forest area (1000 hectares)Categories
1990 2000 2005 2010
Public ownership 52.8 54.1 54.4 98.28
... of which ownedby the state atnational scale
N/A N/A N/A 74.64
... of which ownedby the state atthe sub-nationalgovernment scale
N/A N/A N/A 23.64
Private ownership 3383.2 3288.9 3241.6 3140.72
... of which ownedby individuals
3039.2 2935.9 2886.6 2788.758
... of which ownedby private businessentities andinstitutions
172 177 178 180.216
... of which ownedby local, tribaland indigenouscommunities
172 176 177 171.746
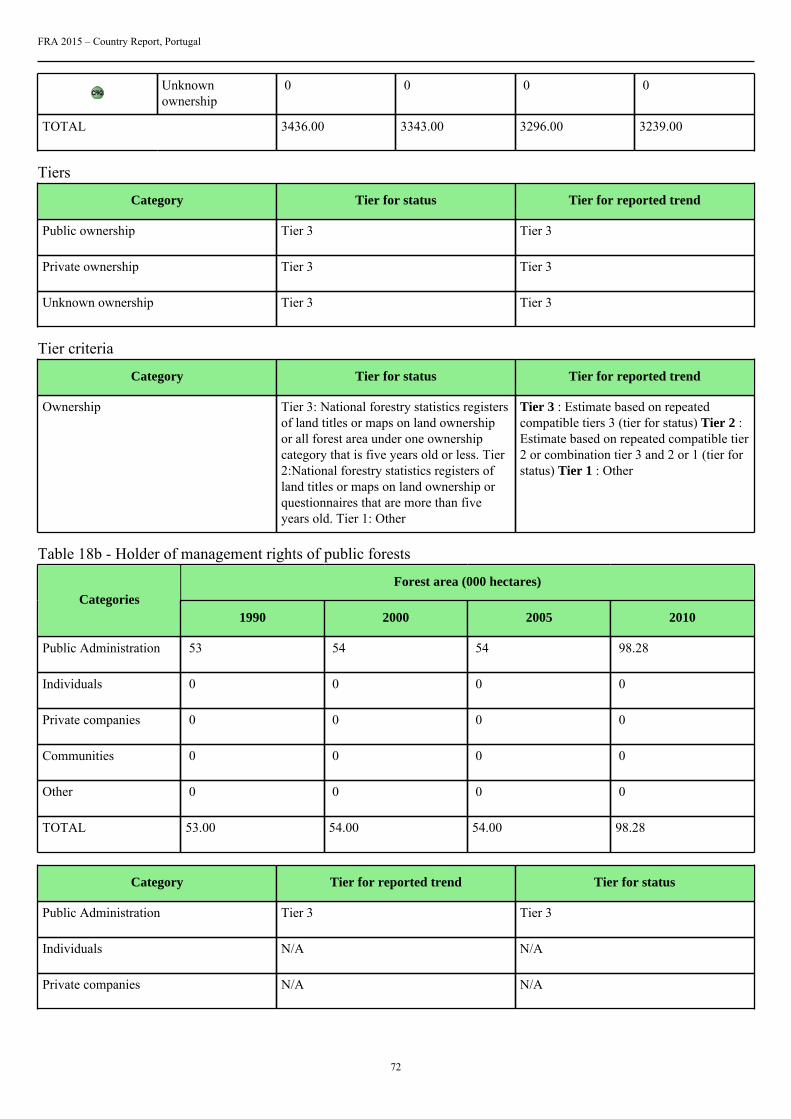
FRA 2015 – Country Report, Portugal
72
Unknownownership
0 0 0 0
TOTAL 3436.00 3343.00 3296.00 3239.00
Tiers
Category Tier for status Tier for reported trend
Public ownership Tier 3 Tier 3
Private ownership Tier 3 Tier 3
Unknown ownership Tier 3 Tier 3
Tier criteria
Category Tier for status Tier for reported trend
Ownership Tier 3: National forestry statistics registersof land titles or maps on land ownershipor all forest area under one ownershipcategory that is five years old or less. Tier2:National forestry statistics registers ofland titles or maps on land ownership orquestionnaires that are more than fiveyears old. Tier 1: Other
Tier 3 : Estimate based on repeatedcompatible tiers 3 (tier for status) Tier 2 :Estimate based on repeated compatible tier2 or combination tier 3 and 2 or 1 (tier forstatus) Tier 1 : Other
Table 18b - Holder of management rights of public forests
Forest area (000 hectares)Categories
1990 2000 2005 2010
Public Administration 53 54 54 98.28
Individuals 0 0 0 0
Private companies 0 0 0 0
Communities 0 0 0 0
Other 0 0 0 0
TOTAL 53.00 54.00 54.00 98.28
Category Tier for reported trend Tier for status
Public Administration Tier 3 Tier 3
Individuals N/A N/A
Private companies N/A N/A

FRA 2015 – Country Report, Portugal
73
Communities N/A N/A
Other N/A N/A
18.5 Comments
CategoryComments related todata definitions etc
Comments on the reported trend
Public ownership N/A Due to the implementation of a specificforest procedure, more forest estates underpublic ownership have been identified andthus taken in consideration on the 2010statistics
Private ownership N/A N/A
Unknown ownership N/A N/A
Management rights N/A N/A
Other general comments to the table
The NFI6 land use/cover data included the classification of 356 thousand sample points for 2010, 2005 and 1995, based on airborneimagery and field surveying. In result, the 1990, 2000 and 2005 national estimations have been updated in FRA2015.

FRA 2015 – Country Report, Portugal
74
19. How many people are directly employed in forestry?Documents for this question:
• Guide for country reporting FRA 2015• FRA 2015 Terms and Definitions
19.1 Categories and definitions
Category Definition
Full-time equivalents(FTE)
A measurement equal to one person working full-time during a specified reference period.
Employment in forestry Employment in activities related to production of goods derived from forests. This category correspondsto the ISIC/NACE Rev. 4 activity A02 (Forestry and logging).
19.2 National data
19.2.1 Data sources
References to sourcesof information
Variables Years Additional comments
1 ILO statistics of Employmentin forestry, logging andrelated services, 2003
N/A N/A Employment in forestry,logging and related services(secondary data reported atFRA 2005)
2 Gabinete de Estratégia ePlaneamento - SISED –Ministério do Trabalho eda Solidariedade Social– National employmentstatistics
N/A 2005 These statistics do notinclude workers related topart of the forest supportservices, as forest inventory,forest management, timberassessment and forestpest control. The nationalemployment statistics do notprovide data for these typesof workers.
3 Gabinete de Estratégiae Planeamento (GEP),Ministério da Solidariedade,Emprego e Segurança Social(MSESS)/Strategy andPlanning Office (SPO)Ministry of Solidarity,Employment and SocialSecurity (MSESS)
N/A 2010 N/A
4 N/A N/A N/A N/A
19.2.2 Classification and definitions
National class Definition
Employment 2010 Total number of employes on the Forest Sector
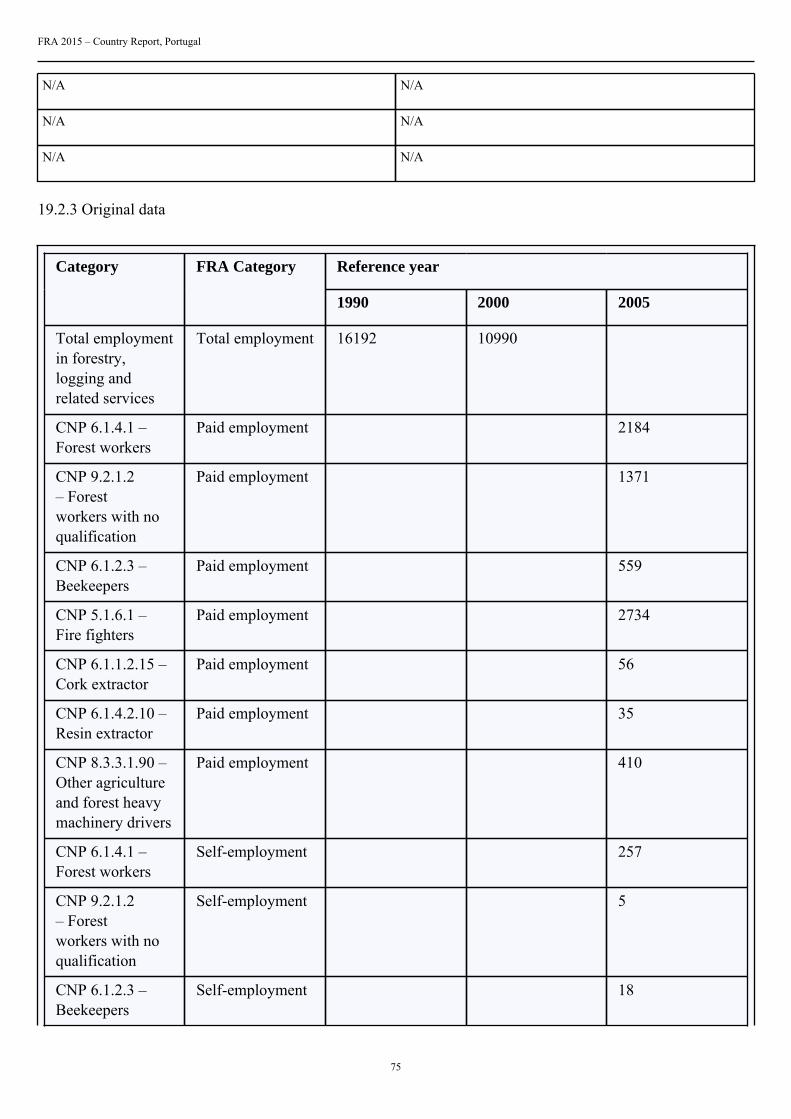
FRA 2015 – Country Report, Portugal
75
N/A N/A
N/A N/A
N/A N/A
19.2.3 Original data
Reference yearCategory FRA Category
1990 2000 2005
Total employmentin forestry,logging andrelated services
Total employment 16192 10990
CNP 6.1.4.1 –Forest workers
Paid employment 2184
CNP 9.2.1.2– Forestworkers with noqualification
Paid employment 1371
CNP 6.1.2.3 –Beekeepers
Paid employment 559
CNP 5.1.6.1 –Fire fighters
Paid employment 2734
CNP 6.1.1.2.15 –Cork extractor
Paid employment 56
CNP 6.1.4.2.10 –Resin extractor
Paid employment 35
CNP 8.3.3.1.90 –Other agricultureand forest heavymachinery drivers
Paid employment 410
CNP 6.1.4.1 –Forest workers
Self-employment 257
CNP 9.2.1.2– Forestworkers with noqualification
Self-employment 5
CNP 6.1.2.3 –Beekeepers
Self-employment 18

FRA 2015 – Country Report, Portugal
76
CNP 5.1.6.1 –Fire fighters
Self-employment 0
CNP 6.1.1.2.15 –Cork extractor
Self-employment 7
CNP 6.1.4.2.10 –Resin extractor
Self-employment 1
CNP 8.3.3.1.90 –Other agricultureand forest heavymachinery drivers
Self-employment 3
19.3 DataTable 19
Employment (000 years FTE)Category
1990 2000 2005 2010
Employment inforestry
16.2 11 7.64 5.91
... of which female N/A N/A N/A N/A
19.4 Comments
CategoryComments related todata definitions etc
Comments on the reported trend
Employment in forestry The data reported for 2010 is the numberof total employes in the Forest Sector(production, manufacturated products andsales)
Different data sources were used between1990/2005 and 2010. The reported trendis consistent with the social change whitinthe primary sector
Other general comments to the table
Not available data related to female employment in forestry
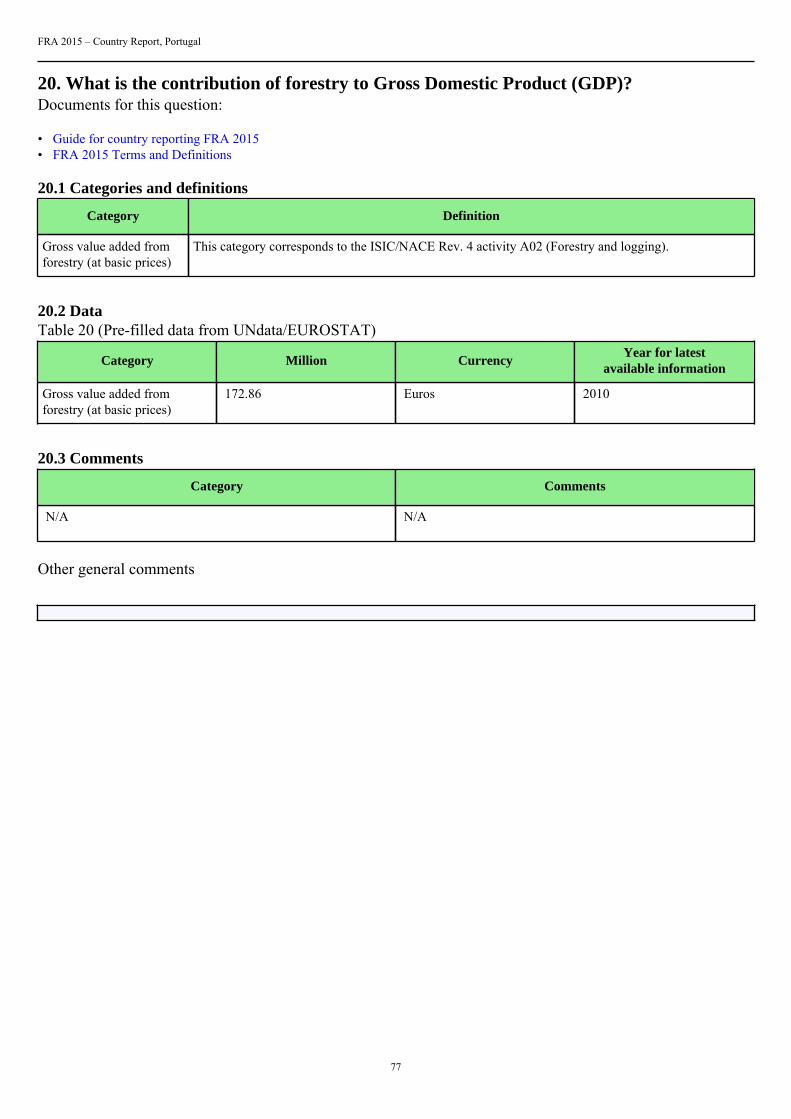
FRA 2015 – Country Report, Portugal
77
20. What is the contribution of forestry to Gross Domestic Product (GDP)?Documents for this question:
• Guide for country reporting FRA 2015• FRA 2015 Terms and Definitions
20.1 Categories and definitions
Category Definition
Gross value added fromforestry (at basic prices)
This category corresponds to the ISIC/NACE Rev. 4 activity A02 (Forestry and logging).
20.2 DataTable 20 (Pre-filled data from UNdata/EUROSTAT)
Category Million CurrencyYear for latest
available information
Gross value added fromforestry (at basic prices)
172.86 Euros 2010
20.3 Comments
Category Comments
N/A N/A
Other general comments
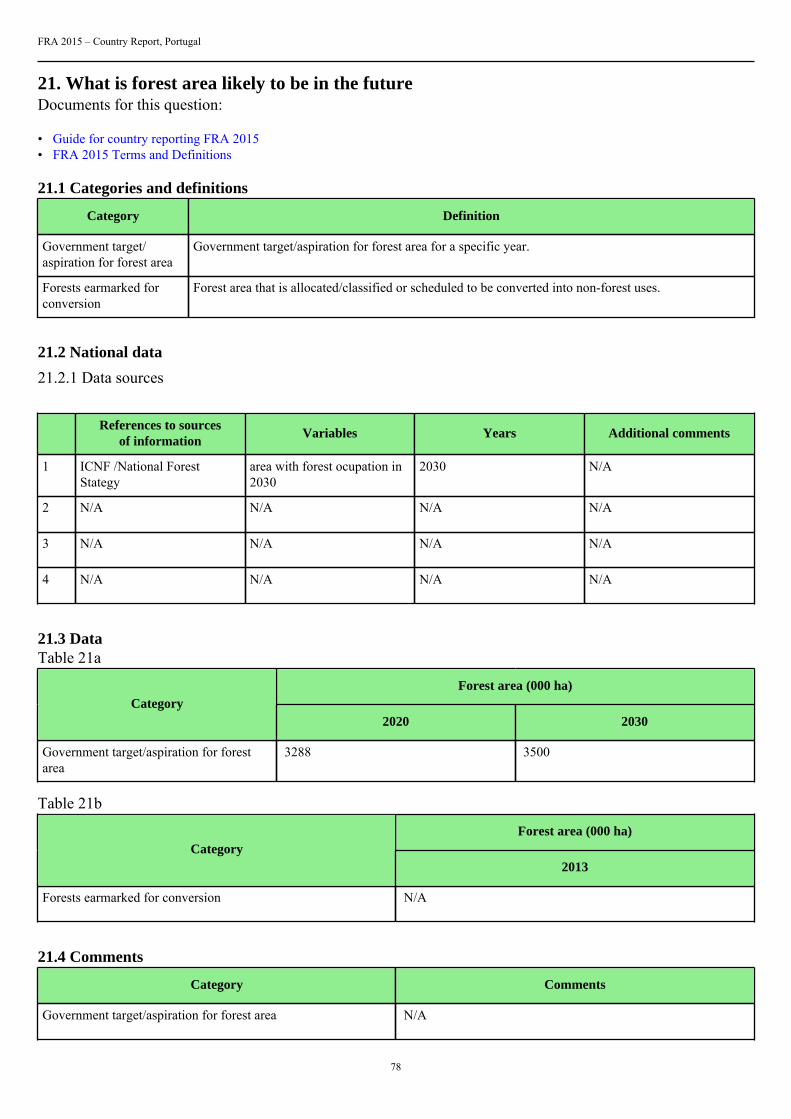
FRA 2015 – Country Report, Portugal
78
21. What is forest area likely to be in the futureDocuments for this question:
• Guide for country reporting FRA 2015• FRA 2015 Terms and Definitions
21.1 Categories and definitions
Category Definition
Government target/aspiration for forest area
Government target/aspiration for forest area for a specific year.
Forests earmarked forconversion
Forest area that is allocated/classified or scheduled to be converted into non-forest uses.
21.2 National data
21.2.1 Data sources
References to sourcesof information
Variables Years Additional comments
1 ICNF /National ForestStategy
area with forest ocupation in2030
2030 N/A
2 N/A N/A N/A N/A
3 N/A N/A N/A N/A
4 N/A N/A N/A N/A
21.3 DataTable 21a
Forest area (000 ha)Category
2020 2030
Government target/aspiration for forestarea
3288 3500
Table 21b
Forest area (000 ha)Category
2013
Forests earmarked for conversion N/A
21.4 Comments
Category Comments
Government target/aspiration for forest area N/A

FRA 2015 – Country Report, Portugal
79
Forests earmarked for conversion N/A
Other general comments
The value for 2020 consideres the forest trend for 2015 (3182000 hectares) and it was interpolated between2015 and the main target for 2030.