potential for wind energy development on new … · potential for wind energy development on new...
TRANSCRIPT
Potential for Wind Energy Development on
New England Islands
Final Report
A report prepared by the Renewable Energy Research Laboratory
Center for Energy Efficiency and Renewable Energy Department of Mechanical and Industrial Engineering
University of Massachusetts at Amherst Amherst, MA 01003
James F. Manwell Jon G. McGowan Anthony Rogers Gabriel Blanco
Mohit Dua
May 2003
ii
Potential for Wind Energy Development on New England Islands
Final Report
In July 2001, the Renewable Energy Research Laboratory (RERL) of the University of Massachusetts, Amherst, was assigned to carry out a feasibility study on the potential for wind energy development on the New England islands by the U.S. Department of Energy (DOE), Region I. According to the proposal submitted to DOE, the study would include an inventory of the New England islands, categorization of the islands according to certain criteria, an overview of the current energy supply situation on some of the energy demanding islands, a proposal for plausible power system designs for selected islands with an estimation of performance and economic merits of those systems and an assessment of the concerns that are likely to be raised by the inhabitants or those responsible for the selected island to wind energy. This is the final version of the draft report submitted in January 2002.
iii
Table of Content
1. Introduction 1
2. Studies Conducted on Potential for Wind Energy Development on New England Islands
2.1 Study by Vachon Associates 3
2.2 Deer Island Study by Devonrue Limited 4
2.3 Thompson Island Study by RERL 6
2.4 Cuttyhunk Study by RERL 7
2.5 Boston Harbor Island Study 8
2.6 Block Island 9
3. Islands Inventory and Classification
3.1. Inventory and Statistics 10
3.2. Classification 12
4. Renewable Resources Offshore New England
4.1 Wind Resource 16
4.2 Solar Resource 19
5. Overview of Current Energy Supply Status on New England Islands 20
6. Power System Options for the New England Islands
6.1 Grid-connected Islands 21
6.2 Isolated Islands 21
7. Description and Modeling of the Potential Power Systems
7.1 Grid-connected Wind Turbines Via Underwater Cables 23
7.2 Wind/Diesel Hybrid Power Systems 26
7.3 PV/Wind Hybrid Power Systems 32
7.4 Loads 34
7.5 Administrative and Distribution Costs 35
7.6 Life cycle Economic Parameters 36
8. Case Studies
8.1. Case I Grid-connected Island Community: Fox Islands 37
8.2. Case II Isolated Island Communities: Monhegan Island 55
8.3. Case III Isolated Island, Summer-Only Activities: Isles of Shoals 62
8.4. Case IV Equipment-only: Matinicus Rock 69

iv
9. Public Acceptance of Wind Power on the New England Islands 77
10. Conclusions 78
11. References 80
12. Appendices
11.1 Appendix A: Islands Inventory 83
11.2 Appendix B: Estimated Costs of Wind Turbines 89
11.3 Appendix C: Explanation of Terms used in HOMER 90
1
Introduction
There are more than 3,000 islands off the coast of New England. About 190 of these islands have been identified as having some kind of activity. These activities range from simple, unmanned automatic lighthouses to communities living year-round on islands. Other activities include recreation, preserves, research and education.
As the type of activity varies from island to island, so does the energy system that provides electricity and heating to the island. Some islands are connected to the mainland electricity grid via underwater power transmission cables while other islands are isolated and generate their own electricity. For the grid-connected islands, the possibility of generating their own electricity may improve system reliability as well as reduce the cost of electricity. For the isolated islands, a reliable, autonomous and sustainable energy system will enhance the quality of life for the inhabitants, as well lead to upgraded services provided to visitors.
The possibility of installing hybrid power systems on the islands also brings, as never before, the opportunity to gain valuable experience by having these systems under the close supervision of well-trained personnel. Unsupervised systems located in remote areas in underdeveloped countries have experienced problems in the past that were difficult to assess and have reduced public confidence on this type of power system.
It is well known that the wind resource off the coast of New England is one the best in the world. Wind speeds average from 7 m/s off the Connecticut coast all the way up to 9 m/s or more off the Maine coast. This has prompted many studies to be conducted on the feasibility of wind energy systems on the New England islands. Depending on the characteristics of each island and its main activities, both grid-connected wind turbines and/or stand-alone hybrid systems can be viable solutions to improve the current energy supply. This project will study and discuss the technical and economic feasibility of such systems as well as environmental and aesthetic issues that may be raised by the island residents and visitors. Technical issues include the system architecture, size of equipment, and performance of the system over a year. Economic analysis includes the life cycle cost of the systems and levelized cost of energy, among other parameters. The power systems considered in this study were designed to supply energy to the islands, although the feasibility of transmitting and selling power to the onshore electric grid is also addressed.
This report begins with a summary of previous wind energy feasibility studies that have been conducted, followed by an inventory of the islands off the New England shore. A detailed inventory including, amongst other information, accessibility, main activity, ownership, area, population, electricity consumption and source has been provided in Appendix A. Based on this information a classification for the islands is presented. This

2
is followed by a description of the wind resources off New England coast and an overview of the current energy supply status on the islands. Then, potential alternative power systems for the islands are proposed, such as wind/diesel, PV/wind hybrid systems and grid-connected wind turbines. The modeling of the systems and results of the preliminary feasibility study for four different islands is presented and discussed. Conclusions and general remarks about public acceptance of wind power close the report.
3
Studies Conducted on Potential for Wind Energy Development on New England Islands
Islands off the coast of New England have excellent wind resources. They have also been used for a variety of activities. With on site energy requirements and high potential for wind energy, many studies have been conducted on assessing the feasibility of wind turbine installation. Some of these studies have been summarized below.
2.1 Study by Vachon & Associates [1]
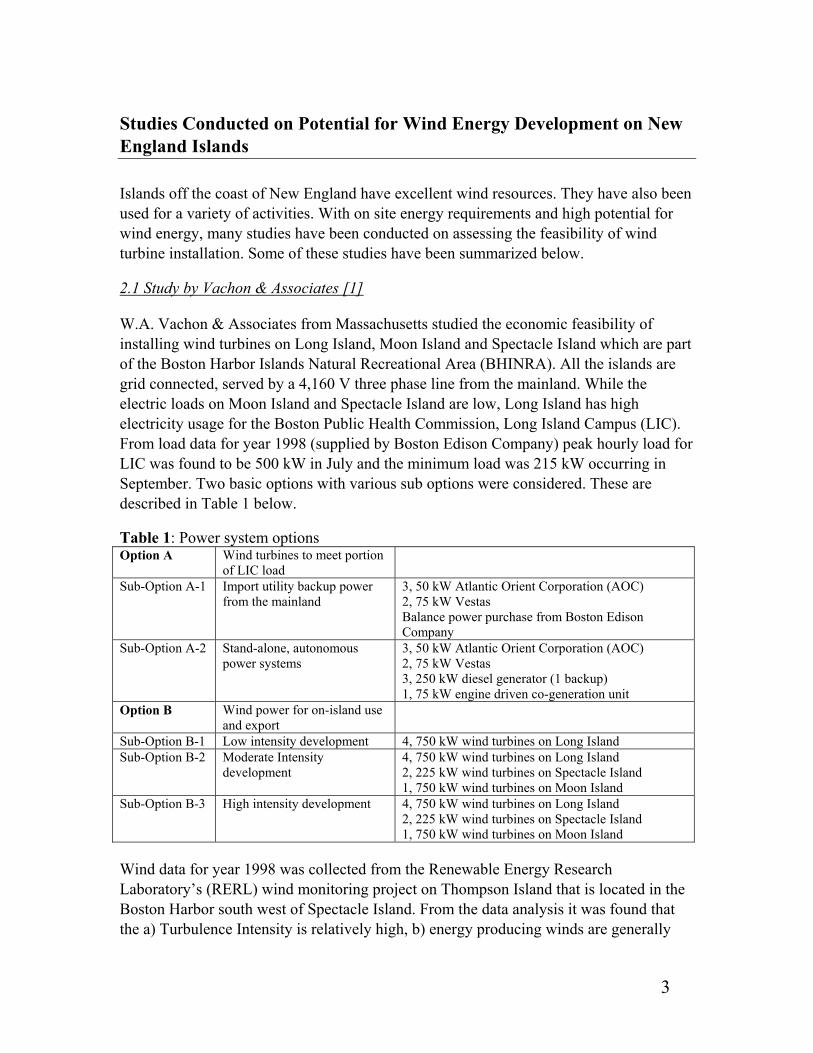
W.A. Vachon & Associates from Massachusetts studied the economic feasibility of installing wind turbines on Long Island, Moon Island and Spectacle Island which are part of the Boston Harbor Islands Natural Recreational Area (BHINRA). All the islands are grid connected, served by a 4,160 V three phase line from the mainland. While the electric loads on Moon Island and Spectacle Island are low, Long Island has high electricity usage for the Boston Public Health Commission, Long Island Campus (LIC). From load data for year 1998 (supplied by Boston Edison Company) peak hourly load for LIC was found to be 500 kW in July and the minimum load was 215 kW occurring in September. Two basic options with various sub options were considered. These are described in Table 1 below.
Table 1: Power system options Option A Wind turbines to meet portion
of LIC load
Sub-Option A-1 Import utility backup power from the mainland
3, 50 kW Atlantic Orient Corporation (AOC) 2, 75 kW Vestas Balance power purchase from Boston Edison Company
Sub-Option A-2 Stand-alone, autonomous power systems
3, 50 kW Atlantic Orient Corporation (AOC) 2, 75 kW Vestas 3, 250 kW diesel generator (1 backup) 1, 75 kW engine driven co-generation unit
Option B Wind power for on-island use and export
Sub-Option B-1 Low intensity development 4, 750 kW wind turbines on Long Island Sub-Option B-2 Moderate Intensity
development 4, 750 kW wind turbines on Long Island 2, 225 kW wind turbines on Spectacle Island 1, 750 kW wind turbines on Moon Island
Sub-Option B-3 High intensity development 4, 750 kW wind turbines on Long Island 2, 225 kW wind turbines on Spectacle Island 1, 750 kW wind turbines on Moon Island
Wind data for year 1998 was collected from the Renewable Energy Research Laboratory’s (RERL) wind monitoring project on Thompson Island that is located in the Boston Harbor south west of Spectacle Island. From the data analysis it was found that the a) Turbulence Intensity is relatively high, b) energy producing winds are generally
4
from the west and northwest directions and c) long-term, annual average wind speed for 40-m height was 6.08 m/s (13.6 mph) while the average for 50-m height was 6.35 m/s (14.22 mph).
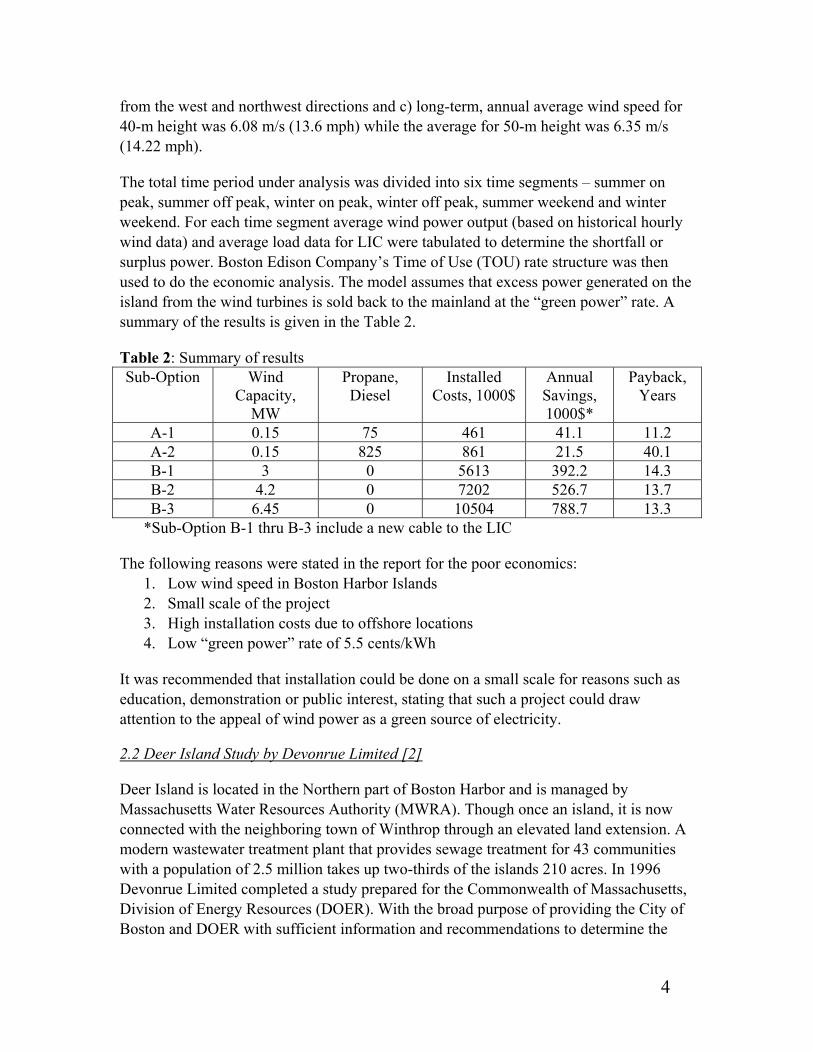
The total time period under analysis was divided into six time segments – summer on peak, summer off peak, winter on peak, winter off peak, summer weekend and winter weekend. For each time segment average wind power output (based on historical hourly wind data) and average load data for LIC were tabulated to determine the shortfall or surplus power. Boston Edison Company’s Time of Use (TOU) rate structure was then used to do the economic analysis. The model assumes that excess power generated on the island from the wind turbines is sold back to the mainland at the “green power” rate. A summary of the results is given in the Table 2.
Table 2: Summary of results Sub-Option Wind
Capacity, MW
Propane, Diesel
Installed Costs, 1000$
Annual Savings, 1000$*
Payback, Years
A-1 0.15 75 461 41.1 11.2 A-2 0.15 825 861 21.5 40.1 B-1 3 0 5613 392.2 14.3 B-2 4.2 0 7202 526.7 13.7 B-3 6.45 0 10504 788.7 13.3
*Sub-Option B-1 thru B-3 include a new cable to the LIC
The following reasons were stated in the report for the poor economics: 1. Low wind speed in Boston Harbor Islands 2. Small scale of the project 3. High installation costs due to offshore locations 4. Low “green power” rate of 5.5 cents/kWh
It was recommended that installation could be done on a small scale for reasons such as education, demonstration or public interest, stating that such a project could draw attention to the appeal of wind power as a green source of electricity.
2.2 Deer Island Study by Devonrue Limited [2]
Deer Island is located in the Northern part of Boston Harbor and is managed by Massachusetts Water Resources Authority (MWRA). Though once an island, it is now connected with the neighboring town of Winthrop through an elevated land extension. A modern wastewater treatment plant that provides sewage treatment for 43 communities with a population of 2.5 million takes up two-thirds of the islands 210 acres. In 1996 Devonrue Limited completed a study prepared for the Commonwealth of Massachusetts, Division of Energy Resources (DOER). With the broad purpose of providing the City of Boston and DOER with sufficient information and recommendations to determine the

5
feasibility of installing a wind power plant at Deer Island, this study’s focus was to “identify and evaluate physical and regulatory issues that would affect the feasibility of the proposed project”. The second phase of the study was to study the wind resource at the site.
Electricity supply to the island is through dedicated underwater cables which connect to a transmission line in Winthrop. There is also onsite electricity generation by a gas-fired power plant. Since the island is located close to Logan International Airport, wind data was obtained from anemometers located at the airport. A study of data in the period between August 1957 and December 1978 indicated annual average wind speeds of 7.4 m/s at a 50 m height. The data shows seasonal variation, with highest winds in winter and lowest in summer.
A study of regulatory and institutional issues indicated minimal requirements. Due to proximity to the airport however, markings may be required to conform to air traffic regulations. It was recommended that both Massachusetts Aeronautics Commission and Federal Aviation Authority must be informed of the project before operation. The study also indicated that the project could qualify as a Small Power Producer (SPP) and Qualified Facility (QF). This could eliminate rate negotiations with electric utilities as provided by Public Utility Regulatory Policies Act (PURPA).
Noise was the other major part of the study. MWRA has a Memorandum of Understanding (MoU) with the Town of Winthrop which states that noise generated from the facility should not be greater than 36 dB at the Town Line. It was therefore pointed out that wind turbines sited on the island should not generate noise greater than 26 dB to comply with this regulation.
A summary of the findings is given below:
1. Altogether Deer Island has between 5 to 11 possible turbine locations, however, once noise limitations are taken into consideration, possible locations decrease significantly. Due to noise concerns, up to two wind turbines can be sited on Deer Island. It must be pointed out that due to technological advances since this study, wind turbine noise levels have gone down significantly.
2. The most feasible location for wind turbines is on the southeast of the island. The turbines must be sited 1000 ft apart in the north south orientation. These turbines would meet the noise requirements of the MoU and the Department of Air Quality Control (DAQC). However, they would generate a noise impact within 550 ft along the pedestrian walkway. Noise limitations will continue being the limiting factor in turbine placement.
3. The wastewater treatment plant has large structures. To prevent impact of large structure on the wind turbines, the possibility of their location offshore was discussed.
6
To make a more detailed assessment it was recommended that the wind regime on the island be evaluated in phase two of the study.
2.3 Thompson Island Study by RERL [11]
Thompson Island, also located in the Boston harbor, is approximately two and a half miles south-southeast of Logan airport. The island is approximately one mile long and 500-1500 feet wide. The island is currently used by Outward Bound Education Center for conducting programs for school children. In 1999 a study was completed by the Renewable Energy Research Laboratory (RERL) for the Massachusetts Division of Energy Resources (DOER) to evaluate the possibility of putting wind and/or solar generators on Thompson Island. Wind, solar and electric load data were available from an ongoing monitoring study by RERL and sponsored by DOER. Data between May 1, 1998 and April 30, 1999 was used in the study.
Electric load on the island is supplied from the mainland from an undersea cable. Backup emergency power is provided by an 80 kW diesel generator located on the island. The major load on the island is due to lighting and refrigeration. Annual average electric load was 36.8 kW with the maximum power consumption in any month averaging between 70 and 90 kW with the minimum load being 12 kW. The maximum load occurs in winters, which is different from most of the islands studied. Electric usage during the year was 321 MWh at a price of 6.07 c/kWh and $5.41/kW demand charge. Heating is provided by fuel oil with a total annual usage of about 35,000 gallons, representing approximately 1,005 MWh of energy. Heating costs 2.16 c/kWh for the delivered energy. The average wind speed for the island, scaled to reflect the long-term average, was found to be 6 m/s at a height of 40 m. The average annual solar resource was about 123 W/m2.
The following power plant options were considered for the study: 1) Renewable energy systems for reduction in purchased energy, 2) large renewable energy systems with significant energy sales to the mainland, and 3) autonomous systems. Hybrid2 modeling software developed by the RERL and supported by the National Renewable Energy Laboratory (NREL) was used for modeling the renewable energy systems. The economic analysis did not include any tax credits for the production of green power.
Based on the performance results, the following conclusions were presented:
1. If Thompson Island were willing to forego the undersea cable and become completely autonomous, the hybrid system with wind power is a very viable and cost effective option. For example, an autonomous system with 50 kW of wind power offsetting the power production from the diesel generator would have a net present value of $248,680 over the lifetime of the system.
2. If Thompson Island puts in a cable, the addition of wind power to offset the power drawn from the mainland would in general be economic. For example, putting a 660
7
kW Vestas selling power to grid at a green rate of 7 c/kWh would have a net present value of $969,890 over the project lifetime.
3. The smaller wind systems considered are neutral in terms of economic benefits. Installing a 50 kW wind turbine would meet 36.1% of total load giving a net present value of -$5,076. In general, larger wind systems were found to be more economic.
4. The inclusion of PV in grid connected systems decreases the net present value considerably. Addition of 5 kW of PV to the 50 kW of wind mentioned above would decrease the net present value to –$51,136.
2.4 Cuttyhunk Island Study by RERL [7]
Cuttyhunk Island is located fourteen miles off the coast of New Bedford, Massachusetts. It has a year round population of twenty-five, peaking to a few hundred residents in summer. A study for evaluating the feasibility of adding a wind/diesel hybrid power system to Cuttyhunk Island was conducted by the Renewable Energy Research Laboratory (RERL). The Massachusetts Division of Energy Resources sponsored the study. The local municipal utility, Cuttyhunk Electric Light Department, operates a powerhouse with four diesel generators with a total installed capacity of 770 kW. A 480 V, three-phase grid is used for distribution.
The island has a history with wind energy. WTG Systems installed a 200 kW wind turbine in 1977. However, it soon ceased operation due to poor design. In May 1988, US Windpower began to explore the potential of renewable energy on the island by measuring the wind speed, solar resource, temperature and electric load. When US Windpower shifted its operations from Massachusetts to California, it handed over data from May 1988 to April 1989 to RERL for subsequent analysis. Winds on Cuttyhunk averaged 17.6 mph (at a height of 60 ft) with increased winds in fall and winter and lower winds in the summer. Annual electric load on the island is 62.5 kW, with the maximum hourly power consumption occurring in August of 224 kW and minimum in November of 27 kW. Total electricity consumption was 500,000 kWh. 56,000 gallons of diesel fuel was imported annually at a total cost of $1.40 per gallon. The average cost of producing electricity is $0.31/kWh. The annual fuel oil usage for heating is estimated to be 28,000 gallons per year at a price of $1.42/gallon.
Hybrid2 has been used for modeling the wind/diesel power systems. Three wind turbines were used for the analysis: the AOC 50 kW, the Northern Power System’s Northwind 100 kW and the Nordex N29 250 kW. For electric space heating, which was considered as an optional load, compact heating units containing electric heating elements surrounded by dense bricks were considered. Twelve system configurations were considered with varying complexity (simple/advanced system), wind turbines (50kW/100kW/250kW) and option of electric space heating (with/without electric heating). Analysis was done to maximize fuel savings.

8
The study put forward the following conclusions and observations:
1. In general, systems using the 50 kW or 100 kW wind turbines are least cost effective because they do not achieve sufficient fuel savings to justify their capital expenses.
2. The 250 kW wind turbine system presents the most potential for cost effectiveness and fuel savings. Dispatchable thermal storage heaters further increase the attractiveness of the system.
3. A wind/diesel power system should be installed in stages, starting with the simplest configuration and progressing towards a more advanced system capable of utilizing greater wind potential.
4. Allowing wind-only operation and decreasing the diesel run-time would also improve the island’s noise levels.
5. If the wind turbine were privately owned, the system would achieve additional savings due to tax credits.
6. Before a system is selected, details concerning necessary permits and detailed cost estimates should be further investigated.
2.5 Boston Harbor Island Study
The 34 islands Boston Harbor Islands National Park Area (BHINPA) was established by the Congress in 1996. The legislation also created a 13-member Partnership comprised of public and private island owner organizations. The Partnership adopted a General Management Plan for BHINPA to coordinate park wide policies, management, and programs. An Advisory Council, comprised of 28 members representing municipalities, educational and cultural institutions, environmental organizations, businesses and commercial entities provides recommendations to the Partnership on the development and implementation of the general management plan [4]. The Island Alliance, a nonprofit organization was also created to generate private funding for the park.
The Massachusetts Technology Collaborative Renewable Energy Trust Fund is currently funding a study titled “Predevelopment of Renewable Energy in the Boston Harbor Islands National Park Area”. The joint study is being undertaken by the Urban Harbors Institute at the University of Massachusetts, Boston; Timeless Technologies; The Renewable Energy Research Laboratory at the University of Massachusetts, Amherst; and the Island Alliance, the non profit partner of BHINPA. The goal of the project is to develop integrated pathways for installing renewable energy facilities with a combined output of one to ten megawatts at sites on or around four of the grid- connected Boston Harbor Islands: Long Island, Moon Island, Thompson Island and Spectacle Island. It is intended that this will promote the wider recognition and use of renewable resources in the greater Boston area and beyond.
9
The project has the following tasks:
1. An islands survey including the existing state of islands
2. A wind, solar and tidal resource assessment
3. Suggestions for development, ownership and maintenance options
4. An environmental impact analysis and a review of permitting requirements
5. A financial analysis of the development scenarios
6. Outreach and education
7. Documentation
2.6 Block Island
Located approximately 10 miles of the coast of Rhode Island, Block Island has approximately 900 year round residents, with the summer population increasing to 15,000 due to a tourist influx. The Block Island Power Company (BIPC) currently supplies power to the island using diesel generator sets with a peak capacity of 5 MW. In 1998 Rhode Islands used a $378,000 grant from DOE’s State Energy Program to promote the use of renewable energy on the island [3]. The grant provided funding for 25% of the cost of buying and installing qualifying solar and wind energy systems.
10
Islands Inventory and Classification
To determine the potential for wind energy use on New England islands they need to be classified into categories depending on the type of activity on the island. The activities on the islands vary broadly from wildlife preserve to meteorological stations to summer camps to entire communities living year-round on the islands. Energy use on the island is dependent to the type of activity on it. While year round communities require a reliable electricity supply throughout the year, wildlife preserves may not require any electricity.
3.1 Inventory and Statistics
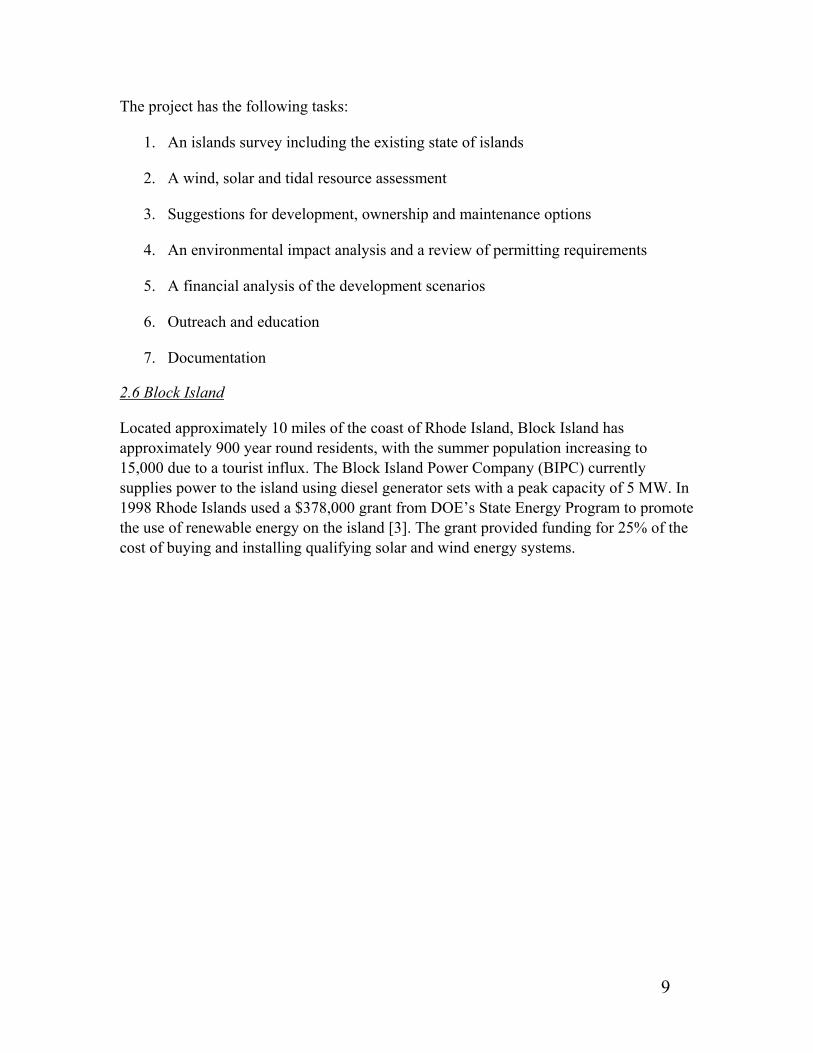
The U.S. Geological Survey through the Geographic Names Information System has catalogued a total of 3,284 islands in New England [6]. Figure 1 gives the number of islands by state.
Figure 1: Number of islands by state
Most of the islands are located within 20 miles from the mainland with few exceptions such as Matinicus Rock, ME, and Nantucket Island off Cape Cod, MA, located at 22 and 30 miles from the shore respectively.
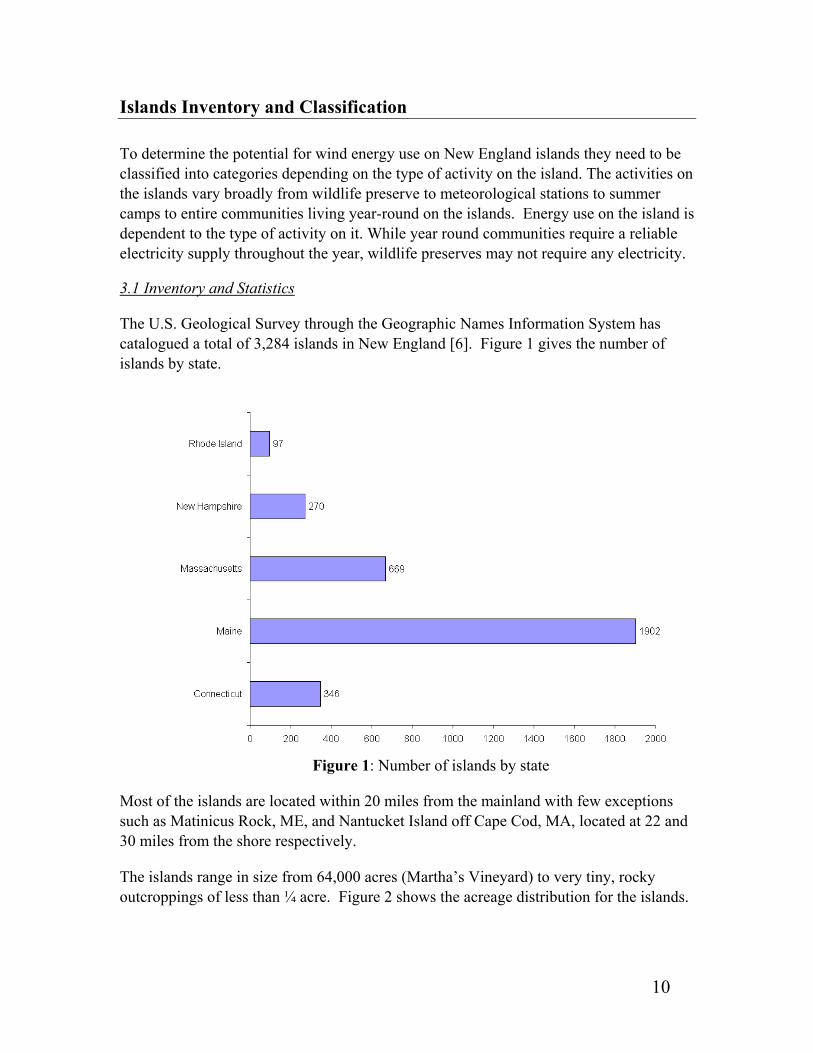
The islands range in size from 64,000 acres (Martha’s Vineyard) to very tiny, rocky outcroppings of less than ¼ acre. Figure 2 shows the acreage distribution for the islands.
11
Figure 2: Acreage distribution of New England islands
Amongst all the islands, roughly 190 have been identified as having some kind of activity. Of these islands, 125 are in Maine, 46 in Massachusetts, and the rest are distributed among New Hampshire, Rhode Island, and Connecticut.
For almost all of these islands the location, area, distance to the mainland, accessibility, ownership and main activities have been tabulated in Appendix A. However, specific information regarding energy consumption, electricity source and population has been difficult to obtain and limited data regarding these is presented.
The population distribution during a given year fluctuates substantially for most of the islands. On average, the population on islands with year round communities increases by a factor of seven during the summer with respect to the year-round population. Some islands, however, present a more dramatic variation. As an example, Star Island (a member of the Isles of Shoals), NH, sees its population increase 200 times over the summer due to conferences that are held every year on the island. Block Island, RI, is another example of large population fluctuation. It has a year-round population of approximately 900, but tourists arriving early in the summer take that figure to 15,000.
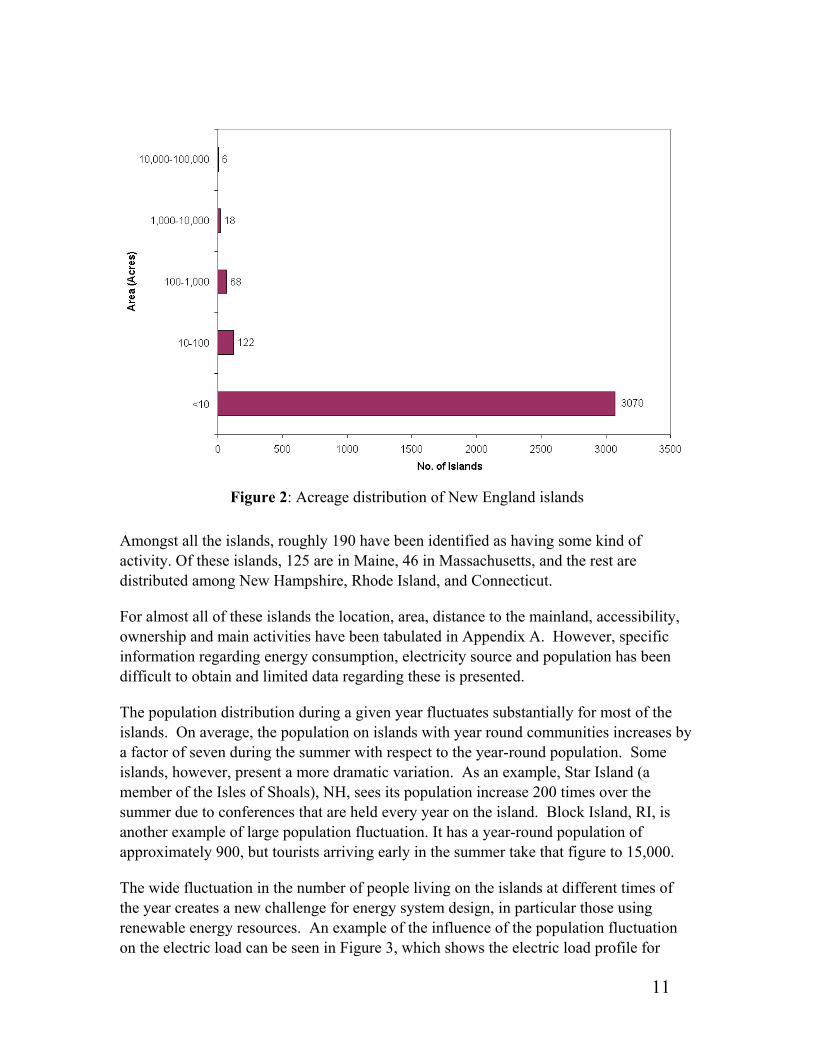
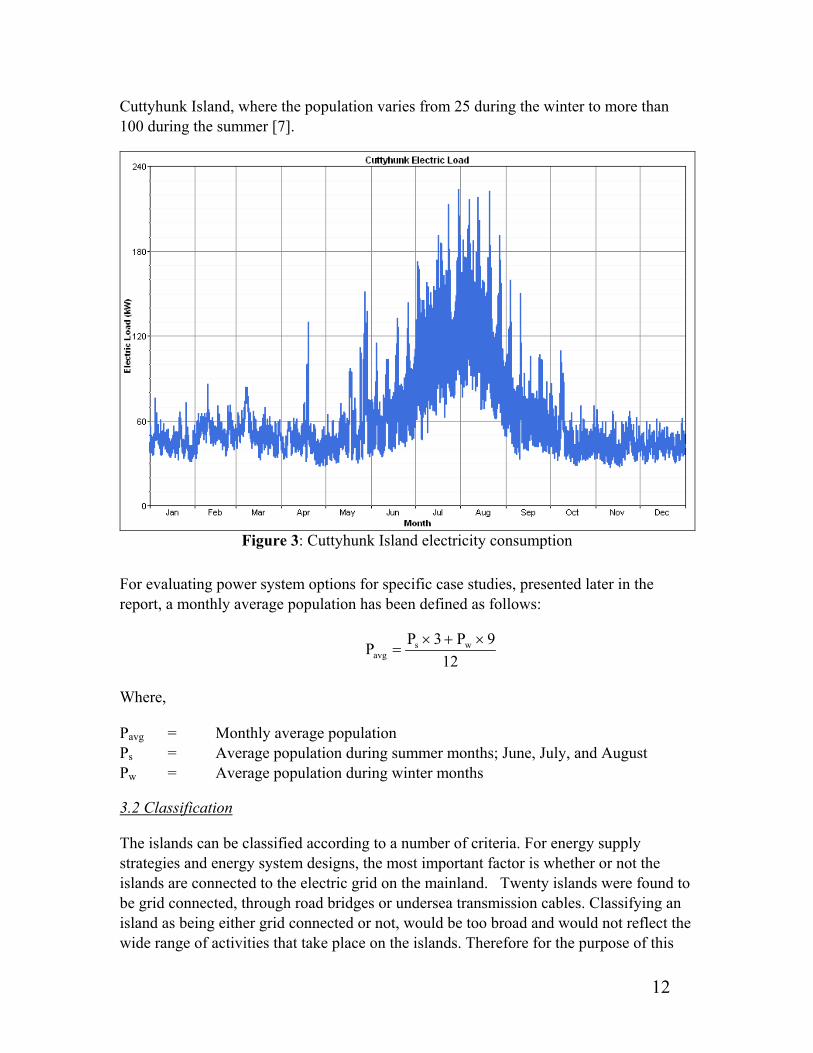
The wide fluctuation in the number of people living on the islands at different times of the year creates a new challenge for energy system design, in particular those using renewable energy resources. An example of the influence of the population fluctuation on the electric load can be seen in Figure 3, which shows the electric load profile for
12
Cuttyhunk Island, where the population varies from 25 during the winter to more than 100 during the summer [7].
Figure 3: Cuttyhunk Island electricity consumption
For evaluating power system options for specific case studies, presented later in the report, a monthly average population has been defined as follows:
129P3PP ws
avg×+×
=
Where,
Pavg = Monthly average population Ps = Average population during summer months; June, July, and August Pw = Average population during winter months
3.2 Classification
The islands can be classified according to a number of criteria. For energy supply strategies and energy system designs, the most important factor is whether or not the islands are connected to the electric grid on the mainland. Twenty islands were found to be grid connected, through road bridges or undersea transmission cables. Classifying an island as being either grid connected or not, would be too broad and would not reflect the wide range of activities that take place on the islands. Therefore for the purpose of this

13
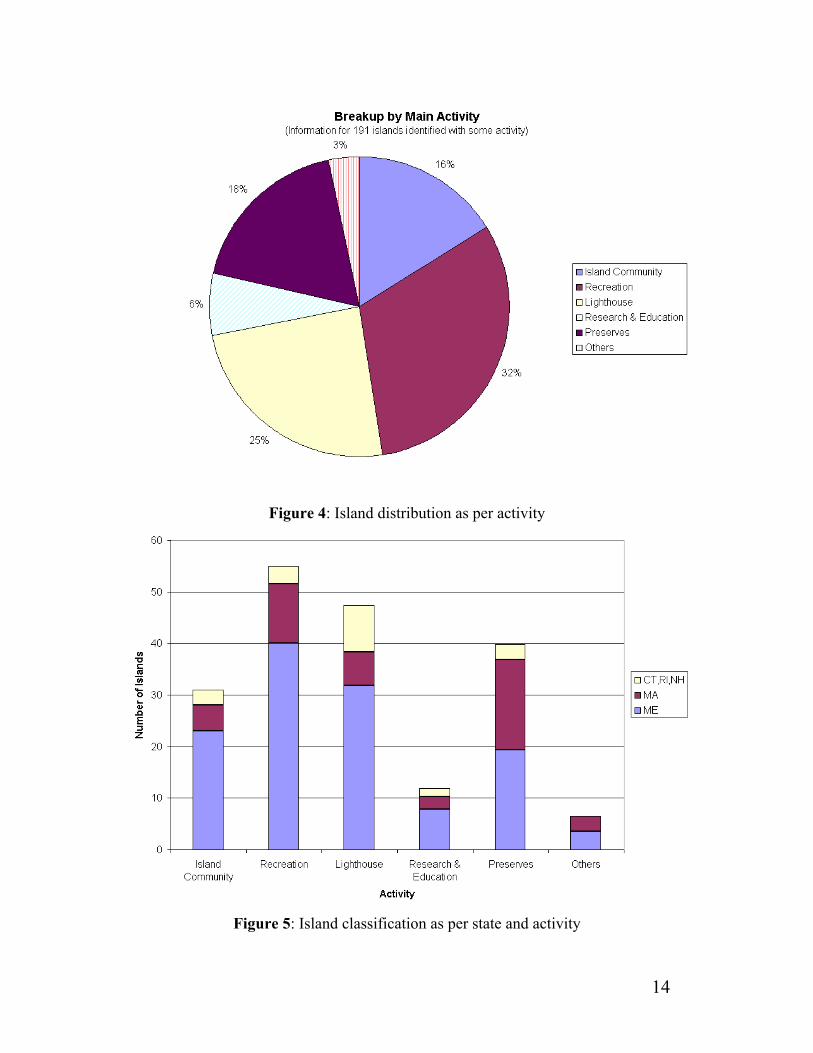
study the islands have been classified according to their main activity. The following categories have been used for the classification:
1. Island communities: These are characterized by year round population, though the population may fluctuate during the year. As a rule, there is an increase in population during summer. These islands are either connected to the grid or use isolated energy systems like diesel generators. Swans Island located in Hancock, ME, 6 miles off the Maine coast, is an island community. It has a year round population of 350 which rises to 700 in summer. Electricity is supplied from the mainland via undersea cables.
2. Recreation: Some of the islands are used as summer destinations, for outdoor camps or summer residences. Islands with historic sites are part of this category. For example, Eagle Island located in Cumberland, ME, is a state historic site since the summer home of North Pole explorer Admiral Robert E. Peary is located there. Visitors are allowed starting June 15th through Labor Day.
3. Lighthouses: Many islands are used solely to site lighthouses, though they may also have other activities. For example, Thatcher Island, located in Essex, MA, is home to the Thatcher Island Twin Lights.
4. Research and education: Many islands are used to conduct research. The Shoals Marine Laboratory is located on Appledore Island which is part of the Isles of Shoals. The laboratory, which is cooperatively run by Cornell University and the University of New Hampshire, conducts research on marine science. Penikese Island in Dukes, MA has a school for troubled youth.
5. Preserves: A Majority of the islands are part of a wildlife refuge, national park or state park. For example, Jenny Island, located in Casco Bay off Maine coast is a Project Puffin research station. The National Audubon Society manages the island.
6. Others: There are island which do not fall in any of the above categories. For example, Deer Island located in the Boston Harbor has a wastewater treatment plant operated by Massachusetts Water Resources Authority.
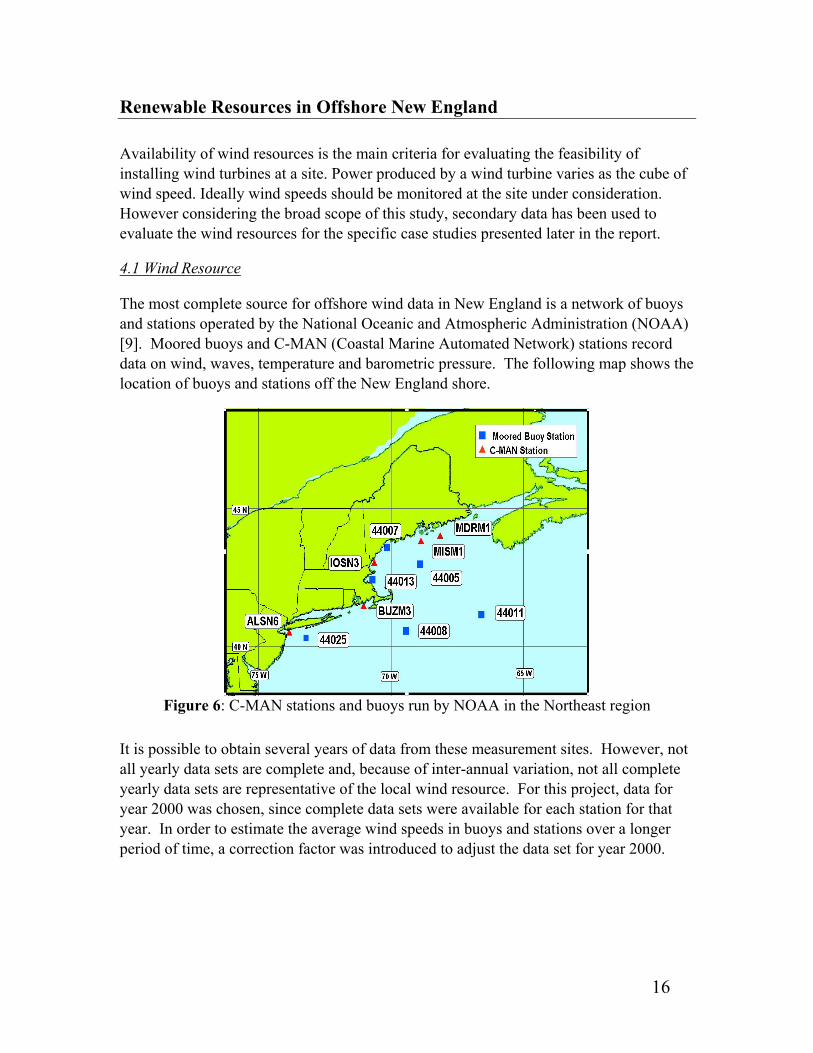
Figure 4 shows the percentage distribution of the 191 islands under each of the above groups, while Figure 5 shows the break up by state.
14
Figure 4: Island distribution as per activity
Figure 5: Island classification as per state and activity

15
As mentioned previously, specific information about annual energy (electricity and heating) consumption and supply, electricity rates, fuel costs, underwater cable capacity and other energy related data are not available for many of the islands. For some of the islands for which the energy use is not available, correlations have been used in order to estimate annual and daily electric and heating load profiles. For the electric load estimation, correlations used population patterns and type of activities from islands whose electricity consumption and load profiles were known. To estimate heating loads, correlations based on standard values for the ratio between energy required per household and degree-days have been used. These standards are given by the Energy Information Administration for different types of households and heating systems [8]. Electric and heating load profiles were used to model alternative power systems as shown further in this report.
16
Renewable Resources in Offshore New England
Availability of wind resources is the main criteria for evaluating the feasibility of installing wind turbines at a site. Power produced by a wind turbine varies as the cube of wind speed. Ideally wind speeds should be monitored at the site under consideration. However considering the broad scope of this study, secondary data has been used to evaluate the wind resources for the specific case studies presented later in the report.
4.1 Wind Resource
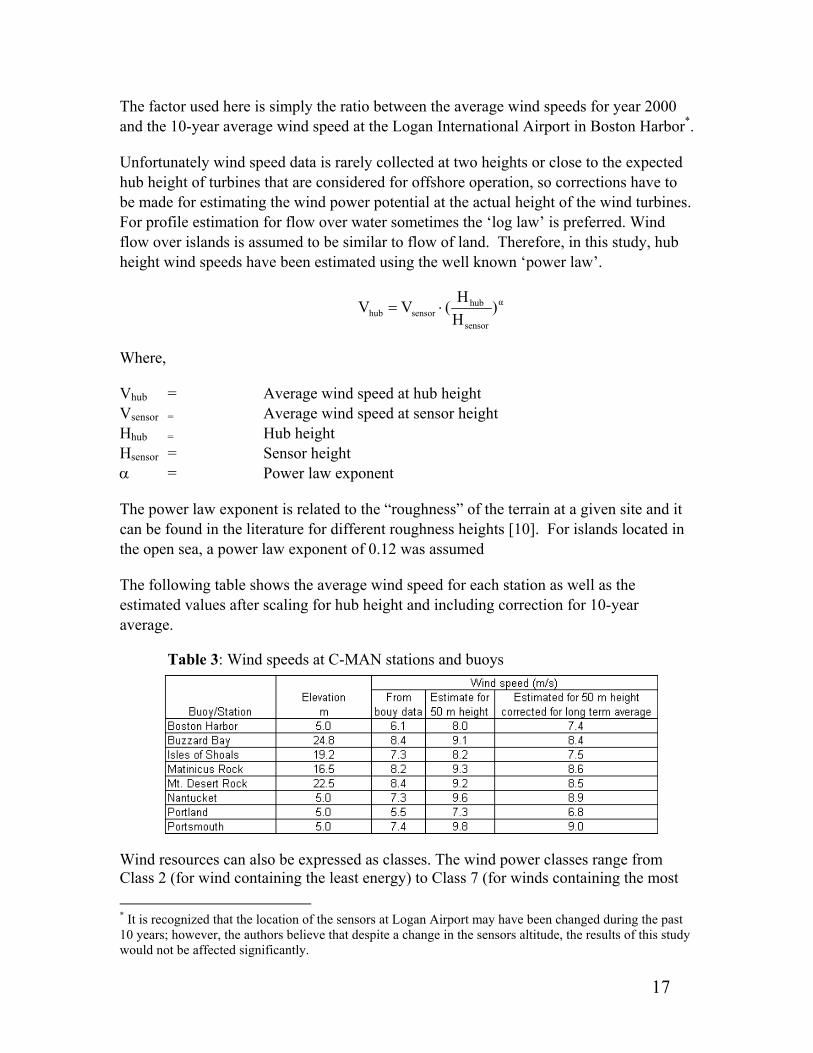
The most complete source for offshore wind data in New England is a network of buoys and stations operated by the National Oceanic and Atmospheric Administration (NOAA) [9]. Moored buoys and C-MAN (Coastal Marine Automated Network) stations record data on wind, waves, temperature and barometric pressure. The following map shows the location of buoys and stations off the New England shore.
Figure 6: C-MAN stations and buoys run by NOAA in the Northeast region
It is possible to obtain several years of data from these measurement sites. However, not all yearly data sets are complete and, because of inter-annual variation, not all complete yearly data sets are representative of the local wind resource. For this project, data for year 2000 was chosen, since complete data sets were available for each station for that year. In order to estimate the average wind speeds in buoys and stations over a longer period of time, a correction factor was introduced to adjust the data set for year 2000.
17
The factor used here is simply the ratio between the average wind speeds for year 2000 and the 10-year average wind speed at the Logan International Airport in Boston Harbor*.
Unfortunately wind speed data is rarely collected at two heights or close to the expected hub height of turbines that are considered for offshore operation, so corrections have to be made for estimating the wind power potential at the actual height of the wind turbines. For profile estimation for flow over water sometimes the ‘log law’ is preferred. Wind flow over islands is assumed to be similar to flow of land. Therefore, in this study, hub height wind speeds have been estimated using the well known ‘power law’.
α
sensor
hubsensorhub )
HH(VV ⋅=
Where,
Vhub = Average wind speed at hub height Vsensor = Average wind speed at sensor height Hhub = Hub height Hsensor = Sensor height α = Power law exponent
The power law exponent is related to the “roughness” of the terrain at a given site and it can be found in the literature for different roughness heights [10]. For islands located in the open sea, a power law exponent of 0.12 was assumed
The following table shows the average wind speed for each station as well as the estimated values after scaling for hub height and including correction for 10-year average.
Table 3: Wind speeds at C-MAN stations and buoys
Wind resources can also be expressed as classes. The wind power classes range from Class 2 (for wind containing the least energy) to Class 7 (for winds containing the most * It is recognized that the location of the sensors at Logan Airport may have been changed during the past 10 years; however, the authors believe that despite a change in the sensors altitude, the results of this study would not be affected significantly.
18
energy)[10]. It can be seen from the table that the New England offshore wind environment consists of class 5 and 6 sites, which represents an excellent wind resource for commercial wind energy development. For comparison purposes, the average wind speeds shown in the table are, 1.28 times as high as the average wind speed at Logan Airport, Boston. This, in turn, represents a 2.13 times increase in the available wind power, which scales as the cube of wind speed.
In addition to the NOAA data collection, RERL has also carried out wind resource assessment at several sites throughout New England in the past several years, including Thompson Island in Boston Harbor [11]. The estimated 10-year average wind speed at Thompson Island, based on the method described above, is 6.33 m/s at 50 m.
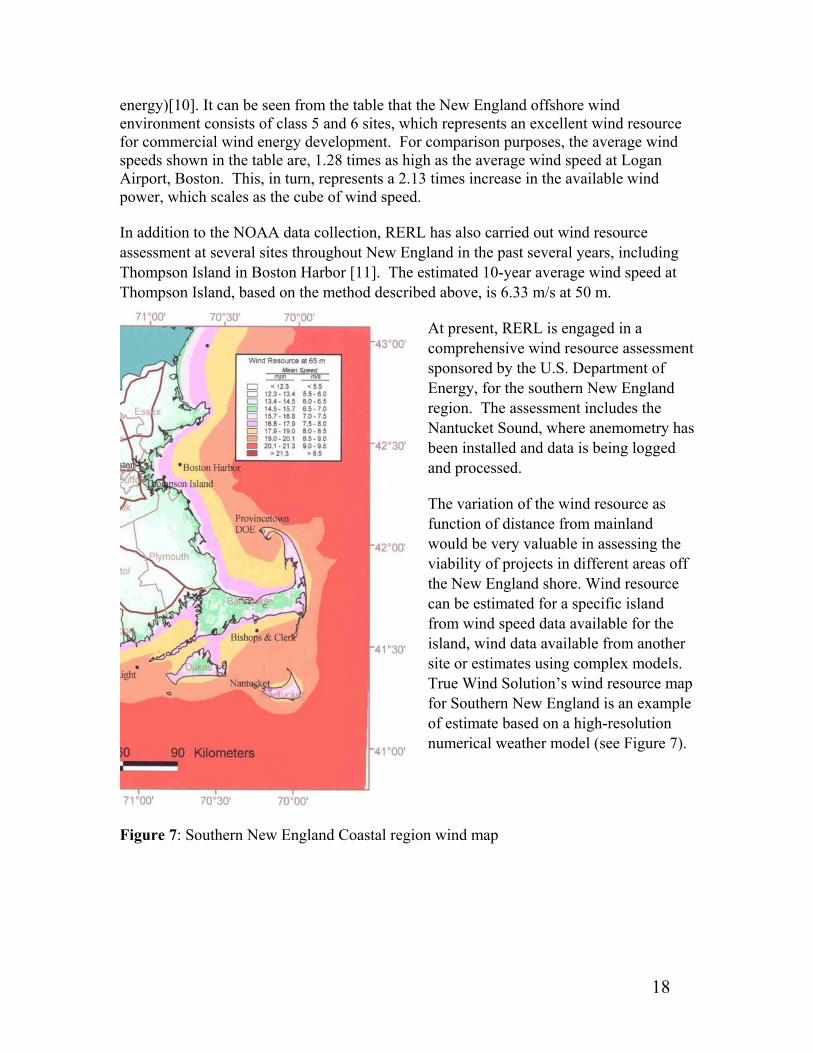
At present, RERL is engaged in a comprehensive wind resource assessment sponsored by the U.S. Department of Energy, for the southern New England region. The assessment includes the Nantucket Sound, where anemometry has been installed and data is being logged and processed.
The variation of the wind resource as function of distance from mainland would be very valuable in assessing the viability of projects in different areas off the New England shore. Wind resource can be estimated for a specific island from wind speed data available for the island, wind data available from another site or estimates using complex models. True Wind Solution’s wind resource map for Southern New England is an example of estimate based on a high-resolution numerical weather model (see Figure 7).
Figure 7: Southern New England Coastal region wind map

19
4.2 Solar Resource
Even though this study concentrates on the potential of wind power, the integration of solar energy into the power systems could be a feasible option, as explained later in this report.
The solar radiation was estimated based on the geographical location (i.e. latitude) of the island and the monthly average clearness index KT. The clearness index is a number between 0 and 1 that indicates the fraction of solar radiation incident on the top of the atmosphere that reaches the earth’s surface. It is a measure of the clearness of the atmosphere. In this project, monthly KT values were obtained from Duffie and Beckman for various locations along the New England shore [12]. Since the islands where PV systems were proposed are less than 20 miles from mainland, the given KT values were used.
Usual values for KT on New England shore vary from 0.49 in the summer to 0.40 in the winter. These values yield an annual average radiation for the region of approximately 3.7 kWh/m2/day. Unfortunately, this solar radiation is not ideal for solar energy development, although, in some applications the introduction of PV modules compensates for the lack of wind during the summer, making a PV/wind hybrid system a plausible solution.

20
Overview of Current Energy Supply Status on New England Islands
This section provides a generalized description of the current energy supply situation on the islands. The energy supply system for an island is dependent mainly on it activities and the resources available. Islands with year round communities need a reliable supply of electricity throughout the year. For this, they could either be connected to the grid or be isolated, in which case, they mostly rely on diesel generator sets for electricity supply. Both have unique issues. At present, some of the grid-connected island communities are facing the necessity of replacing their old underwater transmission cables, as is the case for North Haven and Vinalhaven in Penobscot Bay, ME. In this case fishing practices and other maritime activities have physically damaged the underwater cable. Its replacement will cost Fox Islands Electric Cooperative, the local utility company, several millions of dollars. Heating fuel is brought in from the mainland on a regular basis, an operation that is both costly and environmentally risky. The heating fuel is needed for both water and space heating as well as cooking.
The island communities isolated from the electrical grid are most often supplied electricity by stand-alone diesel generators. This is the case for islands such as Monhegan, ME, Cuttyhunk, MA, and Block Island, RI. In all cases, the local utility takes care of the maintenance and operation of the generators at an annual cost comparable to the cost of the fuel itself, according to several reports from the local utility companies. The cost of fuel, in turn, is an unpredictable variable that represents no less than 25% percent of the cost of energy in this type of power system. The logistics of fuel transportation not only add to this cost, but also create uncertainty in the energy supply. The use of fossil fuels also involves several environmental hazards such as air pollution, noise and the possibility of fuel spills. In isolated islands, as with grid connected ones, heating fuel is periodically delivered from mainland.
For those islands where activities are concentrated in the summer months, power is usually provided by either diesel generators (e.g., Isles of Shoals, NH) or individual PV systems (e.g., Eagle Island, ME), depending on the size of the electrical load. As for the stand-alone diesel systems, issues about fuel cost and transportation as well as other environmental impacts such as air pollution and noise are a serious concern among the residents. The small, individual PV systems are usually used on islands with a few houses or cabins occupied only during the summer. In many of these cases propane is used to power the refrigerators. Here again, the logistics and hazards of fuel transportation are present.
Finally, for the more than 40 lighthouses and meteorological stations located on the New England islands, electricity is supplied by stand-alone power systems, with some of them powered by PV panels [13]. The Coast Guard automated most of the lighthouses during the 80’s and 90’s. Scientific laboratories and stations located on some islands rely, in general, on PV systems for their electricity supply.
21
Power System Options for New England Islands
To address the issue of how best to use wind power for power supply to the New England islands, a number of options have been considered. The introduction of wind power for islands is complicated by the fluctuating nature of wind and the mismatch between electricity demand and wind power supply. While the wind energy on grid-connected islands can be used to offset electricity consumption from the grid, in isolated island relying solely on diesel generator sets, it can be used to reduce fuel consumption by supplying part of the energy from renewable energy. There is also a possibility of siting wind turbines on isolated islands to take advantage of high wind speeds and reduced costs compared to offshore wind farms. There are a number of islands with no human activity or special ecological value that can be used for this purpose. The analysis of this option is left for future studies.
6.1 Grid-connected Islands
For the grid-connected islands, wind turbines to supply electricity to the islands was the first power system analyzed. With such a power system, the island community could actively participate in the generation of their own energy, reducing their dependence on external energy supply, and, in a broader sense, reducing the emission of greenhouse gases and use of nuclear fuel.
Potential economic benefits of grid-connected wind turbines include the use of large wind energy resources available offshore and the possibility to transmit and sell the excess energy (i.e. the power generated by the wind turbines that exceeds the load at any given moment) to the electric grid on the mainland. In this way, the islands could see their current electricity bills reduced, depending on factors such as the size of the wind power system and the selling price of excess energy to the onshore utility.
The option of using wind/diesel hybrid systems was studied as a second option. These systems could supply not only electricity, but also heat to the community, decreasing the amount of heating fuel shipped to the islands every week. At present, many islands are facing the possibility of replacing the existing underwater cables because of severe damaged caused by fishing and other nautical activities. For some of these islands, a stand-alone wind/diesel hybrid system could be a viable alternative.
6.2 Isolated Islands
For isolated islands with year round populations, wind/diesel hybrid systems seem to be the appropriate solution. A comparative study between hybrid systems and existing diesel only systems for two such cases has been carried out. It will be shown that wind/diesel systems offer the islands not only economic benefit by reducing the amount of fuel used by the diesel generators, but also many social and environmental benefits. At a local

22
level, a wind/diesel hybrid system could reduce the dependence on unpredictable fuel prices, increase the power supply reliability, improve the air quality on the islands, reduce the risk of oil spills, and achieve a greater sense of social responsibility about energy consumption and the environment.
The islands where the activities reach their peak during the summer (e.g., tourism, summer camps, special events) are perhaps the most difficult to address in terms of energy supply strategies and power system design. The large fluctuation in the energy load profile over the year makes this case unique. Since power is required at a very specific time of the year, it may seem that renewable resources, which are more randomly distributed over time, are not appropriate to deal with this situation. However, a wind/diesel hybrid system could save fuel and money over the lifetime of the project. Later in this report, a case study will illustrate how those savings can be achieved and how much they represent in terms of the cost of each unit of energy generated.
Islands where there is only electrical equipment and no population usually have a more stable energy demand over the year. In these cases, the systems are used to provide power to communication equipment, meteorological stations, lighthouses and the like, that require a fairly constant and highly reliable source of energy. For these remote systems, the options considered include more than one energy resource, as well as energy storage, to increase power redundancy. A combination of photovoltaic modules and wind turbines with a storage battery bank is a reasonable solution. In fact, since the solar resource is greater in summer than it is in winter and the wind resource in New England increases in winter a PV/Wind system has a smoother power output over the year, following the load more closely.
On islands, which are preserved for environmental and ecological purposes, development is usually not desirable. During the summer, some of these islands receive visitors who stay for the day as part of educational tours, or scientific expeditions that spend several days on the islands conducting research studies. In the latter case, some energy supply might be required, but these should be studied on a case-by-case basis.

23
Description and Modeling of the Potential Power Systems
Two basic types of systems have been modeled, grid connected wind turbines and hybrid systems. Use of wind turbines on grid-connected islands reduces their electricity consumption from the grid. The penetration of wind energy (percentage of power supplied by wind to the total power) depends on a variety of factors including undersea cable capacity, land availability on the island, public acceptance and economics. Hybrid systems can bring together a more diverse mix of sources. They are typically used for isolated applications. A general description of these two basic systems follows.
7.1 Grid-connected Wind Turbines via Underwater Cables
In these systems, both an underwater cable carrying power from the main electric grid onshore and the wind turbines would supply the local electric grid on the island. Whenever the electricity generated by the wind turbines exceeds the island electric load, the excess electricity would be transmitted back to mainland through the underwater cable. The wind turbine recently installed in Hull, MA, a Vestas V47 660 kW, represents a good example of this type of power system, although in this case the wind turbine is located onshore.
The fundamental components of an island-based, grid-connected wind turbine are briefly described below.
7.1.1 Wind Turbines Generators
Technically, all wind turbines ranging in power from about 50 kW to 2500 kW or more could be suitable for this type of application. For inhabited islands other factors which may restrict the size and number of wind turbines to be installed on a given island should be taken into account. These include population safety, land availability, wildlife disturbance, noise and visual impact. For deserted islands, some of these issues are not of concern.
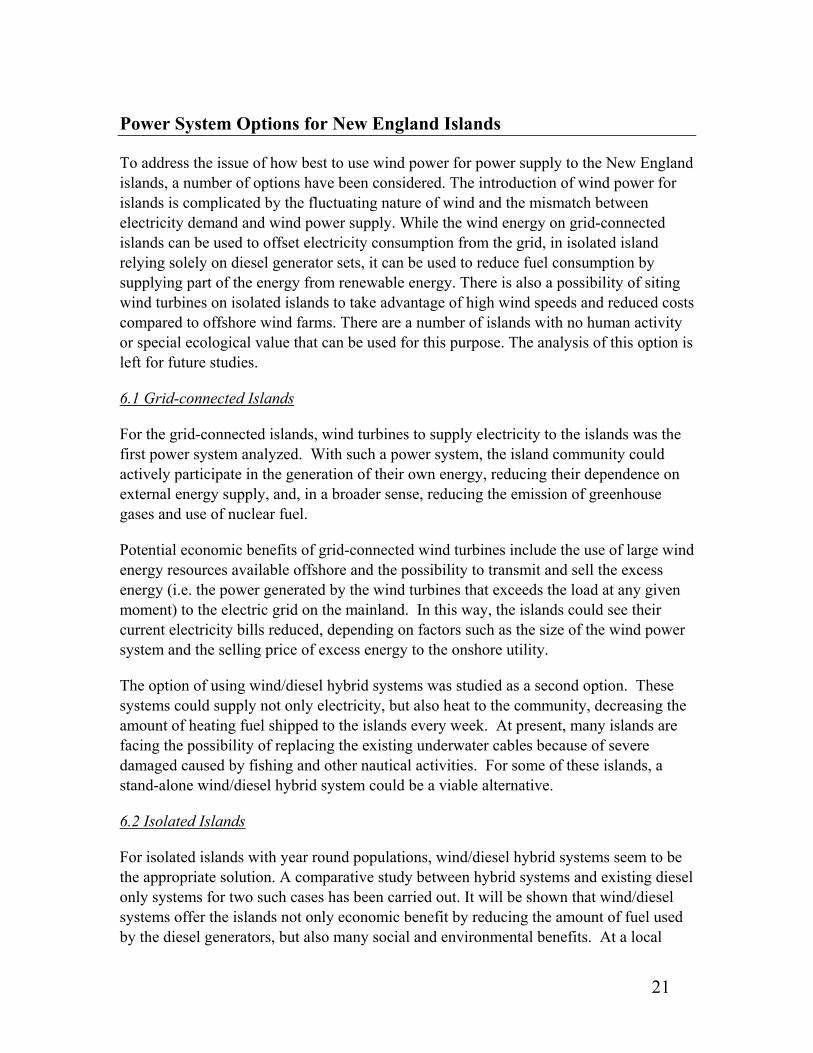
The basic components of the most commonly used horizontal axis wind turbine are: the rotor, the drive train, the electrical system and the power control system. The power available from wind is P = (1/2) ρAU3 where ρ denoted density of air, A, the area of the rotor and U, the air velocity. In practice, the power available from a wind turbine can be shown by a machine power curve. A typical power curve is shown in Figure 8. These curves, which can be obtained from the turbine suppliers, are based on test data. Three characteristics velocities are illustrated on the curve: • The cut-in speed – the wind speed at which the turbine starts to generate power. • The rated velocity – the wind velocity at which the turbine reaches the rated power.
24
• The cut out velocity – the wind speed at which the turbine is shut down to keep loads and generator power from reaching damaging levels.
7.1.1.1 Specific Data Applied to Case Studies
In order to estimate the energy generated by grid-connected wind turbines, wind speed time series data and the wind turbine power curves were used. Four wind turbines have been considered for grid-connected wind power systems, with power outputs ranging from 660 kW to 1500 kW. The current cost per kW of state-of-the-art wind turbines in this power range varies from $1,000 to $1,200, with the lower cost corresponding to the larger turbines. These figures do not include transportation and installation costs, which for a site located on an island are a substantial part of the total cost of the system.
The power curves and other technical specifications of these wind turbines are available from manufacturer websites [14].
Installation costs were estimated from the detailed installation cost breakdown prepared by RERL for a case study of wind development on Cuttyhunk Island, MA [7]. Wind turbine installation includes site preparation, electrical equipment and material, concrete for foundation and turbine assembly.
• Site preparation includes transportation of the equipment and materials to the island, construction or improvement of roads to the site, digging for the foundation and other smaller tasks. Site preparation has been estimated at 5% of the cost of the turbine.
• Electrical equipment and materials include transformers and cables, switchgear, lightning protection and equipment installation. Electrical equipment and materials represent, approximately, 17% of the cost of the turbine.
Figure 8: Power output curve for a wind turbine
25
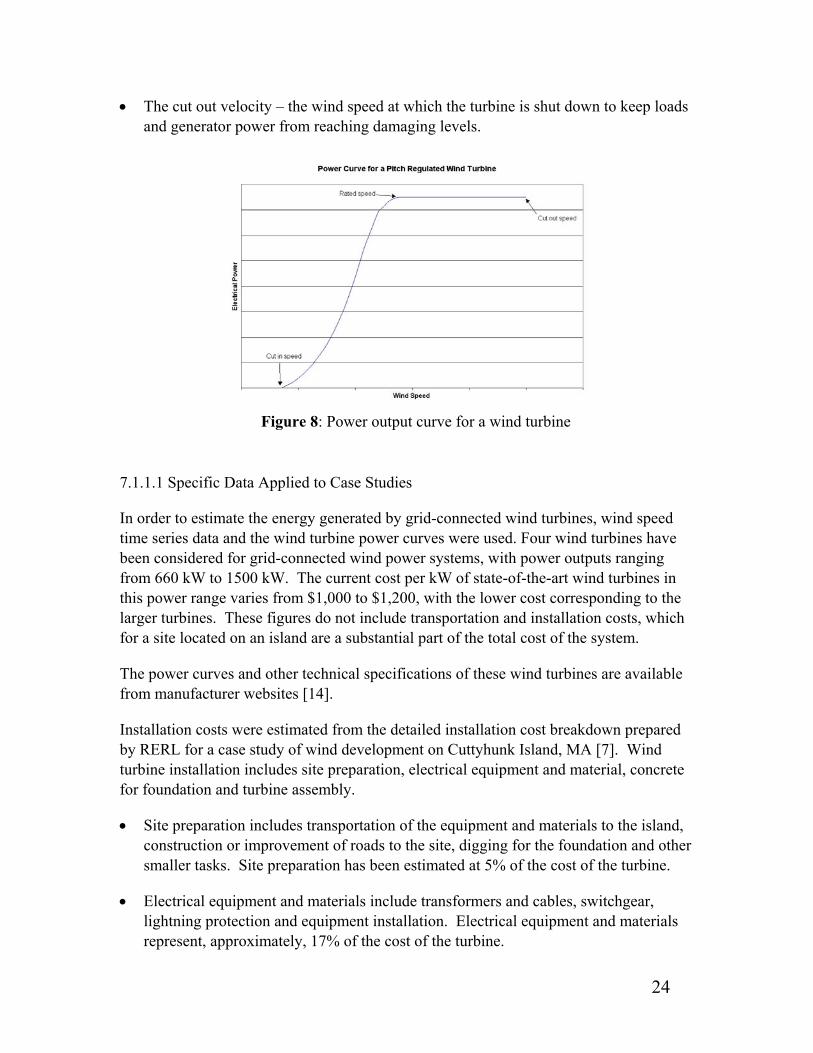
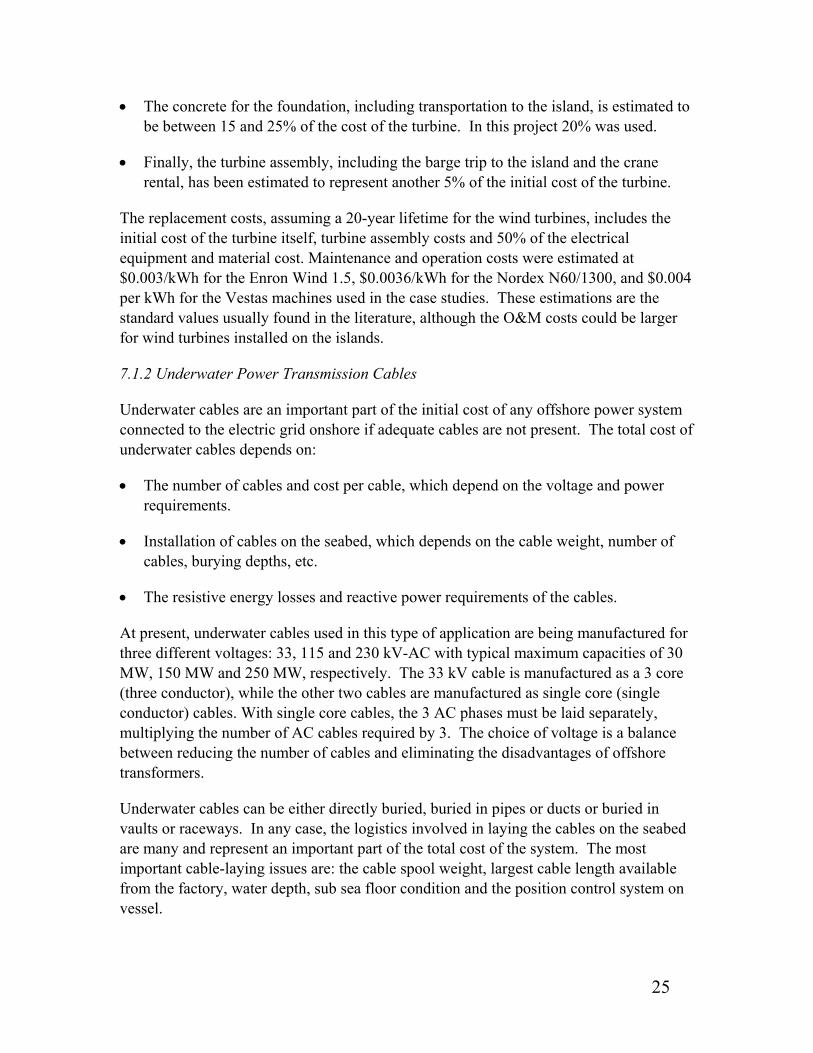
• The concrete for the foundation, including transportation to the island, is estimated to be between 15 and 25% of the cost of the turbine. In this project 20% was used.
• Finally, the turbine assembly, including the barge trip to the island and the crane rental, has been estimated to represent another 5% of the initial cost of the turbine.
The replacement costs, assuming a 20-year lifetime for the wind turbines, includes the initial cost of the turbine itself, turbine assembly costs and 50% of the electrical equipment and material cost. Maintenance and operation costs were estimated at $0.003/kWh for the Enron Wind 1.5, $0.0036/kWh for the Nordex N60/1300, and $0.004 per kWh for the Vestas machines used in the case studies. These estimations are the standard values usually found in the literature, although the O&M costs could be larger for wind turbines installed on the islands.
7.1.2 Underwater Power Transmission Cables
Underwater cables are an important part of the initial cost of any offshore power system connected to the electric grid onshore if adequate cables are not present. The total cost of underwater cables depends on:
• The number of cables and cost per cable, which depend on the voltage and power requirements.
• Installation of cables on the seabed, which depends on the cable weight, number of cables, burying depths, etc.
• The resistive energy losses and reactive power requirements of the cables.
At present, underwater cables used in this type of application are being manufactured for three different voltages: 33, 115 and 230 kV-AC with typical maximum capacities of 30 MW, 150 MW and 250 MW, respectively. The 33 kV cable is manufactured as a 3 core (three conductor), while the other two cables are manufactured as single core (single conductor) cables. With single core cables, the 3 AC phases must be laid separately, multiplying the number of AC cables required by 3. The choice of voltage is a balance between reducing the number of cables and eliminating the disadvantages of offshore transformers.
Underwater cables can be either directly buried, buried in pipes or ducts or buried in vaults or raceways. In any case, the logistics involved in laying the cables on the seabed are many and represent an important part of the total cost of the system. The most important cable-laying issues are: the cable spool weight, largest cable length available from the factory, water depth, sub sea floor condition and the position control system on vessel.

26
7.1.2.1 Specific Data Applied to Case Studies
The cost of the cables themselves vary from $150 per meter for the 33 kV, 3-core cable up to $250 per meter for the 115 and 230 kV, single core cables [15]. Transformers initial cost range between $25 and $35 per kVA [16].
The cost of laying the cables, obtained from projects already realized, range approximately from $180 per meter for the 33 kV cable to $600 per meter for high voltage cables [15]. The former has been used in this study as the transmission voltage is 33 kV.
7.2 Wind/Diesel Hybrid Power Systems
Many wind turbines are not connected to large grids, but to small, independent, diesel powered grids, in which the wind generators may be a large fraction of the total generating capacity. Adding wind power to the system can reduce fuel costs but its design is more complex due to mismatch between fluctuations in the winds and variations in the load. Traditionally, communities isolated from the centralized grid have used diesel generators to supply their needed electricity.
Wind/diesel power systems can be designed to operate in two distinct modes: wind with continuous diesel operation (simple systems) and wind-only capability (advanced systems). In this study advanced systems that allow the diesel generators to shut down have been considered, in addition to simple ones.
In order to find the optimum configuration among the large number of potential hybrid systems, the Hybrid Optimization Model for Electric Renewables (HOMER) computer software has been used [17]. HOMER has been developed by the National Renewable Energy Laboratory (NREL) to simulate and optimize stand-alone hybrid power systems. HOMER is able to analyze the performance of many potential system configurations (i.e. different combinations of wind turbines, diesel generators, PV modules, battery banks).
The model requires many inputs such as primary and deferrable loads, solar and wind resources, technical specifications and costs of the system components, and several parameters regarding energy generation strategies and life cycle economics. As outputs, the model offers summaries of system performance and operation, time series of power flows, life cycle economic analysis and cost of energy for every possible configuration. An explanation of the terms used in HOMER is given in Appendix C.
When a more detailed analysis for one particular configuration is needed, then the Hybrid2 computer software, developed by RERL at University of Massachusetts, Amherst and NREL, has been used, as in the analysis of Cuttyhunk Island, MA [18].

27
In all cases, the hybrid systems were compared to a base case where a diesel generator is used to supply the entire load. This allows examination of how much the introduction of renewable energy resources affects the performance and the economics of the system.
The characteristics of the basic components of wind/diesel hybrid power systems and their technical and economic parameters used for modeling are described below.
7.2.1 Diesel Generators
A conventional diesel generator set produces AC power and consists of a diesel engine connected to a synchronous generator. A governor maintains the frequency of AC power. A voltage regulator on the generator controls the voltage. The fuel consumption depends on the power output.
Diesel generators should be operated at some minimum power output to ensure a reasonable engine lifetime. Manufacturers often recommend a minimum operating power level of 30 % of the rated power. However, on small isolated loads it is common to run them as low 5 % of the rated power. This is the minimum level used in this study.
When multiple diesel generators are present some type of control is necessary to ensure that the total power output of all diesels simultaneously matches the electrical load. This can sometimes be accomplished manually by turning the diesel generators on or off as the load rises and falls. In most wind/diesel hybrid systems, some form of automated control is necessary to maintain stable power.
7.2.1.1 Specific Data Applied to Case Studies
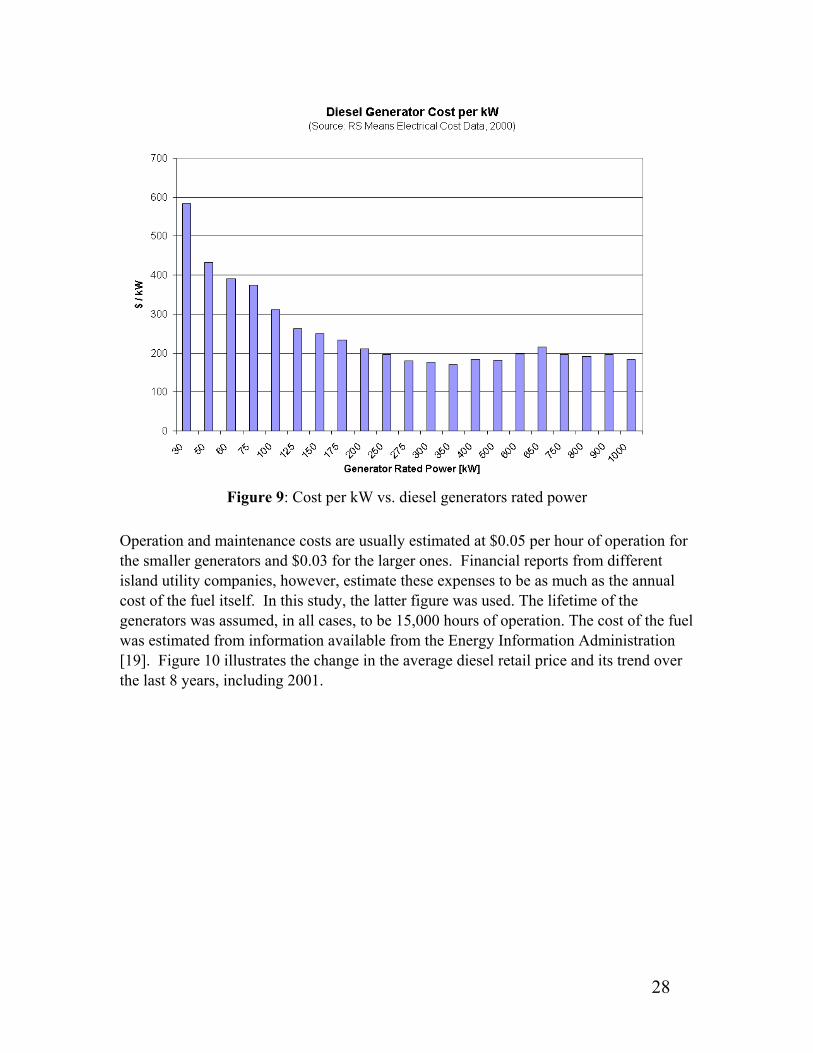
The initial cost of the diesel generators was obtained from RS Means Electrical Cost Data [16]. Figure 9 illustrates the installed cost per kW as a function of the rated power of the diesel generator.
28
Figure 9: Cost per kW vs. diesel generators rated power
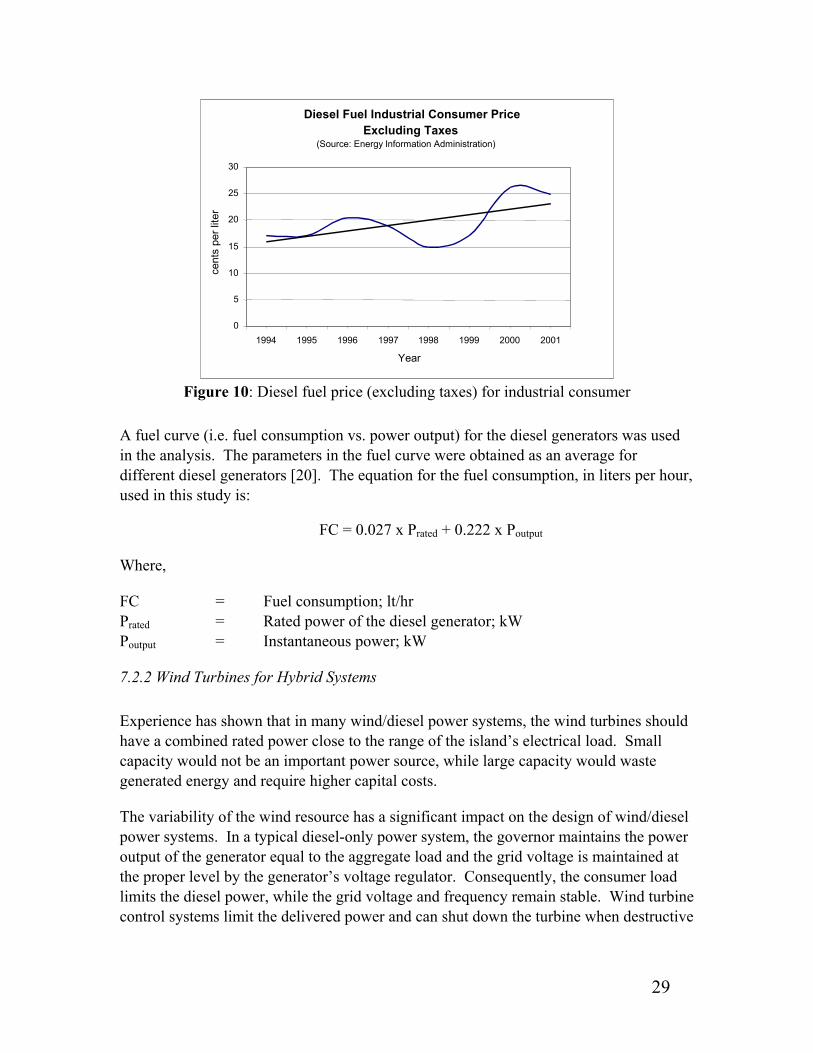
Operation and maintenance costs are usually estimated at $0.05 per hour of operation for the smaller generators and $0.03 for the larger ones. Financial reports from different island utility companies, however, estimate these expenses to be as much as the annual cost of the fuel itself. In this study, the latter figure was used. The lifetime of the generators was assumed, in all cases, to be 15,000 hours of operation. The cost of the fuel was estimated from information available from the Energy Information Administration [19]. Figure 10 illustrates the change in the average diesel retail price and its trend over the last 8 years, including 2001.
29
Diesel Fuel Industrial Consumer Price
Excluding Taxes (Source: Energy Information Administration)
0
5
10
15
20
25
30
1994 1995 1996 1997 1998 1999 2000 2001
Year
cent
s pe
r lite
r
Figure 10: Diesel fuel price (excluding taxes) for industrial consumer
A fuel curve (i.e. fuel consumption vs. power output) for the diesel generators was used in the analysis. The parameters in the fuel curve were obtained as an average for different diesel generators [20]. The equation for the fuel consumption, in liters per hour, used in this study is:
FC = 0.027 x Prated + 0.222 x Poutput
Where,
FC = Fuel consumption; lt/hr Prated = Rated power of the diesel generator; kW Poutput = Instantaneous power; kW
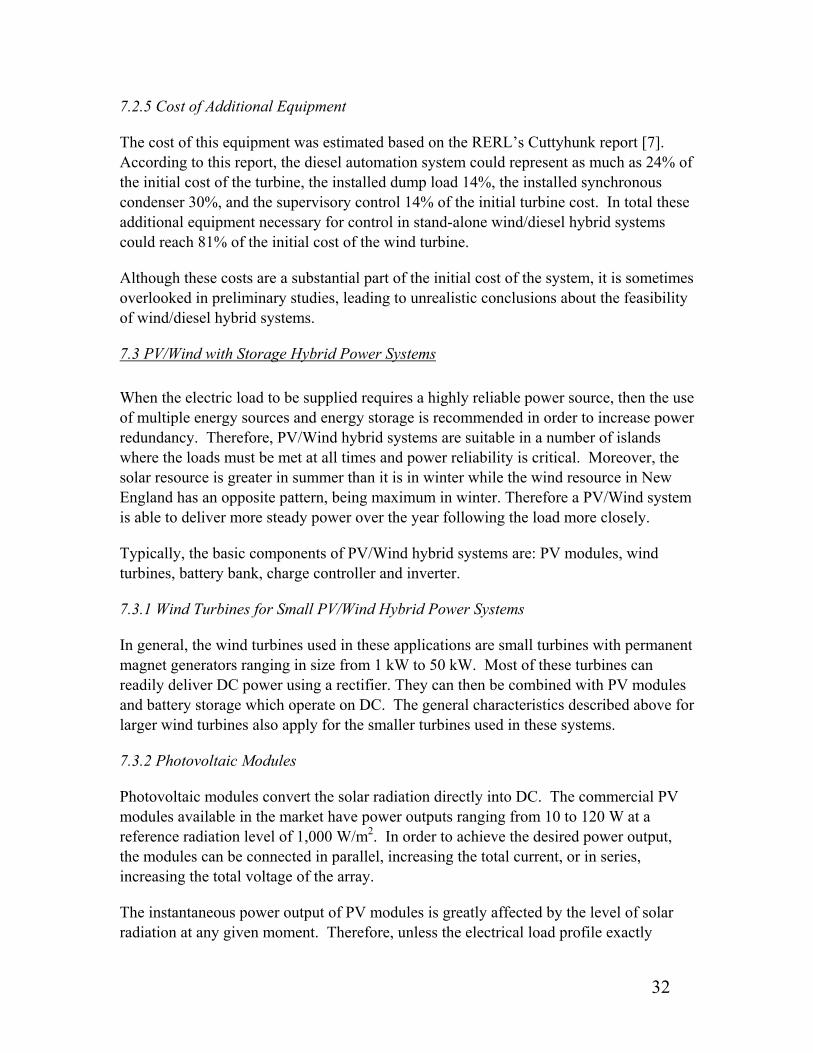
7.2.2 Wind Turbines for Hybrid Systems
Experience has shown that in many wind/diesel power systems, the wind turbines should have a combined rated power close to the range of the island’s electrical load. Small capacity would not be an important power source, while large capacity would waste generated energy and require higher capital costs.
The variability of the wind resource has a significant impact on the design of wind/diesel power systems. In a typical diesel-only power system, the governor maintains the power output of the generator equal to the aggregate load and the grid voltage is maintained at the proper level by the generator’s voltage regulator. Consequently, the consumer load limits the diesel power, while the grid voltage and frequency remain stable. Wind turbine control systems limit the delivered power and can shut down the turbine when destructive

30
high winds are present. Most wind turbine controls, however, do not limit the wind power to match the changing energy demand.
In systems where the wind turbine capacity is larger than the load, the turbines may at times be able to provide the entire load, thereby allowing all the diesel generators to shut off. In such cases the control system must be configured to maintain the system frequency and voltage. For this purpose these systems normally have specially designed dump loads, and often include power electronic converters and short-term storage.
7.2.2.1 Specific Data Applied to Case Studies
Three different wind turbines have been used to analyze potential wind/diesel hybrid systems: the Atlantic Orient Corporation’s AOC 15/50, the Northern Power System’s NW100/19, and the Fuhrlaender’s FL250, with 50, 100 and 250 kW of rated power respectively. Power curves and technical specifications of wind turbines were provided by the manufacturers [14].
The installation costs for these wind turbines were estimated as before, following the detailed cost breakdown for Cuttyhunk, MA, done by the RERL [7].
Replacement costs were also estimated as before, and they include the cost of the new turbine, the cost of assembling the turbine (including transportation to the island), and a percentage of the cost of the electrical equipment and materials. The lifetime of the wind turbines was assumed at 20 years in all cases.
Maintenance and operation costs were estimated at $0.054/kWh for the FL250, and 0.10/kWh for the smaller turbines. Estimations are based on commonly accepted standards.
7.2.3 Additional Hybrid Power System Components
In addition to the items discussed above, a wind/diesel power system may contain the following components: a dump load, a synchronous condenser, electric storage, power converters and supervisory control. The extent to which these components are used depends on the resource characteristics and the system configuration considered.
As mentioned previously, successful operation of the power system requires that there be a sink for excess power and a source when there is shortage of wind-generated power. The diesel generators are typically used to respond to the power shortfalls in a wind/diesel system. The instantaneous dissipation of excess power is essential to the stability of the grid voltage and frequency. To accomplish this end, a dump load is often used. Dump loads are typically devices that incorporate power electronics and resistors that waste or “dump” the energy as heat. Generally, the dump load is sized so that its

31
capacity roughly equals the maximum power output of the wind turbine minus the minimum electrical load.
One of the primary goals of a wind/diesel system is to reduce the run-time of the diesels. When wind speeds are sufficiently high and the primary load is at a level such that the wind power can supply the entire primary load, the diesel generator(s) can often be shut down. Powering the system only with wind energy necessitates additional equipment to stabilize the grid frequency and voltage of the power. These other components could include an inverter, a rotary converter and a synchronous condenser. Inverters or rotary converters are used in conjunction with electric energy storage. Synchronous condensers provide reactive power for the induction generator on the wind machine.
7.2.4 Hybrid Power System Controls
In order to successfully integrate many of the components listed above, a wind/diesel power system requires some form of control system that includes communication between the different components. Therefore, most hybrid power systems include system controls to ensure stable power is provided to the consumers. For example, in the case of a wind/diesel power system with multiple diesel generators, it would be necessary to have a comprehensive method of dispatching the diesel generators and regulating the flow of power. The controllers may include individual controllers specific to each component and/or a supervisory controller responsible for some or all components. The control strategy is crucial in determining the power system’s reliability and efficiency, and therefore its operation and economic performance.
The supervisory, or central, controller currently provides the best option in these situations. Its functions may, depending on the particular system, include turning diesel generators on or off, adjusting power set points, allocating power to heating and dump loads, and charging batteries or other storage. With the advances in computer and communication technology, wind/diesel system controllers have improved immensely, and some early difficulties experienced with wind/diesel power systems were overcome. Modern supervisory controllers generally consist of a Programmable Logic Controller (PLC) or a high speed PC computer with a comprehensive software program.
As mentioned previously, it becomes increasingly more complex to control the power system when all the diesel generators are shut off and the wind turbine is allowed to operate alone. These advanced wind/diesel systems require intelligent control strategies and equipment, such as a dump load, synchronous condenser, or electrical energy storage to properly manage the rapid fluctuating wind power and successfully regulate system voltage and frequency.
32
7.2.5 Cost of Additional Equipment
The cost of this equipment was estimated based on the RERL’s Cuttyhunk report [7]. According to this report, the diesel automation system could represent as much as 24% of the initial cost of the turbine, the installed dump load 14%, the installed synchronous condenser 30%, and the supervisory control 14% of the initial turbine cost. In total these additional equipment necessary for control in stand-alone wind/diesel hybrid systems could reach 81% of the initial cost of the wind turbine.
Although these costs are a substantial part of the initial cost of the system, it is sometimes overlooked in preliminary studies, leading to unrealistic conclusions about the feasibility of wind/diesel hybrid systems.
7.3 PV/Wind with Storage Hybrid Power Systems
When the electric load to be supplied requires a highly reliable power source, then the use of multiple energy sources and energy storage is recommended in order to increase power redundancy. Therefore, PV/Wind hybrid systems are suitable in a number of islands where the loads must be met at all times and power reliability is critical. Moreover, the solar resource is greater in summer than it is in winter while the wind resource in New England has an opposite pattern, being maximum in winter. Therefore a PV/Wind system is able to deliver more steady power over the year following the load more closely.
Typically, the basic components of PV/Wind hybrid systems are: PV modules, wind turbines, battery bank, charge controller and inverter.
7.3.1 Wind Turbines for Small PV/Wind Hybrid Power Systems
In general, the wind turbines used in these applications are small turbines with permanent magnet generators ranging in size from 1 kW to 50 kW. Most of these turbines can readily deliver DC power using a rectifier. They can then be combined with PV modules and battery storage which operate on DC. The general characteristics described above for larger wind turbines also apply for the smaller turbines used in these systems.
7.3.2 Photovoltaic Modules
Photovoltaic modules convert the solar radiation directly into DC. The commercial PV modules available in the market have power outputs ranging from 10 to 120 W at a reference radiation level of 1,000 W/m2. In order to achieve the desired power output, the modules can be connected in parallel, increasing the total current, or in series, increasing the total voltage of the array.
The instantaneous power output of PV modules is greatly affected by the level of solar radiation at any given moment. Therefore, unless the electrical load profile exactly

33
matches the solar radiation profile, it is necessary to combine PV modules with another source of power or use some form of energy storage.
7.3.2.1 Specific Data Applied to Case Studies
Commercially available PV modules were considered for the PV/wind hybrid system studied [21]. The initial cost of a PV module was set at $6.50 per watt (provided 100 W modules or larger are used) and installation costs, including mounting hardware and labor, were assumed at 15% of the cost of the modules. Maintenance and operation costs are usually very low. In this project maintenance costs per year of 1 % of the initial cost of the PV module was used. A lifetime of 20 years and a derating factor of 90 % were assumed for the module array. The derating factor is a scaling factor applied to the PV array output to account for losses such as different operating voltages and soiling of the panels.
7.3.3 Battery Bank, Charge Controller and Inverter
Because wind turbine generators and PV modules produce a continuous supply of power, researchers and developers of PV/wind systems have sought a reliable and convenient form of electrical energy storage to capture the excess solar or wind power and store it for later use. Lead-acid deep cycle batteries are most often used for electrical energy storage in hybrid power systems. However, other forms of storage such as composite flywheels are emerging to replace batteries.
Batteries are inherently DC devices and therefore require some kind of power converter to convert the wind turbine generated AC power to the DC power and back to AC power for the electric grid. Bi-directional inverters or rotary converters are often employed for this purpose. Their overall charging and discharging efficiency is about 80%.
Batteries require charge controllers to prevent them from being overcharged or discharged beyond a certain level set in advance. This charge controller protects the batteries from internal damages, thus extending their lifetime.
Inverters are needed to convert the DC power from the battery bank into AC power to supply the AC load. These devices, which usually include a built-in charge controller, are also well known and further description can be found in catalogues from different manufacturers [22].
7.3.3.1 Specific Data Applied to Case Studies
For the systems where battery storage was introduced, deep-cycle lead-acid batteries were considered. The average initial cost of the batteries given by retailers is $110 per kWh. Maintenance and operation costs were estimated at 10% of initial cost per year. With a minimum state of charge of 40%, the battery life was estimated at 500 full cycles, and a round trip efficiency at 80% [23].

34
The initial cost of the inverters does not follow the same pattern as other equipment where the cost per unit of rated power output decreases when the rated power increases. For inverters, according to price lists published by retailers and manufacturers, the opposite is true. In this project, the initial cost for different inverters was obtained from the price given by Xantrex Technology, Arlington, WA. The costs range from $1,029 for a 1.5 kW inverter to $17,000 for a 16.5 kW. Maintenance and operation cost were estimated at 5 % of the initial cost. A 20-year lifetime and 90 % efficiency was assumed for the inverters [22].
The initial and replacement costs of these devices are considered in the economic analysis of PV/Wind hybrid system carried out in this project.
7.4 Loads
The following is a description of other inputs required by the computer model, such as electric and heating loads and general life cycle economic parameters. The administrative and distribution costs on the islands are briefly described.
7.4.1 Primary and Optional Loads
Hybrid power systems can have both primary and optional electrical loads. A primary load is an electrical load that must be satisfied at all times. Any failure to supply the full primary electric load is defined as a power outage. Primary loads in hybrid power systems for residential consumers generally consist of lighting, water heating and refrigeration. In general, primary load is the electrical load.
Optional electric loads are loads that utilize surplus power that would otherwise be wasted. For example, electric space heating can function as an optional load if it is used as supplementary heating. Because the surplus electricity would otherwise have to be wasted as heat into the surrounding, using the excess power for heating allows the wind/diesel system to function as a combined heat and power system.
7.4.2 Electrical Loads
The annual electrical loads for the studied islands were obtained either from the Island Institute, Rockland, ME [24] or from the power system operators on the islands. The monthly and daily profiles, however, were not always available. In order to estimate the monthly electric load profile for a particular island, necessary to model and analyze the performance of the power systems, the monthly energy use per capita was calculated for another island in the same classification group and then, based on the monthly average population of the island to be modeled, a correlation was established and the monthly load estimated. Final adjustments in the energy use per capita were made in order to match the estimated total annual energy consumption with the actual value for the island. Figure 3 illustrates the correlation between monthly population and electric load profile

35
for an actual case. Electricity consumption is maximum in the summer when the population is at its peak. Daily profiles were estimated based on the time of the day when the maximum and minimum loads occur on the reference island. The electric load profiles estimated by this procedure are shown later in the case studies section.
7.4.3 Heating Loads
Heating loads were estimated using standards given by the Energy Information Administration (EIA) of the U.S Department of Energy (DOE) [8]. EIA gives average values for the ratio between the kWh required per household and the number of degree-days for different types of households and heating fuels. Then, the monthly average energy required can be calculated as:
monthhouseEIAheat DDNRE ××=
Where,
Eheat = Monthly average energy required by space heating; kWh/month REIA = Ratio between the kWh required per household and the number of
degree-days; kWh/DD/household Nhouse = Number of households being heated in a given month DDmonth = Monthly average Degree-Days; DD/month
For single-family households using fuel oil as heating fuel, the ratio is approximately 3.50 kWh/degree-day/household. Then, if the number of households being heated and the number of degree-days in a particular month are known, it is possible to estimate the kWh required on the island during that month.
Since this is a very general estimation, in all cases studied, a sensitivity analysis was performed, rescaling the annual heating load to 75 %, 50 % and 25 % of the calculated value. Heating load profiles are shown later in the case studies section.
7.5 Administrative and Distribution Costs
Reports from power companies in Cuttyhunk, MA, Block Island, RI, and Monhegan Island, ME, divide the operating expenses into power production and non-power production expenses [25,26,27]. Power production expenses account for the cost of the diesel fuel and the cost of maintenance and operation of the diesel generators. These expenses have already been described. Non-power production expenses include electricity distribution, maintaining customer accounts, administrative costs, depreciation and taxes. According to these reports, they add up to 50% of the total operating expenses. In this study, for those islands where the administrative and distribution costs were not available, this figure was used as the best estimate.

36
7.6 Life cycle Economic Parameters
In order to perform a life cycle economic analysis several general assumptions have to be made regarding the economic parameters. The assumed values were kept constant for all the alternative power systems for a given island and for all islands analyzed to facilitate comparison of results.
In order to simplify the analysis, down payments of initial capital costs are not considered in any case. This assumption may benefit the power systems with larger initial capital costs.
Initial capital costs, were assumed to be paid in annual levelized installments over the lifetime of the project according to the following equation:
1i)(1i)(1iCCC n
n
cap −++⋅
⋅=
Where,
Ccap = Annualized capital cost or an end-of-period payment in a uniform series of payments over n periods at i discount rate; $/year
CC = Capital cost to annualize; $ i = Real interest rate; fraction n = Number of payments
Replacement costs are to be paid at the end of each equipment lifetime. In this study, replacement costs are first brought to present values, and then annualized according to the following expression:
1i)(1iRCC nrepl −+
⋅=
Where,
Crepl = Annualized replacement cost; $/year RC = Replacement cost to annualize; $ i = Real interest rate; fraction n = Years in which the replacement has to be made; years
For all power systems, the real interest rate was initially established at 4% and the lifetime was assumed as 20 years unless otherwise stated.

37
Case Studies
In this project, the performance and the economics of different power systems have been evaluated for the following four islands: Fox Islands, ME, Monhegan Island, ME, Isles of Shoals, NH, and Matinicus Rock Island, ME. Each of these islands has different characteristics.
Technical issues analyzed include the configuration of the system, size of system components and performance of the system over a year, including hourly prediction of energy production, fuel consumption, energy served and excess energy generated. The life cycle economic analysis takes into account the initial capital cost and the operating and maintenance costs of the power systems, along with other economic factors. Annualized costs and levelized cost of energy are calculated for each of the case studies.
8.1 Case I Grid-connected Island Community: Fox Islands
8.1.1 Description of the Islands
Fox Islands are a group of islands located in Penobscot Bay, in mid-coast Maine, at about 12 miles from the mainland. The two major islands in the group are Vinalhaven and North Haven.
Vinalhaven, the largest island, is approximately 9 miles long and 6 miles wide. Most of the island is covered with dense spruce forest, with several large areas of barren granite outcroppings. The island has a rocky coastline.
Vinalhaven is home to one the largest island communities in New England, with a year-round population of 1,300 and a summer population of approximately 6,000. The island possesses a rich and varied wildlife habitat and the Vinalhaven Land Trust, an active group of year-round and seasonal residents, works to preserve the open spaces for the benefit of both wildlife and human enjoyment. The waters of Vinalhaven are home to large populations of crustaceans, with commercial lobster fishing making up the largest segment of the island’s economy [27].
North Haven, the second largest island of the group, has an area of 9.8 square miles and a year-round population of 350 that increases during the summer to approximately 2,000. North Haven has a small snack bar/restaurant, a post office, a library, two gift shops, a
Figure 11: Town of Vinalhaven
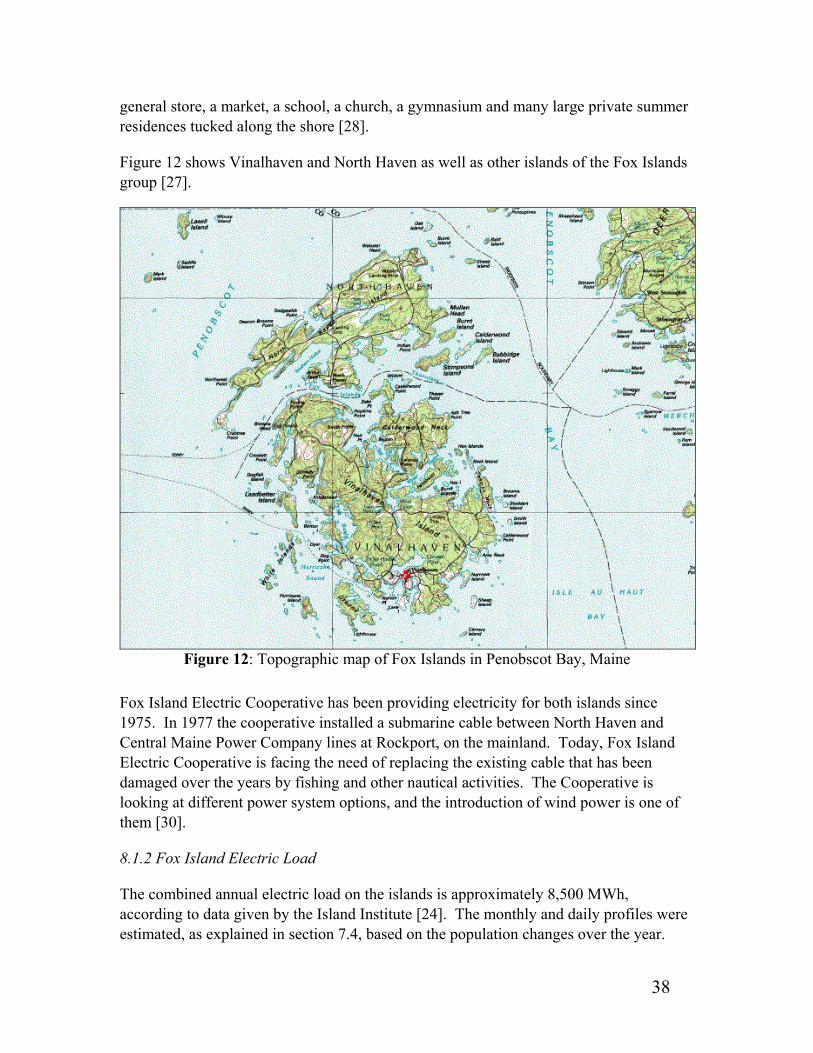
38
general store, a market, a school, a church, a gymnasium and many large private summer residences tucked along the shore [28].
Figure 12 shows Vinalhaven and North Haven as well as other islands of the Fox Islands group [27].
Figure 12: Topographic map of Fox Islands in Penobscot Bay, Maine
Fox Island Electric Cooperative has been providing electricity for both islands since 1975. In 1977 the cooperative installed a submarine cable between North Haven and Central Maine Power Company lines at Rockport, on the mainland. Today, Fox Island Electric Cooperative is facing the need of replacing the existing cable that has been damaged over the years by fishing and other nautical activities. The Cooperative is looking at different power system options, and the introduction of wind power is one of them [30].
8.1.2 Fox Island Electric Load
The combined annual electric load on the islands is approximately 8,500 MWh, according to data given by the Island Institute [24]. The monthly and daily profiles were estimated, as explained in section 7.4, based on the population changes over the year.
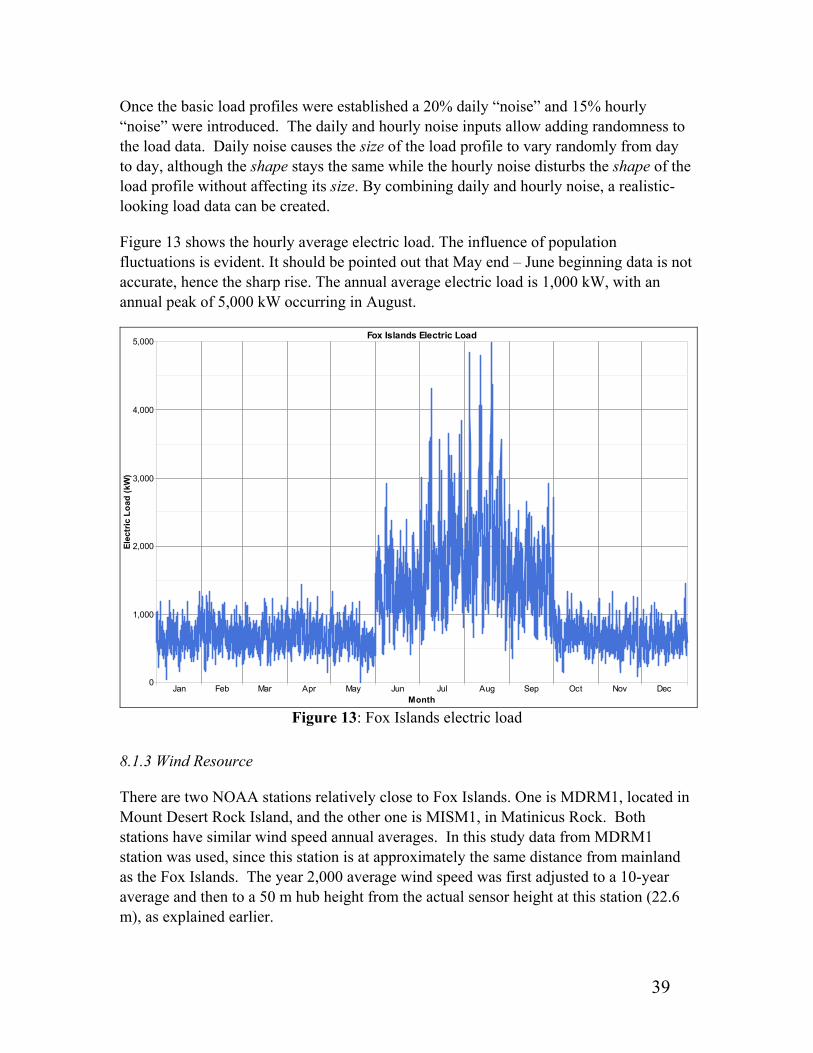
39
Once the basic load profiles were established a 20% daily “noise” and 15% hourly “noise” were introduced. The daily and hourly noise inputs allow adding randomness to the load data. Daily noise causes the size of the load profile to vary randomly from day to day, although the shape stays the same while the hourly noise disturbs the shape of the load profile without affecting its size. By combining daily and hourly noise, a realistic-looking load data can be created.
Figure 13 shows the hourly average electric load. The influence of population fluctuations is evident. It should be pointed out that May end – June beginning data is not accurate, hence the sharp rise. The annual average electric load is 1,000 kW, with an annual peak of 5,000 kW occurring in August.
Jan Feb Mar Apr May Jun Jul Aug Sep Oct Nov Dec0
1,000
2,000
3,000
4,000
5,000
Elec
tric
Loa
d (k
W)
Fox Islands Electric Load
Month Figure 13: Fox Islands electric load
8.1.3 Wind Resource
There are two NOAA stations relatively close to Fox Islands. One is MDRM1, located in Mount Desert Rock Island, and the other one is MISM1, in Matinicus Rock. Both stations have similar wind speed annual averages. In this study data from MDRM1 station was used, since this station is at approximately the same distance from mainland as the Fox Islands. The year 2,000 average wind speed was first adjusted to a 10-year average and then to a 50 m hub height from the actual sensor height at this station (22.6 m), as explained earlier.
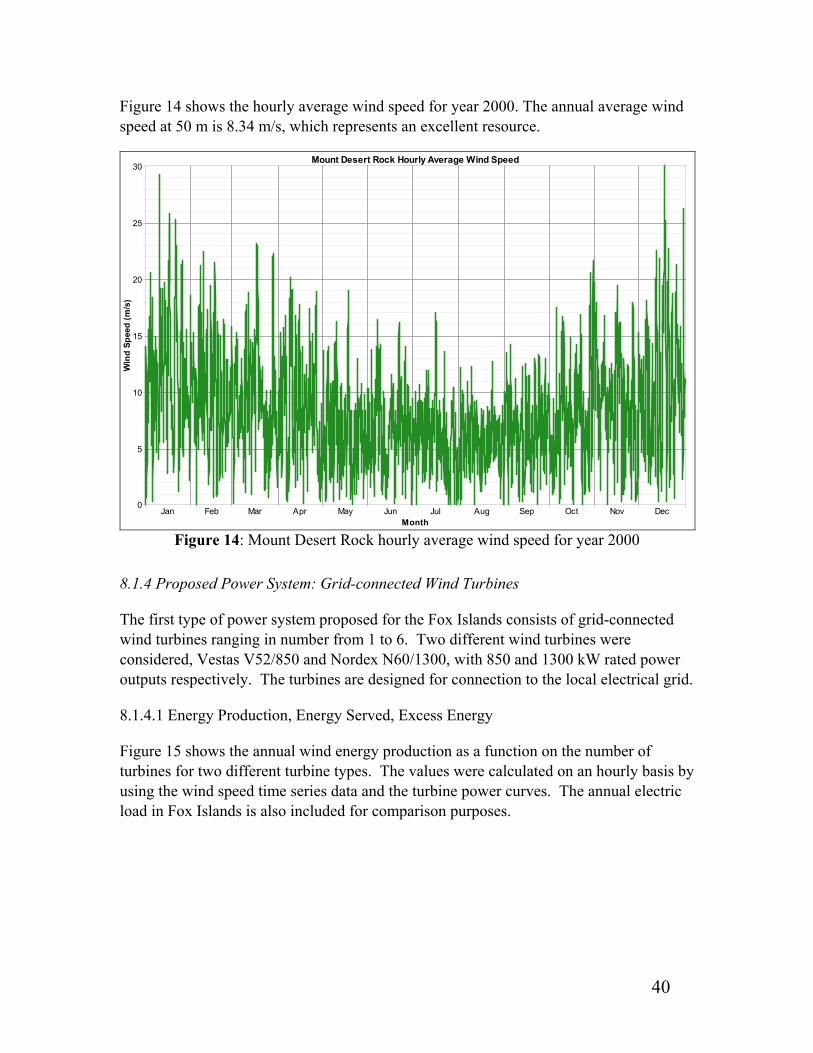
40
Figure 14 shows the hourly average wind speed for year 2000. The annual average wind speed at 50 m is 8.34 m/s, which represents an excellent resource.
Jan Feb Mar Apr May Jun Jul Aug Sep Oct Nov Dec0
5
10
15
20
25
30
Win
d Sp
eed
(m/s
)
Mount Desert Rock Hourly Average Wind Speed
Month Figure 14: Mount Desert Rock hourly average wind speed for year 2000
8.1.4 Proposed Power System: Grid-connected Wind Turbines
The first type of power system proposed for the Fox Islands consists of grid-connected wind turbines ranging in number from 1 to 6. Two different wind turbines were considered, Vestas V52/850 and Nordex N60/1300, with 850 and 1300 kW rated power outputs respectively. The turbines are designed for connection to the local electrical grid.
8.1.4.1 Energy Production, Energy Served, Excess Energy
Figure 15 shows the annual wind energy production as a function on the number of turbines for two different turbine types. The values were calculated on an hourly basis by using the wind speed time series data and the turbine power curves. The annual electric load in Fox Islands is also included for comparison purposes.
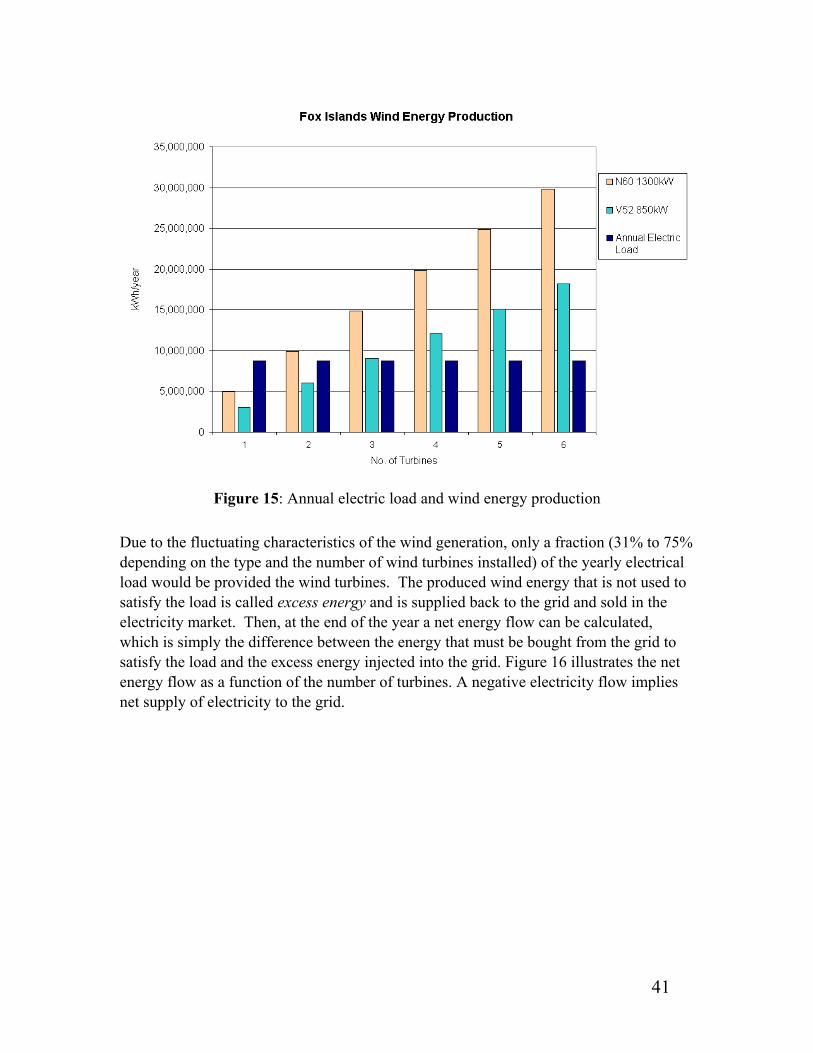
41
Figure 15: Annual electric load and wind energy production
Due to the fluctuating characteristics of the wind generation, only a fraction (31% to 75% depending on the type and the number of wind turbines installed) of the yearly electrical load would be provided the wind turbines. The produced wind energy that is not used to satisfy the load is called excess energy and is supplied back to the grid and sold in the electricity market. Then, at the end of the year a net energy flow can be calculated, which is simply the difference between the energy that must be bought from the grid to satisfy the load and the excess energy injected into the grid. Figure 16 illustrates the net energy flow as a function of the number of turbines. A negative electricity flow implies net supply of electricity to the grid.
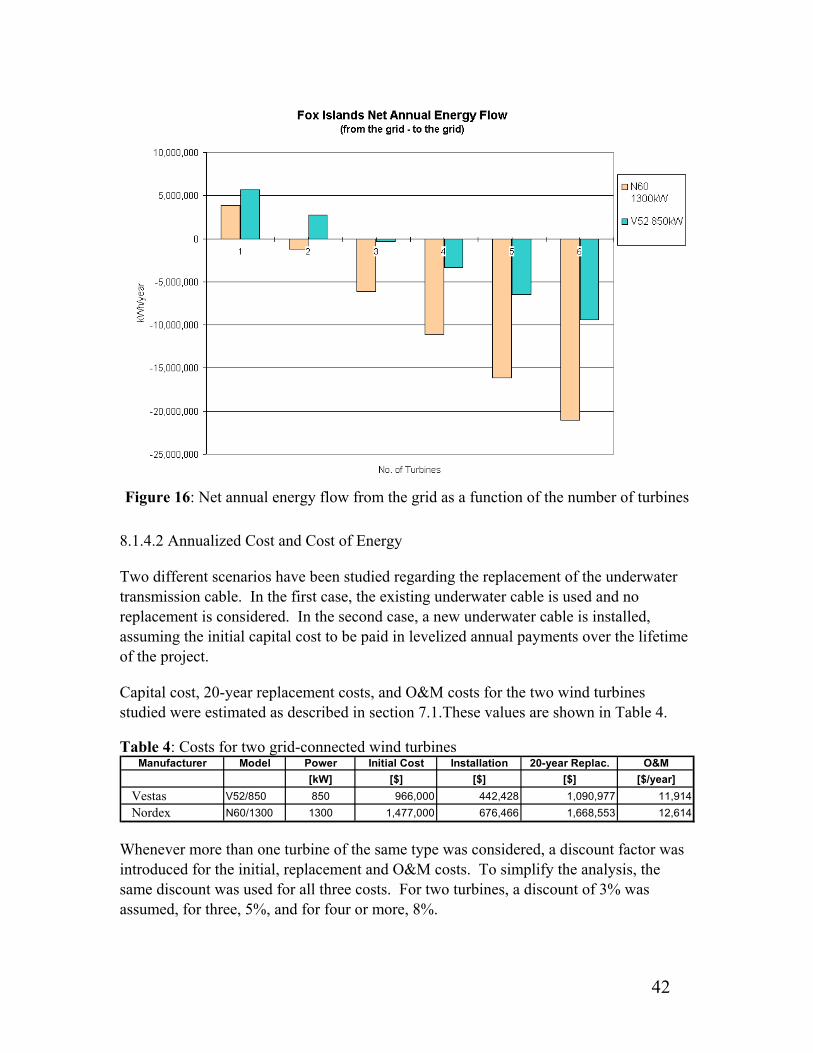
42
Figure 16: Net annual energy flow from the grid as a function of the number of turbines
8.1.4.2 Annualized Cost and Cost of Energy
Two different scenarios have been studied regarding the replacement of the underwater transmission cable. In the first case, the existing underwater cable is used and no replacement is considered. In the second case, a new underwater cable is installed, assuming the initial capital cost to be paid in levelized annual payments over the lifetime of the project.
Capital cost, 20-year replacement costs, and O&M costs for the two wind turbines studied were estimated as described in section 7.1.These values are shown in Table 4.
Table 4: Costs for two grid-connected wind turbines Manufacturer Model Power Initial Cost Installation 20-year Replac. O&M
[kW] [$] [$] [$] [$/year]Vestas V52/850 850 966,000 442,428 1,090,977 11,914Nordex N60/1300 1300 1,477,000 676,466 1,668,553 12,614
Whenever more than one turbine of the same type was considered, a discount factor was introduced for the initial, replacement and O&M costs. To simplify the analysis, the same discount was used for all three costs. For two turbines, a discount of 3% was assumed, for three, 5%, and for four or more, 8%.

43
Administrative and distribution costs are an important part of the annual costs of the power systems and may vary substantially from island to island. In this case, the actual administrative and distribution costs are not known, but a cost of $1,200,000 per year was estimated based on the reports from two other islands with similar characteristics in terms of population pattern and energy consumption.
8.1.4.3 Results Without Replacing the Existing Underwater Cable
The annualized cost of the power system is defined as the sum of the annualized capital cost, the operation and maintenance costs of the wind turbines, and the administrative and distribution costs:
DistrAdmMOcapann CCCC && ++=
The annualized cost defined in this way does not take into account the trading of energy with the grid. In order to introduce this additional expense (or income) in the annualized cost, the rate of the excess energy sold to the grid is assumed at $0.04 per kWh, while the price of energy bought from the grid is initially assumed at $0.08 per kWh. Due to uncertainty in this price a sensitivity analysis has been carried out.
Thus, a net annualized cost can be defined as follows:
kWhs,excesskWhb,unservedDistr&AdmM&Ocapnet PEPECCCC ⋅−⋅+++=
Where,
Ccap = Annualized capital cost of the wind turbines;$/year CO&M = Operation and maintenance of the wind turbines;$/year CAdm&Distr = Administrative and distribution costs;$/year Eunserved = Fraction of the electric load unserved by the wind turbines;
kWh/year Eexcess = Excess energy sold to the grid; kWh/year Pb,kWh = Price of electricity bought from the grid; $/kWh Ps,kWh = Price of electricity sold to the grid; $/kWh
Figure 16 shows the net annualized costs as a function of the number of turbines for two different turbines.
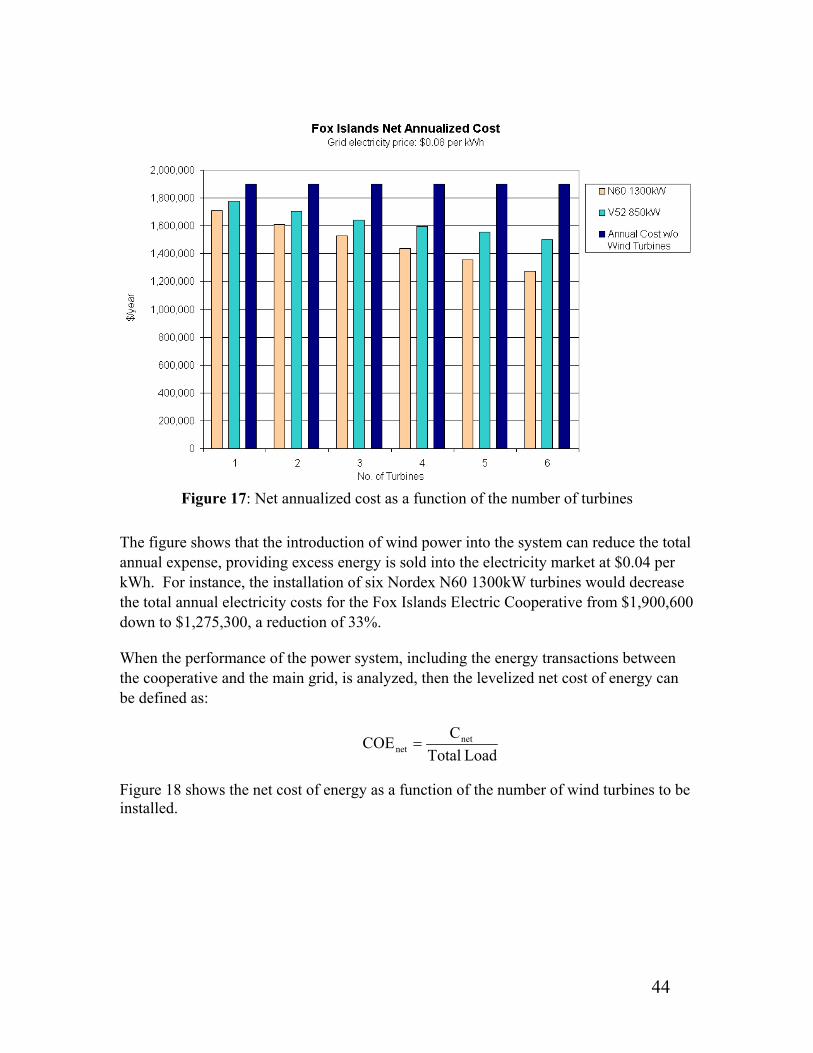
44
Figure 17: Net annualized cost as a function of the number of turbines
The figure shows that the introduction of wind power into the system can reduce the total annual expense, providing excess energy is sold into the electricity market at $0.04 per kWh. For instance, the installation of six Nordex N60 1300kW turbines would decrease the total annual electricity costs for the Fox Islands Electric Cooperative from $1,900,600 down to $1,275,300, a reduction of 33%.
When the performance of the power system, including the energy transactions between the cooperative and the main grid, is analyzed, then the levelized net cost of energy can be defined as:
Load TotalCCOE net
net =
Figure 18 shows the net cost of energy as a function of the number of wind turbines to be installed.
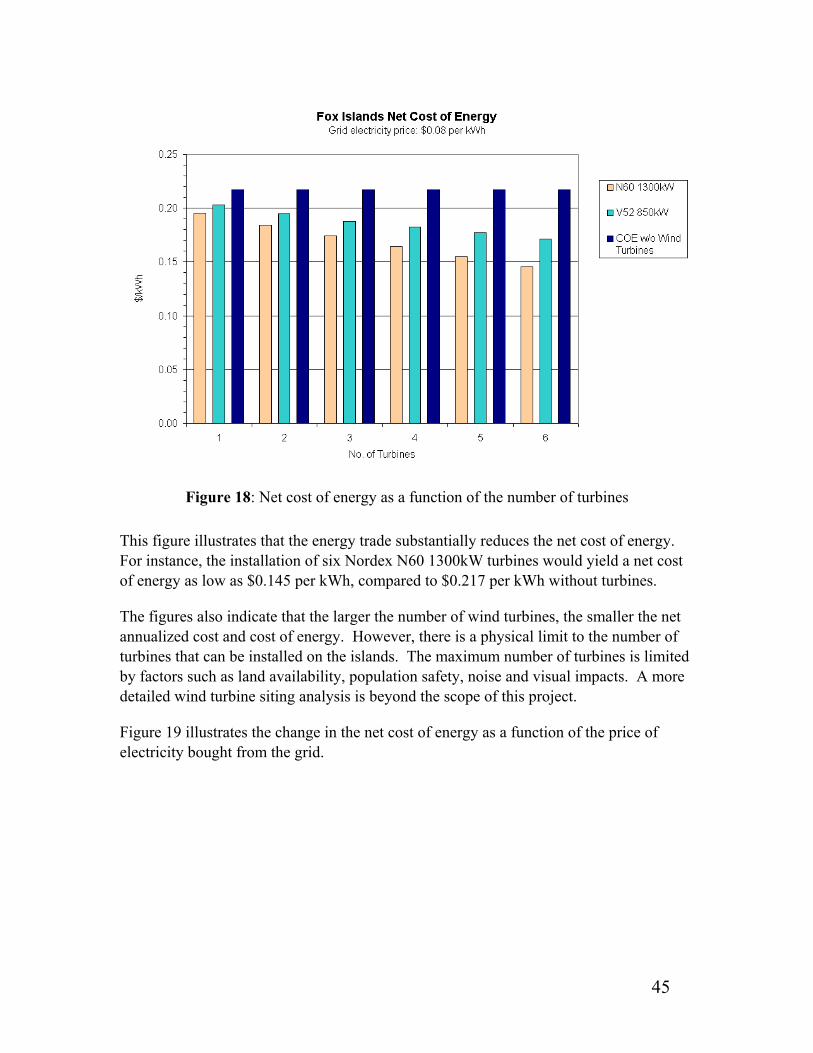
45
Figure 18: Net cost of energy as a function of the number of turbines
This figure illustrates that the energy trade substantially reduces the net cost of energy. For instance, the installation of six Nordex N60 1300kW turbines would yield a net cost of energy as low as $0.145 per kWh, compared to $0.217 per kWh without turbines.
The figures also indicate that the larger the number of wind turbines, the smaller the net annualized cost and cost of energy. However, there is a physical limit to the number of turbines that can be installed on the islands. The maximum number of turbines is limited by factors such as land availability, population safety, noise and visual impacts. A more detailed wind turbine siting analysis is beyond the scope of this project.
Figure 19 illustrates the change in the net cost of energy as a function of the price of electricity bought from the grid.
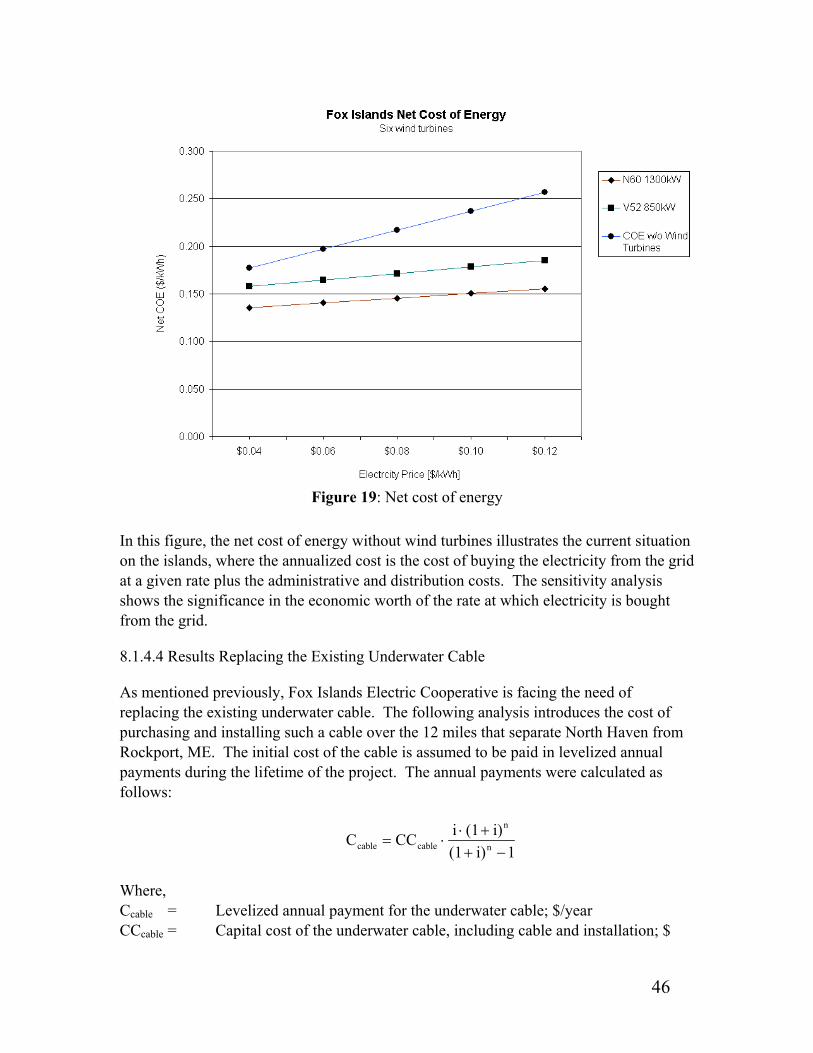
46
Figure 19: Net cost of energy
In this figure, the net cost of energy without wind turbines illustrates the current situation on the islands, where the annualized cost is the cost of buying the electricity from the grid at a given rate plus the administrative and distribution costs. The sensitivity analysis shows the significance in the economic worth of the rate at which electricity is bought from the grid.
8.1.4.4 Results Replacing the Existing Underwater Cable
As mentioned previously, Fox Islands Electric Cooperative is facing the need of replacing the existing underwater cable. The following analysis introduces the cost of purchasing and installing such a cable over the 12 miles that separate North Haven from Rockport, ME. The initial cost of the cable is assumed to be paid in levelized annual payments during the lifetime of the project. The annual payments were calculated as follows:
1i)(1i)(1iCCC n
n
cablecable −++⋅
⋅=
Where, Ccable = Levelized annual payment for the underwater cable; $/year CCcable = Capital cost of the underwater cable, including cable and installation; $
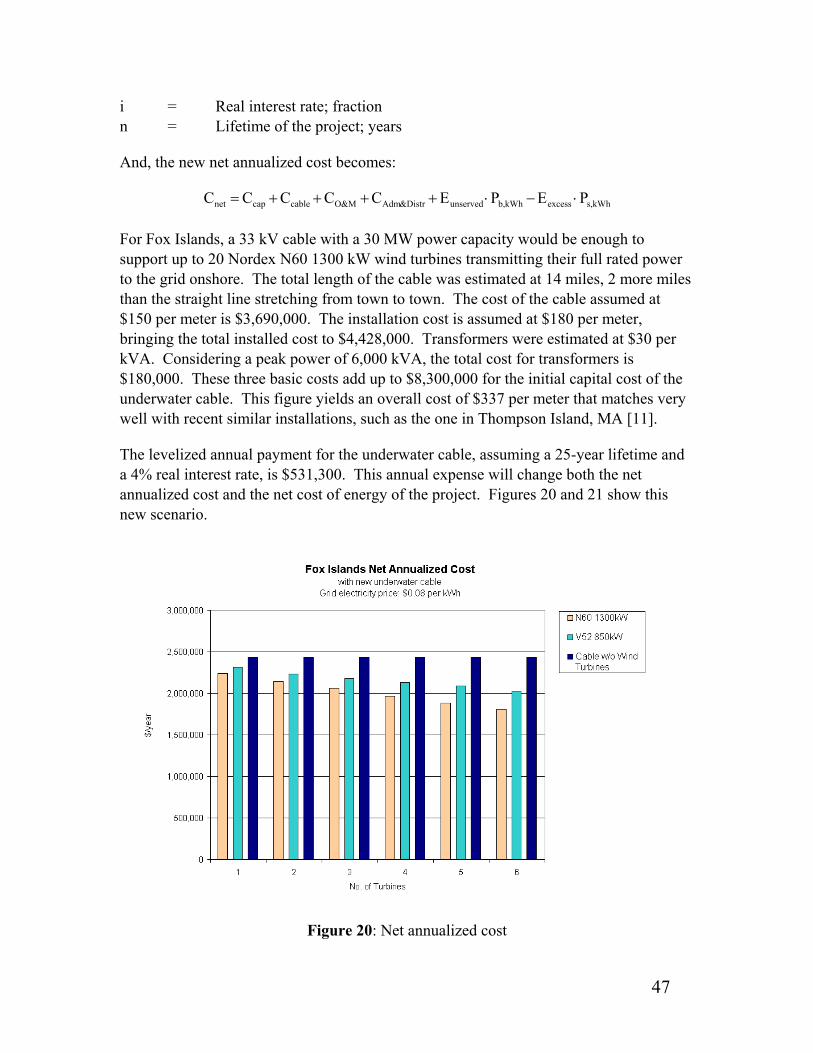
47
i = Real interest rate; fraction n = Lifetime of the project; years
And, the new net annualized cost becomes:
kWhs,excesskWhb,unservedDistr&AdmM&Ocablecapnet PEPECCCCC ⋅−⋅++++=
For Fox Islands, a 33 kV cable with a 30 MW power capacity would be enough to support up to 20 Nordex N60 1300 kW wind turbines transmitting their full rated power to the grid onshore. The total length of the cable was estimated at 14 miles, 2 more miles than the straight line stretching from town to town. The cost of the cable assumed at $150 per meter is $3,690,000. The installation cost is assumed at $180 per meter, bringing the total installed cost to $4,428,000. Transformers were estimated at $30 per kVA. Considering a peak power of 6,000 kVA, the total cost for transformers is $180,000. These three basic costs add up to $8,300,000 for the initial capital cost of the underwater cable. This figure yields an overall cost of $337 per meter that matches very well with recent similar installations, such as the one in Thompson Island, MA [11].
The levelized annual payment for the underwater cable, assuming a 25-year lifetime and a 4% real interest rate, is $531,300. This annual expense will change both the net annualized cost and the net cost of energy of the project. Figures 20 and 21 show this new scenario.
Figure 20: Net annualized cost
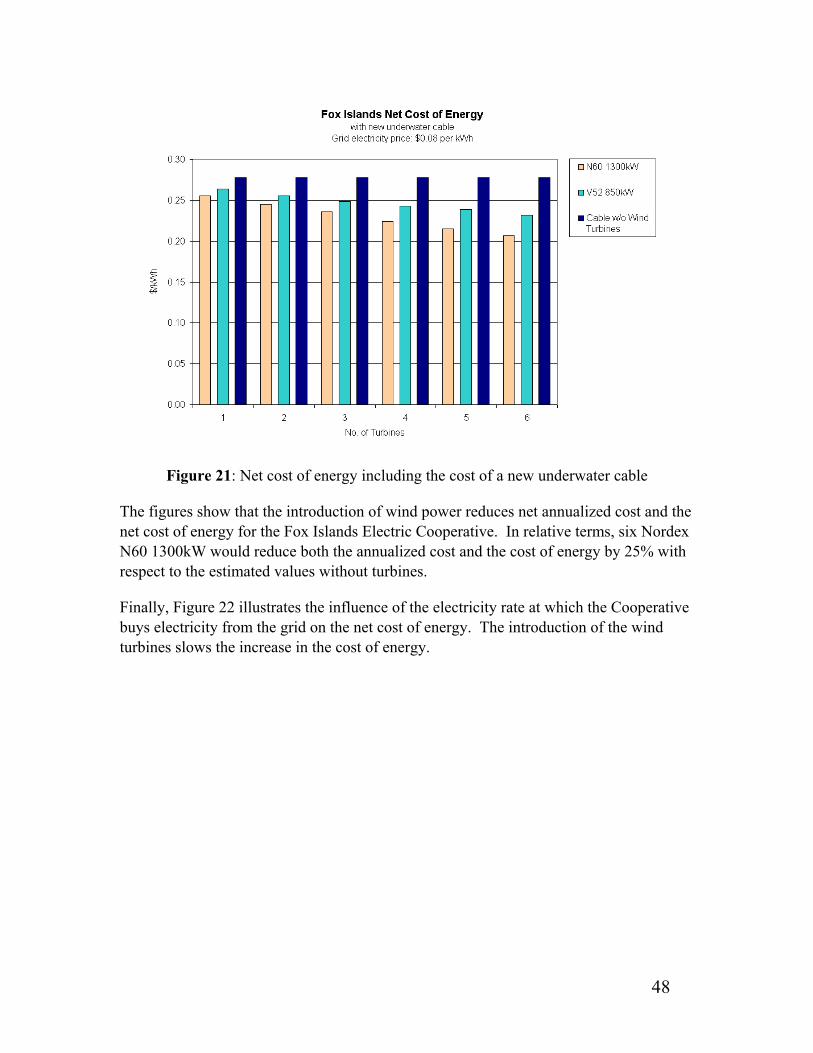
48
Figure 21: Net cost of energy including the cost of a new underwater cable
The figures show that the introduction of wind power reduces net annualized cost and the net cost of energy for the Fox Islands Electric Cooperative. In relative terms, six Nordex N60 1300kW would reduce both the annualized cost and the cost of energy by 25% with respect to the estimated values without turbines.
Finally, Figure 22 illustrates the influence of the electricity rate at which the Cooperative buys electricity from the grid on the net cost of energy. The introduction of the wind turbines slows the increase in the cost of energy.
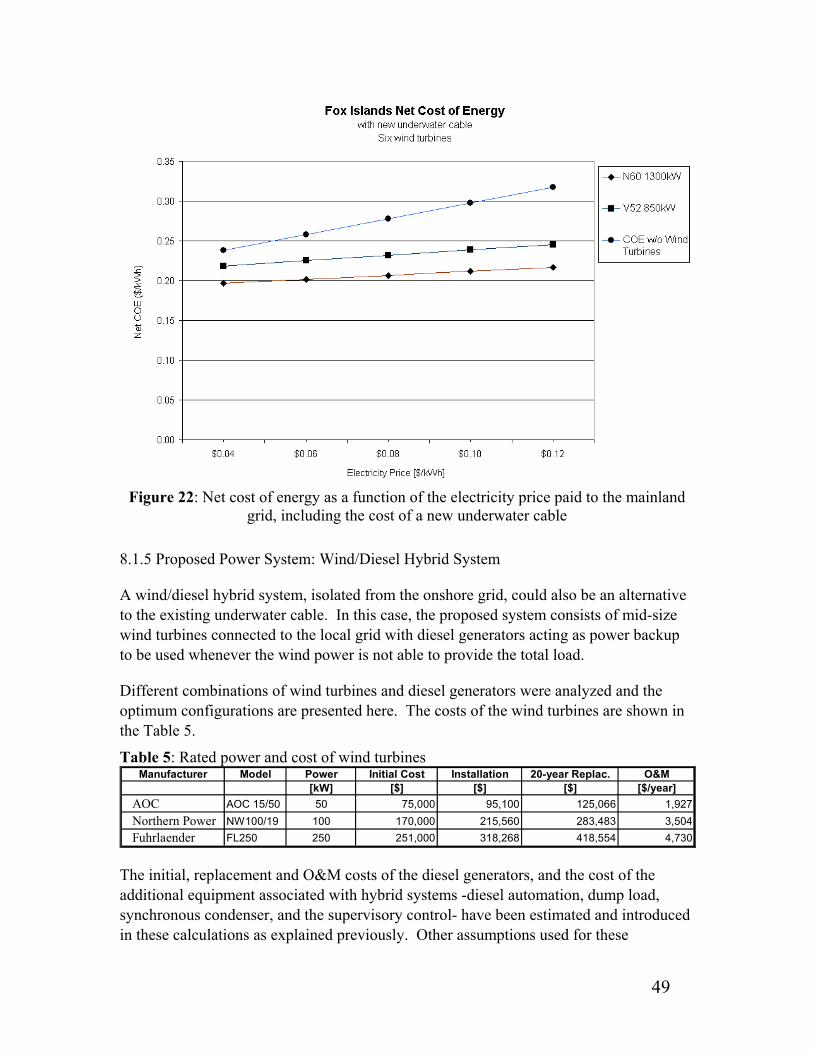
49
Figure 22: Net cost of energy as a function of the electricity price paid to the mainland grid, including the cost of a new underwater cable
8.1.5 Proposed Power System: Wind/Diesel Hybrid System
A wind/diesel hybrid system, isolated from the onshore grid, could also be an alternative to the existing underwater cable. In this case, the proposed system consists of mid-size wind turbines connected to the local grid with diesel generators acting as power backup to be used whenever the wind power is not able to provide the total load.
Different combinations of wind turbines and diesel generators were analyzed and the optimum configurations are presented here. The costs of the wind turbines are shown in the Table 5.
Table 5: Rated power and cost of wind turbines Manufacturer Model Power Initial Cost Installation 20-year Replac. O&M
[kW] [$] [$] [$] [$/year]AOC AOC 15/50 50 75,000 95,100 125,066 1,927Northern Power NW100/19 100 170,000 215,560 283,483 3,504Fuhrlaender FL250 250 251,000 318,268 418,554 4,730
The initial, replacement and O&M costs of the diesel generators, and the cost of the additional equipment associated with hybrid systems -diesel automation, dump load, synchronous condenser, and the supervisory control- have been estimated and introduced in these calculations as explained previously. Other assumptions used for these
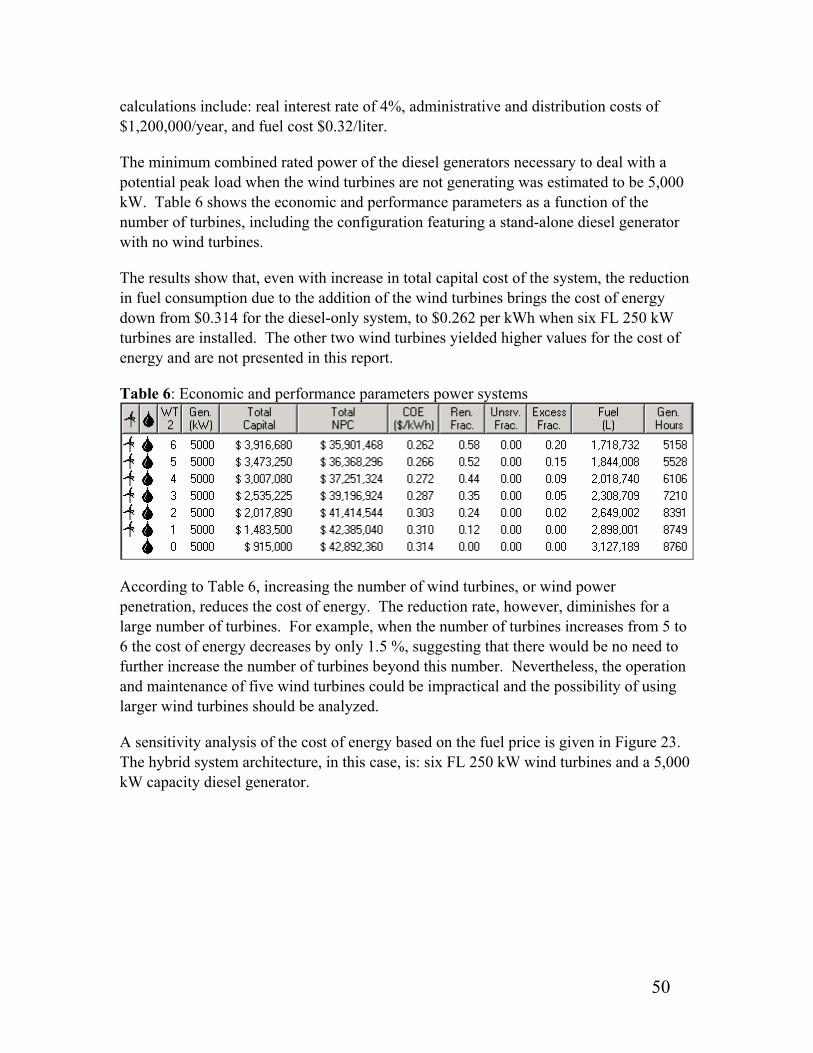
50
calculations include: real interest rate of 4%, administrative and distribution costs of $1,200,000/year, and fuel cost $0.32/liter.
The minimum combined rated power of the diesel generators necessary to deal with a potential peak load when the wind turbines are not generating was estimated to be 5,000 kW. Table 6 shows the economic and performance parameters as a function of the number of turbines, including the configuration featuring a stand-alone diesel generator with no wind turbines.
The results show that, even with increase in total capital cost of the system, the reduction in fuel consumption due to the addition of the wind turbines brings the cost of energy down from $0.314 for the diesel-only system, to $0.262 per kWh when six FL 250 kW turbines are installed. The other two wind turbines yielded higher values for the cost of energy and are not presented in this report.
Table 6: Economic and performance parameters power systems
According to Table 6, increasing the number of wind turbines, or wind power penetration, reduces the cost of energy. The reduction rate, however, diminishes for a large number of turbines. For example, when the number of turbines increases from 5 to 6 the cost of energy decreases by only 1.5 %, suggesting that there would be no need to further increase the number of turbines beyond this number. Nevertheless, the operation and maintenance of five wind turbines could be impractical and the possibility of using larger wind turbines should be analyzed.
A sensitivity analysis of the cost of energy based on the fuel price is given in Figure 23. The hybrid system architecture, in this case, is: six FL 250 kW wind turbines and a 5,000 kW capacity diesel generator.
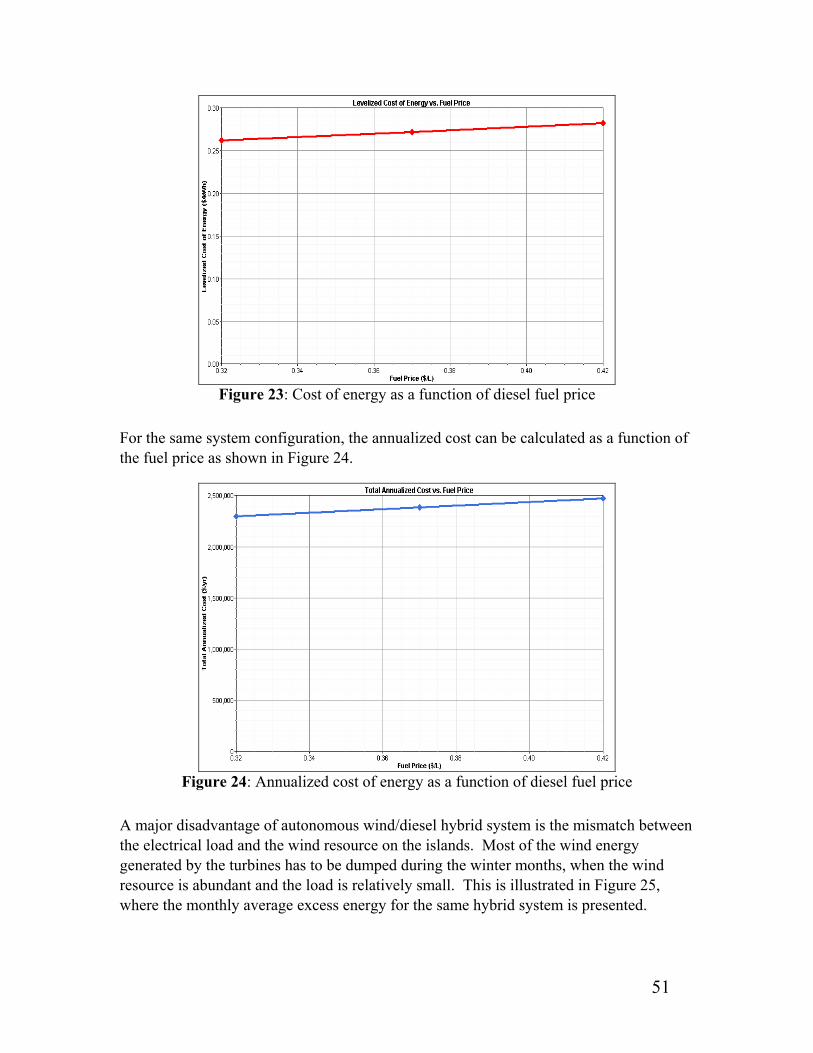
51
Figure 23: Cost of energy as a function of diesel fuel price
For the same system configuration, the annualized cost can be calculated as a function of the fuel price as shown in Figure 24.
Figure 24: Annualized cost of energy as a function of diesel fuel price
A major disadvantage of autonomous wind/diesel hybrid system is the mismatch between the electrical load and the wind resource on the islands. Most of the wind energy generated by the turbines has to be dumped during the winter months, when the wind resource is abundant and the load is relatively small. This is illustrated in Figure 25, where the monthly average excess energy for the same hybrid system is presented.

52
Figure 25: Monthly averages of excess energy generated by the hybrid system
In order to offset, to some extent, the mismatch caused by the installing wind power capacity, the excess energy can be used for heating purposes during the cold months. Figure 26 shows the monthly average heating load estimated as explained previously. The almost perfect match between excess energy and heating load pattern is remarkable.
Figure 26: Fox Islands heating load
When the excess energy is used to supply the heating load, the cost of energy is substantially reduced, since now the served load fraction increases at a larger rate than the annualized costs. In this case, each heating load fraction analyzed was treated as a primary load along with the electric load. The annualized cost increases due to an increase in the fuel consumption, as discussed later. Figure 27 illustrates the reduction in
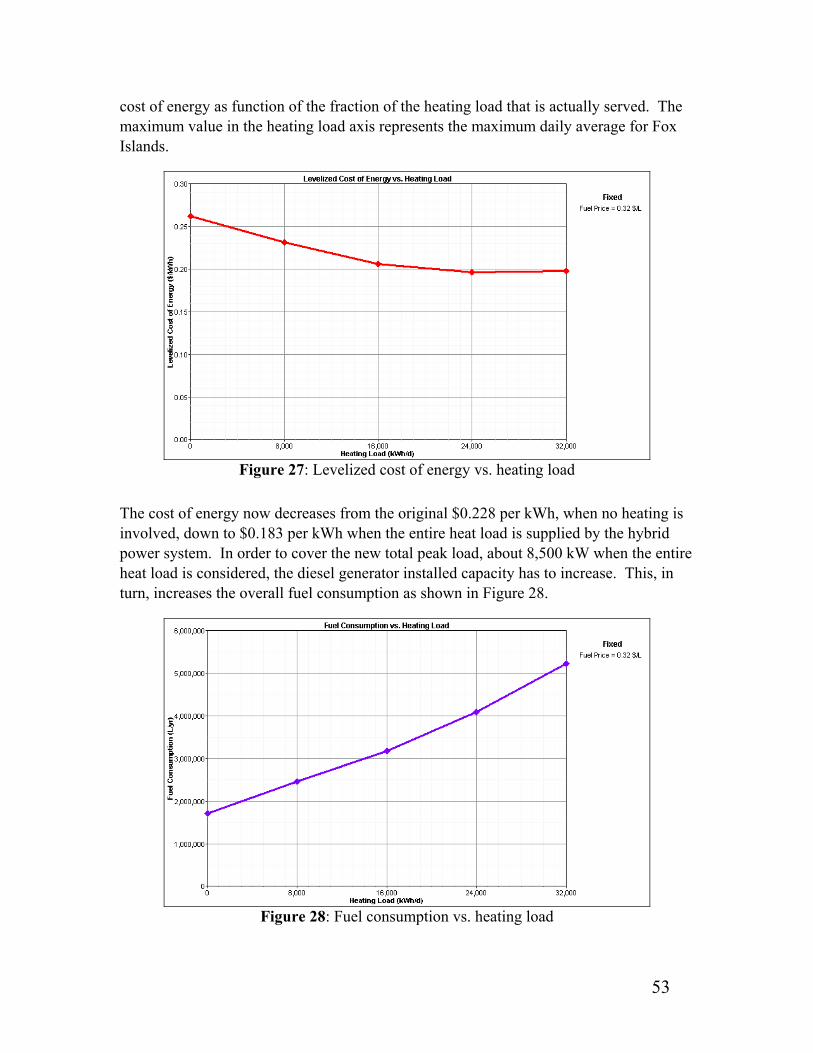
53
cost of energy as function of the fraction of the heating load that is actually served. The maximum value in the heating load axis represents the maximum daily average for Fox Islands.
Figure 27: Levelized cost of energy vs. heating load
The cost of energy now decreases from the original $0.228 per kWh, when no heating is involved, down to $0.183 per kWh when the entire heat load is supplied by the hybrid power system. In order to cover the new total peak load, about 8,500 kW when the entire heat load is considered, the diesel generator installed capacity has to increase. This, in turn, increases the overall fuel consumption as shown in Figure 28.
Figure 28: Fuel consumption vs. heating load
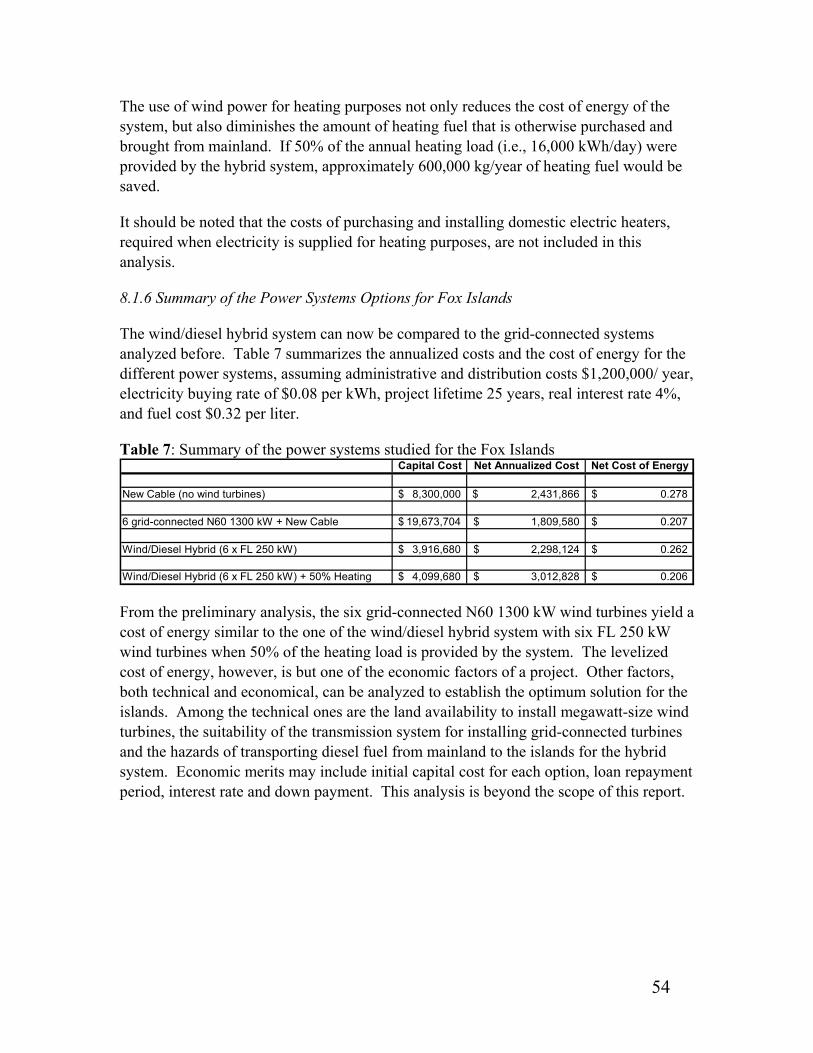
54
The use of wind power for heating purposes not only reduces the cost of energy of the system, but also diminishes the amount of heating fuel that is otherwise purchased and brought from mainland. If 50% of the annual heating load (i.e., 16,000 kWh/day) were provided by the hybrid system, approximately 600,000 kg/year of heating fuel would be saved.
It should be noted that the costs of purchasing and installing domestic electric heaters, required when electricity is supplied for heating purposes, are not included in this analysis.
8.1.6 Summary of the Power Systems Options for Fox Islands
The wind/diesel hybrid system can now be compared to the grid-connected systems analyzed before. Table 7 summarizes the annualized costs and the cost of energy for the different power systems, assuming administrative and distribution costs $1,200,000/ year, electricity buying rate of $0.08 per kWh, project lifetime 25 years, real interest rate 4%, and fuel cost $0.32 per liter.
Table 7: Summary of the power systems studied for the Fox Islands Capital Cost Net Annualized Cost Net Cost of Energy
New Cable (no wind turbines) 8,300,000$ 2,431,866$ 0.278$
6 grid-connected N60 1300 kW + New Cable 19,673,704$ 1,809,580$ 0.207$
Wind/Diesel Hybrid (6 x FL 250 kW) 3,916,680$ 2,298,124$ 0.262$
Wind/Diesel Hybrid (6 x FL 250 kW) + 50% Heating 4,099,680$ 3,012,828$ 0.206$
From the preliminary analysis, the six grid-connected N60 1300 kW wind turbines yield a cost of energy similar to the one of the wind/diesel hybrid system with six FL 250 kW wind turbines when 50% of the heating load is provided by the system. The levelized cost of energy, however, is but one of the economic factors of a project. Other factors, both technical and economical, can be analyzed to establish the optimum solution for the islands. Among the technical ones are the land availability to install megawatt-size wind turbines, the suitability of the transmission system for installing grid-connected turbines and the hazards of transporting diesel fuel from mainland to the islands for the hybrid system. Economic merits may include initial capital cost for each option, loan repayment period, interest rate and down payment. This analysis is beyond the scope of this report.
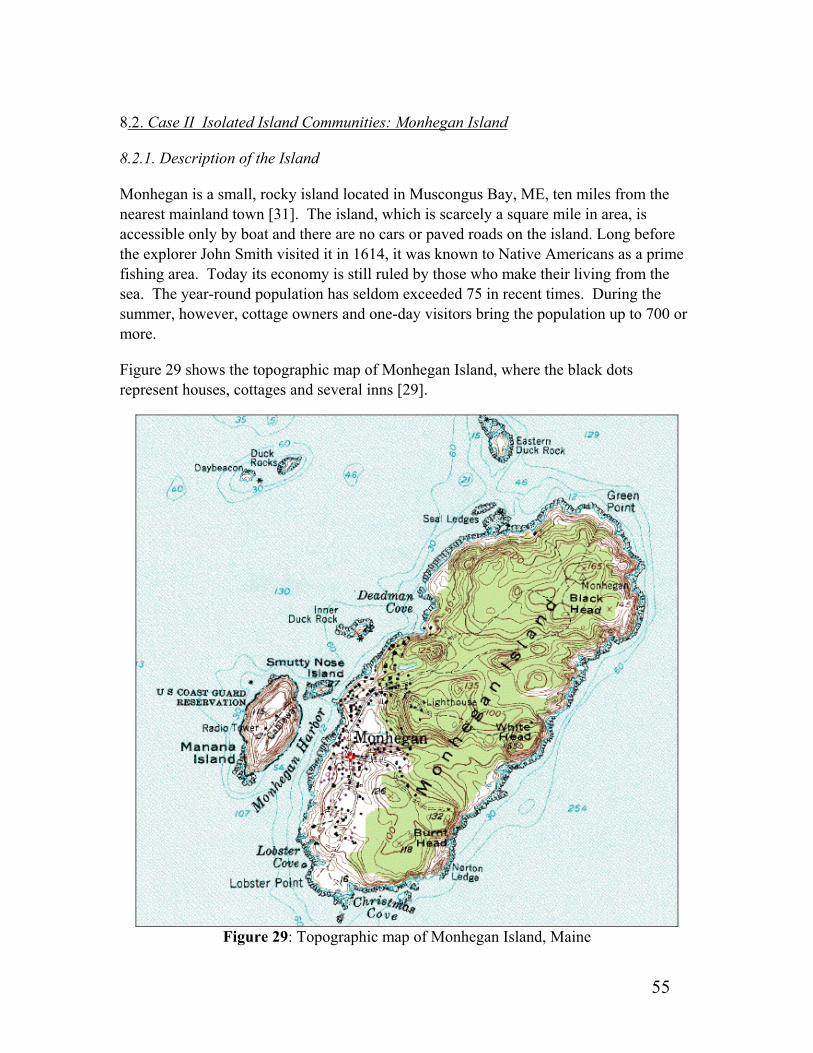
55
8.2. Case II Isolated Island Communities: Monhegan Island
8.2.1. Description of the Island
Monhegan is a small, rocky island located in Muscongus Bay, ME, ten miles from the nearest mainland town [31]. The island, which is scarcely a square mile in area, is accessible only by boat and there are no cars or paved roads on the island. Long before the explorer John Smith visited it in 1614, it was known to Native Americans as a prime fishing area. Today its economy is still ruled by those who make their living from the sea. The year-round population has seldom exceeded 75 in recent times. During the summer, however, cottage owners and one-day visitors bring the population up to 700 or more.
Figure 29 shows the topographic map of Monhegan Island, where the black dots represent houses, cottages and several inns [29].
Figure 29: Topographic map of Monhegan Island, Maine
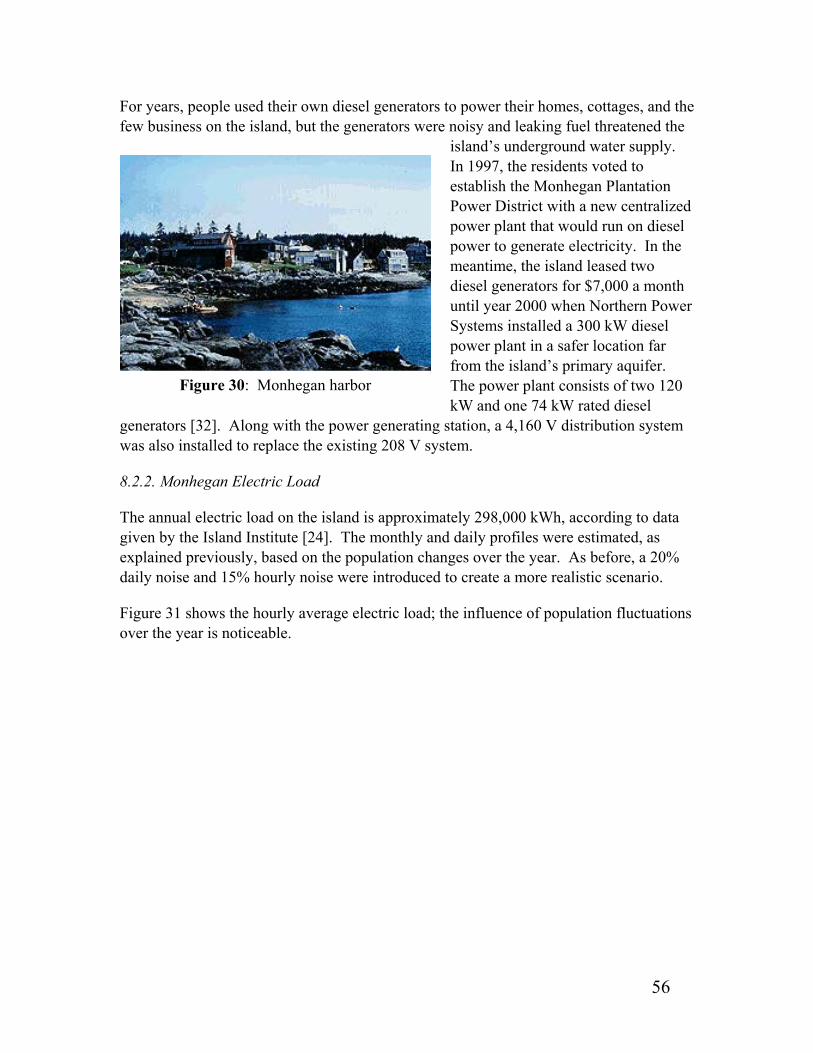
56
For years, people used their own diesel generators to power their homes, cottages, and the few business on the island, but the generators were noisy and leaking fuel threatened the
island’s underground water supply. In 1997, the residents voted to establish the Monhegan Plantation Power District with a new centralized power plant that would run on diesel power to generate electricity. In the meantime, the island leased two diesel generators for $7,000 a month until year 2000 when Northern Power Systems installed a 300 kW diesel power plant in a safer location far from the island’s primary aquifer. The power plant consists of two 120 kW and one 74 kW rated diesel
generators [32]. Along with the power generating station, a 4,160 V distribution system was also installed to replace the existing 208 V system.
8.2.2. Monhegan Electric Load
The annual electric load on the island is approximately 298,000 kWh, according to data given by the Island Institute [24]. The monthly and daily profiles were estimated, as explained previously, based on the population changes over the year. As before, a 20% daily noise and 15% hourly noise were introduced to create a more realistic scenario.
Figure 31 shows the hourly average electric load; the influence of population fluctuations over the year is noticeable.
Figure 30: Monhegan harbor
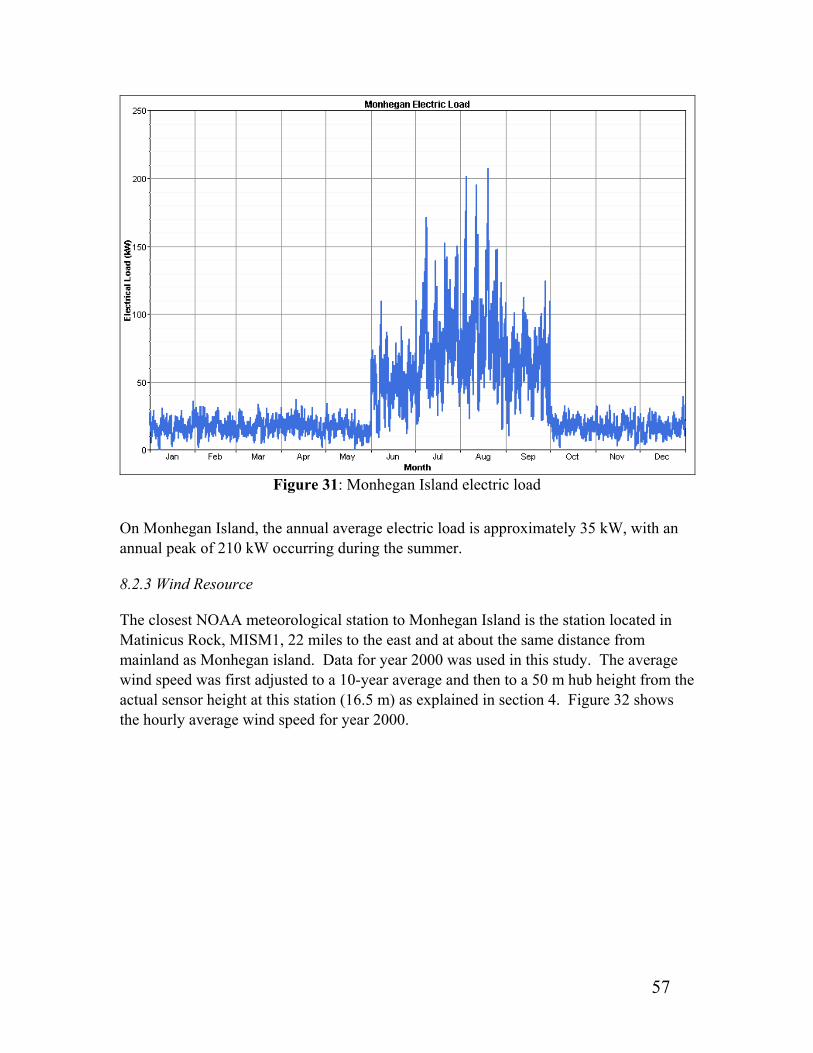
57
Figure 31: Monhegan Island electric load
On Monhegan Island, the annual average electric load is approximately 35 kW, with an annual peak of 210 kW occurring during the summer.
8.2.3 Wind Resource
The closest NOAA meteorological station to Monhegan Island is the station located in Matinicus Rock, MISM1, 22 miles to the east and at about the same distance from mainland as Monhegan island. Data for year 2000 was used in this study. The average wind speed was first adjusted to a 10-year average and then to a 50 m hub height from the actual sensor height at this station (16.5 m) as explained in section 4. Figure 32 shows the hourly average wind speed for year 2000.
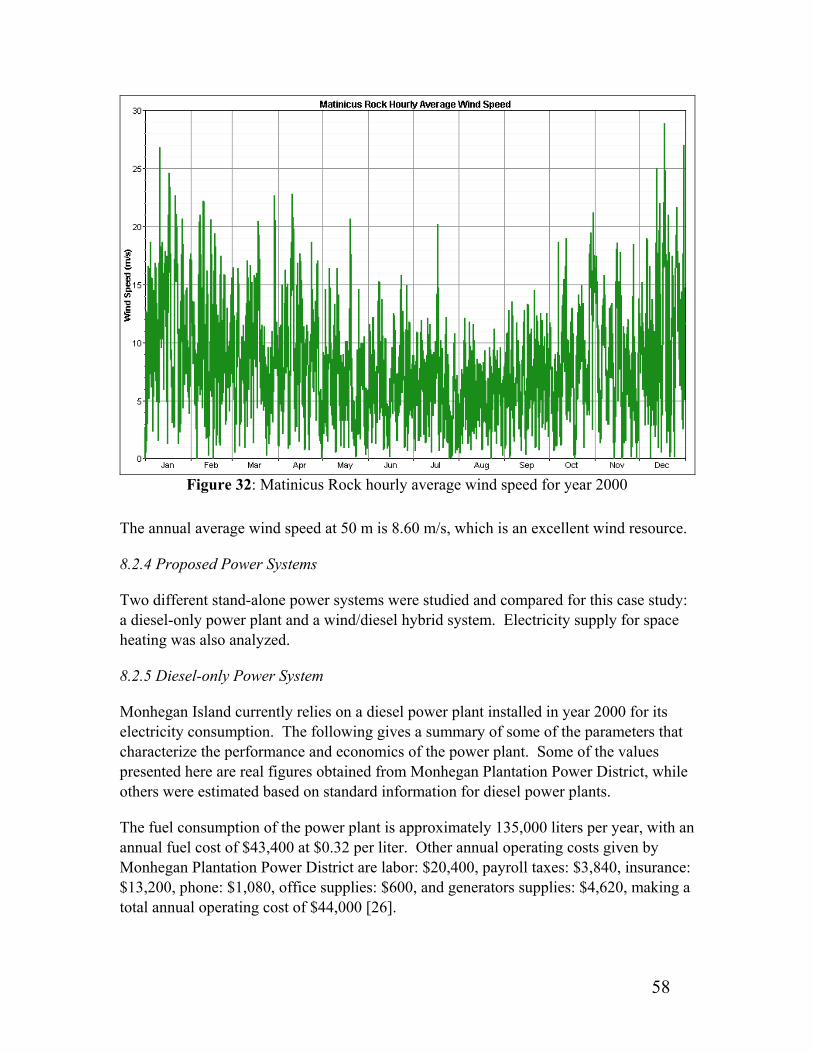
58
Figure 32: Matinicus Rock hourly average wind speed for year 2000
The annual average wind speed at 50 m is 8.60 m/s, which is an excellent wind resource.
8.2.4 Proposed Power Systems
Two different stand-alone power systems were studied and compared for this case study: a diesel-only power plant and a wind/diesel hybrid system. Electricity supply for space heating was also analyzed.
8.2.5 Diesel-only Power System
Monhegan Island currently relies on a diesel power plant installed in year 2000 for its electricity consumption. The following gives a summary of some of the parameters that characterize the performance and economics of the power plant. Some of the values presented here are real figures obtained from Monhegan Plantation Power District, while others were estimated based on standard information for diesel power plants.
The fuel consumption of the power plant is approximately 135,000 liters per year, with an annual fuel cost of $43,400 at $0.32 per liter. Other annual operating costs given by Monhegan Plantation Power District are labor: $20,400, payroll taxes: $3,840, insurance: $13,200, phone: $1,080, office supplies: $600, and generators supplies: $4,620, making a total annual operating cost of $44,000 [26].

59
Other expenses include the maintenance and complete overhaul of the diesel generators that is necessary every two years with a total cost of approximately $52,000.
The annual energy production of the diesel generators is approximately 298,000 kWh.
Based on the annual costs and the annual energy consumed, the cost of energy can be calculated at $0.38 per kWh.
8.2.6 Wind/Diesel Hybrid System
The introduction of wind power in combination with the diesel power plant is analyzed here. The wind turbines studied were, as before, the AOC 50 kW, the Northern Power 100 kW, and the Furhlander 250 kW. Preliminary economic results indicate that the two bigger machines are more appropriate in this case, yielding lower cost per kWh in the life cycle economic analysis.
Table 8 shows the basic economic parameters for three different power systems: diesel-only, diesel and one Northern Power 100 kW turbine (WT2 in the table), and diesel and one Furhlander 250 kW turbine (WT1 in the table). In this case, it was assumed that the existing diesel power plant is used, so no initial capital cost for diesel generators is considered. The initial cost of the wind turbine includes, as before, the wind turbine itself, transportation of equipment and material to the island, site preparation, associated electrical equipment, turbine foundation, and turbine assembly.
Table 8: Economic and performance parameters for power systems
The table shows a significant reduction in the fuel consumption ranging from 49 to 69 percent when the wind turbines are introduced into the power system. This reduction is the key factor in the reduction of the cost of energy that goes down from $0.39 per kWh to approximately $0.36 per kWh for the hybrid system. Due to mismatch between electric load and availability of wind energy 47% of the energy generated by the Northern Power 100 kW turbine would be wasted, while 72% would be dumped if the Furhlander 250 kW turbine were installed.
A possible solution to this problem, as in the previous case study, is to use the excess wind energy to supply part of the heating load on the island. Figure 33 shows the heating load on Monhegan Island estimated based on number of households and monthly average degree-days, as explained in section 7.4.
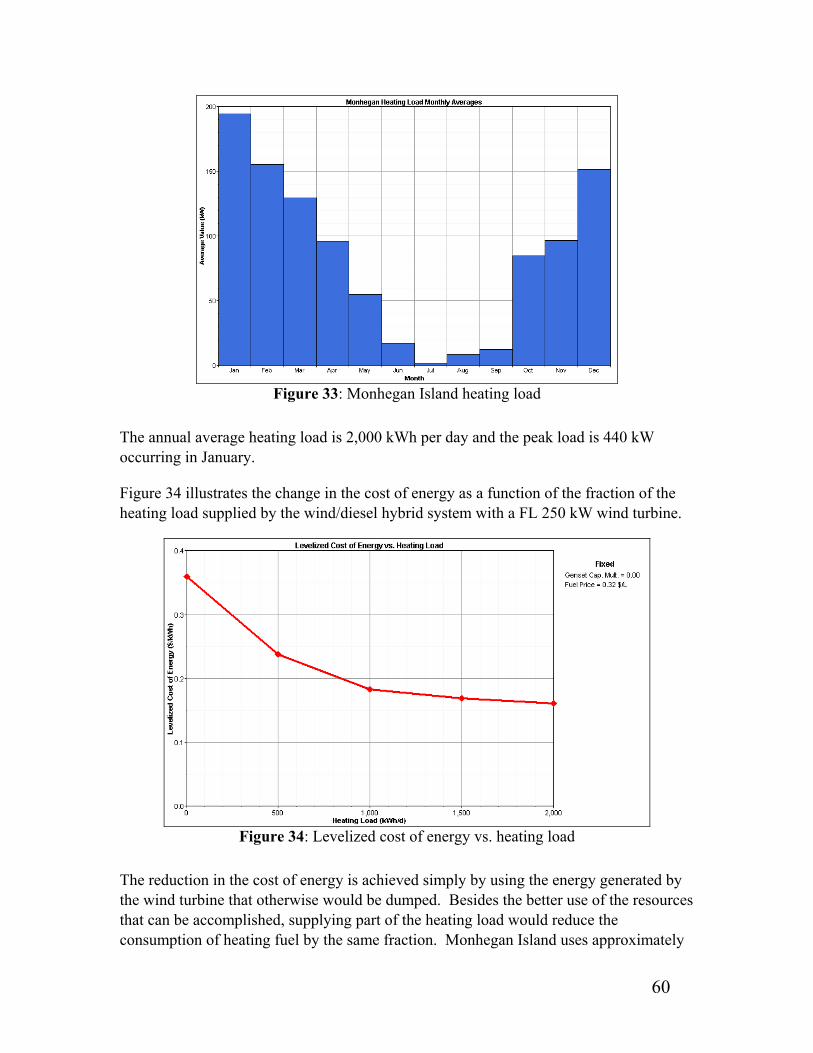
60
Figure 33: Monhegan Island heating load
The annual average heating load is 2,000 kWh per day and the peak load is 440 kW occurring in January.
Figure 34 illustrates the change in the cost of energy as a function of the fraction of the heating load supplied by the wind/diesel hybrid system with a FL 250 kW wind turbine.
Figure 34: Levelized cost of energy vs. heating load
The reduction in the cost of energy is achieved simply by using the energy generated by the wind turbine that otherwise would be dumped. Besides the better use of the resources that can be accomplished, supplying part of the heating load would reduce the consumption of heating fuel by the same fraction. Monhegan Island uses approximately

61
140,000 liters of heating fuel per year that represents an annual expense of $45,000. Were this saved cost introduced into the calculations, the cost of energy would decrease beyond $0.16 per kWh shown in the figure when the total heating load is supplied.
The previous calculations of the cost of energy do not take into account any additional cost for the purchasing of domestic electric heaters that would be necessary in this case.
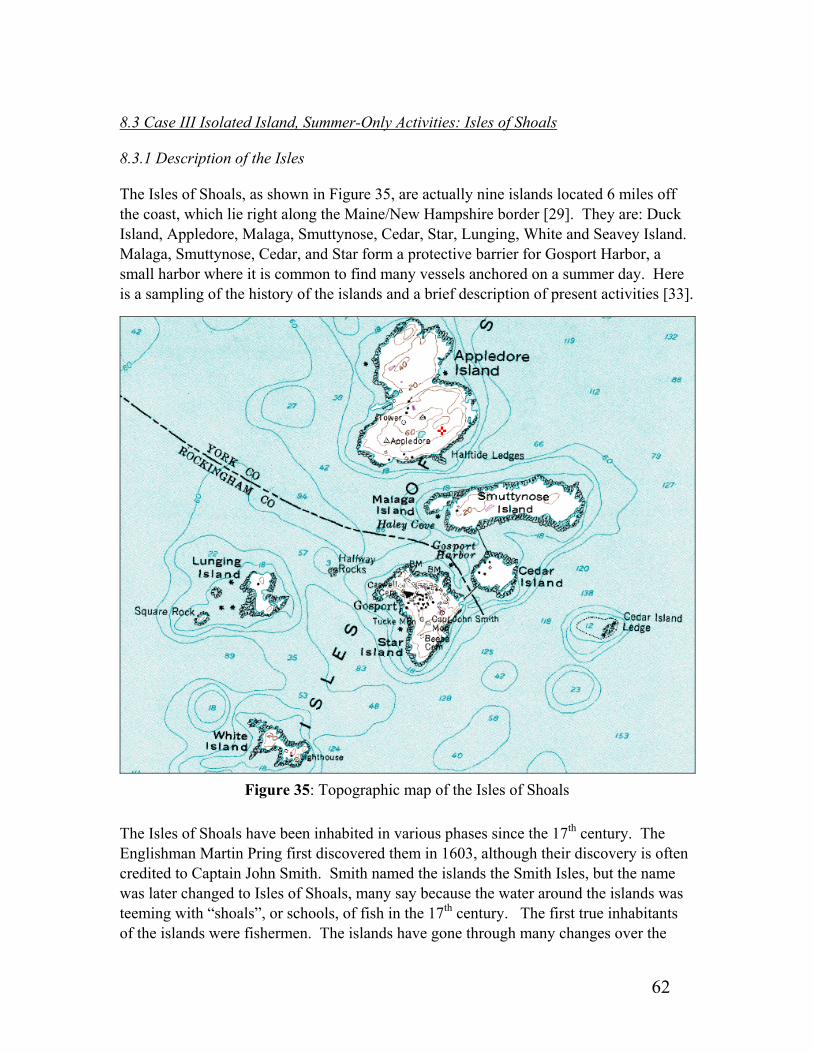
62
8.3 Case III Isolated Island, Summer-Only Activities: Isles of Shoals
8.3.1 Description of the Isles
The Isles of Shoals, as shown in Figure 35, are actually nine islands located 6 miles off the coast, which lie right along the Maine/New Hampshire border [29]. They are: Duck Island, Appledore, Malaga, Smuttynose, Cedar, Star, Lunging, White and Seavey Island. Malaga, Smuttynose, Cedar, and Star form a protective barrier for Gosport Harbor, a small harbor where it is common to find many vessels anchored on a summer day. Here is a sampling of the history of the islands and a brief description of present activities [33].
Figure 35: Topographic map of the Isles of Shoals
The Isles of Shoals have been inhabited in various phases since the 17th century. The Englishman Martin Pring first discovered them in 1603, although their discovery is often credited to Captain John Smith. Smith named the islands the Smith Isles, but the name was later changed to Isles of Shoals, many say because the water around the islands was teeming with “shoals”, or schools, of fish in the 17th century. The first true inhabitants of the islands were fishermen. The islands have gone through many changes over the
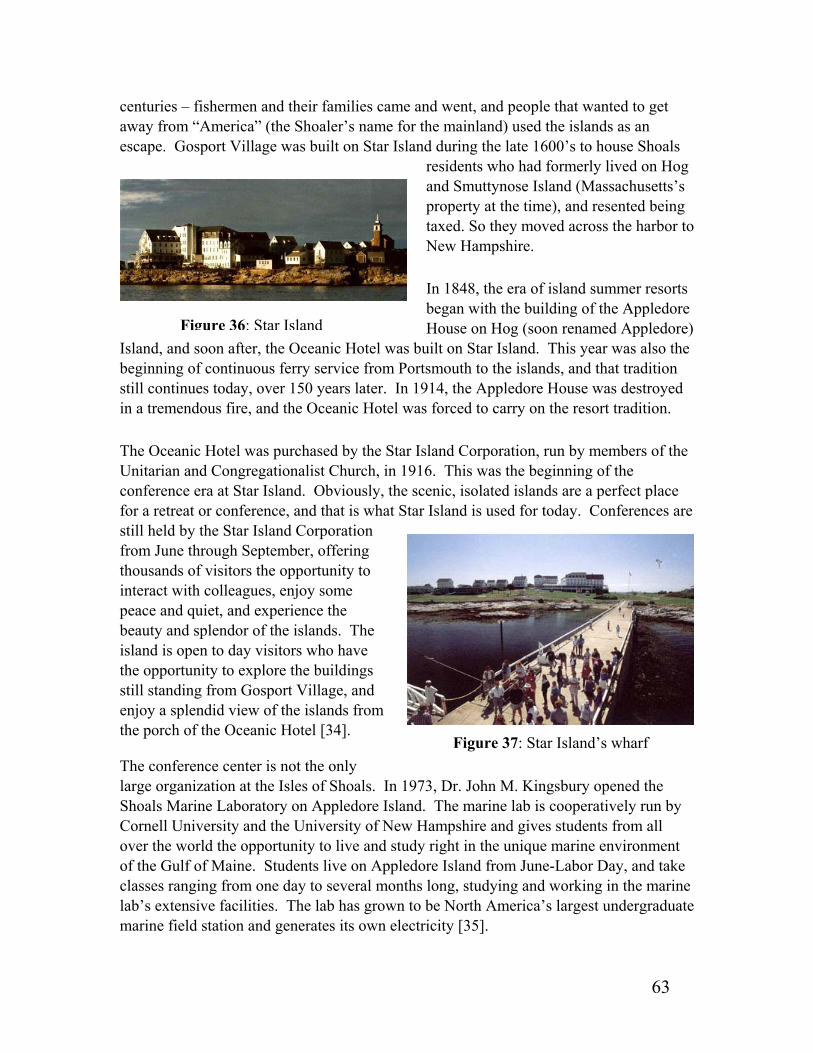
63
centuries – fishermen and their families came and went, and people that wanted to get away from “America” (the Shoaler’s name for the mainland) used the islands as an escape. Gosport Village was built on Star Island during the late 1600’s to house Shoals
residents who had formerly lived on Hog and Smuttynose Island (Massachusetts’s property at the time), and resented being taxed. So they moved across the harbor to New Hampshire.
In 1848, the era of island summer resorts began with the building of the Appledore House on Hog (soon renamed Appledore)
Island, and soon after, the Oceanic Hotel was built on Star Island. This year was also the beginning of continuous ferry service from Portsmouth to the islands, and that tradition still continues today, over 150 years later. In 1914, the Appledore House was destroyed in a tremendous fire, and the Oceanic Hotel was forced to carry on the resort tradition.
The Oceanic Hotel was purchased by the Star Island Corporation, run by members of the Unitarian and Congregationalist Church, in 1916. This was the beginning of the conference era at Star Island. Obviously, the scenic, isolated islands are a perfect place for a retreat or conference, and that is what Star Island is used for today. Conferences are still held by the Star Island Corporation from June through September, offering thousands of visitors the opportunity to interact with colleagues, enjoy some peace and quiet, and experience the beauty and splendor of the islands. The island is open to day visitors who have the opportunity to explore the buildings still standing from Gosport Village, and enjoy a splendid view of the islands from the porch of the Oceanic Hotel [34].
The conference center is not the only large organization at the Isles of Shoals. In 1973, Dr. John M. Kingsbury opened the Shoals Marine Laboratory on Appledore Island. The marine lab is cooperatively run by Cornell University and the University of New Hampshire and gives students from all over the world the opportunity to live and study right in the unique marine environment of the Gulf of Maine. Students live on Appledore Island from June-Labor Day, and take classes ranging from one day to several months long, studying and working in the marine lab’s extensive facilities. The lab has grown to be North America’s largest undergraduate marine field station and generates its own electricity [35].
Figure 36: Star Island
Figure 37: Star Island’s wharf

64
Appledore and Star are not the only inhabited islands. Duck Island is often crowded with a large colony of harbor seals that spend at least nine months out of the year there. Smuttynose Island is home to what may be the oldest house in Maine, the Haley House, built by Captain Samuel Haley in the 1700’s. Smuttynose Island was later the site of the infamous Smuttynose Murders in 1873. Cedar Island is privately owned by a local “lobstering” family, Lunging Island is home to the picturesque “Honeymoon Cottage” and is privately owned, and recently White Island was leased to Don Stevens of Atlantic Aqua Sport in Rye, who will run a cold-water diving school there.
8.3.2 Star Island Electric Load
Among the islands of Isles of Shoals, Star Island was chosen as the case study for it has the most significant energy demand and, at the same time, it’s characteristic load profile makes designing a power system very challenging.
Star Island has a summer population of 400, although only two people stay in residence year-round as winter keepers. There are a total of 30 buildings on the island, 8 houses that belong to the hotel complex and 22 other buildings, including the hotel itself, the powerhouse, shops, etc. The total annual electric load is approximately 220,000 kWh. The hourly load profile can be seen in Figure 38.
Figure 38: Isles of Shoals electric load
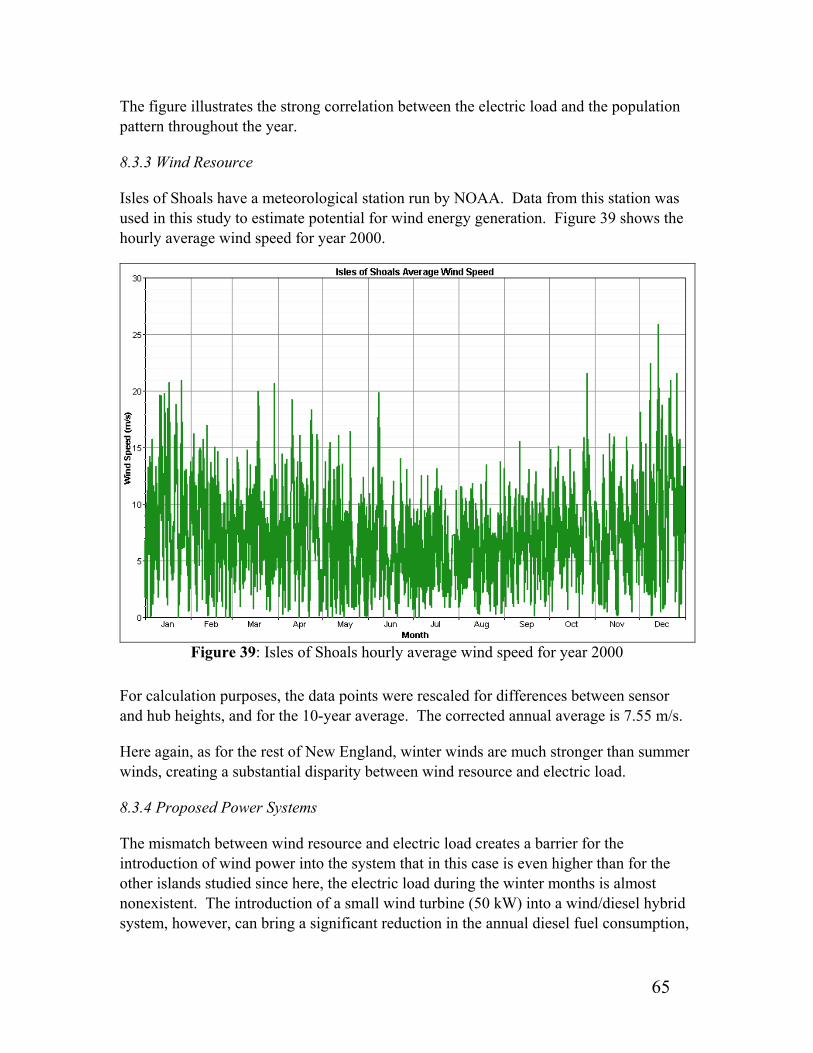
65
The figure illustrates the strong correlation between the electric load and the population pattern throughout the year.
8.3.3 Wind Resource
Isles of Shoals have a meteorological station run by NOAA. Data from this station was used in this study to estimate potential for wind energy generation. Figure 39 shows the hourly average wind speed for year 2000.
Figure 39: Isles of Shoals hourly average wind speed for year 2000
For calculation purposes, the data points were rescaled for differences between sensor and hub heights, and for the 10-year average. The corrected annual average is 7.55 m/s.
Here again, as for the rest of New England, winter winds are much stronger than summer winds, creating a substantial disparity between wind resource and electric load.
8.3.4 Proposed Power Systems
The mismatch between wind resource and electric load creates a barrier for the introduction of wind power into the system that in this case is even higher than for the other islands studied since here, the electric load during the winter months is almost nonexistent. The introduction of a small wind turbine (50 kW) into a wind/diesel hybrid system, however, can bring a significant reduction in the annual diesel fuel consumption,
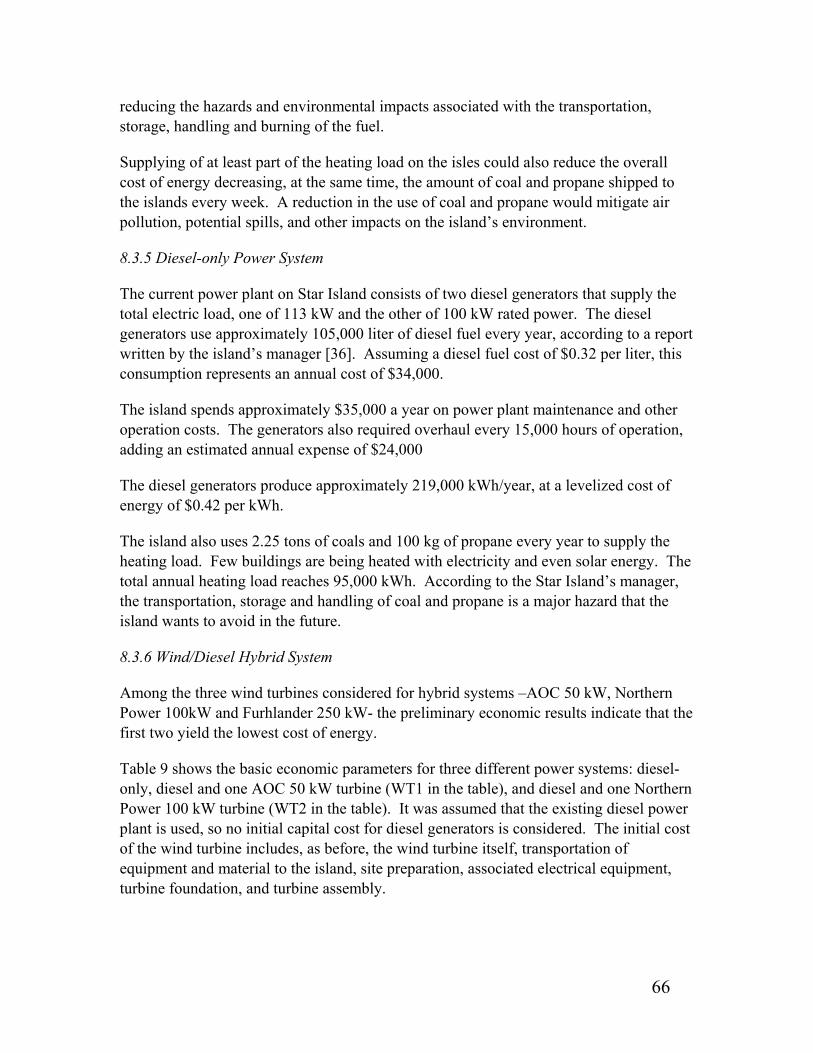
66
reducing the hazards and environmental impacts associated with the transportation, storage, handling and burning of the fuel.
Supplying of at least part of the heating load on the isles could also reduce the overall cost of energy decreasing, at the same time, the amount of coal and propane shipped to the islands every week. A reduction in the use of coal and propane would mitigate air pollution, potential spills, and other impacts on the island’s environment.
8.3.5 Diesel-only Power System
The current power plant on Star Island consists of two diesel generators that supply the total electric load, one of 113 kW and the other of 100 kW rated power. The diesel generators use approximately 105,000 liter of diesel fuel every year, according to a report written by the island’s manager [36]. Assuming a diesel fuel cost of $0.32 per liter, this consumption represents an annual cost of $34,000.
The island spends approximately $35,000 a year on power plant maintenance and other operation costs. The generators also required overhaul every 15,000 hours of operation, adding an estimated annual expense of $24,000
The diesel generators produce approximately 219,000 kWh/year, at a levelized cost of energy of $0.42 per kWh.
The island also uses 2.25 tons of coals and 100 kg of propane every year to supply the heating load. Few buildings are being heated with electricity and even solar energy. The total annual heating load reaches 95,000 kWh. According to the Star Island’s manager, the transportation, storage and handling of coal and propane is a major hazard that the island wants to avoid in the future.
8.3.6 Wind/Diesel Hybrid System
Among the three wind turbines considered for hybrid systems –AOC 50 kW, Northern Power 100kW and Furhlander 250 kW- the preliminary economic results indicate that the first two yield the lowest cost of energy.
Table 9 shows the basic economic parameters for three different power systems: diesel-only, diesel and one AOC 50 kW turbine (WT1 in the table), and diesel and one Northern Power 100 kW turbine (WT2 in the table). It was assumed that the existing diesel power plant is used, so no initial capital cost for diesel generators is considered. The initial cost of the wind turbine includes, as before, the wind turbine itself, transportation of equipment and material to the island, site preparation, associated electrical equipment, turbine foundation, and turbine assembly.

67
Table 9: Economic and performance parameters power systems
The table shows an important reduction in the fuel consumption, on the order of 40 %, when the wind turbines are introduced into the power system. The cost of energy also decreases, although the initial capital cost of the wind turbines and the excess energy fraction prevent a larger reduction. The table shows that 41 % of the energy generated by the AOC 50 kW would be wasted and 53 % of the energy generated by Northern Power 100 kW would be wasted due to mismatch between load and wind resources.
The supplying of part of heating load could improve the overall cost of the hybrid systems. Figure 40 shows the heating load on Star Island estimated. The heating load is estimated based on number of households being heated in any particular month and monthly average degree-days, as explained in section 7.4.
Figure 40: Star Island heating load
The annual heating load average is approximately 260 kWh per day with a peak load of 60 kW in January.
Table 10 shows the basic economic and performance parameters for the same three systems when the electricity generated by them supplies the total heating load. As in previous case studies, the heating load is considered as a primary load along with the electric load.
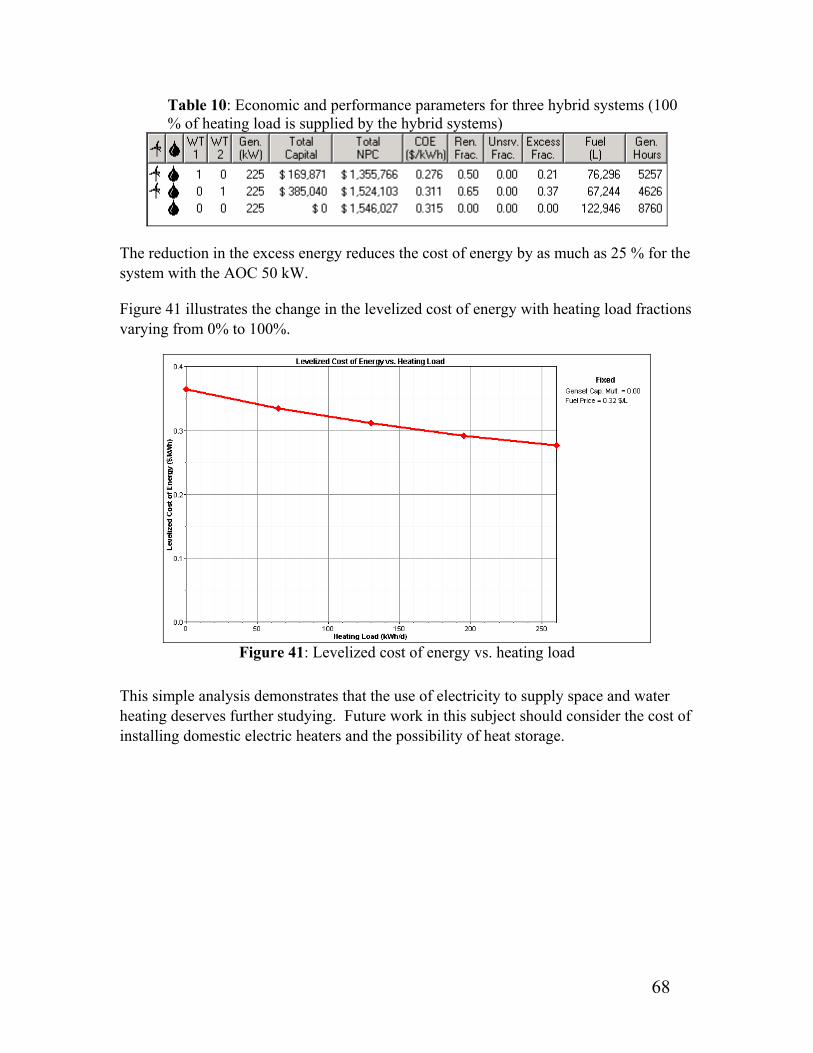
68
Table 10: Economic and performance parameters for three hybrid systems (100 % of heating load is supplied by the hybrid systems)
The reduction in the excess energy reduces the cost of energy by as much as 25 % for the system with the AOC 50 kW.
Figure 41 illustrates the change in the levelized cost of energy with heating load fractions varying from 0% to 100%.
Figure 41: Levelized cost of energy vs. heating load
This simple analysis demonstrates that the use of electricity to supply space and water heating deserves further studying. Future work in this subject should consider the cost of installing domestic electric heaters and the possibility of heat storage.
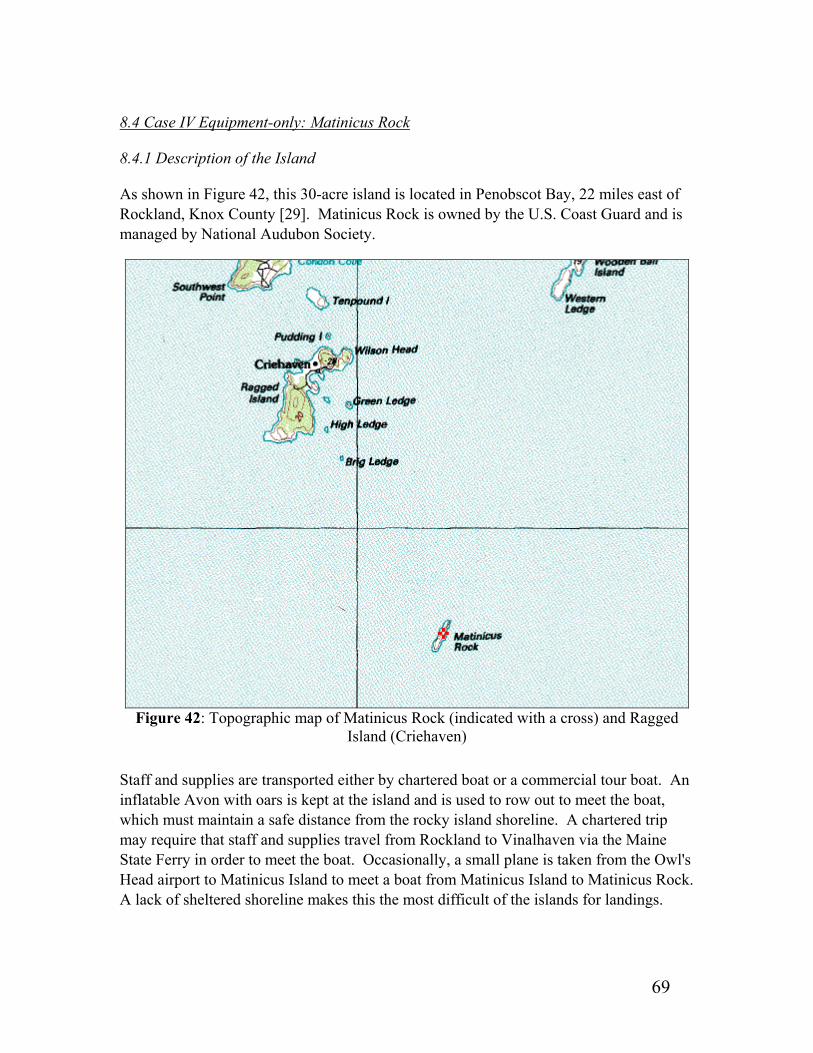
69
8.4 Case IV Equipment-only: Matinicus Rock
8.4.1 Description of the Island
As shown in Figure 42, this 30-acre island is located in Penobscot Bay, 22 miles east of Rockland, Knox County [29]. Matinicus Rock is owned by the U.S. Coast Guard and is managed by National Audubon Society.
Figure 42: Topographic map of Matinicus Rock (indicated with a cross) and Ragged
Island (Criehaven)
Staff and supplies are transported either by chartered boat or a commercial tour boat. An inflatable Avon with oars is kept at the island and is used to row out to meet the boat, which must maintain a safe distance from the rocky island shoreline. A chartered trip may require that staff and supplies travel from Rockland to Vinalhaven via the Maine State Ferry in order to meet the boat. Occasionally, a small plane is taken from the Owl's Head airport to Matinicus Island to meet a boat from Matinicus Island to Matinicus Rock. A lack of sheltered shoreline makes this the most difficult of the islands for landings.

70
A historic lighthouse is the hub of the living quarters (Figure 43). Three bedrooms are available for staff. The kitchen area has a propane camp stove and drinking water, collected in the lighthouse cistern, is filtered at the kitchen sink. Electricity is available most times from the solar array that is used to power the automated light and foghorn. A solar shower bag is set up in the shower stall in the
lighthouse bathroom. There is a composting toilet outside the boathouse. The activities, coordinated by the Island Supervisor, may include: daily bird counts, 3-hour blind observation stints, bird banding and census. Typical fauna on the island includes a large variety of birds and seals [37].
8.4.2 Matinicus Rock Electric Load
The average electric load on the island was estimated at 15 kWh per day, including the main light, several household appliances, such as radio, TV, refrigerator, water pump, and building lighting. A daily noise of 25 % and hourly noise of 20 % were used to create the daily and monthly load profiles. The estimated electric load profile on Matinicus Rock is shown in Figure 44.
Figure 43: Matinicus Rock Lighthouse
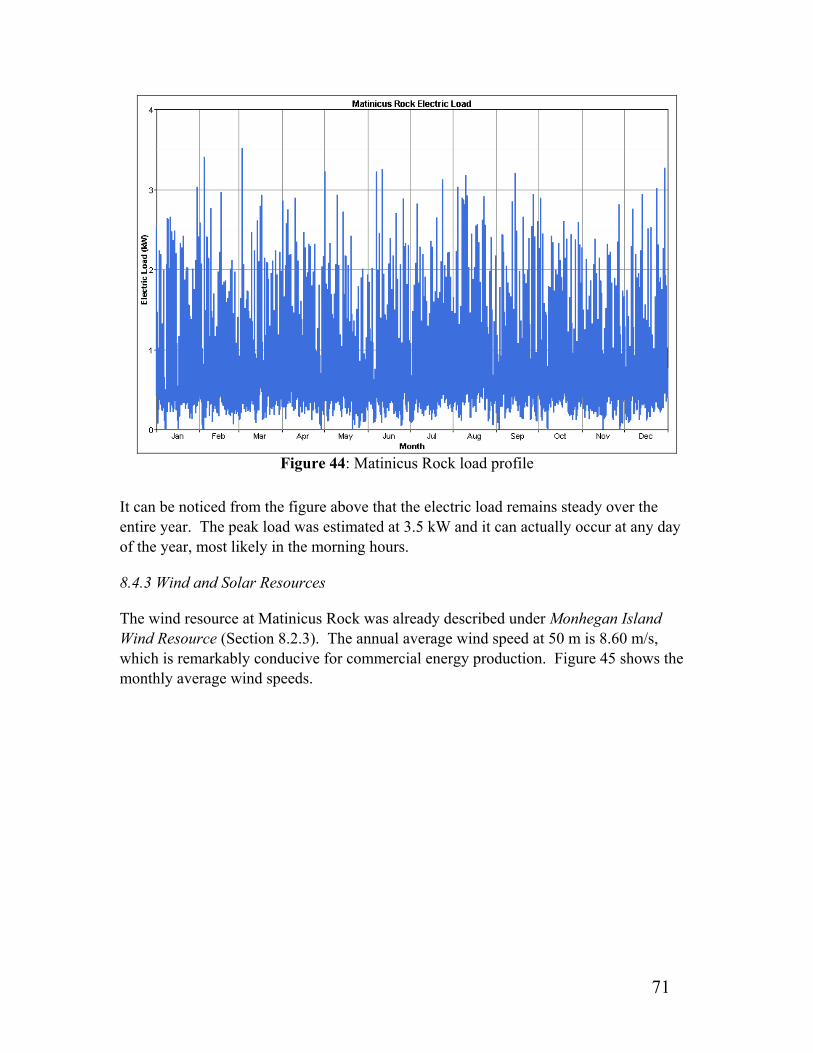
71
Figure 44: Matinicus Rock load profile
It can be noticed from the figure above that the electric load remains steady over the entire year. The peak load was estimated at 3.5 kW and it can actually occur at any day of the year, most likely in the morning hours.
8.4.3 Wind and Solar Resources
The wind resource at Matinicus Rock was already described under Monhegan Island Wind Resource (Section 8.2.3). The annual average wind speed at 50 m is 8.60 m/s, which is remarkably conducive for commercial energy production. Figure 45 shows the monthly average wind speeds.
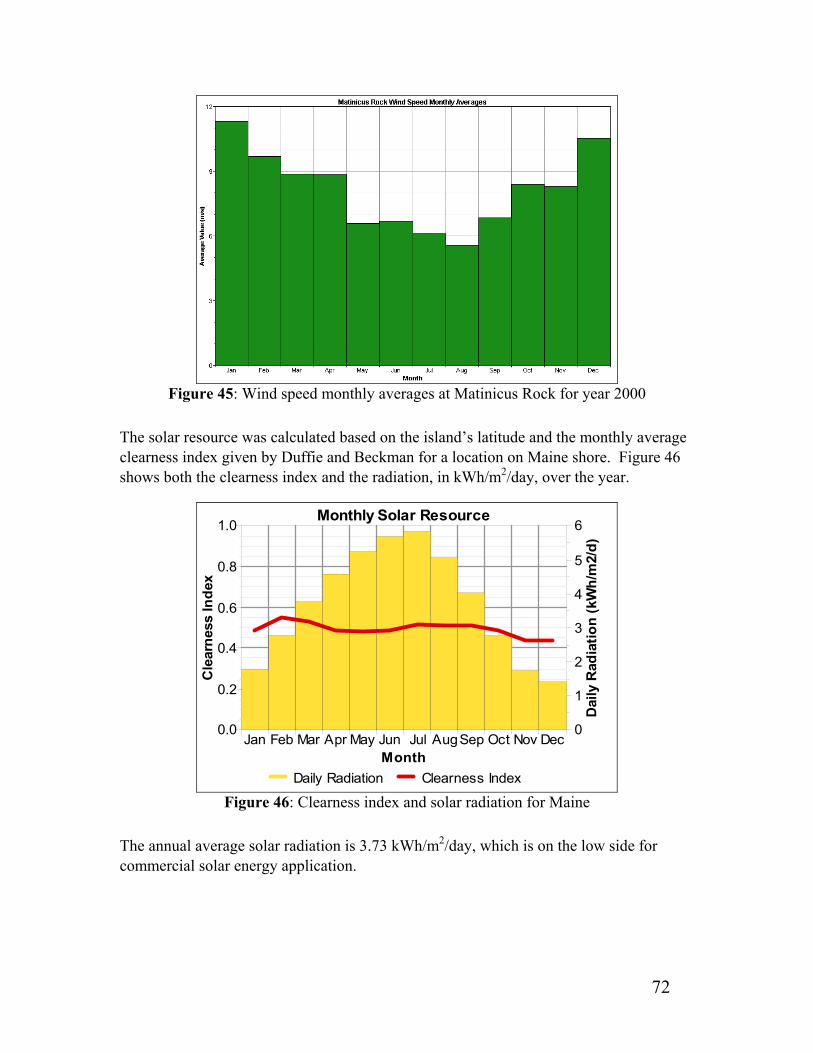
72
Figure 45: Wind speed monthly averages at Matinicus Rock for year 2000
The solar resource was calculated based on the island’s latitude and the monthly average clearness index given by Duffie and Beckman for a location on Maine shore. Figure 46 shows both the clearness index and the radiation, in kWh/m2/day, over the year.
0
1
2
3
4
5
6
Jan Feb Mar Apr May Jun Jul AugSep Oct Nov Dec0.0
0.2
0.4
0.6
0.8
1.0
Cle
arne
ss In
dex
Monthly Solar Resource
Month
Dai
ly R
adia
tion
(kW
h/m
2/d)
Daily Radiation Clearness Index Figure 46: Clearness index and solar radiation for Maine
The annual average solar radiation is 3.73 kWh/m2/day, which is on the low side for commercial solar energy application.

73
8.4.4 Proposed Power Systems
The combination of fairly steady, relatively small electric load, and a wind resource that decreases during the summer months in contrast to the solar radiation that increases in the same period suggests, a priori, the use of a PV/wind hybrid system with energy storage to improve power reliability. Even though this is the power system actually proposed and studied, two other systems are also analyzed here for comparison purposes: wind-alone and PV-alone, both featuring energy storage.
The maximum unserved energy level was set initially at 1 %, although a sensitivity analysis based on this parameter is presented at the end of this section. The maximum unserved energy is the maximum unserved fraction of the load that can be tolerated during the year. It is expressed as a percentage of the total annual electrical demand. Small changes in this parameter could change the results dramatically in some cases. This happens when there are high peaks for a very short time. If this number is set to zero, the system will be sized to meet even this very high peak load. This could mean that the system has to include large, very expensive equipment that is not fully used most of the time. If a small amount of unserved energy is allowed, then it is possible to choose much smaller, less expensive equipment that would be able to supply all but that peak load.
8.4.5 PV-only with Energy Storage
Even though there is a PV system already in place on Matinicus Rock, the configuration and performance of this power system was predicted using HOMER, the same tool used in the calculations of the other power systems proposed. Thus, a fair comparison among the systems was possible.
The basic configuration for the PV system includes a 10.5 kW photovoltaic array, a 65 kWh capacity battery bank, and a 3 kW inverter capable to deal with a 3.5 kW short-time peak. The total initial cost of the PV array including installation is $77,200. A total of 45 Trojan T-145 lead-acid batteries with a capacity of 1.46 kWh each are used for energy storage. The initial cost of the batteries was estimated at $6,500. The inverter used in this case is a Xantrex Technology DR-3624, with a continuous rated power of 3.6 kVA, 24V input and 120V and 60 Hz output, and a built-in A 70 Amp battery charger. The initial cost of the inverter is $1,500. Total annual operating and maintenance costs were estimated at $1,900, including transportation of maintenance personnel to the island when needed. The total initial cost of the system is $85,000 and the total annualized cost $8,300, assuming the same life cycle cost parameters as before. The total annual energy production of the system is 14,900 kWh, although 53 % of this energy is excess energy and has to be wasted. The actual electric load supplied is 5,500 kWh a year and the unserved load is 58 kWh, or 1 % of the annual load. The total annualized cost and the
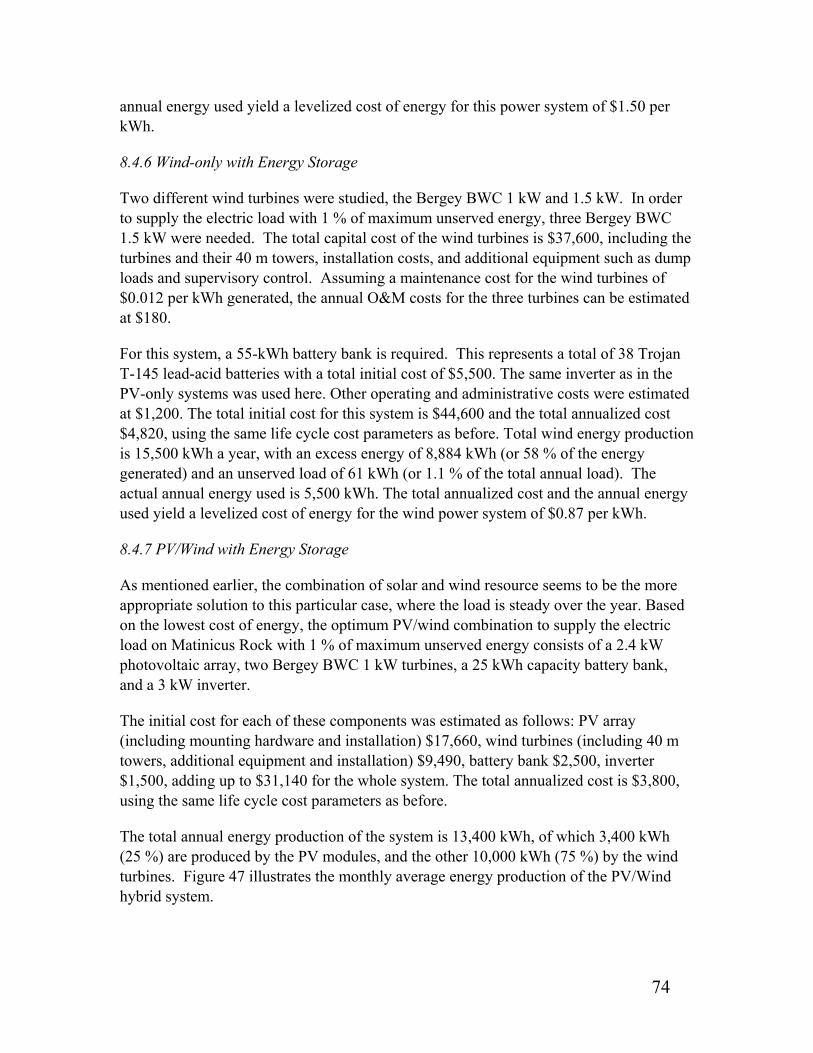
74
annual energy used yield a levelized cost of energy for this power system of $1.50 per kWh.
8.4.6 Wind-only with Energy Storage
Two different wind turbines were studied, the Bergey BWC 1 kW and 1.5 kW. In order to supply the electric load with 1 % of maximum unserved energy, three Bergey BWC 1.5 kW were needed. The total capital cost of the wind turbines is $37,600, including the turbines and their 40 m towers, installation costs, and additional equipment such as dump loads and supervisory control. Assuming a maintenance cost for the wind turbines of $0.012 per kWh generated, the annual O&M costs for the three turbines can be estimated at $180.
For this system, a 55-kWh battery bank is required. This represents a total of 38 Trojan T-145 lead-acid batteries with a total initial cost of $5,500. The same inverter as in the PV-only systems was used here. Other operating and administrative costs were estimated at $1,200. The total initial cost for this system is $44,600 and the total annualized cost $4,820, using the same life cycle cost parameters as before. Total wind energy production is 15,500 kWh a year, with an excess energy of 8,884 kWh (or 58 % of the energy generated) and an unserved load of 61 kWh (or 1.1 % of the total annual load). The actual annual energy used is 5,500 kWh. The total annualized cost and the annual energy used yield a levelized cost of energy for the wind power system of $0.87 per kWh.
8.4.7 PV/Wind with Energy Storage
As mentioned earlier, the combination of solar and wind resource seems to be the more appropriate solution to this particular case, where the load is steady over the year. Based on the lowest cost of energy, the optimum PV/wind combination to supply the electric load on Matinicus Rock with 1 % of maximum unserved energy consists of a 2.4 kW photovoltaic array, two Bergey BWC 1 kW turbines, a 25 kWh capacity battery bank, and a 3 kW inverter.
The initial cost for each of these components was estimated as follows: PV array (including mounting hardware and installation) $17,660, wind turbines (including 40 m towers, additional equipment and installation) $9,490, battery bank $2,500, inverter $1,500, adding up to $31,140 for the whole system. The total annualized cost is $3,800, using the same life cycle cost parameters as before.
The total annual energy production of the system is 13,400 kWh, of which 3,400 kWh (25 %) are produced by the PV modules, and the other 10,000 kWh (75 %) by the wind turbines. Figure 47 illustrates the monthly average energy production of the PV/Wind hybrid system.
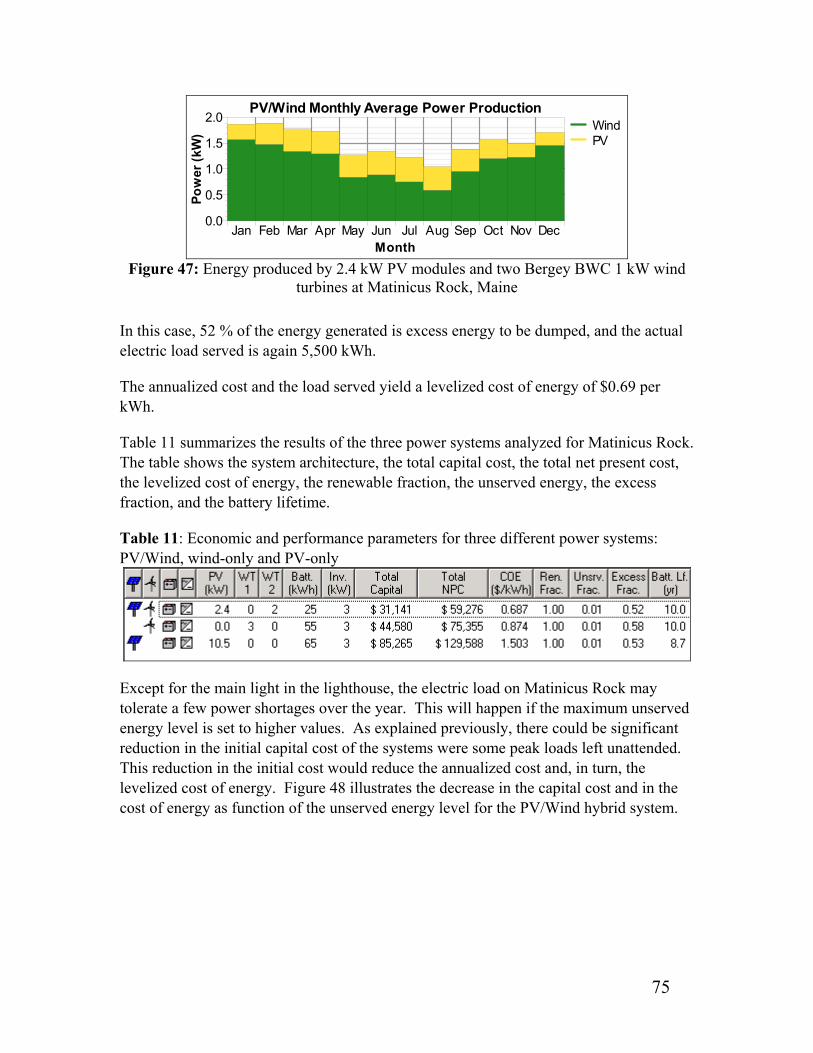
75
Jan Feb Mar Apr May Jun Jul Aug Sep Oct Nov Dec0.0
0.5
1.0
1.5
2.0
Pow
er (k
W)
PV/Wind Monthly Average Power Production
Month
WindPV
Figure 47: Energy produced by 2.4 kW PV modules and two Bergey BWC 1 kW wind
turbines at Matinicus Rock, Maine
In this case, 52 % of the energy generated is excess energy to be dumped, and the actual electric load served is again 5,500 kWh.
The annualized cost and the load served yield a levelized cost of energy of $0.69 per kWh.
Table 11 summarizes the results of the three power systems analyzed for Matinicus Rock. The table shows the system architecture, the total capital cost, the total net present cost, the levelized cost of energy, the renewable fraction, the unserved energy, the excess fraction, and the battery lifetime.
Table 11: Economic and performance parameters for three different power systems: PV/Wind, wind-only and PV-only
Except for the main light in the lighthouse, the electric load on Matinicus Rock may tolerate a few power shortages over the year. This will happen if the maximum unserved energy level is set to higher values. As explained previously, there could be significant reduction in the initial capital cost of the systems were some peak loads left unattended. This reduction in the initial cost would reduce the annualized cost and, in turn, the levelized cost of energy. Figure 48 illustrates the decrease in the capital cost and in the cost of energy as function of the unserved energy level for the PV/Wind hybrid system.
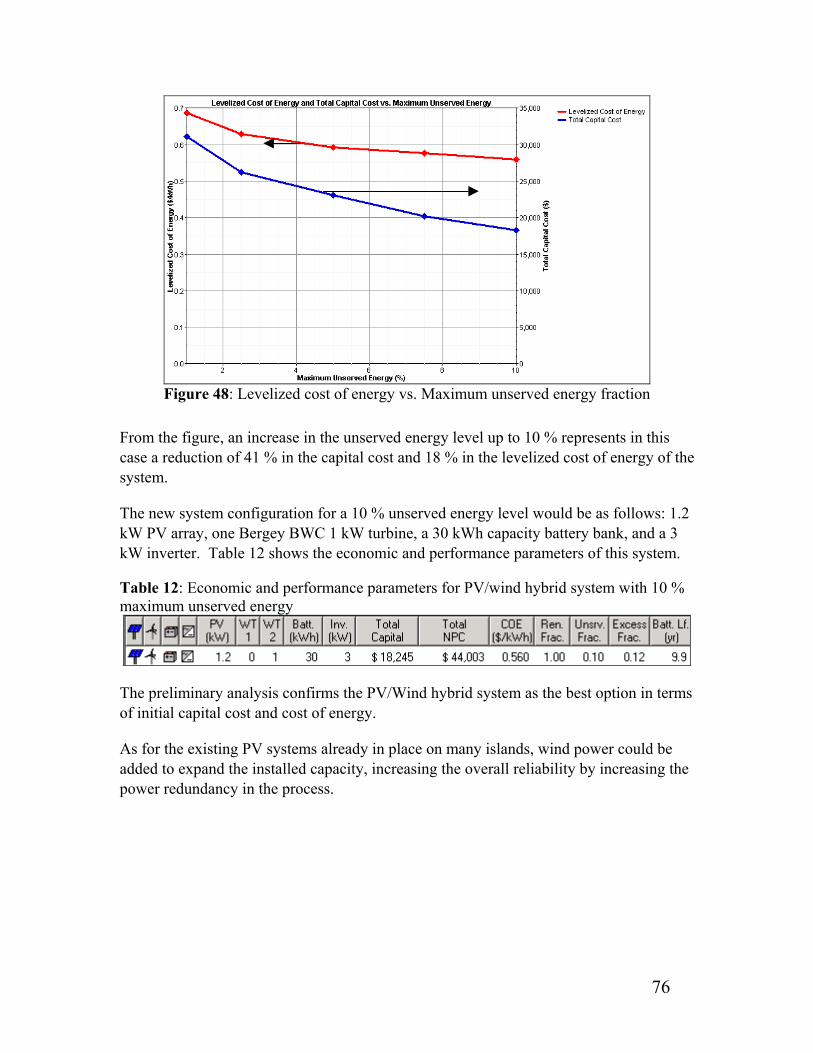
76
Figure 48: Levelized cost of energy vs. Maximum unserved energy fraction
From the figure, an increase in the unserved energy level up to 10 % represents in this case a reduction of 41 % in the capital cost and 18 % in the levelized cost of energy of the system.
The new system configuration for a 10 % unserved energy level would be as follows: 1.2 kW PV array, one Bergey BWC 1 kW turbine, a 30 kWh capacity battery bank, and a 3 kW inverter. Table 12 shows the economic and performance parameters of this system.
Table 12: Economic and performance parameters for PV/wind hybrid system with 10 % maximum unserved energy
The preliminary analysis confirms the PV/Wind hybrid system as the best option in terms of initial capital cost and cost of energy.
As for the existing PV systems already in place on many islands, wind power could be added to expand the installed capacity, increasing the overall reliability by increasing the power redundancy in the process.
77
Public Acceptance of Wind Power on the New England Islands
Over the last six months, informal discussions about potential wind power development have taken place with people involved with the islands in different capacities, from local utility managers to island technical staff to island residents.
The following are the most common issues that were brought up during those conversations. Power reliability was perhaps the most frequent issue about energy supply among community islands. Power shortages and system failure in the past, especially with diesel systems and in some cases with wind turbines, have prompted in many cases the installation of underwater cables running from mainland.
● A smooth operating power system was the requirement for some islanders in small, residential islands. In some of these privately owned islands PV systems were installed in the past few years even though wind power would have been a more economic solution. The lack of moving parts and the low maintenance of PV modules seem to appeal to the homeowners over economic factors.
● Visual impact and noise are a concern among those islands where the main activities are related with nature, such as summer camps and other recreational activities, like Thompson Island, MA. The issue is also important for some mostly residential islands like Block Island, RI, and Nantucket Island, MA, to name just two.
● Fuel transportation, handling and storage were a major concern in all cases. Different types of fuel are involved in these operations: diesel fuel for diesel generators, heating fuel for space heating, and propane for either space heating or refrigeration. The operation and logistics of shipping fuel to the islands are very time consuming and the risk of spills is always present. Despite this fact, the possibility of switching to a renewable resource for energy supply to reduce the fuel consumption had not even been pondered, in general, because of lack of knowledge about the technology available.

78
Conclusions
The wind resources off the New England coast indicate tremendous potential for wind power development. Historical wind data collected by the National Data Buoy Center for the past 20 years gives annual averages wind speeds ranging from 5.50 m/s in Boston Harbor to almost 8 m/s off the Maine coast which if scaled to normal wind turbine hub heights represents 6.75 m/s to almost 9 m/s respectively. This enormous wind resource represents the possibility of improving the existing power systems on the islands and installing new power systems, by introducing state-of-the-art wind turbines.
Although each of the 191 islands is unique and represents a different case study that must be individually considered, some general conclusions can be drawn from this report.
Grid-connected wind turbines on islands where underwater transmission cables already exist could increase the energy supply reliability by increasing the number of energy sources. There will also be reduction in the greenhouse gases emissions and nuclear material waste by decreasing the amount of fossil and nuclear fuel used in the power plants onshore as well as reduction in the electricity bills.
There are some potential economic advantages for this kind of power system, mainly the use of the offshore wind resource without the expensive and technically challenging installation and maintenance of the “conventional” offshore wind farms installed in the water. The Fox Islands case study suggests that the economic advantages of grid-connected wind turbines can be achieved even for the smallest wind power system proposed.
For the isolated islands, the three different cases analyzed in this report suggest that the introduction of wind power into the stand-alone systems would improve the performance and the economics of the systems. The performance is improved by multiplying the number of energy sources, thus increasing the reliability of the systems. For the diesel/wind hybrid system, the reduction in the diesel fuel consumption could be substantial, of the order of 50 %. The reduction in the diesel fuel consumption is a major issue because it not only reduces the overall cost of the system, but also reduces the influence of uncertain future fuel prices and hazards associated with fuel transportation, handling and storage. A reduction in the number of operation hours of diesel generators also reduces the greenhouse gases emissions and noise. The reduction in fuel consumption, although somewhat offset by the higher initial cost of the wind turbines, also reduces the cost of energy of the system up to 16 % in some cases.
The use of electricity for heating purposes was analyzed and, in all cases, the advantages of using the otherwise wasted energy were promising. Reduction in the cost of energy of up to 25 % could be achieved, although a more detailed analysis of other costs involved, such as the cost of the electric heaters, should be included in future studies.

79
For those islands, like Matinicus Rock, where PV modules are frequently seen as the most common solution to supply a steady electric load, PV/wind hybrid systems could actually reduce the initial cost as well as the cost of energy by as much as 60% and 50 % respectively.
Finally, public acceptance seems to be a major factor for the future of wind power development on the New England islands. Public education about the environmental issues and the technology available to replace conventional power systems, and the installation of successful small-scale projects can help increase the public awareness of the benefits of renewable energy systems.

80
10. References
[1] Assessment of the potential for the use of wind energy on Boston Harbor Islands: W.A. Vachon & Associates, January 24, 2000
[2] Deer Island Study Wind Power Assessment and Monitoring Study: Site and Issues Evaluation - Devonrue Limited, April 1996
[3] Entech Engineering Incorporated, Block Island Energy Grant, http://www.entech-engineering.com/BIREG.htm
[4] Boston Harbor Islands, http://www.bostonislands.com/deer.html
[5] Boston Harbor Islands, http://www.bostonislands.org/manage/manage_admin_adcncl.html
[6] Geographic Names Information System, Query Form For The United States And Its Territories, U.S. Geological Service, http://geonames.usgs.gov/pls/gnis/web_query.gnis_web_query_form, 2001.
[7] Manwell, J.F., Johnson, C., Wind/Diesel Power System Options Report for Cuttyhunk Island, Renewable Energy Research Laboratory, University of Massachusetts, Amherst, July 2001.
[8] Energy Information Administration, Space-Heating Energy Consumption in U.S. Households, www.eia.doe.gov/emeu/recs/recs97_ce/t2_4c.html, 2002.
[9] National Data Buoy Center, National Oceanographic and Atmospheric Administration, Historical Data, www.ndbc.noaa.gov
[10] Manwell, J. F., McGowan, J. G., Rogers, A. L., Wind Energy Explained, Wiley & Sons, In Press.
[11] Rogers A. L., Manwell, J. F., Ellis, A. F., Abdulwahid, U., Power Plant Options Report for Thompson Island, Renewable Energy Research Laboratory, University of Massachusetts, Amherst, 1999.
[12] Duffie, J. A., Beckman, W. A., Solar Engineering of Thermal Processes, Second edition, John Wiley and Sons, Inc., 1991.
[13] Maine Lighthouses Map and Guide, New England Lighthouses, a Virtual Guide, www.lighthouse.cc.
[14] Wind Turbines Manufacturers:

81
Bergey: www.bergey.com Atlantic Orient Corporation: www.aocwind.net Northern Power: www.northernpower.com Furhlaender: www.fuhrlaender.de Vestas: www.vestas.com Nordex: www.nordex.dk
[15] Institute for Wind Energy, Delft University of Technology, A Typical Design Solution for an Offshore Wind Energy Conversion System, Opti-OWECS Final Report, Vol. 4, 1998.
[16] RS Means, Electrical Cost Data, CMD Group, 2001.
[17] National Renewable Energy Laboratory, The Hybrid Optimization Model for Electric Renewables, http://www.nrel.gov/international/tools/HOMER/homer.html, 2001.
[18] Renewable Energy Research Laboratory, The Hybrid Power System Simulation Model, University of Massachusetts at Amherst, http://www.ecs.umass.edu/mie/labs/rerl/index.html, 2001.
[19] Energy Information Administration, U.S. Heating Oil, Diesel Fuel, and Distillate, www.eia.doe.gov, 2002.
[20] Diesel Generators Manufacturers:
www.johndeere.com www.deutz.co.za www.penta.volvo.se
[21] PV Modules Manufacturers:
Solarex: www.bpsolar.com/solarex.html Siemens: www.siemenssolar.com
[22] Inverter Manufacturers
http://power-inverter.net
http://www.xantrex.com/Market/distributed.html
[23] Battery Manufacturers
http://www.trojan-battery.com
[24] Island Institute, Private Communication, May 25, 2001.

82
[25] Block Island Power Company, Financial Overview, 1993.
[26] Monhegan Plantation Power District, Statement of Income and Expenses, www.monhegan.com/utility, 2001.
[27] Vinalhaven Historical Society, A Brief History of Vinalhaven, http://www.midcoast.com/~vhhissoc/vhistory.htm, 2001.
[28] North Haven Community School, North Haven Island, http://www.midcoast.com/~nhcs/northhaven.html, 2001.
[29] Maps a la Carte, Inc., TopoZone.com, http://www.topozone.com, 2000.
[30] Gallant, F. K., Fox Island Electric, http://www.foxislands.net, 1983.
[31] Monhegan Boat Line, An Introduction to Monhegan, Maine, http://www.briegull.com/Monhegan/mibooklet.html, 2001.
[32] Northern Power System, 300 kW Diesel Power Plant Supports Monhegan Island, www.northernpower.com, 2001.
[33] Isles of Shoals Steamship Company, Isles of Shoals History, http://www.islesofshoals.com/histios.html, 2001.
[34] Star Island Corporation, Star Island, Religious and Educational Conference Center, http://www.starisland.org
[35] Shoals Marine Laboratory, Cornell University, G-14 Stimson Hall, Ithaca, NY 14853, http://www.sml.cornell.edu, 2001.
[36] Star Island Corporation, Manager’s Report (Private Communication), Isles of Shoals, 2001.
[37] Project Puffin, Research Stations: Matinicus Rock, www.projectpuffin.org/islands/matinicus.html, 2001.
[38] Town of Gosnold, Cuttyhunk Island, Massachusetts, Annual Reports Years 1988-2000.
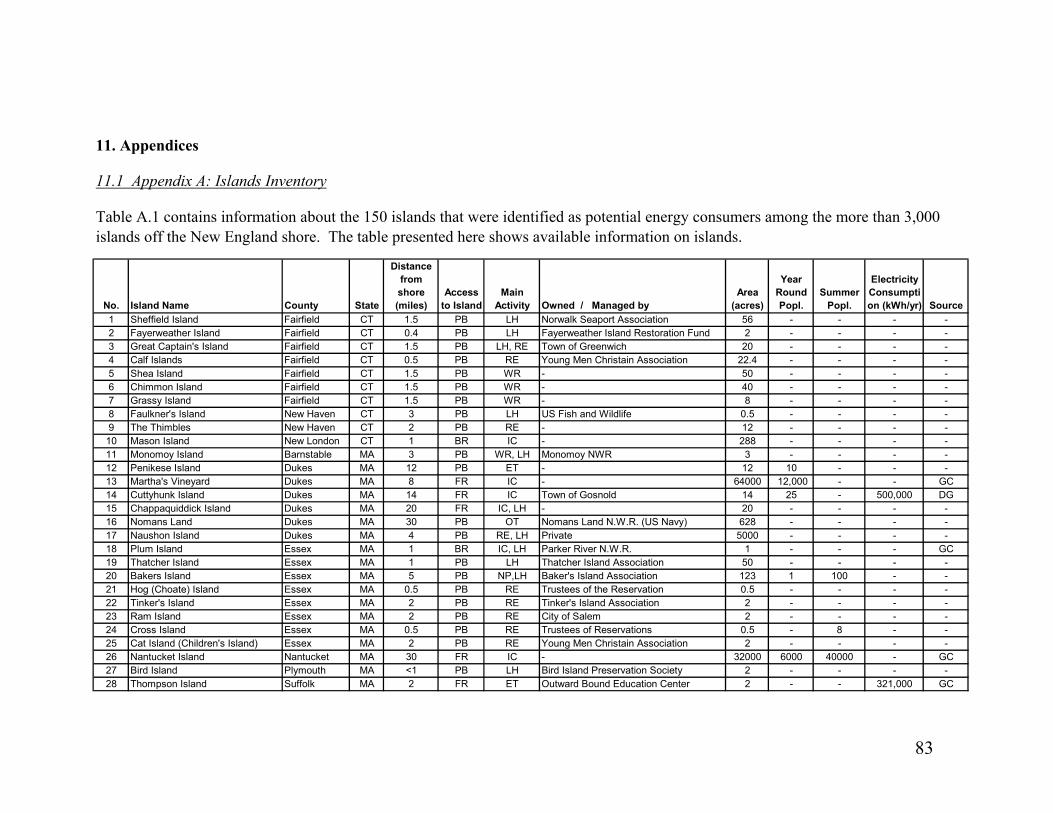
83
11. Appendices
11.1 Appendix A: Islands Inventory
Table A.1 contains information about the 150 islands that were identified as potential energy consumers among the more than 3,000 islands off the New England shore. The table presented here shows available information on islands.
No. Island Name County State
Distance from shore (miles)
Access to Island
Main Activity Owned / Managed by
Area (acres)
Year Round Popl.
Summer Popl.
Electricity Consumption (kWh/yr) Source
1 Sheffield Island Fairfield CT 1.5 PB LH Norwalk Seaport Association 56 - - - -2 Fayerweather Island Fairfield CT 0.4 PB LH Fayerweather Island Restoration Fund 2 - - - -3 Great Captain's Island Fairfield CT 1.5 PB LH, RE Town of Greenwich 20 - - - -4 Calf Islands Fairfield CT 0.5 PB RE Young Men Christain Association 22.4 - - - -5 Shea Island Fairfield CT 1.5 PB WR - 50 - - - -6 Chimmon Island Fairfield CT 1.5 PB WR - 40 - - - -7 Grassy Island Fairfield CT 1.5 PB WR - 8 - - - -8 Faulkner's Island New Haven CT 3 PB LH US Fish and Wildlife 0.5 - - - -9 The Thimbles New Haven CT 2 PB RE - 12 - - - -
10 Mason Island New London CT 1 BR IC - 288 - - - -11 Monomoy Island Barnstable MA 3 PB WR, LH Monomoy NWR 3 - - - -12 Penikese Island Dukes MA 12 PB ET - 12 10 - - -13 Martha's Vineyard Dukes MA 8 FR IC - 64000 12,000 - - GC14 Cuttyhunk Island Dukes MA 14 FR IC Town of Gosnold 14 25 - 500,000 DG15 Chappaquiddick Island Dukes MA 20 FR IC, LH - 20 - - - -16 Nomans Land Dukes MA 30 PB OT Nomans Land N.W.R. (US Navy) 628 - - - -17 Naushon Island Dukes MA 4 PB RE, LH Private 5000 - - - -18 Plum Island Essex MA 1 BR IC, LH Parker River N.W.R. 1 - - - GC19 Thatcher Island Essex MA 1 PB LH Thatcher Island Association 50 - - - -20 Bakers Island Essex MA 5 PB NP,LH Baker's Island Association 123 1 100 - -21 Hog (Choate) Island Essex MA 0.5 PB RE Trustees of the Reservation 0.5 - - - -22 Tinker's Island Essex MA 2 PB RE Tinker's Island Association 2 - - - -23 Ram Island Essex MA 2 PB RE City of Salem 2 - - - -24 Cross Island Essex MA 0.5 PB RE Trustees of Reservations 0.5 - 8 - -25 Cat Island (Children's Island) Essex MA 2 PB RE Young Men Christain Association 2 - - - -26 Nantucket Island Nantucket MA 30 FR IC - 32000 6000 40000 - GC27 Bird Island Plymouth MA <1 PB LH Bird Island Preservation Society 2 - - - -28 Thompson Island Suffolk MA 2 FR ET Outward Bound Education Center 2 - - 321,000 GC
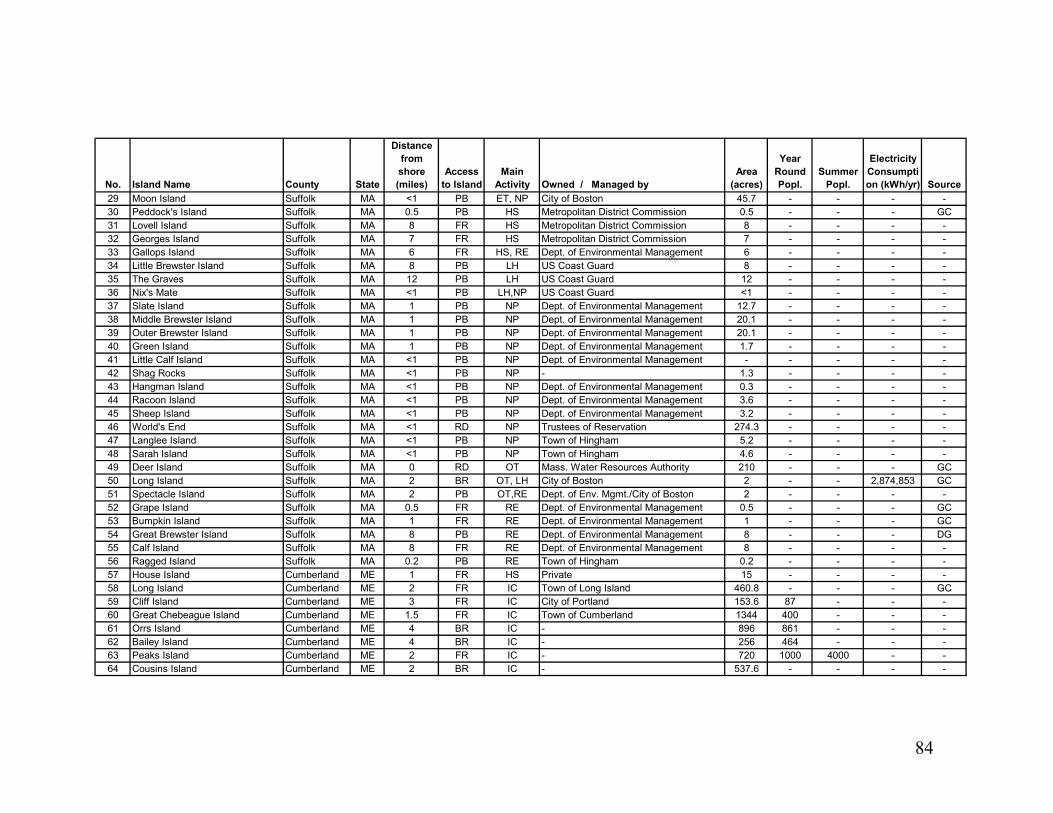
84
No. Island Name County State
Distance from shore (miles)
Access to Island
Main Activity Owned / Managed by
Area (acres)
Year Round Popl.
Summer Popl.
Electricity Consumption (kWh/yr) Source
29 Moon Island Suffolk MA <1 PB ET, NP City of Boston 45.7 - - - -30 Peddock's Island Suffolk MA 0.5 PB HS Metropolitan District Commission 0.5 - - - GC31 Lovell Island Suffolk MA 8 FR HS Metropolitan District Commission 8 - - - -32 Georges Island Suffolk MA 7 FR HS Metropolitan District Commission 7 - - - -33 Gallops Island Suffolk MA 6 FR HS, RE Dept. of Environmental Management 6 - - - -34 Little Brewster Island Suffolk MA 8 PB LH US Coast Guard 8 - - - -35 The Graves Suffolk MA 12 PB LH US Coast Guard 12 - - - -36 Nix's Mate Suffolk MA <1 PB LH,NP US Coast Guard <1 - - - -37 Slate Island Suffolk MA 1 PB NP Dept. of Environmental Management 12.7 - - - -38 Middle Brewster Island Suffolk MA 1 PB NP Dept. of Environmental Management 20.1 - - - -39 Outer Brewster Island Suffolk MA 1 PB NP Dept. of Environmental Management 20.1 - - - -40 Green Island Suffolk MA 1 PB NP Dept. of Environmental Management 1.7 - - - -41 Little Calf Island Suffolk MA <1 PB NP Dept. of Environmental Management - - - - -42 Shag Rocks Suffolk MA <1 PB NP - 1.3 - - - -43 Hangman Island Suffolk MA <1 PB NP Dept. of Environmental Management 0.3 - - - -44 Racoon Island Suffolk MA <1 PB NP Dept. of Environmental Management 3.6 - - - -45 Sheep Island Suffolk MA <1 PB NP Dept. of Environmental Management 3.2 - - - -46 World's End Suffolk MA <1 RD NP Trustees of Reservation 274.3 - - - -47 Langlee Island Suffolk MA <1 PB NP Town of Hingham 5.2 - - - -48 Sarah Island Suffolk MA <1 PB NP Town of Hingham 4.6 - - - -49 Deer Island Suffolk MA 0 RD OT Mass. Water Resources Authority 210 - - - GC50 Long Island Suffolk MA 2 BR OT, LH City of Boston 2 - - 2,874,853 GC51 Spectacle Island Suffolk MA 2 PB OT,RE Dept. of Env. Mgmt./City of Boston 2 - - - -52 Grape Island Suffolk MA 0.5 FR RE Dept. of Environmental Management 0.5 - - - GC53 Bumpkin Island Suffolk MA 1 FR RE Dept. of Environmental Management 1 - - - GC54 Great Brewster Island Suffolk MA 8 PB RE Dept. of Environmental Management 8 - - - DG55 Calf Island Suffolk MA 8 FR RE Dept. of Environmental Management 8 - - - -56 Ragged Island Suffolk MA 0.2 PB RE Town of Hingham 0.2 - - - -57 House Island Cumberland ME 1 FR HS Private 15 - - - -58 Long Island Cumberland ME 2 FR IC Town of Long Island 460.8 - - - GC59 Cliff Island Cumberland ME 3 FR IC City of Portland 153.6 87 - - -60 Great Chebeague Island Cumberland ME 1.5 FR IC Town of Cumberland 1344 400 - - -61 Orrs Island Cumberland ME 4 BR IC - 896 861 - - -62 Bailey Island Cumberland ME 4 BR IC - 256 464 - - -63 Peaks Island Cumberland ME 2 FR IC - 720 1000 4000 - -64 Cousins Island Cumberland ME 2 BR IC - 537.6 - - - -
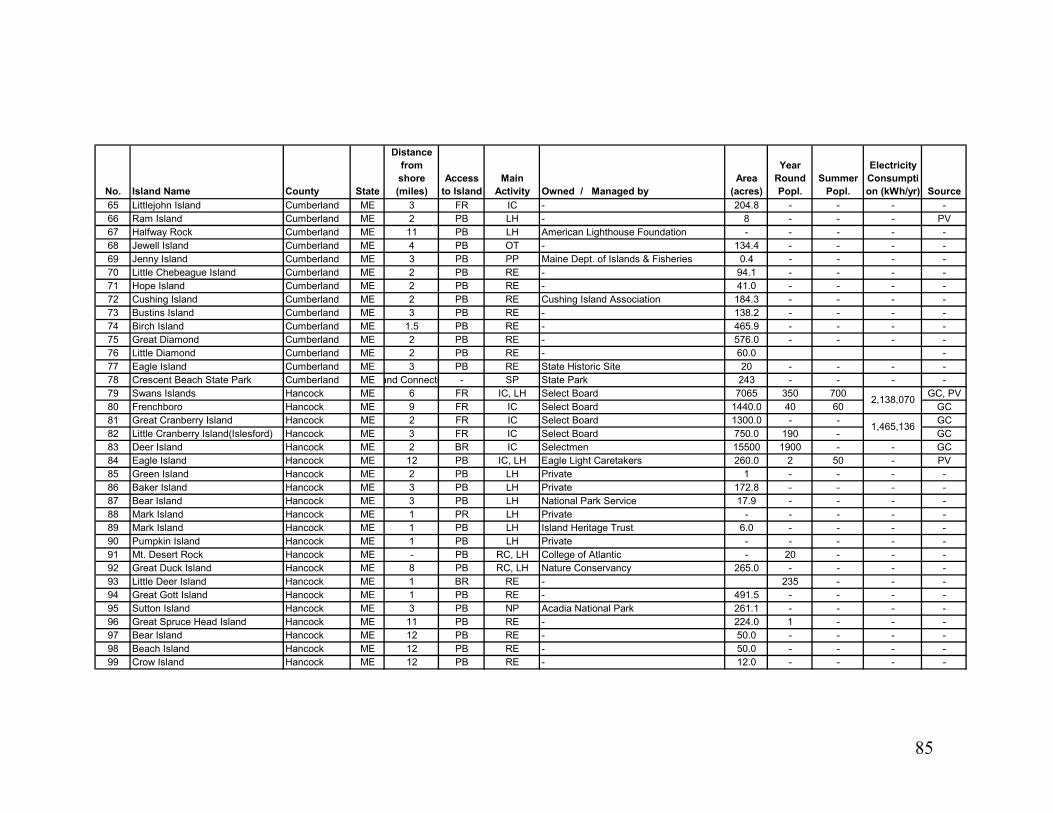
85
No. Island Name County State
Distance from shore (miles)
Access to Island
Main Activity Owned / Managed by
Area (acres)
Year Round Popl.
Summer Popl.
Electricity Consumption (kWh/yr) Source
65 Littlejohn Island Cumberland ME 3 FR IC - 204.8 - - - -66 Ram Island Cumberland ME 2 PB LH - 8 - - - PV67 Halfway Rock Cumberland ME 11 PB LH American Lighthouse Foundation - - - - -68 Jewell Island Cumberland ME 4 PB OT - 134.4 - - - -69 Jenny Island Cumberland ME 3 PB PP Maine Dept. of Islands & Fisheries 0.4 - - - -70 Little Chebeague Island Cumberland ME 2 PB RE - 94.1 - - - -71 Hope Island Cumberland ME 2 PB RE - 41.0 - - - -72 Cushing Island Cumberland ME 2 PB RE Cushing Island Association 184.3 - - - -73 Bustins Island Cumberland ME 3 PB RE - 138.2 - - - -74 Birch Island Cumberland ME 1.5 PB RE - 465.9 - - - -75 Great Diamond Cumberland ME 2 PB RE - 576.0 - - - -76 Little Diamond Cumberland ME 2 PB RE - 60.0 -77 Eagle Island Cumberland ME 3 PB RE State Historic Site 20 - - - -78 Crescent Beach State Park Cumberland ME and Connecte - SP State Park 243 - - - -79 Swans Islands Hancock ME 6 FR IC, LH Select Board 7065 350 700 GC, PV80 Frenchboro Hancock ME 9 FR IC Select Board 1440.0 40 60 GC81 Great Cranberry Island Hancock ME 2 FR IC Select Board 1300.0 - - GC82 Little Cranberry Island(Islesford) Hancock ME 3 FR IC Select Board 750.0 190 - GC83 Deer Island Hancock ME 2 BR IC Selectmen 15500 1900 - - GC84 Eagle Island Hancock ME 12 PB IC, LH Eagle Light Caretakers 260.0 2 50 - PV85 Green Island Hancock ME 2 PB LH Private 1 - - - -86 Baker Island Hancock ME 3 PB LH Private 172.8 - - - -87 Bear Island Hancock ME 3 PB LH National Park Service 17.9 - - - -88 Mark Island Hancock ME 1 PR LH Private - - - - -89 Mark Island Hancock ME 1 PB LH Island Heritage Trust 6.0 - - - -90 Pumpkin Island Hancock ME 1 PB LH Private - - - - -91 Mt. Desert Rock Hancock ME - PB RC, LH College of Atlantic - 20 - - -92 Great Duck Island Hancock ME 8 PB RC, LH Nature Conservancy 265.0 - - - -93 Little Deer Island Hancock ME 1 BR RE - 235 - - -94 Great Gott Island Hancock ME 1 PB RE - 491.5 - - - -95 Sutton Island Hancock ME 3 PB NP Acadia National Park 261.1 - - - -96 Great Spruce Head Island Hancock ME 11 PB RE - 224.0 1 - - -97 Bear Island Hancock ME 12 PB RE - 50.0 - - - -98 Beach Island Hancock ME 12 PB RE - 50.0 - - - -99 Crow Island Hancock ME 12 PB RE - 12.0 - - - -
1,465,136
2,138,070
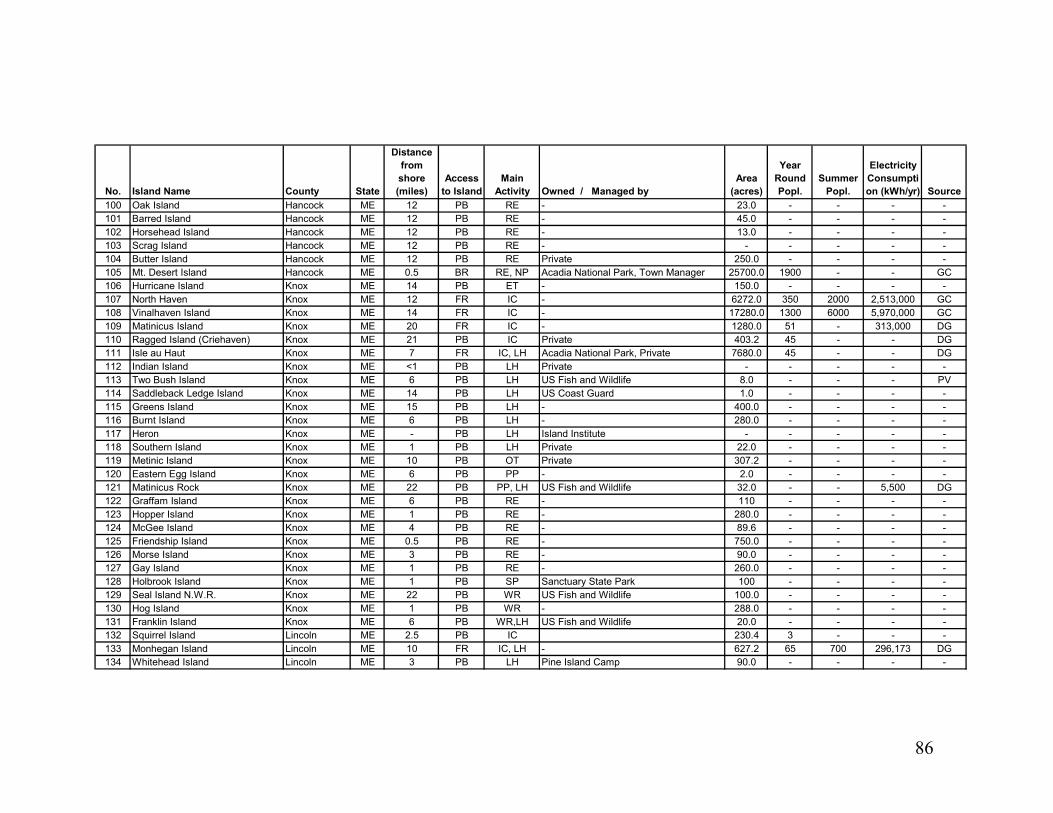
86
No. Island Name County State
Distance from shore (miles)
Access to Island
Main Activity Owned / Managed by
Area (acres)
Year Round Popl.
Summer Popl.
Electricity Consumption (kWh/yr) Source
100 Oak Island Hancock ME 12 PB RE - 23.0 - - - -101 Barred Island Hancock ME 12 PB RE - 45.0 - - - -102 Horsehead Island Hancock ME 12 PB RE - 13.0 - - - -103 Scrag Island Hancock ME 12 PB RE - - - - - -104 Butter Island Hancock ME 12 PB RE Private 250.0 - - - -105 Mt. Desert Island Hancock ME 0.5 BR RE, NP Acadia National Park, Town Manager 25700.0 1900 - - GC106 Hurricane Island Knox ME 14 PB ET - 150.0 - - - -107 North Haven Knox ME 12 FR IC - 6272.0 350 2000 2,513,000 GC108 Vinalhaven Island Knox ME 14 FR IC - 17280.0 1300 6000 5,970,000 GC109 Matinicus Island Knox ME 20 FR IC - 1280.0 51 - 313,000 DG110 Ragged Island (Criehaven) Knox ME 21 PB IC Private 403.2 45 - - DG111 Isle au Haut Knox ME 7 FR IC, LH Acadia National Park, Private 7680.0 45 - - DG112 Indian Island Knox ME <1 PB LH Private - - - - -113 Two Bush Island Knox ME 6 PB LH US Fish and Wildlife 8.0 - - - PV114 Saddleback Ledge Island Knox ME 14 PB LH US Coast Guard 1.0 - - - -115 Greens Island Knox ME 15 PB LH - 400.0 - - - -116 Burnt Island Knox ME 6 PB LH - 280.0 - - - -117 Heron Knox ME - PB LH Island Institute - - - - -118 Southern Island Knox ME 1 PB LH Private 22.0 - - - -119 Metinic Island Knox ME 10 PB OT Private 307.2 - - - -120 Eastern Egg Island Knox ME 6 PB PP - 2.0 - - - -121 Matinicus Rock Knox ME 22 PB PP, LH US Fish and Wildlife 32.0 - - 5,500 DG122 Graffam Island Knox ME 6 PB RE - 110 - - - -123 Hopper Island Knox ME 1 PB RE - 280.0 - - - -124 McGee Island Knox ME 4 PB RE - 89.6 - - - -125 Friendship Island Knox ME 0.5 PB RE - 750.0 - - - -126 Morse Island Knox ME 3 PB RE - 90.0 - - - -127 Gay Island Knox ME 1 PB RE - 260.0 - - - -128 Holbrook Island Knox ME 1 PB SP Sanctuary State Park 100 - - - -129 Seal Island N.W.R. Knox ME 22 PB WR US Fish and Wildlife 100.0 - - - -130 Hog Island Knox ME 1 PB WR - 288.0 - - - -131 Franklin Island Knox ME 6 PB WR,LH US Fish and Wildlife 20.0 - - - -132 Squirrel Island Lincoln ME 2.5 PB IC 230.4 3 - - -133 Monhegan Island Lincoln ME 10 FR IC, LH - 627.2 65 700 296,173 DG134 Whitehead Island Lincoln ME 3 PB LH Pine Island Camp 90.0 - - - -
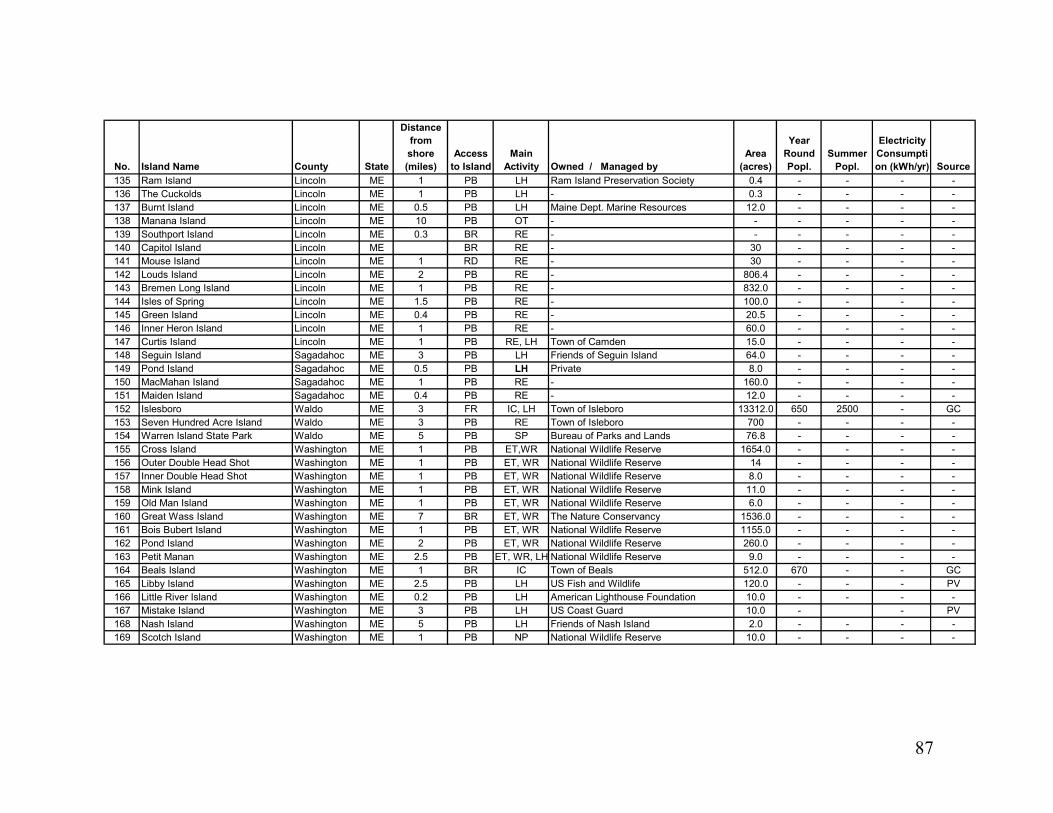
87
No. Island Name County State
Distance from shore (miles)
Access to Island
Main Activity Owned / Managed by
Area (acres)
Year Round Popl.
Summer Popl.
Electricity Consumption (kWh/yr) Source
135 Ram Island Lincoln ME 1 PB LH Ram Island Preservation Society 0.4 - - - -136 The Cuckolds Lincoln ME 1 PB LH - 0.3 - - - -137 Burnt Island Lincoln ME 0.5 PB LH Maine Dept. Marine Resources 12.0 - - - -138 Manana Island Lincoln ME 10 PB OT - - - - - -139 Southport Island Lincoln ME 0.3 BR RE - - - - - -140 Capitol Island Lincoln ME BR RE - 30 - - - -141 Mouse Island Lincoln ME 1 RD RE - 30 - - - -142 Louds Island Lincoln ME 2 PB RE - 806.4 - - - -143 Bremen Long Island Lincoln ME 1 PB RE - 832.0 - - - -144 Isles of Spring Lincoln ME 1.5 PB RE - 100.0 - - - -145 Green Island Lincoln ME 0.4 PB RE - 20.5 - - - -146 Inner Heron Island Lincoln ME 1 PB RE - 60.0 - - - -147 Curtis Island Lincoln ME 1 PB RE, LH Town of Camden 15.0 - - - -148 Seguin Island Sagadahoc ME 3 PB LH Friends of Seguin Island 64.0 - - - -149 Pond Island Sagadahoc ME 0.5 PB LH Private 8.0 - - - -150 MacMahan Island Sagadahoc ME 1 PB RE - 160.0 - - - -151 Maiden Island Sagadahoc ME 0.4 PB RE - 12.0 - - - -152 Islesboro Waldo ME 3 FR IC, LH Town of Isleboro 13312.0 650 2500 - GC153 Seven Hundred Acre Island Waldo ME 3 PB RE Town of Isleboro 700 - - - -154 Warren Island State Park Waldo ME 5 PB SP Bureau of Parks and Lands 76.8 - - - -155 Cross Island Washington ME 1 PB ET,WR National Wildlife Reserve 1654.0 - - - -156 Outer Double Head Shot Washington ME 1 PB ET, WR National Wildlife Reserve 14 - - - -157 Inner Double Head Shot Washington ME 1 PB ET, WR National Wildlife Reserve 8.0 - - - -158 Mink Island Washington ME 1 PB ET, WR National Wildlife Reserve 11.0 - - - -159 Old Man Island Washington ME 1 PB ET, WR National Wildlife Reserve 6.0 - - - -160 Great Wass Island Washington ME 7 BR ET, WR The Nature Conservancy 1536.0 - - - -161 Bois Bubert Island Washington ME 1 PB ET, WR National Wildlife Reserve 1155.0 - - - -162 Pond Island Washington ME 2 PB ET, WR National Wildlife Reserve 260.0 - - - -163 Petit Manan Washington ME 2.5 PB ET, WR, LH National Wildlife Reserve 9.0 - - - -164 Beals Island Washington ME 1 BR IC Town of Beals 512.0 670 - - GC165 Libby Island Washington ME 2.5 PB LH US Fish and Wildlife 120.0 - - - PV166 Little River Island Washington ME 0.2 PB LH American Lighthouse Foundation 10.0 - - - -167 Mistake Island Washington ME 3 PB LH US Coast Guard 10.0 - - PV168 Nash Island Washington ME 5 PB LH Friends of Nash Island 2.0 - - - -169 Scotch Island Washington ME 1 PB NP National Wildlife Reserve 10.0 - - - -
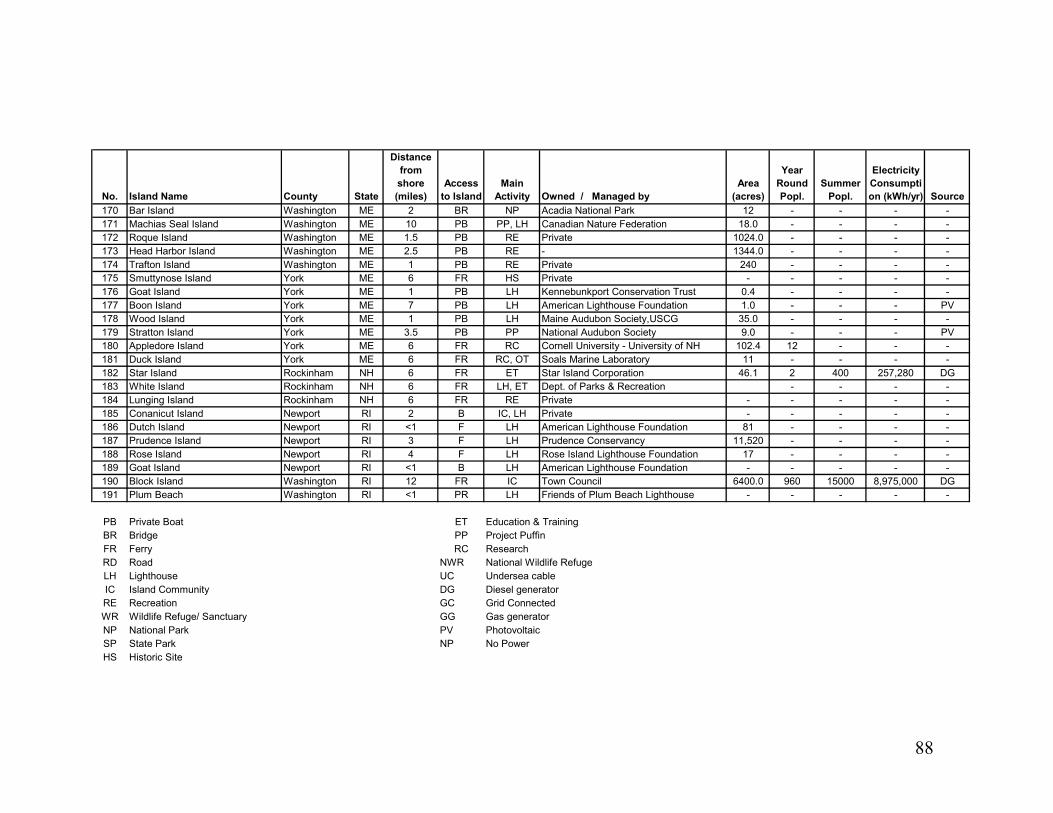
88
No. Island Name County State
Distance from shore (miles)
Access to Island
Main Activity Owned / Managed by
Area (acres)
Year Round Popl.
Summer Popl.
Electricity Consumption (kWh/yr) Source
170 Bar Island Washington ME 2 BR NP Acadia National Park 12 - - - -171 Machias Seal Island Washington ME 10 PB PP, LH Canadian Nature Federation 18.0 - - - -172 Roque Island Washington ME 1.5 PB RE Private 1024.0 - - - -173 Head Harbor Island Washington ME 2.5 PB RE - 1344.0 - - - -174 Trafton Island Washington ME 1 PB RE Private 240 - - - -175 Smuttynose Island York ME 6 FR HS Private - - - - -176 Goat Island York ME 1 PB LH Kennebunkport Conservation Trust 0.4 - - - -177 Boon Island York ME 7 PB LH American Lighthouse Foundation 1.0 - - - PV178 Wood Island York ME 1 PB LH Maine Audubon Society,USCG 35.0 - - - -179 Stratton Island York ME 3.5 PB PP National Audubon Society 9.0 - - - PV180 Appledore Island York ME 6 FR RC Cornell University - University of NH 102.4 12 - - -181 Duck Island York ME 6 FR RC, OT Soals Marine Laboratory 11 - - - -182 Star Island Rockinham NH 6 FR ET Star Island Corporation 46.1 2 400 257,280 DG183 White Island Rockinham NH 6 FR LH, ET Dept. of Parks & Recreation - - - -184 Lunging Island Rockinham NH 6 FR RE Private - - - - -185 Conanicut Island Newport RI 2 B IC, LH Private - - - - -186 Dutch Island Newport RI <1 F LH American Lighthouse Foundation 81 - - - -187 Prudence Island Newport RI 3 F LH Prudence Conservancy 11,520 - - - -188 Rose Island Newport RI 4 F LH Rose Island Lighthouse Foundation 17 - - - -189 Goat Island Newport RI <1 B LH American Lighthouse Foundation - - - - -190 Block Island Washington RI 12 FR IC Town Council 6400.0 960 15000 8,975,000 DG191 Plum Beach Washington RI <1 PR LH Friends of Plum Beach Lighthouse - - - - -
PB Private Boat ET Education & TrainingBR Bridge PP Project PuffinFR Ferry RC ResearchRD Road NWR National Wildlife RefugeLH Lighthouse UC Undersea cableIC Island Community DG Diesel generatorRE Recreation GC Grid ConnectedWR Wildlife Refuge/ Sanctuary GG Gas generatorNP National Park PV PhotovoltaicSP State Park NP No PowerHS Historic Site
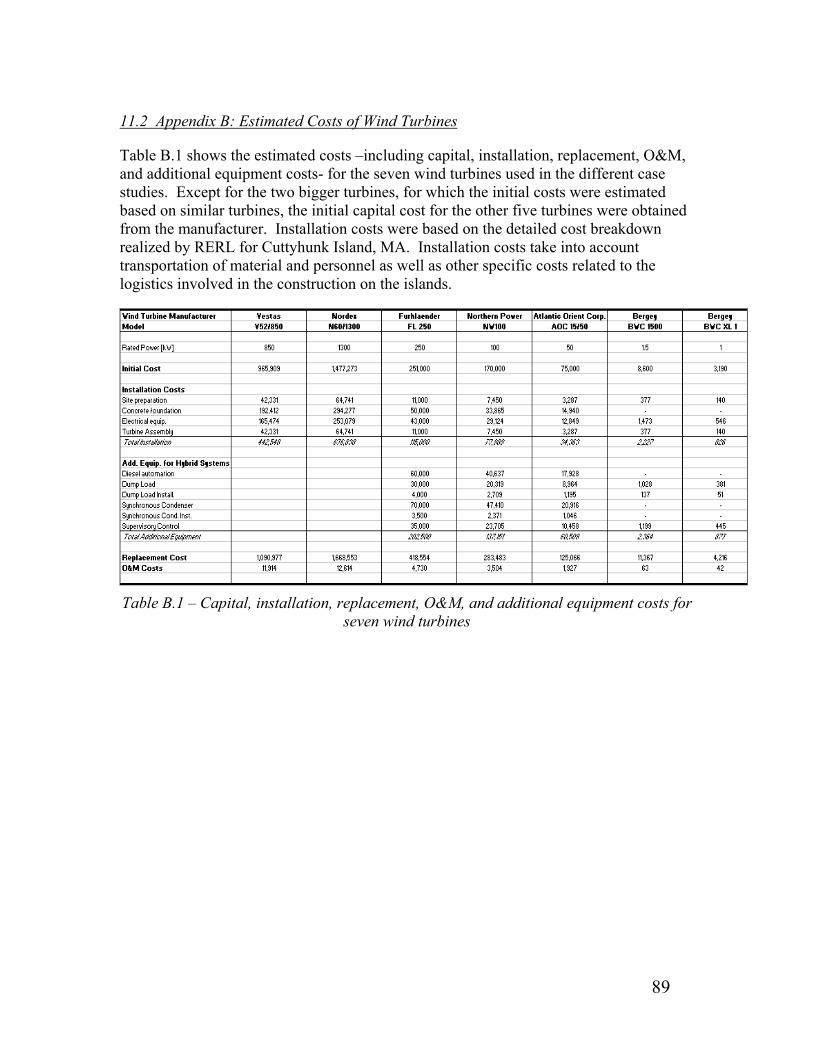
89
11.2 Appendix B: Estimated Costs of Wind Turbines
Table B.1 shows the estimated costs –including capital, installation, replacement, O&M, and additional equipment costs- for the seven wind turbines used in the different case studies. Except for the two bigger turbines, for which the initial costs were estimated based on similar turbines, the initial capital cost for the other five turbines were obtained from the manufacturer. Installation costs were based on the detailed cost breakdown realized by RERL for Cuttyhunk Island, MA. Installation costs take into account transportation of material and personnel as well as other specific costs related to the logistics involved in the construction on the islands.
Table B.1 – Capital, installation, replacement, O&M, and additional equipment costs for
seven wind turbines
90
11.3 Appendix C: Explanation of Terms used in HOMER
Total Capital: The total capital cost is the sum of the initial capital costs of each component of the hybrid system, including that due to fixed system costs.
Total NPC: Total net present cost
COE: The levelized cost of energy is the average cost of producing electricity.
Ren. Frac.: The renewable fraction is the portion of the total annual energy production that is produced by renewable sources (solar and wind).
Unsrv. Frac.: The unserved energy fraction is the proportion of the total annual electrical load that went unserved because of insufficient generation.
Excess Frac.: The excess energy fraction is the ratio of total excess energy to the total annual energy production.
Gen. Hours: Yearly generator operating hours.
WT: Wind turbine
PV: Photovoltaic
Batt.: Storage battery
Inv.: Inverted
Batt. Lf.: Battery life