potential of chrysomya megacephala (diptera:...
TRANSCRIPT
POTENTIAL OF CHRYSOMYA MEGACEPHALA
(DIPTERA: CALLIPHORIDAE) MAGGOT MEAL AS PROTEIN
SOURCE IN TILAPIA (OREOCHROMIS SP.) FEED
SING KONG WAH
DISSERTATION SUBMITTED IN FULFILLMENT OF
THE REQUIREMENT FOR THE DEGREE OF
MASTER OF SCIENCE
INSTITUTE OF BIOLOGICAL SCIENCES
FACULTY OF SCIENCE
UNIVERSITY OF MALAYA
KUALA LUMPUR
2012

ii
ABSTRACT
Currently, fishmeal is a common protein source in aquafeed for farmed fish.
However, the demand for fishmeal is increasing but supply is stagnating or even decreasing
and therefore is insufficient to meet demand. This has caused the increase of fishmeal price
in global markets and thereby, incurs higher production costs. Thus, there is an urgent need
to find a cheaper but suitable protein source to replace fishmeal in animal feed.
The objective of this study is to evaluate the potential of Chrysomya megacephala
(Fabricius, 1974) maggot meal as protein source in red tilapia (Oreochromis sp.) feed.
Protein content of blowfly (C. megacephala) maggot meal extract was determined
using three different colourimetric methods – Biuret method, dye-binding method and the
method of Lowry et al. (1951). Protein estimation was performed after dissolution of
maggot powder in 0.06 M sodium phosphate buffer, pH 7.0 both in the absence and
presence of 1% (w/v) sodium dodecyl sulphate (SDS). Alternatively, the use of color
reagent was made both before and after centrifugation of the dissolved mixture. Since dye-
binding method could not be performed in the presence of SDS which its interferes with the
process, both Biuret method and the method of Lowry et al. (1951) were employed using
standard curves in presence of 1% (w/v) SDS. Two other methods, namely, Warburg-
Christian method and semi-micro Kjeldhal method were also used to determine protein
concentration. The inclusion of SDS and addition of color reagents before centrifugation of
the dissolved sample showed a significant increase in the percentage of protein content
compared to the results obtained under normal condition. A comparison of all these results
supported the use of Biuret method and the method of Lowry et al. (1951) under specific

iii
conditions as the substitute for semi-micro Kjeldhal method for protein estimation.
SDS-polyacrylamide gel electrophoresis of maggot meal extract showed the presence of
both small and medium sized proteins ranging in molecular weight from 17 ― 83 kDa.
Maggot meal powder derived from maggots hatched from eggs over a period of 4 days
were also found to be rich in essential amino acids as proven by amino acid analysis.
A feeding trial was performed for 60 days to evaluate the potential of this blowfly
maggot meal to replace fish meal in red tilapia (Oreochromis sp.) feed. Five isonitrogenous
and isoenergy fish meal diets formulated to contain 30% of protein and 20 kJ g-1
of gross
energy were replaced by maggot meal at 0%, 25%, 50%, 75% and 100%. Fishes that were
fed with 100% showed the highest survival rate (80%), percentage weight gain (239%),
specific growth rate (2.02% per day) and protein efficiency ratio (0.3), and the lowest of
food conversion ratio (1.34) as compared with other experimental diets.
A selection experiment was conducted to improve the body weight of
C. megacephala. After 10 generations of artificial selection, the body weight of
C. megacephala maggot increased.
Taken together, all these results suggested the suitability of maggot
(C. megacephala) meal as a protein source in red tilapia feed.
iv
ABSTRAK
Pada masa ini, serbuk ikan adalah sumber protein umum dalam makanan aquatik
untuk ikan ternak. Walau bagaimanapun, permintaan serbuk ikan semakin meningkat tetapi
bekalan tidak lagi berkembang malahan menurun justerus tidak dapat memenuhi
permintaan. Ini telah menyebabkan kenaikan harga serbuk ikan di pasaran global dan
dengan itu, penternak ikan perlu menanggung kos yang lebih tinggi. Oleh itu, terdapat
keperluan segera untuk mencari sumber protein yang lebih murah tetapi sesuai untuk
menggantikan bahan berkaitan ikan dalam makanan haiwan.
Objektif kajian ini adalah untuk menilai potensi ulat Chrysornya megacephala
(Fabricius, 1974) sebagai sumber protein dalam makanan tilapia merah (Oreochromis sp.).
Kandungan protein ekstrak ulat langau (Chrysomya megacephala) telah diukur
dengan menggunakan tiga kaedah kolorimetrik yang berbeza – kaedah Biuret, kaedah
pengikat-pewarna dan kaedah Lowry et al. (1951). Anggaran protein telah dilakukan
selepas serbuk ulat dilarutkan ke dalam 0.06 M penimbal natrium fosfat, pH 7.0 dalam
ketiadaan dan kehadiran 1% (w/v) natrium dodesil sulfat (SDS). Sebagai alternatif,
penambahanan reagen berwarna telah dibuat sebelum dan selepas pengemparan campuran
terlarut. Oleh sebab kaedah pengikat-pewarna tidak boleh dilakukan dengan kehadiran SDS
kerana mengganggu proses, maka kedua-dua kaedah Biuret dan kaedah Lowry et al. (1951)
dijalankan menggunakan lengkuk piawai dengan kehadiran 1% (w / v) SDS. Dua kaedah
yang lain, iaitu, kaedah Warburg-Christian dan kaedah separa-mikro Kjeldhal juga
digunakan untuk menentukan kandungan protein yang ada pada ekstrak ulat. Penambahan
SDS dan reagen pewarna ke dalam campuran sampel sebelum pengemparan menunjukkan
peningkatan yang ketara dalam peratusan kandungan protein berbanding dengan keputusan

v
yang diperolehi di bawah keadaan normal. Perbandingan semua keputusan yang diperolehi
mencadangkan penggunaan kaedah Biuret dan kaedah Lowry et al. (1951) di bawah syarat-
syarat tertentu sebagai penggantian kaedah separa-mikro Kjeldhal dalam penganggaran
kandungan protein. Gel elektroforesis SDS-poliakrailamide ekstrak ulat menunjukkan
kehadiran berat molekul protein yang bersaiz kecil dan sederhana iaitu 17 - 83 kDa. Serbuk
ulat yang didapati daripada ulat yang menetas dari telur sepanjang tempoh 4 hari didapati
kaya dengan asid amino perlu setelah disahkan melalui penganalisisian asid amino.
Satu ujian pemberian makanan telah dilakukan selama 60 hari untuk menilai potensi
serbuk ulat blowfly menggantikan serbuk ikan di dalam makanan tilapia merah
(Oreochromis sp.) Lima isonitrogenous dan isoenergy makan ikan yang digubal
mengandungi 30% protein dan 20 kJ g-1
tenaga kasar dengan serbuk ikan telah digantikan
oleh serbok ulat pada 0%, 25%, 50%, 75% dan 100%. Ikan-ikan yang diberi makanan
100% menunjukkan kadar kebolehan hidup yang tertinggi (80%), peratusan kenaikan berat
badan (239%), kadar pertumbuhan spesifik (2.02% sehari), nisbah kecekapan protein (0.3)
dan nisbah penukaran makanan yang paling rendah (1.34) apabila berbanding dengan
makanan yang lain.
Satu eksperimen pemilihan telah dijalankan untuk meningkatkan berat badan
C. megacephala. Berat badan C. megacephala telah meningkat selepas 10 generasi
pemilihan dilakukan.
Dengan keputusan yang diperolehi ia mencadangkan kesesuaian (C. megacephala)
ulat sebagai sumber protein dalam makanan ikan tilapia merah.

vi
ACKNOWLEDGEMENTS
I would like to express my deepest appreciation and gratitude to my supervisor
Professor Dato‟ Dr. Mohd. Sofian bin Azirun and my co-supervisor Professor Saad Tayyab
for their constant guidance, invaluable advice, suggestions, constructive criticism and
patience extended to me throughout the course of this study.
Special thanks to Associate Professor Mohd. Salleh bin Kamarudin (Head of
Department of Aquaculture, Universiti Putra Malaysia) for assistance, help and use of
facilities in the preparation of fish pellets for this study.
I am also indebted to Professor Emeritus Yong Hoi Sen for in valuable discussions
and advice on the artificial selection experiment and Dr. Khang Tsung Fei for guidance and
advice on the statistical analysis.
I wish to convey my heartfelt appreciation to Mrs. Adyani Azizah bt. Abd. Halim
and Ms. Nabilah bt. Abdul Aleem Sidek for assistance and guidance on protein analysis
experiment.
Grateful thanks are also offered to Madam Patricia Loh for her encouragement and
proof-reading of this manuscript.
I owe my deepest gratitude to my friends: Ms. Evan Chin Hui See, Ms. Wong Min
May, Ms. Yong Yze Shiuan, Mr. Cheah Yih Horng, Mr. Aaron Teo Wee Fei, Mr. Wong Jin
Yung, Mr. Daicus Anak Belabut, Ms. Liew Lee Yun, Mr. Cheah Siew Chung for their
constant encouragement and support.

vii
Financial grant of IPPP, PS284/2010A by Universiti Malaya for this research is
gratefully acknowledged.
Last but not the least, I wish to thank and dedicate this thesis to my beloved family
for their support.

viii
TABLE OF CONTENTS
Page
ABSTRACT ii
ABSTRAK iv
ACKNOWLEDGEMENTS vi
TABLE OF CONTENTS viii
LIST OF FIGURES xii
LIST OF TABLES xiii
LIST OF SYMBOLS AND ABBREVIATIONS xiv
CHAPTER 1: GENERAL INTRODUCTION 1
CHAPTER 2: LITERATURE REVIEW 4
2.1 Aquaculture 4
2.2 Tilapia 4
2.3 Fishmeal 6
2.4 Alternative protein sources 7
2.4.1 Algae 7
2.4.2 Yeast 7
2.4.3 Bacteria 7
2.4.4 Fungi 8
2.4.5 Plant protein 8
2.4.6 Animal protein 8
2.5 Amino acid 9
2.6 Protein Estimation 12
2.6.1 Spectrophotometric Method
(Warburg & Christian, 1942) 12
2.6.2 Biuret Method (Gornall et al, 1949) 13
2.6.3 Dye-Binding Method (Bradford, 1976) 13
2.6.4 Method of Lowry et al. (1951) 14
2.6.5 Semi-micro Kjeldahl Method (Helrich, 1990) 14

ix
2.7 Chrysomya megacephala 15
2.7.1 Importance of Chrysomya megacephala 16
CHAPTER 3: PROTEIN ANALYSIS OF
CHRYSOMYA MEGACEPHALA
MAGGOT MEAL 17
3.1 Introduction 17
3.2 Materials and methods 19
3.2.1 Materials 19
3.2.1.1 Proteins 19
3.2.1.2 Reagents used in protein estimation 19
3.2.1.3 Reagents used in sodium dodecyl
Sulphate polyacrylamide gel
electrophoresis (SDS-PAGE) 19
3.2.1.4 Other reagents 20
3.2.1.5 Miscellaneous 20
3.2.2 Methods 20
3.2.2.1 pH measurements 20
3.2.2.2 Absorption measurements 21
3.2.2.3 Fluorescence spectroscopy 21
3.2.2.4 Sample collection 21
3.2.2.5 Preparation of maggot (C. megacephala)
meal extract 22
3.2.2.6 Determination of protein concentration 22
3.2.2.6.1 Spectrophotometric method
(Warburg & Christian, 1942) 24
3.2.2.6.2 Biuret method
(Gornall et al., 1949) 24
3.2.2.6.3 Dye-binding method
(Bradford, 1976) 25
3.2.2.6.4 Method of Lowry et al. (1951) 26
3.2.2.6.5 Semi-micro Kjeldahl method
(Helrich, 1990) 27
x
3.2.2.7 Sodium dodecyl sulphate polyacrylamide
gel electrophoresis (SDS-PAGE) 27
3.2.3 Determination of amino acid composition 30
3.2.4 Analysis of tryptophan 31
3.3 Results and discussion 32
CHAPTER 4: EVALUATION OF BLOWFLY (CHRYSOMYA
MEGACEPHALA) MAGGOT MEAL AS AN
EFFECTIVE AND SUSTAINABLE REPLACEMENT
FOR FISHMEAL IN THE DIET OF FARMED
JUVENILE RED TILAPIA (OREOCHROMIS SP.) 48
4.1 Introduction 48
4.2 Materials and methods 50
4.2.1 Maggot meal preparation 50
4.2.2 Determination of protein concentration of
maggot meal 50
4.2.3 Determination of amino acid composition of
maggot meal 51
4.2.4 Experimental diets 51
4.2.5. Feeding trial 52
4.2.6. Chemical analysis 52
4.2.7 Statistical analysis 53
4.3 Results and discussion 54
CHAPTER 5: PRELIMINARY STUDY ON MAGGOT STRAIN
IMPROVEMENT USING ARTIFICIAL
SELECTION 65
5.1 Introduction 65
5.2 Materials and methods 67
5.2.1 Sampling and colonization of flies 67
5.2.2 Artificial selection based on body weight 67
5.2.3 Determination of protein content 68
5.2.4 Flies breeding 68

xi
5.3 Results and discussion 69
CHAPTER 6: GENERAL DISCUSSION 73
CHAPTER 7: SUMMARY 77
REFERENCES
LIST OF PUBLICATIONS AND PRESENTATIONS

xii
LIST OF FIGURES
Figure Page
3.1 Standard curves for the determination of protein concentration by
Biuret method (1949) using BSA as the standard. These curves
were obtained in 0.06 M sodium phosphate buffer, pH 7.0 in the
absence and presence of 1% SDS. 35
3.2 Standard curve for the determination of protein concentration by
dye- binding method of Bradford (1976) using BSA as the
standard. The curve was obtained in 0.06 M sodium phosphate
buffer, pH 7.0. 36
3.3 Standard curves for the determination of protein concentration by
the method of Lowry et al. (1951) using BSA as the standard.
These curves were obtained in 0.06 M sodium phosphate buffer,
pH 7.0 in the absence and presence of 1% SDS. 37
3.4 SDS-PAGE pattern of maker proteins (M) and maggot
(C. megacephala) meal extract (MG) on 10% polyacrylamide gel
following the method of Laemmli (1970). 43
3.5 Plot of log molecular weight versus relative mobility (Rm) of
different marker proteins. 44
3.6 Fluorescence spectrum of maggot (C. megacephala) protein
Sample obtained in 0.06 M sodium phosphate buffer, pH 7.0 at
25°C upon excitation at 280 nm. 47
4.1 The body weight of red tilapia Oreochromis sp. at the
beginning and end of the experimental period (60 days). 62
4.2 95% confidence interval of mean percentage weight gain (%)
according to feed types. 63
4.3 Body sizes of red tilapia Oreochromis sp. after feeding with the
experimental diets for 60 days. 64

xiii
LIST OF TABLES
Table Page
2.1 The 10 essential amino acids and its optimum dietary level (%)
for juvenile Nile tilapia. 11
3.1 Regression analysis of various analytical methods used for
protein estimation in maggot (C. megacephala) meal extract. 38
3.2 Comparative analysis of protein estimation in maggot
(C. megacephala) meal extract as determined by different
methods under different experimental conditions. 39
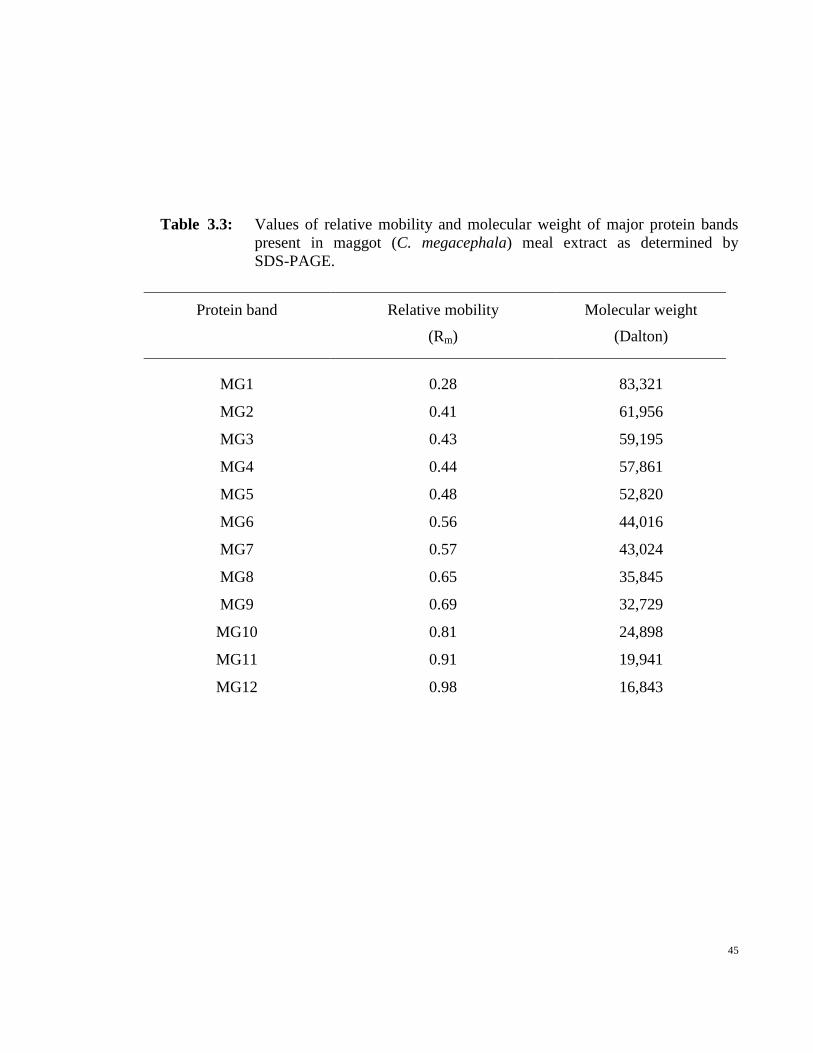
3.3 Values of relative mobility and molecular weight of major protein
bands present in maggot (C. megacephala) meal extract as
determined by SDS-PAGE. 45
3.4 Amino acid composition of (C. megacephala) maggot powder. 46
4.1 Analyzed crude protein (%) and amino acid composition (%)
of blowfly maggot (different day after it hatched from egg). 57
4.2 Feed composition and proximate analysis of the experimental diets. 58
4.3 Initial body weight (g), final body weight (g), special growth
rate (SGR), food conversion ratio (FCR) and protein efficiency
ratio (PER) of red tilapia Oreochromis sp. after feeding with the
experimental diets for 60 days. 61
5.1 Number of maggot (N), mean body weight (g) and standard
deviations (S.D), 95% confident interval (CI) and coefficient of
variance (C.V) in each generation for selected and non-selected
lines of C. megacephala maggot. 72
5.2 Mean protein content (mg/ml) and standard deviations (S.D),
95% confident interval (CI) in each generation for selected and
non-selected lines of C. megacephala maggot. 73

xiv
LIST OF SYMBOLS AND ABBREVIATIONS
Abs. Absorbance
CI Confident interval
cm Centimeter
conc. Concentration
Cu+
Cuprous
ºC Degree Celsius
Da Dalton
DNA Deoxyribonucleic acid
et al. Latin phrase et alia (and other)
FCR Food conversion ratio
g Gram
HCl Hydrochloric acid
HPLC High performance liquid chromatography
i.e. Latin phrase id est (that is)
J Joule
kg Kilogram
m Meter
M Molar
mg Milligram
ml Milliliter
N Normality
N.D. Not determined
nm Nanometer
PER protein efficiency ratio
PMI Post-mortem interval
Rm Relative mobility
RNA Ribonucleic acid
S.D. Standard deviation
S.E. Standard error
SDS- PAGE Sodium dodecyl sulfate- Polyacrylamide gel electrophoresis
SDS Sodium dodecyl sulfate
SGR Special growth rate
sp. Species
TEMED N,N,N‟,N‟-tetramethylethylenediamine
µg Microgram
µl Microlitre
UV Ultraviolet
v/v Volume per volume

xv
w/v Mass per volume
~ Approximate
% Percentage
± Plus-minus

1
CHAPTER 1
GENERAL INTRODUCION
The world‟s population grew more than 10 times from 600 million people in 1700
to 7 billion people in 2011 and is still growing rapidly. As such, an ever increasing
population has exerted enormous pressure on food producers to step up food production to
meet increasing demand and this has led to the overhauling of the world‟s agricultural
systems. Previously, farmers relied on their own traditional cultures and knowledge to
cultivate animals and plants. However, these traditional self-subsistence farming methods
can no longer cater to the huge increase in demand for food. Hence, large-scale
monoculture employing the latest technologies is now being practiced in modern farming to
maximize food production cost-effectively (Cohen, 2003).
Over the years, the aquaculture industry in Malaysia has shown a steady growth due
to active participation of local farmers. However, most of the raw ingredients for feedstuffs
are imported because they are not currently produced in Malaysia: soybean meal, fishmeal,
cereal grains, corn gluten meal, mineral sources and various micro-ingredients. Thus,
feedstuffs constitute a large part of the cost of production. Soybean meal in Malaysia is
usually obtained after the process of making soybean curd and soybean. Therefore, its
quality is not as good as the imported soybean meal (Loh, 2002).
One of the alternative protein sources used as feedstuff in Malaysia is palm kernel
meal, a by-product from the oil palm industry. Palm kernel meal is a moderate quality feed
for ruminants in terms of digestibility with 16% crude fiber. However, it contains low crude

2
protein (15 – 17%), lacks some amino acids and has very low lysine content (O'Mara et al.,
1999).
Currently, fishmeal is a common protein source in aquafeed for farmed fish.
However, the demand for fishmeal is increasing but supply is stagnating or even decreasing
and therefore is insufficient to meet demand. This has caused the increase of fishmeal price
in global markets and thereby, incurs higher production costs (Tidwell & Allan, 2001).
Thus, there is an urgent need to find a cheaper but suitable protein source to replace
fishmeal in animal feed.
A suitable alternative protein source for aquafeed should be sustainable and
nutritious. This protein source should be easily obtainable and in sufficient amounts to meet
demand. In the nutritional aspect, the essential amino acids derived from the alternative
protein source should meet the basic amino acid requirements of fish; the quality of protein
is determined by the composition and ratio of amino acids (Watanabe, 2002).
The ability of the fish to digest the alternative protein after feeding should be taken
into account as this will directly affect the absorption of proteins by the fish and
consequently the growth rate. In addition, the palatability of the protein source should be
the same as the fishmeal to avoid rejection by the fish.
The use of insects as a protein source in animal food is not a new idea and many
scientific papers have been published regarding this approach. In Japan and China, farmers
used silkworm (Bombyx mori) pupae to culture carp fish (Begum et al., 1994). Other
insects such as mealworm beetle (Tenebrio molitor) and house fly (Musca domestica)

3
larvae have also been studied as alternative protein source in fish diets (Fasakin et al., 2003;
Ng et al., 2001). Insect-based diets have been recognized as one of the cheaper alternatives
to fishmeal by researchers (Yen, 2009).
The Chrysomya megacephala (Fabricius) blowfly maggots can be found on
carcasses and are able to decompose the carcasses with their enzyme (Greenberg, 1991).
During the decomposition process, maggots are converting the waste (carcasses) into a
good quality form of protein. As such, the maggots are of high protein content and thus
there is great potential to use the C. megacephala maggot as an alternative protein source in
animal feed.
Hence, the following objectives were set for this study:
i. To study the suitability of Chrysomya megacephala maggot meal as a protein
source in animal feed with a comparative study of different methods used in protein
determination.
ii. To evaluate the effect of partial substitution of fishmeal by Chrysomya
megacephala maggot meal on growth performance and feed utilization of red tilapia
(Oreochromis sp.).
iii. To produce a robust and high protein strain of Chrysomya megacephala maggots to
be used as animal feed by artificial selection.

4
CHAPTER 2
LITERATURE REVIEW
2.1 Aquaculture
Fish is an important source of protein for humans. As the human population
expands beyond 7 billion and the quantity of wild-caught fish declines, large scale fish
farming methods are being used to cope with the increased demand for fish.
Farmed fish and shellfish contribute to more than one quarter of the total fish
directly consumed by humans and fish production is expected to increase in the future.
Nowadays, cages, ponds and tanks are the common systems used in fish farming to increase
fish production and contribute directly to the global fish supply (FAO Fishery Information
Data and Statistics Unit, 1999).
There are many aspects to consider when expanding aquaculture because most of
the fish farms are built on the natural habitats of wild fish such as mangroves and coastal
ecosystems. As such, there should be proper management of resources and wastes,
pathogen transmission, biological pollution and ecology impact, so as to minimize negative
effects on the immediate environment. Therefore, sound aquaculture practices will be the
key in balancing farmed and wild-caught fish for human consumption in the future
(Naylor et al., 2000).
2.2 Tilapia
Tilapia is the common name for the three genera: Oreochromis, Sarotherodon, and
Tilapia. Among these three genera, Oreochromis is the most important group to

5
aquaculture. Examples are the Nile tilapia, O. niloticus, the Mozambique tilapia,
O. mossambicus, the blue tilapia, O. aureus, and the Wami tilapia O. urolepis hornorum. In
addition, they readily hybridize in captivity and many hybrid strains are now available to
growers (Fitzsimmons, 2000).
Tilapia is the second most common farm-raised food fish in the world and the
worldwide production has reached 3.7 million tons at 2011 (Watanabe et al., 2002). Tilapia
farming has expanded rapidly with the development of new strains and hybrids, monosex
male culture, a variety of semi-intensive and intensive culture system. Tilapia is well liked
by consumers as the flesh of fish is tasty. Thus, tilapia has become the second most
important food fish in the world (Fitzsimmons, 2000).
Tilapia can tolerate a wide range of environmental conditions such as low dissolved
oxygen, high ammonia level and a wide range of pH (5–11) (Watanabe et al., 1997).
However, cold weather and the streptococcus bacterial did contribute to a low production of
tilapia in the United States in 2010.
Demand of tilapia in the global market is growing especially in the United States.
Hence, there is an urgency to increase the production of tilapia in order to meet demand.
Moreover, the genetically improved strain of tilapia may have different nutritional
requirements as compared to existing strain (Maugle & Fagan, 1993; Watanabe, 2002).
Therefore, research on establishing the most nutritious and suitable feed for the tilapia is
being carried out so as to improve the growth of fish and increase profitability for fish
farmers as well.

6
2.3 Fishmeal
Fishmeal is a nutrient-rich protein source in feed ingredients for the domestic
animal‟s diet. However, as the demand for fishmeal exceeds supply, the market price of
fishmeal has increased sharply. Since fishmeal is an important raw ingredient in animal
feed, it accounts for a major portion of the production costs of aquaculture farms
(Tacon & Metian, 2008).
The world‟s largest fishmeal consumer is the poultry and swine farm industry
followed by the aquaculture industry. However, the protein content in aquafeed is much
higher than in the livestock feed. An estimated one-third of total 30 metric tons fish caught
is used to produce fishmeal for aquafeeds (Alverson et al., 1994; Tacon, 1998) with the
remainder converted to fishmeal for poultry and other animal feed.
A global survey reported a significant increase in fishmeal use associated with the
marked increase in shrimp and fish production (Tacon & Metian, 2008). The expanding
aquaculture industry has increased the demand for fishmeal and this has placed the pelagic
fishes which are a source of fishmeal, in endangered status. The rapid growth of the
aquaculture industry has changed the current fish capture pattern from large piscivorous
fishes toward smaller invertebrates and planktivorous fishes but does not alleviate pressure
on wild fisheries stocks (Pauly et al., 1998). This would clearly threaten marine ecosystems
as well as constrain the long-term growth of the aquaculture industry itself.

7
2.4 Alternative protein sources
In recent years, researchers have been studying the potential of algae, fungi, bacteria,
feed peas, insects and earthworms as a replacement protein source in animal feed. However,
thus far, no promising results have been obtained due to several limitations as listed below.
2.4.1 Algae
The algae protein is a byproduct from the treatment of sewage effluents for water
clarification (Calvert, 1979). Feeding trials using algae for chicks showed that the Chlorella
group could provide water-soluble vitamins and carotene but contains low levels of
methionine (Combs, 1952). Another limitation of algae is that the cell walls are difficult to
digest by animals (Hintz et al., 1966).
2.4.2 Yeast
In 1975, Yoshida, a Japanese researcher, reported yeasts grown on n-paraffins are a
good protein source for poultry. In addition, yeasts produced on alkanes by a British
company presented no safety hazards to livestock and human (Shacklady & Gatumel, 1972).
Generally, yeasts are considered as a satisfactory protein source but are rather deficient in
sulfuric amino acid content (cysteine and methionine).
2.4.3 Bacteria
Production of bacterial protein on methanol for feed production is feasible. On the
other hand, producing bacterial protein via fermentation of animal wastes and petroleum-

8
derived hydrocarbons is limited. A study of the effects of bacterial protein on the health of
rats showed adverse effects on the rats in the laboratory (Agren et al., 1974).
2.4.4 Fungi
Litchfield (1968) summarized that the protein content of 20 species of fungal
mycelium ranged from 12.0% to 53.5%, indicating that many species from this fungal
group can compete with fishmeal that is used in animal feed in term of protein content.
However, fungal protein is low in sulfuric amino acid content and contains fungitoxins.
2.4.5 Plant protein
Different groups of scientists have been studying the potential practicability of plant
protein to replace fishmeal in aquafeed. Most of the results showed that plant protein can
only partially replace fishmeal because the inclusion of plant protein in substantial amounts
has adverse effects on fish growth. A common problem of plant protein is their relatively
low sulfuric amino acid content which are essential amino acids for fish (Carter & Hauler,
2000; Eusebio & Coloso, 2000).
2.4.6 Animal protein
Earthworms and insects are the two common animal protein sources used in
substitution of fishmeal experiments because they can be mass produced. The nutritional
value of both earthworms and insects are well studied by scientists and these animals
contain high protein content. The quality of these proteins appeared to be good with 10
essential amino acids present (Sing et al., 2012). Thus, they are a potential sustainable
protein source in animal nutrition. Earlier studies showed that high replacement of fishmeal

9
by these animal proteins shared the same limitation as plant protein where slow growth of
fish was observed without adverse effect such as high mortality rate. This limitation may be
due to deficiencies in essential nutrients or the presence of high concentrations of saturated
fat in animal proteins.
2.5 Amino acid
Amino acids are building blocks for protein and play an important role in regulating
metabolism in animals. Some of the processes which require amino acids include protein
synthesis, stress response, reproduction, growth and development, behavior, pigmentation,
osmoregulation, immunity and survival, cell signaling and ammonia removal (Li et al.,
2009).
Nutritionally, the amino acids are classified into the essential amino acid group
(indispensable) and the nonessential amino acid group. Those amino acids that cannot be
synthesized by animals are from the essential amino acid group and can only be obtained
from food whereas the nonessential amino acids can be synthesized adequately by animals
in their own tissue.
The quality of protein depends on the composition and ratio of amino acids rather
than protein concentration. A good protein source should contain adequate levels of protein
and sufficient essential amino acids to fulfill the essential amino acid requirements of
animal. However, in order to produce cheap animal feed, poor quality protein sources, for
example palm kernel cake, are widely used in the manufacture of animal feed. As they
contain inadequate nutrients and essential amino acids, excessive amounts of such protein

10
sources are used in order to meet the essential amino acid requirements. This may actually
result in an oversupply of protein and subsequently lead to nitrogen pollution of the
environment.
Formerly, there was a lack of supportive growth data on the quantitative amino acid
requirements of tilapia. The exact amino acid requirements for several species of tilapia
were unclear and this has prompted researchers to work on this area as the results obtained
would help to formulate the optimum tilapia diet. In 1988, Santiago and Lovell determined
the quantitative requirements of the 10 essential amino acids for the growth of young Nile
tilapia (Oreochromis niloticus) and this is summarized in Table 2.1.

11
Table 2.1: The 10 essential amino acids and their optimum dietary levels (%) for
juvenile Nile tilapia.
Essential amino acids
Optimum dietary level (%)
Histidine
0.48
Threonine
1.05
Valine
0.78
Methionine
0.75
Isoleucine
0.87
Leucine
0.95
Phenylalanine
1.05
Lysine
1.43

12
2.6 Protein Estimation
Various methods have been employed to determine protein concentration in
biological samples. Sensitivity, presence of interference substance in the sample and
personal preference are some of the criteria used for selecting a particular method. In
general, Warburg-Christian (1942) method and coomassie blue dye-binding assay of
Bradford (1976) are the commonly used methods for protein quantification in different
samples (Walsh, 2004).
A single protein solution would probably yield different results if measured with
different methods. This is because different methods use different principles to determine
the protein content. Actually, there is no absolute method for protein estimation; every
method has its own advantages and disadvantages. The colourimetric methods are simple,
fast and easy to carry out in the laboratory but some of these methods suffer from the
interference by certain compounds (Kamizake et al., 2003).
2.6.1 Spectrophotometric Method (Warburg & Christian, 1942)
Proteins absorb light in the UV range with an absorption maximum around 280 nm.
The aromatic amino acids, namely tyrosine and tryptophan mainly contribute to the
absorption peak at 280 nm. However, the presence of nonprotein chromophores in nuclei
acids (which absorb strongly at 260 nm) will produce higher readings at the absorbance
level around 280 nm (Walker, 2002). Nevertheless, this problem can be solved by
eliminating the contribution of nuclei acids using the formula below (Warburg & Christian,
1942):
Protein concentration = 1.55 Abs.280 nm – 0.76 Abs.260nm

13
This method is simple and results can be obtained in a short time. Moreover, it is
non-destructive to samples (Walsh, 2004). The disadvantage of this method is interference
from other chromophores; thus a small amount of nucleic acid can greatly influence the
results (Walker, 2002).
2.6.2 Biuret Method (Gornall et al., 1949)
The biuret method involves the use of alkaline copper sulfate solution which forms
copper tetradentate coordination complexes with protein peptide groups. These complexes
absorb maximally at 550 nm (Drochioiu et al., 2006; Walsh, 2004) which can be read on
spectrophotometer.
The reagent used in this method is easy to prepare and inexpensive. Furthermore,
this assay is less susceptible to many interference substances as compared to other methods.
Yet, the sensitivity of biuret method is low (Walsh, 2004).
2.6.3 Dye-Binding Method (Bradford, 1976)
Coomassie blue dye-binding method was devised by Bradford in 1976 and became
one of the most preferred methods for determining protein concentration in many
laboratories. The principle of this assay is based on the binding of coomassie blue dye to
protein. The dye does not bind to free amino acids (Bradford, 1976; Wei et al., 1997). Thus,
only protein is measured in this method (Kamizake et al., 2003).

14
Bradford‟s method is moderately sensitive, easy to carry out and produces results
quickly. On the other hand, this assay is more susceptible to interference by other chemicals
and detergents such as sodium dodecyl sulfate (SDS) (Walker, 2002; Walsh, 2004).
2.6.4 Method of Lowry et al. (1951)
The method of Lowry et al. (1951) is based on two reactions. The first reaction is
similar to the biuret assay in which the peptide bond of proteins reacts with copper under
alkaline condition to produce cuprous (Cu+). Cuprous ion reacts with Folin-Ciocalteu
reagent to form phosphomolybdotungstate which then will be reduced to
heteropolymolybdenum blue after binding to the proteins. The blue color is read at 750 nm
(Walker, 2002; Walsh, 2004).
Sensitivity of the method of Lowry et al. (1951) is moderately constant from protein
to protein; thus, it is an acceptable assay to determine protein content under various
conditions involving crude extracts or protein mixtures.
2.6.5 Semi-micro Kjeldahl Method (Helrich, 1990)
The semi-micro Kjeldahl method (Helrich, 1990) determines percentage of total
nitrogen in a sample. This method involves the conversion of organic nitrogen into
ammonium by boiling with sulphuric acid and distilling with an alkali in order to liberate
ammonia for titration (Nelson & Sommers, 1973). It is a standard reference method
internationally recognized especially in the food industry but the experiment requires a
lengthy time period (Kamizake et al., 2003).

15
2.7 Chrysomya megacephala
Chrysomya megacephala (Fabricius) belongs to the class Insecta and order Diptera
with a pair of wings. It is also known as “oriental latrine fly”. The body size of adult
C. megacephala is about the size of a house fly (Musca domestica) or slightly bigger with
greenish-blue metallic thorax and abdomen, and a pair of large conspicuous red eyes at the
head part. Eggs of C. megacephala are asymmetric because it is oval in shape with one flat
face and another convex (David et al., 2008) and the mature third instar is muscoid-shaped
with pointed anterior and blunt posterior ends (Sukontason et al., 2008). The pupa is
formed by the contraction and hardening of the larval skin with a true pupa inside.
Puparium is typically coarctate and cylindrical in shape (Siriwattanarungsee et al., 2005).
The adult fly emerges by breaking the front end of the puparium and working its way to the
surface by alternately expanding and contracting a blood-filled sack in the front of the head.
Adult flies are only active in daylight; in darkness or in artificial light, they only move
slowly or rest (Reid, 1953). Activities of adult flies are influenced by temperature,
humidity, wind, light and color.
Blowflies are widely distributed across vast regions of the world including the
Oriental regions, Australasia, Palearctic, South African and Afrotropical Islands (Smith,
1986; Zumpt, 1965). Among the blowflies, C. megacephala is the most common in Brazil
(Gabre et al., 2005) and Egypt (Gabre, 1994). The success of C. megacephala invasion and
colonization in most parts of the world is probably because of the low mortality rate during
its fertility period and also its survivorship strategy (Reigada & Godoy, 2005).

16
Chrysomya megacephala females need protein ingestion before laying eggs because
it is an anaotugenous blowfly species (Spradbery & Schweizer, 1979). An egg batch
contains an average of 224 eggs and is hatched within one day. The developmental time for
larva and pupa, on average, is 5 days under 26°C (Gabre et al., 2005). However, the
developmental rate of C. megacephala is temperature dependent where larvae develop
more rapidly at higher temperatures (Sukontason et al., 2008).
2.7.1 Importance of Chrysomya megacephala
Blowflies are forensically important because many parts of the world have used the
size and the developmental stages of blowflies on corpses to estimate the post-mortem
interval (PMI) of a person who has died (Lee et al., 2004).
Mango is one of the most cultivated fruits and commonly used in cuisine. The
worldwide mango production was estimated at nearly 35 metric tons in 2009 by the
Agriculture Organization of the United Nations. C. megacephala is a very common
pollinator for mango. In Australia (Anderson et al., 1982) and Taiwan, farmer rear the
C. megacephala in their mango farms to pollinate the mango flowers. A mass rearing of
C. megacephala employing convenient and efficient methods have been successfully
developed in the laboratory for the pollination of mango trees in Taiwan (Hu et al., 1995).

17
CHAPTER 3
PROTEIN ANALYSIS OF CHRYSOMYA MEGACEPHALA MAGGOT MEAL
3.1 Introduction
Fishmeal is the primary protein ingredient of choice in animal feeds. However, high
demand of this product in the market has escalated its cost and added further to the
production cost in livestock industry. Therefore, the current mission in agriculture sector is
to seek for the substitution of fishmeal in animal feed (Brinker & Reiter, 2011). Selection
of a good protein source to replace fishmeal in animal feed is based on the quality of
protein and the presence of essential amino acids. Therefore, a good protein source must be
solubilized and digested easily within the animal body. Furthermore, it should contain
sufficient amount of essential amino acids, which are required for the growth of animals
(Kerr & Kidd, 1999).
The potential of maggot proteins as a protein supplement for poultry and fish has
been reported by many researchers (Fasakin et al., 2003; Oyelese, 2007). However, a
significant variation in the protein content for the same maggot meal has been noticed in
the data published by various research groups (Adenji, 2007; Awoniyi et al., 2003; Ogunji
et al., 2008). Such variation can be attributed to the use of different methods for protein
estimation in maggot meal by different groups (Ogunji et al., 2008; Zuidhof et al., 2003).
Kjeldahl method (Helrich, 1990) is the most popular method among various methods
available for protein estimation in a sample (Kamizake et al., 2003). However, the
availability of Kjeldhal apparatus in various laboratories remains an obstacle and can be
easily correlated with the use of other colourimetric methods such as biuret method

18
(Gornall et al., 1949), dye-binding method (Bradford, 1976) and the method of Lowry et al.
(1951).
In view of the presence of other nitrogenous compounds (nucleic acids) in maggot
sample, results obtained with Kjeldahl method (Helrich, 1990) seem to be towards the
higher side as protein determination is based on nitrogen estimation in the sample. On the
other hand; release of membrane-bound proteins and their quantitation by different
colourimetric methods in the absence of any detergent remains questionable. Thus, both
overestimation and underestimation of protein content in Kjeldhal method (Helrich, 1990)
and colourimetric methods respectively calls for further research in the determination of
total protein content in complex subjects (maggot meal). Here, we present our data on a
comparative study of different methods used in protein determination and suitability of
maggot meal as a good protein source in animal feed.

19
3.2 Materials and methods
3.2.1 Materials
3.2.1.1 Proteins
Bovine serum albumin (Lot 015K0591) was purchased from Sigma-Aldrich Inc.,
USA. Prestained SDS-PAGE standards (catalog No. 161-0318) containing different
markers (ß-galactosidase, bovine serum albumin, ovalbumin, carbonic anhydrase, soyabean
trypsin inhibitor and lysozyme) were supplied by Bio-Rad Laboratories, USA.
3.2.1.2 Reagents used in protein estimation
Sodium potassium tartrate, copper sulphate, sodium carbonate, sodium hydroxide
and ethanol were purchased from SYSTERM®, Malaysia. Folin-Ciocalteu‟s phenol reagent
(Lot HC942709) and sulphuric acid were the products from Merck, Germany. Coomassie
brilliant blue G (Lot 117K0796) was procured from Sigma-Aldrich Inc., USA.
3.2.1.3 Reagents used in sodium dodecyl sulphate polyacrylamide gel
electrophoresis (SDS-PAGE)
Acrylamide (Lot 059K1523), N,N‟-methylenebisacrylamide (Lot 106K0158),
N,N,N‟,N‟-tetramethylethylenediamine (TEMED) (Lot 068K0714), 2-mercaptoethanol
(Lot 09524MH), coomassie brilliant blue R (Lot 99F5035) and bromophenol blue
(Lot 63H3607) were obtained from Sigma-Aldrich Inc., USA. Trizma base
[tris (hydroxymethyl aminomethane)] (Lot 1247B029) was the product of AMRESCO,
USA. Sodium dodecyl sulphate (SDS), ammonium persulphate, glycine, glycerol, acetic
acid and methanol were purchased from SYSTERM®, Malaysia.

20
3.2.1.4 Other reagents
Disodium hydrogen phosphate, sodium dihydrogen phosphate, buffer reference
standards (pH 4.0 and 7.0) and hydrochloric acid were purchased from SYSTERM®,
Malaysia.
3.2.1.5 Miscellaneous
Hydrophilic PVDF (0.45 µm) membranes and Millex HV syringe driven filter units
were purchased from Millipore Corporation, Ireland. Filter circles were supplied by
Whatman®
, Schleicher & Shhuell, England. Parafilm „M‟ was the product of Pechiney
Plastic Packaging, USA.
All glass distilled water was used throughout these studies and all experiments were
performed at room temperature (~ 25˚C) unless otherwise stated.
3.2.2 Methods
3.2.2.1 pH measurements
A Mettler Toledo pH meter, Delta 320 attached with a BNC‟s combined electrode,
type HA405-K2/120 consisting of glass and reference electrodes in a single entity was used
in pH measurements. The least count of the pH meter was ± 0.01 pH unit. It was calibrated
with the help of standard buffers (pH 4.0 in acidic range and pH 7.0 in neutral to alkaline
range) at room temperature before pH measurements.

21
3.2.2.2 Absorption measurements
Absorption measurements were carried out in both the ultraviolet (UV) and visible
regions on a Shimadzu double beam Spectrophotometer, UV-2450. Quartz and glass
cuvettes of 1 cm path length were used in the ultraviolet (UV) and visible range
respectively. Scattering corrections, if required, were made by extrapolation of absorbance
values in the wavelength range, 360–340 nm to the desired wavelength.
3.2.2.3 Fluorescence spectroscopy
Fluorescence measurements were made on a Hitachi Fluorescence
Spectrophotometer, model FL-2500. The excitation and emission slits were set at 10 nm
each. After exciting the protein sample at 280 nm, the fluorescence spectrum was recorded
in the wavelength range, 300–400 nm, using a quartz cuvette of 1 cm path length.
3.2.2.4 Sample collection
Adult C. megacephala were collected from a local wet market (Sungai Way,
Petaling Jaya, Selangor, Malaysia) and brought to the laboratory (Pesticide Toxicology
Laboratory, Institute of Biological Sciences, Faculty of Science, University of Malaya) for
colonization. They were reared in dried plastic containers (24 × 28 cm) supplied with
granulated sugar, water and small pieces of fresh beef liver (as a protein source as well as
egg collecting medium) placed in separate petri dishes. Beef liver pieces containing egg
deposits were transferred to an open plastic box (6 × 9 cm) supplied with fresh beef liver
pieces. This was placed in another plastic container (24 × 28 cm) covered with muslin cloth.

22
Roaming maggots (third instar larvae) were collected from the food medium into another
plastic container (10 × 15 × 6 cm) and killed by adding hot water. They were separated
using sieve, dried in an oven at 100˚C for 24 hours and grounded into powder form.
3.2.2.5 Preparation of maggot (C. megacephala) meal extract
Dried maggot powder (0.125 g) was dissolved in 25 ml of 0.06 M sodium
phosphate buffer, pH 7.0 taken in a 50 ml beaker. The mixture was stirred using a
magnetic stirrer, at 37˚C for 6 hours followed by centrifugation at 3645×g in order to get a
clear solution. Supernatant was collected and used as a maggot (C. megacephala) meal
extract in subsequent studies. Alternatively, 0.06 M sodium phosphate buffer, pH 7.0
containing 1% (w/v) SDS was used to dissolve dried maggot powder and treated in the
same way to prepare the extract.
3.2.2.6 Determination of protein concentration
Following treatments were made to prepare different samples of maggot
(C. megacephala) meal extract for the determination of protein concentration using various
colourimetric methods.
i. Treatment 1. Sample was prepared in the same way as described above by dissolving
dried maggot powder (0.125 g) in 25 ml of 0.06 M sodium phosphate
buffer, pH 7.0, followed by centrifugation at 3645×g. The
supernatant was collected for protein content estimation.

23
ii. Treatment 2. Dried maggot powder (0.125 g) was dissolved in 25 ml of 0.06 M
sodium phosphate buffer, pH 7.0 containing 1% (w/v) SDS, followed
by centrifugation at 3645×g and the supernatant was collected for
protein estimation.
iii. Treatment 3. Dried maggot powder (0.125 g) was dissolved in 25 ml of 0.06 M
sodium phosphate, pH 7.0 and reagents for different colour reactions
were added separately. It was followed by centrifugation at 3645×g
and the absorbance of the supernatant solution was read at respective
wavelengths.
iv. Treatment 4. Dried maggot powder (0.125 g) was dissolved in 25 ml of 0.06 M
sodium phosphate, pH 7.0 containing 1% (w/v) SDS and reagents for
different colour reactions were added separately. It was followed by
centrifugation at 3645×g and the absorbance of the supernatant
solution was read at respective wavelengths.
Total protein content in maggot meal extract was determined using 5 different
analytical procedures i.e. biuret method (Gornall et al., 1949), dye-binding method
(Bradford, 1976), method of Lowry et al. (1951), spectrophotometric method (Warburg &
Christian, 1942) and semi-micro Kjeldhal method (Helrich, 1990). Bovine serum albumin
(BSA) was used as the standard for different colourimetric methods and standard plots were
obtained both in the absence and presence of 1% (w/v) SDS.

24
In standard colourimetric assays, analytical reagents were added in sequence to a
constant volume of maggot meal extract (supernatant obtained from Treatments 1 and 2)
and the colour intensity was measured against a suitable blank (prepared in the same way
but without maggot sample) on spectrophotometer. Alternatively, reagents were added first
to the crude maggot meal extract (refer to Treatments 3 and 4) to develop colour followed
by centrifugation at 3645×g and colour intensity measurement in the modified assays.
Sodium phosphate buffer (0.06 M), pH 7.0 was used in these experiments.
Each experiment was performed at least three times and results were analyzed using
Games-Howell post-hoc test (1976).
3.2.2.6.1 Spectrophotometric method (Warburg & Christian, 1942)
Different volumes (0.6, 1.2 and 1.5 ml) of maggot meal extract were pipetted into
three different tubes and the final volume was made up to 3.0 ml with the same buffer. The
solution was vortexed, filtered through millipore filter and absorbance values were recorded
at 260 and 280 nm against buffer.
3.2.2.6.2 Biuret method (Gornall et al., 1949)
This method involves the use of biuret reagent which was prepared by dissolving
1.5 g cupric sulphate and 6.0 g sodium potassium tartrate in 500 ml water, taken in a
volumetric flask. It was followed by the addition of 300 ml of 10% (w/v) sodium hydroxide
solution with constant stirring. The reagent was stored at 8˚C for two weeks.

25
Suitable volumes of the buffer were added to different volumes (0.3, 0.6 and 0.9
ml) of the protein (maggot meal extract) solution, taken in three different tubes in order to
make the final volume to 1.0 ml. It was followed by the addition of 4.0 ml of biuret reagent
to each tube. The mixture was vortexed for 1 minute and the absorbance of the solution was
read at 540 nm against suitable blank after 30 minutes of incubation at room temperature.
For the preparation of standard plots, increasing volumes (0.1–0.8 ml) of the
stock protein (BSA) solution (4.0 mg/ml) were taken in a series of tubes and the final
volume in each tube was made to 1.0 ml with buffer. It was followed in the same way as
described above.
3.2.2.6.3 Dye-binding method (Bradford, 1976)
Bradford‟s reagent was prepared by dissolving 100 mg coomassie brilliant blue
G in 50 ml of 95% (v/v) ethanol followed by the addition of 100 ml of 85% (v/v)
phosphoric acid. The final volume of the reagent was made up to 1 litre with water. It was
filtered through Whatman No. 1 filter paper before storage in an amber coloured bottle at
room temperature. The reagent was stored for four weeks.
Different volumes (0.5, 0.6 and 0.7 ml) of maggot meal extract, taken in three
different tubes were diluted to 1.0 ml with buffer followed by the addition of 5.0 ml of
Bradford‟s reagent. The contents were shaken well and incubated for 30 minutes at room
temperature. The absorbance of the coloured solution was recorded at 595 nm against a
suitable blank, prepared in the same way but without protein.

26
For the preparation of the standard plot, increasing volumes (10–80 µl) of the
stock protein (BSA) solution (1.0 mg/ml) were taken in a series of tubes and the final
volume in each tube was made to 1.0 ml with buffer. Remaining procedure was the same as
described above.
3.2.2.6.4 Method of Lowry et al. (1951)
The method involves the use of Copper reagent as well as Folin-Ciocalteu‟s
phenol reagent. Copper reagent was prepared in water by mixing 4% (w/v) sodium
carbonate, 4% (w/v) sodium potassium tartrate and 2% (w/v) copper sulphate in the ratio
100: 1: 1 (v/v/v) in the sequence in order to avoid precipitation. The reagent was filtered
through Whatman filter paper, No. 1 before use. Working solution of Folin-Ciocalteu‟s
phenol reagent was prepared by diluting the stock solution supplied by the manufacturer
with water in a ratio 1: 3 (v/v) and stored in an amber coloured bottle.
To different volumes (0.2, 0.4 and 0.5 ml) of maggot meal extract taken in three
different tubes, suitable volumes of the buffer were added first to make the total volume to
1.0 ml. Then, 5.0 ml of Copper reagent was added to each tube and incubated for 10
minutes at room temperature after shaking well. It was followed by the addition of 1.0 ml
of working Folin-Ciocalteu‟s phenol reagent to each tube and the contents were mixed well.
After incubation of 30 minutes at room temperature, the absorbance of the coloured
solution was read at 700 nm against a suitable blank.
Standard plots were prepared using increasing volumes (0.1–0.8 ml) of BSA
standard solutions [4.0 mg/ml, prepared in buffer alone and 0.5 mg/ml, prepared in the

27
same buffer containing 1% (w/v) SDS] in a series of tubes and treating them in the same
way as described above with maggot meal extract.
3.2.2.6.5 Semi-micro Kjeldahl method (Helrich, 1990)
Maggot sample (0.1 g maggot powder) was digested with 15 ml of concentrated
sulphuric acid taken in the digester flask for 1 hour at 400 ˚C under fume hood using
BÜCHI Labortechnik digester, model K-435. The digested product was distilled with
sodium hydroxide for 5 minutes on an automatic rapid steam distillation machine
(C. Gerhardt, UK Ltd.), model Vapodest 20. Subsequently, the steam was purged into a
flask containing 10 ml of 2% (w/v) boric acid and 6 drops of bromocresol green as the
indicator and contents were mixed well. The distilled product was titrated with 0.05 N
sulphuric acid and the percentage (%) of nitrogen available in samples was calculated
following the method of Helrich (1990). Protein concentration (%) in the sample was
obtained by multiplying the nitrogen percentage value with the conversion factor, 6.25.
3.2.2.7 Sodium dodecyl sulphate polyacrylamide gel electrophoresis
(SDS-PAGE)
Protein profiles of maggot meal extract were obtained by running the SDS-PAGE
of maggot meal extract on 10% (w/v) polyacrylamide gel containing 0.1% SDS following
the method of Laemmli (1970). Following stock solutions were needed for the preparation
of both stacking and separating gels.
i. Solution A 29.2% (w/v) Acrylamide and 0.8% (w/v)
N,N‟-methylenebisacrylamide

28
ii. Solution B 1.5 M Tris-HCl buffer, pH 8.8
iii. Solution C 10% (w/v) Ammonium persulphate
iv. Solution D 0.5 M Tris-HCl buffer, pH 6.8, containing 0.4% (w/v) SDS
v. Sample buffer 62 mM Tris-HCl buffer, pH 6.8, containing 2.3% (w/v) SDS,
0.01% (w/v) bromophenol blue, 10% (v/v) glycerol and 5%
(v/v) 2-mercaptoethanol
vi. Electrophoresis 0.025 M Tris, 0.192 M glycine and 0.1% (w/v) SDS, pH 8.3
buffer
vii. Fixing solution 40% (v/v) Methanol and 10% (v/v) acetic acid in water
viii. Staining solution 0.2% (w/v) Coomassie brilliant blue R in the fixing solution
ix. Destaining solution 5% (v/v) Methanol and 7% (v/v) acetic acid in water
A small pore gel (separating gel) solution was prepared by mixing 3.0 ml of Solution
A, 3.0 ml of Solution B, 3.0 ml of water, 0.05 ml of Solution C and 5.0 µl of TEMED in a
conical flask. Separating gel was prepared by pouring the above solution into the space
between two glass plates assembled in the gel casting unit up to three-fourth of their height
followed by layering the surface of the separating gel solution with a few drops of water.
The gel was left at room temperature for 45 minutes to polymerize and the water layer was
removed with the help of filter paper strips after the polymerization of the separating gel.
Subsequently, large pore gel (stacking gel) solution (prepared by mixing 0.7 ml of Solution
A, 1.25 ml of Solution D, 3.05 ml of water, 0.1 ml of Solution C and 5.0 µl of TEMED)

29
was poured gently above the separating gel up to a height of 2.0 cm using a micropipette.
Immediately, a comb with 10 wells was inserted into it and the solution was allowed to
polymerize at room temperature for 1 hour. Then, the comb was removed from the stacking
gel and the newly formed wells were rinsed twice with electrophoresis buffer. The glass
plates with the polymerized gel were fitted into an electrophoresis apparatus with half-filled
electrophoresis buffer.
Prestained SDS-PAGE standard proteins along with their molecular weights given in
parentheses such as ß-galactosidase (116,254 Da), bovine serum albumin (84,796 Da),
ovalbumin (53,896 Da), carbonic anhydrase (37,418 Da), soyabean trypsin inhibitor
(29,051 Da) and lysozyme (19,809 Da) were used for molecular weight determination of
major poplypeptides of maggot meal extract. Protein sample was prepared by mixing 100
µl of maggot meal extract with 100 µl of the sample buffer and the mixture was heated for
3–5 minutes in boiling water bath. About 10 µl of the sample containing either standard
proteins or maggot meal extract were loaded in separate wells with the help of a
micropipette. The electrophoresis was performed for about 2 hours using a voltage of
10 volts/well. The power was switched off when the tracking dye reached the bottom of the
gel. The gel was removed from the glass plates by purging electrophoresis buffer in the
spaces between the gel and the glass plates with the help of a syringe. The gel was stained
with staining solution for 30 minutes and destained in destaining solution by repetitive
process until the background was clear. Distances travelled by the protein and dye bands
were measured with the help of a ruler after placing the gel on a glass plate. Relative
mobilities of different standard proteins as well as major polypeptides of maggot meal
30
extract were determined by dividing the distance travelled by the protein band with that of
the dye (bromophenol blue) band. A straight line plot between log molecular weight and
the relative mobility (Rm) of standard proteins was obtained by least squares analysis and
molecular weights of major protein bands in maggot meal extract were determined.
3.2.3 Determination of amino acid composition
Amino acid analysis of maggot powder was carried out by hydrolyzing 74 mg of
maggot sample with 15 ml of 6 N hydrochloric acid (HCl) at 100˚C for 24 hours in a sealed
tube. A fixed volume (10 ml) of α-butyl amino acid was added into the hydrolyzed sample
as the internal standard. Subsequently, the final volume of the mixture was made up to 50
ml with deionized water and filtered through 0.2 µm cellulose nitrate membrane. Then,
10 µl of the hydrolyzed sample was pipetted into a vial and mixed with 10 µl of the internal
standard solution. Immediately, the mixture was dried under vacuum for 30 minutes.
Meanwhile, a redrying solution was prepared by mixing methanol, water and triethylamine
in the ratio 2: 2: 1 (v/v/v). After mixing with 20 µl of redrying solution, the mixture was
re-dried under vacuum for 30 minutes.
The mixture was allowed to react with 20 µl of PITC reagent [phenylisothiocyanate,
water, triethylamine, methanol (1: 1: 1: 7) (v/v/v/v)] for 20 minutes followed by drying
under vacuum for 30 minutes in order to remove the excess PITC reagent. The derivatized
samples were then dissolved in sample buffer (0.1 M ammonium acetate buffer, pH 6.5)
which was used as a mobile phase for high performance liquid chromatography (HPLC)
and filtered through a Millipore membrane. A 20 µl sample was injected into a reversed-

31
phase column in HPLC system (model Md 2010 from JASCO Inc., Japan) and monitored
by UV absorption (PicoTag system, Waters).
3.2.4 Analysis of tryptophan
Proteins of maggot (C. megacephala) meal extract, prepared in 0.06 M sodium
phosphate buffer, pH 7.0 containing 1% (w/v) SDS were precipitated with 95% (v/v)
ethanol in the ratio 1: 9 (v/v) and the mixture was left overnight at 8˚C. It was centrifuged
at 14 000×g for 30 minutes and the precipitate was collected and incubated for 12 hours at
30˚C. It was dissolved in 10 ml of 0.06 M sodium phosphate buffer, pH 7.0. Intrinsic
fluorescence was measured by exciting the protein sample at 280 nm and the fluorescence
spectrum was recorded in the wavelength range, 300–400 nm.

32
3.3 Results and discussion
Table 3.1 shows a comparative analysis of the colourimetric methods – Biuret
method (Gornall et al., 1949), dye-binding method (Bradford, 1976) and the method of
Lowry et al. (1951), used in the determination of protein concentration in maggot meal
extract. Standard plots obtained with these methods both in the absence and presence of 1%
(w/v) SDS (Figures 3.1–3.3) yielded different linear equations and sensitivity range.
Among the three methods, dye-binding method (Bradford, 1976) was found to be most
effective due to its sensitivity up to a protein concentration of 7.9 µg/ml. On the other hand,
biuret method (Gornall et al., 1949) showed poor sensitivity as the minimum protein
concentration estimated was found to be 400 mg/ml. Presence of 1% (w/v) SDS in protein
samples showed interference in both dye-binding method (Bradford, 1976) and the method
of Lowry et al. (1951). However, SDS interference was more pronounced in dye-binding
method (Bradford, 1976) due to inconsistencies in the results obtained at different protein
concentrations (data not shown). The standard curve obtained with the method of Lowry et
al. (1951) in presence of 1% (w/v) SDS showed significant reduction (20%) in the slope
value (from 1.50 to 1.20) of linear equation compared to the one obtained in the absence of
1% (w/v) SDS. Interference of SDS with Bradford‟s method (1976) for protein estimation
has also been reported earlier (Brooks et al., 1995). Therefore, Bradford‟s method (1976)
seems to be useful for protein quantitation in normal protein samples without SDS. As
several proteins in the multicellular subjects are known to be membrane-bound (Dennis,
1995; Jason et al., 2001), it is necessary to dissolve these proteins with a detergent like SDS
for making correct estimation of total protein content. In view of this, standard plots
obtained with various methods both in the absence and presence of 1% (w/v) SDS were

33
used. Since these methods are widely used for protein estimation in different biological
samples (Crossman et al., 2000; Matha et al., 1983), quantification of protein in maggot
meal sample was also made using all these methods under different experimental conditions.
Total protein content in maggot meal extract was determined using five different
methods including above mentioned colourimetric methods under different experimental
conditions as described in 3.2. Materials and methods. Warburg-Christian method (1941)
was employed after dissolving the maggot powder in the buffer both in the absence and
presence of 1% (w/v) SDS and the three colourimetric methods were tested using all four
treatments. Results obtained with these methods in terms of protein concentration (mg/ml)
as well as percentage (%) protein content are given in Table 3.2. Since the semi-micro
Kjeldhal method (Helrich, 1990) is based on the total nitrogen estimation in the sample and
involves complete digestion of the sample, different treatments were not employed for this
method. The total protein percentage in maggot sample as obtained from semi-micro
Kjeldhal method (Helrich, 1990) was found ~ 55.5% (Table 3.2). Semi-micro Kjeldhal
method (Helrich, 1990) is the most popular method for protein estimation in biological
samples and used extensively by many groups (Crossman et al., 2000; Keller & Neville,
1986; Kingsley, 1939; Zaia et al., 2000).
A comparison of percentage protein content as determined by the other four
methods both in the absence and presence of 1% (w/v) SDS (between Treatments 1 and 2;
Treatments 3 and 4) suggested marked enhancement in the total protein content after SDS
treatment. For example, 21% and 24% increase in the protein content was observed when
determined in presence of 1% (w/v) SDS by the method of Lowry et al. (1951) and
Warburg-Christian method (1941) respectively (see columns 3 and 5 of Table 3.2).

34
Similarly, a comparison of the data between Treatments 3 and 4 by the method of Lowry et
al. (1951) showed ~ 19% increase in the protein content when measured in presence of 1%
(w/v) SDS. This seems understandable as SDS, being anionic detergent would have
solubilized the lipid bilayer (Lichtenberg et al., 1983) and thus released all membrane-
bound proteins into the solution. A lesser increase (~ 10%) in the percentage protein
content observed with the biuret method (Gornall et al., 1949) upon SDS treatment can be
ascribed either to the poor sensitivity of the method or the presence of interfering
substances in the sample. A very high value of protein content (~ 70%) observed in
Warburg-Christian method (1941) in presence of 1% (w/v) SDS may be due to the presence
of other substances in the sample which absorb near 280 nm.
Application of Treatments 3 and 4 in the protein estimation was made to check the
presence of any left-over protein in the residue obtained after filtration of the maggot meal
extract. Results obtained with Treatments 1 and 3 verified this hypothesis as nearly 20%
and 12% increase in the protein content was observed in biuret method (Gornall et al., 1949)
and the method of Lowry et al. (1951) respectively when the reagents were added first for
color development before the centrifugation (columns 3 and 7 of Table 3.2). These results
also strengthened our hypothesis that several membrane-bound proteins remained
undetected when the maggot sample was solubilized in buffer only. Surprisingly, a
comparison between results obtained with Treatments 2 and 4 also showed a significant
increase [17% and 10% when determined by biuret method (Gornall et al., 1949) and the
method of Lowry et al. (1951) respectively, when the reagents were added first in the
presence of 1% (w/v) SDS (see columns 5 and 9 of Table 3.2)].

35
Figure 3.1: Standard curves for the determination of protein concentration by Biuret
method (1949) using BSA as the standard. These curves were obtained in
0.06 M sodium phosphate buffer, pH 7.0 in the absence () and presence
() of 1% SDS.

36
Figure 3.2: Standard curve for the determination of protein concentration by
dye-binding method of Bradford (1976) using BSA as the standard. The
curve was obtained in 0.06 M sodium phosphate buffer, pH 7.0 in the
absence () of 1% SDS.

37
Figure 3.3: Standard curves for the determination of protein concentration by the method
of Lowry et al. (1951) using BSA as the standard. These curves were
obtained in 0.06 M sodium phosphate buffer, pH 7.0 in the absence () and
presence () of 1% SDS.

38
Table 3.1: Regression analysis of various analytical methods used for protein estimation in maggot (C. megacephala) meal extract.
Abs. = Absorbance
conc. = Concentration
Methods Regression equation Sensitivity range
1. Biuret (1949)
- without 1 % SDS
(Abs.)540nm = 0.06 Protein conc. (mg/ml) – 0.002
0.40 – 3.23 mg/ml
- with 1 % SDS
(Abs.)540nm = 0.06 Protein conc. (mg/ml) + 0.020 0.42 – 3.27 mg/ml
2. Bradford (1976)
(Abs.)595nm = 0.01 Protein conc. (µg/ml) + 0.005 7.90 – 81.30 µg/ml
3. Lowry et al. (1951)
- without 1 % SDS
(Abs.)700nm = 1.50 Protein conc. (mg/ml) + 0.030
40.00 – 395.30 µg/ml
- with 1 % SDS (Abs.)700nm = 1.20 Protein conc. (mg/ml) + 0.030 47.50 – 394.20 µg/ml

39
Table 3.2: Comparative analysis of protein estimation in maggot (C. megacephala) meal extract as determined by different methods under different experimental
conditions.
N.D. = Not determined.
Each value represents the mean of three independent experiments. Mean values shown with superscripts using different letters within each column are statistically
significant (5% significance level; Bonferroni adjustment) pairwise multiple comparison when unequal variances in the groups.
Methods Treatment 1 Treatment 2 Treatment 3 Treatment 4
Protein
concentration
[mg/ml ± S.E.]
Percentage
[(%) ± S.E.] Arcsine
Protein
concentration
[mg/ml ± S.E.]
Percentage
[(%) ± S.E.] Arcsine
Protein
concentration
[mg/ml ± S.E.]
Percentage
[(%) ± S.E.] Arcsine
Protein
concentration
[mg/ml ± S.E.]
Percentage
[(%) ± S.E.] Arcsine
Biuret
(1949)
1.11 ± 0.02 22.2 ± 0.76a 0.49
1.61 ± 0.03 32.2 ± 1.20a 0.60
2.12 ± 0.08 42.4 ± 4.02a 0.71
2.46 ± 0.06 49.2 ± 2.75a 0.78
Bradford
(1976)
0.18 ± 0.01 3.6 ± 0.22b 0.19
N.D. N.D. N.D.
N.D. N.D. N.D.
N.D. N.D. N.D.
Lowry et
al. (1951)
0.69 ± 0.01 13.8 ± 0.26c 0.38
1.75 ± 0.03 34.9 ± 1.64ab 0.63
1.28 ± 0.02 25.6 ± 2.12b 0.53
2.24 ± 0.04 44.8 ± 1.79a 0.73
Warburg-
Christian
(1942)
2.30 ± 0.10 46.0 ± 4.96d 0.74
3.48 ± 0.11 69.6 ± 5.24bc 0.99
– – –
– – –
Semi-
micro
Kjeldahl
(1990)
– 55.5 ± 2.96 0.84d
– 55.5 ± 2.96c 0.84
– 55.5 ± 2.96c 0.84
– 55.5 ± 2.96c 0.84

40
This clearly suggested that SDS was either not competent enough to solubilize all
membrane-bound proteins or some proteins had undergone aggregation and thus remained
in the insoluble fraction. As a whole, comparison of results obtained with biuret method
(Gornall et al., 1949) and the method of Lowry et al. (1951) in presence of 1% (w/v) SDS
by adding reagents first (last column of Table 3.2) with that obtained with semi-micro
Kjeldhal method (Helrich, 1990) suggested that both biuret method (Gornall et al., 1949)
and the method of Lowry et al. (1951) can be used successfully to determine protein
content in biological samples under specified conditions. It seems appropriate as the protein
content determined by semi-micro Kjeldhal method (Helrich, 1990) may represent the
value towards the higher side due to the presence of other nitrogenous compounds (DNA
and RNA) in biological samples.
Characterization of major polypeptides of maggot meal extract was made by
SDS-PAGE. Figure 3.4 shows electrophoretic pattern of major proteins of maggot meal
extract (MG) along with different marker proteins (M) on 10% (w/v) polyacrylamide gel.
As can be seen from the figure, a total of twelve protein bands (MG1–MG12) differing in
mobility were visualized on the gel after staining with coomassie brilliant blue R. However,
the actual number of protein bands in maggot meal extract may be higher as the resolution
and detection of protein bands depend on the sensitivity of the staining dye as well as
resolving power of the gel. Since separation of various proteins in SDS-PAGE is based on
the size (molecular weight) of a protein, electrophoretrogram of maggot meal extract
showed the presence of different sized proteins. Based on the intensity of protein bands it
can be said that some proteins were present as major constituents while others had
relatively smaller concentrations. Values of relative mobility (Rm) of different protein

41
bands are given in Table 3.3 which were used to determine their molecular weights.
Figure 3.5 shows the standard curve between Log molecular weight and relative mobility
(Rm) of various marker proteins. A least squares analysis of the data was found to follow
the given straight line equation:
Log molecular weight = – 0.9898 Rm + 5.1979 (1)
Substitution of Rm values into the above equation yielded molecular weights of
different proteins present in maggot meal extract (Table 3.3). Both high and low molecular
weight proteins were present in the maggot meal extract as the molecular weight values of
these proteins varied from ~ 17 kDa to ~ 83 kDa. A comparison of data shown in Figure 3.4
and Table 3.3 suggested that maggot meal extract was rich in low molecular weight protein
fraction compared to high molecular weight protein fraction. This is more evident from
Figure 3.4 where the bottom half of the gel was more densely stained compared to the
upper half. This seems advantageous for the selection of maggot meal extract as a protein
source in an animal feed since low molecular weight proteins have greater solubility and
are easily digested compared to high molecular weight proteins (Duodu et al., 2003).
Table 3.4 shows amino acid composition of maggot sample as obtained after acid
hydrolysis. Since acid hydrolysis completely destroys tryptophan and converts amide forms
of acidic amino acids (asparagine and glutamine) into their acid forms, quantitation of three
amino acids, namely, tryptophan, asparagine and glutamine could not be made. As evident
from Table 3.4, majority of essential amino acids were present in maggot sample. Since
nutritional quality of the protein in animal feed depends on the presence of essential amino

42
acids, maggot meal extract offers a better candidate than fishmeal for its selection as the
protein source in animal feed (Santiago & Lovell, 1988).
Figure 3.6 shows the fluorescence spectrum of maggot protein sample (obtained by
ethanol precipitation) in 0.06 M sodium phosphate buffer upon excitation at 280 nm. As
can be seen from the figure, fluorescence spectrum appeared in the wavelength range,
300–400 nm with an emission maximum at 348 nm. Occurrence of an emission maximum
~ 340 nm was suggestive of the presence of tryptophan residues in the sample (Jennifer et
al., 1998). Although, this result was qualitative in nature, it confirmed the presence of a
significant amount of tryptophan in maggot sample. Tryptophan, being an essential amino
acid and its presence in maggot sample adds further to the quality of maggot meal extract
and its use as the animal feed.

43
Figure 3.4: SDS-PAGE pattern of maker proteins (M) and maggot (C. megacephala)
meal extract (MG) on 10% polyacrylamide gel following the method of
Laemmli (1970). The arrow shows the position of tracking dye,
bromophenol blue. About 10 µl of sample containing 24.6 µg protein was
loaded and electrophoresis was performed for about 2 hours. Marker proteins
used were: 1. ß-galactosidase, 2. bovine serum albumin, 3. ovalbumin, 4.
carbonic anhydrase, 5. soyabean trypsin inhibitor and 6. lysozyme. Major
protein bands of maggot meal extract are shown as MG1–MG12.
M MG (―)
(+)
1
2
3
4
5
6
MG2
MG3
MG1
MG4 MG5
MG6 MG7
MG8 MG9
MG10
MG11
MG12

44
Figure 3.5: Plot of log molecular weight versus relative mobility (Rm) of different
marker proteins as obtained from Figure 3.4. Numbers 1–6 refer to different
marker proteins, whereas MG1–MG12 represent major protein bands of
maggot (C. megacephala) meal extract as shown in Figure 3.4. Straight line
was drawn using least squares analysis.
1
MG11
MG8
MG12
45
Table 3.3: Values of relative mobility and molecular weight of major protein bands
present in maggot (C. megacephala) meal extract as determined by
SDS-PAGE.
Protein band Relative mobility
(Rm)
Molecular weight
(Dalton)
MG1 0.28 83,321
MG2 0.41 61,956
MG3 0.43 59,195
MG4 0.44 57,861
MG5 0.48 52,820
MG6 0.56 44,016
MG7 0.57 43,024
MG8 0.65 35,845
MG9
MG10
MG11
MG12
0.69
0.81
0.91
0.98
32,729
24,898
19,941
16,843

46
Table 3.4: Amino acid composition of (C. megacephala) maggot powder.
Amino acids Relative concentration (%)
Essential amino acids
Histidine 1.02
Threonine 2.19
Valine 2.20
Methionine 1.02
Isoleucine 4.13
Leucine 3.41
Phenylalanine 1.72
Lysine 3.72
Non-essential amino acids
Aspartic acid 3.87
Glutamic acid 7.26
Serine 1.94
Glycine 2.27
Arginine 2.43
Alanine 2.73
Proline 2.05
Tyrosine 1.48
Cysteine 0.36

47
Figure 3.6: Fluorescence spectrum of maggot (C. megacephala) protein sample obtained
in 0.06 M sodium phosphate buffer, pH 7.0 at 25°C upon excitation at
280 nm.

48
CHAPTER 4
EVALUATION OF BLOWFLY (CHRYSOMYA MEGACEPHALA) MAGGOT
MEAL AS AN EFFECTIVE AND SUSTAINABLE REPLACEMENT FOR
FISHMEAL IN THE DIET OF FARMED JUVENILE RED TILAPIA
(OREOCHROMIS SP.)
4.1 Introduction
Tilapia from the genus Oreochromis is in very high demand in the market because it
is consumed by people globally. Global tilapia production was predicted up to 3.7 million
tons in the end of 2010 and the demand for tilapia still growing especially in United State,
the single largest market for tilapia. The high demand in the global tilapia market has
thrown the attention from some countries such as Malaysia, Brazil, Thailand and the
Philippines to invest in this potential market. Some programs have been implemented to
enhance the production of tilapia in those countries, such as selective breeding and genetic
improvements technology in tilapia breeding. Nevertheless, the feed still contribute the
major production cost in this aquaculture area due to the high price of fishmeal.
Protein is an important dietary nutrient in animal feed as well as in aquaculture diets
to enhance the growth of poultry and fish (Marley, 1998). Traditionally, protein is sourced
from product such as fish and soybean. Fishmeal contains high nutritional value especially
its crude protein (approximately 50%) compared with plant protein. Furthermore, plant
proteins lack at least one of the essential amino acids needed by animals. Hence, fish is the
best form of protein source (Spinelli, 1978) for formulation of animal diet. However, fish,

49
which is normally obtained from the wild, has dwindled due to overexploitation, resulting
from the ever-increasing human population. Aquaculture has been found necessary as one
approach to increase fish production to make sufficient fish/protein available to the
population. The high competition for the same foodstuffs between man and domestic
animals has increased the price of fishmeal, which is the sole protein source in fish and
animal feeds. It is therefore very crucial that an alternative is found to reduce feeding cost,
and to make aquaculture a viable and attractive venture (Jauncey, 1982). Various
experiments on fishmeal replacement in aquafeed have been conducted to find an
alternative effective and sustainable protein source (Cabral et al., 2011; Deng et al., 2006;
Richard et al., 2011; Silva et al., 2010).
Insect larvae have been found as a very good protein source by many researchers.
Housefly (Musca domestica) is one of the well reported in literature. However, blowfly
Chrysomya megacephala from the same Order as the housefly is one of the potential
species to be used as protein source in animal feed. Chrysomya megacephala maggots are
always found on a carcass, are forensically important, and they feed on the decaying
organic matter. Hence, the ability of C. megacephala to convert the wastes into the better
quality of protein needs further investigation. Thus, this study will investigate the potential
value of blowflies C. megacephala maggots to be used as protein source in red tilapia
Oreochromis sp.

50
4.2 Materials and methods
The experimental diets used in this study were formulated and produced at the
Aquafeed Laboratory, Department of Aquaculture, Faculty of Agriculture, Universiti Putra
Malaysia, Malaysia. The fish feeding trial was conducted at the Marine and Fresh Water
Toxicology Laboratory, Institute of Biological Sciences, University of Malaya, Malaysia.
4.2.1 Maggot meal preparation
Adults of C. megacephala were collected from the local wet market and cultured in
the Pesticide Toxicology Laboratory, Institute of Biological Sciences, University of Malaya,
Malaysia. A slice of fresh beef liver acting as the egg collecting medium was placed in a
small container (4 × 2 cm) within a plastic culture container (24 × 28 cm). Once the eggs of
C. megacephala have been deposited on the beef liver slice, the medium would be
transferred to another round plastic container which was then covered with fabric. Maggots
hatched from eggs over a period of 4 days were killed by adding hot water. They were
sieved and dried in an oven at 100 ˚C for 24 hours before being ground into powder form.
4.2.2 Determination of protein concentration of maggot meal
The protein content of maggot meal was determined using semi-micro Kjeldahl
method (Helrich, 1990). A volume of 12 ml of concentrated sulphuric acid was used to
digest 0.1 g of maggot powder for 1 hour at 400 ˚C in fume hood using BÜCHITM
Labortechnik digester, model K-435. The digested product was distilled with sodium
hydroxide for 5 minutes on an automatic rapid steam distillation machine (C. Gerhardt, UK

51
Ltd.), model Vapodest20TM. Crude protein content was obtained by multiplying the nitrogen
percentage value with 6.25.
4.2.3 Determination of amino acid composition of maggot meal
Maggot meal was hydrolyzed with 6 N hydrochloric acid at 100 ˚C for 24 hours. An
internal standard amino acid was added into the hydrolyzed sample before filtering through
a 0.2 µm cellulose nitrate membrane. Subsequently, a reagent containing methanol,
phenylisothiocyanate, triethylamine and water in the ratio 7: 1: 1: 1 was allowed to react
with the filtered sample for 20 minutes. This was followed by vacuum drying for 30
minutes. The samples were then dissolved in 0.1 M ammonium acetate (pH 6.5) which was
used as the mobile phase for high performance liquid chromatography (HPLC) before
filtering with a Millipore membrane. A 20 µl sample was injected into a reversed-phase
column in HPLC system (JASCOTM Md 2010) and monitored by UV absorption (PicoTagTM
system, Waters).
4.2.4 Experimental diets
Prior to the feed formulation, the approximate nutrient composition of feed
ingredients was analyzed. All ingredients were ground into fine powder form with a
laboratory grinder. Five experimental diets: a control diet (M0) containing fishmeal as the
main animal protein source and four increasing substitution levels of maggot meal to
fishmeal at 25% (M25), 50% (M50), 75% (M75) and 100% (M100) were formulated
(Table 4.2) to contain approximately 30.0% of crude protein and 20.0 kJg-1
of gross energy.
This requirement will affect the quantities of the feed components. The diets were

52
processed using a laboratory scale extruder (Brabender TM
KE19), dried at 50˚C for 12
hours, sealed and stored at room temperature until use.
4.2.5. Feeding trial
Juvenile red tilapia supplied by a local hatchery, were quarantined for a week before
being used for the growth trial experiment. All fish were fasted for 24 hours at the
beginning of the experiment and body weight of fish was measured individually. Ten
juveniles were stocked into each glass tank (60 × 30 × 30 cm) equipped with a closed
recirculation water system. Each diet was randomly assigned to a tank in triplicates. Fish
were kept in a natural photoperiod regime and the water temperature of 25 ± 1.8 ˚C.
Feeding was done twice daily at 0800 and 1600 for 60 days at a daily feeding rate of 5% of
total biomass. Throughout the feeding trial period, fish were bulk weighed every two weeks
in order to adjust the feeding rate.
At the end of the feeding trial, fish were fasted for 24 hours before the final body
weight was recorded. Specific growth rate (SGR), feed conversion ratio (FCR) and protein
efficiency ratio (PER) were calculated as (following Chou and Shia, 1996):
SGR = ((ln (Final body weight) – ln (Initial body weight)) / number of days) X 100
FCR = Total feed intake (g) / (Final body weight – Initial body weight) (g)
PER = (Final body weight – Initial body weight) (g) / Total protein intake (g)

53
4.2.6. Chemical analysis
At the end of the feeding trial experiment, fish were starved for 24 hours before the
body weight was recorded. Subsequently, the fish were sacrificed and dried in an oven at
105 ˚C for 48 hours. The amount of moisture lost was recorded after 48 hours. For
proximate composition, the whole fish and dorsal muscle parts (fillets without skin) of
3 – 4 fishes from each replicate were oven dried and analyzed.
The crude protein, crude lipid, ash, fiber and gross energy of the experimental diets,
the whole fish and fillets were determined according to the AOAC method (1990). An
adiabatic bomb calorimeter was used to estimate the gross energy of the dry sample.
4.2.7 Statistical analysis
All the data were recorded as mean ± standard deviation and were subjected to
one-way analysis of variance (ANOVA). All percentage data were arcsine transformed
prior to analysis. The differences among treatment means were analyzed using Duncan‟s
multiple range test using R 2.13.1.

54
4.3 Results and Discussion
In this study, the potential of C. megacephala as an alternative protein source in red
tilapia feed was investigated and the best performance was observed when fishmeal was
substituted with maggot meal at 100%.
The crude protein and amino acid profile of C. megacephala maggots (different
days after hatching from eggs) are summarized in Table 4.1. Crude protein content of
maggot meal powder derived from maggots hatched from eggs over a period of 4 days
varied between 52% and 56% while the amino acids composition were slightly different
(Table 4.1). These values are similar to the housefly maggot meal that was reported by
Awoniyi et al. (2003), but are slightly higher when compared to the data published by
Gado et al. (1982) and Atteh and Ologbenla (1993). However, Calvert et al. (1971) found
that the crude protein of housefly maggot meal is 65% which is much higher than the others.
Such variations in protein content for the same maggot meal can be attributed to the
processing, drying, storage and protein estimation method employed or the media for the
production of housefly maggots (Awoniyi et al., 2003; Ogunji et al., 2008).
Maggot meal derived from maggots that hatched after 1 day have the highest
concentration of amino acids as compared to the others. However, the difference in the
concentration of the essential amino acids among the maggot meal of the various days are
very small (< 2%) except Cystine from the non-essential amino acid group. Since, acid
hydrolysis completely destroys tryptophan, asparagine and glutamine, quantification of
these three amino acids could not be performed (Tsugita & Scheffler, 1982). As evident
from Table 4.1, the majority of essential amino acids are present in the maggot samples.

55
Since nutritional quality of the protein in animal feed depends on the presence of essential
amino acids, maggot meal extract is a better candidate than fishmeal for selection as the
alternative protein source in animal feed (Santiago & Lovell, 1988).
All the experimental diets had similar crude protein content at 292.0 – 311.0 g kg-1
and gross energy 19.9 – 21.8 kJ g-1
, while crude lipid ranged from 468.0 – 562.0 g kg-1
. The
ash content decreased from 104.0 – 43.0 g kg-1
as the level of substitution maggot meal to
fishmeal increased. The fiber content decreased from 60.0 – 22.0 g kg-1
in the M0 to M50
diets and gradually increased to 31.0 g kg
-1 when the fishmeal was totally replaced by
maggot meal (M100). All the experimental diets contain 60 – 70% of moisture except the
diet with 25% substitution of maggot meal to fishmeal (48%).
The initial body weight of juvenile red tilapia was similar (~ 3.00 g) for all the
treatments before the feeding trial experiment. At the end of the experiment, the final body
weight of juvenile red tilapia increased when the percentage of maggot meal substituting
fishmeal in the diet increased. This is shown in Figure 4.1. The highest final body weight
(10.63 g) was recorded from the group of fish fed with the diet that contained only maggot
meal without fishmeal. Therefore, this group of fish has the highest percentage of weight
gain at the end of the experiment (~ 250%) and it is significantly different from the other
groups of fish (Figure 4.2). Other studies also revealed that maggot meal with partial
substitution levels for fishmeal is accepted by omnivorous fish species such as catfish and
Nile tilapia but not at the total substitution level (Brinker & Reiter, 2010; Cabral et al.,
2011; Ogunji et al., 2008; Oyelese, 2007). In addition, other researchers reported that the
level of replacement fishmeal with housefly maggot at below 50% appeared to be the

56
optimum substitution level for broiler feed (Adenji, 2007; Awoniyi et al., 2003). This is
because of the high level of replacement fishmeal by housefly maggot meal which is
associated with low body weight gain in both fish and broiler.
Table 4.3 summarizes the initial and final body weight of fish, survival, special
growth rate, food conversion ratio and protein efficiency ratio of juvenile red tilapia after
feeding with the experimental diets for 60 days. At the end of the experiment, the highest
survival rate of juvenile red tilapia was observed in those fed with 100% substitution
(80.0%) maggot meal. Even though a lower survival rate was recorded in the lower levels
of replacement maggot meal to fishmeal, there are no significant differences (P > 0.05) in
survival rate among the various experimental diets. Special growth rate (SGR) increased
when the level of substitution increased. The maximum SGR value (2.02% day-1
) was
recorded when fishmeal was totally replaced by maggot meal and is significantly different
(P < 0.05) from other the diets. When fed on a fishmeal-free diet (M100), the juvenile red
tilapia had the best feed conversion ratio (1.34) and protein efficiency ratio (0.30). There is
no significant difference (P > 0.05) among the experimental diets in feed conversion and
protein efficiency ratio.

57
Table 4.1: Analyzed crude protein (%) and amino acid composition (%) of blowfly
maggot (different day after it hatched from egg).
Day
1 2 3 4
Protein concentration 55.0 56.2 54.0 52.4
Essential amino acid
Histidine 2.5 1.4 1.5 1.5
Threonine 4.7 2.7 2.3 2.3
Valine 3.5 2.3 2.4 2.6
Methionine 2.1 1.2 1.3 1.5
Isoleucine 3.7 1.9 1.9 2.1
Leucine 4.9 3.4 3.5 3.7
Phenylalanine 2.9 2.5 3.2 4.0
Lysine 5.3 4.1 4.4 4.6
Non-essential amino acid
Aspartic acid 12.1 10.0 10.7 12.1
Glutamic acid 15.7 13.2 13.8 14.4
Serine 2.9 2.0 2.0 2.2
Glycine 3.2 2.4 2.4 2.3
Arginine 3.4 2.7 2.2 2.6
Alanine 3.9 3.1 2.8 2.8
Proline 3.7 2.0 2.0 2.2
Tyrosine 3.2 1.8 2.9 4.2
Cystine 2.9 0.2 0.1 0.1

58
Table 4.2: Feed composition and proximate analysis of the experimental diets.
a Mineral premix (g kg
-1): potassium chloride, 9; potassium iodide, 0.004; dicalcium phosphate dihydrate, 50;
sodium chloride, 4; copper sulfate, 0.3; zinc sulfate, 0.4; cobalt (II) sulfate, 0.002; ferrous sulphate, 2;
manganese (II) sulfate, 0.3; calcium carbonate, 21.5; magnesium hydroxide, 12.4; sodium selenite, 0.003;
sodium fluoride, 0.1.
b Vitamin premix (g kg
-1): ascobic acid, 45; myo-insitol, 5; choline chloride, 75; niacin, 4.5; riboflavin, 1;
pyridoxine, 1; thiamin mononitrate, 0.9; ca-pantothenate, 3; retinyl acetate, 0.6; cholecalciferol, 0.08; vitamin
K menadione, 1.7; α-tocopheryl acetate (500 IU g-1
), 8; biotin, 0.02; folic acid, 0.1; vitamin B12, 0.001;
cellulose, 845.1.
Experimental Diets
M0 M25 M50 M75 M100
Ingredients (g kg-1
)
Fishmeal 300.0 225.0 150.0 75.0 0.0
Maggot meal 0.0 75.0 150.0 225.0 300.0
Soybean meal 210.0 213.0 248.0 254.0 259.0
Tapioca starch 200.0 200.0 282.0 276.0 271.0
Rice bran 222.0 236.0 50.0 50.0 50.0
Fish oil 15.0 15.0 50.0 50.0 50.0
Corn meal 0.0 0.0 50.0 50.0 50.0
Sunflower oil 34.0 16.0 15.0 5.0 2.0
Mineral premixa 10.0 10.0 10.0 10.0 10.0
Vitamin premixb 10.0 10.0 10.0 10.0 10.0
Proximate composition (g kg-1
dry matter)
Crude protein 295.0 310.0 292.0 295.0 311.0
Crude carbohydrate 468.0 497.0 562.0 555.0 546.0
Ash 104.0 93.0 58.0 52.0 43.0
Fiber 60.0 52.0 22.0 25.0 31.0
Moisture 73.0 48.0 62.0 72.0 69.0
Gross energy (kJ g-1
) 21.8 20.8 19.7 19.9 20.0
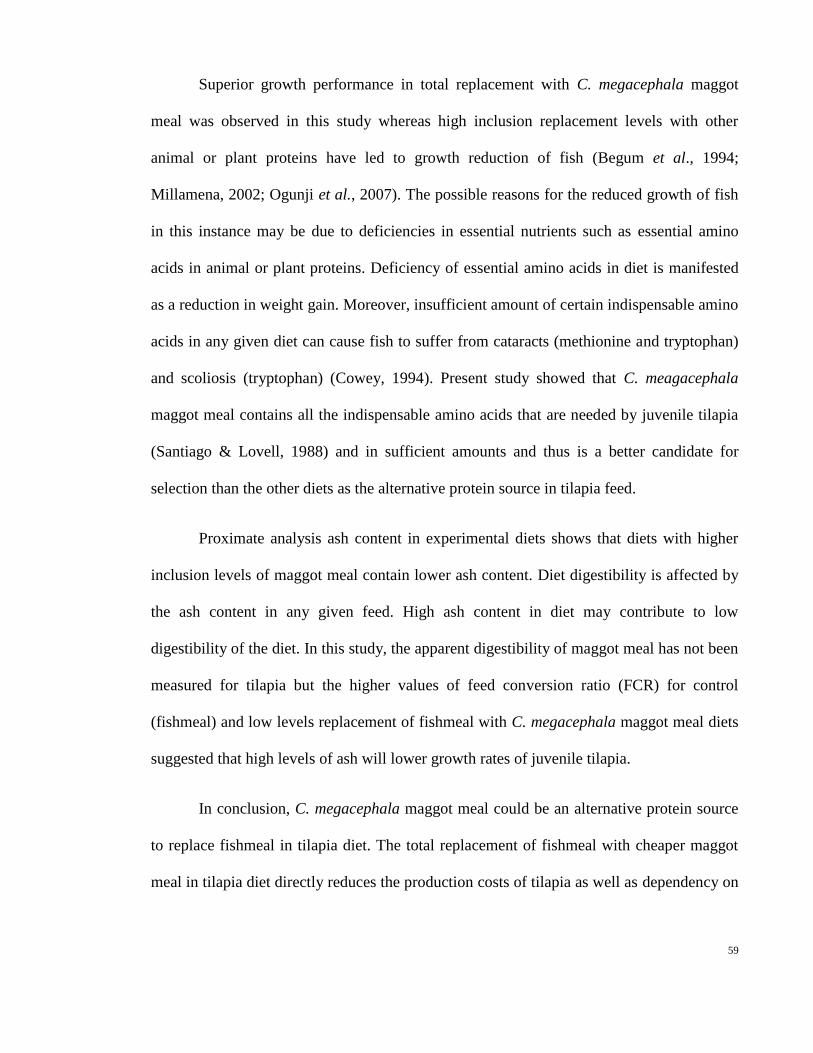
59
Superior growth performance in total replacement with C. megacephala maggot
meal was observed in this study whereas high inclusion replacement levels with other
animal or plant proteins have led to growth reduction of fish (Begum et al., 1994;
Millamena, 2002; Ogunji et al., 2007). The possible reasons for the reduced growth of fish
in this instance may be due to deficiencies in essential nutrients such as essential amino
acids in animal or plant proteins. Deficiency of essential amino acids in diet is manifested
as a reduction in weight gain. Moreover, insufficient amount of certain indispensable amino
acids in any given diet can cause fish to suffer from cataracts (methionine and tryptophan)
and scoliosis (tryptophan) (Cowey, 1994). Present study showed that C. meagacephala
maggot meal contains all the indispensable amino acids that are needed by juvenile tilapia
(Santiago & Lovell, 1988) and in sufficient amounts and thus is a better candidate for
selection than the other diets as the alternative protein source in tilapia feed.
Proximate analysis ash content in experimental diets shows that diets with higher
inclusion levels of maggot meal contain lower ash content. Diet digestibility is affected by
the ash content in any given feed. High ash content in diet may contribute to low
digestibility of the diet. In this study, the apparent digestibility of maggot meal has not been
measured for tilapia but the higher values of feed conversion ratio (FCR) for control
(fishmeal) and low levels replacement of fishmeal with C. megacephala maggot meal diets
suggested that high levels of ash will lower growth rates of juvenile tilapia.
In conclusion, C. megacephala maggot meal could be an alternative protein source
to replace fishmeal in tilapia diet. The total replacement of fishmeal with cheaper maggot
meal in tilapia diet directly reduces the production costs of tilapia as well as dependency on

60
trash fish that is comprehensively being used as feed. Further studies under on-farm
conditions should be carried out to determine the growth performance of fish fed with fish
replacement diets and its long-term effects.

61
Table 4.3: Initial body weight (g), final body weight (g), special growth rate (SGR), food conversion ratio (FCR) and protein efficiency
ratio (PER) of red tilapia Oreochromis sp. after feeding with the experimental diets for 60 days.
Value (mean ± standard deviation) of three replications in same row followed by different letters are statistically significant using, Duncan‟s
multiple range test, P < 0.05.
Experimental diets
M0 M25 M50 M75 M100
Initial body weight (g) 2.75 ± 0.57 3.00 ± 0.27 3.21 ± 0.22 3.29 ± 0.21 3.11 ± 0.14
Final body weight (g) 5.64 ± 0.93 6.34 ± 1.71 7.47 ± 1.44 8.53 ± 2.22 10.63 ± 2.65
Survival rate (%) 63.33 ± 11.55a 60.00 ± 10.00
a 76.67 ± 15.28
a 73.33 ± 25.17
a 80.00 ± 26.46
a
SGR (% day-1
) 1.21 ± 0.34a 1.21 ± 0.37
a 1.39 ± 0.21
a 1.55 ± 0.34
ab 2.02 ± 0.27
b
FCR 2.89± 0.99a 2.63 ± 1.10
a 2.08 ± 0.35
a 1.97 ± 0.50
a 1.34 ± 0.14
a
PER 0.18 ± 0.06a 0.17 ± 0.06
a 0.20 ± 0.05
a 0.21 ± 0.07
a 0.30 ± 0.12
a

62
M0 M25 M50 M75 M100
Diet
We
igh
t (g
)
Initial
Final
0
3
6
9
12
15
Figure 4.1: The body weight of red tilapia Oreochromis sp. at the beginning and end of
the experimental period (60 days).

63
10
01
50
20
02
50
30
0
Diet
We
igh
t g
ain
(%)
M0 M25 M50 M75 M100
Figure 4.2: 95% confidence interval of mean percentage weight gain (%) according to
feed types.

64
Figure 4.3: Body sizes of red tilapia Oreochromis sp. after feeding with the
experimental diets for 60 days.

65
CHAPTER 5
PRELIMINARY STUDY ON MAGGOT STRAIN IMPROVEMENT USING
ARTIFICIAL SELECTION
5.1 Introduction
Artificial selection, also known as selective breeding, refers to the process of
enhancing certain traits of an original 'wild' type through a controlled breeding program. It
is in contrast with natural selection and has been applied domestically for centuries in
animals and plants in order to gain desirable traits such as high yield strain crops that are
preferred by farmers (Snustad & Simmons, 2010).
Selection experiments are able to magnify the differences of phenotypic
characteristics between selected lines and control lines; this can contribute to an
understanding of physiological mechanisms involved in the response to selection
(Harshman & Hoffmann, 2000). Moreover, resultant improved strains from using the
selection method are relatively stable in terms of genetic dynamic because only the
homozygous will remain at the end of selective breeding program (Gjedrem, 2005;
Moen & Zhuikov, 2007).
The size and body weight of an organism can be influenced by genes, environment,
ecology, life history and physiology (Hillesheim & Stearns, 1992). Generally, body weight
is considered to have moderate heritability (Dunnington & Siegel, 1985). However, under
highly control conditions body weight responds significantly to artificial selection.

66
In 1989, Eisen reported that body weight and protein weight are highly correlated.
Thus, the objective of this study is to produce a robust and high protein strain of
Chrysomya megacephala maggots to be used as animal feed by artificial selection.

67
5.2 Materials and methods
5.2.1 Sampling and colonization of flies
The C. megacephala fly population used in this study was sampled by using a
sweep net from a single wild population at the Sungai Way Wet Market in April 2010.
Collected wild flies were brought to the laboratory and used to generate the next generation.
They were reared in plastic containers (24 x 28 cm) supplied with granulated sugar, water
and small pieces of fresh beef liver (protein source) in separated petri dishes. These flies
were kept at 27˚C on a 12:12 light: dark photoperiod.
5.2.2 Artificial selection based on body weight
The above wild flies were separated into two different lines. These are the control
(non-selected) line and the selected line. Each line consisted of three independent replicates
and was kept in different plastic containers at 27˚C on a 12:12 light: dark photoperiod. C1,
C2 and C3 represented the three replicates for the control line whereby S1, S2 and S3
represented the three replicates for the selected line. All maggots were weighed
individually by using a precision balance and their body weight was recorded. The non-
selected line will be random breeding without introducing any selection force until the tenth
generation. However, the artificial selection criteria will be based on the 20% of the highest
maggot weight in the distribution curve and this will be carried out until the tenth
generation.

68
5.2.3 Determination of protein content
Half of the selected maggots from the previous section (5.2.2) were killed by using
hot water. They were dried in an oven at 100˚C for 24 hours and then grounded into powder
form. Subsequently, the powder was used to prepare maggot meal extract following
Treatment 4. Method of Lowry et al. was used to estimate the protein content of maggot
meal for all generations.
5.2.4 Flies breeding
The other half of the selected maggots were kept in a new plastic container for
breeding purposes. The above procedures were repeated up to 10 generations for both
selected and non-selected lines under laboratory condition.

69
5.3 Results and Discussion
The maggot body weight of each generation, mean and standard deviation for
selected and non-selected lines of maggots (10 generations) were summarized in Table 5.1.
The means were variable in the non-selected line and fluctuated from 0.049 g (lowest) to
0.0713 g (highest) throughout the 10 generations. Moreover, the range of body weight in
the non-selected line within the 95% confidence interval is found to be overlapping after
observing all the 10 generations. On the other hand, a slight increase in body weight was
observed in the selected line when selection pressure was continuously introduced to the
population. The lowest and upper boundary (0.0500 ― 0.0842 g) of the 95% confidence
interval body weight for the selected line increased at the tenth generation compared to
parental (0.0387 ― 0.0686 g).
Many complex traits such as body size, weight and height are influenced by genes
and do not show simple patterns of inheritance. Genetic variation in a population‟s gene
pool determines the evolutionary potential of the population as well as the response to
selection. Nonetheless, the populations are phenotypically variable and are strongly related
with the genetic variation. Hence, the majority of quantitative traits in a population could be
permanently altered after selection force was continuously introduced to the population
(Fristrom & Clegg, 1987). Thus, in this study the maggot body weight in the selected line
showed a slight increase through the selection breeding experiment.
During the selection experiment, the positive assortative mating with a single
extreme homozygous genotype will reduce the range of variation if the assorting is cued on
heritable traits. This is because the frequency of a single phenotypically homozygous
genotype will be increased in the population and uniformity of genetics might occur

70
(Fristrom & Clegg, 1987). Therefore, the range of body weight from the selected line was
reduced as compared to the parental.
The protein content of maggot meal from this experiment showed a weak
relationship with body weight because the maggots from the selected line have higher body
weight but lower protein content as compared to parental. Hence, selection for body weight
could be accompanied by raising fatness as there is a high correlation between fatness and
weight (Bunger et al., 1998).

71
Table 5.1: Number of maggots (N), mean body weight (g) and standard deviations (S.D), 95% confident interval (CI) and
coefficient of varience (C.V) in each generation for selected and non-selected lines of C. megacephala maggots.
Generation Non-Selected
Selected
Mean ± S.D (g) Range (g) 95% CI (g) C.V Mean ± S.D (g) Range (g) 95% CI (g) C.V
Parental
0.0512 ± 0.0089
(N = 1341)
0.0350 ― 0.0799 0.0387 ― 0.0686 0.1738
0.0512 ± 0.0089
(N = 1341)
0.0350 ― 0.0799 0.0387 ― 0.0686 0.1738
F1
0.05611 ± 0.0085
(N = 537)
0.0368 ― 0.0861 0.0395 ― 0.0728 0.1515 0.0525 ± 0.0086
(N = 1380) 0.0335 ― 0.0861 0.0356 ― 0.0694 0.1638
F2
0.05197 ± 0.0063
(N = 1257)
0.0341 ― 0.0705 0.0473 ― 0.0623 0.1212
0.0598 ± 0.0082
(N = 1056)
0.0375 ― 0.0846 0.0437 ― 0.0759 0.1371
F3
0.0490 ± 0.0063
(N = 1277)
0.0337 ― 0.0721 0.0367 ― 0.0613 0.1286
0.0651 ± 0.0101
(N = 360)
0.0416 ― 0.0912 0.0453 ― 0.0849 0.1551
F4
0.0618 ± 0.0064
(N = 820)
0.0426 ― 0.0844 0.0499 ― 0.0743 0.0337
0.0596 ± 0.0053
(N = 118)
0.0462 ― 0.0710 0.0492 ― 0.0700 0.0889
F5
0.0576 ± 0.0073
(N = 763)
0.0374 ― 0.0805 0.0433 ― 0.0719 0.1267
0.0598 ± 0.0065
(N = 129)
0.0428 ― 0.0730 0.0471 ― 0.0725 0.1087
F6
0.0563 ± 0.0079
(N = 701)
0.0348 ― 0.0802 0.0408 ― 0.0718 0.1403
0.0608 ± 0.0104
(N = 126)
0.0428 ― 0.0867 0.0404 ― 0.0812 0.1711
F7
0.0713 ± 0.0077
(N = 196)
0.0454 ― 0.0878 0.0562 ― 0.0864 0.1080
0.0685 ± 0.0107
(N = 384)
0.0500 ― 0.0955 0.0475 ― 0.0895 0.1562
F8
0.0612 ± 0.0073
(N = 754)
0.0400 ― 0.0885 0.0469 ― 0.0755 0.3548
0.0698 ± 0.0110
(N = 378)
0.0406 ― 0.0957 0.0482 ― 0.0914 0.1576
F9
0.0573 ± 0.0079
(N = 763)
0.0381 ― 0.0759 0.0418 ― 0.0728 0.2958 0.0671 ± 0.0084
(N = 123) 0.0406 ― 0.0860 0.0506 ― 0.0836 0.1252
F10
0.0529 ± 0.0057
(N = 275)
0.0405 ― 0.0701 0.0417 ― 0.0641 0.1078 0.0671 ± 0.0087
(N = 123) 0.0410 ― 0.0860 0.0500 ― 0.0842 0.1297

72
Table 5.2: Mean protein content (mg/ml) and standard deviations (S.D), 95% confident
interval (CI) in each generation for selected and non-selected lines of
C. megacephala maggots.
Generation
Non-selected
Selected
Mean ± S.D
(mg/ml)
95% CI
(mg/ml)
Mean ± S.D
(mg/ml)
95% CI
(mg/ml)
Parental 2.10 2.03 ― 2.57 2.10 2.03 ― 2.57
F1 2.17 1.38 ― 2.95 2.11 1.18 ― 3.04
F2 2.37 1.59 ― 3.16 2.48 2.27 ― 2.69
F3 2.36 2.24 ― 2.49 2.42 2.21 ― 2.63
F4 2.49 2.32 ― 2.66 1.90 1.76 ― 2.04
F5 2.35 2.20 ― 2.50 2.51 2.32 ― 2.70
F6 2.78 2.68 ― 2.87 2.38 2.20 ― 2.56
F7 2.32 2.25 ― 2.40 3.02 2.92 ― 3.12
F8 2.98 2.26 ― 3.11 2.54 2.37 ― 2.71
F9 2.88 2.46 ― 3.30 1.93 1.70 ― 2.17
F10 2.90 2.65 ― 3.15 2.00 1.41 ― 2.60

73
CHAPTER 6
GENERAL DISCUSSION
Protein is an important component in animal feed to enhance the growth of poultry
(SRAC, 1998). Thus, protein concentration in a feed supplement needs to be determined
before using it for animal feed formulation. A comparative study was made to determine
the protein content in C. megacephala maggot meal by semi-micro Kjeldahl method, biuret
method (Gornall et al., 1949), dye-binding method (Bradford, 1976), Warburg-Christian
method (1941) and the method of Lowry et al. (1951). These methods (except semi-micro
Kjeldahl) were equivalent being commonly used and easy to perform. Furthermore, the
comparative study may be helpful in detecting potential interference in protein estimation
by other substances present in the feed. Different methods produced different estimates of
the total protein amount present in the C. megacephala maggot meal. However, Warburg-
Christian method (1941) yielded the similar results to that obtained with semi-micro
Kjeldahl method for total protein amount. In view of the presence of other nitrogenous
compounds (nucleic acids and free amino acids) in maggot meal extract, results obtained
from these two methods seem to be questionable. Presence of detergent, sodium dodecyl
sulfate (SDS) in the solubilization buffer also resulted in a higher value of protein content
in each of the colourimetric methods compared to that obtained in the absence of SDS. This
is because SDS solubilized the membrane-bound proteins in maggot meal which would
otherwise remain insoluble in the residue upon centrifugation. A comparison of results
obtained with biuret method (Gornall et al., 1949) and the method of Lowry et al. (1951)
using prior addition of reagents in the presence of 1% (w/v) SDS before centrifugation with
that obtained with semi-micro Kjeldhal method (Helrich, 1990), suggested that these two

74
methods can be used successfully to determine protein content in maggot meal and other
multicellular biological samples.
Protein analysis of C. megacephala maggot meal based on SDS-polyacrylamide gel
electrophoresis, amino acid analysis and fluorescence spectra suggested it is a good protein
source in tilapia feed due to high protein content (55.5%), abundance of low molecular
weight proteins and good amount of essential amino acids. Presence of low molecular
weight proteins in the maggot meal also increases the feasibility due to their greater
solubility and digestibility as compared to high molecular weight proteins (Duodu et al.,
2003). In addition, presence of essential amino acids in maggot meal further adds to its
quality as the protein source in animal feed (Santiago & Lovell, 1988).
After determining the suitability of C. megacephala maggot meal as a protein
source in animal feed, a feeding trial was conducted to evaluate the growth performance
and feed utilization of juvenile red tilapia (Oreochromis sp.) with diets containing
increasing substitution levels of dietary fishmeal by a mixture of maggot meal sources.
Results showed that the juvenile red tilapia diet which constituted a 100% replacement with
maggot meal protein had the highest weight gain, survival rate, special growth rate (SGR),
protein efficiency ratio (PER) and lowest food conversion ratio (FCR). This superior
growth performance at the highest inclusion replacement level of maggot meal to fishmeal
clearly indicated that maggot meal contains sufficient nutrients such as essential amino
acids and fatty acids which are important for growth and development of tilapia.
There are other advantages in using maggot meal as an alternative protein source
rather than plant protein. Different groups of scientists have been studying the potential
practicability of plant protein to replace fishmeal in aquafeed. Most of the results showed

75
that plant protein can only partially replace fishmeal because the inclusion of plant protein
in substantial amounts has adverse effects on fish growth. A common problem of plant
protein is their relatively low sulfuric amino acid content (cystine and methionine) which
are essential amino acids for fish and also, the presence of anti-nutritional factors.
Sudaryono et al. (1999) and Espe et al. (2007) reported low feed intake and low
digestibility in shrimps and fishes when given feed containing anti-nutritional factors.
Additionally, the high occurrence of plant cell walls present in feed are resistant to
digestion by fish and other animals (Calvert, 1979).
In earlier studies, high survival rates of fish when fed with diets containing different
levels of housefly maggot meal have been recorded by different groups. Ogunji et al. (2007)
found that the inclusion of maggot meal in nile tilapia fingerling diet did not cause
oxidative stress generation in tilapia liver. Thus, no high reactive oxygen species (ROS)
were observed. Furthermore, in the wild, insect larvae are the natural food sources for
animals including fish. From the sustainable standpoint, maggot larvae is a suitable protein
source because it can be mass produced in a short period of time and the maggots are ready
to be harvested within a brief period (less than 1 week). Besides, fish feed protein should be
sourced from other forms of organisms because using aquaculture wastes such as discarded
fish heads and other unwanted fish parts in fishmeal (especially from the same species),
could spread diseases and/or cause environmental contamination. However, before maggot
meal can be used commercially in red tilapia feed, a larger trial over a longer period on-
farm condition should be conducted to confirm its performance and long-term effects.
The artificial selection experiment was designed to produce a more robust strain of
C. megacephala with increased protein content. However, results (Table 5.1) showed that
there is a reduction of variances in body weight rather than a change, with the mean trait
76
leaning towards higher body weight. This might due to the stabilizing of selection. Earlier
studies suggested stabilizing selection caused genetic variance reduction which is in
contrast with the disruptive selection experiment (Bulmer, 1971; Kaufman et al., 1977).
Table 5.2 showed the dispersion pattern of protein content after the selection
experiment up to 10 generations. The lack of information on the distribution of gene effects
as well as trait frequencies of protein content in maggots and changes in variance cannot be
fully explained by the change in gene frequency. Furthermore, it is difficult to detect
changes in rates of response to selection in the short term; therefore, long term experiments
are needed to ascertain the inheritance of quantitative traits.

77
CHAPTER 7
SUMMARY
Chrysomya megacephala maggot meal was found to be suitable as a protein source
in animal feed because of its high protein content, essential amino acids and abundance of
low molecular weight proteins.
Moreover, C. megacephala maggot meal has very good potential as a protein source
for red tilapia diet. The total substitution of fishmeal by maggot meal in the replacement
level diets showed the best growth performance and feed utilization in juvenile tilapia.
The artificial selection experiment failed to meet the third objective of this study but
has succeeded in narrowing the range of body weight of maggot (a slight increase in the
lowest boundary). However, this will not negate the effectiveness of C. megacephala
maggot meal as a protein source in animal feed.
In conclusion my study has demonstrated that there is a great potential for the use of
C. megacephala maggots as a protein source in tilapia feed.
This could make a significant impact on the cost of producing farmed tilapia
contributing to the sustainable development of the aquaculture industry a crucial concern in
light of rising human and global food demands.

REFERENCES
Adenji, A. A. (2007). Effect of replacing groundnut cake with maggot meal in the diet of
broilers. International Journal of Poultry Science, 6(11), 822-825.
Agren, G., Stenram, U., Nordgen, H., Eklund, A., & Glas, J. E. (1974). Some biological
effects observed in rat fed on single-cell proteins of yeast and bacterial origin.
Nutrition & Metabolism 17, 20-36.
Alverson, D. L., Freeberg, M. H., Murawaski, S. A., & Pope, J. G. (1994). A global
assessment of fisheries bycatch and discards. FAO Fisheries Technical Paper No.
339, 235.
Anderson, D., Sedgley, M., Short, J., & Allwood, A. (1982). Insect pollination of mango in
northern Australia. Australian Journal of Agricultural Research, 33(3), 541-548.
AOAC. (1990). Official Methods of Analysis of the Association of Official Analytical
Chemistry. (11 ed.). AOAC, Arlington, VA, USA.
Atteh, J. O., & Ologbenla, S. (1993). Replacement of fish meal with maggot in broiler diets.
Effects on performance and nutrition. Nigeria Journal of Animal Production, 20,
44-49.
Awoniyi, T., Aletor, V., & Aina, J. (2003). Performance of broiler-chickens fed on maggot
meal in place of fishmeal. International Journal of Poultry Science, 2(4), 271-274.
Begum, N. N., Chakraborty, S. C., Zaher, M., Abdul, M. M., & Gupta, M. V. (1994).
Replacement of fishmeal by low-cost animal protein as a quality fish feed ingredient
for indian major carp, Labeo rohita, fingerlings. Journal of the Science of Food and
Agriculture, 64(2), 191-197.
Bradford, M. M. (1976). A rapid and sensitive method for the quantitation of microgram
quantities of protein utilizing the principle of protein-dye binding. Analytical
Biochemistry, 72(1-2), 248-254.
Brinker, A., & Reiter, R. (2010). Fish meal replacement by plant protein substitution and
guar gum addition in trout feed, Part I: Effects on feed utilization and fish quality.
Aquaculture, 310(3–4), 350-360.

Brooks, S. P. J., Lampi, B. J., Sarwar, G., & Botting, H. G. (1995). A Comparison of
Methods for Determining Total Body Protein. Analytical Biochemistry, 226(1),
26-30.
Bulmer, M. G. (1971). The effect of selection on genetic variability. The American
Naturalist, 105(943), 201-211.
Bunger, L., Renne, U., Dietl, G., & Kuhla, S. (1998). Long-term selection for protein
amount over 70 generations in mice. Genetic Research, 72, 93-109.
Cabral, E. M., Bacelar, M., Batista, S., Castro-Cunha, M., Ozório, R. O. A., & Valente, L.
M. P. (2011). Replacement of fishmeal by increasing levels of plant protein blends
in diets for Senegalese sole (Solea senegalensis) juveniles. Aquaculture, 322–323(0),
74-81.
Calvert, C. C. (1979). Use of animal excreta for microbial and insect protein synthesis.
Journal of Animal Science, 48(1), 178-192.
Calvert, C. C., Morgan, N. O., & Eby, H. J. (1971). Biodegraded hen manure and adult
flies; their nutritiional value to the growing chick. Paper presented at the Livestock
Waste Management and Pollution Abatement, Proceedings of International
symposium on Livestock wastes, Columbus.
Carter, C. G., & Hauler, R. C. (2000). Fish meal replacement by plant meals in extruded
feeds for Atlantic salmon, Salmo salar L. Aquaculture, 185(3–4), 299-311.
Chou, B-S., Shia, S-Y., 1996. Optimal dietary lipid level for growth of juvenile hybrid
tilapia, Oreochromis niloticus X Oreochromis aureus. Aquaculture, 143, 185-195.
Cohen, J. E. (2003). Human Population: The Next Half Century. Science, 302(5648),
1172-1175.
Combs, G. F. (1952). Algae (Chlorella) as a source of nutrients for the chick. Science,
116(3017), 453-454.
Cowey, C. B. (1994). Amino acid requirements of fish: a critical appraisal of present values.
Aquaculture, 124(1–4), 1-11.
Crossman, D. J., Clements, K. D., & Cooper, G. J. S. (2000). Determination of protein for
studies of marine herbivory: a comparison of methods. Journal of Experimental
Marine Biology and Ecology, 244(1), 45-65.
David, J. A. d. O., Rocha, T., & Caetano, F. H. (2008). Ultramorphological characteristics
of Chrysomya megacephala (Diptera, Calliphoridae) eggs and its eclosion. Micron,
39(8), 1134-1137.
Deng, J., Mai, K., Ai, Q., Zhang, W., Wang, X., Xu, W., & Liufu, Z. (2006). Effects of
replacing fish meal with soy protein concentrate on feed intake and growth of
juvenile Japanese flounder, Paralichthys olivaceus. Aquaculture, 258(1–4), 503-513.
Dennis, B. (1995). Protein molecules as computational elements in living cells. Nature, 376,
307-312.
Drochioiu, G., Damoc, N. E., & Przybylski, M. (2006). Novel UV assay for protein
determination and the characterization of copper-protein complexes by mass
spectrometry. Talanta, 69(3), 556-564.
Dunnington, E. A., & Siegel, P. B. (1985). Long-term selection for 8-week body weight in
chickens-direct and correlated responses. Theory Applied Genetics, 71, 305-313.
Duodu, K. G., Taylor, J. R. N., Belton, P. S., & Hamaker, B. R. (2003). Factors affecting
sorghum protein digestibility. Journal of Cereal Science, 38(2), 117-131.
Eisen, E. J. (1989). Selection experiments for body composition in mice and rats: A review.
Livestock Production Science, 23(1–2), 17-32.
Espe, M., Lemme, A., Petri, A., & El-Mowafi, A. (2007). Assessment of lysine requirement
for maximal protein accretion in Atlantic salmon using plant protein diets.
Aquaculture, 263(1–4), 168-178.
Eusebio, B. P. S., & Coloso, R. M. (2000). Nutritional evaluation of various plant protein
sources in diets for Asian sea bass Lates calcarifer. Journal of Applied Ichthyology,
16(2), 56-60.
FAO Fishery Information Data and Statistics Unit. (1999). Aquaculture production
statistics 1998-1997. Rome.

Fasakin, E. A., Balogun, A. M., & Ajayi, O. O. (2003). Evaluation of full-fat and defatted
maggot meals in the feeding of clariid catfish Clarias gariepinus fingerlings.
Aquaculture Research, 34(9), 733-738.
Fitzsimmons, K. (2000). Future trends of tilapia aquaculture in the Americas. In A. B.
Costa-Pierce & J. E. Rakocy (Eds.), Tilapia in the Americas (Vol. 2, pp. 252-264).
Baton Rouge, Louisiana: World Aquaculture Society.
Fristrom, J. W., & Clegg, M. T. (1987). Principles of genetics. New York: W. H. Freeman
and Company.
Gabre, R. M. (1994). Studies on the bionomics and medical importance of Chrysomya
megacephala (Fabricius)(Diptera: Calliphoridae) in Egypt. Master thesis, Cairo
University, Cairo, Egypt.
Gabre, R., Adham, F., & Chi, H. (2005). Life table of Chrysomya megacephala (Fabricius)
(Diptera: Calliphoridae). Acta Oecologica, 27(3), 179-183.
Gado, M. S., El-Aggory, S. M., El-Gawaard, A. A., & Mormond, A. K. (1982). The
possibility of applying insect protein in broiler rations. Nutrition Abstracts &
Reviews, 53, 76.
Games, P.A. and Howell, J.F. (1976). Pairwise multiple comparison procedures with
unequal N's and/or variances: A monte carlo study. Journal of Educational and
Behavioral Statistics, 1: 113-125.
Gjedrem, T. (Ed.). (2005). Selection and Breeding Programs in Aquaculture. Dordrecht:
Springer.
Gornall, A. G., Bardawill, C. J., & David, M. M. (1949). Determination of serum proteins
by means of the biuret reaction. Journal of Biological Chemistry, 177, 751-766.
Greenberg, B. (1991). Flies as Forensic Indicators. Journal of Medical Entomology, 28(5),
565-577.
Harshman, L. G., & Hoffmann, A. A. (2000). Laboratory selection experiments using
Drosophila: what do they really tell us? Trends in Ecology and Evolution, 15(1),
32-36.
Helrich, K. (1990). Association of Official Analytical Chemistry (11 ed.).

Hillesheim, E., & Stearns, S. C. (1992). Correlated responses in life-history traits to
artificial selection for body weight in Drosophila melanogaster. Evolution, 46(3),
745-752.
Hintz, H. F., Heitman, H., Weir, J. W. C., Torell, D. T., & Meyer, J. H. (1966). Nutritive
value of algae grown on sewage. Jaournal of Animal Science, 25, 675-681.
Hu, T., Len, C., & Lee, B. (1995). The laboratory rearing and radiation effects of gamma
ray on the pupae of Chrysomya megacephala (Fabricius). Chinese Journal of
Entomology, 15, 103–111.
Jason, B. B., Hugo, M. T., Andrew, P. A., & Richard, S. H. (2001). A genomic perspective
on membrane compartment organization. Nature, 409, 839-841.
Jauncey, K. (1982). The effects of varying dietary protein level on the growth, food
conversion, protein utilization and body composition of juvenile tilapias
(Sarotherodon mossambicus). Aquaculture, 27(1), 43-54.
Jennifer, M. L., Joseph, B. M., Steven, O. T., & Peter, G. G. W. (1998). Deconvolution of
the fluorescence emission spectrum of human antithrombin and identification of the
tryptophan residues that are responsive to heparin binding. The Journal of
Biological Chemistry, 273(36), 23283 - 23289.
Kamizake, N. K. K., Gonçalves, M. M., Zaia, C. T. B. V., & Zaia, D. A. M. (2003).
Determination of total proteins in cow milk powder samples: a comparative study
between the Kjeldahl method and spectrophotometric methods. Journal of Food
Composition and Analysis, 16(4), 507-516.
Kaufman, P. K., Enfield, F. D., & Comstock, R. E. (1977). Stabilizing selection for pupal
weight in Tribolium castaneum. Genetics, 87(2), 327-341.
Keller, R. P., & Neville, M. C. (1986). Determination of total protein in human milk:
Comparison of method. Clinical Chemistry, 32(1), 120-123.
Kerr, B. J., & Kidd, M. T. (1999). Amino acid supplementation of low-protein broiler diets:
2. Formulation on an ideal amino acid basis. Journal of Applied Poultry Research, 8,
310-320.
Kingsley, G. R. (1939). The determination of serum total protein, albumin, and globulin by
the biuret reaction. The Journal of Biological Chemistry, 131, 197-200.

Laemmli, U. K. (1970). Cleavage of structural proteis during the assembly of the head of
bacteriophage T4. Nature, 227, 680-685.
Lee, H. L., Krishnasamy, M., Abdullah, A., & Jeffery, J. (2004). Review of forensically
important entomological specimens in the period of 1972–2002. Tropical
biomedicine, 21(2), 69.
Li, P., Mai, K., Trushenski, J., & Wu, G. (2009). New developments in fish amino acid
nutrition: towards functional and environmentally oriented aquafeeds. Amino Acids,
37(1), 43-53.
Lichtenberg, D., Robson, R. J., & Dennis, E. A. (1983). Solubilization of phospholipids by
detergents structural and kinetic aspects. Biochimica et Biophysica Acta (BBA) -
Reviews on Biomembranes, 737(2), 285-304.
Litchfield, J. H. (1968). The production of fungi. In R. I. Mateles & S. R. Tannebaum
(Eds.), Single cell protein. London: M.I.T. Press.
Loh, T. C. (2002). Livestock production and the feed industry in Malaysia. Paper presented
at the Protein Sources for the Animal Feed Industry, Bangkok.
Lowry, O. H., Rosebrough, N. J., Farr, A. L., & Randall, R. J. (1951). Protein measurement
with the Folin Phenol reagent. Journal of Biological Chemistry, 193, 265-275.
Marley, B. (1998). Aquaculture: Realities and potentials when getting started SRAC
Publication (Vol. 441).
Matha, V., Xemec, V., & Sula, J. (1983). Changes in protein content and acid phosphatese
activity as a consequnce of various infections in the last instar larvae of Simulium
ornatum. Acta Entomologica Bohemoslovaca, 80, 332-335.
Maugle, P. D., & Fagan, J. M. (1993). Formulation feed for tilapia reared in recirculating
systems. Paper presented at the Proceedings of the International Conference on
Recirculating Aquaculture.
Millamena, O. M. (2002). Replacement of fish meal by animal by-product meals in a
practical diet for grow-out culture of grouper Epinephelus coioides. Aquaculture,
204(1–2), 75-84.
Moen, S., & Zhuikov, M. (Eds.). (2007). Genetic guidelines for fisheries management.
Duluth: Minnesota Sea Grant.
Naylor, R. L., Goldburg, R. J., Primavera, J. H., Kautsky, N., Beveridge, M. C. M., Clay, J.,
Folke, C., Lubchenco, J., Mooney, H., & Troell, M. (2000). Effect of aquaculture on
world fish supplies. Nature, 405(6790), 1017-1024.
Nelson, D. W., & Sommers, L. E. (1973). Determination of total nitrogen in plant materials.
Agronomy Journal, 65, 109-112.
Ng, W. K., Liew, F. L., Ang, L. P., & Wong, K. W. (2001). Potential of mealworm
(Tenebrio molitor) as an alternative protein source in practical diets for African
catfish, Clarias gariepinus. Aquaculture Research, 32, 273-280.
O'Mara, F. P., Mulligan, F. J., Cronin, E. J., Rath, M., & Caffrey, P. J. (1999). The nutritive
value of palm kernel meal measured in vivo and using rumen fluid and enzymatic
techniques. Livestock Production Science, 60(2-3), 305-316.
Ogunji, J., Summan Toor, R.-U.-A., Schulz, C., & Kloas, W. (2008). Growth performance,
Nutrient Utilization of Nile Tilapia Oreochromis niloticus fed housefly maggot meal
(Magmeal) Diets. Turkish Journal of Fisheries and Aquatic Sciences, 8, 141-147.
Ogunji, J. O., Nimptsch, J., Wiegand, C., & Schulz, C. (2007). Evaluation of the influence
of housefly maggot meal (magmeal) diets on catalase, glutathione S-transferase and
glycogen concentration in the liver of Oreochromis niloticus fingerling.
Comparative Biochemistry and Physiology, Part A, 147(4), 942-947.
Oyelese, O. A. (2007). Utilization of compounded ration and maggot in the diet of Clarias
gariepinus. Research Journal of Applied Sciences, 2(3), 301-306.
Pauly, D., Christensen, V., Dalsgaard, J., Froese, R., & Jr, F. T. (1998). Fishing down
marine webs. Science, 279, 860-863.
Reid, J. (1953). Notes on house-flies and blowflies in Malaya. Bulletin Institute for Medical
Research Kuala Lumpur, 7, 1-26.
Reigada, C., & Godoy, W. A. C. (2005). Seasonal fecundity and body size in Chrysomya
megacephala (Fabricius) (Diptera: Calliphoridae). Neotropical Entomology, 34,
163-168.

Richard, L., Surget, A., Rigolet, V., Kaushik, S. J., & Geurden, I. (2011). Availability of
essential amino acids, nutrient utilisation and growth in juvenile black tiger shrimp,
Penaeus monodon, following fishmeal replacement by plant protein. Aquaculture,
322–323, 109-116.
Santiago, C. B., & Lovell, R. T. (1988). Amino acid requirements for growth of Nile
Tilapia. The Journal of Nutrition, 118, 1540-1546.
Shacklady, C. A., & Gatumel, E. (1972). Safety in use and nutritional value of yeast grown
on alkenes. Paper presented at the Proc. II World Congress of Animal Feeding,
Madrid, Spain.
Silva, J. M. G., Espe, M., Conceição, L. E. C., Dias, J., Costas, B., & Valente, L. M. P.
(2010). Feed intake and growth performance of Senegalese sole (Solea senegalensis
Kaup, 1858) fed diets with partial replacement of fish meal with plant proteins.
Aquaculture Research, 41(9), 20-30.
Sing, K. W., Sofian-Azirun, M., & Tayyab, S. (2012). Protein analysis of of Chrysomya
megacephala maggot meal. Animal Nutrition and Feed Technology, 12, 35-46.
Siriwattanarungsee, S., Sukontason, K. L., Kuntalue, B., Piangjai, S., Olson, J. K., &
Sukontason, K. (2005). Morphology of the puparia of the housefly, Musca
domestica (Diptera: Muscidae) and blowfly Chrysomya megacephala (Diptera:
Calliphoridae). Parasitology Research, 96(3), 166-170.
Smith, K. G. V. (1986). A manual of forensic entomology. London: Cornell University
Press.
Snustad, D. P., & Simmons, M. J. (2010). Prinsiple of genetics. Hoboken: John Wiley &
Sons.
Spinell, J. (1978). Unconventional Feed Ingredients for Fish Feed.
http://www.fao.org/docrep/x5738e/x5738e0d.htm
Spradbery, J. P., & Schweizer, G. (1979). Ingestion of food by the adult screw-worm fly,
Chrysomya bezziana (Diptera, Calliphoridae). Entomologia Experimentalis et
Applicata, 25(1), 75-85.
SRAC. (1998). Dietary protein and lipid requirements of Golden Shines and Goldfish.
SRAC Publication.

Sudaryono, A., Tsvetnenko, E., Hutabarat, J., Supriharyono, & Evans, L. H. (1999). Lupin
ingredients in shrimp (Penaeus monodon) diets: influence of lupin species and types
of meals. Aquaculture, 171(1–2), 121-133.
Sukontason, K., Piangjai, S., Siriwattanarungsee, S., & Sukontason, K. (2008). Morphology
and developmental rate of blowflies Chrysomya megacephala and Chrysomya
rufifacies in Thailand: application in forensic entomology. Parasitology Research,
102(6), 1207-1216.
Tacon, A. G. J. (1998). Trends in global aquaculture and aquafeed production: 1984-1996
highlights. Paper presented at the Conference of Feed Manufacturers of the
Mediterranean, Reus, Spain.
Tacon, A. G. J., & Metian, M. (2008). Global overview on the use of fish meal and fish oil
in industrially compounded aquafeeds: Trends and future prospects. Aquaculture,
285(1–4), 146-158.
Tidwell, J. H., & Allan, G. L. (2001). Fish as food: aquaculture's contribution. Ecological
and economic impacts and contributions of fish and capture fisheries. EMBO report,
2(11), 958-963.
Tsugita, A., & Scheffler, J.-J. (1982). A Rapid Method for Acid Hydrolysis of Protein with
a Mixture of Trifluoroacetic Acid and Hydrochloric Acid. European Journal of
Biochemistry, 124(3), 585-588.
Walker, J. M. (2002). The protein protocols handbook: Humana Press.
Walsh, G. (2004). Protein Biochemistry and Biotechnology. London: John Wiley & Sons
Ltd.
Warburg, O., & Christian, W. (1942). Isolierung and kristallisation des garungsferments
enolase. Biochemische Zeitschrift, 310, 384-421.
Watanabe, T. (2002). Strategies for further development of aquatic feeds. Fisheries Science,
68(2), 242-252.
Watanabe, W. O., Losordo, T. M., Fitzsimmons, K., & Hanley, F. (2002). Tilapia
Production Systems in the Americas: Technological Advances, Trends, and
Challenges. Reviews in Fisheries Science, 10(3-4), 465-498.
Watanabe, W. O., Wicklund, R. I., Olla, B. I., & Head, W. D. (1997). Saltwater culture of
the Florida red and other saline tolerant tilapias: a review. In A. B. Costa-Pierce & J.
E. Rakocy (Eds.), Tilapia Aquaculture in the Americans. (Vol. 1, pp. 54-141).
Baton Rouge, Louisiana: World Aquaculture Society.
Wei, Y. J., Li, K. A., & Tong, S. Y. (1997). A linear regression method for the study of the
Coomassie brilliant blue protein assay. Talanta, 44(5), 923-930.
Yen, A. L. (2009). Edible insects: Traditional knowledge or western phobia?
Entomological Research, 39(5), 289-298.
Yoshida, M. (1975). Yeast grown on n-paraffin as future poultry feed. World's Poultry
Science Journal, 31, 221-234.
Zaia, D. A. M., Verri Jr, W. A.., & Zaia, C. T. B. V. (2000). Determination of total proteins
in several tissues of rat: a comparative study among spectrophotometric methods.
Microchemical Journal, 64(3), 235-239.
Zuidhof, M. J., Molnar, C. L., Morley, F. M., Wray, T. L., Robinson, F. E., Khan, B. A.,
Al-Ani, L., & Goonewardene, L. A. (2003). Nutritive value of house fly (Musca
domestica) larvae as a feed supplement for turkey poults. Animal Feed Science and
Technology, 105(1-4), 225-230.
Zumpt, F. (1965). Myiasis in man and animals in the Old World: a textbook for physicians,
veternarians and zoologists. London: Butterworth.

LIST OF PUBLICATION AND PRESENTATION
1. Sing, K. W., Sofian-Azirun., M. and S. Tayyab. (2012). Protein analysis of
Chrysomya megacephala maggot meal. Animal Nutrition and Feed Technology 12:
35-46.
2. Sing, K. W., Salleh, K. M., Tayyab, S. and Sofian-Azirun. M. (2012). Chrysomya
megacephala (Fabricus) maggot meal as an alternative protein in red tilapia
(Oreochromis sp.) feed. Presented orally at the 48th
Annual Scientific Conference of
The Malaysia Society of Parasitology and Tropical Medicine.
3. Sing, K. W., M. Sofian-Azirun and S. Tayyab. (2011). Chrysomya megacephala
(Calliphoridae) maggot meal as an alternative protein in feed industry. Paper
presented at the 16th
Biological Sciences Graduate Congress.
4. Sing, K. W. and Sofian-Azirun, M. (2011). The potential of fly maggot-derived
meal as an alternative protein in feed industry. Paper presented at the Universiti
Malaysia Terengganu 10th
International Annual Symposium.
5. Sing, K. W., Nor Shariza, Sofian-Azirun, M., and Tayyab, S. (2010). Protein
Content in Chrysomya megacephala Maggot Meal: Methods Revisited. Paper
presented at the 15th
Biological Sciences Graduate Congress.