preliminary design and modelling of a gas-fired...
TRANSCRIPT

Klimanek, A., et al.: Preliminary Design and Modelling of a Gas-Fired … THERMAL SCIENCE: Year 2016, Vol. 20, No. 4, pp. 1233-1244 1233
PRELIMINARY DESIGN AND MODELLING OF A GAS-FIRED
THERMOELECTRIC GENERATOR
by
Adam KLIMANEK a
, Wojciech J. KOSTOWSKI a*
, Grzegorz BURDA a
,
Pawel BARGIEL a
, Andrzej SZLEK a
, and Krzysztof GORNY b
a Institute of Thermal Technology, Silesian University of Technology, Gliwice, Poland b Gascontrol Polska sp. z o.o., Suszec, Poland Original scientific paper
DOI: 10.2298/TSCI151128110K
The paper discusses modelling of coupled heat transfer and electricity generation in a thermoelectric generator designed for reliable island-mode power supply. The considered generator is a new concept of a low power supply (50 W) whose aim is to provide electricity for remote gas pressure reduction stations with the purpose to maintain the control and automation equipment. This equipment con-tributes to the system safety and minimizes the risk of unintended methane emis-sions. The thermoelectric generator is designed for reliable and maintenance- -free operation and power supply. Natural gas is burned in a partially premixed burner and the flue gas heats the hot side of the thermoelectric generator. The combustion air cools the cold side of the thermoelectric generator, providing the temperature difference required for electricity generation occurring based on the Seebeck effect. The flow of air and flue gas through the system is driven by chim-ney draft. The developed model couples the heat transfer on the hot and the cold side, as well as the generation of electrical energy inside the thermoelectric mod-ules. The model takes into account convection and conduction in the gas flow conduits and in finned heat exchangers of the cold and hot sides. The analysis demonstrates the relevance of design and operational parameters on the bounda-ry temperatures of the thermoelectric modules. The obtained results will be used in further (ongoing) phase leading to the design and construction of a prototype electricity generator dedicated for island-mode supply.
Key words: thermoelectric generator, heat transfer, numerical modelling, pressure letdown stations
Introduction
Natural gas (NG) is one of the world’s key energy resources, contributing to 23.7%
of the global primary energy consumption in 2014 [1]. Due to large distances between the
regions of extraction and consumption, there is a need of an extensive transportation infra-
structure comprising high-pressure transmission pipelines, and distribution pipelines operated
at several pressure levels, used to supply the gas to final consumers. The total length of distri-
bution pipelines is by about one order of magnitude higher than that of the transmission pipe-
lines (for example, in Poland these lengths are 160,000 km vs. 10,000 km).
Levels of pressure used for NG distribution depend on national regulations, in the
case of Poland typical values set at the source point of each level are: 800-1,000 kPa (inter-
mediate), 280 kPa (medium) and 2.5 kPa (low pressure). Pressure reduction (regulation) be-
–––––––––––– * Corresponding author; e-mail: [email protected]

Klimanek, A., et al.: Preliminary Design and Modelling of a Gas-Fired … 1234 THERMAL SCIENCE: Year 2016, Vol. 20, No. 4, pp. 1233-1244 tween various levels is carried out in pressure letdown stations (PLS, also called pressure
reduction stations); the number of PLS in Poland is about 3,500.
Transportation of natural gas involves some losses of the transported medium. As
demonstrated by Stanek and Bialecki [2], the level of leakage equal to 4.2% would offset the
environmental benefits of natural gas compared to hard coal. Hence, it is essential to constant-
ly enhance the quality of gas transmission and distribution in order to minimize possible loss-
es.
Unfortunately, losses from distribution networks are more complex to quantify than
those from the transmission pipelines. This is due to the following factors:
– higher length of network,
– topological complexity of the network (number of nodes),
– limited number of gas flow metering systems,
– limited coverage of the existing SCADA systems,
– smaller size and impact of individual leakages, and
– lack of information exchange platforms (such as GIE [3] and EGIG [4] for transmission
pipelines).
For distribution networks, the main points of metering are the PLS, typically sup-
plied with a gas flow meter and a volume corrector (or a flow computer). In many cases
(about 1/3 of PLS in Poland), the PLS is not supplied with electric energy for economic rea-
sons. Such unplugged PLS can correctly operate in the gas distribution system, and can store
the measurement data in a local, battery-operated volume corrector. However, it is not possi-
ble to include the PLS into the operator’s supervisory control and data acquisition (SCADA)
system, which allows monitoring and controlling the gas flow and detecting possible losses.
There are two failure scenarios including natural gas emission, which remain unde-
tectable for this class of objects:
– medium-size network failure; the leakage flow rate does not exceed the PLS capacity; the
PLS operates correctly yet the flow rate is much higher than normally; (small-size leak-
ages remain undetectable even under SCADA supervision, large-size failures exceeding
the PLS capacity entail a strong pressure drop in the network which closes the PLS slam-
shut valves), and
– failure in the PLS pressure regulators or auxiliary devices causing the safety blow-off
valves to release gas to the atmosphere.
If the PLS were supplied with electrical energy and connected to the SCADA sys-
tem, the operator would be able to detect the failure observing a rapid change in NG parame-
ters (flow and pressure).
For this reason, operators of distribution networks search for island-mode supply op-
tions for the PLS objects. Available solutions comprise:
– photovoltaic (PV) panels; this solution uses renewable energy, however, the drawback of
this option is poor performance in winter period (short and poor insolation); additionally,
snow fall may totally cover the panel causing downtime in power supply; the reliability of
power supply is vital especially during that winter period as it is characterized by in-
creased natural gas demand; while some PLS operate throughout the whole year, those
remaining, which operate for part of the year, operate during winter season; also, the popu-
larity of PV panels makes this option subject to thefts in remote, unsupervised locations;
also, possible integration options combining PV with wind energy and diesel generator are
available [5], yet these options exceed the scale of demand studied here,
Klimanek, A., et al.: Preliminary Design and Modelling of a Gas-Fired … THERMAL SCIENCE: Year 2016, Vol. 20, No. 4, pp. 1233-1244 1235 – gas expanders [6]; this solution uses the exergy available in the pressurized gas; however,
the available solutions are designed to produce electricity by exporting it to the public
grid, and
– thermoelectric generators fired with natural gas available on-site; the solution is the sub-
ject of the research presented in this paper.
Thermoelectric generators (TEG) are based on the Seebeck effect, where two differ-
ent materials whose ends are placed in sources of different temperatures, provide a different
current response to the temperature gradient, creating a current loop. The Seebeck effect is
usually utilized for temperature or heat flux measurements [7]. However, it is also possible to
apply the effect for power generation. In energy engineering, TEG are usually considered as
an option for low-grade heat recovery [8]. In the studied case, the TEG is integrated with a
heat source generated intentionally, using a small share of chemical energy transported as
natural gas.
Preliminary design and considerations
Estimation of the required electric output
The main objective of the designed TEG device is to provide autonomous power
supply in order to include the PLS object into the operator’s SCADA system (telemetry). In
small PLS objects not integrated with the SCADA system, the metering line consists of:
(1) a turbine or rotary type volumetric gas meter, and
(2) a battery-supplied volume corrector with a built-in pressure sensor and an integrated RTD
temperature transmitter.
The battery-supplied volume correctors convert the signals of volumetric increment
(V), pressure (p) and temperature (T) into short-time quantities of normalized gas volume
(Vn at 101.325 kPa, 0 C), and provide an integration of these quantities over time. The vol-
ume correctors are installed directly at the metering line, within the 2nd
explosion-hazard area
of the metering station. The measured data and the resulting metering information are stored
in the device’s memory and can be accessed locally by connecting to a PC, tablet or a
smartphone.
In order to integrate a PLS into the SCADA system, the metering chain should be
extended to:
(1) a turbine or rotary type volumetric gas meter (no changes required if old objects are
adapted),
(2) a separate pressure and temperature transducers (installed within the explosion-hazard
area),
(3) a flowcomputer supplied from 230 V mains, installed beyond the explosion-hazard area,
and
(4) a communication modem with a dedicated transmission interface.
The flowcomputer represents an extended version of a battery-supplied volume cor-
rector. This class of devices is equipped with additional inputs and control outputs, enabling
one to monitor multiple gas meters, and to provide digital output information for the SCADA
system. The last element of the chain is a modem providing communication in one of the
chosen data protocols (TCP/IP, UDP, FTP).
Power input for the described system can be evaluated based on the devices offered
by the company PLUM (Bialystok, Poland [9]), applied in the majority of PLS in Poland.
Accordingly, the required input is:

Klimanek, A., et al.: Preliminary Design and Modelling of a Gas-Fired … 1236 THERMAL SCIENCE: Year 2016, Vol. 20, No. 4, pp. 1233-1244 – 30 W for the flowcomputer type MacMAT IIIE, and
– 1.2 W for the communication modem type IK-301 3,5 G.
Due to the possible increment of input power requirements in future applications,
the power output of the proposed TEG device has been assumed at the level of 50 W.
In some cases, the TEG device may be also used to provide power for an injection-
type odorising equipment. Here, the range of the required power may vary depending on the
type of equipment. The odorising equipment offered by Gascontrol Polska (OSGC-03) re-
quires 50 W power input, accordingly the proposed TEG output power for this cases should
yield 100 W.
Finally, it has been assumed that the prototype should be designed in two versions
(1) Basic, 50 W electric output, and
(2) Extended, 100 W electric output.
Preliminary design of the device
The TEG in design combines the functions of a combustion chamber and two heat
exchangers. The hot side heat exchanger is designed to transfer heat from the hot products of
combustion into the hot side of thermoelectric (TE) modules. The cold side heat exchanger
should receive the heat flux from the cold side of TE modules, and reject it into a cold heat
sink.
Preliminary calculations demonstrate that the cold side heat exchanger placed in the
ambient air is not able to effectively dissipate the heat flux from the TE modules. This entails
that the temperature difference across the TE module is very low, and the generated electric
power drops to nearly zero.
Hence, it is required to increase the intensity of cooling by placing the cold-side heat
exchanger into a cold agent with a sufficiently high convective heat transfer coefficient. The
available solutions comprise: forced convection (fan), using a liquid or intensifying the natu-
ral convection. Using a fan is not desired since it would consume a significant part of the
generated electricity, moreover, it would strongly decrease the reliability of the device which
is intended to operate without constant supervision. Using a liquid complicates the construc-
tion of the device and is currently not considered. Therefore, it was proposed to intensify the
convection by means of a chimney draft available in the device.
The proposed solution uses the flux of air supplied to the burner for cooling the
cold-side of the generator. Following the combustion of fuel (in the designed case: natural
gas) in the burner, how flue gases leaving the combustion zone flow over the hot-side of the
generator. Once the flue gases are cooled in this zone, they are discharged to the environment
through an exhaust channel (chimney). The chimney draft is driving the process, and causes
movement of both hot flue gases and cold atmospheric air entering the device.
The flow of the cold and the hot agents at both sides of the TEG can be arranged as
co-current or counter-current, which affects the temperature distribution in the heat exchanger
(fig. 1). Curves in fig. 1 represent the expected (not yet calculated) distribution based on basic
heat exchanger characteristics found in heat transfer handbooks [10].
As it can be seen in fig. 1, a co-current arrangement is bound to a large temperature
difference at the channel head, and the difference drops towards the tail end of the channels.
The advantage of this arrangement is a relatively stable temperature profile at the TE module
(more exactly, at its hot and cold side). For the purpose of preliminary modelling, it is as-
sumed that the TE modules form a continuous layer.

Klimanek, A., et al.: Preliminary Design and Modelling of a Gas-Fired … THERMAL SCIENCE: Year 2016, Vol. 20, No. 4, pp. 1233-1244 1237
The counter-current flow ar-
rangement is related to a mo-
notonous (falling) temperature
distribution across the channels
and it provides a higher mean
temperature difference. Howev-
er, the temperature profile in the
TE zone is more variable.
Possible technical arrange-
ments of the co-current and
counter-current flow are pre-
sented in fig. 2. It can be seen
that the counter-current flow
can be obtained using a simpler
(less complex) design of the
equipment. Air supplied to the
devices passes below the cold
side of the TE modules, and receives heat from the modules. Pre-heated air is then supplied to
the burner, where combustion takes place. Hot combustion products flow over the thermoe-
lectric modules. In order to intensify the heat transfer from the modules to the cold air, rec-
tangular fins are placed in the inlet air channel (yellow-marked area in fig. 2).
Figure 2. A possible counter-current (left) and co-current (right) flow arrangement
In the case of the co-current flow, it is nec-
essary to combine the zone of cold-inlet air
with the zone of hot exhaust gases directly
downstream of the burner. This is technically
complex, since it requires using an additional
(thermally idle) channel for air, since the pre-
heated air is located far away from the burner.
For the present preliminary model, the coun-
ter-current flow arrangement is assumed. In
fig. 3 a more detailed schematic diagram of this
arrangement is presented. In the first step, only
the mean temperature values across the channel
length are considered, in order to determine ba-
sic factors influencing the temperature distribution across the wall (between the hot and the
cold side).
Figure 1. Expected temperature distribution in the designed
device in the case of co-current (left) and counter-current (right) flow arrangements. TE modules form a continuous layer
Figure 3. Schematic diagram of the considered counter-current flow arrangement

Klimanek, A., et al.: Preliminary Design and Modelling of a Gas-Fired … 1238 THERMAL SCIENCE: Year 2016, Vol. 20, No. 4, pp. 1233-1244 It should be repeated, that the heat transfer at the cold side is intensified be fins. It is
expected that the fins equalize the temperature distribution along the flow channels, such that
for the preliminary model, a uniform temperature distribution is assumed.
On the contrary, at the hot side of the generator, heat transfer should be limited in
order to maintain the temperature at the hot side of the generator above the technological
limit. For the considered type of the module, this limit equals 320 C. In order to protect the
module from excessive temperature, thermal insulation is installed between the hot exhaust
gas and the thermoelectric modules.
Model equations
Heat transfer from the hot to the cold side of the generator comprises:
– convection from the flue gas to the hot side walls of the device,
– conduction through an insulation layer,
– heat transfer through a thermoelectric module with generation of electricity, and
– convection from the finned cold side walls to the cooling air.
Heat transfer at the hot side eq. (1) of the generator is calculated from the convection
heat transfer coefficient directly integrated over the wall surface:
w11111 TThAQ (1)
Heat transfer at the cold side eq. (2) of the device equals the heat transfer rate at the
hot side reduced by the generated flux of electric energy:
NQQ 12 (2)
On the other hand, the heat transfer rate at the cold side results from the local heat
transfer conditions. For a finned surface, the total rate is composed of the heat transfer from
the fins and from the space between them [10]:
2w222B2w222F2 tanh TThAmLmTTknAQ (3)
where n is the number of fins, A2F is the cross section area of a single fin, k2 is the fin’s mate-
rial thermal conductivity, L is the fin’s height (from the base), A2B is the wall surface between
the fins, and m is the fin parameter defined as:
yk
hm
2
22 (4)
where y is the thickness of the fin.
The convection heat transfer coefficients h1 and h2 have been determined from the
following empirical formulae [10]:
2,300Re ifPrRe 0.021
2,300Re ifGrPrPe0.74Nu
t
0.430.8
lt
0.10.2
(5)
where ε1 is a correction factor for the channel starting section, and εt is a factor accounting for
the difference between the fluid properties for the wall w and the mean boundary layer tem-
perature f:

Klimanek, A., et al.: Preliminary Design and Modelling of a Gas-Fired … THERMAL SCIENCE: Year 2016, Vol. 20, No. 4, pp. 1233-1244 1239
0.25
wft PrPr / (6)
Due to the limitations of the hot side temperature of TE modules, a thermal insula-
tion has been applied to protect the modules against excessive temperature. Provided that the
heat flux density at the hot side is given by eq. (1), it can be written:
1
11
A
(7)
and the temperature at the hot side of the TE modules can be found from the condition:
iw11w1TE1 RRqTT (8)
where Rw1 and Ri are the thermal resistances of the channel wall and the insulation, calculated
as the quotient of the corresponding thickness and conductivity:
i
ii
kR
(9)
Heat transfer calculations for the layer including the thermoelectric modules is based
on the following assumptions:
– TE modules cover the entire space between the insulation and the outer (cold-side) wall of
the device,
– electrical energy generated in the modules is small compared with the heat transfer rate;
this means that the results of the heat transfer model determine the electric power, but the
electric power has a negligible impact on the heat transfer model; this assumption is done
for the first iteration, and is then corrected in subsequent iterations, as described in section
Solution algorithm, and
– there are no heat losses in the heat transfer through the TE modules.
Knowing the thermal conductivity of the TE module and the corresponding thermal
resistance RTE it is possible to obtain the cold side temperature:
TE1TE1TE2 RqTT (10)
Once the cold-side temperature TTE2 is known, it is possible to obtain the power gen-
erated by the modules. The estimation of TE power output is done based on characteristic
curves provided by the manufacturer [11] and approximated by the following functions:
otherwiseΔΔΔΔ
C250 ifΔ4
4
3
3
2
21
TE14TE234TE2210
TbTbTbTb
aaTaaaaN
(11a-b)
where has to be given in °C, and T is the temperature difference across the TE module
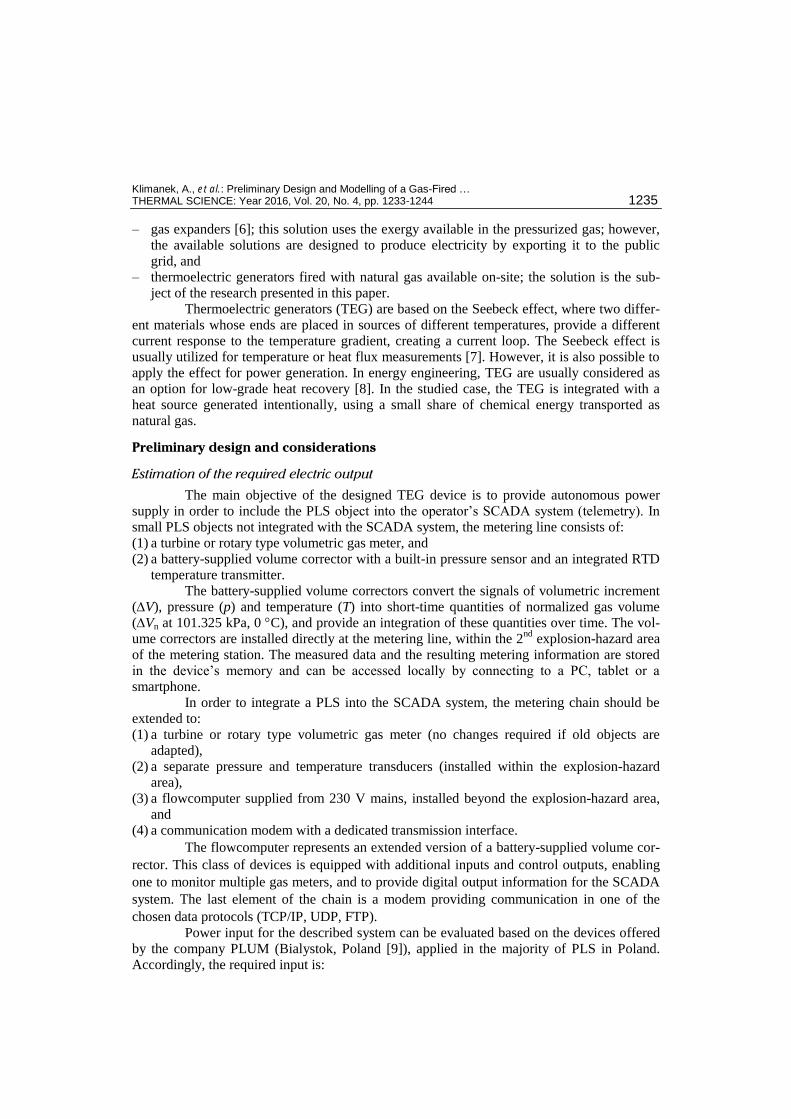
(T = TTE1 – TTE2). Original characteristic curves are presented in fig. 4, and the values of the
approximation function coefficients are given in tab. 1.
It should be underlined that the manufacturer indicates the TE output for TTE1 in the
range (50 °C-300 °C) and TTE2 in the range (25 °C-100 °C). In order to make the model con-
tinuous outside this range the data is extrapolated. If the temperature of the hot side of the ge-
nerator TTE1 exceeds the value of 100 °C, the extrapolation is done by eq. (11a). If the temper-
ature of the cold side of the generator exceeds 100 °C, extrapolation is done by the following
linear interpolation:
Klimanek, A., et al.: Preliminary Design and Modelling of a Gas-Fired … 1240 THERMAL SCIENCE: Year 2016, Vol. 20, No. 4, pp. 1233-1244
100
1001C100
1TE
TE2TE1
,NN
(11c)
which yields 0 if both temperatures are equal.
Finally, the efficiency of the generation is
calculated by comparing the power output with
the heat transfer rate supplied to the hot side of
the device:
1TE
TEqA
N
(12)
Solution algorithm
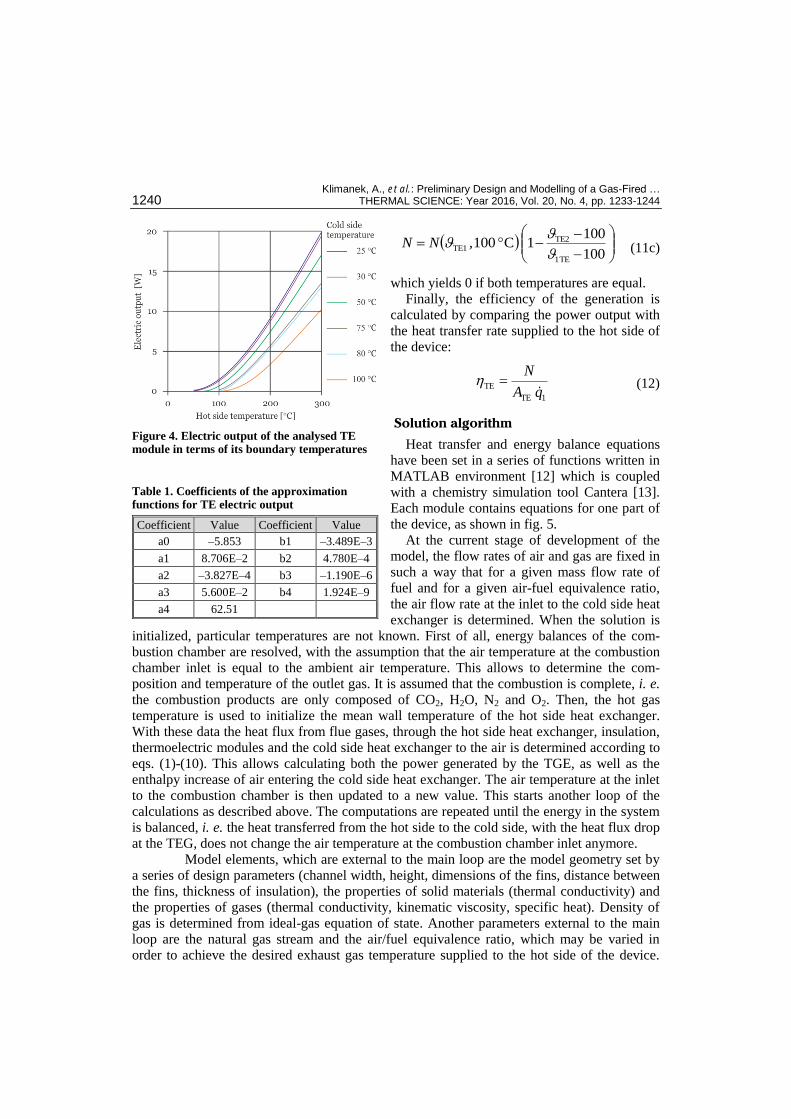
Heat transfer and energy balance equations
have been set in a series of functions written in
MATLAB environment [12] which is coupled
with a chemistry simulation tool Cantera [13].
Each module contains equations for one part of
the device, as shown in fig. 5.
At the current stage of development of the
model, the flow rates of air and gas are fixed in
such a way that for a given mass flow rate of
fuel and for a given air-fuel equivalence ratio,
the air flow rate at the inlet to the cold side heat
exchanger is determined. When the solution is
initialized, particular temperatures are not known. First of all, energy balances of the com-
bustion chamber are resolved, with the assumption that the air temperature at the combustion
chamber inlet is equal to the ambient air temperature. This allows to determine the com-
position and temperature of the outlet gas. It is assumed that the combustion is complete, i. e. the combustion products are only composed of CO2, H2O, N2 and O2. Then, the hot gas
temperature is used to initialize the mean wall temperature of the hot side heat exchanger.
With these data the heat flux from flue gases, through the hot side heat exchanger, insulation,
thermoelectric modules and the cold side heat exchanger to the air is determined according to
eqs. (1)-(10). This allows calculating both the power generated by the TGE, as well as the
enthalpy increase of air entering the cold side heat exchanger. The air temperature at the inlet
to the combustion chamber is then updated to a new value. This starts another loop of the
calculations as described above. The computations are repeated until the energy in the system
is balanced, i. e. the heat transferred from the hot side to the cold side, with the heat flux drop
at the TEG, does not change the air temperature at the combustion chamber inlet anymore.
Model elements, which are external to the main loop are the model geometry set by
a series of design parameters (channel width, height, dimensions of the fins, distance between
the fins, thickness of insulation), the properties of solid materials (thermal conductivity) and
the properties of gases (thermal conductivity, kinematic viscosity, specific heat). Density of
gas is determined from ideal-gas equation of state. Another parameters external to the main
loop are the natural gas stream and the air/fuel equivalence ratio, which may be varied in
order to achieve the desired exhaust gas temperature supplied to the hot side of the device.
Figure 4. Electric output of the analysed TE module in terms of its boundary temperatures
Table 1. Coefficients of the approximation functions for TE electric output
Coefficient Value Coefficient Value
a0 –5.853 b1 –3.489E–3
a1 8.706E–2 b2 4.780E–4
a2 –3.827E–4 b3 –1.190E–6
a3 5.600E–2 b4 1.924E–9
a4 62.51
Klimanek, A., et al.: Preliminary Design and Modelling of a Gas-Fired … THERMAL SCIENCE: Year 2016, Vol. 20, No. 4, pp. 1233-1244 1241 Particular care has been taken to accurately represent the properties of gases (air and flue gas)
which are required at many stages of the computations. The properties are calculated by
means of the Cantera software.
Figure 5. Outlay of the solution algorithm for heat transfer and energy balance
The function thermoelectric modules contains the characteristic curves of the
modules and additional logical conditions which issue several types of warnings (flags) if:
– one or both temperatures are out of the allowed range,
– one or both temperatures are beyond the design range, in this case the power output is
extrapolated and can not be guarranted, and
– the cold-side temperature is above the hot-side temperature (if so, power is set to zero).
Results and discussion
Since the objective of operation of the TEG in-design is to provide electric output, it
is essential to find the boundary temperatures at the hot and the cold side of the thermoelectric
modules, which are hidden inside the device.
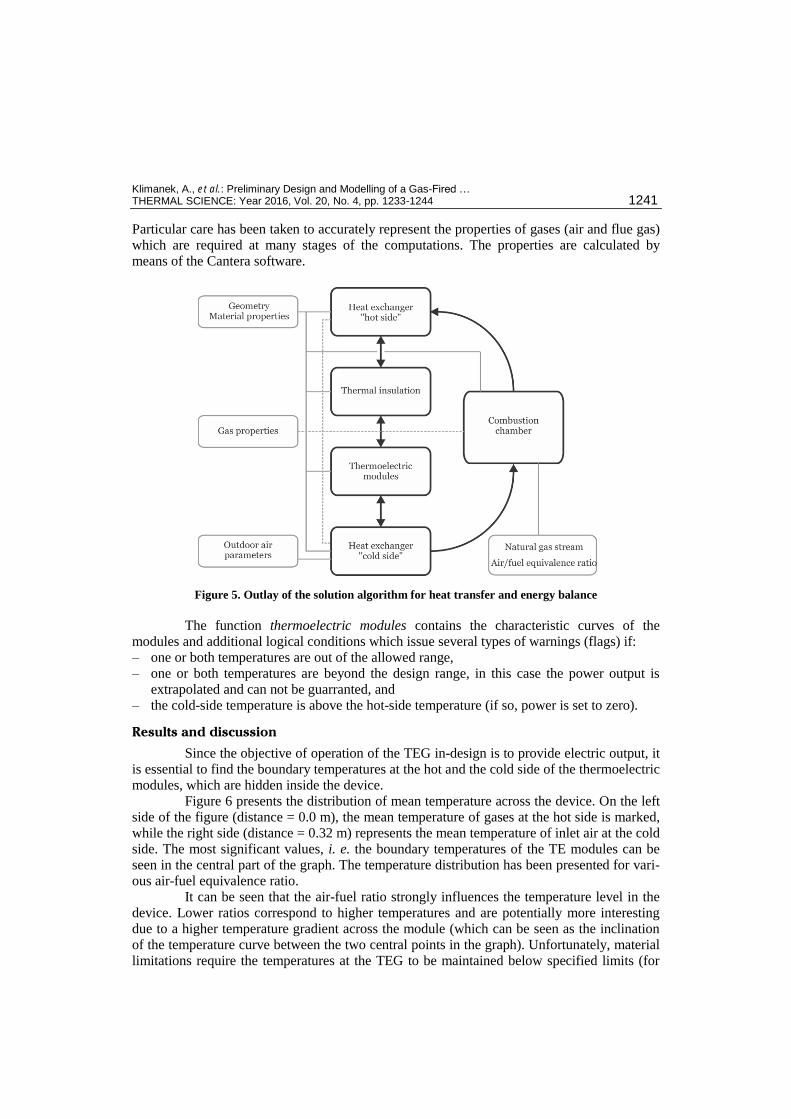
Figure 6 presents the distribution of mean temperature across the device. On the left
side of the figure (distance = 0.0 m), the mean temperature of gases at the hot side is marked,
while the right side (distance = 0.32 m) represents the mean temperature of inlet air at the cold
side. The most significant values, i. e. the boundary temperatures of the TE modules can be
seen in the central part of the graph. The temperature distribution has been presented for vari-
ous air-fuel equivalence ratio.
It can be seen that the air-fuel ratio strongly influences the temperature level in the
device. Lower ratios correspond to higher temperatures and are potentially more interesting
due to a higher temperature gradient across the module (which can be seen as the inclination
of the temperature curve between the two central points in the graph). Unfortunately, material
limitations require the temperatures at the TEG to be maintained below specified limits (for
Klimanek, A., et al.: Preliminary Design and Modelling of a Gas-Fired … 1242 THERMAL SCIENCE: Year 2016, Vol. 20, No. 4, pp. 1233-1244 the studied case, 320 C at the hot side and 180 C at the cold side). Accordingly, higher air-
fuel ratios are needed to ‘dilute’ the exhaust gases.
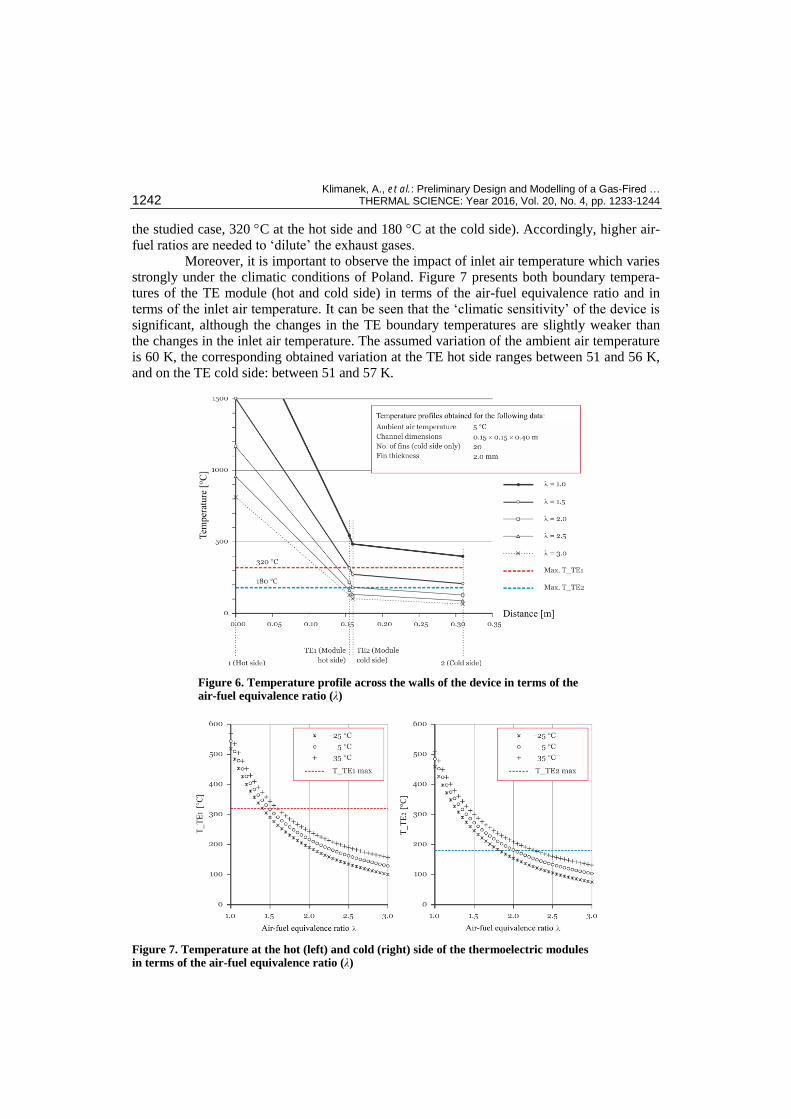
Moreover, it is important to observe the impact of inlet air temperature which varies
strongly under the climatic conditions of Poland. Figure 7 presents both boundary tempera-
tures of the TE module (hot and cold side) in terms of the air-fuel equivalence ratio and in
terms of the inlet air temperature. It can be seen that the ‘climatic sensitivity’ of the device is
significant, although the changes in the TE boundary temperatures are slightly weaker than
the changes in the inlet air temperature. The assumed variation of the ambient air temperature
is 60 K, the corresponding obtained variation at the TE hot side ranges between 51 and 56 K,
and on the TE cold side: between 51 and 57 K.
Figure 6. Temperature profile across the walls of the device in terms of the air-fuel equivalence ratio (λ)
Figure 7. Temperature at the hot (left) and cold (right) side of the thermoelectric modules in terms of the air-fuel equivalence ratio (λ)

Klimanek, A., et al.: Preliminary Design and Modelling of a Gas-Fired … THERMAL SCIENCE: Year 2016, Vol. 20, No. 4, pp. 1233-1244 1243
Also, as shown in tab. 2, a higher number of fins provides a more favorable tempera-
ture distribution across the device, since the temperature gradient across the TE module
slightly increases, and the temperature level in the TE zone decreases.
However, it can be seen that for
all studied parameters, the tem-
perature drop across the module is
below 50 K which corresponds to
low power output according to the
manufacturer’s data. It can be su-
pposed that higher temperature
drops, claimed by the manufac-
turer, were obtained only during a
limited period of time, until the
cold side of the module reached
its target temperature due to heat conduction across the thin semiconductor layer.
Conclusions
According to background information collected prior to the realization of the pro-
ject, the main problem in the design of thermoelectricity generators is the effective cooling at
the cold side of the modules. This fact has been confirmed by the preliminary model present-
ed herewith.
Due to the insufficient heat transfer rate at the TEG cold side, the temperature drop
across the module (and accordingly, the generated power output) is lower than desired from
the point of view of TEG characteristic curve. It may be concluded that natural convection
sets a remarkable limitation here. However, an optimization procedure comprising both the
operating principle and design parameters (in particular, dimensions) can significantly im-
prove the performance of the device.
Another problem observed is the excessive temperature level in the TEG zone. In
order to maintain the TEG boundary temperatures (especially, the hot side temperature) with-
in material-related limitations, it is required to reduce the source temperature, which is possi-
ble either by applying thermal insulation between the hot exhaust gases and the TE zone, or
by reducing the temperature of hot gases by increasing the air-fuel equivalence ratio. Both
options are related to exergy losses, and the latter option directly entails a loss of energy effi-
ciency similarly like for the gas turbines. Higher allowable temperatures can be achieved if
very expensive materials are used for the TEG.
The preliminary study presented here provides a first view on the system’s perfor-
mance and illustrates difficulties which have to be addressed in the design process. Further
work, leading to an optimum design of the device is currently continued by means of CFD
modelling along with a series of experimental tests, and the results will be presented in the
nearest future.
Acknowledgment
The work has been carried out within the project A Seebeck-effect based thermoelec-tric generator for autonomous power supply of metering stations, Grant No. GEKON1/
02/214051/6/2014, supported by the National Centre of Research and Development and by
the National Fund of Environmental Projection and Water Management of Poland.
Table 2. Temperature profile: sensitivity to the
number fins (n) at the cold side. Data obtained for the air-fuel equivalence ratio of 2.0
Point Temperature [C] Change [K]
n = 20 (reference) n = 40
1. Hot side (flue gas) 1,168.2 1,170.6 +2.4
TE1: TE hot side 217.1 198.8 –18.3
TE2: TE hot side 181.9 162.8 –19.0
2. Cold side (air) 129.3 132.2 +3.0

Klimanek, A., et al.: Preliminary Design and Modelling of a Gas-Fired … 1244 THERMAL SCIENCE: Year 2016, Vol. 20, No. 4, pp. 1233-1244 Nomenclature
A surface area, [m2] a thermal diffusivity, [m2s−1] Gr Grashof number (= gβΔTL3/ν2), [‒] g gravitational acceleration, [ms−2] h convection heat transfer coefficient,
[Wm–2K–1] k thermal conductivity, [Wm–1K–1] L characteristic length, [m] m fin performance parameter, [m–1] N electric power, [W] Nu Nusselt number (= hL/k), [‒] Pe Péclet number (= uL/a), [‒] Pr Prandtl number (=ν/a), [‒]
Q heat transfer rate, [W]
q heat flux, [Wm–2] R thermal resistance, [m2KW–1] Re Reynold number (= uL/ν), [‒] T temperature, [K] ΔT wall-bulk fluid temperature difference,
[K]
u flow velocity, [ms−1] y fin thickness, [m]
Greek symbols
thermal expansion coefficient, [K−1] layer thickness, [m] l correction factor: starting section t correction factor: boundary layer efficiency temperature, [°C] air-fuel equivalence ratio ν kinematic viscosity, [m2s−1]
Subscripts
f mean parameters of the boundary layer TE thermoelectric module w wall 1 hot side 2 cold side
References
[1] ***, BP Statistical Review of World Energy 2014, http://www.bp.com/statisticalreview [2] Stanek, W., Bialecki, R., Can Natural Gas Warm the Climate More than Coal?, Fuel, 136 (2014), Nov.,
pp. 341-348 [3] ***, Gas Infrastructure Europe, Information Exchange Platform, http://www.gie.eu [4] ***, European Gas Pipeline Incident Data Group, http://www.egig.eu [5] Katti, P. K., Khedkar, M. K., Alternative Energy Facilities Based on Site Matching and Generation Unit
Sizing for Remote Area Power Supply, Renewable Energy, 32 (2007), 8, pp. 1346-1362 [6] Kostowski, W., The Possibility of Energy Generation Within the Conventional Natural Gas Transport
System, Strojarstvo, 52 (2010), 4, pp. 429-440 [7] Sippawit, N., Leephakpreeda, T., A Study of Sensing Heat Flow through Thermal Walls by Using
Thermoelectric Module, Thermal Science, 19 (2014), 5, pp. 1497-1505 [8] Xiao, H., et al., Detailed Modeling and Irreversible Transfer Process Analysis of a Multi-element Ther-
moelectric Generator System, Journal of Electronic Materials, 40 (2011), 5, pp. 1195-1201 [9] ***, Manufacturer’s Website, http://www.plum.pl [10] Kostowski, E., Heat transfer, Silesian University of Technology Publishing House (in Polish), Gliwice,
Poland, 2006 [11] ***, Manufacturer’s Website, http://www.customthermoelectric.com [12] ***, MATLAB, version 7.9.0.529 (R2009b), The MathWorks Inc., Natick, Massachusetts, 2009 [13] ***, Cantera, Software provider’s website, http://www.cantera.org
Paper submitted: November 28, 2015 Paper revised: March 24, 2016 Paper accepted: April 6, 2016