preliminary feasibility study - · pdf filepreliminary feasibility study on the palm oil mill...
TRANSCRIPT
Preliminary Feasibility Study on
The Palm Oil Mill Wastes-fired Power Generation Systems
and CDM Project
for Rural Electrification in Sumatra, Indonesia
Study Report
March 2009
Engineering and Consulting Firms Association, Japan
NTT GP-ECO communication, Inc.
This work was subsidized by Japan Keirin Association through its Promotion funds form

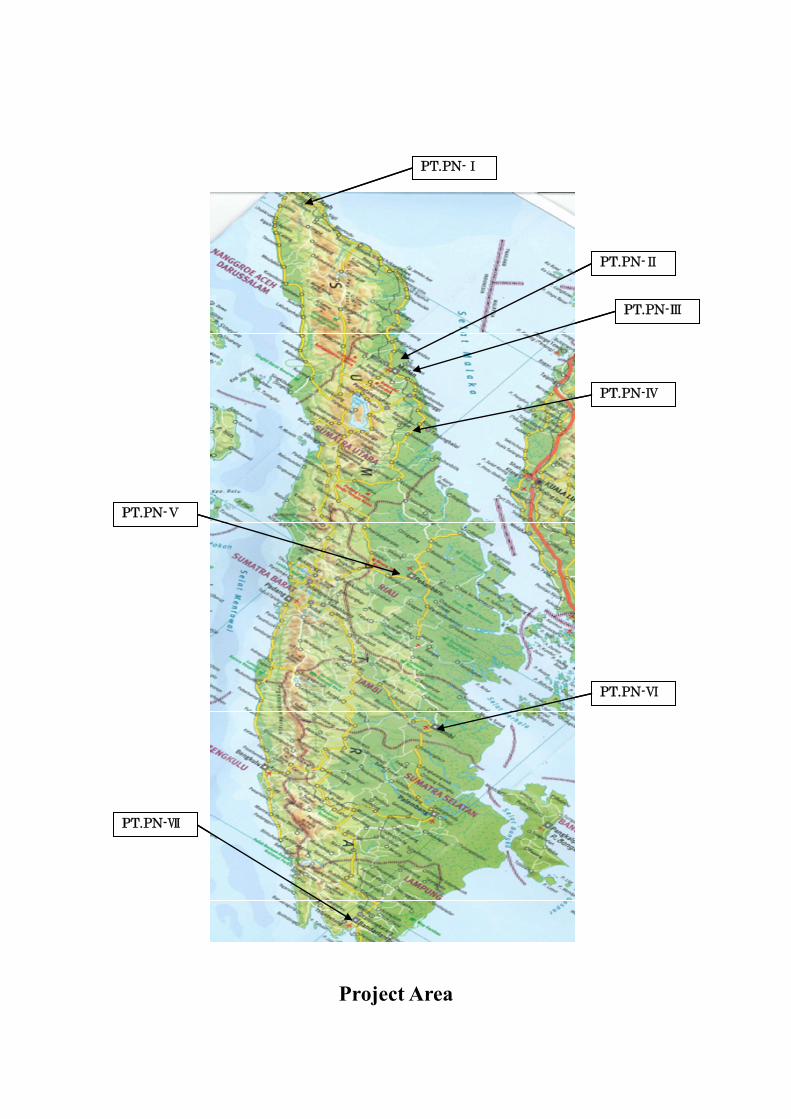
PT.PN-Ⅰ
PT.PN-Ⅱ
PT.PN-Ⅲ
PT.PN-Ⅳ
PT.PN-Ⅴ
PT.PN-Ⅵ
PT.PN-Ⅶ
PT.PN-Ⅰ
PT.PN-Ⅱ
PT.PN-Ⅲ
PT.PN-Ⅳ
PT.PN-Ⅴ
PT.PN-Ⅵ
PT.PN-Ⅶ
Project Area


EXECUTIVE SUMMARY

- S - I
Executive Summary
1. Significance and Objectives of the Study
The Republic of Indonesia has experienced serious economic slumps in the late 1990s, due to Financial Crisis that happened in Thailand in 1997. Also, the Republic’s financial status was seriously influenced by moving the Nation from the Oil Exporting Country to Oil Importing Country in the year of 2000. This situation made the Republic to take a motion to reduce its subsidies to Oil Products, Electricity and other utilities and encouraged to diversify the energy resources from fossil fuel to renewable energies such as Geothermal, Hydraulic, Solar, Wind and Biomass. In 2004, the Government has drawn up National Electric Master Plan (RUKN) and set the National Electrification Ratio. However, actual implementation of this Master Plan was left in the hands of the provincial offices of National Electricity Corporation or PLN, and they shall implement the program with close cooperation of the Provincial Governments. Thus, progress of this Master Plan was not progressed well, due to the lack of capacity for the planning works in the Provincial Governments and PLN Offices and the shortage of power supply capacity.
In 2006, the Government of Indonesia through the Ministry of Energy and Mineral
Resources had issued Decree No. 002 of 2006 to encourage and support the Power Supply business by the Private Sector utilizing Renewable Energy. This Decree tasked PLN to purchase the electric power generated by the Renewable Energy and rules how the purchasing prices shall be determined. In addition to this Decree, the Government has introduced the concept of “Energy-independent Village Program (DME)” to guarantee the safety of domestic power supply to every habitant with an attempt to improve the life standards at the isolated islands and remote mountainous areas.
Although the launching the DME Program nation-wide by the initiatives of the
Government, rural areas in Sumatra Island were not well entertained by this Program and some of them are still left behind to be improved. Meantime, Sumatra Island is rich in Biomass Resources, and Biomass Wastes at Palm Oil Mills (POMs) is one of the most potential resources to be utilized for the Power Generation in particular for the Off-grid Electric Districts.

- S - II
Considering these factors, this Project aimed at exploring the possibility to develop a POM Wastes-fired Power Generation Project for reducing poverty and promoting regional development by enhancing Rural Electrification at the Off-grid Electric Districts in Sumatra. Through the implementation of this Project which materializes the concept of “Waste-to-Energy”, may also improve the sanitary and environmental conditions at and around the POMs by capturing the Empty Fruit Bunches (EFBs) and Methane Gases from Palm Oil Mill Effluent (POME). This concept may also be applied to the United Nations for the Certified Emission Reduction (CER) of the Greenhouse Gas (GHG) under the Kyoto Protocol which in turn creates additional revenues to this Venture as a Carbon Credit.
2. Outline of Study outputs
This Study covers the Fact-finding on the Socio-economic conditions of Indonesia, Conducting survey over the existing and future development plans in the Power Sector and progress of the “Energy-independent Village” Plan, Appraisal of technology and man-power in the Power Sector and the Palm Oil Industry, Site Surveys at POMs in the Project areas, Analysis of Economical and Financial Viability, and others. As the results of this Study, the following findings are outlined;
(1) Significance of the Palm Oil Mill Wastes as an alternative resource for the Biomass
Power Generation.
The republic of Indonesia being the largest Palm Oil Producer in the World, Indonesia in particular the provinces of Sumatra has vast potential to become the center of Biomass Power Generation and Supply Systems in the World as well. The Empty Bruit Bunche (EFB) which accounts about 23% out of Fresh Fruit Bunch (FFB) as residue, have been abandon or neglected since long as the wastes in the Palm Oil Mills (POMs) except few that are returned to the Plantation as fertilizer. Meantime, Methane Gases which influences the Climate Change as one of the Greenhouse Gas (GHG) have also been freely evaporated from the Palm Oil Mill Effluent (POME). This concept proposes to capture these “Wastes” and utilize them as the Resources under the concept of “Wastes to Energy”. According to the Site Survey conducted, there is 61 POMs in Sumatra under the management of Seven (7) PTPekebunan Nusantasas (PT.PNs), the State Owned Plantation Corporations, and hundreds of POMs owned and run by the Private Sector. There is therefore tremendous potential to use these hidden resources for the Power Generation. It is worthwhile to consider to fully utilizing these resources

- S - III
for the Electrification of rural areas especially for those Off-grid Electricity Districts in the remote areas along with the program of “Energy-independent Village” that is strongly enhanced by the Government.
(2) Confirmation of willingness to implement the scheme by the authorities and
communities.
Through the series of discussions and interviews with the Coordinating Ministry for Economic Affairs, Ministry of Finance, BAPPENAS, Ministry of State Corporation, Ministry of Agriculture, Ministry of Energy and Mineral Resources, Ministry of Industry, PT. PNs, the Local Governments, and the Bank Mandiri, It was confirmed that the proposed concept was well accepted by all the authorities concerned and the Ministry of State Corporation and some of PT. PNs that the Study Team has met, have confirmed their intention to implement this scheme. Also, the Bank Mandiri who is one of the prominent state banks in the Republic has expressed their interest to act as a Conduit Organization for this Project, should there be any opportunity to deal with a Two-steps Loan. It is also assumed that this concept is attractive to the local communities so that the objectives of the Project aimed at the promotion of Rural Electrification and subsequent reduction of poverty in the rural areas, although there is no written evidence verifying the support of local community but the verbal one.
(3) Selection of the most suitable and optimal technical profile of the Biomass Power
Generation Systems.
With due and careful consideration to the Technology and Capability of Human Resources available in the Project Areas, the Study Team, based on the results of the Site Survey, have exercised alternative examinations to several alternatives of the Power Generation and Supply Systems which is utilizing the EFBs and Methane Gases captured from the premises of POMs. The detailed explanation is presented in the Chapter 3 hereof.
(4) Project Implementation Models for the Projects owned by the Public and Private
Sectors.
Besides the Project for the POMs that are owned by the Public Sector, the Study Team has tried to establish suitable Project Implementation Model for the POMs that

- S - IV
owned and run by the Private Sector. Major issues to establish this model were who will be responsible for functions of the Project Implementation Agency, and who will perform as a Conduit Organization for the Soft Loan to be provided. With recommendations from the Ministry of Finance and BAPPENAS, the Study Team made contact with the Bank Mandiri who is the largest state owned bank in the Republic, and they showed keen interest in the scheme to act as the Conduit Organization to provide the Soft Loan for this Project. However, the Study Team could not narrow down, due to time constraints, the candidate for the Project Implementation Agency, although some of line Ministries showed their interest in managing the Project.
(5) Analysis of the Financial Viability as a PoA Project.
The Financial Viability Analysis has been conducted with some assumption of the Parameters influencing the viability. Major pre-conditions for the analysis are; (1) Two Revenue Resources from the sales of Electricity to PLN and Certified of Emission Reduction (CER) for GHG under the Kyoto Protocol, and (2) Provision of the Soft Loan from the Government of Japan to cover the Initial Capital Outlays. As the results of Financial Viability Analysis, the Project with a processing capacity of Fresh Fruit Bunches for 30 tons per hour, Financial Internal Rate of Return was 11.7% before Tax, while the Project with 60 tons per hour processing capacity shows 31.7% in the same indicator. Sensitivity Analysis has also been conducted with some scenarios for changes on the parameters.
(6) Recommended Roadmap for the Implementation.
Although the results of this Preliminary Feasibility Study show positive indications, it is recommended to conduct a full scale Feasibility Study and Environmental Impact Assessment for this Project, utilizing a facility of the Technical Assistance from the Government of Japan. Roadmap for an application for the Technical Assistance, and implementation of the full-scale Feasibility Study and Environmental Impact Assessment is presented in Chapter 4 of this Report.

TABLE OF CONTENTS Location Map Executive Summary Abbreviation
Chapter 1 : Introduction............................................................................................................. 1 1.1 Background and Objectives ............................................................................................. 1 1.2 Scope of Works .................................................................................................................. 2 1.3 Study Area .......................................................................................................................... 3 1.4 Study Schedule................................................................................................................... 3 1.5 Study Team Member ......................................................................................................... 4
Chapter 2 : Issues of Rural Electrification and the DME Program ....................................... 5
2.1 Status of Economic Development and Energy in Indonesia .......................................... 5 2.2 Issues of Rural Electrification in Indonesia .................................................................... 6 2.3 The DME Program............................................................................................................ 7 2.4 Outlines of the Surveyed Area........................................................................................ 10
Chapter 3 : Profile of the POM Wastes-fired Power Generation Systems and PoA........... 12
3.1 Results of the Site Survey at three (3) POMs................................................................ 12 3.1.1 System Flow of the POM ......................................................................................... 12 3.1.2 Fluctuation of Material Supply and POM Operation........................................... 13 3.1.3 Treatment of EFB and Environmental Issues........................................................ 14
3.2 General description of the Biomass Wastes available for Power Generation in a POM..................................................................................................................... 14
3.2.1 Types of Biomass Wastes and Gases available for Power Generation ................. 14 3.2.2 Current Material Balance at the POM Systems .................................................... 16 3.2.3 Heating Value of the Biomass Wastes and Methane Gas ...................................... 18 3.2.4 Expected Power Generation Capacity.................................................................... 23 3.2.5 Expected Performance and Outputs of the Project at EFB 10t/h ........................ 24 3.2.6 Pelletization, carbonization and gasification of EFB ............................................ 25 3.2.7 Technical Issues to be solved ................................................................................... 26
3.3 Selection of the Optimum Systems for utilization of biomass waste........................... 29 3.3.1 Purposes of the POM Wastes-fired Power Generation and Gas Capturing
Project.................................................................................................................. 29 3.3.2 Evaluation Criteria for Selection of the Technology for the proposed Project ... 29
3.3.3 Technical Outlines of the Selected Power Generation Systems ............................ 30 3.3.4 Integration of the proposed Power Generation Systems into the Existing POM
Systems ................................................................................................................ 31 3.3.5 Expected Amount of Emission Reduction by Capturing Methane Gas .............. 32 3.3.6 Outline Technical Specifications of the Project ..................................................... 34 3.3.7 Rough Cost Estimate for the Major Equipments and Installations..................... 35
3.4 Outline of PoA and its Applicability to the Project ...................................................... 37 3.4.1 Definition and Outlines of the PoA Concept .......................................................... 37 3.4.2 Applicability of the PoA Concept to the Project .................................................... 39 3.4.3 Proposed Structure to implement the Project as a validated PoA Project .......... 44
Chapter 4 : Schemes foe the Project Implementation............................................................ 46
4.1 Project Implementation for the POMs owned by PT. PNs and POMs owned by the Private Sector...................................................................................................... 46
4.1.1 Project Implementation for the POMs owned by PT. PNs ................................... 46 4.2 Project Implementation for the POMs owned by the Private Sector ......................... 47 4.3 Economic and Financial Viability of the Project .......................................................... 47
4.3.1 Pre-conditions for the Financial Viability Analysis ............................................... 48 4.3.2 Total required costs for the Project......................................................................... 48 4.3.3 Results of the Financial Feasibility Analysis (Analysis of FIRR)......................... 50
4.4 Proposed Implementation Schedule of the Project ...................................................... 54 4.4.1 Construction at the Project Sites ............................................................................ 54 4.4.2 Trial operation .......................................................................................................... 55 4.4.3 Personnel ................................................................................................................... 55 4.4.4 Training program for operators.............................................................................. 55 4.4.5 Construction schedule.............................................................................................. 55
Chapter 5 : Recommendations................................................................................................. 58 Appendix 1: Itinerary for the Field Survey .............................................................................. I Appendix 2: Technical Data Sheets ........................................................................................... I Appendix 3: Site Photographs.................................................................................................... I Appendix 4: Financial Analysis Sheets...................................................................................... I Appendix 5: Recommended Terms of Reference ..................................................................... I
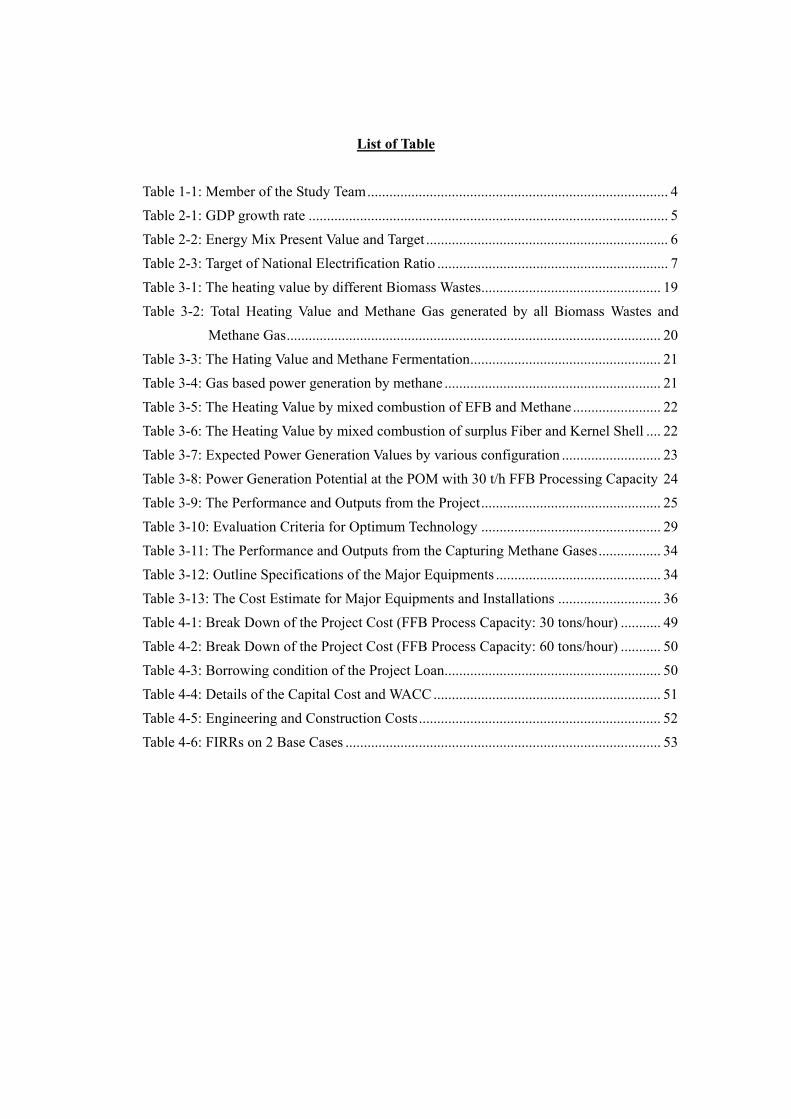
List of Table
Table 1-1: Member of the Study Team.................................................................................. 4 Table 2-1: GDP growth rate .................................................................................................. 5 Table 2-2: Energy Mix Present Value and Target .................................................................. 6 Table 2-3: Target of National Electrification Ratio ............................................................... 7 Table 3-1: The heating value by different Biomass Wastes................................................. 19 Table 3-2: Total Heating Value and Methane Gas generated by all Biomass Wastes and
Methane Gas...................................................................................................... 20 Table 3-3: The Hating Value and Methane Fermentation.................................................... 21 Table 3-4: Gas based power generation by methane ........................................................... 21 Table 3-5: The Heating Value by mixed combustion of EFB and Methane ........................ 22 Table 3-6: The Heating Value by mixed combustion of surplus Fiber and Kernel Shell .... 22 Table 3-7: Expected Power Generation Values by various configuration ........................... 23 Table 3-8: Power Generation Potential at the POM with 30 t/h FFB Processing Capacity 24 Table 3-9: The Performance and Outputs from the Project................................................. 25 Table 3-10: Evaluation Criteria for Optimum Technology ................................................. 29 Table 3-11: The Performance and Outputs from the Capturing Methane Gases................. 34 Table 3-12: Outline Specifications of the Major Equipments ............................................. 34 Table 3-13: The Cost Estimate for Major Equipments and Installations ............................ 36 Table 4-1: Break Down of the Project Cost (FFB Process Capacity: 30 tons/hour) ........... 49 Table 4-2: Break Down of the Project Cost (FFB Process Capacity: 60 tons/hour) ........... 50 Table 4-3: Borrowing condition of the Project Loan........................................................... 50 Table 4-4: Details of the Capital Cost and WACC .............................................................. 51 Table 4-5: Engineering and Construction Costs.................................................................. 52 Table 4-6: FIRRs on 2 Base Cases ...................................................................................... 53
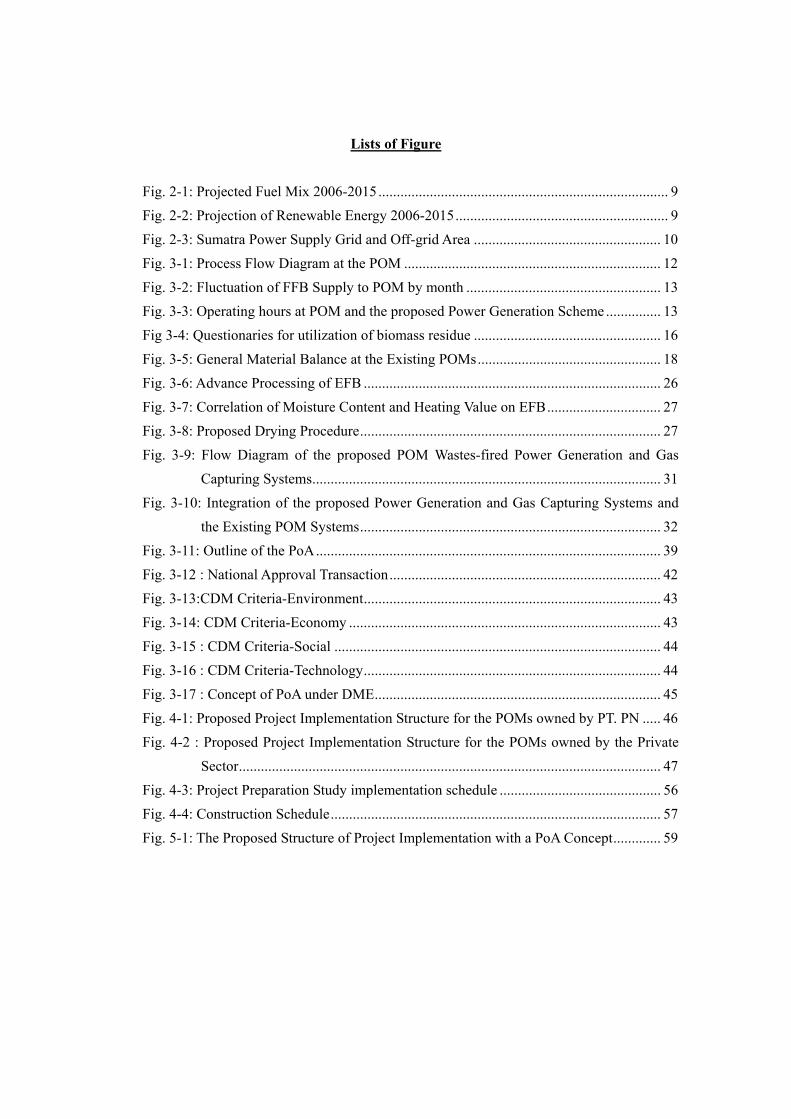
Lists of Figure
Fig. 2-1: Projected Fuel Mix 2006-2015............................................................................... 9 Fig. 2-2: Projection of Renewable Energy 2006-2015.......................................................... 9 Fig. 2-3: Sumatra Power Supply Grid and Off-grid Area ................................................... 10 Fig. 3-1: Process Flow Diagram at the POM ...................................................................... 12 Fig. 3-2: Fluctuation of FFB Supply to POM by month ..................................................... 13 Fig. 3-3: Operating hours at POM and the proposed Power Generation Scheme ............... 13 Fig 3-4: Questionaries for utilization of biomass residue ................................................... 16 Fig. 3-5: General Material Balance at the Existing POMs.................................................. 18 Fig. 3-6: Advance Processing of EFB ................................................................................. 26 Fig. 3-7: Correlation of Moisture Content and Heating Value on EFB............................... 27 Fig. 3-8: Proposed Drying Procedure.................................................................................. 27 Fig. 3-9: Flow Diagram of the proposed POM Wastes-fired Power Generation and Gas
Capturing Systems............................................................................................... 31 Fig. 3-10: Integration of the proposed Power Generation and Gas Capturing Systems and
the Existing POM Systems.................................................................................. 32 Fig. 3-11: Outline of the PoA.............................................................................................. 39 Fig. 3-12 : National Approval Transaction.......................................................................... 42 Fig. 3-13:CDM Criteria-Environment................................................................................. 43 Fig. 3-14: CDM Criteria-Economy ..................................................................................... 43 Fig. 3-15 : CDM Criteria-Social ......................................................................................... 44 Fig. 3-16 : CDM Criteria-Technology................................................................................. 44 Fig. 3-17 : Concept of PoA under DME.............................................................................. 45 Fig. 4-1: Proposed Project Implementation Structure for the POMs owned by PT. PN ..... 46 Fig. 4-2 : Proposed Project Implementation Structure for the POMs owned by the Private
Sector................................................................................................................... 47 Fig. 4-3: Project Preparation Study implementation schedule ............................................ 56 Fig. 4-4: Construction Schedule.......................................................................................... 57 Fig. 5-1: The Proposed Structure of Project Implementation with a PoA Concept............. 59

Abbreviation
AMS Approved Methodology
BAPPENAS National Development Planning Agency
Badan Perencanaan dan Pembangunan Nasional
BOD Biochemical Oxygen Demand
CER Certified Emission Reduction
CDM Clean Development Mechanism
CDM EB CDM Executive Board
COD Chemical Oxidant Demand
CPA CDM Project Activities
CPO Crude Palm Oil
DNA Designated National Authority
DOC Degradable Organic Carbon
DOE Designated Operational Entity
DME Energy-independent Village Program
Desa Mandiri Energi
EFB(s) Empty Fruits Bunch
FFB(s) Fresh Fruit Bunches
FIRR Financial Internal Rate of Return
FTO Free Trade Organization
GHG Greenhouse Gas
HSD High Speed Diesel
IMF International Monetary Fund
JICA Japan International Cooperation Agency
LHV Low Heating Value
LSPO Land Sustainable Palm Oil
O&M Operation and Maintenance
OPEC Organization of the Petroleum Exporting Countries
PoA Programme of Activities
PDD Project Design Documents
PLN National Electricity Corporation, Indonesia
Perusahaan Listrik Negara
POM(s)
PKS
Palm Oil Mill
Pabrik Kelapa Sawit

POME Palm Oil Mill Effluent
PT. PN(s) PT. Perkebunan Nusantara I~VII in Sumatra
RUKN National Electric Master Plan
Rencana Umum Kelistrikan Negara
SPC Special Purpose Company
SSC-CDM Small Scale CDM
UNFCCC United Nations Framework Convention on Climate Change


MAIN TEXT

- - 1
Chapter 1 : Introduction
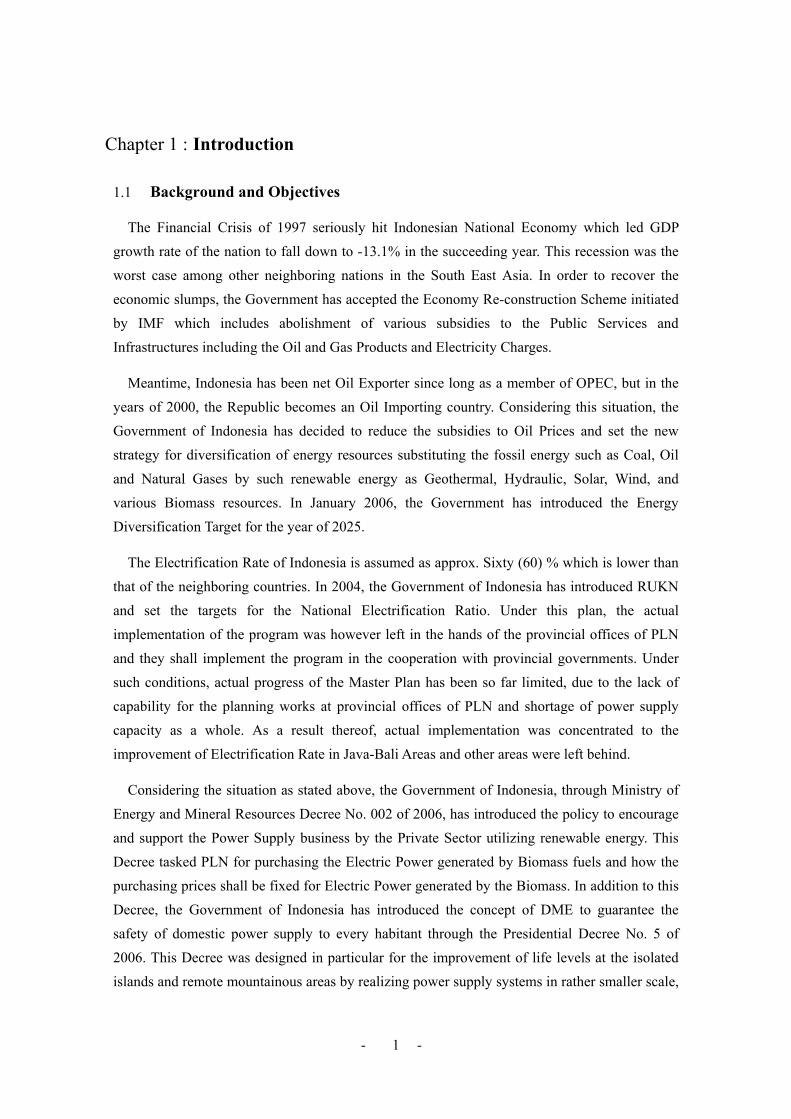
1.1 Background and Objectives
The Financial Crisis of 1997 seriously hit Indonesian National Economy which led GDP growth rate of the nation to fall down to -13.1% in the succeeding year. This recession was the worst case among other neighboring nations in the South East Asia. In order to recover the economic slumps, the Government has accepted the Economy Re-construction Scheme initiated by IMF which includes abolishment of various subsidies to the Public Services and Infrastructures including the Oil and Gas Products and Electricity Charges.
Meantime, Indonesia has been net Oil Exporter since long as a member of OPEC, but in the years of 2000, the Republic becomes an Oil Importing country. Considering this situation, the Government of Indonesia has decided to reduce the subsidies to Oil Prices and set the new strategy for diversification of energy resources substituting the fossil energy such as Coal, Oil and Natural Gases by such renewable energy as Geothermal, Hydraulic, Solar, Wind, and various Biomass resources. In January 2006, the Government has introduced the Energy Diversification Target for the year of 2025.
The Electrification Rate of Indonesia is assumed as approx. Sixty (60) % which is lower than that of the neighboring countries. In 2004, the Government of Indonesia has introduced RUKN and set the targets for the National Electrification Ratio. Under this plan, the actual implementation of the program was however left in the hands of the provincial offices of PLN and they shall implement the program in the cooperation with provincial governments. Under such conditions, actual progress of the Master Plan has been so far limited, due to the lack of capability for the planning works at provincial offices of PLN and shortage of power supply capacity as a whole. As a result thereof, actual implementation was concentrated to the improvement of Electrification Rate in Java-Bali Areas and other areas were left behind.
Considering the situation as stated above, the Government of Indonesia, through Ministry of Energy and Mineral Resources Decree No. 002 of 2006, has introduced the policy to encourage and support the Power Supply business by the Private Sector utilizing renewable energy. This Decree tasked PLN for purchasing the Electric Power generated by Biomass fuels and how the purchasing prices shall be fixed for Electric Power generated by the Biomass. In addition to this Decree, the Government of Indonesia has introduced the concept of DME to guarantee the safety of domestic power supply to every habitant through the Presidential Decree No. 5 of 2006. This Decree was designed in particular for the improvement of life levels at the isolated islands and remote mountainous areas by realizing power supply systems in rather smaller scale,

- - 2
utilizing such up-to-date technology as Solar, Wind, Mini Hydro and Biomass.
This concept aims at replacement of fossil fuels by locally produced renewable energy to provide the Electric Power to the Off-grid areas. The locally produced renewable energy resources may the transportation cost for the fossil fuels to such isolated mountainous and island areas. This Project will contribute greatly to reduce the subsidies by the Government for the transportation costs of fossil fuels and to maintain the environmental conditions in the regions. This program has been actively implemented by the initiative of Coordinating Ministry for Economic Affairs and other Six (6) line Ministries.
However the launching the DME Program nation-wide by the initiatives of the Government, rural areas in Sumatra Island were not well entertained by this Program and are still left behind to be improved. Meantime, Sumatra Island is rich in Biomass Resources and Biomass Wastes at POMs is one of the most potential resources to be utilized for the Power Generation and Supply systems to various Off-grid areas, while these resources have been less utilized.
Under such circumstances, this Project is aimed at reducing poverty and promoting regional development through enhancing Rural Electrification at the Off-grid areas by Power Generation and Supply systems utilizing Biomass Wastes at POMs in Sumatra, Indonesia. Through the implementation of this Project, sanitary conditions at and around the POMs may also be improved since EFB and Methane Gases shall be properly captured and managed as a fuel for the Project. This concept may be applied to the United Nations for CER of the Greenhouse Gas (GHG) under the Kyoto Protocol which in turn creates additional revenues to this venture as a Carbon Credit to be dealt in the Market.
1.2 Scope of Works
This study aimed at the formulation of a Biomass Power Generation Project for the purpose of Rural Electrification in Sumatra Island, Indonesia by changing the Biomass-based Industrial Wastes at the POMs into an Electric Power. The Project is at the same time sought to be applied as PoA for CER on GHG to the UNFCCC under CDM within the spectrum of Kyoto Protocol. This Study shall collect and analyze the data and information in the following fields among others, examine and select the most suitable Power Generation and Supply Systems, recommend necessary measures to realize, and drawn a implementation schedule for the Project;
・ Present situation relative to the Power Sector in Sumatra Island, ・ Progress of DME Concept in Sumatra, ・ EFB and Methane Gases as a Potential Biomass Energy Resources,

- - 3
・ Needs for Waste-to-Energy concept at POMs, ・ Potential Application of PoA to the Project,
1.3 Study Area
The Study Area covers the entire regions of Sumatra Island, the Republic of Indonesia. However, due to certain constraint in the study periods, site survey was conducted in the three locations; City of Jakarta, Pekanbaru, Capital City of Riau Province, and Medan, Capital City of North Sumatra Province. Pekanbaru and Medan were selected based upon the views that two areas are identified as the centers of Palm Oil Production in the Republic, thus they are expected to have a vast potential to realize the proposed concept into reality. As to the rest of other Provinces in Sumatra., Study Team has also gathered the secondary data and conducted subsequent analysis thereto.
1.4 Study Schedule
During the Study Periods, the Study Team has conducted the Field Survey at the Study Area for the periods from Sunday, December 14, 2008 to Wednesday December 24, 2008. The detailed Survey Schedule is shown in the Table attached hereto as the Appendix 1.
- - 4
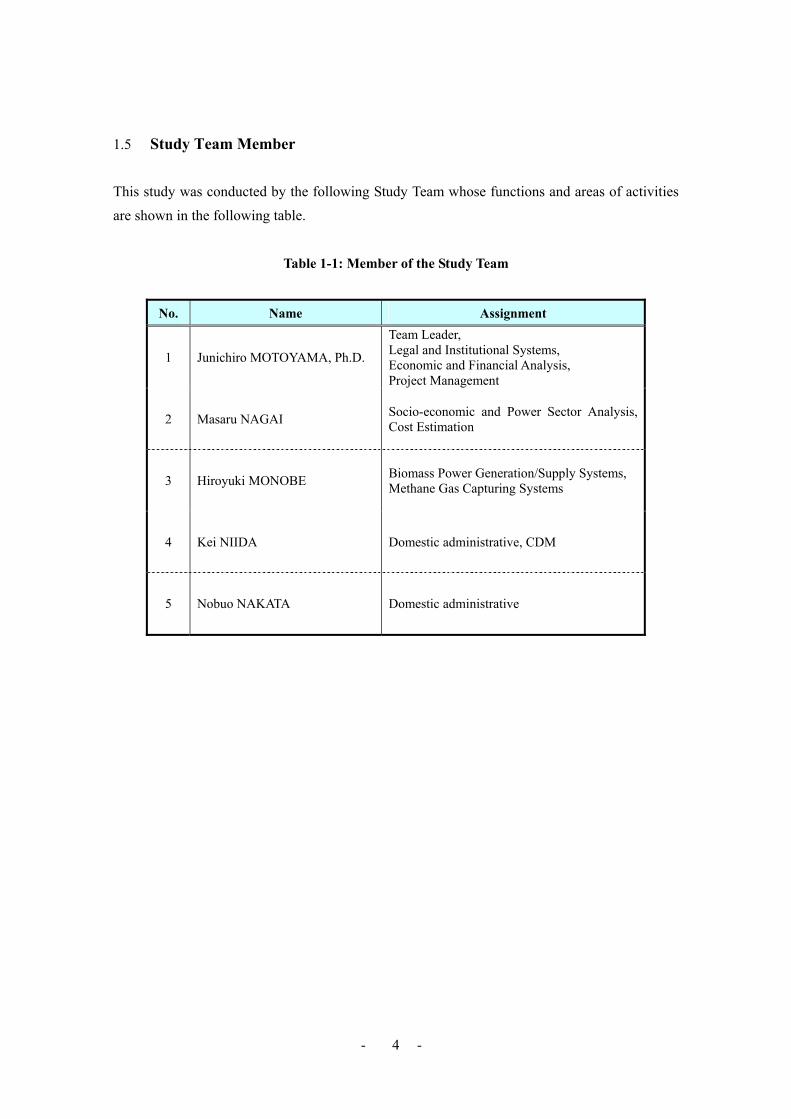
1.5 Study Team Member This study was conducted by the following Study Team whose functions and areas of activities are shown in the following table.
Table 1-1: Member of the Study Team
No. Name Assignment
1 Junichiro MOTOYAMA, Ph.D.
Team Leader, Legal and Institutional Systems, Economic and Financial Analysis, Project Management
2 Masaru NAGAI Socio-economic and Power Sector Analysis, Cost Estimation
3 Hiroyuki MONOBE Biomass Power Generation/Supply Systems, Methane Gas Capturing Systems
4 Kei NIIDA Domestic administrative, CDM
5 Nobuo NAKATA Domestic administrative
- - 5
Chapter 2 : Issues of Rural Electrification and the DME Program
2.1 Status of Economic Development and Energy in Indonesia
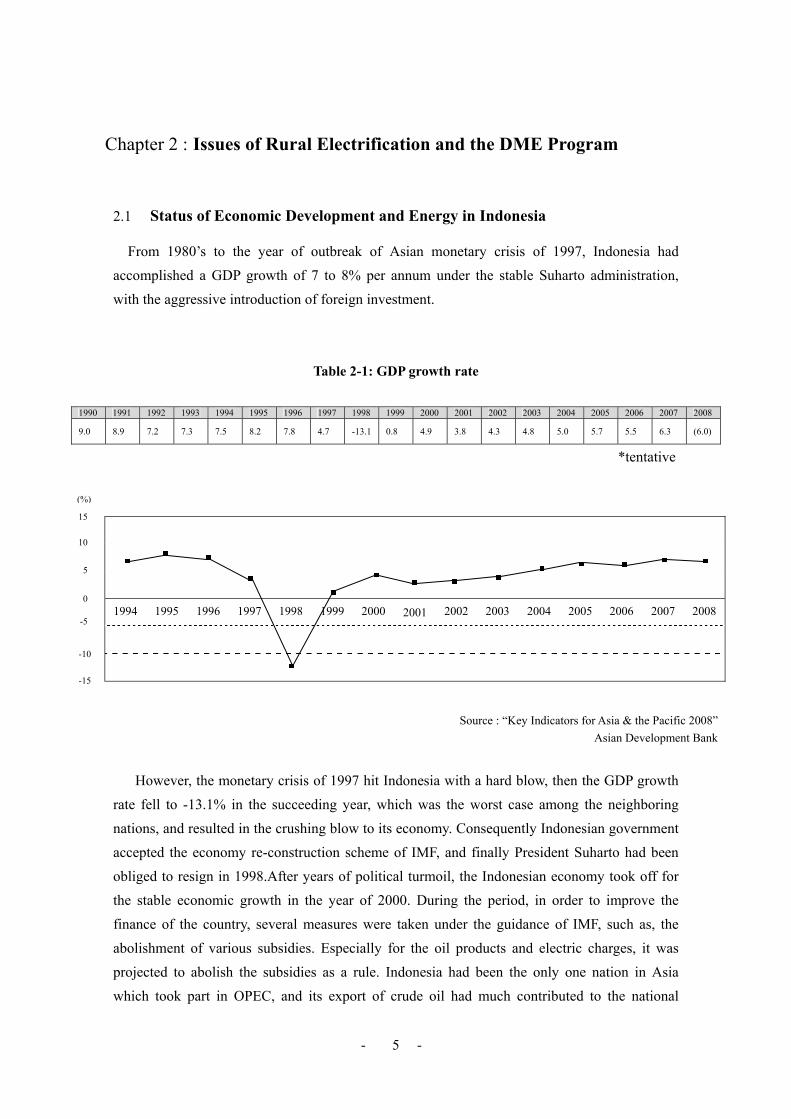
From 1980’s to the year of outbreak of Asian monetary crisis of 1997, Indonesia had accomplished a GDP growth of 7 to 8% per annum under the stable Suharto administration, with the aggressive introduction of foreign investment.
Table 2-1: GDP growth rate
1990 1991 1992 1993 1994 1995 1996 1997 1998 1999 2000 2001 2002 2003 2004 2005 2006 2007 2008
9.0 8.9 7.2 7.3 7.5 8.2 7.8 4.7 -13.1 0.8 4.9 3.8 4.3 4.8 5.0 5.7 5.5 6.3 (6.0)
*tentative
1994 1995 1996 1997 1998 1999 2000 2001 2002 2003 2004 2005 2006 2007 2008
Source : “Key Indicators for Asia & the Pacific 2008”Asian Development Bank
However, the monetary crisis of 1997 hit Indonesia with a hard blow, then the GDP growth rate fell to -13.1% in the succeeding year, which was the worst case among the neighboring nations, and resulted in the crushing blow to its economy. Consequently Indonesian government accepted the economy re-construction scheme of IMF, and finally President Suharto had been obliged to resign in 1998.After years of political turmoil, the Indonesian economy took off for the stable economic growth in the year of 2000. During the period, in order to improve the finance of the country, several measures were taken under the guidance of IMF, such as, the abolishment of various subsidies. Especially for the oil products and electric charges, it was projected to abolish the subsidies as a rule. Indonesia had been the only one nation in Asia which took part in OPEC, and its export of crude oil had much contributed to the national
10
15
5
0
-5
-10
-15
(%)

- - 6
finance. However, starting from 1990’s, the production of the crude oil had decreased, and in 2000’s, Indonesia became an oil importing country reversely, and seceded from OPEC last year.
In order to curb the increment of oil consumption, and to reduce subsidies, Indonesia government had set the target of the diversification of energy resources, substituting coal, gas and renewable energy for oil, and in January 2006, by the presidential decree No.5, the target of the energy diversification by year 2025 was established as shown in Table 2-2 below.
Table 2-2: Energy Mix Present Value and Target
Energy Resources As of 2004 Target for 2025 Oil 52.10% < 20% Gas 19.04% > 30% Coal 21.52% > 33% Bio fuel - > 5% Geothermal 3.01% > 5% Renewable energy 3.93% > 5% Liquefied Coal - > 2%
Indonesian economy had satisfactorily developed until beginning of 2008. However due to
the outbreak of the world simultaneous recession caused by US monetary upheaval in 2008, Indonesian economy, which much depended on the export to US, China etc., is supposed to be influenced for the worse by it.
2.2 Issues of Rural Electrification in Indonesia
The electrification rate of Indonesia is said approx. 60%, which is lower than the neighboring countries. Especially in the isolated rural area, such as mountainous remote area and islands, it is presumed that considerable amount of non-electrified indigent villages still remain. Indonesia government has, with the assistance of developed countries, promoted the electrification of such rural area starting from 1970’s, in the manner of not only enriching power distribution network but also introduction of diesel power generation, micro hydro power station and solar energy generation to such Off-grid area.
In the government’s RUKN which was created in 2004, the following target of electrification and necessary supporting organization for it were established. However, actual planning was left in the hand of the local office of PLN, and to be executed in the cooperation with local government.
- - 7
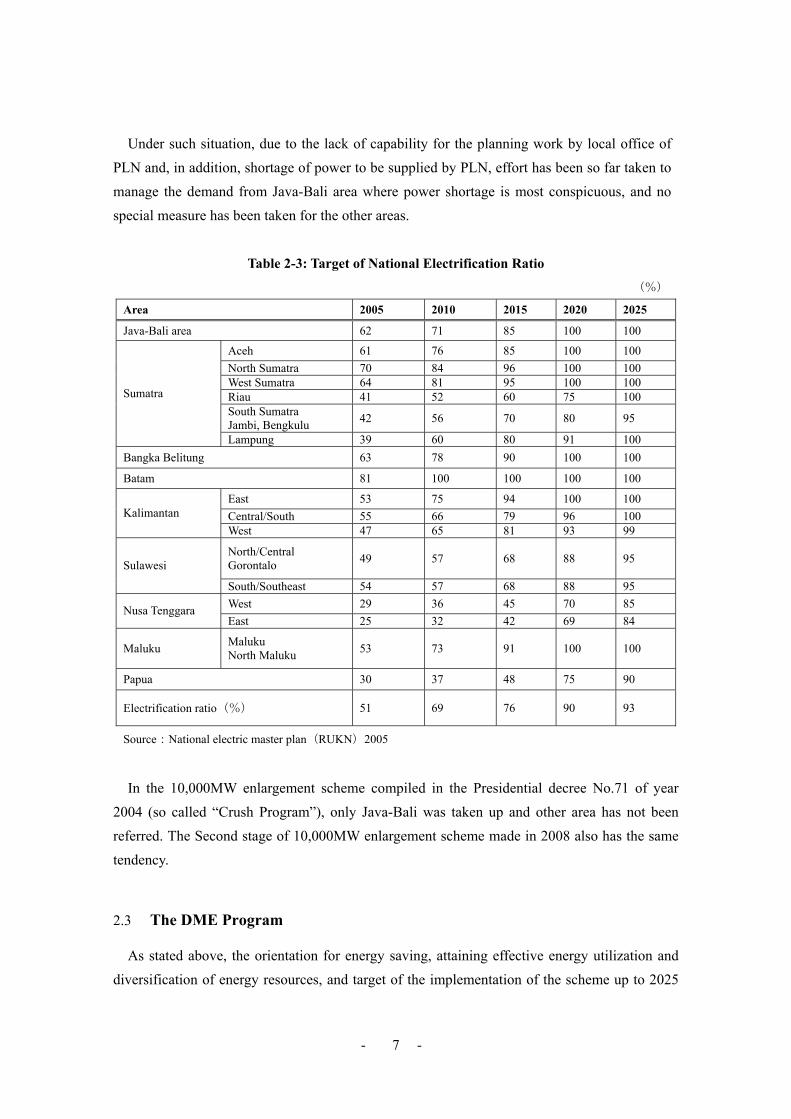
Under such situation, due to the lack of capability for the planning work by local office of PLN and, in addition, shortage of power to be supplied by PLN, effort has been so far taken to manage the demand from Java-Bali area where power shortage is most conspicuous, and no special measure has been taken for the other areas.
Table 2-3: Target of National Electrification Ratio
(%)
Area 2005 2010 2015 2020 2025
Java-Bali area 62 71 85 100 100
Aceh 61 76 85 100 100 North Sumatra 70 84 96 100 100 West Sumatra 64 81 95 100 100 Riau 41 52 60 75 100 South Sumatra Jambi, Bengkulu 42 56 70 80 95
Sumatra
Lampung 39 60 80 91 100 Bangka Belitung 63 78 90 100 100
Batam 81 100 100 100 100
East 53 75 94 100 100 Central/South 55 66 79 96 100 Kalimantan West 47 65 81 93 99
North/Central Gorontalo 49 57 68 88 95 Sulawesi
South/Southeast 54 57 68 88 95 West 29 36 45 70 85 Nusa Tenggara East 25 32 42 69 84
Maluku Maluku North Maluku 53 73 91 100 100
Papua 30 37 48 75 90
Electrification ratio(%) 51 69 76 90 93
Source:National electric master plan(RUKN)2005
In the 10,000MW enlargement scheme compiled in the Presidential decree No.71 of year
2004 (so called “Crush Program”), only Java-Bali was taken up and other area has not been referred. The Second stage of 10,000MW enlargement scheme made in 2008 also has the same tendency.
2.3 The DME Program
As stated above, the orientation for energy saving, attaining effective energy utilization and diversification of energy resources, and target of the implementation of the scheme up to 2025

- - 8
were set as main structure of the national energy policy in the Presidential Decree No.5 in 2006 to cope with rapid increment of the demand for energy of 7% per annum in an average.
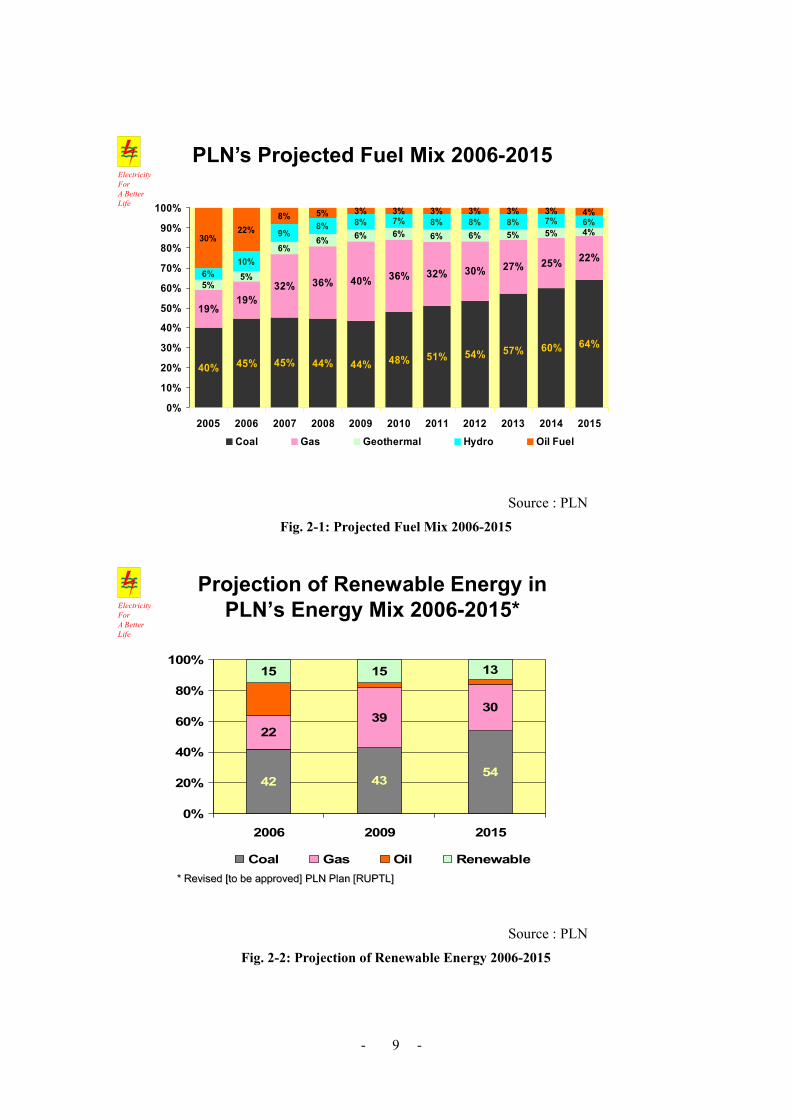
As for the plan of Energy Mix prepared by PLN, it is stated that renewable energy shall be geothermal energy and hydraulic power, as shown in Fig. 2-1, which shall occupy 10% in the PLN at the year of 2015. Other energy resources, such as, solar energy, wind-generated electricity and biomass have not been referred. Under such situation, Indonesian government has, in the Decree No.002 of 2006 of the Ministry of Energy and Mineral Resources, proposed the definite measures to support and promote the electric generation business by private sectors utilizing renewable energy. This policy included the responsibility for purchasing generated power, deciding purchasing price, etc..
In addition, in order to fulfill the government’s responsibility “ to guarantee the safety of domestic power supply”, prescribed in the Presidential Decree No.5 in 2006 as Energy-Independent Village Program, for the mountainous remote area and isolated islands which suffer from the shortage of power supply, government has planned to secure power to be necessary for lighting, cooking and industrial /productive activities, utilizing up-to-date technology, such as, solar energy, wind-generated electricity etc..
This is based on the consideration that the transportation of fossil fuel for power generation to mountain remote area or islands with high transportation cost is not efficient and will requires much subsidies, and that more effective way will be that fossil fuel is replaced with locally procured renewable energy and so generated power is supplied to off-grid area.
For the materialization of the scheme, Coordinating Ministry for Economic Sector shall take initiative and 6 ministries will cooperate. In the program, the villages that 60% of the demand for power can be managed by the renewable energy (Biomass fuel, geothermal energy, wind, micro hydro power and biomass from waste) are chosen as candidates and electrification work shall be carried out for them. Although the off-grid area of Sumatera where we have executed survey has not been chosen as an objective area, but the area always suffers from shortage of power supply and any measures have not been taken by the government so far notwithstanding the policy of the government, i.e. “to guarantee the safety of energy supply”. However, this area constantly produces biomass fuel of palm tree, so called FEB, in large quantity, so it is anticipated that the utilization of EFF for power generation shall be quite effective and will contribute DME program in a wide sense.
- - 9
40% 45% 45% 44% 44% 48% 51% 54% 57% 60% 64%
19%19%
32% 36% 40% 36% 32% 30% 27% 25% 22%
5%5%
6%6% 6% 6% 6% 6% 5% 5% 4%
6%10%
9%8% 8% 7% 8% 8% 8% 7% 6%
30%22%
8% 5% 3% 3% 3% 3% 3% 3% 4%
0%
10%
20%
30%
40%
50%
60%
70%
80%
90%
100%
2005 2006 2007 2008 2009 2010 2011 2012 2013 2014 2015Coal Gas Geothermal Hydro Oil Fuel
PLN’s Projected Fuel Mix 2006-2015ElectricityFor A BetterLife
Source : PLN
Fig. 2-1: Projected Fuel Mix 2006-2015
54
2239
30
15 15 13
42 43
0%
20%
40%
60%
80%
100%
2006 2009 2015
Coal Gas Oil Renewable
ElectricityFor A BetterLife
Projection of Renewable Energy in PLN’s Energy Mix 2006-2015*
* Revised [to be approved] PLN Plan [RUPTL]
Source : PLN
Fig. 2-2: Projection of Renewable Energy 2006-2015

- - 10
2.4 Outlines of the Surveyed Area
The selected surveyed areas are Riau Province which is the most far from Sumatera Electricity transmission line of PLN, Western Sumatera Province where transmission lines are dotted, Jambi and North Sumatera Provinces where the lines are concentrated. The common feature in these four provinces is that there are major palm producing areas, and in Riau, Jambi and West Sumatera province, private oil mills are dominant, while public ones are in North Sumatra. Therefore, survey has been conducted on a private mill in Riau and two public mills in Northern Sumatera, in order to complete the survey within the limited period. The data obtained from the survey which has been conducted on two private mills in Riau in the year of 2006 has also been considered as the supplementary data in this study, and that of other two provinces are analyzed according to the secondary data.
Source: National Energy Strategy Review
Fig. 2-3: Sumatra Power Supply Grid and Off-grid Area
The selected four provinces have a lot of off-grid Electricity Districts,, most of which are
Main line of PLN
The line under construction
Energy independent line
Northern Sumatra
Riau
Western Sumatra
Jambi
- - 11
under the umbrella of PLN. Although the electrification rate depends on the definition, it turned out that the area along the paved roads has the rate of 100% from the survey (according to Department of Agriculture and JICA specialists). Viability of electrical power supply to DME is also included in this project goal. DME project is designed to provide with such standalone-type as Solar PV and Micro Hydro Power Generation to the region which is located far from the road or transportation systems are not available. As to the Operation and Maintenance (O&M) for these Power Supply Systems, it is entrusted to the regional communities, and this concept is a little different from the objective of supplying the surplus electricity like this project. Therefore this Preliminary Feasibility Study shall be conducted along with the precondition that the surplus electricity of the POMs shall be connected to the off-grid Power distribution network as well as to the Sumatra grid of PLN. Over coming the shortage of energy in Sumatra by supplying surplus Electricity to the grid eventually might lead to supply the energy to DME.
- - 12
Chapter 3 : Profile of the POM Wastes-fired Power Generation Systems and PoA
3.1 Results of the Site Survey at three (3) POMs
The Study Team has conducted the Site Survey for the periods from December 17 to 19, 2008 in the vicinity of Pekanbaru, Riau Province and Medan, North Sumatra Province. They have visited three (3) POMs; one is owned by Private Sector and two are owned by PT. PN-II and PT.PN-IV. The General descriptions of the POMs are illustrated in the Technical Sheets as shown in the Appendix 2 hereto. The Results of the Site Survey may be summarized as follows;
3.1.1 System Flow of the POM
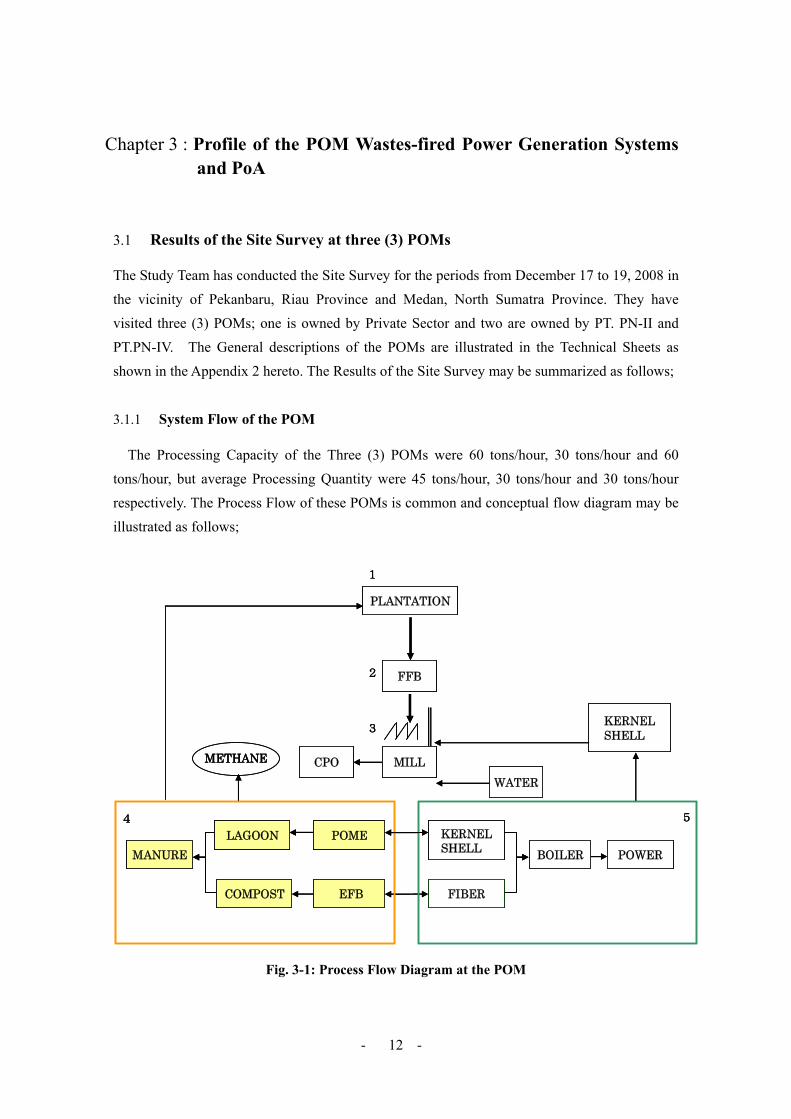
The Processing Capacity of the Three (3) POMs were 60 tons/hour, 30 tons/hour and 60 tons/hour, but average Processing Quantity were 45 tons/hour, 30 tons/hour and 30 tons/hour respectively. The Process Flow of these POMs is common and conceptual flow diagram may be illustrated as follows;
Fig. 3-1: Process Flow Diagram at the POM
PLANTATION
KERNELSHELL
METHANE
FFB
CPO MILL
EFB
POMELAGOON
COMPOST
MANURE
FIBER
KERNELSHELL POWERBOILER
1
2
3
4 5
WATER
PLANTATION
KERNELSHELL
METHANE
FFB
CPO MILL
EFB
POMELAGOON
COMPOST
MANURE
FIBER
KERNELSHELL POWERBOILER
1
2
3
4 5
WATER

- - 13
3.1.2 Fluctuation of Material Supply and POM Operation
The supply of Fresh Fruit Bunches (FFBs) is varied by seasons and peak season is the months from May to August every year. Processing Quantity in FFB basis shows up-trends in the recent 3 years, due maybe to higher selling price of CPO, the major project of POMs. The Processing Quantity in 2008 reached to the almost same level of that of year 2003.The Operation ratio of POM shall be influenced heavily depending upon the quantity of FFB supply. Fluctuation
between the peak season and low season was ±26% against the mean figure of 11,230 tons/month in case of the POM in North Sumatra. The following Figure shows the typical trends in the fluctuation of FFB supply to POM.
The collected amount of EFB,monthly
8,000
13,000
18,000
Jan Feb Mar Apr May Jun Jul Aug Sep Oct Nov
(t)
Fig. 3-2: Fluctuation of FFB Supply to POM by month
Meantime, relationship of the Operating Hours in POM and the proposed Power Generation
Project are as follows;
Fig. 3-3: Operating hours at POM and the proposed Power Generation Scheme
Operating hours of POM:4,752 hours Suspend operations during night time:2,694
Generation at POM (fiber and shell)Generation at the Power Generation Scheme (EFB, Methane & POM Surplus)
7,446 hours
annually
- - 14
Each POM generates electricity by using Fiber and Kernel Shell during the operating hours for their own use. If the proposed Power Generation Scheme commences its Operation, POM will supply the surplus Biomass Wastes, Methane Gases and the proposed Power Generation Scheme generates the Electricity by using them.
3.1.3 Treatment of EFB and Environmental Issues
At present, EFBs are partly returned to the Palm Plantation without any treatment if the Plantation is attached to the POM. Since EFB takes several years to ferment and change itself to organic fertilizer, and during these periods, those abandon EFBs keep generating the Methane Gases. On the other hand, POM produces considerable amount of Effluent Waters through its CPO production process. These Effluent Waters are kept in the Lagoons located adjacent to the POM and the lagoons generate Methane Gases too. These Methane Gases, being one of the GHGs identified by the United Nations, affect adversely to the Climate Change in the global scale. Thus, Capturing the Methane Gases is one of the urgent countermeasures to be undertaken by the Government as well as by the Industry.
3.2 General description of the Biomass Wastes available for Power Generation in a POM
3.2.1 Types of Biomass Wastes and Gases available for Power Generation
There are about four types of biomass wastes in the Existing POM Systems.
・ Fiber The fibrous carrier of oil which stretches seed coat of fruits and kernel
・ Kernel Shell Skin of kernel, Core of fruits. Kernel holds and Kernel oil, which are separately extracted with Palm Oil
・ EFB Fibrous material, which fruits were removed from the bunch with some hundreds of fruits
・ POME The processed water at the POM which is consists of the condensed water of steam boiler and industrial cleansing water. It includes fibrous pieces, ones of seed coat, existing oil derived protein and muddy water contained seed coat. After storing at POME Lagoon, it generates Methane Gas through anaerobic fermentation.

- - 15
The weight ratio of the above four biomass wastes is generally calculated based on weight of
FFB, however, it varies on each POMs according to the disposing methods. At these POMs, regardless of its ownership either owned by Private or Public sectors, the expected amount of power generation is calculated by combining some of the above mentioned and converting the steam generated thereby and used for the power generation. Although the generated electricity is sufficient for internal use in general, it is necessary to purchase from commercial transmission lines in case of emergency.
(1) Fiber and Kernel Shell Traditionally, fiber and kernel shell have been used effectively for the purpose of Power
Generation to be used within POM, while EFB as well as POME have been disposed.
(2) EFB Despite the fact, according to the survey which has been conducted for years, the sources to
the mills replied that those wastes have been used effectively at any sites. Particularly, EFB is used as fertilizer at palm plantations, EFB contains a little amount of potassium, and for that reason, they say it is said to be reused at plantations. And it is some time used as heat generating source by boiler combustion, or sold as cut briquette materials after drying. From the point of transportation, the lump of fibrous like EFB has no choice but to be dumped in the plantation, but it takes several years to decompose, which generates Methane Gas through aerobic fermentation. If it is decomposed, it just contributes to reduction of chemical fertilizer of no more than 10 to 20% (excludes the composted fertilizer). In short, utilization of EFB as energy sources is rare, and dumping in plantation is the most cases.
(3) POME
The source of POME is mainly hot water from steam in the sterilizing process. In addition to this, drain from the back pressure tank, the water used for dividing the shell and the seed, industrial cleansing water with small pieces of EFB are among the sources. BOD of POME at he lagoon is 4 to 50 thousand ppm. POME is filtered through 5 to 6 lagoons gradually and reaches the level to be discharged into a river in a few months. Through these processes, gases such as methane are released from lagoons through anaerobic fermentation.
- - 16
FFBPlantation POME Lagoon
Residue
EFB
Methane
Drying
POM
CarryCarry
On-site powergeneration
Surplusbiomass
Non-electrification area (Local municipality)
(1)-2
(2)-1
(2)-2
(3)
On-site powergeneration
Cylinder
Effluent
(1)-1
Captive Power Generation Area
FFBPlantation POME Lagoon
Residue
EFB
Methane
Drying
POM
CarryCarry
On-site powergeneration
Surplusbiomass
Non-electrification area (Local municipality)
(1)-2
(2)-1
(2)-2
(3)
On-site powergeneration
Cylinder
Effluent
(1)-1
Captive Power Generation Area
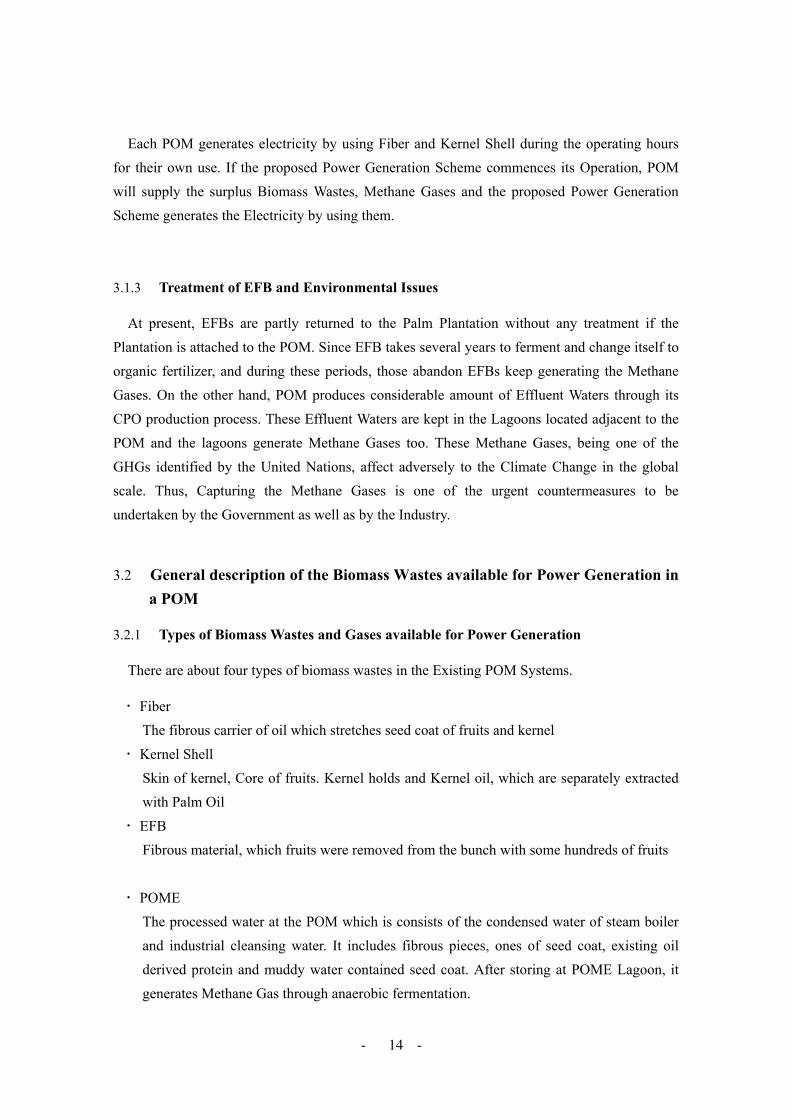
Fig 3-4: Questionaries for utilization of biomass residue
According to the POMs, POME is pumped into plantations from the POME Lagoons. It is used for irrigation as liquefied fertilizer. In many cases, plantations are not equipped with irrigation devices, and geographical difference of elevation leads the drained POME to stay at the low elevated areas as untreated water. Therefore, flooding in the rainy season will lead the untreated POME to pour into a river. In that case, it is not considered as the efficient use of POME, but the discharging the industrial waste waters in the plantation without treatment. As for possible treatment on POME, converting it into organic fertilizers might be applicable through anaerobic fermentation in the fermentation tank, and separating process of sludge and liquid after capturing methane. And then the liquid is discharged into a river after appropriate treatment is done, while the sludge is converted into organic fertilizers through aerobic disposing.
3.2.2 Current Material Balance at the POM Systems
The following figure shows the general weight ratio of amount of biomass residue against EFB, however in general these values vary widely by POMs. So, the amount of EFB varies widely in every year, month and day, which leads to unstable amount of biomass residue. In case that a

- - 17
Power Generation scheme uses biomass wastes as the generating power source, it must be supplied to the Power Plant regularly, and operating schemes must be influenced depending upon the Operational fluctuation of POM. Thus, supply of power resources shall be regulated by the volume of stockpile as a buffer to fill the gaps that happened between the Operations of POM and a Power Generation Scheme. The correlations of Operating Hours by POM and a Power Generation Scheme are described in Fig. 3-3.
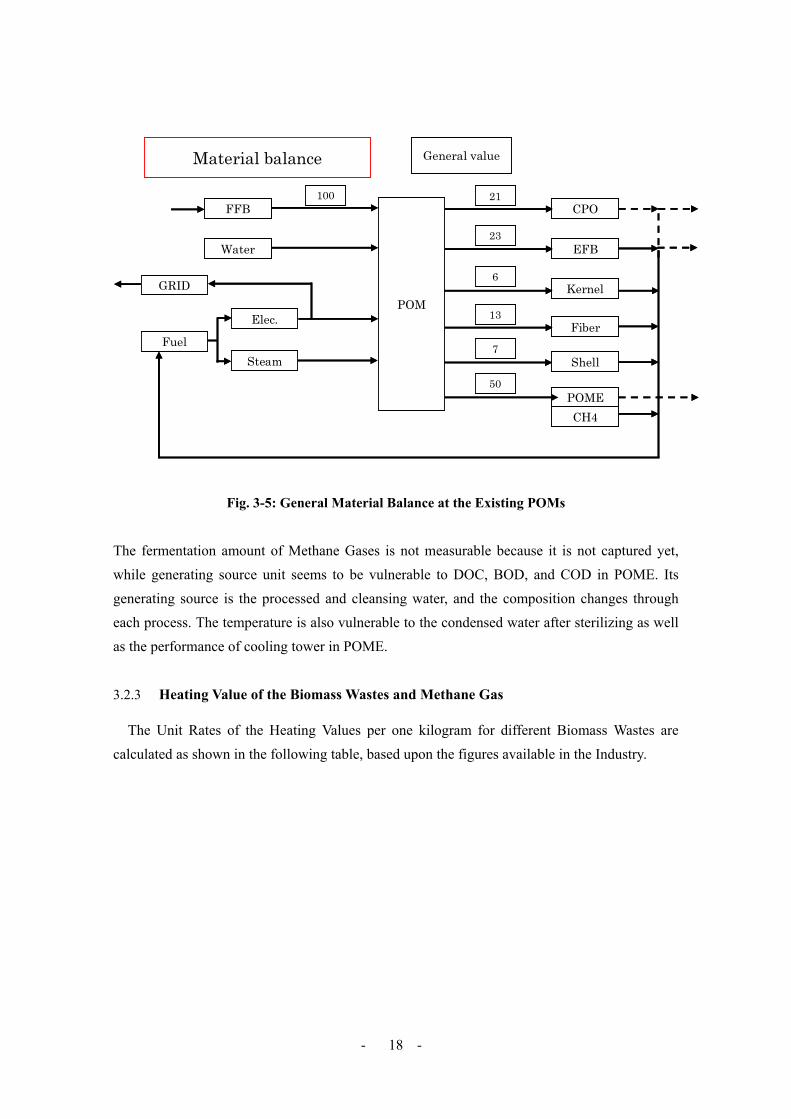
- - 18
Material balance General value
FFB
Water
GRID
Fuel
Elec.
Steam
POM
EFB
CPO
Kernel
Fiber
Shell
POMECH4
100 21
23
6
13
7
50
Material balance General value
FFB
Water
GRID
Fuel
Elec.
Steam
POM
EFB
CPO
Kernel
Fiber
Shell
POMECH4
POMECH4
100 21
23
6
13
7
50
Fig. 3-5: General Material Balance at the Existing POMs
The fermentation amount of Methane Gases is not measurable because it is not captured yet, while generating source unit seems to be vulnerable to DOC, BOD, and COD in POME. Its generating source is the processed and cleansing water, and the composition changes through each process. The temperature is also vulnerable to the condensed water after sterilizing as well as the performance of cooling tower in POME.
3.2.3 Heating Value of the Biomass Wastes and Methane Gas
The Unit Rates of the Heating Values per one kilogram for different Biomass Wastes are calculated as shown in the following table, based upon the figures available in the Industry.

- - 19
Table 3-1: The heating value by different Biomass Wastes
The amount of heat MJ/kg Remarks
Fiber 11.3 Condition of drain moisture of 30%
Shell 18.8 Condition of drain moisture of 30%
EFB 15.0 After drying moisture of 10%
POME * Methane 35.8MJ/㎥
The amount of heating input
Source: Survey data on POM in Indonesia Japan Consulting Institute 2007
/cited the actual measured data by company A, 2007)
*The amount of generated Methane from POME varies according to POM, which is unstable. This specific value has been gained in the anaerobic fermenting tank which is owned by company A, for reference only.
For the calculation and determination of the Heating Value under the proposed Power
Generation and Gas Capturing Systems, the following configurations are examined. The basic unit of the calculation was 10 t/h of EFB Processing Capacity. (1) Heating Values in case of firing EFB, Fiber and Kernel and Methane Fermentation
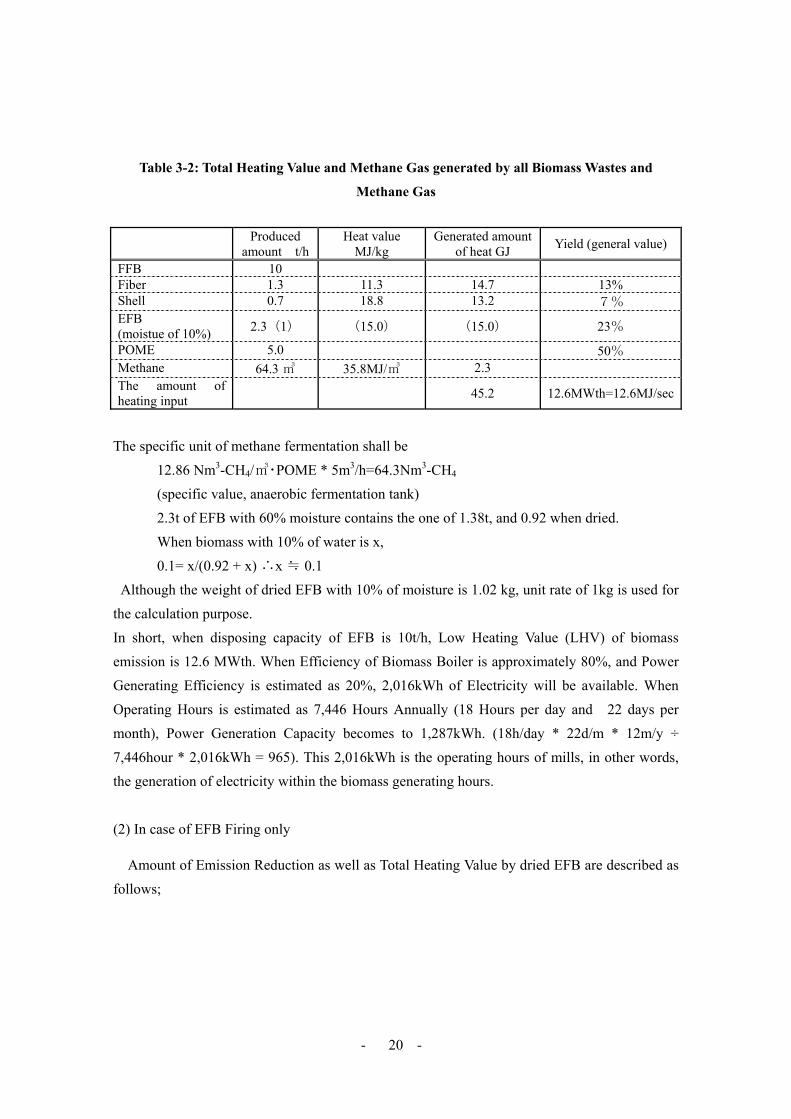
Total amount of Biomass Emission as well as Heating Value are described in the following table.
- - 20
Table 3-2: Total Heating Value and Methane Gas generated by all Biomass Wastes and
Methane Gas
Produced
amount t/h Heat value
MJ/kg Generated amount
of heat GJ Yield (general value)
FFB 10 Fiber 1.3 11.3 14.7 13% Shell 0.7 18.8 13.2 7% EFB (moistue of 10%) 2.3(1) (15.0) (15.0) 23%
POME 5.0 50% Methane 64.3 ㎥ 35.8MJ/㎥ 2.3 The amount of heating input 45.2 12.6MWth=12.6MJ/sec
The specific unit of methane fermentation shall be
12.86 Nm3-CH4/㎥・POME * 5m3/h=64.3Nm3-CH4 (specific value, anaerobic fermentation tank) 2.3t of EFB with 60% moisture contains the one of 1.38t, and 0.92 when dried. When biomass with 10% of water is x,
0.1= x/(0.92 + x) ∴x ≒ 0.1 Although the weight of dried EFB with 10% of moisture is 1.02 kg, unit rate of 1kg is used for
the calculation purpose. In short, when disposing capacity of EFB is 10t/h, Low Heating Value (LHV) of biomass emission is 12.6 MWth. When Efficiency of Biomass Boiler is approximately 80%, and Power Generating Efficiency is estimated as 20%, 2,016kWh of Electricity will be available. When Operating Hours is estimated as 7,446 Hours Annually (18 Hours per day and 22 days per month), Power Generation Capacity becomes to 1,287kWh. (18h/day * 22d/m * 12m/y ÷ 7,446hour * 2,016kWh = 965). This 2,016kWh is the operating hours of mills, in other words, the generation of electricity within the biomass generating hours. (2) In case of EFB Firing only
Amount of Emission Reduction as well as Total Heating Value by dried EFB are described as follows;

- - 21
Table 3-3: The Hating Value and Methane Fermentation
Produced
amount t/h Heat value
MJ/kg Generated amount
of heat GJ Yield
EFB (moisture of 10%) 2.3 (1) (15.0) (15.0) 23%
POME 5.0 50% Methane 64.3 ㎥ 35.8MJ/㎥ 2.3 The amount of heating input 17.3GJ 4.8MWth=4.8MJ/sec
When boiler efficiency is 0.8, and power generating efficiency is 0.2, the production of power
generation will be 768 kW. When Operating Hours is estimated as 7,446 hours annually, the production capacity will be 493 kW. In the universal program for PoA, Methane Capturing from POME lagoons is hesitated to implement, given the conditions that Certification of Reduction is rather complicated and sophisticated equipments are required.
(3) In case of Methane from Lagoon only
Methane Gas can be fed into the Biomass Boiler directly without combusting. Emission Reduction as well as Total Heating Value by biomass are described as follows;.
Table 3-4: Gas based power generation by methane
Produced
amount t/h Heat value
MJ/kg Generated amount
of heat GJ Yield
FFB 10 Fiber 1.3 11.3 14.7 13% Shell 0.7 18.8 13.2 7% The amount of heating input 27.9 7.75MJ
(4) In case of EFB and Methane Gas from Lagoon Amount of Emission Reduction as well as Total Heating Value of EFB are described as follows;.
- - 22
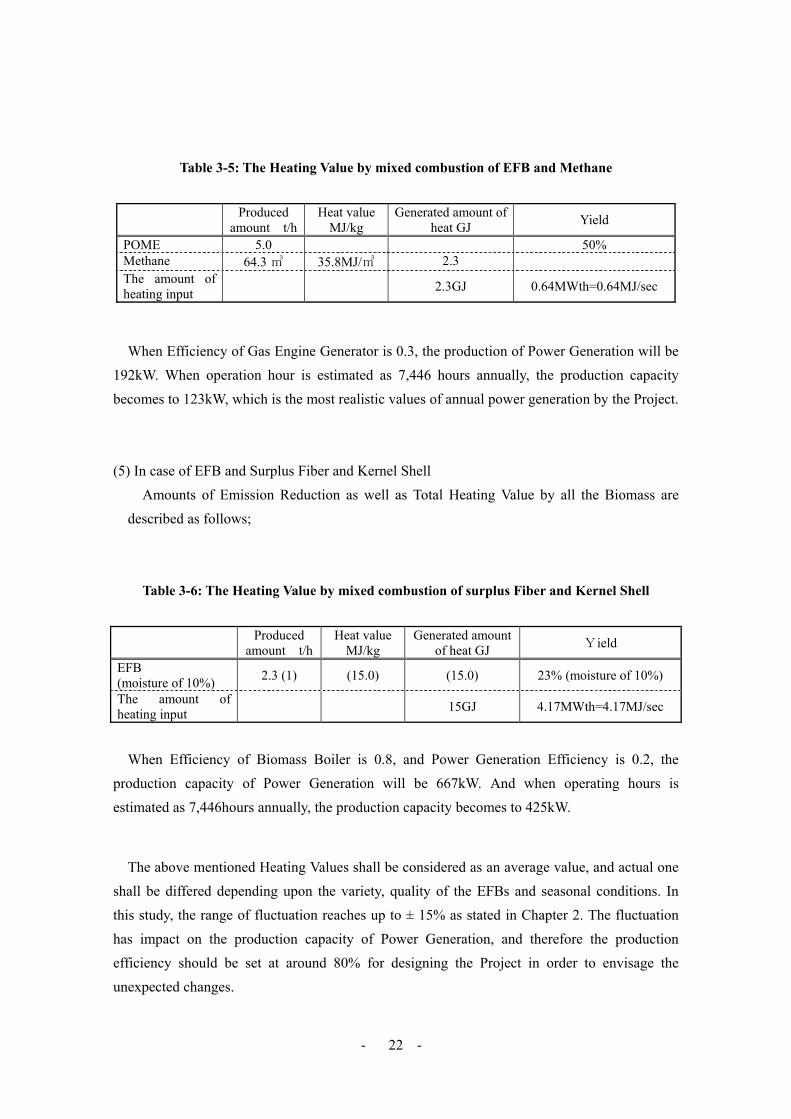
Table 3-5: The Heating Value by mixed combustion of EFB and Methane
Produced
amount t/h Heat value
MJ/kg Generated amount of
heat GJ Yield
POME 5.0 50% Methane 64.3 ㎥ 35.8MJ/㎥ 2.3 The amount of heating input 2.3GJ 0.64MWth=0.64MJ/sec
When Efficiency of Gas Engine Generator is 0.3, the production of Power Generation will be 192kW. When operation hour is estimated as 7,446 hours annually, the production capacity becomes to 123kW, which is the most realistic values of annual power generation by the Project.
(5) In case of EFB and Surplus Fiber and Kernel Shell Amounts of Emission Reduction as well as Total Heating Value by all the Biomass are
described as follows;
Table 3-6: The Heating Value by mixed combustion of surplus Fiber and Kernel Shell
Produced
amount t/h Heat value
MJ/kg Generated amount
of heat GJ Yield
EFB (moisture of 10%) 2.3 (1) (15.0) (15.0) 23% (moisture of 10%)
The amount of heating input 15GJ 4.17MWth=4.17MJ/sec
When Efficiency of Biomass Boiler is 0.8, and Power Generation Efficiency is 0.2, the
production capacity of Power Generation will be 667kW. And when operating hours is estimated as 7,446hours annually, the production capacity becomes to 425kW.
The above mentioned Heating Values shall be considered as an average value, and actual one
shall be differed depending upon the variety, quality of the EFBs and seasonal conditions. In this study, the range of fluctuation reaches up to ± 15% as stated in Chapter 2. The fluctuation has impact on the production capacity of Power Generation, and therefore the production efficiency should be set at around 80% for designing the Project in order to envisage the unexpected changes.

- - 23
3.2.4 Expected Power Generation Capacity
The expected Power Generation Values by different configuration of Biomass and Methane Gas are shown in the following table. These unit rates are derived considering the different conditions of POM Wastes such as Actual disposing amount of FFB at the surveyed POMs, Seasonal changes, Months and Days, in order to figure out most realistic amount for Power Generation by the proposed Project.
Table 3-7: Expected Power Generation Values by various configuration
Combinations of
biomass Total produced amount of heat
Total generated amount of electricity(within operating hours) annual amount
All of biomass (fiber, shell, EFB and Methane)
45.2GJ≒12.6MJ/sec 2,016kW (A) 855kW
Fiber and shell 27.9GJ≒7.8MJ/sec 930kW
Private power generation purpose
(B) 526kW B/A=46%
EFB with moisture of 10% & methane 17.3GJ≒4.8MJ/sec 768kW Unused (C) 493kW C/A 38%
EFB 15GJ≒4.2MJ/sec 667kW Unused (D) 425kW D/A 33%POME Methane 2.3GJ=0.64MJ/sec 192kW Unused (E) 123kW E/A10% According to the table shown herein above, it is found that 62% of fiber and shell is used for the Power Generation for their own use at the most of POMs, and the rest 40% of those Fiber and Kernel are used for different purposes. EFBs and Methane Gases are not used at all for the purpose of Power Generation. Potential Heating Value of Methane Gases accounts for approximately 10% of the total potential generation value, while the EFBs, if once the material is dried as 10% moisture contents, accounts approximately 38 % of the total potential generation values.
Based on the figures as estimated in the Table 3-7, the Potential Power Generation Value by firing EFB with 10% moisture contents and Methane will be 1,275kW at the POM with 30 t/h processing capacity of FFB. The most of the POMs owned by PT. PNs are 30 t/h of FFB Processing Capacity.

- - 24
Table 3-8: Power Generation Potential at the POM with 30 t/h FFB Processing Capacity
Combinations of biomass Specific unit POM (within operating hours)
SPC (annual)
All of biomass (fiber, shell, EFB and Methane) 2,016kW (6,048kW) (3,860kW)
*Fiber and shell 930kW 2,790kW N/A
EFB with moisture of 10% & methane 768kW N/A 1,479kW
**EFB 667kW N/A 1,275kW POME Methane 192kW N/A N/A
* If POM utilizes all the Biomass Wastes such as Fiber, Kernel Shell, EFB and Methane for
Power Generation purposes, potential Power Generation Value accounts 2,790kW, of which 1,500kW is required for internal use and 1,000kW is the surplus.
** When the proposed Power Generation Systems use only EFB for Power Generation purposes, the Potential Power Generation Values accounts approximately 1,275kW.
3.2.5 Expected Performance and Outputs of the Project at EFB 10t/h
As the results of this analysis, the expected Performance and Outputs derived from this Project are summarized as shown in the following table.
- - 25
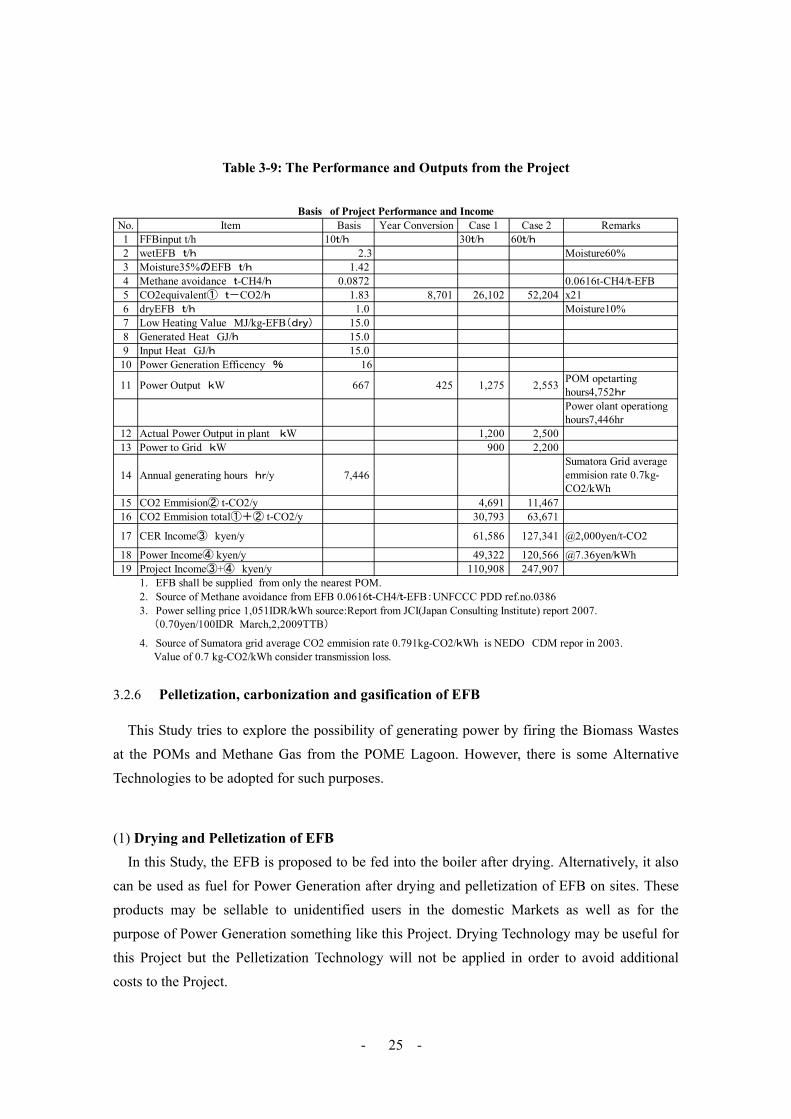
Table 3-9: The Performance and Outputs from the Project
No. Item Basis Year Conversion Case 1 Case 2 Remarks1 FFBinput t/h 10t/h 30t/h 60t/h2 wetEFB t/h 2.3 Moisture60%3 Moisture35%のEFB t/h 1.424 Methane avoidance t-CH4/h 0.0872 0.0616t-CH4/t-EFB5 CO2equivalent① t-CO2/h 1.83 8,701 26,102 52,204 x216 dryEFB t/h 1.0 Moisture10%7 Low Heating Value MJ/kg-EFB(dry) 15.08 Generated Heat GJ/h 15.09 Input Heat GJ/h 15.0
10 Power Generation Efficency % 16
11 Power Output kW 667 425 1,275 2,553 POM opetartinghours4,752hr
Power olant operationghours7,446hr
12 Actual Power Output in plant kW 1,200 2,50013 Power to Grid kW 900 2,200
14 Annual generating hours hr/y 7,446Sumatora Grid averageemmision rate 0.7kg-CO2/kWh
15 CO2 Emmision② t-CO2/y 4,691 11,46716 CO2 Emmision total①+② t-CO2/y 30,793 63,671
17 CER Income③ kyen/y 61,586 127,341 @2,000yen/t-CO2
18 Power Income④ kyen/y 49,322 120,566 @7.36yen/kWh19 Project Income③+④ kyen/y 110,908 247,907
1. EFB shall be supplied from only the nearest POM.2. Source of Methane avoidance from EFB 0.0616t-CH4/t-EFB:UNFCCC PDD ref.no.03863. Power selling price 1,051IDR/kWh source:Report from JCI(Japan Consulting Institute) report 2007. (0.70yen/100IDR March,2,2009TTB)
4. Source of Sumatora grid average CO2 emmision rate 0.791kg-CO2/kWh is NEDO CDM repor in 2003. Value of 0.7 kg-CO2/kWh consider transmission loss.
Basis of Project Performance and Income
3.2.6 Pelletization, carbonization and gasification of EFB
This Study tries to explore the possibility of generating power by firing the Biomass Wastes at the POMs and Methane Gas from the POME Lagoon. However, there is some Alternative Technologies to be adopted for such purposes.
(1) Drying and Pelletization of EFB In this Study, the EFB is proposed to be fed into the boiler after drying. Alternatively, it also
can be used as fuel for Power Generation after drying and pelletization of EFB on sites. These products may be sellable to unidentified users in the domestic Markets as well as for the purpose of Power Generation something like this Project. Drying Technology may be useful for this Project but the Pelletization Technology will not be applied in order to avoid additional costs to the Project.

- - 26
EFB Drying Cutting
CarbonizationPellet Gasification
materials, cooking fuel
Pelletization transportation
EFB Drying Cutting
CarbonizationPellet Gasification
materials, cooking fuel
Pelletization transportation
Fig. 3-6: Advance Processing of EFB
(2) Carbonization and Gasification of EFB As an advanced step of the Drying and Pelletization of EFB, Carbonization and Gasification may be considered. However, mutuality of technology and adoptability to Indonesia market shall be carefully examined as well as the cost implication to the Project viability.
Although several technologies for drying and pelletization are developed and commercially applied, but Carbonization and Gasification technologies are still at the stages of experimental and not the stage of commercial operation. Through the Questionnaire Survey conducted during the Study periods, several negative opinions against this topic have been observed from various stakeholders including POMs, and many of them say that the application of these technologies is premature in such developing countries as Indonesia.
3.2.7 Technical Issues to be solved
(1) Higher Moisture Content The EFB is discharged containing moisture of 60% and decomposes in a day after dumping.
As mentioned at the previous clause, in order to convert the biomass into a fertilizer, it is dumped in the palm plantation or fed into boiler without a drying process, however, it is difficult to catch a fire because the EFB is of 60% of moisture contents. And as for composting, it is just lined in rows along the road and it takes several years until it decomposes as fertilizer, and Methane gas is generated during that periods. On this point, back pressure steam which is generated from turbine in the POM Systems might be applied to reduce moisture content of EFB. According to the results of several literature surveys on moisture of the biomass as well as heating value, there is some correlations in between, and LHV 15MJ/kg may be generated when the EFB with 10% of moisture content is fed. In this study, the biomass is set at 10t/h. The weight of which is discharged from POM is 2.3t when moisture content is 60%, and the weight

- - 27
of moisture is 1.38t. When EFB contains 10% of moisture, and the dried one is x, the removed
moisture amount is 1,280 kg, according to the formula ; 0.1=x/(0.92+x) ∴x≒0.1
0
5
10
15
20
0% 20% 40% 60% 80%moisture
MJ/kg
0
5
10
15
20
0% 20% 40% 60% 80%moisture
MJ/kg
Fig. 3-7: Correlation of Moisture Content and Heating Value on EFB
In case of the POM with treatment capability of 30t/h, the tripled moisture amount of 3,840kg
is able to be removed within an hour through the processes of the following Drying Systems.
15t/h
Condensed waterExternal
steam dryerFlush tank
Sterilizer
CPOheating60→80
degree CEFB
②5bar steam
Boiler20 bar 18t/h
①3bar steam
15t/h
Condensed waterExternal
steam dryerFlush tank
Sterilizer
CPOheating60→80
degree CEFB
②5bar steam
Boiler20 bar 18t/h
①3bar steam
Fig. 3-8: Proposed Drying Procedure
The required heat value for evaporation of 1 kg-moisture is 5MJ/kg, taking the efficiency of
dry system into account. In this case, 3,840kg - moisture, the required heat is 19,200 MJ, which is supplied from back pressure tank. When enthalpy of steam ratio for 3 bar is 2100kJ/kg, the
- - 28
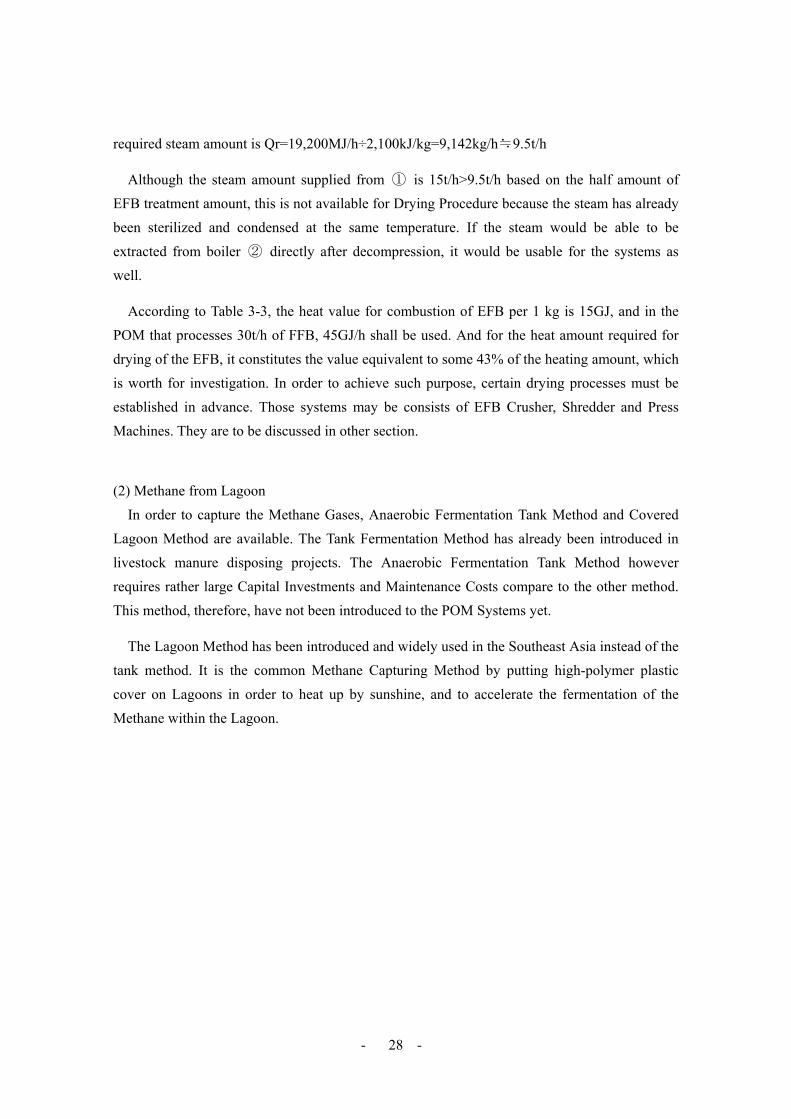
required steam amount is Qr=19,200MJ/h÷2,100kJ/kg=9,142kg/h≒9.5t/h
Although the steam amount supplied from ① is 15t/h>9.5t/h based on the half amount of EFB treatment amount, this is not available for Drying Procedure because the steam has already been sterilized and condensed at the same temperature. If the steam would be able to be
extracted from boiler ② directly after decompression, it would be usable for the systems as well.
According to Table 3-3, the heat value for combustion of EFB per 1 kg is 15GJ, and in the POM that processes 30t/h of FFB, 45GJ/h shall be used. And for the heat amount required for drying of the EFB, it constitutes the value equivalent to some 43% of the heating amount, which is worth for investigation. In order to achieve such purpose, certain drying processes must be established in advance. Those systems may be consists of EFB Crusher, Shredder and Press Machines. They are to be discussed in other section.
(2) Methane from Lagoon
In order to capture the Methane Gases, Anaerobic Fermentation Tank Method and Covered Lagoon Method are available. The Tank Fermentation Method has already been introduced in livestock manure disposing projects. The Anaerobic Fermentation Tank Method however requires rather large Capital Investments and Maintenance Costs compare to the other method. This method, therefore, have not been introduced to the POM Systems yet.
The Lagoon Method has been introduced and widely used in the Southeast Asia instead of the tank method. It is the common Methane Capturing Method by putting high-polymer plastic cover on Lagoons in order to heat up by sunshine, and to accelerate the fermentation of the Methane within the Lagoon.
- - 29
3.3 Selection of the Optimum Systems for utilization of biomass waste
3.3.1 Purposes of the POM Wastes-fired Power Generation and Gas Capturing Project
There will be three (3) major objectives to introduce the proposed POM Wastes-fired Power Generation and Gas Capturing Project. (1) To help support the Rural Electrification Program which have been initiated by the
Government of Indonesia through the extension of DME Program, (2) To improve the Environmental Conditions within the POMs, at the surrounding
communities and to contribute for mitigating the Climate Change at global levels by capturing the methane gas,
(3) To help support the financial sustainability of POMs by providing additional Revenues through the realization of “Waste-to-Energy” concept; the sales of Electric Power to National Grid and/or Off-grid Electricity Districts and the Carbon Credit gained by the Certification of Emission Reduction of GHGs to be issued by the United Nations.
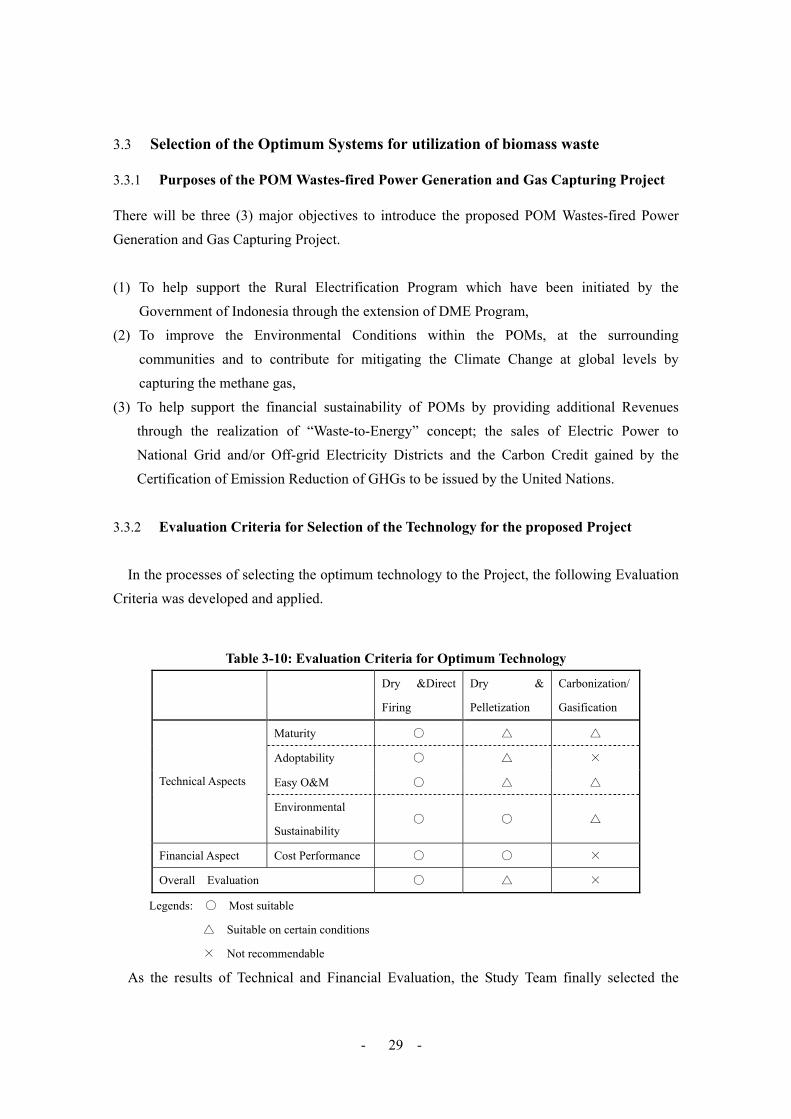
3.3.2 Evaluation Criteria for Selection of the Technology for the proposed Project
In the processes of selecting the optimum technology to the Project, the following Evaluation Criteria was developed and applied.
Table 3-10: Evaluation Criteria for Optimum Technology
Dry &Direct
Firing
Dry &
Pelletization
Carbonization/
Gasification
Maturity ○ △ △
Adoptability ○ △ ×
Easy O&M ○ △ △ Technical Aspects
Environmental
Sustainability ○ ○ △
Financial Aspect Cost Performance ○ ○ ×
Overall Evaluation ○ △ ×
Legends: ○ Most suitable
△ Suitable on certain conditions
× Not recommendable
As the results of Technical and Financial Evaluation, the Study Team finally selected the

- - 30
technology of Dry and Direct Firing Method for the proposed POM Wastes-fired Power Generation and Gas Capturing Project.
3.3.3 Technical Outlines of the Selected Power Generation Systems
As stated in Chapter 3.2.3, the Study Team has selected “Dry and Direct Firing Method” for this Project. If this Project shall be implemented as a PoA verified Project, it is required to implement each Activities of Program under the unified standard form. Thus, the proposed POM Wastes-fired Power Generation and Gas Capturing Project shall be implemented along with the following project components;
(1) Drying and Firing of EFB together with extra Fiber and Kernel in the Biomass Boiler
It is necessary to reduce the Moisture Content of EFBs to the level of less than 20% on site, before firing them in the Biomass Boiler. For Drying Processes, surplus steam from Biomass Boiler, Steam Turbine or Sterilizer is used for that purpose. The dried EFBs together with extra Fiber and Kernel available within the POM, will be fired in the Biomass Boiler of the Power Generation Systems.
For drying up the EFBs, a pair of new Biomass Boiler is recommended in order to avoid to
tough with the existing POM Systems. Thus, the proposed POM Wastes-fired Power Generation and Gas Capturing Systems shall be operational completely independent from the existing POM Operations.
The EFBs which are supplied from the existing POM Operator, shall have moisture contents
of 60% and they shall be processed by the Crusher and smashed by Shredder as well as Screw Press within the premises of the Project Site. The smashed EFBs contain 40% of moisture, and its Low Heating Value (LHV) is 8 MJ/kg. When the supplied amount of EFB is 6.9t/h (moisture of 60%: water of 4.14t, dried content 2.76t), and moisture 40%, the moisture is 1.84t against 2.76t of the dried content. And when the moisture is 10%, it is 0.31t against 2.76t of the dried contents, therefore 1.53t/h (1.84-0.31) of moisture must be removed in order to reduce the moisture from 40% to 10%. Converting in annual hours of 7,446 hours, 1.53t/h * 4,752h/7,446h=0.98t/h, which must be reduced against operating hours of 7,446 hours at the proposed scheme. The amount of heat which is required to remove 1kg of moisture is settled at 5MJ/kg, taking the efficiency of EFB drying system into consideration.
The following figure shows the flow diagram of the proposed Power Generation Systems

- - 31
3 bar steam
Reducer tank Flush tank →condensed water→ POME
Sterilizer
20 barmax 36 t/h
BoilerOver 24 t/h
Back pressure tank 24 t/h steam
Processed steam
3 bar steam
Reducer tank Flush tank →condensed water→ POME
Sterilizer
20 barmax 36 t/h
BoilerOver 24 t/h
Back pressure tank 24 t/h steam
Processed steamReducer tank Flush tank →
condensed water→ POME
Sterilizer
20 barmax 36 t/h
BoilerOver 24 t/h
Back pressure tank 24 t/h steam
Processed steam
Fig. 3-9: Flow Diagram of the proposed POM Wastes-fired Power Generation and Gas
Capturing Systems
(2) Capture Methane Gas from the Covered Lagoon Systems and Flaring The Methane Gases captured from the POME Lagoon shall be fired either in the Biomass
Boiler installed within the Power Generation Systems or at the alongside of the POME Lagoon. Captured Methane Gas has, however, lower Heating Value for Power Generation and lower piping lines to transport the Gases from Lagoon to Power Generation Plant, this Study recommends for flaring the Gases alongside the POME Lagoon and not utilized as an energy source for the Power Generation Systems.
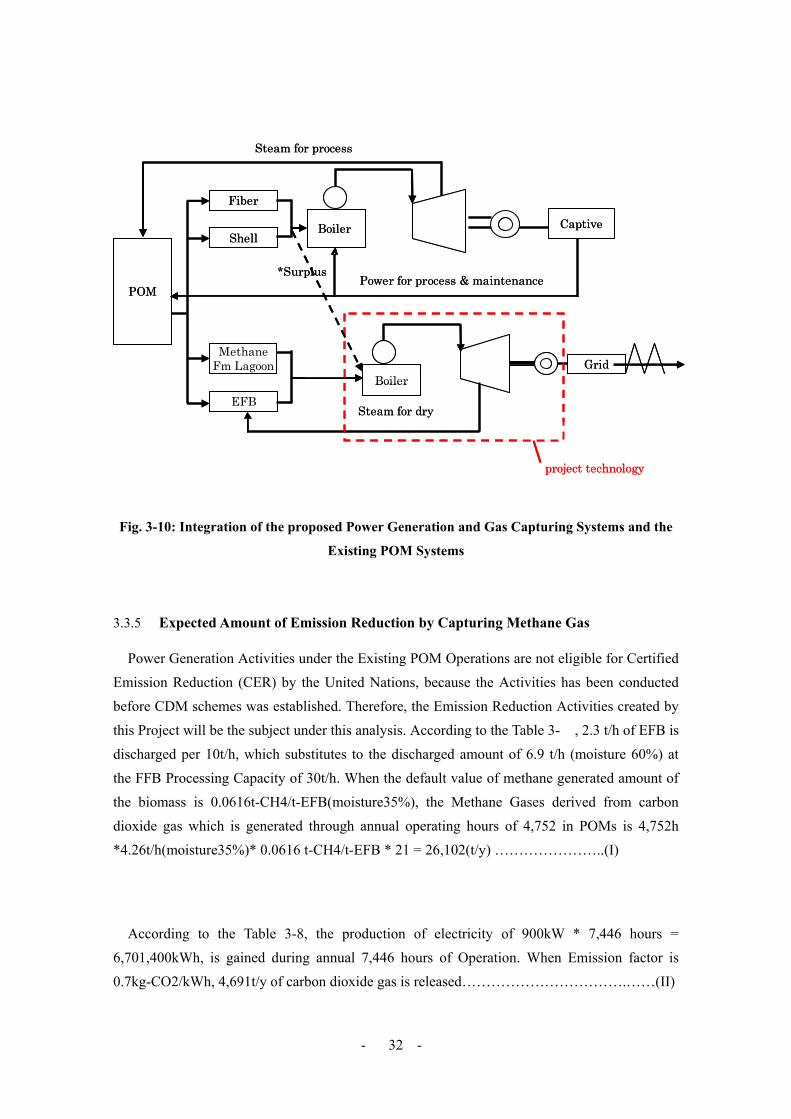
3.3.4 Integration of the proposed Power Generation Systems into the Existing POM Systems
The proposed POM Wastes-fired Power Generation and Gas Capturing Systems shall be properly integrated into the existing POM Systems. Special attention shall be drawn to the points that the Operations of POM are fluctuated depending upon the supply of FFB which varies seasonally while the Operations of the Power Generation Project is required to be consistent throughout the year around. In order to absolve the gap, certain amount of dried EFB shall be kept at the yards of stockpile. Inter-relation of the proposed Power Generation and Gas Capturing Systems and the Existing POM Systems may be illustrated as follows;
- - 32
Steam for process
*SurplusPower for process & maintenance
POM
EFB
MethaneFm Lagoon
Fiber
Shell
Grid
CaptiveBoiler
Steam for dry
Boiler
project technology
Steam for process
*SurplusPower for process & maintenance
POM
EFB
MethaneFm Lagoon
Fiber
Shell
Grid
CaptiveBoiler
Steam for dry
Boiler
project technology
Fig. 3-10: Integration of the proposed Power Generation and Gas Capturing Systems and the
Existing POM Systems
3.3.5 Expected Amount of Emission Reduction by Capturing Methane Gas
Power Generation Activities under the Existing POM Operations are not eligible for Certified Emission Reduction (CER) by the United Nations, because the Activities has been conducted before CDM schemes was established. Therefore, the Emission Reduction Activities created by this Project will be the subject under this analysis. According to the Table 3- , 2.3 t/h of EFB is discharged per 10t/h, which substitutes to the discharged amount of 6.9 t/h (moisture 60%) at the FFB Processing Capacity of 30t/h. When the default value of methane generated amount of the biomass is 0.0616t-CH4/t-EFB(moisture35%), the Methane Gases derived from carbon dioxide gas which is generated through annual operating hours of 4,752 in POMs is 4,752h *4.26t/h(moisture35%)* 0.0616 t-CH4/t-EFB * 21 = 26,102(t/y) …………………..(I)
According to the Table 3-8, the production of electricity of 900kW * 7,446 hours = 6,701,400kWh, is gained during annual 7,446 hours of Operation. When Emission factor is 0.7kg-CO2/kWh, 4,691t/y of carbon dioxide gas is released…………………………….……(II)
- - 33
(I) + (II) = 30,793t/y (the Table 3-9 describes the amount of Potential Power Generation of
900kW this is the difference on calculation method on the equipments).
As leakage, Methane and Nitrous oxide are released at combustion in the Boiler. Although it is difficult to make precise calculation for the revenues from the CER as Carbon Credit, approximately 60 million yen is expected to be earned through the sale of CER as the Carbon Credit, on the conditions that the Project creates 30 kt-Co2 and it can be sold at the rate of 2,000 JPY/t-Co2.
When only Methane is taken up, the generated amount is 64.3 Nm3-CH4* 3 = 202.7N ㎥-CH4 according to the Table 3-5.
Annual amount = 4,752 h* 202.7Nm3-CH4/h = 963,230 Nm3-CH4 = 655t-CH4, When converted into CO2 13,750t/y …………………………….………..………………….(III)
Under this Study, it is proposed that Methane shall be captured by covering lagoons. However,
covering five lagoons is not a practical and not feasible. Methane capturing rate was set as 50% by covering the first Lagoon out of four (4) Lagoons, and the expected amount of Capturing will be half of (III); approximately seven thousand tons.
Meantime, in implementing a PoA Project, the unified methodologies must be applied.
However, distance between the POM Plants and Lagoon is sometime differed POM by POM and taking into the consideration of Capital Investment for the piping facilities for the Methane Gases to the Biomass Boiler to be installed at the Project Site, and necessary modification to the Biomass Boiler for mixed combustion of Methane Gases with the Biomass Wastes, the Study Team opted to flair the Methane Gases at the site of POME Lagoon. This solution may still contribute to create the CER and Carbon Credits by reduction of GHG. The expected Performance and Outputs by the Capturing Methane Gases are shown in the following Table.
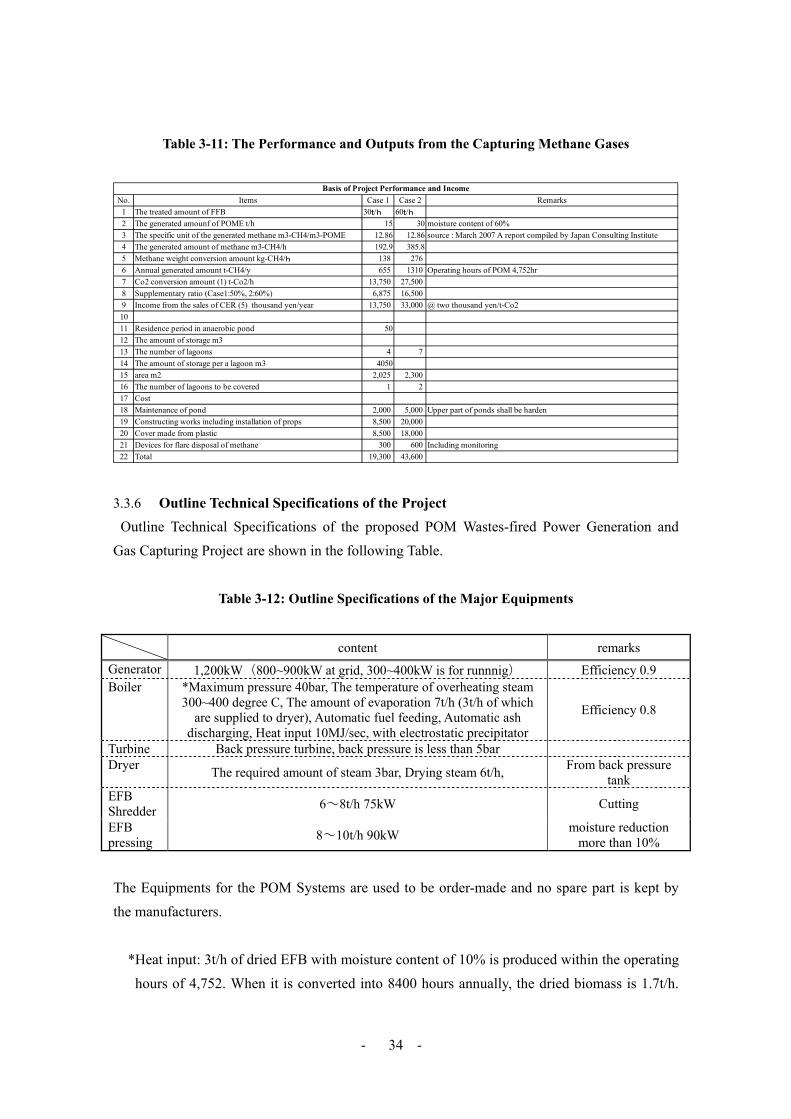
- - 34
Table 3-11: The Performance and Outputs from the Capturing Methane Gases
No. Items Case 1 Case 2 Remarks1 The treated amount of FFB 30t/h 60t/h2 The generated amounf of POME t/h 15 30 moisture content of 60%3 The specific unit of the generated methane m3-CH4/m3-POME 12.86 12.86 source : March 2007 A report compiled by Japan Consulting Institute4 The generated amount of methane m3-CH4/h 192.9 385.85 Methane weight conversion amount kg-CH4/h 138 2766 Annual generated amount t-CH4/y 655 1310 Operating hours of POM 4,752hr7 Co2 conversion amount (1) t-Co2/h 13,750 27,5008 Supplementary ratio (Case1:50%, 2:60%) 6,875 16,5009 Income from the sales of CER (5) thousand yen/year 13,750 33,000 @ two thousand yen/t-Co21011 Residence period in anaerobic pond 5012 The amount of storage m313 The number of lagoons 4 714 The amount of storage per a lagoon m3 405015 area m2 2,025 2,30016 The number of lagoons to be covered 1 217 Cost18 Maintenance of pond 2,000 5,000 Upper part of ponds shall be harden19 Constructing works including installation of props 8,500 20,00020 Cover made from plastic 8,500 18,00021 Devices for flare disposal of methane 300 600 Including monitoring22 Total 19,300 43,600
Basis of Project Performance and Income
3.3.6 Outline Technical Specifications of the Project Outline Technical Specifications of the proposed POM Wastes-fired Power Generation and Gas Capturing Project are shown in the following Table.
Table 3-12: Outline Specifications of the Major Equipments
content remarks Generator 1,200kW(800~900kW at grid, 300~400kW is for runnnig) Efficiency 0.9 Boiler *Maximum pressure 40bar, The temperature of overheating steam
300~400 degree C, The amount of evaporation 7t/h (3t/h of which are supplied to dryer), Automatic fuel feeding, Automatic ash
discharging, Heat input 10MJ/sec, with electrostatic precipitator
Efficiency 0.8
Turbine Back pressure turbine, back pressure is less than 5bar Dryer The required amount of steam 3bar, Drying steam 6t/h, From back pressure
tank EFB Shredder 6~8t/h 75kW Cutting
EFB pressing 8~10t/h 90kW moisture reduction
more than 10%
The Equipments for the POM Systems are used to be order-made and no spare part is kept by the manufacturers.
*Heat input: 3t/h of dried EFB with moisture content of 10% is produced within the operating
hours of 4,752. When it is converted into 8400 hours annually, the dried biomass is 1.7t/h.
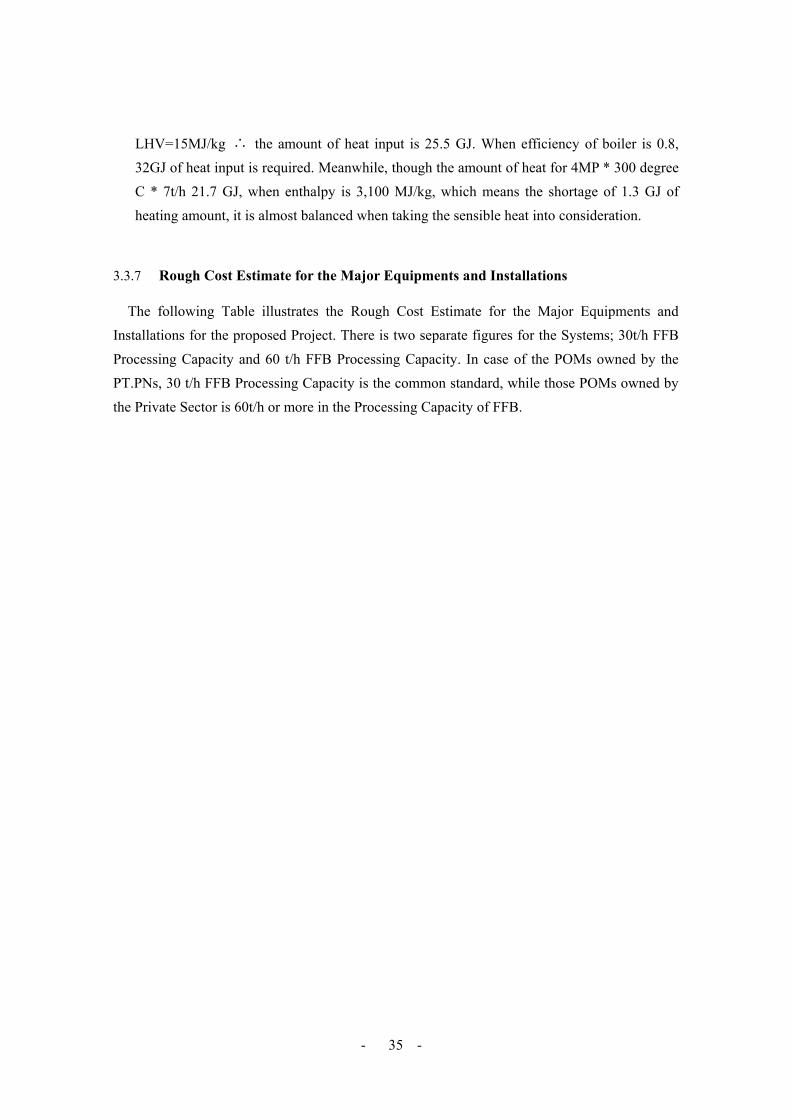
- - 35
LHV=15MJ/kg ∴ the amount of heat input is 25.5 GJ. When efficiency of boiler is 0.8, 32GJ of heat input is required. Meanwhile, though the amount of heat for 4MP * 300 degree C * 7t/h 21.7 GJ, when enthalpy is 3,100 MJ/kg, which means the shortage of 1.3 GJ of heating amount, it is almost balanced when taking the sensible heat into consideration.
3.3.7 Rough Cost Estimate for the Major Equipments and Installations
The following Table illustrates the Rough Cost Estimate for the Major Equipments and Installations for the proposed Project. There is two separate figures for the Systems; 30t/h FFB Processing Capacity and 60 t/h FFB Processing Capacity. In case of the POMs owned by the PT.PNs, 30 t/h FFB Processing Capacity is the common standard, while those POMs owned by the Private Sector is 60t/h or more in the Processing Capacity of FFB.
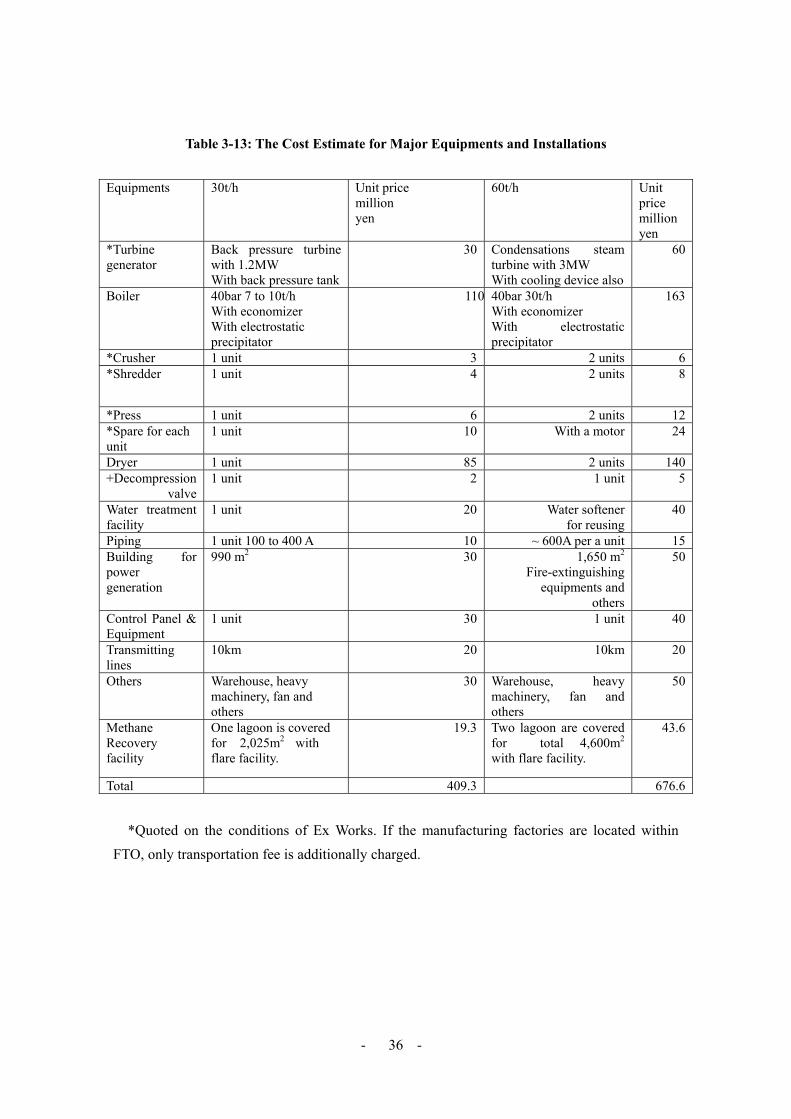
- - 36
Table 3-13: The Cost Estimate for Major Equipments and Installations
Equipments 30t/h Unit price
million yen
60t/h Unit price million yen
*Turbine generator
Back pressure turbine with 1.2MW With back pressure tank
30 Condensations steam turbine with 3MW With cooling device also
60
Boiler 40bar 7 to 10t/h With economizer With electrostatic precipitator
110 40bar 30t/h With economizer With electrostatic precipitator
163
*Crusher 1 unit 3 2 units 6 *Shredder 1 unit 4 2 units 8
*Press 1 unit 6 2 units 12 *Spare for each unit
1 unit 10 With a motor 24
Dryer 1 unit 85 2 units 140 +Decompression
valve 1 unit 2 1 unit 5
Water treatment facility
1 unit 20 Water softener for reusing
40
Piping 1 unit 100 to 400 A 10 ~ 600A per a unit 15 Building for power generation
990 m2 30 1,650 m2 Fire-extinguishing
equipments and others
50
Control Panel & Equipment
1 unit 30 1 unit 40
Transmitting lines
10km 20 10km 20
Others Warehouse, heavy machinery, fan and others
30 Warehouse, heavy machinery, fan and others
50
Methane Recovery facility
One lagoon is covered for 2,025m2 with flare facility.
19.3 Two lagoon are covered for total 4,600m2 with flare facility.
43.6
Total 409.3 676.6
*Quoted on the conditions of Ex Works. If the manufacturing factories are located within FTO, only transportation fee is additionally charged.
- - 37
3.4 Outline of PoA and its Applicability to the Project
In this Chapter, the Concept and Applicability of the Program of Activities (PoA) is intensively discussed and explored applicability of PoA to the proposed Project together with the recommended Structure for the implementation of this Project as a verified PoA Project by the United Nations
3.4.1 Definition and Outlines of the PoA Concept
The brief definitions of PoA may be digested as under;
(1) Programme of Activities (PoA) is: - a voluntary coordinated action, - by a private or public entity, - which coordinates and implements any policy/measure or stated goal, i.e. incentive schemes and voluntary programs,
- which leads to GHG emission reductions or increase removals by sinks additionally, - via an unlimited number of CDM program activity, - and able to registered as a single CDM project activity.
(2) CDM program activity (CPA) is:
- a project activity under a Program of Activities, - a single, or a set of interrelated measure(s), - to reduce GHG emissions or result in net removals by sinks, applied within a designated area defined in the baseline methodology.
There is several basic key words governing the core activities under the PoA, and they will
be summarized as follows.
(3) Coordinating and Managing Entity (CME) is; The Implementation body of PoA, roles and function of which are summarized as:
A PoA shall be proposed by the coordinating or managing entity which shall be a Project Participants (PP) authorized by all participating host country DNA involved and identified in the modalities of communication as the entity which communicates with the CDM EB, including on matters relating to the distribution of CERs.

- - 38
Project Participants of the PoA shall make arrangements with the coordinator or managing entity, relating to communications, distribution of CERs and change of Project Participants. (4) Boundary of PoA;
The physical boundary of a PoA may extend to more than one country provided that each participating non-annex I host Party provides confirmation that the PoA, and thereby all CPAs, assists it in achieving sustainable development. (5) Baseline and additionality;
All CPAs of a PoA shall apply the same Approved Methodology (AM), The PoA shall demonstrate that GHG reductions or net removals by sinks for each CPA under the PoA are real and measurable, are an accurate reflection of what has occurred within the project boundary, and are uniquely attributable to the PoA.
The PoA shall therefore define at registration, the type of information which is to be
provided for each CPA to ensure that leakage, additionality, establishment of the baseline, baseline emissions, eligibility and double counting are unambiguously defined for each CPA within the PoA.
If the Approved Methodology is put on hold or withdrawn, not for the purpose of inclusion
in a consolidation, no new CPAs shall be added to the PoA in accordance with the timelines indicated in procedures.
If the methodology is subsequently revised or replaced by inclusion in a consolidated
methodology, the PoA shall be revised accordingly and changes validated by a DOE and approved by the CDM EB. Once changes have been approved by the CDM EB, each CPA included in the PoA thereafter has to use the new version of the PoA.
CPAs included prior to the methodology being put on hold, shall apply the new version of
the PoA at the time of the renewal of its crediting period. (6) Project Scale;
In the case of CPAs which individually do not exceed the SSC threshold, SSC methodologies may be used. (7) Applicable GHG reduction methodology, technology and measure
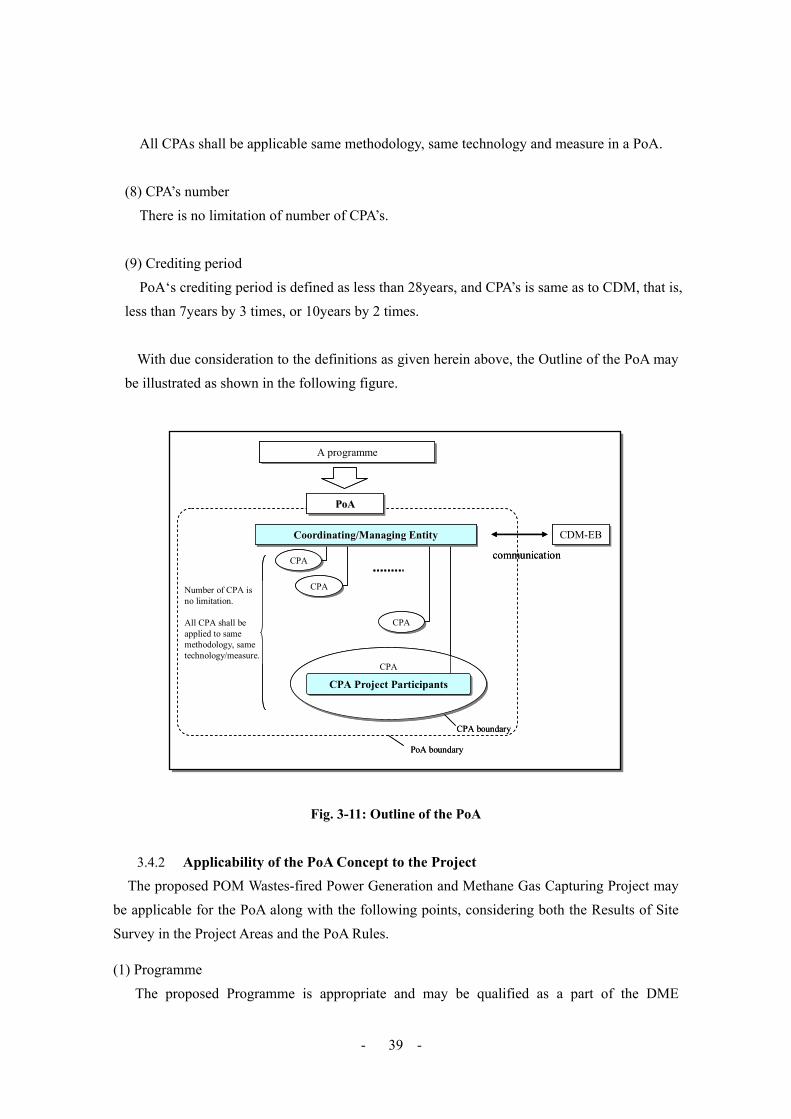
- - 39
All CPAs shall be applicable same methodology, same technology and measure in a PoA. (8) CPA’s number
There is no limitation of number of CPA’s. (9) Crediting period
PoA‘s crediting period is defined as less than 28years, and CPA’s is same as to CDM, that is, less than 7years by 3 times, or 10years by 2 times.
With due consideration to the definitions as given herein above, the Outline of the PoA may be illustrated as shown in the following figure.
Fig. 3-11: Outline of the PoA
3.4.2 Applicability of the PoA Concept to the Project The proposed POM Wastes-fired Power Generation and Methane Gas Capturing Project may
be applicable for the PoA along with the following points, considering both the Results of Site Survey in the Project Areas and the PoA Rules.
(1) Programme The proposed Programme is appropriate and may be qualified as a part of the DME
CPA boundary
Number of CPA is no limitation.
All CPA shall be applied to same methodology, same technology/measure.
CDM-EBCDM-EB
communication
A programmeA programme
CPACPA
CPACPA
CPA Project ParticipantsCPA Project Participants
PoAPoAPoA
CPACPA
CPACPA
Coordinating/Managing EntityCoordinating/Managing EntityCoordinating/Managing Entity
PoA boundary
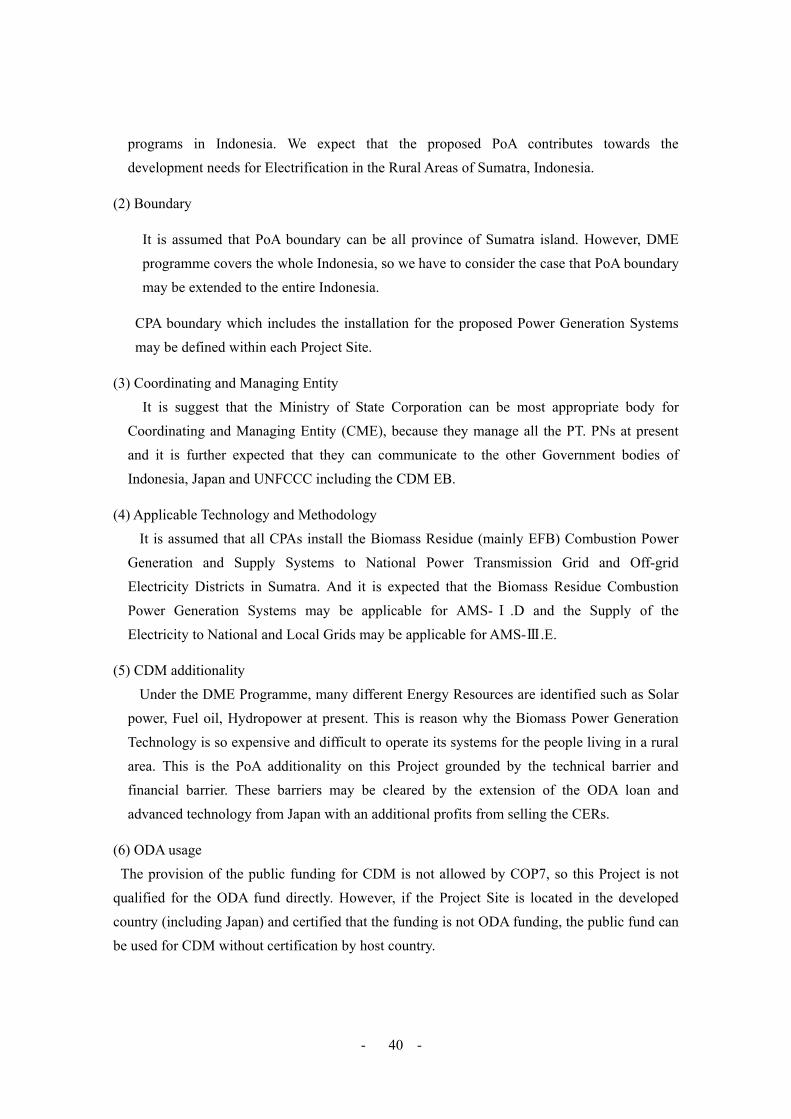
- - 40
programs in Indonesia. We expect that the proposed PoA contributes towards the development needs for Electrification in the Rural Areas of Sumatra, Indonesia.
(2) Boundary
It is assumed that PoA boundary can be all province of Sumatra island. However, DME programme covers the whole Indonesia, so we have to consider the case that PoA boundary may be extended to the entire Indonesia.
CPA boundary which includes the installation for the proposed Power Generation Systems may be defined within each Project Site.
(3) Coordinating and Managing Entity It is suggest that the Ministry of State Corporation can be most appropriate body for
Coordinating and Managing Entity (CME), because they manage all the PT. PNs at present and it is further expected that they can communicate to the other Government bodies of Indonesia, Japan and UNFCCC including the CDM EB.
(4) Applicable Technology and Methodology It is assumed that all CPAs install the Biomass Residue (mainly EFB) Combustion Power
Generation and Supply Systems to National Power Transmission Grid and Off-grid Electricity Districts in Sumatra. And it is expected that the Biomass Residue Combustion
Power Generation Systems may be applicable for AMS-Ⅰ .D and the Supply of the Electricity to National and Local Grids may be applicable for AMS-Ⅲ.E.
(5) CDM additionality Under the DME Programme, many different Energy Resources are identified such as Solar
power, Fuel oil, Hydropower at present. This is reason why the Biomass Power Generation Technology is so expensive and difficult to operate its systems for the people living in a rural area. This is the PoA additionality on this Project grounded by the technical barrier and financial barrier. These barriers may be cleared by the extension of the ODA loan and advanced technology from Japan with an additional profits from selling the CERs.
(6) ODA usage The provision of the public funding for CDM is not allowed by COP7, so this Project is not
qualified for the ODA fund directly. However, if the Project Site is located in the developed country (including Japan) and certified that the funding is not ODA funding, the public fund can be used for CDM without certification by host country.

- - 41
(7) Environmental Impact Assessment (EIA) EFB Combustion Generation Systems in a degree of 5-10MW is not imposed on in the present
EIA regulation in Indonesia. However, this Project may execute spontaneous EIA when the CDM project starts.
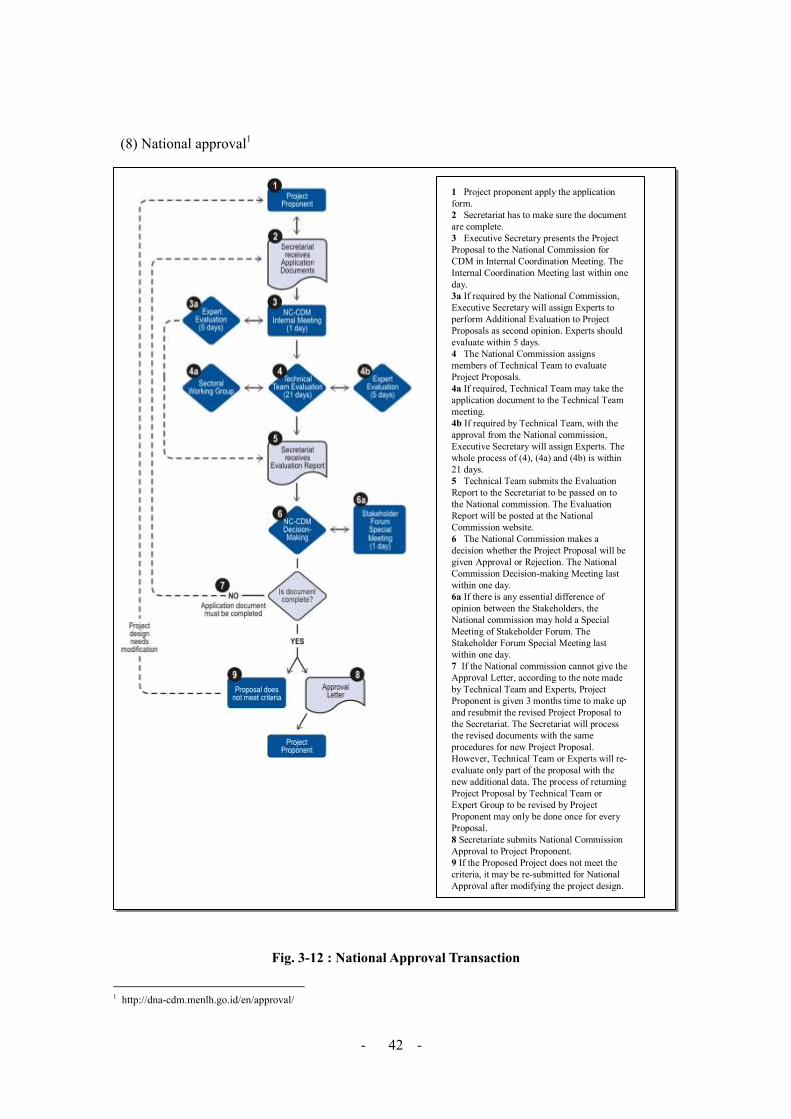
- - 42
(8) National approval1
Fig. 3-12 : National Approval Transaction
1 http://dna-cdm.menlh.go.id/en/approval/
1 Project proponent apply the application form.2 Secretariat has to make sure the document are complete.3 Executive Secretary presents the Project Proposal to the National Commission for CDM in Internal Coordination Meeting. The Internal Coordination Meeting last within one day. 3a If required by the National Commission, Executive Secretary will assign Experts to perform Additional Evaluation to Project Proposals as second opinion. Experts should evaluate within 5 days. 4 The National Commission assigns members of Technical Team to evaluate Project Proposals. 4a If required, Technical Team may take the application document to the Technical Team meeting.4b If required by Technical Team, with the approval from the National commission, Executive Secretary will assign Experts. The whole process of (4), (4a) and (4b) is within 21 days.5 Technical Team submits the Evaluation Report to the Secretariat to be passed on to the National commission. The Evaluation Report will be posted at the National Commission website.6 The National Commission makes a decision whether the Project Proposal will be given Approval or Rejection. The National Commission Decision-making Meeting last within one day. 6a If there is any essential difference of opinion between the Stakeholders, the National commission may hold a Special Meeting of Stakeholder Forum. The Stakeholder Forum Special Meeting last within one day. 7 If the National commission cannot give the Approval Letter, according to the note made by Technical Team and Experts, Project Proponent is given 3 months time to make up and resubmit the revised Project Proposal to the Secretariat. The Secretariat will process the revised documents with the same procedures for new Project Proposal. However, Technical Team or Experts will re-evaluate only part of the proposal with the new additional data. The process of returning Project Proposal by Technical Team or Expert Group to be revised by Project Proponent may only be done once for every Proposal.8 Secretariate submits National Commission Approval to Project Proponent. 9 If the Proposed Project does not meet the criteria, it may be re-submitted for National Approval after modifying the project design.

- - 43
(9) CDM Criteria2 CDM Criteria is provided in terms of Environment, Economy, Social and Technology. This
Project may satisfy all the Conditions required under this clause.
Fig. 3-13:CDM Criteria-Environment
Fig. 3-14: CDM Criteria-Economy
2 http://dna-cdm.menlh.go.id/en/susdev/
EnvironmentThe scope of evaluation is the area having direct ecological impacts from the project.
・ Criteria: Environmental sustainability by practicing natural resource cnservation ordiversification
○Indicator: Maintain sustainability of local ecological functions○Indicator: Not exceeding the threshold of existing national, as well as local,
environmental standards (not causing air, water and/or soil pollution) ○ Indicator: Maintaining genetic, species, and ecosystem biodiversity and not
permitting any genetic pollution○Indicator: Complying with existing land use planning
・ Criteria: Local community health and safety○ Indicator: Not imposing any health risk ○ Indicator : Complying with occupational health and safety regulation ○ Indicator: There is a documented procedure of adequate actions to be taken in
order to prevent and manage possible accidents
EconomyThe scope of evaluation is administrative border of regency. If the impacts are cross
boundary, the scope of evaluation includes all impacted regencies. ・ Criteria: Local community welfare
○Indicator: Not lowering local community’s income ○Indicator: There are adequate measures to overcome the possible impact of
lowered income of community members ○ Indicator: Not lowering local public services○Indicator: An agreement among conflicting parties is reached, conforming toexisting regulation, dealing with any lay-off problems
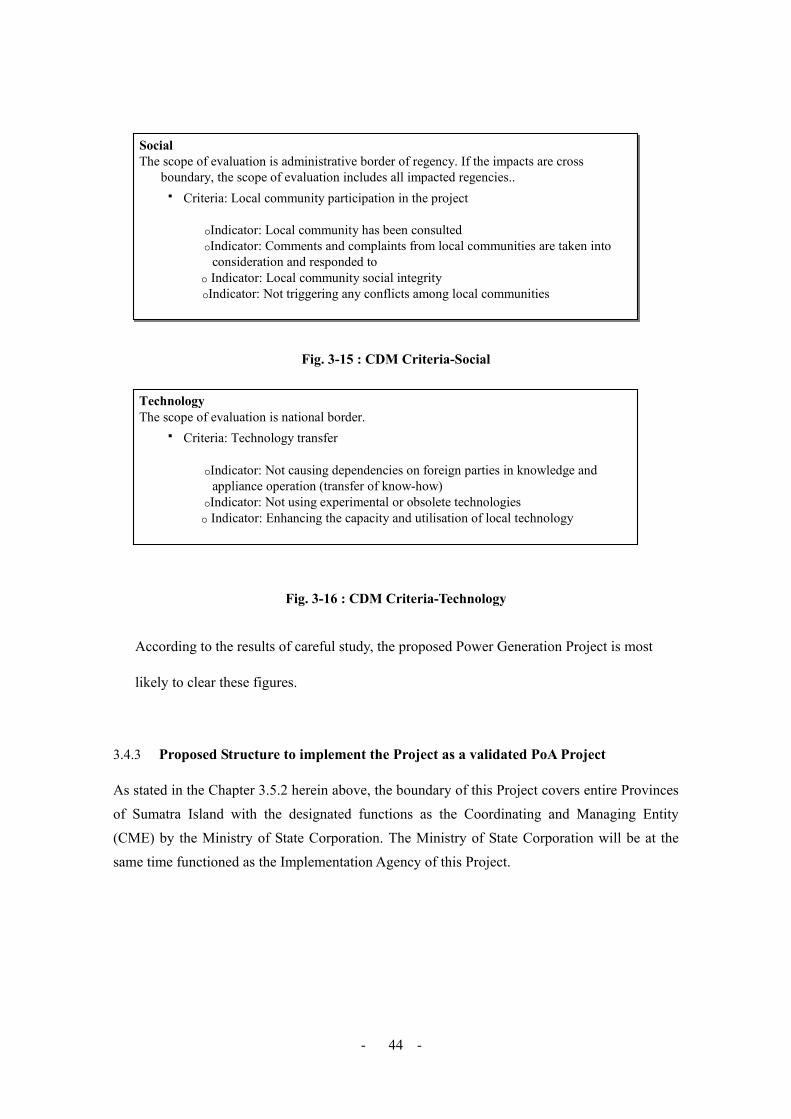
- - 44
Fig. 3-15 : CDM Criteria-Social
Fig. 3-16 : CDM Criteria-Technology
According to the results of careful study, the proposed Power Generation Project is most
likely to clear these figures.
3.4.3 Proposed Structure to implement the Project as a validated PoA Project
As stated in the Chapter 3.5.2 herein above, the boundary of this Project covers entire Provinces of Sumatra Island with the designated functions as the Coordinating and Managing Entity (CME) by the Ministry of State Corporation. The Ministry of State Corporation will be at the same time functioned as the Implementation Agency of this Project.
SocialThe scope of evaluation is administrative border of regency. If the impacts are cross
boundary, the scope of evaluation includes all impacted regencies.. ・ Criteria: Local community participation in the project
○Indicator: Local community has been consulted ○Indicator: Comments and complaints from local communities are taken into
consideration and responded to○ Indicator: Local community social integrity ○Indicator: Not triggering any conflicts among local communities
TechnologyThe scope of evaluation is national border.
・ Criteria: Technology transfer
○Indicator: Not causing dependencies on foreign parties in knowledge and appliance operation (transfer of know-how)
○Indicator: Not using experimental or obsolete technologies ○ Indicator: Enhancing the capacity and utilisation of local technology

- - 45
CPA in PT.PN-ⅠCPA in
PT.PN-Ⅰ
CPA in PT.PN-ⅣCPA in
PT.PN-Ⅳ CPA in PT.PN-ⅤCPA in
PT.PN-Ⅴ
CPA in PT.PN-ⅥCPA in
PT.PN-Ⅵ
CPA inPT.PN-ⅦCPA in
PT.PN-Ⅶ
CPA in PT.PN-ⅢCPA in
PT.PN-ⅢCPA in PT.PN-ⅡCPA in
PT.PN-Ⅱ
Ministry of State CorporationManage / Coordinate the CPA
Ministry of State CorporationManage / Coordinate the CPA
PoAPoA
Fig. 3-17 : Concept of PoA under DME
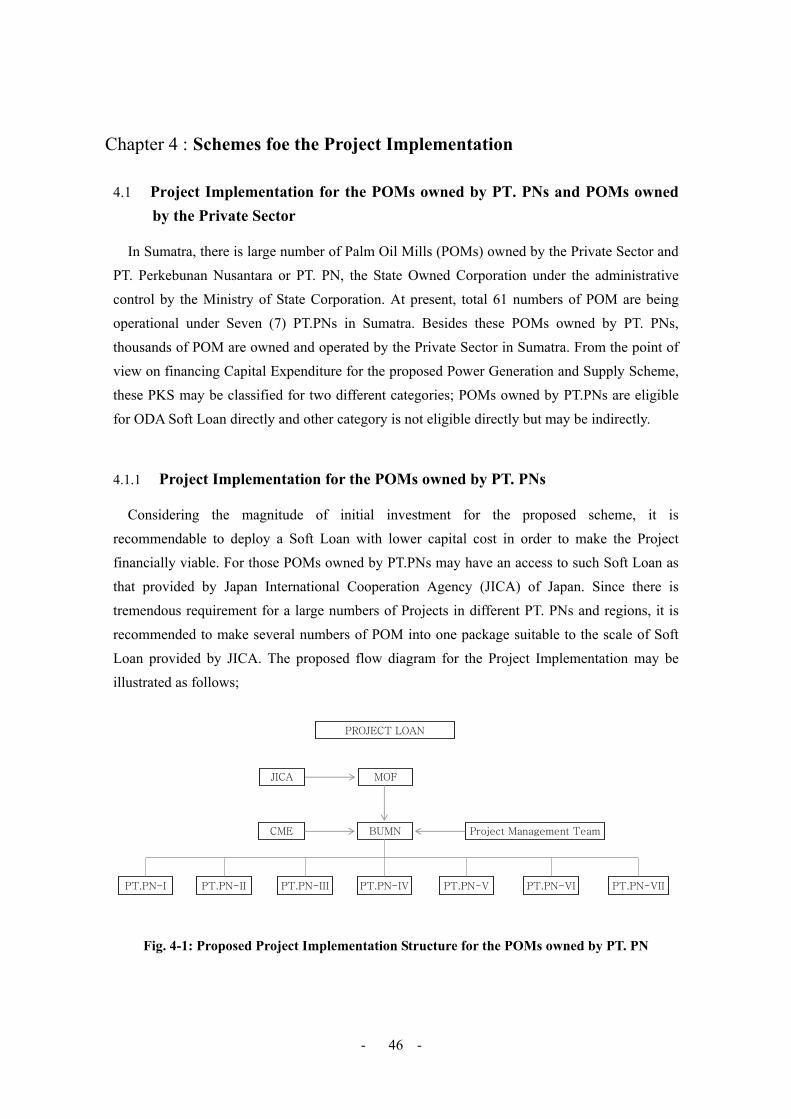
- - 46
Chapter 4 : Schemes foe the Project Implementation
4.1 Project Implementation for the POMs owned by PT. PNs and POMs owned by the Private Sector
In Sumatra, there is large number of Palm Oil Mills (POMs) owned by the Private Sector and PT. Perkebunan Nusantara or PT. PN, the State Owned Corporation under the administrative control by the Ministry of State Corporation. At present, total 61 numbers of POM are being operational under Seven (7) PT.PNs in Sumatra. Besides these POMs owned by PT. PNs, thousands of POM are owned and operated by the Private Sector in Sumatra. From the point of view on financing Capital Expenditure for the proposed Power Generation and Supply Scheme, these PKS may be classified for two different categories; POMs owned by PT.PNs are eligible for ODA Soft Loan directly and other category is not eligible directly but may be indirectly.
4.1.1 Project Implementation for the POMs owned by PT. PNs
Considering the magnitude of initial investment for the proposed scheme, it is recommendable to deploy a Soft Loan with lower capital cost in order to make the Project financially viable. For those POMs owned by PT.PNs may have an access to such Soft Loan as that provided by Japan International Cooperation Agency (JICA) of Japan. Since there is tremendous requirement for a large numbers of Projects in different PT. PNs and regions, it is recommended to make several numbers of POM into one package suitable to the scale of Soft Loan provided by JICA. The proposed flow diagram for the Project Implementation may be illustrated as follows;
PT.PN-I PT.PN-II PT.PN-III PT.PN-IV PT.PN-V PT.PN-VI PT.PN-VII
BUMN Project Management TeamCME
MOFJICA
PROJECT LOAN
Fig. 4-1: Proposed Project Implementation Structure for the POMs owned by PT. PN
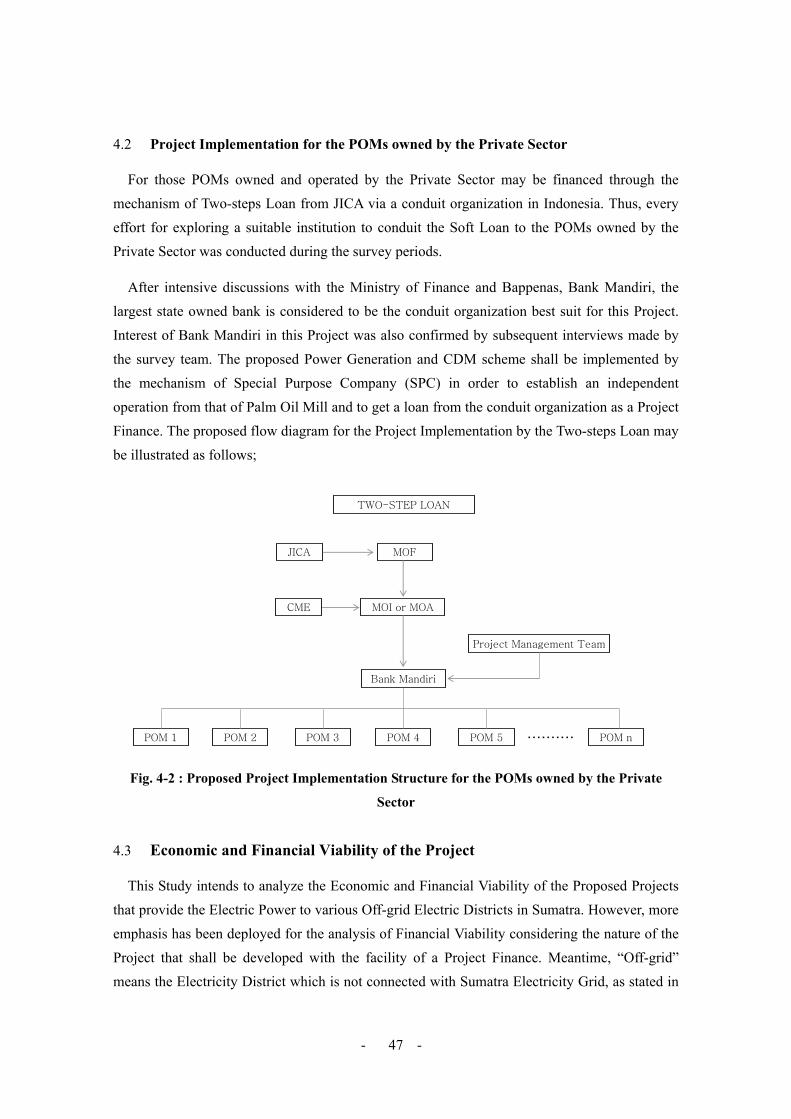
- - 47
4.2 Project Implementation for the POMs owned by the Private Sector
For those POMs owned and operated by the Private Sector may be financed through the mechanism of Two-steps Loan from JICA via a conduit organization in Indonesia. Thus, every effort for exploring a suitable institution to conduit the Soft Loan to the POMs owned by the Private Sector was conducted during the survey periods.
After intensive discussions with the Ministry of Finance and Bappenas, Bank Mandiri, the largest state owned bank is considered to be the conduit organization best suit for this Project. Interest of Bank Mandiri in this Project was also confirmed by subsequent interviews made by the survey team. The proposed Power Generation and CDM scheme shall be implemented by the mechanism of Special Purpose Company (SPC) in order to establish an independent operation from that of Palm Oil Mill and to get a loan from the conduit organization as a Project Finance. The proposed flow diagram for the Project Implementation by the Two-steps Loan may be illustrated as follows;
POM 1 POM 2 POM 3 POM 4 POM 5 POM n
MOI or MOA
Project Management Team
CME
MOFJICA
TWO-STEP LOAN
Bank Mandiri
・・・・・・・・・・
Fig. 4-2 : Proposed Project Implementation Structure for the POMs owned by the Private
Sector
4.3 Economic and Financial Viability of the Project
This Study intends to analyze the Economic and Financial Viability of the Proposed Projects that provide the Electric Power to various Off-grid Electric Districts in Sumatra. However, more emphasis has been deployed for the analysis of Financial Viability considering the nature of the Project that shall be developed with the facility of a Project Finance. Meantime, “Off-grid” means the Electricity District which is not connected with Sumatra Electricity Grid, as stated in

- - 48
the Chapter 2. This Biomass Wastes-fired Power Generation Systems shall be developed at Twenty-two (22) POMs in Sumatra simultaneously and expected Revenues are the Revenue from the sale of extra Electricity to the Provincial PLN Offices whose administrate the Off-grid power distribution networks and Revenue from the Sale of Carbon Credit derived from this venture. Thus, this financial viability analysis was conducted for Twenty-two (22) Biomass Wastes-fired Power Generation Project as one package that shall be implemented by PT. PNs under the administrative monitoring by the Ministry of State Corporation.
4.3.1 Pre-conditions for the Financial Viability Analysis The Financial Viability Analysis has been conducted based on the following pre-conditions.
・All the Plants, Equipments and other Components shall be procured in the Republic of Indonesia, except for a few component,
・Inflation factors in relation to this Capital Investment are eliminated in this analysis, Selling Price of Electric Power to the Provincial Office of National Electricity Corporation (PLN) shall be determined based on the Unit Price for inter-connection under the medium voltage transmission which shall be governed by the Ministerial Decree No. 2 of 2006, that was issued by the Ministry of Energy and Mineral Resources, the Republic of Indonesia,
・Sale of Carbon Credit will be realized after One (1) year from the commencement of Operation of the Power Generation Systems,
Capital Cost for the Project shall be based on the costs imposed by a Soft Loan to be provided
under the Official Development Assistance program by the Government of Japan or similar facility.
4.3.2 Total required costs for the Project
○ Composition of the Project Costs The Capital Expenditures required for the development of Power Generation facilities have
been estimated along with the following payment categories;
(a)Dehydration Facility for EFBs, (b)Power Generator, (c)Methane Gas Capturing and Piping Facility, (d)Engineering Services,

- - 49
(e)General Administration Costs, (f)Contingency.
○ Currency and Foreign Exchange Rates The Investment costs have been separately estimated in the Foreign and Local Currencies
based on the following exchange rates;
One (1) U.S. Dollars = 100 Japanese Yen = 12,000 Indonesian Rupees
○ General Administration Costs and Contingency General Administration Costs cover all the Costs by the Implementation Agency for the
administration of the Project during the preparation and construction of the Project, and Five (5) percent of the Investment Costs identified under the pay items (a), (b) and (c) hereinabove was allocated. In the meantime, the Contingency shall be responded to risks of the Project during the periods of Planning and Construction, and Five (5) percent of the Construction Costs were allocated based on the experiences in the similar projects in the Republic of Indonesia.
○ The Breakdown of the Project Costs The total project costs for 30 tons/hour and 60 tons/hour are broken down in the following tables.
Table 4-1: Break Down of the Project Cost (FFB Process Capacity: 30 tons/hour)
Foreign Currency Local Currency Total Mill. Yen
Bill Rupee
Mill. Yen Bill. Rupee
Mill. Yen Bill. Rupee
1 Dehydration of EFB & Boiler
100 0
0 15.3 100 (127)
15.3
2 Collection of Methane Gas & Piping
0 0 0 5.2 (43) 5.2
3 Generator( 1,200kW) Transmission Line
30 0 0 10.8 30 (90)
10.8
4 Engineering Fees 10 0 0 0 10 05 General
Administration 0 0 0 3.8 (32) 3.8
6 Contingency(5%) 0 0 0 2 (24) 27 Total 140 0 0 37.9 456
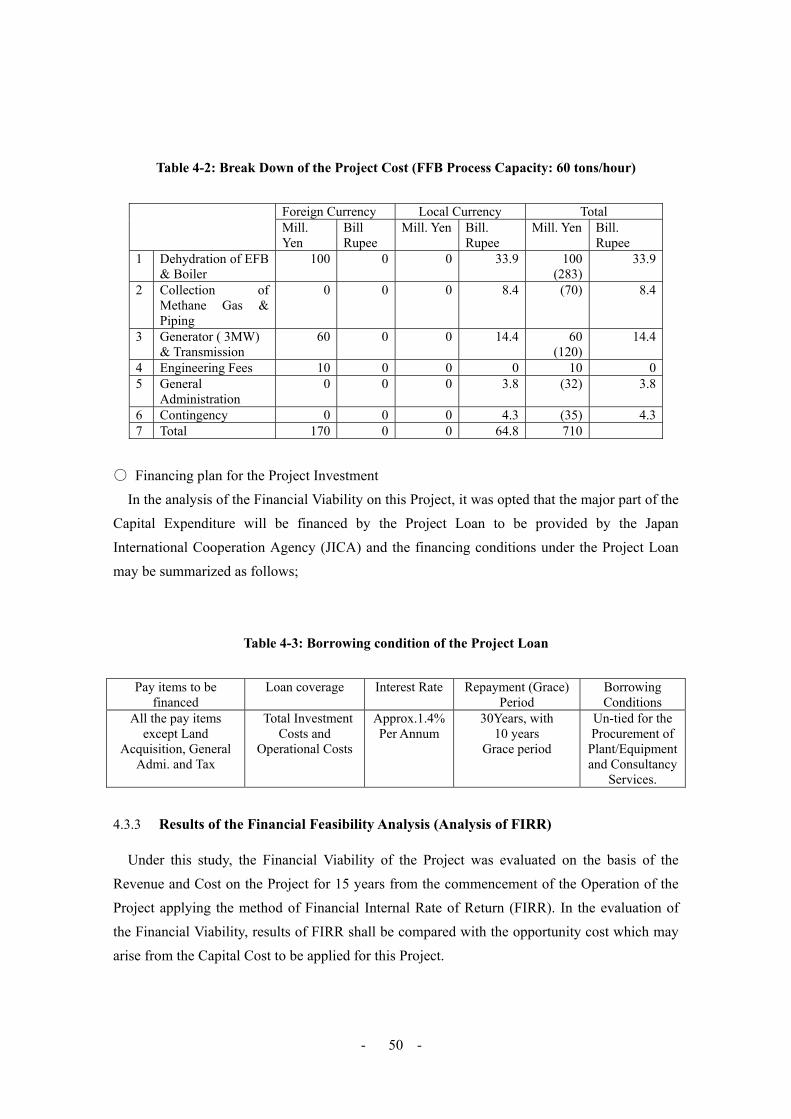
- - 50
Table 4-2: Break Down of the Project Cost (FFB Process Capacity: 60 tons/hour)
Foreign Currency Local Currency Total Mill. Yen
Bill Rupee
Mill. Yen Bill. Rupee
Mill. Yen Bill. Rupee
1 Dehydration of EFB & Boiler
100 0 0 33.9 100 (283)
33.9
2 Collection of Methane Gas & Piping
0 0 0 8.4 (70) 8.4
3 Generator ( 3MW) & Transmission
60 0 0 14.4 60 (120)
14.4
4 Engineering Fees 10 0 0 0 10 05 General
Administration 0 0 0 3.8 (32) 3.8
6 Contingency 0 0 0 4.3 (35) 4.37 Total 170 0 0 64.8 710
○ Financing plan for the Project Investment In the analysis of the Financial Viability on this Project, it was opted that the major part of the
Capital Expenditure will be financed by the Project Loan to be provided by the Japan International Cooperation Agency (JICA) and the financing conditions under the Project Loan may be summarized as follows;
Table 4-3: Borrowing condition of the Project Loan
Pay items to be
financed Loan coverage Interest Rate Repayment (Grace)
Period Borrowing Conditions
All the pay items except Land
Acquisition, General Admi. and Tax
Total Investment Costs and
Operational Costs
Approx.1.4% Per Annum
30Years, with 10 years
Grace period
Un-tied for the Procurement of
Plant/Equipment and Consultancy
Services.
4.3.3 Results of the Financial Feasibility Analysis (Analysis of FIRR)
Under this study, the Financial Viability of the Project was evaluated on the basis of the Revenue and Cost on the Project for 15 years from the commencement of the Operation of the Project applying the method of Financial Internal Rate of Return (FIRR). In the evaluation of the Financial Viability, results of FIRR shall be compared with the opportunity cost which may arise from the Capital Cost to be applied for this Project.

- - 51
○ Project Cash-In Flow In-flow of Cash under this Project consists of (1) Equity and Borrowings for the Initial
Investment, (2) Sale of Electric Power, (3) Sale of Carbon Credit, and (4) Saving from the Fuel and Operational Costs at the existing High Speed Diesel (HSD) Generation Systems in the Off-grid Electric District.
○ Equity and Borrowing for the Capital Investment Among the total costs required for the development of the such Capital Outlays as Plants,
Equipments, Buildings and Operational Costs in it first year, it was assumed that Ten (10) percent of the total sums may be paid up by PT. PNs as the Equity, and the rest of the Capital Expenditures shall be covered by the Project Loan to be provided by JICA. Anticipated Capital Cost for discounting the revenues may be summarized as follows;
Table 4-4: Details of the Capital Cost and WACC
Loans Financing Method
ODA Loan NEDO’s Advance
Equity Total/Weighted Average
Ratio between Loan and Equity
75% Appro.15% 10% 100%
Capital Cost 1.4%/Year Zero 15%/Year 1.51%/Year Weighted Average Cost of Capital (WACC) is calculated as 1.51% per year, based on the composition of the Loans and Equity as stated hereinabove.
○ Sale of the Electric Power For the calculation of Sale of Electric Power, Unit Rate of 1.051 Ind. Rupee or 7.36 Japanese
Yen per Kilowatt Hour shall be applied according to Decree No. 002 of 2006 issued by the Ministry of Energy and Mineral Resources, the Government of Indonesia which being the Eighty (80) percent of the average production cost of electricity in the region.
○ Sale of Carbon Credit For the calculation of Sale of Carbon Credit, Unit Rate of Japanese Yen 2,000 per one ton of
CO2 shall be applied.

- - 52
○ Project Cash-out Flow Cash-Out Flow of this Project consists of the following four pay items.
・Engineering and Construction Costs The Engineering and Construction Costs for this Project were shown in the Table under
Article 4.3.2 in this Chapter, and these expenses shall be paid out within one year from the commencement of the Project.
Table 4-5: Engineering and Construction Costs
Projects Engineering Costs Construction Costs Total
POM with FFB Process Capacity
30 tons/hour Jp¥ 10Mill Jp¥ 446Mill Jp¥456 Mill
POM with FFB Process Capacity
60 tons/hour Jp¥ 10Mill Jp¥ 700Mill Jp¥710 Mill
・Operational Costs The Operational Costs for this Project was projected as Five (5) percent on the
Construction Costs, based on actual occurrence of the same expenditure on the similar projects in Indonesia.
・Depreciation Costs Such Major Initial Investment Costs as the Boiler, Generator and auxiliary equipments
shall be depreciated up to Ninety (90) percent of its costs at the equal amount every year within 15 years time.
・Taxes Any Tax applicable in Indonesia for the procurement of Engineering Services,
Construction of the Building, Installation of Plants and Equipments and other activities shall be inclusive of the costs estimated in each pay items, and the Income Tax derived from this Project is deemed to be Thirty (30) percent on the Incomes before Tax.
○ Results of the Financial Feasibility Analysis The results of the Financial Feasibility for the Two (2) cases assessed at the Financial Internal
Rate of Return on the incomes before Taxes, are summarized as follows. In all the cases, the Projects are financially viable at the given conditions as stated hereinbefore.
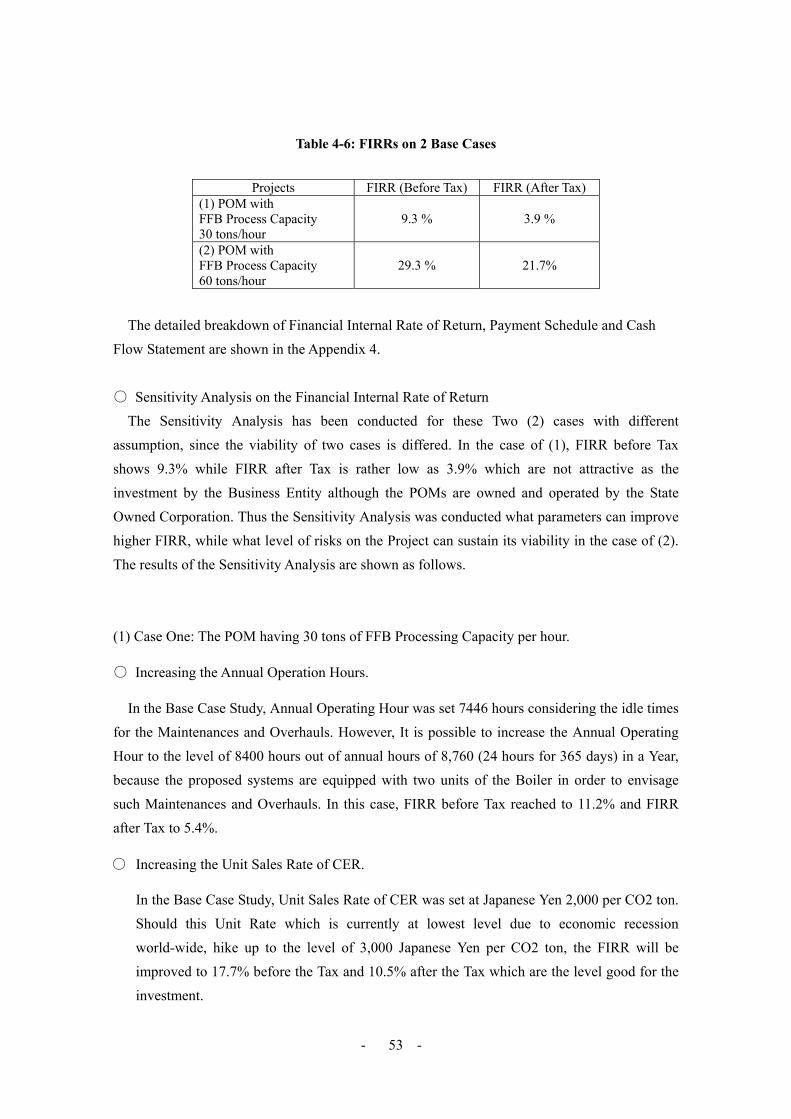
- - 53
Table 4-6: FIRRs on 2 Base Cases
Projects FIRR (Before Tax) FIRR (After Tax)
(1) POM with FFB Process Capacity 30 tons/hour
9.3 % 3.9 %
(2) POM with FFB Process Capacity 60 tons/hour
29.3 % 21.7%
The detailed breakdown of Financial Internal Rate of Return, Payment Schedule and Cash Flow Statement are shown in the Appendix 4.
○ Sensitivity Analysis on the Financial Internal Rate of Return The Sensitivity Analysis has been conducted for these Two (2) cases with different
assumption, since the viability of two cases is differed. In the case of (1), FIRR before Tax shows 9.3% while FIRR after Tax is rather low as 3.9% which are not attractive as the investment by the Business Entity although the POMs are owned and operated by the State Owned Corporation. Thus the Sensitivity Analysis was conducted what parameters can improve higher FIRR, while what level of risks on the Project can sustain its viability in the case of (2). The results of the Sensitivity Analysis are shown as follows.
(1) Case One: The POM having 30 tons of FFB Processing Capacity per hour.
○ Increasing the Annual Operation Hours.
In the Base Case Study, Annual Operating Hour was set 7446 hours considering the idle times for the Maintenances and Overhauls. However, It is possible to increase the Annual Operating Hour to the level of 8400 hours out of annual hours of 8,760 (24 hours for 365 days) in a Year, because the proposed systems are equipped with two units of the Boiler in order to envisage such Maintenances and Overhauls. In this case, FIRR before Tax reached to 11.2% and FIRR after Tax to 5.4%.
○ Increasing the Unit Sales Rate of CER.
In the Base Case Study, Unit Sales Rate of CER was set at Japanese Yen 2,000 per CO2 ton. Should this Unit Rate which is currently at lowest level due to economic recession world-wide, hike up to the level of 3,000 Japanese Yen per CO2 ton, the FIRR will be improved to 17.7% before the Tax and 10.5% after the Tax which are the level good for the investment.
- - 54
(2) Case Two: The POM having 60 tons of FFB Processing Capacity per hour.
○ Overrun of the Project Cost Should the Initial Investment Costs increase for Fifteen (15) percent against that of Base Case,
FIRR drops from 29.3 % to 28.5 % at the stage of “before Tax”, and it drops from 21.7 % to 21.5 % at the stage of “After Tax” respectively. This means that the cost overruns on the Project does not have significant influence to viability of the Project.
○ Change in the Selling Unit Rates of CER and Operating Hours. Should the Selling Unit Rates of CER and Operating Hours drops by Fifteen (15) percent
respectively, the FIRR before Tax drops from 29.3% to 23.7%, and the FIRR after Tax drops from 21.7 % to 17.6% respectively.
4.4 Proposed Implementation Schedule of the Project
4.4.1 Construction at the Project Sites
The major part of the Project may be undertaken by local construction companies with adequately qualified in terms of Technology and Financial capabilities. They shall undertake the following Scope of Works and responsibility for overall quality of the works that are required on this Project.
○ Installation of Crusher, Shredder, Press Machines and Drying Devices for treatment of EFB In order to conduct Pre-firing processes, these equipments play important roles in the
Systems. Alternative study shall be conducted on the performances between the set of Crusher, Shredder and Press Machines and the Drying Devices. A Warehouse for stockpile of the treated EFB shall be provided within the yard of the POMs.
○ Installation of Boiler and Turbine Generator after interior replacement of mills The models of Biomass Boiler which has proven performance records and Steam Turbine and
Generator may be procured as core plants for the Power Generation Systems. And those equipments can be procured from the well-qualified supplier from Japan or other South-east Asian Country.
○ Power Transmission lines to the Grid and the Power Stabilizer Connection to the Electricity Grids adjacent to POMs, and procurement and installation of a Power Stabilizer are required.

- - 55
○ Access Road for Construction Materials Should there be no Access Road for the transportation of Construction Materials that are required for the Project, necessary costs shall be prepared within the budget of the Project. It is considered to have a five meters wide macadamized road which runs between POMs and major roads.
4.4.2 Trial operation
As an Independent Electricity Producer, the Project is required uninterrupted operation, once commenced its operation and around 8,400 hours of operation in a year is ideal target based on the track records in the similar Project. Therefore, the discussions with PLN’s provincial offices are important for mutual understanding and agreement on the conditions to be performed by the Project. Trial Operation of the Systems shall be conducted prior to the official handing over of the Project by the Contractor to the Implementation Agency.
4.4.3 Personnel
Operators for the boiler, turbine and generator, dryer and electricity transmission and distribution systems must be stationed for a sound system operation and maintenance at the Project Site. In order to operate the systems around the clock, approx. 10 personnel for three shift works is necessary.
4.4.4 Training program for operators
The training program for operators shall be carried out along with construction at the sites.
The actual training program shall be undertaken by the Contractor or Supplier of the Plants and Equipments for the Project.
4.4.5 Construction schedule
○ Project Preparation Study The Project Preparation Study which is formerly known as Special Assistance for Project
Formation (SAPROF) is required before the physical development is undertaken, and the schedule is as the table below.

- - 56
No Process of Project Preparation Study 1 2 3 4 5 6 7 8 9 10 11 12
1 Domestic survey
Preparations of field survey
2 Field survey Survey on POA candidacies
Ministry of State Corporation Candidacies for Public POMs SPC candidacies
PLN Independent power producer
Purchasing terms on biomass generated power Policies on electricity The same as noted
Confirmation of intention Environmental impact assessment
BAPPENAS BAPEDAL
JICA Survey on the required conditions in applying for ODAFinancial flow
3 Domestic survey
Drafting
4 Field survey Confirmation of draft contents Agreement
5 Domestic survey
Final reportPresentation to JICA on the report
6 Coordination at field
Presentation at domestic level on the report
7 Coordination at national level
Final agreement
Fig. 4-3: Project Preparation Study implementation schedule
If viability is confirmed by the Project Preparation Study, official request by the host nation must be prerequisite. The Construction Schedule is planned as 2). (Full-scale Study and Constructing Schedule shall be examined closely by prior consultation)
The project scale by a case is estimated to be approximately no more than 4 hundred thousand yen. Therefore, it aims to expand from the first year of the project 2 to 10 cases in three years, which totals 4 to 5 billion yen of the project scale.

- - 57
○ Construction schedule
Years Category
1st 2nd 3rd 4th 5th
a)Detailed Engineering
b) Tendering
c)Manufacturing and installation of equipments Boiler Turbine Generator Dryer Mill Power transmission lines Power source equipment
d) Efficiency test Trial operation
Fig. 4-4: Construction Schedule
As described in the report, some programs can be established into the one with the aim of
electricity generation by using the captured methane from the lagoons of POME, or of the destruction of methane by flaring. Considering that common programs available for various POMs must be applied for the Program of Activity, it might infringe on the condition of maintainig the present equipments. And therefore, any Project improving the existing Plants and Equipment are excluded from the initial discussions.
- - 58
Chapter 5 : Recommendations
This Study is designed to collect data and information on the present conditions of Rural Electrification and to explore the possibility to realize “Waste to Energy” concept by utilizing Biomass Wastes in the Palm Oil Mills (POMs) in Sumatra. Through the processes of this Study, Interviews with various authorities concerned and Financial Viability Analysis have been conducted. As the result of this Study, the proposed concept of Biomass Wastes-fired Power Generation Systems and CDM Project is assumed to be Financially Viable, if it is developed with a Soft Project Loan from the Financial Institution such as Japan International Cooperation Agency (JICA). However, the Soft Loan is applicable only for those POMs owned by PT. PNs which are under the administrative jurisdiction of the Ministry of State Corporation, the Government of Indonesia.
There is another possibility to realize the same concept for the POMs owned by the Private
Sector which is much larger in its number. The Study Team recommends implementation of this scheme by the deployment of a Two-steps Loan through the Conduit Organization such as Bank Mandiri, one of the prominent state banks in Indonesia. However, it was difficult for the Study Team to gather sufficient data and information during rather limited study periods, thus the Preliminary Feasibility Study for this scheme is yet to be conducted.
According to the Financial Viability Analysis under the given pre-conditions, the proposed scheme performs 9.3% in the Financial Internal Rate of Return (FIRR) before Tax in case of FFB process capacity of thirty (30) tons per hour, and 29.3% of IRR before Tax in case of 60 tons per hour. The demands for Rural Electrification are quite large in the surveyed areas and there is sufficient numbers of POM sites to be developed, it is recommendable to implement simultaneously several numbers of investments as one package. The Project will therefore require qualified project management team attached to the Implementation Agency to monitor the quality and progress of various Projects in different region in Sumatra.
This concept is also suitable for the Program of Activity (PoA) to be applied to the United
Nations for the Certified Emission Reduction (CER) under the Kyoto Protocol. In implementing the PoA, a Coordination and Management Entity (CME) shall be appointed to monitor and coordinate with various stakeholders along with the chains of activities required under the Clean Development Mechanism. For such roles and activities, it is most

- - 59
recommendable to establish a unit designated for these requirements within the Ministry of State Corporation. A professional team of the Project Management may be attached to BUMN to help support the activities of BUMN and CME. Considering these activities, the proposed Project Implementation Structure may be illustrated as follows;
PT.PN-I PT.PN-II PT.PN-III PT.PN-IV PT.PN-V PT.PN-VI PT.PN-VII
BUMN Project Management TeamCME
MOFJICA
PROJECT LOAN
Fig. 5-1: The Proposed Structure of Project Implementation with a PoA Concept
Although results of this Preliminary Feasibility Study show positive indications, it is however
strongly recommended to conduct a full scale Feasibility Study and Environmental Impact Assessment for this scheme, utilizing a facility of the Technical Assistance from the Government of Japan. A full scale Feasibility Study and Environmental Impact Assessment may be the initial step to be taken in order to lead this vital Project to a reality.


APPENDIX 1
Itinerary for the Field Survey

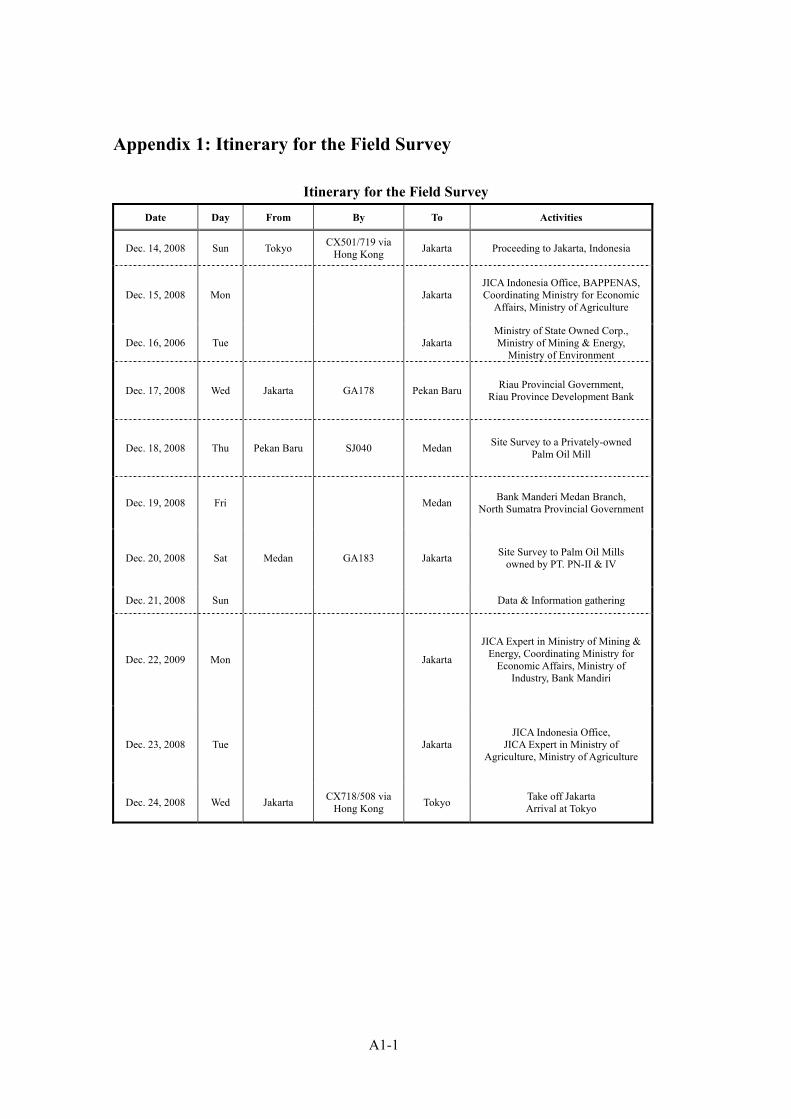
A1-1
Appendix 1: Itinerary for the Field Survey
Itinerary for the Field Survey
Date Day From By To Activities
Dec. 14, 2008 Sun Tokyo CX501/719 via Hong Kong Jakarta Proceeding to Jakarta, Indonesia
Dec. 15, 2008 Mon Jakarta JICA Indonesia Office, BAPPENAS, Coordinating Ministry for Economic
Affairs, Ministry of Agriculture
Dec. 16, 2006 Tue Jakarta Ministry of State Owned Corp., Ministry of Mining & Energy,
Ministry of Environment
Dec. 17, 2008 Wed Jakarta GA178 Pekan Baru Riau Provincial Government, Riau Province Development Bank
Dec. 18, 2008 Thu Pekan Baru SJ040 Medan Site Survey to a Privately-owned Palm Oil Mill
Dec. 19, 2008 Fri Medan Bank Manderi Medan Branch, North Sumatra Provincial Government
Dec. 20, 2008 Sat Medan GA183 Jakarta Site Survey to Palm Oil Mills owned by PT. PN-II & IV
Dec. 21, 2008 Sun Data & Information gathering
Dec. 22, 2009 Mon Jakarta
JICA Expert in Ministry of Mining & Energy, Coordinating Ministry for
Economic Affairs, Ministry of Industry, Bank Mandiri
Dec. 23, 2008 Tue Jakarta JICA Indonesia Office,
JICA Expert in Ministry of Agriculture, Ministry of Agriculture
Dec. 24, 2008 Wed Jakarta CX718/508 via Hong Kong Tokyo Take off Jakarta
Arrival at Tokyo


APPENDIX 2
Technical Data


- A2 I -
Appendix 2: Technical Data Sheets
General Description of PT Sinar Agro Raya (Private oil mill)
Site 20 km north of Pekanbaru, Riau Province
Type The oil mill without plantation, which purchased all amount of EFB from the union. The area owned by union members is 2ha~100ha.
Treated amount
60t/h~30t/h average 45t/h that of dry season from Jan to Jul at most 700t/d, while rainy season, at lowest, 400t/d average 450t/d Though operation is 24 d/m and 11h/d, the mill is flexibly run.
Employees 60(officially) 30(present) (due to the decrease of Palm harvest, setting in the rainy season)
Treatment methods of biomass
(1) Fiber & Kernel : fuel for independent power generation (2) EFB : boiler fuel and decomposition after dumped in the forest (3) POME : poured into 6 lagoons accordingly, some of which is used for irrigation
and the rest is discharged into a river
Spec
(1) A boiler (manufactured in 2004:20bar * 36t/h), actual amount of operation is 24t/h pressure 17kg/c ㎡, fixed bed, no economizer
(2) Generator (manufactured in 2004) 1400KVA * 2, all amount of the generated electricity is used in the mill Power generation is covered by a generator in the rainy season when EFB supply is smaller Spare: two diesel generators of 500KVA
(3) Saturated back pressure of 3kg/ c ㎡ is almost provided into a sterilizer. (4) Steam is generated on the oil extracting stage, and the flow is described as the
following figure. The amount of generated steam is almost stable.
Others The cooling pond of POME is heated above 100 degree C through saturated water in steam tank. The rest of oil is no more than 1%, which is collected by skimmers.

- A2 II -
General Description of PKS Adolina (PT PN IV Public Oil Mill)
Site Medan, Northern Sumatera Province
Type
**One of the 15 mills which is under the umbrella of PT PNIV and controls 8800ha, including 6500ha of private plantation. An old oil mill which has been established in 1942, and equipments of which has been replaced in 1962.
Treated amount
Treatment amount is at most in the dry season from January to July, while the rainy season at lowest. Year average is 30t/h. Operating hours is 30 days / month and 24 hours / day (only in July) in the peak, while 25days / month and 16 hours / day in the off season. Maintaining this, the mill is run flexibly by adjusting personnel.
Employees
The work shift system by two groups of 41 personnel. (The harvesting amount of Palm decreases due to the rainy season) The shortage of work forces is covered by extra work.
Treatment methods of biomass
(1) Fiber & Kernel : fuel for independent power generation, 700kWof power generation is available.
(2) EFB : composted in plantations (3) POME : the digested liquid of lagoons is irrigated into the forests which are located
three km away from the mill, the rest is discharged in a river.
Spec
(1) Two boilers, fixed bed and with economizer Operation : manufactured in 1995:23bar * 20 t/h actual amount of use is 18 t/h,
19 bar 260 degree C (overheated steam) Spare : manufactured in 1990:24bar * 18t/h
260 degree C (overheated steam) when suspended (2) Generator 700kW * 3, and one of which is operated now. It covers
90% of the required electricity. Electricity is generated by a generator in the rainy season. Spare : Two diesel generators of 500 KVA
(3) The back pressure of turbine is 5 to 6 bar, 170 degree C. After it is fed into sterilizer, maintain it for 90 min. (the pressure seems to be a little bit higher)
(4) Steam is generated on the oil extracting stage, and the flow is described as the following figure. The amount of generated steam is almost stable.
Others According to an experimental conducted by the domestic public palm oil research center, methane has not been generated from the methane fermentation tank for POME. (It is just an experimental that POME was fed into drum can, but failed.)

- A2 III -
General Description of PKS Marbaw (PT PN II Public Oil Mill)
Site Medan, Northern Sumatera Province
Type
Scale is the same as the public mills, Adolina. 70% of EFB is purchased from the private plantation of about 6,000 ha, and 30% is from the adjacent. One of the six oil mills which are under the umbrella of PTPNⅡand has been established in 1960 with history. **
Treated amount
30t/h (treatment capacity 50t/h) According to the monthly data, the amount is volatile. Operating hours: 16 hours / day, 25 days / month
Employees Unknown
Treatment method of Biomass
(1) Fiber & Kernel : fuel for independent power generation, 460 kW of power generation is available.
The surplus power generation is also available, however, it must be purchased from PLN
(2) EFB : composted in plantations (3) POME : digested liquid of adjacent lagoons is irrigated into the plantation, the rest is
discharged as BOD 100 into a river In order to promote digestion, POME is fed into boiler after cooling it from 80 to 60 degree C through cooling tower
Spec
(1) Two boilers, fixed bed, no economizer 20bar * 20t/h, actual operated amount is 18bar * 16t/h
(2) Three generators : 800kW Two units are for common use, 450kW, 800kW A unit of diesel for spare
(3) The back pressure of turbine is 3 bar. After it is supplied to sterilizer, maintain it for 90 min.
(4) Steam is generated on the oil extracting stage, and the flow is described as the following figure. The amount of generated steam is almost stable.
(5) Process stages are common in every public oil mills.
Others
The domestic public palm oil research center has conducted experiment on methane fermentation tank of POME. It is the round funnel-shaped one with the height of three meters, which is bigger than the previous mentioned public oil mills. It is under trial manufacturing.


APPENDIX 3
Sites Photographs

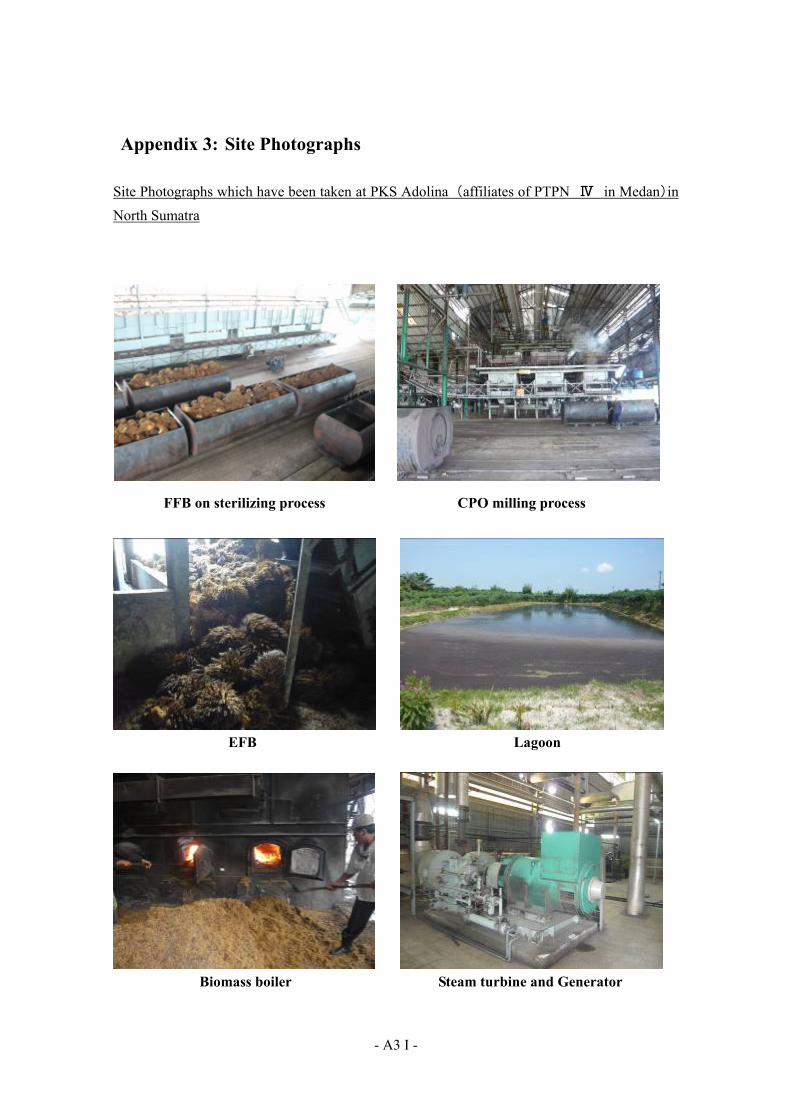
- A3 I -
Appendix 3: Site Photographs
Site Photographs which have been taken at PKS Adolina (affiliates of PTPN Ⅳ in Medan)in North Sumatra
FFB on sterilizing process CPO milling process
EFB Lagoon
Biomass boiler Steam turbine and Generator


APPENDIX 4
Financial Analysis

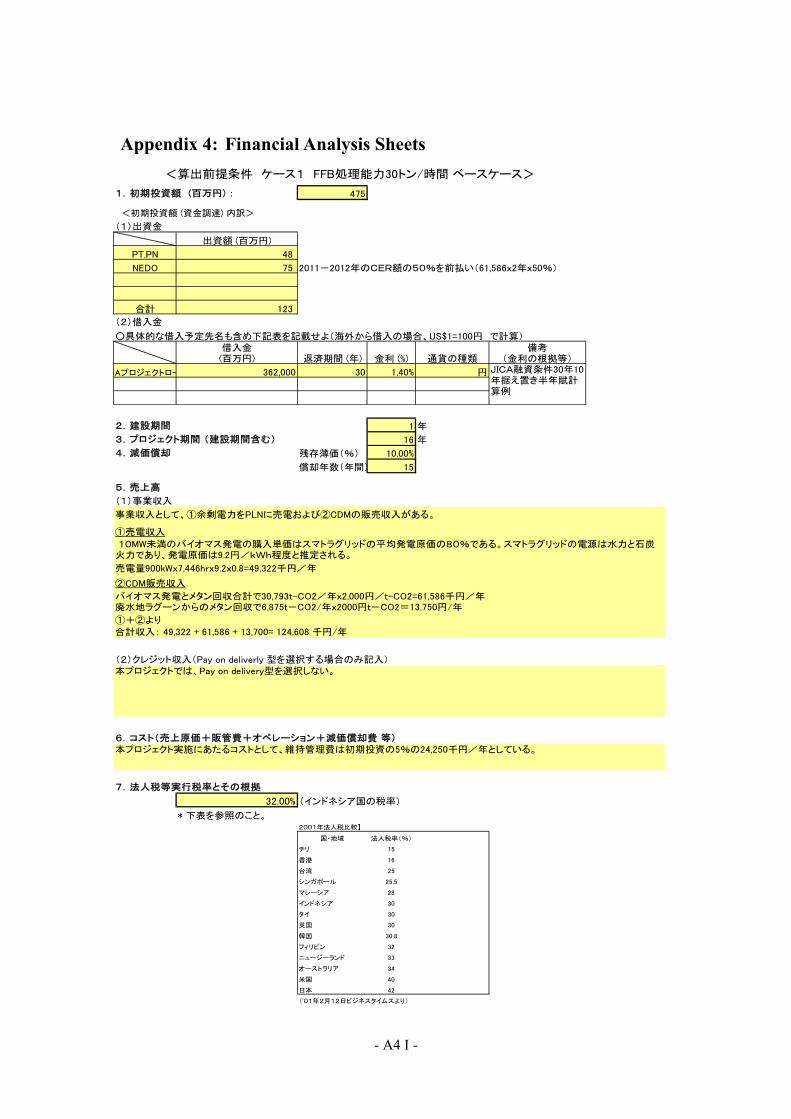
- A4 I -
Appendix 4: Financial Analysis Sheets
475
出資額 (百万円)
PT.PN 48
NEDO 75 2011-2012年のCER額の50%を前払い(61,586x2年x50%)
合計 123
○具体的な借入予定先名も含め下記表を記載せよ(海外から借入の場合、US$1=100円 で計算)借入金(百万円) 返済期間 (年) 金利 (%) 通貨の種類
備考(金利の根拠等)
CAプロジェクトロー 362,000 30 1.40% 円
1 年
16 年
残存薄価(%) 10.00%
償却年数(年間) 15
①+②より
32.00%
* 下表を参照のこと。
国・地域 法人税率(%)
チリ 15
香港 16
台湾 25
シンガポール 25.5
マレーシア 28
インドネシア 30
タイ 30
英国 30
韓国 30.8
フィリピン 32
ニュージーランド 33
オーストラリア 34
米国 40
日本 42
(2)借入金
(1)事業収入
3.プロジェクト期間 (建設期間含む)
(2)クレジット収入(Pay on deliverly 型を選択する場合のみ記入)
(インドネシア国の税率)
('01年2月12日ビジネスタイムスより)
<算出前提条件 ケース1 FFB処理能力30トン/時間 ベースケース>
(1)出資金
1.初期投資額 (百万円) :
<初期投資額 (資金調達) 内訳>
売電量900kWx7,446hrx9.2x0.8=49,322千円/年
JICA融資条件30年10年据え置き半年賦計算例
本プロジェクトでは、Pay on delivery型を選択しない。
本プロジェクト実施にあたるコストとして、維持管理費は初期投資の5%の24,250千円/年としている。
7.法人税等実行税率とその根拠
6.コスト(売上原価+販管費+オペレーション+減価償却費 等)
2001年法人税比較】
合計収入: 49,322 + 61,586 + 13,700= 124,608 千円/年
2.建設期間
10MW未満のバイオマス発電の購入単価はスマトラグリッドの平均発電原価の80%である。スマトラグリッドの電源は水力と石炭火力であり、発電原価は9.2円/kWh程度と推定される。
バイオマス発電とメタン回収合計で30,793t-CO2/年x2,000円/t-CO2=61,586千円/年廃水地ラグーンからのメタン回収で6,875t-CO2/年x2000円t-CO2=13,750円/年
4.減価償却
5.売上高
事業収入として、①余剰電力をPLNに売電および②CDMの販売収入がある。
①売電収入
②CDM販売収入

- A4 II -
《収支一覧表 (単位:千円)事業年度 建設期間(1年) 2011 2012 2013 2014 2015 2016 2017 2018 2019 2020 2021 2022 2023 2024 2025
0 1 2 3 4 5 6 7 8 9 10 11 12 13 14 15損益計算書
1.売上高合計 124,608 124,608 124,608 124,608 124,608 124,608 124,608 124,608 124,608 124,608 124,608 124,608 124,608 124,608 124,608 売上高(売電事業) 49,322 49,322 49,322 49,322 49,322 49,322 49,322 49,322 49,322 49,322 49,322 49,322 49,322 49,322 49,322 売上高(CER販売) 75,286 75,286 75,286 75,286 75,286 75,286 75,286 75,286 75,286 75,286 75,286 75,286 75,286 75,286 75,286
2.コスト 55,920 55,920 55,920 55,920 55,920 55,920 55,920 55,920 55,920 55,920 55,920 55,920 55,920 55,920 55,870 建設・開業費 485,000 原材料費 - - - - - - - - - - - - - - - 運転管理費 24,250 24,250 24,250 24,250 24,250 24,250 24,250 24,250 24,250 24,250 24,250 24,250 24,250 24,250 24,250
3.減価償却費 475,000 31,670 31,670 31,670 31,670 31,670 31,670 31,670 31,670 31,670 31,670 31,670 31,670 31,670 31,670 31,620 営業利益(*) 68,688 68,688 68,688 68,688 68,688 68,688 68,688 68,688 68,688 68,688 68,688 68,688 68,688 68,688 68,738 4.支払利息(*) 5,068 5,068 5,068 5,068 5,068 5,068 4,561 4,054 3,548 3,041 2,534 1,773 1,329 886 4435.繰延資産償却費(*) 2,000 2,000 2,000 2,000 2,000 - - - - - - - - - - 税引前当期利益(*) 61,620 61,620 61,620 61,620 61,620 63,620 64,127 64,634 65,140 65,647 66,154 66,915 67,359 67,802 57,708 6.法人税等(*) 32.00% 19,718 19,718 19,718 19,718 19,718 20,358 20,521 20,683 20,845 21,007 21,169 21,413 21,555 21,697 18,467 当期利益(*) 41,902 41,902 41,902 41,902 41,902 43,262 43,606 43,951 44,295 44,640 44,985 45,502 45,804 46,105 39,241
キャッシュフロー計算書税引前当期利益 61,620 61,620 61,620 61,620 61,620 63,620 64,127 64,634 65,140 65,647 66,154 66,915 67,359 67,802 57,708 償却費(設備) 33,670 33,670 33,670 33,670 33,670 31,670 31,670 31,670 31,670 31,670 31,670 31,670 31,670 31,670 31,620 キャッシュインフロー合計 95,290 95,290 95,290 95,290 95,290 95,290 95,797 96,304 96,810 97,317 97,824 98,585 99,029 99,472 89,328 法人税等支払 19,718 19,718 19,718 19,718 19,718 20,358 20,521 20,683 20,845 21,007 21,169 21,413 21,555 21,697 18,467 借入金返済 0 0 0 0 0 36,200 36,200 36,200 36,200 36,200 36,200 36,200 36,200 36,200 36,200 キャッシュアウトフロー合計 19,718 19,718 19,718 19,718 19,718 56,558 56,721 56,883 57,045 57,207 57,369 57,613 57,755 57,897 54,667 キャッシュフロー 75,572 75,572 75,572 75,572 75,572 38,732 39,076 39,421 39,765 40,110 40,455 40,972 41,274 41,575 34,661
貸借対照表流動資産(余剰資金) 75,572 151,143 226,715 302,286 377,858 416,590 455,666 495,087 534,852 574,962 615,417 656,389 697,663 739,238 773,900 固定資産(償却資産) 475,000 443,330 411,660 379,990 348,320 316,650 284,980 253,310 221,640 189,970 158,300 126,630 94,960 63,290 31,620 - 繰延資産 10,000 8,000 6,000 4,000 2,000 0 0 0 0 0 0 0 0 0 0 0 資産合計(資産の部) 485,000 526,902 568,803 610,705 652,606 694,508 701,570 708,976 716,727 724,822 733,262 742,047 751,349 760,953 770,858 773,900 借入金(当初借入) 362,000 362,000 362,000 362,000 362,000 362,000 325,800 289,600 253,400 217,200 181,000 144,800 108,600 72,400 36,200 0不足資金借入金(追加借入) - - - - - - - - - - - - - - - 負債合計 362,000 362,000 362,000 362,000 362,000 325,800 289,600 253,400 217,200 181,000 144,800 108,600 72,400 36,200 - 資本金 123,000 123,000 123,000 123,000 123,000 123,000 123,000 123,000 123,000 123,000 123,000 123,000 123,000 123,000 123,000 123,000 (上記資本金のうち、クレジット購入分額) 75,000 75,000 75,000 75,000 75,000 75,000 75,000 75,000 75,000 75,000 75,000 75,000 75,000 75,000 75,000 75,000 剰余金 0 41,902 83,803 125,705 167,606 209,508 252,770 296,376 340,327 384,622 429,262 474,247 519,749 565,553 611,658 650,900 資本合計 123,000 164,902 206,803 248,705 290,606 332,508 375,770 419,376 463,327 507,622 552,262 597,247 642,749 688,553 734,658 773,900 負債・資本合計(負債及び資本の部) 485,000 526,902 568,803 610,705 652,606 694,508 701,570 708,976 716,727 724,822 733,262 742,047 751,349 760,953 770,858 773,900
借入金A (借入金残高:記入) 362,000,000 362,000 362,000 362,000 362,000 362,000 325,800 289,600 253,400 217,200 181,000 144,800 108,600 72,400 36,200 0国際協力銀行 (元利合計返済金額:記入) 5,068 10,136 15,204 20,272 61,540 102,301 142,556 182,303 223,389 263,498 302,630 340,784 377,961 414,161 投資金融 (元金分返済額) 0 0 0 0 0 36,200 36,200 36,200 36,200 36,200 36,200 36,200 36,200 36,200 36,200
(支払利息:金利のみ記入) 1.40% 5,068 5,068 5,068 5,068 5,068 5,068 4,561 4,054 3,548 4,886 3,909 2,932 1,954 977 0合計 (借入金残高:記入) 362,000 362,000 362,000 362,000 362,000 325,800 289,600 253,400 217,200 181,000 144,800 108,600 72,400 36,200 0
(元利合計返済金額:記入) 0 5,068 10,136 15,204 20,272 61,540 102,301 142,556 182,303 223,389 263,498 302,630 340,784 377,961 414,161(元金分返済額) 0 0 0 0 0 36,200 36,200 36,200 36,200 36,200 36,200 36,200 36,200 36,200 36,200(支払利息:金利のみ記入) 5,068 5,068 5,068 5,068 5,068 5,068 4,561 4,054 3,548 4,886 3,909 2,932 1,954 977 0
採算計算税引後キャッシュフロー 75,572 75,572 75,572 75,572 75,572 74,932 75,276 75,621 75,965 76,310 76,655 77,172 77,474 77,775 70,861 税引後キャッシュフローの累計 [S] 75,572 151,143 226,715 302,286 377,858 452,790 528,066 603,687 679,652 755,962 832,617 909,789 987,263 1,065,038 1,135,900 [S] - 投下資本 -399,428 -323,857 -248,285 -172,714 -97,142 -22,210 53,066 128,687 204,652 280,962 357,617 434,789 512,263 590,038 660,900 内部利益率 [IRR] (利息除外、税金織込) -18.7% 0.4% 5.8%(IRR計算データ) -475,000 48,970 48,970 48,970 48,970 48,970 48,330 48,167 48,005 47,843 47,681 47,519 47,275 47,133 46,991 50,271 内部利益率 [IRR] (利息除外、税引前) -9.9% 7.3% 11.7%(IRR計算データ) -475,000 68,688 68,688 68,688 68,688 68,688 68,688 68,688 68,688 68,688 68,688 68,688 68,688 68,688 68,688 68,738
設定項目 償却率 14.2% 残存薄価 10% % 15 年償却 繰延資産償却年数 5 年 初期投資額 475,000
FFB処理能力30トン/時間 ベースケース
(*:記入不要欄、網掛け部分は記入)
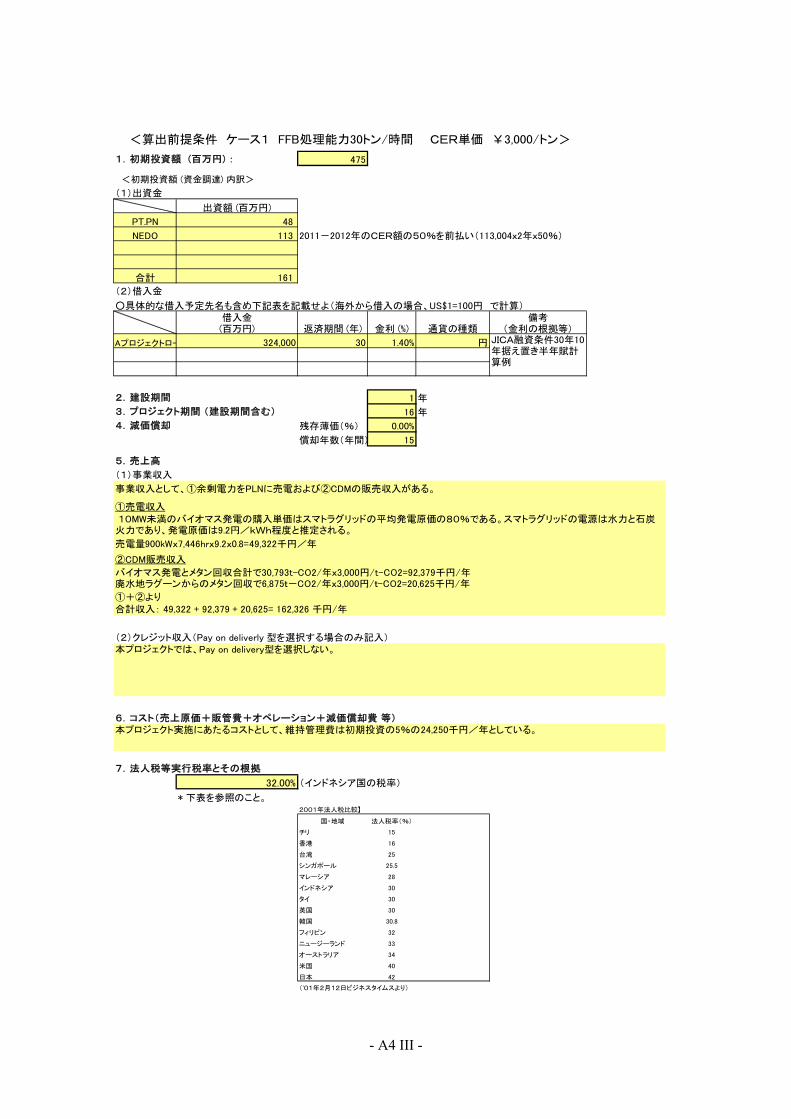
- A4 III -
475
出資額 (百万円)
PT.PN 48
NEDO 113 2011-2012年のCER額の50%を前払い(113,004x2年x50%)
合計 161
○具体的な借入予定先名も含め下記表を記載せよ(海外から借入の場合、US$1=100円 で計算)借入金(百万円) 返済期間 (年) 金利 (%) 通貨の種類
備考(金利の根拠等)
CAプロジェクトロー 324,000 30 1.40% 円
1 年
16 年
残存薄価(%) 0.00%
償却年数(年間) 15
①+②より
32.00%
* 下表を参照のこと。
国・地域 法人税率(%)
チリ 15
香港 16
台湾 25
シンガポール 25.5
マレーシア 28
インドネシア 30
タイ 30
英国 30
韓国 30.8
フィリピン 32
ニュージーランド 33
オーストラリア 34
米国 40
日本 42
(2)クレジット収入(Pay on deliverly 型を選択する場合のみ記入)
(インドネシア国の税率)
('01年2月12日ビジネスタイムスより)
<算出前提条件 ケース1 FFB処理能力30トン/時間 CER単価 ¥3,000/トン>
(1)出資金
1.初期投資額 (百万円) :
<初期投資額 (資金調達) 内訳>
売電量900kWx7,446hrx9.2x0.8=49,322千円/年
JICA融資条件30年10年据え置き半年賦計算例
合計収入: 49,322 + 92,379 + 20,625= 162,326 千円/年
①売電収入
(2)借入金
(1)事業収入
3.プロジェクト期間 (建設期間含む)
2.建設期間
本プロジェクトでは、Pay on delivery型を選択しない。
本プロジェクト実施にあたるコストとして、維持管理費は初期投資の5%の24,250千円/年としている。
7.法人税等実行税率とその根拠
6.コスト(売上原価+販管費+オペレーション+減価償却費 等)
2001年法人税比較】
10MW未満のバイオマス発電の購入単価はスマトラグリッドの平均発電原価の80%である。スマトラグリッドの電源は水力と石炭火力であり、発電原価は9.2円/kWh程度と推定される。
バイオマス発電とメタン回収合計で30,793t-CO2/年x3,000円/t-CO2=92,379千円/年廃水地ラグーンからのメタン回収で6,875t-CO2/年x3,000円/t-CO2=20,625千円/年
4.減価償却
5.売上高
事業収入として、①余剰電力をPLNに売電および②CDMの販売収入がある。
②CDM販売収入

- A4 IV -
《収支一覧表 (単位:千円)事業年度 建設期間(1年) 2011 2012 2013 2014 2015 2016 2017 2018 2019 2020 2021 2022 2023 2024 2025
0 1 2 3 4 5 6 7 8 9 10 11 12 13 14 15損益計算書
1.売上高合計 162,326 162,326 162,326 162,326 162,326 162,326 162,326 162,326 162,326 162,326 162,326 162,326 162,326 162,326 162,326 売上高(売電事業) 49,322 49,322 49,322 49,322 49,322 49,322 49,322 49,322 49,322 49,322 49,322 49,322 49,322 49,322 49,322 売上高(CER販売) 113,004 113,004 113,004 113,004 113,004 113,004 113,004 113,004 113,004 113,004 113,004 113,004 113,004 113,004 113,004
2.コスト 55,920 55,920 55,920 55,920 55,920 55,920 55,920 55,920 55,920 55,920 55,920 55,920 55,920 55,920 38,140 建設・開業費 485,000 原材料費 - - - - - - - - - - - - - - - 運転管理費 24,250 24,250 24,250 24,250 24,250 24,250 24,250 24,250 24,250 24,250 24,250 24,250 24,250 24,250 24,250
3.減価償却費 475,000 31,670 31,670 31,670 31,670 31,670 31,670 31,670 31,670 31,670 31,670 31,670 31,670 31,670 31,670 13,890 営業利益(*) 74,736 74,736 74,736 74,736 74,736 74,736 74,736 74,736 74,736 74,736 74,736 74,736 74,736 74,736 110,296 4.支払利息(*) 4,536 4,536 4,536 4,536 4,536 4,082 3,629 3,175 2,722 2,268 1,814 1,361 907 454 05.繰延資産償却費(*) 2,000 2,000 2,000 2,000 2,000 - - - - - - - - - - 税引前当期利益(*) 68,200 68,200 99,870 68,200 68,200 70,654 71,107 71,561 72,014 72,468 72,922 73,375 73,829 74,282 88,501 6.法人税等(*) 32.00% 21,824 21,824 31,958 21,824 21,824 22,609 22,754 22,899 23,045 23,190 23,335 23,335 23,625 23,770 28,320 当期利益(*) 46,376 46,376 67,912 46,376 46,376 48,044 48,353 48,661 48,970 49,278 49,587 50,040 50,204 50,512 60,181
キャッシュフロー計算書税引前当期利益 68,200 68,200 99,870 68,200 68,200 70,654 71,107 71,561 72,014 72,468 72,922 73,375 73,829 74,282 88,501 償却費(設備) 33,670 33,670 33,670 33,670 33,670 31,670 31,670 31,670 31,670 31,670 31,670 31,670 31,670 31,670 13,890 キャッシュインフロー合計 101,870 101,870 133,540 101,870 101,870 102,324 102,777 103,231 103,684 104,138 104,592 105,045 105,499 105,952 102,391 法人税等支払 21,824 21,824 31,958 21,824 21,824 22,609 22,754 22,899 23,045 23,190 23,335 23,335 23,625 23,770 28,320 借入金返済 0 0 0 0 0 32,400 32,400 32,400 32,400 32,400 32,400 32,400 32,400 32,400 32,400 キャッシュアウトフロー合計 21,824 21,824 31,958 21,824 21,824 55,009 55,154 55,299 55,445 55,590 55,735 55,735 56,025 56,170 60,720 キャッシュフロー 80,046 80,046 101,582 80,046 80,046 47,314 47,623 47,931 48,240 48,548 48,857 49,310 49,474 49,782 41,671
貸借対照表流動資産(余剰資金) 80,046 160,092 261,674 341,720 421,766 469,080 516,703 564,634 612,874 661,422 710,279 759,589 809,063 858,845 900,516 固定資産(償却資産) 475,000 443,330 411,660 379,990 348,320 316,650 284,980 253,310 221,640 189,970 158,300 126,630 94,960 63,290 31,620 17,730 繰延資産 10,000 8,000 6,000 4,000 2,000 0 0 0 0 0 0 0 0 0 0 0 資産合計(資産の部) 485,000 531,376 577,752 645,664 692,040 738,416 754,060 770,013 786,274 802,844 819,722 836,909 854,549 872,353 890,465 918,246 借入金(当初借入) 324,000 324,000 324,000 324,000 324,000 324,000 291,600 259,200 226,800 194,400 162,000 129,600 97,200 64,800 32,400 0不足資金借入金(追加借入) - - - - - - - - - - - - - - - 負債合計 324,000 324,000 324,000 324,000 324,000 324,000 291,600 259,200 226,800 194,400 162,000 129,600 97,200 64,800 32,400 - 資本金 161,000 161,000 161,000 161,000 161,000 161,000 161,000 161,000 161,000 161,000 161,000 161,000 161,000 161,000 161,000 161,000 (上記資本金のうち、クレジット購入分額) 113,000 113,000 113,000 113,000 113,000 113,000 113,000 113,000 113,000 113,000 113,000 113,000 113,000 113,000 113,000 113,000 剰余金 0 46,376 92,752 160,664 207,040 253,416 301,460 349,813 398,474 447,444 496,722 546,309 596,349 646,553 697,065 757,246 資本合計 161,000 207,376 253,752 321,664 368,040 414,416 462,460 510,813 559,474 608,444 657,722 707,309 757,349 807,553 858,065 918,246 負債・資本合計(負債及び資本の部) 485,000 531,376 577,752 645,664 692,040 738,416 754,060 770,013 786,274 802,844 819,722 836,909 854,549 872,353 890,465 918,246
借入金A (借入金残高:記入) 324,000,000 324,000 324,000 324,000 324,000 324,000 291,600 259,200 226,800 194,400 162,000 129,600 97,200 64,800 32,400 0国際協力銀行 (元利合計返済金額:記入) 4,536 9,072 13,608 18,144 22,680 59,616 96,098 132,127 167,702 204,988 241,297 276,629 310,983 344,360 376,760 投資金融 (元金分返済額) 0 0 0 0 0 32,400 32,400 32,400 32,400 32,400 32,400 32,400 32,400 32,400 32,400
(支払利息:金利のみ記入) 1.40% 4,536 4,536 4,536 4,536 4,536 4,536 4,082 3,629 3,175 4,886 3,909 2,932 1,954 977 0合計 (借入金残高:記入) 324,000 324,000 359,000 359,000 359,000 326,600 294,200 261,800 229,400 197,000 164,600 132,200 99,800 67,400 35,000
(元利合計返済金額:記入) 4,536 9,072 13,608 18,144 22,680 59,616 96,098 132,127 167,702 204,988 241,297 276,629 310,983 344,360 376,760(元金分返済額) 0 0 0 0 0 32,400 32,400 32,400 32,400 32,400 32,400 32,400 32,400 32,400 32,400(支払利息:金利のみ記入) 4,536 4,536 4,536 4,536 4,536 4,536 4,082 3,629 3,175 4,886 3,909 2,932 1,954 977 0
採算計算税引後キャッシュフロー 80,046 80,046 101,582 80,046 80,046 79,714 80,023 80,331 80,640 80,948 81,257 81,710 81,874 82,182 74,071 税引後キャッシュフローの累計 [S] 80,046 160,092 261,674 341,720 421,766 501,480 581,503 661,834 742,474 823,422 904,679 986,389 1,068,263 1,150,445 1,224,516 [S] - 投下資本 -394,954 -314,908 -213,326 -133,280 -53,234 26,480 106,503 186,834 267,474 348,422 429,679 511,389 593,263 675,445 749,516 内部利益率 [IRR] (利息除外、税金織込) -4.5% 11.7% 15.5%(IRR計算データ) -475,000 84,582 84,582 74,448 84,582 84,582 83,797 83,652 83,507 83,361 83,216 83,071 83,071 82,781 82,636 95,866 内部利益率 [IRR] (利息除外、税引前) 3.9% 18.2% 21.2%(IRR計算データ) -475,000 106,406 106,406 106,406 106,406 106,406 106,406 106,406 106,406 106,406 106,406 106,406 106,406 106,406 106,406 124,186
設定項目 償却率 100.0% 残存薄価 0% % 15 年償却 繰延資産償却年数 5 年 初期投資額 475,000
FFB処理能力30トン/時間 CER単価¥3,000/トン
(*:記入不要欄、網掛け部分は記入)

- A4 V -
485
出資額 (百万円)
PT.PN 48
NEDO 84 2011-2012年のCER額の50%を前払い(84,989x2年x50%)
合計 132
○具体的な借入予定先名も含め下記表を記載せよ(海外から借入の場合、US$1=100円 で計算)借入金(百万円) 返済期間 (年) 金利 (%) 通貨の種類
備考(金利の根拠等)
CAプロジェクトロー 353 30 1.40% 円
1 年
16 年
残存薄価(%) 0.00%
償却年数(年間) 15
①+②より
32.00%
* 下表を参照のこと。
国・地域 法人税率(%)
チリ 15
香港 16
台湾 25
シンガポール 25.5
マレーシア 28
インドネシア 30
タイ 30
英国 30
韓国 30.8
フィリピン 32
ニュージーランド 33
オーストラリア 34
米国 40
日本 42
(2)クレジット収入(Pay on deliverly 型を選択する場合のみ記入)
(インドネシア国の税率)
('01年2月12日ビジネスタイムスより)
<算出前提条件 ケース1 FFB処理能力30トン/時間 年間稼動8400時間>
(1)出資金
1.初期投資額 (百万円) :
<初期投資額 (資金調達) 内訳>
売電量900kWx8,400hrx9.2x0.8=55,642千円/年
JICA融資条件30年10年据え置き半年賦計算例
合計収入: 55,642 + 69,477 +15,512= 140,631 千円/年
①売電収入
(2)借入金
(1)事業収入
3.プロジェクト期間 (建設期間含む)
2.建設期間
10MW未満のバイオマス発電の購入単価はスマトラグリッドの平均発電原価の80%である。スマトラグリッドの電源は水力と石炭火力であり、発電原価は9.2円/kWh程度と推定される。
バイオマス発電とメタン回収合計で30,793t-CO2/年x(8,400/7,446)x2,000円/t-CO2=69,477千円/年廃水地ラグーンからのメタン回収で6,875t-CO2/年x(8,400/7,446)x2,000円/t-CO2=15,512千円/年
本プロジェクトでは、Pay on delivery型を選択しない。
本プロジェクト実施にあたるコストとして、維持管理費は初期投資の5%の24,250千円/年としている。
7.法人税等実行税率とその根拠
6.コスト(売上原価+販管費+オペレーション+減価償却費 等)
2001年法人税比較】
4.減価償却
5.売上高
事業収入として、①余剰電力をPLNに売電および②CDMの販売収入がある。
②CDM販売収入
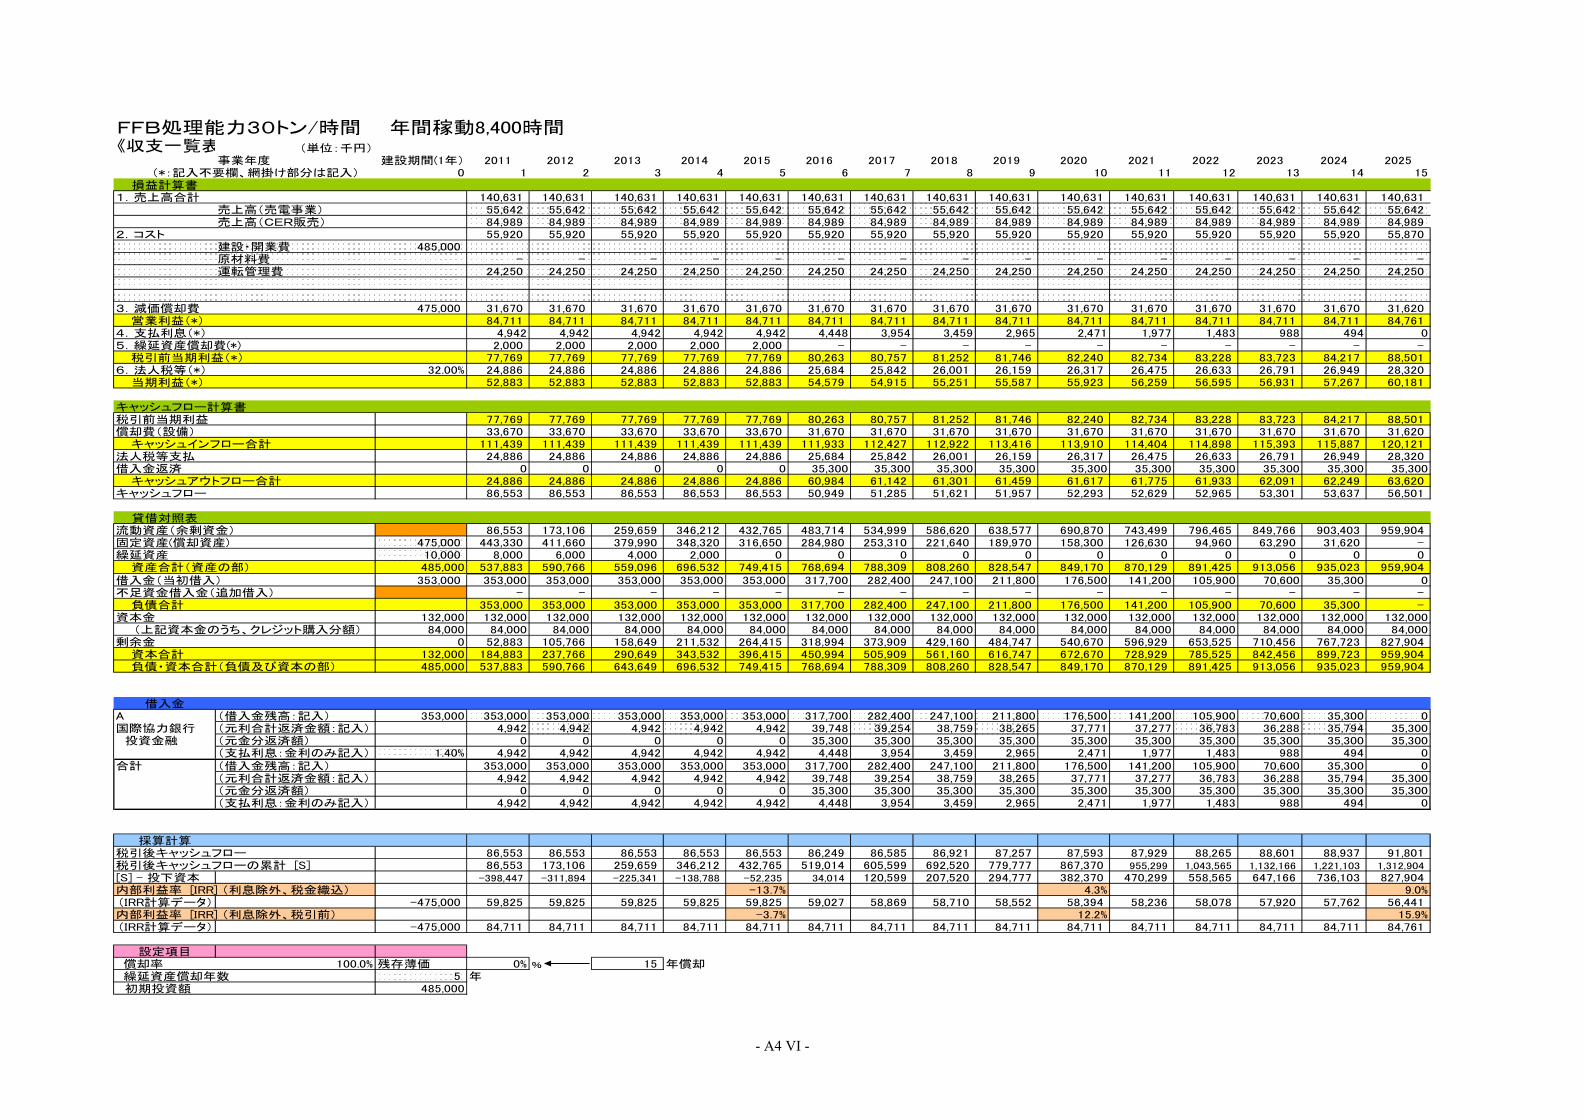
- A4 VI -
《収支一覧表 (単位:千円)事業年度 建設期間(1年) 2011 2012 2013 2014 2015 2016 2017 2018 2019 2020 2021 2022 2023 2024 2025
0 1 2 3 4 5 6 7 8 9 10 11 12 13 14 15損益計算書
1.売上高合計 140,631 140,631 140,631 140,631 140,631 140,631 140,631 140,631 140,631 140,631 140,631 140,631 140,631 140,631 140,631 売上高(売電事業) 55,642 55,642 55,642 55,642 55,642 55,642 55,642 55,642 55,642 55,642 55,642 55,642 55,642 55,642 55,642 売上高(CER販売) 84,989 84,989 84,989 84,989 84,989 84,989 84,989 84,989 84,989 84,989 84,989 84,989 84,989 84,989 84,989
2.コスト 55,920 55,920 55,920 55,920 55,920 55,920 55,920 55,920 55,920 55,920 55,920 55,920 55,920 55,920 55,870 建設・開業費 485,000 原材料費 - - - - - - - - - - - - - - - 運転管理費 24,250 24,250 24,250 24,250 24,250 24,250 24,250 24,250 24,250 24,250 24,250 24,250 24,250 24,250 24,250
3.減価償却費 475,000 31,670 31,670 31,670 31,670 31,670 31,670 31,670 31,670 31,670 31,670 31,670 31,670 31,670 31,670 31,620 営業利益(*) 84,711 84,711 84,711 84,711 84,711 84,711 84,711 84,711 84,711 84,711 84,711 84,711 84,711 84,711 84,761 4.支払利息(*) 4,942 4,942 4,942 4,942 4,942 4,448 3,954 3,459 2,965 2,471 1,977 1,483 988 494 05.繰延資産償却費(*) 2,000 2,000 2,000 2,000 2,000 - - - - - - - - - - 税引前当期利益(*) 77,769 77,769 77,769 77,769 77,769 80,263 80,757 81,252 81,746 82,240 82,734 83,228 83,723 84,217 88,501 6.法人税等(*) 32.00% 24,886 24,886 24,886 24,886 24,886 25,684 25,842 26,001 26,159 26,317 26,475 26,633 26,791 26,949 28,320 当期利益(*) 52,883 52,883 52,883 52,883 52,883 54,579 54,915 55,251 55,587 55,923 56,259 56,595 56,931 57,267 60,181
キャッシュフロー計算書税引前当期利益 77,769 77,769 77,769 77,769 77,769 80,263 80,757 81,252 81,746 82,240 82,734 83,228 83,723 84,217 88,501 償却費(設備) 33,670 33,670 33,670 33,670 33,670 31,670 31,670 31,670 31,670 31,670 31,670 31,670 31,670 31,670 31,620 キャッシュインフロー合計 111,439 111,439 111,439 111,439 111,439 111,933 112,427 112,922 113,416 113,910 114,404 114,898 115,393 115,887 120,121 法人税等支払 24,886 24,886 24,886 24,886 24,886 25,684 25,842 26,001 26,159 26,317 26,475 26,633 26,791 26,949 28,320 借入金返済 0 0 0 0 0 35,300 35,300 35,300 35,300 35,300 35,300 35,300 35,300 35,300 35,300 キャッシュアウトフロー合計 24,886 24,886 24,886 24,886 24,886 60,984 61,142 61,301 61,459 61,617 61,775 61,933 62,091 62,249 63,620 キャッシュフロー 86,553 86,553 86,553 86,553 86,553 50,949 51,285 51,621 51,957 52,293 52,629 52,965 53,301 53,637 56,501
貸借対照表流動資産(余剰資金) 86,553 173,106 259,659 346,212 432,765 483,714 534,999 586,620 638,577 690,870 743,499 796,465 849,766 903,403 959,904 固定資産(償却資産) 475,000 443,330 411,660 379,990 348,320 316,650 284,980 253,310 221,640 189,970 158,300 126,630 94,960 63,290 31,620 - 繰延資産 10,000 8,000 6,000 4,000 2,000 0 0 0 0 0 0 0 0 0 0 0 資産合計(資産の部) 485,000 537,883 590,766 559,096 696,532 749,415 768,694 788,309 808,260 828,547 849,170 870,129 891,425 913,056 935,023 959,904 借入金(当初借入) 353,000 353,000 353,000 353,000 353,000 353,000 317,700 282,400 247,100 211,800 176,500 141,200 105,900 70,600 35,300 0不足資金借入金(追加借入) - - - - - - - - - - - - - - - 負債合計 353,000 353,000 353,000 353,000 353,000 317,700 282,400 247,100 211,800 176,500 141,200 105,900 70,600 35,300 - 資本金 132,000 132,000 132,000 132,000 132,000 132,000 132,000 132,000 132,000 132,000 132,000 132,000 132,000 132,000 132,000 132,000 (上記資本金のうち、クレジット購入分額) 84,000 84,000 84,000 84,000 84,000 84,000 84,000 84,000 84,000 84,000 84,000 84,000 84,000 84,000 84,000 84,000剰余金 0 52,883 105,766 158,649 211,532 264,415 318,994 373,909 429,160 484,747 540,670 596,929 653,525 710,456 767,723 827,904 資本合計 132,000 184,883 237,766 290,649 343,532 396,415 450,994 505,909 561,160 616,747 672,670 728,929 785,525 842,456 899,723 959,904 負債・資本合計(負債及び資本の部) 485,000 537,883 590,766 643,649 696,532 749,415 768,694 788,309 808,260 828,547 849,170 870,129 891,425 913,056 935,023 959,904
借入金A (借入金残高:記入) 353,000 353,000 353,000 353,000 353,000 353,000 317,700 282,400 247,100 211,800 176,500 141,200 105,900 70,600 35,300 0国際協力銀行 (元利合計返済金額:記入) 4,942 4,942 4,942 4,942 4,942 39,748 39,254 38,759 38,265 37,771 37,277 36,783 36,288 35,794 35,300 投資金融 (元金分返済額) 0 0 0 0 0 35,300 35,300 35,300 35,300 35,300 35,300 35,300 35,300 35,300 35,300
(支払利息:金利のみ記入) 1.40% 4,942 4,942 4,942 4,942 4,942 4,448 3,954 3,459 2,965 2,471 1,977 1,483 988 494 0合計 (借入金残高:記入) 353,000 353,000 353,000 353,000 353,000 317,700 282,400 247,100 211,800 176,500 141,200 105,900 70,600 35,300 0
(元利合計返済金額:記入) 4,942 4,942 4,942 4,942 4,942 39,748 39,254 38,759 38,265 37,771 37,277 36,783 36,288 35,794 35,300(元金分返済額) 0 0 0 0 0 35,300 35,300 35,300 35,300 35,300 35,300 35,300 35,300 35,300 35,300(支払利息:金利のみ記入) 4,942 4,942 4,942 4,942 4,942 4,448 3,954 3,459 2,965 2,471 1,977 1,483 988 494 0
採算計算税引後キャッシュフロー 86,553 86,553 86,553 86,553 86,553 86,249 86,585 86,921 87,257 87,593 87,929 88,265 88,601 88,937 91,801 税引後キャッシュフローの累計 [S] 86,553 173,106 259,659 346,212 432,765 519,014 605,599 692,520 779,777 867,370 955,299 1,043,565 1,132,166 1,221,103 1,312,904 [S] - 投下資本 -398,447 -311,894 -225,341 -138,788 -52,235 34,014 120,599 207,520 294,777 382,370 470,299 558,565 647,166 736,103 827,904 内部利益率 [IRR] (利息除外、税金織込) -13.7% 4.3% 9.0%(IRR計算データ) -475,000 59,825 59,825 59,825 59,825 59,825 59,027 58,869 58,710 58,552 58,394 58,236 58,078 57,920 57,762 56,441 内部利益率 [IRR] (利息除外、税引前) -3.7% 12.2% 15.9%(IRR計算データ) -475,000 84,711 84,711 84,711 84,711 84,711 84,711 84,711 84,711 84,711 84,711 84,711 84,711 84,711 84,711 84,761
設定項目 償却率 100.0% 残存薄価 0% % 15 年償却 繰延資産償却年数 5 年 初期投資額 485,000
FFB処理能力30トン/時間 年間稼動8,400時間
(*:記入不要欄、網掛け部分は記入)

- A4 VII -
754
出資額 (百万円)
PT.PN 75
NEDO 160 2011-2012年のCER金額の50%を前払い(127,341x2年x50%)
合計 235
○具体的な借入予定先名も含め下記表を記載せよ(海外から借入の場合、US$1=110円 で計算)借入金(百万円) 返済期間 (年) 金利 (%) 通貨の種類
備考(金利の根拠等)
JICAプロジェクト 529 10 1.40% 円
ファイナンス
1 年
16 年
残存薄価(%) 0.00%
償却年数(年間) 15
①+②より
32.00%
* 下表を参照のこと。
国・地域 法人税率(%)
チリ 15
香港 16
台湾 25
シンガポール 25.5
マレーシア 28
インドネシア 30
タイ 30
英国 30
韓国 30.8
フィリピン 32
ニュージーランド 33
オーストラリア 34
米国 40
日本 42
('01年2月12日ビジネスタイムスより)
売電量2,200kWx7,446hrx9.2x0.8=120,566千円/年
合計収入: 120,566 + 127,341+ 33,000 = 280,907 千円/年
10MW未満のバイオマス発電の購入単価はスマトラグリッドの平均発電原価の80%である。スマトラグリッドの電源は水力と石炭火力であり、発電原価は9.2円/kWh程度と推定される。
バイオマス発電とメタン回収合計で63,671t-CO2/年x2,000円/t-CO2=127,341千円/年廃水地ラグーンからのメタン回収で16,500t-CO2/年x2,000円/t-CO2=33,000千円/年
②CDM販売収入
<算出前提条件 ケース2 FFB処理能力60トン/時間 ベースケース>
(1)出資金
1.初期投資額 (百万円) :
<初期投資額 (資金調達) 内訳>
初期投資額の10%
JBIC融資条件10年5年据え置き半年賦計算例
①売電収入
(2)借入金
2.建設期間
4.減価償却
5.売上高
事業収入として、①余剰電力をPLNに売電および②CDMの販売収入がある。
3.プロジェクト期間 (建設期間含む)
本プロジェクトでは、Pay on delivery型を選択しない。
本プロジェクト実施にあたるコストとして、維持管理費は初期投資の5%の38,200千円/年としている。
7.法人税等実行税率とその根拠
6.コスト(売上原価+販管費+オペレーション+減価償却費 等)
2001年法人税比較】
(1)事業収入
(2)クレジット収入(Pay on deliverly 型を選択する場合のみ記入)
(インドネシア国の税率)
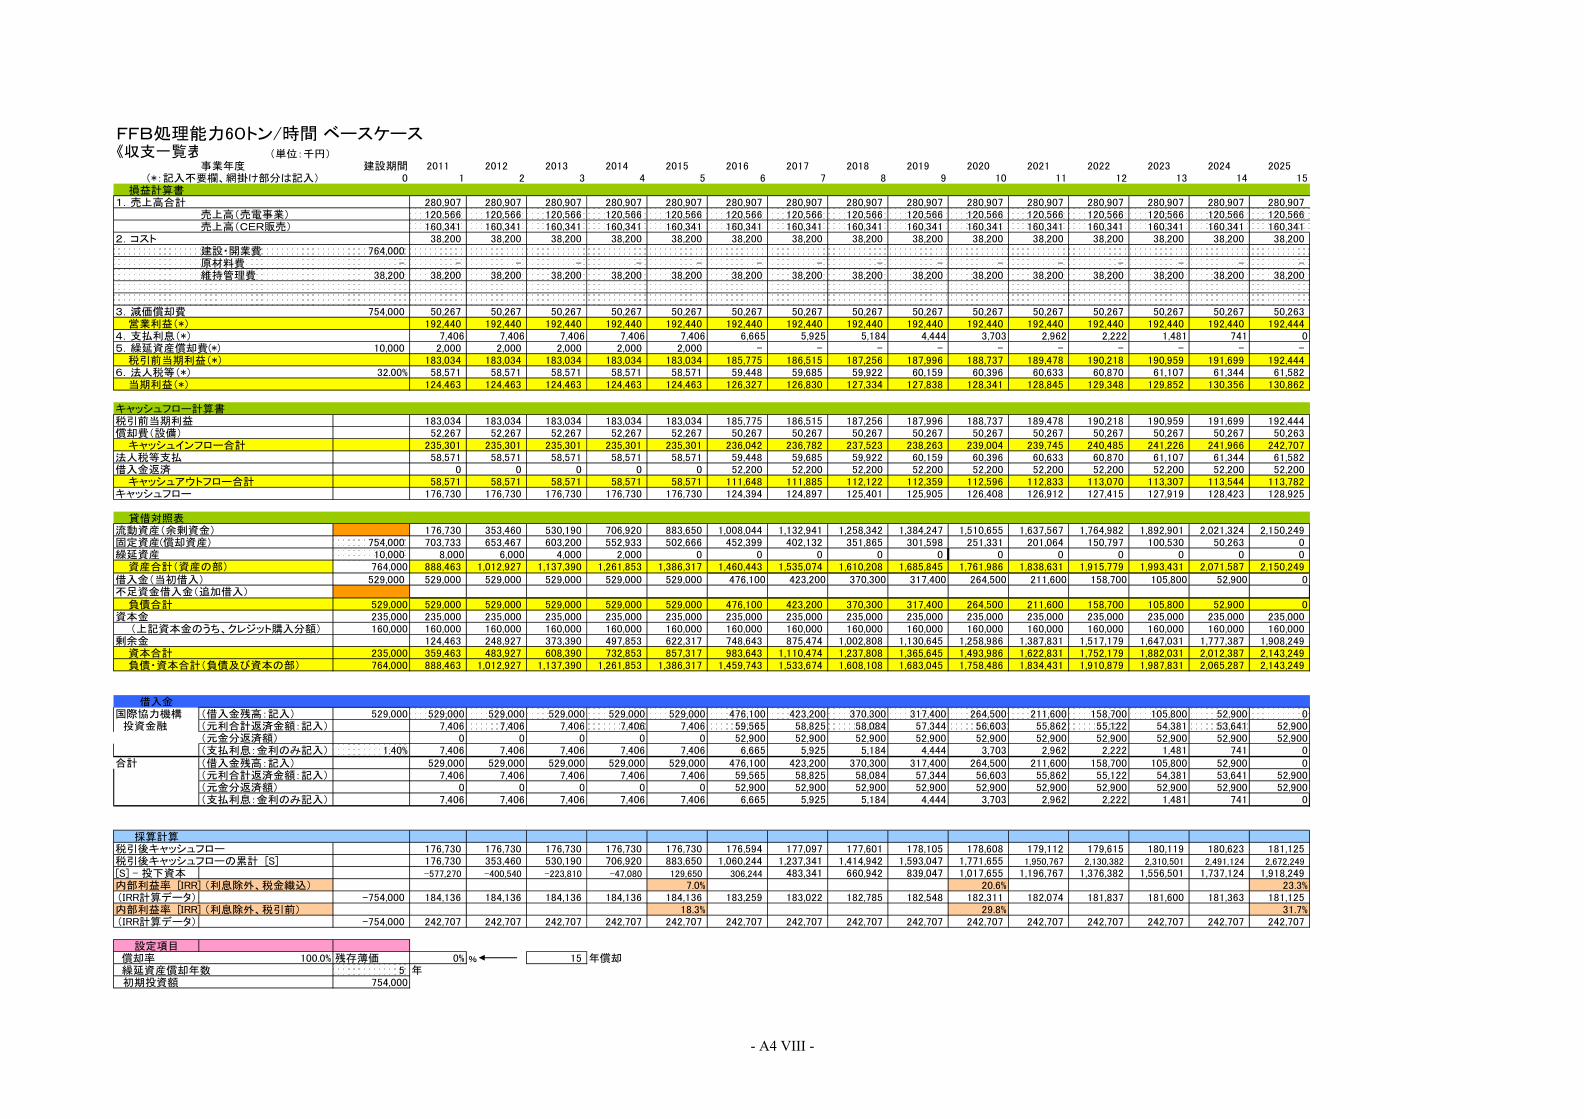
- A4 VIII -
《収支一覧表 (単位:千円)事業年度 建設期間 2011 2012 2013 2014 2015 2016 2017 2018 2019 2020 2021 2022 2023 2024 2025
0 1 2 3 4 5 6 7 8 9 10 11 12 13 14 15損益計算書
1.売上高合計 280,907 280,907 280,907 280,907 280,907 280,907 280,907 280,907 280,907 280,907 280,907 280,907 280,907 280,907 280,907 売上高(売電事業) 120,566 120,566 120,566 120,566 120,566 120,566 120,566 120,566 120,566 120,566 120,566 120,566 120,566 120,566 120,566 売上高(CER販売) 160,341 160,341 160,341 160,341 160,341 160,341 160,341 160,341 160,341 160,341 160,341 160,341 160,341 160,341 160,341
2.コスト 38,200 38,200 38,200 38,200 38,200 38,200 38,200 38,200 38,200 38,200 38,200 38,200 38,200 38,200 38,200 建設・開業費 764,000 原材料費 - - - - - - - - - - - - - - - - 維持管理費 38,200 38,200 38,200 38,200 38,200 38,200 38,200 38,200 38,200 38,200 38,200 38,200 38,200 38,200 38,200 38,200
3.減価償却費 754,000 50,267 50,267 50,267 50,267 50,267 50,267 50,267 50,267 50,267 50,267 50,267 50,267 50,267 50,267 50,263 営業利益(*) 192,440 192,440 192,440 192,440 192,440 192,440 192,440 192,440 192,440 192,440 192,440 192,440 192,440 192,440 192,444 4.支払利息(*) 7,406 7,406 7,406 7,406 7,406 6,665 5,925 5,184 4,444 3,703 2,962 2,222 1,481 741 05.繰延資産償却費(*) 10,000 2,000 2,000 2,000 2,000 2,000 - - - - - - - - - - 税引前当期利益(*) 183,034 183,034 183,034 183,034 183,034 185,775 186,515 187,256 187,996 188,737 189,478 190,218 190,959 191,699 192,444 6.法人税等(*) 32.00% 58,571 58,571 58,571 58,571 58,571 59,448 59,685 59,922 60,159 60,396 60,633 60,870 61,107 61,344 61,582 当期利益(*) 124,463 124,463 124,463 124,463 124,463 126,327 126,830 127,334 127,838 128,341 128,845 129,348 129,852 130,356 130,862
キャッシュフロー計算書税引前当期利益 183,034 183,034 183,034 183,034 183,034 185,775 186,515 187,256 187,996 188,737 189,478 190,218 190,959 191,699 192,444 償却費(設備) 52,267 52,267 52,267 52,267 52,267 50,267 50,267 50,267 50,267 50,267 50,267 50,267 50,267 50,267 50,263 キャッシュインフロー合計 235,301 235,301 235,301 235,301 235,301 236,042 236,782 237,523 238,263 239,004 239,745 240,485 241,226 241,966 242,707 法人税等支払 58,571 58,571 58,571 58,571 58,571 59,448 59,685 59,922 60,159 60,396 60,633 60,870 61,107 61,344 61,582 借入金返済 0 0 0 0 0 52,200 52,200 52,200 52,200 52,200 52,200 52,200 52,200 52,200 52,200 キャッシュアウトフロー合計 58,571 58,571 58,571 58,571 58,571 111,648 111,885 112,122 112,359 112,596 112,833 113,070 113,307 113,544 113,782 キャッシュフロー 176,730 176,730 176,730 176,730 176,730 124,394 124,897 125,401 125,905 126,408 126,912 127,415 127,919 128,423 128,925
貸借対照表流動資産(余剰資金) 176,730 353,460 530,190 706,920 883,650 1,008,044 1,132,941 1,258,342 1,384,247 1,510,655 1,637,567 1,764,982 1,892,901 2,021,324 2,150,249 固定資産(償却資産) 754,000 703,733 653,467 603,200 552,933 502,666 452,399 402,132 351,865 301,598 251,331 201,064 150,797 100,530 50,263 0繰延資産 10,000 8,000 6,000 4,000 2,000 0 0 0 0 0 0 0 0 0 0 0 資産合計(資産の部) 764,000 888,463 1,012,927 1,137,390 1,261,853 1,386,317 1,460,443 1,535,074 1,610,208 1,685,845 1,761,986 1,838,631 1,915,779 1,993,431 2,071,587 2,150,249 借入金(当初借入) 529,000 529,000 529,000 529,000 529,000 529,000 476,100 423,200 370,300 317,400 264,500 211,600 158,700 105,800 52,900 0不足資金借入金(追加借入) 負債合計 529,000 529,000 529,000 529,000 529,000 529,000 476,100 423,200 370,300 317,400 264,500 211,600 158,700 105,800 52,900 0資本金 235,000 235,000 235,000 235,000 235,000 235,000 235,000 235,000 235,000 235,000 235,000 235,000 235,000 235,000 235,000 235,000 (上記資本金のうち、クレジット購入分額) 160,000 160,000 160,000 160,000 160,000 160,000 160,000 160,000 160,000 160,000 160,000 160,000 160,000 160,000 160,000 160,000 剰余金 124,463 248,927 373,390 497,853 622,317 748,643 875,474 1,002,808 1,130,645 1,258,986 1,387,831 1,517,179 1,647,031 1,777,387 1,908,249 資本合計 235,000 359,463 483,927 608,390 732,853 857,317 983,643 1,110,474 1,237,808 1,365,645 1,493,986 1,622,831 1,752,179 1,882,031 2,012,387 2,143,249 負債・資本合計(負債及び資本の部) 764,000 888,463 1,012,927 1,137,390 1,261,853 1,386,317 1,459,743 1,533,674 1,608,108 1,683,045 1,758,486 1,834,431 1,910,879 1,987,831 2,065,287 2,143,249
借入金国際協力機構 (借入金残高:記入) 529,000 529,000 529,000 529,000 529,000 529,000 476,100 423,200 370,300 317,400 264,500 211,600 158,700 105,800 52,900 0 投資金融 (元利合計返済金額:記入) 7,406 7,406 7,406 7,406 7,406 59,565 58,825 58,084 57,344 56,603 55,862 55,122 54,381 53,641 52,900
(元金分返済額) 0 0 0 0 0 52,900 52,900 52,900 52,900 52,900 52,900 52,900 52,900 52,900 52,900(支払利息:金利のみ記入) 1.40% 7,406 7,406 7,406 7,406 7,406 6,665 5,925 5,184 4,444 3,703 2,962 2,222 1,481 741 0
合計 (借入金残高:記入) 529,000 529,000 529,000 529,000 529,000 476,100 423,200 370,300 317,400 264,500 211,600 158,700 105,800 52,900 0(元利合計返済金額:記入) 7,406 7,406 7,406 7,406 7,406 59,565 58,825 58,084 57,344 56,603 55,862 55,122 54,381 53,641 52,900(元金分返済額) 0 0 0 0 0 52,900 52,900 52,900 52,900 52,900 52,900 52,900 52,900 52,900 52,900(支払利息:金利のみ記入) 7,406 7,406 7,406 7,406 7,406 6,665 5,925 5,184 4,444 3,703 2,962 2,222 1,481 741 0
採算計算税引後キャッシュフロー 176,730 176,730 176,730 176,730 176,730 176,594 177,097 177,601 178,105 178,608 179,112 179,615 180,119 180,623 181,125 税引後キャッシュフローの累計 [S] 176,730 353,460 530,190 706,920 883,650 1,060,244 1,237,341 1,414,942 1,593,047 1,771,655 1,950,767 2,130,382 2,310,501 2,491,124 2,672,249 [S] - 投下資本 -577,270 -400,540 -223,810 -47,080 129,650 306,244 483,341 660,942 839,047 1,017,655 1,196,767 1,376,382 1,556,501 1,737,124 1,918,249 内部利益率 [IRR] (利息除外、税金織込) 7.0% 20.6% 23.3%(IRR計算データ) -754,000 184,136 184,136 184,136 184,136 184,136 183,259 183,022 182,785 182,548 182,311 182,074 181,837 181,600 181,363 181,125 内部利益率 [IRR] (利息除外、税引前) 18.3% 29.8% 31.7%(IRR計算データ) -754,000 242,707 242,707 242,707 242,707 242,707 242,707 242,707 242,707 242,707 242,707 242,707 242,707 242,707 242,707 242,707
設定項目 償却率 100.0% 残存薄価 0% % 15 年償却 繰延資産償却年数 5 年 初期投資額 754,000
FFB処理能力60トン/時間 ベースケース
(*:記入不要欄、網掛け部分は記入)
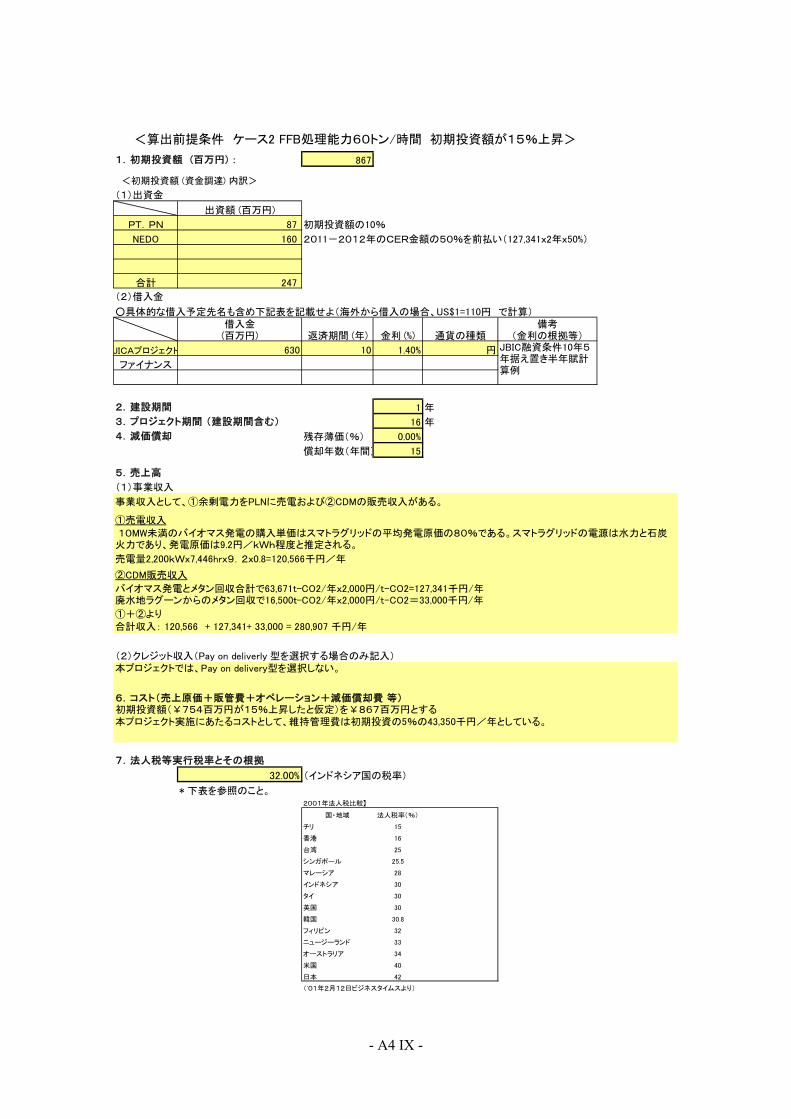
- A4 IX -
867
出資額 (百万円)
PT.PN 87
NEDO 160 2011-2012年のCER金額の50%を前払い(127,341x2年x50%)
合計 247
○具体的な借入予定先名も含め下記表を記載せよ(海外から借入の場合、US$1=110円 で計算)借入金(百万円) 返済期間 (年) 金利 (%) 通貨の種類
備考(金利の根拠等)
JICAプロジェクト 630 10 1.40% 円
ファイナンス
1 年
16 年
残存薄価(%) 0.00%
償却年数(年間) 15
①+②より
32.00%
* 下表を参照のこと。
国・地域 法人税率(%)
チリ 15
香港 16
台湾 25
シンガポール 25.5
マレーシア 28
インドネシア 30
タイ 30
英国 30
韓国 30.8
フィリピン 32
ニュージーランド 33
オーストラリア 34
米国 40
日本 42
本プロジェクトでは、Pay on delivery型を選択しない。
本プロジェクト実施にあたるコストとして、維持管理費は初期投資の5%の43,350千円/年としている。
7.法人税等実行税率とその根拠
6.コスト(売上原価+販管費+オペレーション+減価償却費 等)初期投資額(¥754百万円が15%上昇したと仮定)を¥867百万円とする
2001年法人税比較】
(1)事業収入
(2)クレジット収入(Pay on deliverly 型を選択する場合のみ記入)
(インドネシア国の税率)
初期投資額の10%
JBIC融資条件10年5年据え置き半年賦計算例
①売電収入
(2)借入金
2.建設期間
4.減価償却
5.売上高
事業収入として、①余剰電力をPLNに売電および②CDMの販売収入がある。
3.プロジェクト期間 (建設期間含む)
<算出前提条件 ケース2 FFB処理能力60トン/時間 初期投資額が15%上昇>
(1)出資金
1.初期投資額 (百万円) :
<初期投資額 (資金調達) 内訳>
('01年2月12日ビジネスタイムスより)
売電量2,200kWx7,446hrx9.2x0.8=120,566千円/年
合計収入: 120,566 + 127,341+ 33,000 = 280,907 千円/年
10MW未満のバイオマス発電の購入単価はスマトラグリッドの平均発電原価の80%である。スマトラグリッドの電源は水力と石炭火力であり、発電原価は9.2円/kWh程度と推定される。
バイオマス発電とメタン回収合計で63,671t-CO2/年x2,000円/t-CO2=127,341千円/年廃水地ラグーンからのメタン回収で16,500t-CO2/年x2,000円/t-CO2=33,000千円/年
②CDM販売収入
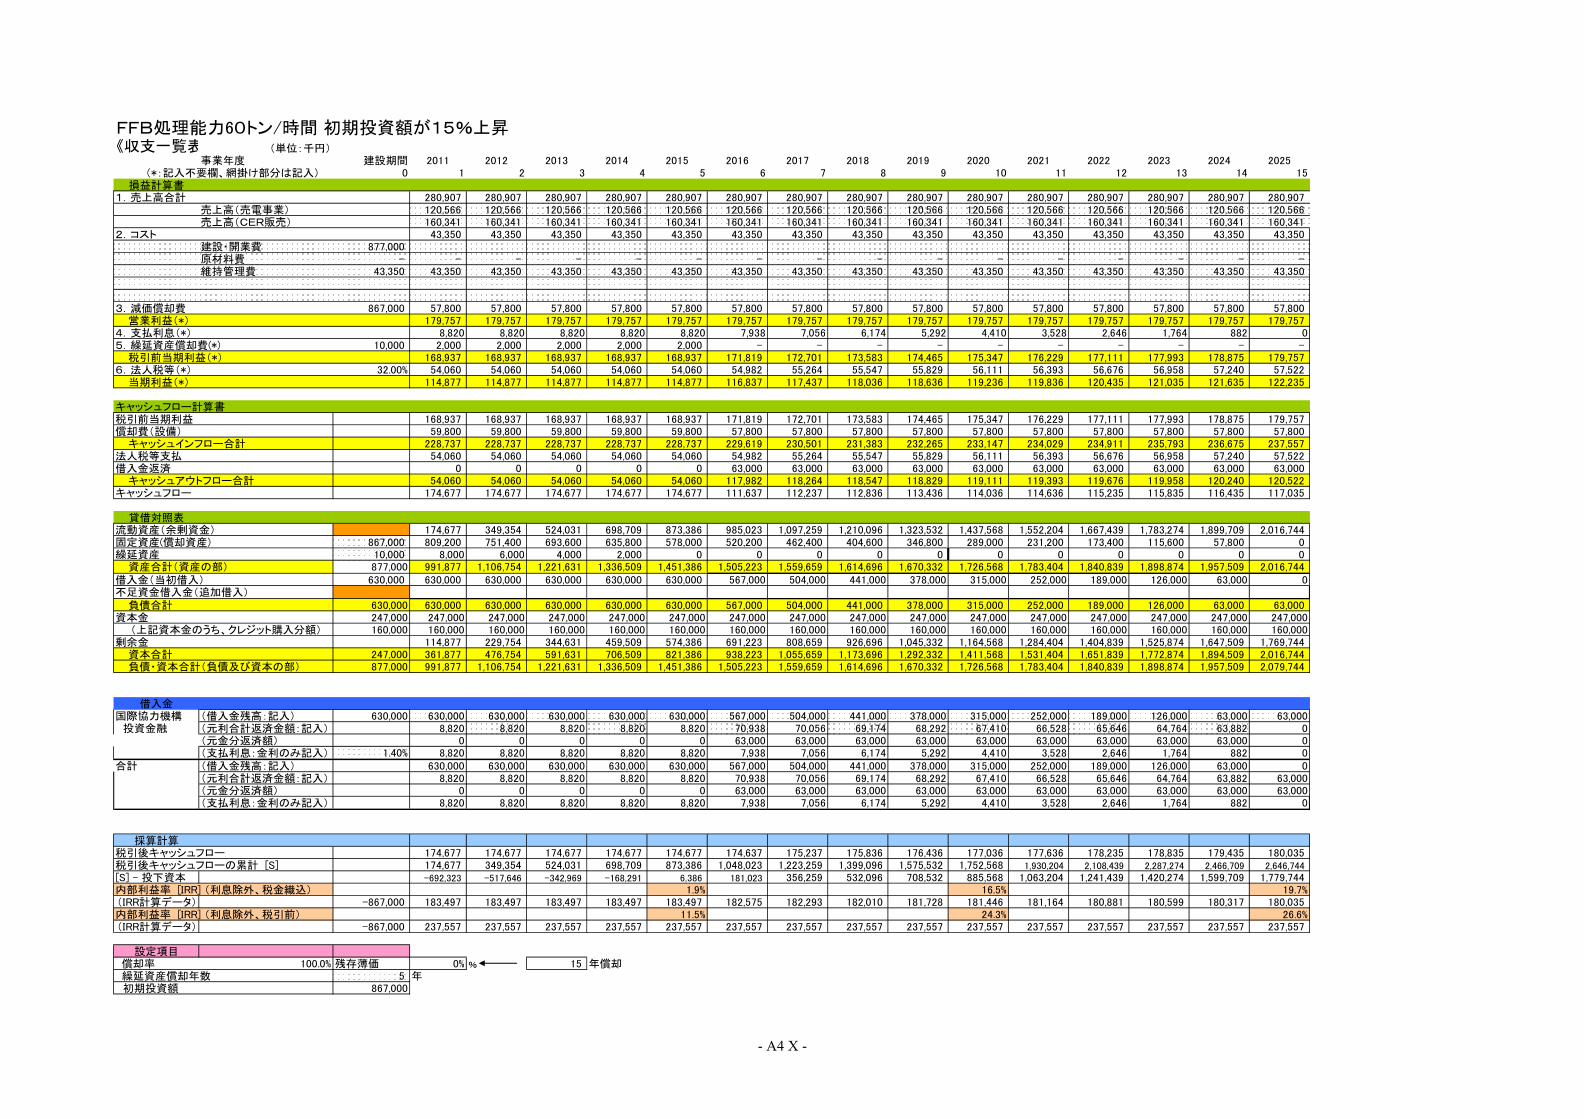
- A4 X -
《収支一覧表 (単位:千円)事業年度 建設期間 2011 2012 2013 2014 2015 2016 2017 2018 2019 2020 2021 2022 2023 2024 2025
0 1 2 3 4 5 6 7 8 9 10 11 12 13 14 15損益計算書
1.売上高合計 280,907 280,907 280,907 280,907 280,907 280,907 280,907 280,907 280,907 280,907 280,907 280,907 280,907 280,907 280,907 売上高(売電事業) 120,566 120,566 120,566 120,566 120,566 120,566 120,566 120,566 120,566 120,566 120,566 120,566 120,566 120,566 120,566 売上高(CER販売) 160,341 160,341 160,341 160,341 160,341 160,341 160,341 160,341 160,341 160,341 160,341 160,341 160,341 160,341 160,341
2.コスト 43,350 43,350 43,350 43,350 43,350 43,350 43,350 43,350 43,350 43,350 43,350 43,350 43,350 43,350 43,350 建設・開業費 877,000 原材料費 - - - - - - - - - - - - - - - - 維持管理費 43,350 43,350 43,350 43,350 43,350 43,350 43,350 43,350 43,350 43,350 43,350 43,350 43,350 43,350 43,350 43,350
3.減価償却費 867,000 57,800 57,800 57,800 57,800 57,800 57,800 57,800 57,800 57,800 57,800 57,800 57,800 57,800 57,800 57,800 営業利益(*) 179,757 179,757 179,757 179,757 179,757 179,757 179,757 179,757 179,757 179,757 179,757 179,757 179,757 179,757 179,757 4.支払利息(*) 8,820 8,820 8,820 8,820 8,820 7,938 7,056 6,174 5,292 4,410 3,528 2,646 1,764 882 05.繰延資産償却費(*) 10,000 2,000 2,000 2,000 2,000 2,000 - - - - - - - - - - 税引前当期利益(*) 168,937 168,937 168,937 168,937 168,937 171,819 172,701 173,583 174,465 175,347 176,229 177,111 177,993 178,875 179,757 6.法人税等(*) 32.00% 54,060 54,060 54,060 54,060 54,060 54,982 55,264 55,547 55,829 56,111 56,393 56,676 56,958 57,240 57,522 当期利益(*) 114,877 114,877 114,877 114,877 114,877 116,837 117,437 118,036 118,636 119,236 119,836 120,435 121,035 121,635 122,235
キャッシュフロー計算書税引前当期利益 168,937 168,937 168,937 168,937 168,937 171,819 172,701 173,583 174,465 175,347 176,229 177,111 177,993 178,875 179,757 償却費(設備) 59,800 59,800 59,800 59,800 59,800 57,800 57,800 57,800 57,800 57,800 57,800 57,800 57,800 57,800 57,800 キャッシュインフロー合計 228,737 228,737 228,737 228,737 228,737 229,619 230,501 231,383 232,265 233,147 234,029 234,911 235,793 236,675 237,557 法人税等支払 54,060 54,060 54,060 54,060 54,060 54,982 55,264 55,547 55,829 56,111 56,393 56,676 56,958 57,240 57,522 借入金返済 0 0 0 0 0 63,000 63,000 63,000 63,000 63,000 63,000 63,000 63,000 63,000 63,000 キャッシュアウトフロー合計 54,060 54,060 54,060 54,060 54,060 117,982 118,264 118,547 118,829 119,111 119,393 119,676 119,958 120,240 120,522 キャッシュフロー 174,677 174,677 174,677 174,677 174,677 111,637 112,237 112,836 113,436 114,036 114,636 115,235 115,835 116,435 117,035
貸借対照表流動資産(余剰資金) 174,677 349,354 524,031 698,709 873,386 985,023 1,097,259 1,210,096 1,323,532 1,437,568 1,552,204 1,667,439 1,783,274 1,899,709 2,016,744 固定資産(償却資産) 867,000 809,200 751,400 693,600 635,800 578,000 520,200 462,400 404,600 346,800 289,000 231,200 173,400 115,600 57,800 0繰延資産 10,000 8,000 6,000 4,000 2,000 0 0 0 0 0 0 0 0 0 0 0 資産合計(資産の部) 877,000 991,877 1,106,754 1,221,631 1,336,509 1,451,386 1,505,223 1,559,659 1,614,696 1,670,332 1,726,568 1,783,404 1,840,839 1,898,874 1,957,509 2,016,744 借入金(当初借入) 630,000 630,000 630,000 630,000 630,000 630,000 567,000 504,000 441,000 378,000 315,000 252,000 189,000 126,000 63,000 0不足資金借入金(追加借入) 負債合計 630,000 630,000 630,000 630,000 630,000 630,000 567,000 504,000 441,000 378,000 315,000 252,000 189,000 126,000 63,000 63,000 資本金 247,000 247,000 247,000 247,000 247,000 247,000 247,000 247,000 247,000 247,000 247,000 247,000 247,000 247,000 247,000 247,000 (上記資本金のうち、クレジット購入分額) 160,000 160,000 160,000 160,000 160,000 160,000 160,000 160,000 160,000 160,000 160,000 160,000 160,000 160,000 160,000 160,000剰余金 114,877 229,754 344,631 459,509 574,386 691,223 808,659 926,696 1,045,332 1,164,568 1,284,404 1,404,839 1,525,874 1,647,509 1,769,744 資本合計 247,000 361,877 476,754 591,631 706,509 821,386 938,223 1,055,659 1,173,696 1,292,332 1,411,568 1,531,404 1,651,839 1,772,874 1,894,509 2,016,744 負債・資本合計(負債及び資本の部) 877,000 991,877 1,106,754 1,221,631 1,336,509 1,451,386 1,505,223 1,559,659 1,614,696 1,670,332 1,726,568 1,783,404 1,840,839 1,898,874 1,957,509 2,079,744
借入金国際協力機構 (借入金残高:記入) 630,000 630,000 630,000 630,000 630,000 630,000 567,000 504,000 441,000 378,000 315,000 252,000 189,000 126,000 63,000 63,000 投資金融 (元利合計返済金額:記入) 8,820 8,820 8,820 8,820 8,820 70,938 70,056 69,174 68,292 67,410 66,528 65,646 64,764 63,882 0
(元金分返済額) 0 0 0 0 0 63,000 63,000 63,000 63,000 63,000 63,000 63,000 63,000 63,000 0(支払利息:金利のみ記入) 1.40% 8,820 8,820 8,820 8,820 8,820 7,938 7,056 6,174 5,292 4,410 3,528 2,646 1,764 882 0
合計 (借入金残高:記入) 630,000 630,000 630,000 630,000 630,000 567,000 504,000 441,000 378,000 315,000 252,000 189,000 126,000 63,000 0(元利合計返済金額:記入) 8,820 8,820 8,820 8,820 8,820 70,938 70,056 69,174 68,292 67,410 66,528 65,646 64,764 63,882 63,000(元金分返済額) 0 0 0 0 0 63,000 63,000 63,000 63,000 63,000 63,000 63,000 63,000 63,000 63,000(支払利息:金利のみ記入) 8,820 8,820 8,820 8,820 8,820 7,938 7,056 6,174 5,292 4,410 3,528 2,646 1,764 882 0
採算計算税引後キャッシュフロー 174,677 174,677 174,677 174,677 174,677 174,637 175,237 175,836 176,436 177,036 177,636 178,235 178,835 179,435 180,035 税引後キャッシュフローの累計 [S] 174,677 349,354 524,031 698,709 873,386 1,048,023 1,223,259 1,399,096 1,575,532 1,752,568 1,930,204 2,108,439 2,287,274 2,466,709 2,646,744 [S] - 投下資本 -692,323 -517,646 -342,969 -168,291 6,386 181,023 356,259 532,096 708,532 885,568 1,063,204 1,241,439 1,420,274 1,599,709 1,779,744 内部利益率 [IRR] (利息除外、税金織込) 1.9% 16.5% 19.7%(IRR計算データ) -867,000 183,497 183,497 183,497 183,497 183,497 182,575 182,293 182,010 181,728 181,446 181,164 180,881 180,599 180,317 180,035 内部利益率 [IRR] (利息除外、税引前) 11.5% 24.3% 26.6%(IRR計算データ) -867,000 237,557 237,557 237,557 237,557 237,557 237,557 237,557 237,557 237,557 237,557 237,557 237,557 237,557 237,557 237,557
設定項目 償却率 100.0% 残存薄価 0% % 15 年償却 繰延資産償却年数 5 年 初期投資額 867,000
FFB処理能力60トン/時間 初期投資額が15%上昇
(*:記入不要欄、網掛け部分は記入)

- A4 XI -
754
出資額 (百万円)
PT.PN 76
NEDO 136 2011-2012年のCER金額の50%を前払い(136,291x2年x50%)
合計 212
○具体的な借入予定先名も含め下記表を記載せよ(海外から借入の場合、US$1=110円 で計算)借入金(百万円) 返済期間 (年) 金利 (%) 通貨の種類
備考(金利の根拠等)
JICAプロジェクト 552 10 1.40% 円
ファイナンス
1 年
16 年
残存薄価(%) 0.00%
償却年数(年間) 15
①+②より
32.00%
* 下表を参照のこと。
国・地域 法人税率(%)
チリ 15
香港 16
台湾 25
シンガポール 25.5
マレーシア 28
インドネシア 30
タイ 30
英国 30
韓国 30.8
フィリピン 32
ニュージーランド 33
オーストラリア 34
米国 40
日本 42
本プロジェクトでは、Pay on delivery型を選択しない。
本プロジェクト実施にあたるコストとして、維持管理費は初期投資の5%の37,700千円/年としている。
7.法人税等実行税率とその根拠
6.コスト(売上原価+販管費+オペレーション+減価償却費 等)初期投資額は754百万円とする
2001年法人税比較】
(1)事業収入
(2)クレジット収入(Pay on deliverly 型を選択する場合のみ記入)
(インドネシア国の税率)
初期投資額の10%
JBIC融資条件10年5年据え置き半年賦計算例
①売電収入
(2)借入金
2.建設期間
4.減価償却
5.売上高
事業収入として、①余剰電力をPLNに売電および②CDMの販売収入がある。
3.プロジェクト期間 (建設期間含む)
<算出前提条件 ケース2 FFB処理能力60トン/時間 操業率15%ダウン>
(1)出資金
1.初期投資額 (百万円) :
<初期投資額 (資金調達) 内訳>
('01年2月12日ビジネスタイムスより)
売電量2,200kWx7,446hrx9.2x0.8x0.85=102,481千円/年
合計収入: 102,481+ 108,2411+ 28,050 = 238,772 千円/年
10MW未満のバイオマス発電の購入単価はスマトラグリッドの平均発電原価の80%である。スマトラグリッドの電源は水力と石炭火力であり、発電原価は9.2円/kWh程度と推定される。
バイオマス発電とメタン回収合計で63,671t-CO2/年x2,000円/t-CO2x0.85=108,241千円/年廃水地ラグーンからのメタン回収で16,500t-CO2/年x2,000円/t-CO2x0.85=28,050千円/年
②CDM販売収入

- A4 XII -
《収支一覧表 (単位:千円)事業年度 建設期間 2011 2012 2013 2014 2015 2016 2017 2018 2019 2020 2021 2022 2023 2024 2025
0 1 2 3 4 5 6 7 8 9 10 11 12 13 14 15損益計算書
1.売上高合計 237,772 237,772 237,772 237,772 237,772 237,772 237,772 237,772 237,772 237,772 237,772 237,772 237,772 237,772 237,772 売上高(売電事業) 102,481 102,481 102,481 102,481 102,481 102,481 102,481 102,481 102,481 102,481 102,481 102,481 102,481 102,481 102,481 売上高(CER販売) 135,291 135,291 135,291 135,291 135,291 135,291 135,291 135,291 135,291 135,291 135,291 135,291 135,291 135,291 135,291
2.コスト 37,700 37,700 37,700 37,700 37,700 37,700 37,700 37,700 37,700 37,700 37,700 37,700 37,700 37,700 37,700 建設・開業費 754,000 原材料費 - - - - - - - - - - - - - - - - 維持管理費 37,700 37,700 37,700 37,700 37,700 37,700 37,700 37,700 37,700 37,700 37,700 37,700 37,700 37,700 37,700 37,700
3.減価償却費 754,000 50,267 50,267 50,267 50,267 50,267 50,267 50,267 50,267 50,267 50,267 50,267 50,267 50,267 50,267 50,267 営業利益(*) 149,805 149,805 149,805 149,805 149,805 149,805 149,805 149,805 149,805 149,805 149,805 149,805 149,805 149,805 149,805 4.支払利息(*) 7,728 7,728 7,728 7,728 7,728 6,955 6,182 5,410 4,637 3,864 3,091 2,318 1,546 773 05.繰延資産償却費(*) 10,000 2,000 2,000 2,000 2,000 2,000 - - - - - - - - - - 税引前当期利益(*) 140,077 140,077 140,077 140,077 140,077 142,850 143,623 144,396 145,169 145,941 146,714 147,487 148,260 149,033 149,805 6.法人税等(*) 32.00% 44,825 44,825 44,825 44,825 44,825 45,712 45,959 46,207 46,454 46,701 46,949 47,196 47,443 47,690 47,938 当期利益(*) 95,253 95,253 95,253 95,253 95,253 97,138 97,664 98,189 98,715 99,240 99,766 100,291 100,817 101,342 101,868
キャッシュフロー計算書税引前当期利益 140,077 140,077 140,077 140,077 140,077 142,850 143,623 144,396 145,169 145,941 146,714 147,487 148,260 149,033 149,805 償却費(設備) 52,267 52,267 52,267 52,267 52,267 50,267 50,267 50,267 50,267 50,267 50,267 50,267 50,267 50,267 50,267 キャッシュインフロー合計 192,344 192,344 192,344 192,344 192,344 193,117 193,890 194,662 195,435 196,208 196,981 197,754 198,526 199,299 200,072 法人税等支払 44,825 44,825 44,825 44,825 44,825 45,712 45,959 46,207 46,454 46,701 46,949 47,196 47,443 47,690 47,938 借入金返済 0 0 0 0 0 55,200 55,200 55,200 55,200 55,200 55,200 55,200 55,200 55,200 55,200 キャッシュアウトフロー合計 44,825 44,825 44,825 44,825 44,825 100,912 101,159 101,407 101,654 101,901 102,149 102,396 102,643 102,890 103,138 キャッシュフロー 147,519 147,519 147,519 147,519 147,519 92,205 92,730 93,256 93,781 94,307 94,832 95,358 95,883 96,409 96,934
貸借対照表流動資産(余剰資金) 147,519 295,039 442,558 590,077 737,596 829,801 922,531 1,015,787 1,109,568 1,203,875 1,298,707 1,394,065 1,489,948 1,586,357 1,683,292 固定資産(償却資産) 754,000 703,733 653,467 603,200 552,933 502,667 452,400 402,133 351,867 301,600 251,333 201,067 150,800 100,533 50,267 0繰延資産 10,000 8,000 6,000 4,000 2,000 0 0 0 0 0 0 0 0 0 0 0 資産合計(資産の部) 764,000 859,253 954,505 1,049,758 1,145,010 1,240,263 1,282,201 1,324,665 1,367,654 1,411,168 1,455,208 1,499,774 1,544,865 1,590,482 1,636,624 1,683,292 借入金(当初借入) 552,000 552,000 552,000 552,000 552,000 552,000 496,800 441,600 386,400 331,200 276,000 220,800 165,600 110,400 55,200 0不足資金借入金(追加借入) 負債合計 552,000 552,000 552,000 552,000 552,000 552,000 496,800 441,600 386,400 331,200 276,000 220,800 165,600 110,400 55,200 - 資本金 212,000 212,000 212,000 212,000 212,000 212,000 212,000 212,000 212,000 212,000 212,000 212,000 212,000 212,000 212,000 212,000 (上記資本金のうち、クレジット購入分額) 136,000 136,000 136,000 136,000 136,000 136,000 136,000 136,000 136,000 136,000 136,000 136,000 136,000 136,000 136,000 136,000剰余金 95,253 190,505 285,758 381,010 476,263 573,401 671,065 769,254 867,968 967,208 1,066,974 1,167,265 1,268,082 1,369,424 1,471,292 資本合計 212,000 307,253 402,505 497,758 593,010 688,263 785,401 883,065 981,254 1,079,968 1,179,208 1,278,974 1,379,265 1,480,082 1,581,424 1,683,292 負債・資本合計(負債及び資本の部) 764,000 859,253 954,505 1,049,758 1,145,010 1,240,263 1,282,201 1,324,665 1,367,654 1,411,168 1,455,208 1,499,774 1,544,865 1,590,482 1,636,624 1,683,292
借入金国際協力機構 (借入金残高:記入) 552,000 552,000 552,000 552,000 552,000 552,000 496,800 441,600 386,400 331,200 276,000 220,800 165,600 110,400 55,200 0 投資金融 (元利合計返済金額:記入) 7,728 7,728 7,728 7,728 7,728 62,155 61,382 60,610 59,837 59,064 58,291 57,518 56,746 55,973 0
(元金分返済額) 0 0 0 0 0 55,200 55,200 55,200 55,200 55,200 55,200 55,200 55,200 55,200 0(支払利息:金利のみ記入) 1.40% 7,728 7,728 7,728 7,728 7,728 6,955 6,182 5,410 4,637 3,864 3,091 2,318 1,546 773 0
合計 (借入金残高:記入) 552,000 552,000 552,000 552,000 552,000 496,800 441,600 386,400 331,200 276,000 220,800 165,600 110,400 55,200 0(元利合計返済金額:記入) 7,728 7,728 7,728 7,728 7,728 62,155 61,382 60,610 59,837 59,064 58,291 57,518 56,746 55,973 55,200(元金分返済額) 0 0 0 0 0 55,200 55,200 55,200 55,200 55,200 55,200 55,200 55,200 55,200 55,200(支払利息:金利のみ記入) 7,728 7,728 7,728 7,728 7,728 6,955 6,182 5,410 4,637 3,864 3,091 2,318 1,546 773 0
採算計算税引後キャッシュフロー 147,519 147,519 147,519 147,519 147,519 147,405 147,930 148,456 148,981 149,507 150,032 150,558 151,083 151,609 152,134 税引後キャッシュフローの累計 [S] 147,519 295,039 442,558 590,077 737,596 885,001 1,032,931 1,181,387 1,330,368 1,479,875 1,629,907 1,780,465 1,931,548 2,083,157 2,235,292 [S] - 投下資本 -606,481 -458,961 -311,442 -163,923 -16,404 131,001 278,931 427,387 576,368 725,875 875,907 1,026,465 1,177,548 1,329,157 1,481,292 内部利益率 [IRR] (利息除外、税金織込) 1.0% 15.8% 19.0%(IRR計算データ) -754,000 155,247 155,247 155,247 155,247 155,247 154,360 154,113 153,865 153,618 153,371 153,123 152,876 152,629 152,382 152,134 内部利益率 [IRR] (利息除外、税引前) 10.2% 23.3% 25.7%(IRR計算データ) -754,000 200,072 200,072 200,072 200,072 200,072 200,072 200,072 200,072 200,072 200,072 200,072 200,072 200,072 200,072 200,072
設定項目 償却率 100.0% 残存薄価 0% % 15 年償却 繰延資産償却年数 5 年 初期投資額 754,000
FFB処理能力60トン/時間 操業率15%ダウン
(*:記入不要欄、網掛け部分は記入)

APPENDIX 5
Recommended Terms of Reference

- A5 I -
Appendix 5: Recommended Terms of Reference
Recommended Terms of Reference for
the Project Preparation Study on
the POM Wastes-fired Power Generation and POA Project for
the Rural Electrification in Sumatra, Indonesia
1. Project Digest
(1) Project Title:
The Project Formulation Study on POM Wastes-fired Power Generation and PoA Project for the Rural Electrification in Sumatra, the Republic of Indonesia.
(2) Location:
Entire Provinces in Sumatra Island, the Republic of Indonesia
(3) Implementing Agency:
The Ministry of State Corporation (BUMN) The Ministry of State Corporation (BUMN) shall be responsible for the whole course of the Study and will coordinate and cooperate with related Government Agencies and PT. Perkebunan Nusantara I~VII in proceeding on this Project and will set up a Steering Committee as follows.
Structure of the Steering Committee:
Chairman: - The Ministry of State Corporation (BUMN) Secretary: - Office of the Deputy Minister for Agro Industry, Forestry, Paper, Printing
and Publishing.
- A5 II -
Members: - Coordinating Ministry for Economic Affairs - National Development Planning Board (BAPPENAS) - Ministry of Finance (MOF) - Ministry of Energy and Mineral Resources (MEMR) - National Electricity Company (PT. PLN) - Agencies for the assessment and application of technology (BPPT) - Ministry of Agriculture (MOA) - Ministry of Industry (MOI)- - Ministry of Environment (MOE) - PT. Perkebunan Nusantara I - PT. Perkebunan Nusantara II - PT. Perkebunan Nusantara III - PT. Perkebunan Nusantara IV - PT. Perkebunan Nusantara V - PT. Perkebunan Nusantara VI - PT. Perkebunan Nusantara VII
(4) Rationale of the Project
1) Needs for Rural Electrification
The Electrification Rate of Indonesia is said to be approx. 60%, which is lower than the neighboring countries. Especially in the isolated rural area, such as mountainous remote area and islands, it is presumed that considerable amount of non-electrified indigent villages still remain in large number. Indonesian Government has, with the assistance of developed countries, promoted the electrification of such rural area starting from 1970’s, in the manner of not only enriching power distribution network but also introduction of diesel power generator, micro hydro power station and solar energy generation including such Off-grid Electric Districts. The Electrification Rates by Region in Indonesia are shown as follows;
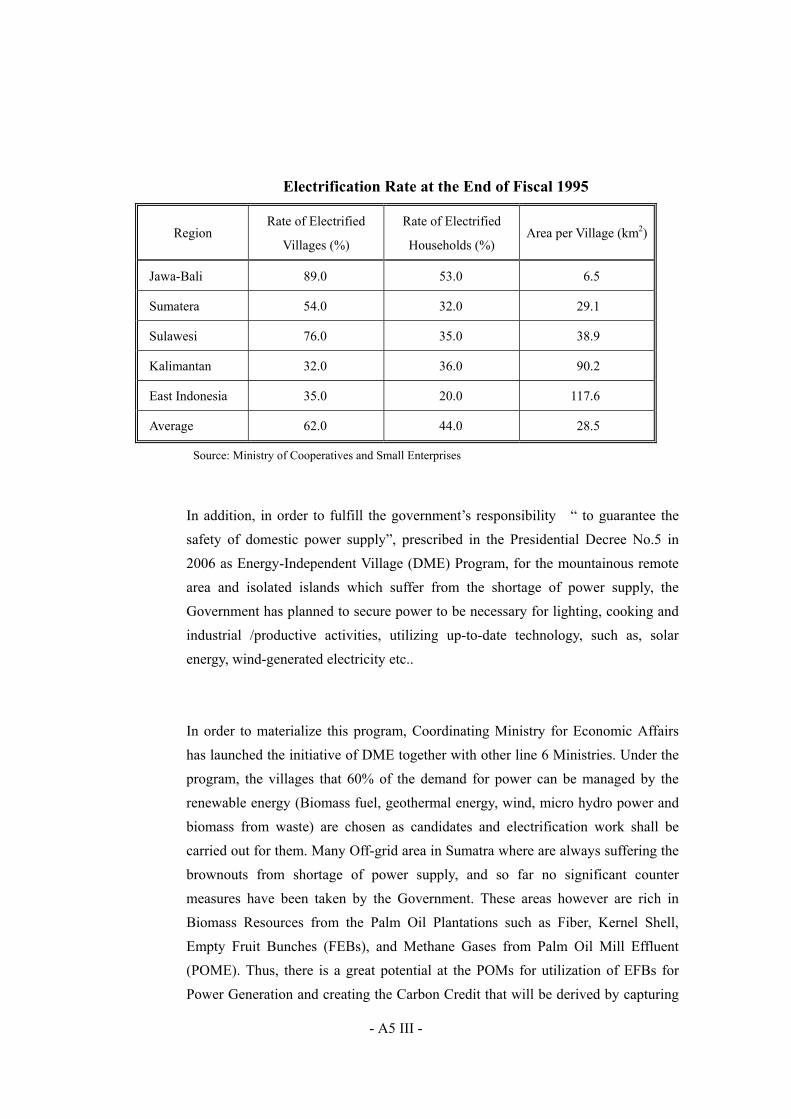
- A5 III -
Electrification Rate at the End of Fiscal 1995
Region Rate of Electrified
Villages (%)
Rate of Electrified
Households (%) Area per Village (km2)
Jawa-Bali 89.0 53.0 6.5
Sumatera 54.0 32.0 29.1
Sulawesi 76.0 35.0 38.9
Kalimantan 32.0 36.0 90.2
East Indonesia 35.0 20.0 117.6
Average 62.0 44.0 28.5
Source: Ministry of Cooperatives and Small Enterprises
In addition, in order to fulfill the government’s responsibility “ to guarantee the safety of domestic power supply”, prescribed in the Presidential Decree No.5 in 2006 as Energy-Independent Village (DME) Program, for the mountainous remote area and isolated islands which suffer from the shortage of power supply, the Government has planned to secure power to be necessary for lighting, cooking and industrial /productive activities, utilizing up-to-date technology, such as, solar energy, wind-generated electricity etc..
In order to materialize this program, Coordinating Ministry for Economic Affairs has launched the initiative of DME together with other line 6 Ministries. Under the program, the villages that 60% of the demand for power can be managed by the renewable energy (Biomass fuel, geothermal energy, wind, micro hydro power and biomass from waste) are chosen as candidates and electrification work shall be carried out for them. Many Off-grid area in Sumatra where are always suffering the brownouts from shortage of power supply, and so far no significant counter measures have been taken by the Government. These areas however are rich in Biomass Resources from the Palm Oil Plantations such as Fiber, Kernel Shell, Empty Fruit Bunches (FEBs), and Methane Gases from Palm Oil Mill Effluent (POME). Thus, there is a great potential at the POMs for utilization of EFBs for Power Generation and creating the Carbon Credit that will be derived by capturing

- A5 IV -
the Methane Gases from the POME, and eventually to contribute the DME program throughout the entire provinces in Sumatra Island.
2) Purpose of the Project Purposes of the proposed Palm Oil Mill (POM) Wastes-fired Power Generation and Gas Capturing Project which shall be implemented as a Program of Activity (PoA) Project, will be consists of three (3) major Objectives that may be summarized as under. a.To help support the Rural Electrification Program which have been initiated by
the Government of Indonesia through the extension of Energy-independent Village Program,
b.To improve the Environmental Conditions within the POMs, at the surrounding
communities and to contribute for mitigating the Climate Changes at global levels by capturing the Green House Effect Gases (GHGs), and
c.To help support the financial sustainability of POMs by providing additional
Revenues through the realization of “Waste-to-Energy” concept; the sales of Electric Power to National Grid and/or Off-grid Electricity Districts and the Carbon Credit gained by the Certification of Emission Reduction of GHGs to be issued by the United Nations.
3) Need for the Project Preparation Study The Preliminary Feasibility Study has been conducted by Engineering and
Consulting Firms Association (ECFA), Japan in March 2009. Through this Study, the Optimum Technology for the proposed Systems, Applicability of PoA Concept to the Scheme, Implementation and Monitoring Structures and Financial Viability have been fairly analyzed.
However, dept of the Site Investigation and Cost Estimate were rather limited due to time constraints given to the study team. In addition, the Environment Impact

- A5 V -
Assessment (EIA) Study and the Detailed System Design and Detailed Engineering Study are yet to be conducted. Thus, the Project needs a full-scale Preparation Study in order to meet these requirements prior to the implementation of the Project.
2. Terms of Reference for the Project Preparation Study
(1) Objectives of the Study
The main objective of the Project Preparation Study is to ascertain the outputs of the Preliminary Feasibility Study for the proposed Palm Oil Mill Wastes-fired Power Generation and Methane Gas Capturing Project in Sumatra. Preliminary Feasibility Study has been conducted by ECFA in March 2009, which aimed at the dissemination of the Rural Electrification through the implementation of the Project Areas of the proposed Project Preparation Study covers the entire regions of Sumatra Island.
(2) Scope of the Study 1) Overview of Rural Electrification in Indonesia
a) Gathering and Analyzing of Background Data/Information
- Economic situation - Energy situation in Indonesia such as energy consumption, energy
resources, and energy policies - Current state of electrification including electrification policies and
plan, related laws, acts - Rural electrification plans by PLN - Related organizations, their activities and their awareness in regard
to electrification
b) Confirmation of Rural Electrification Policy
- Review and confirmation of rural electrification policy
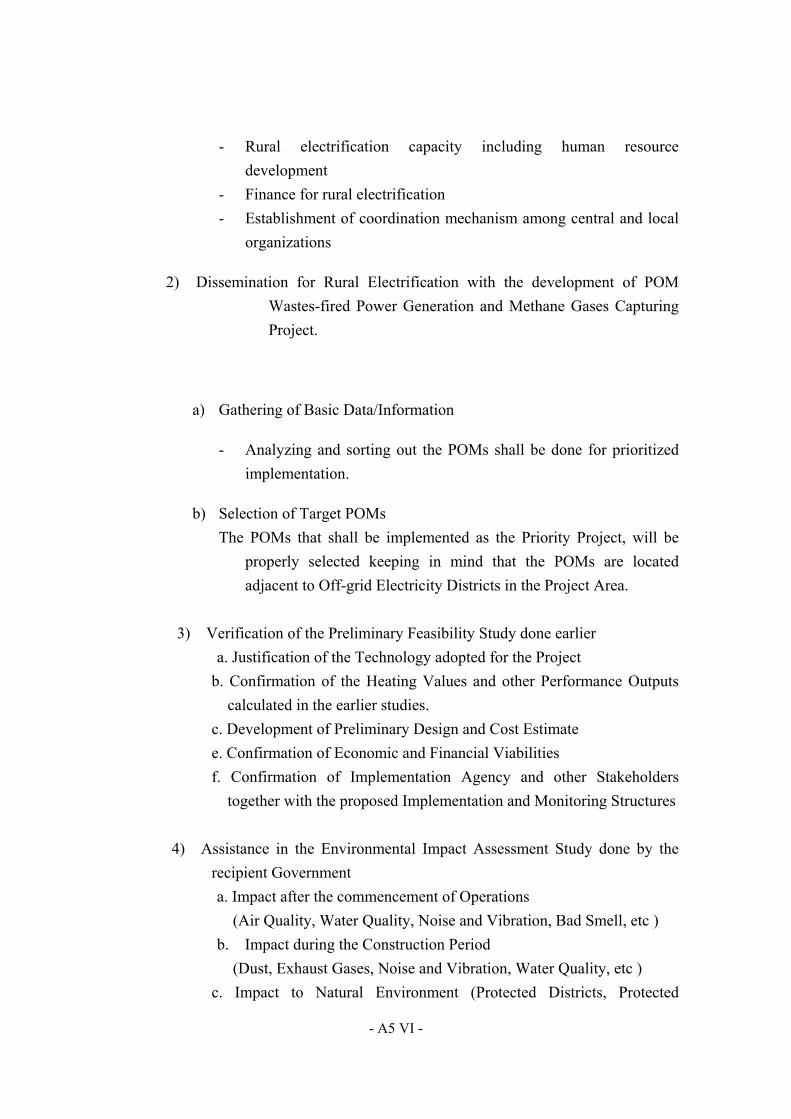
- A5 VI -
- Rural electrification capacity including human resource development
- Finance for rural electrification - Establishment of coordination mechanism among central and local
organizations
2) Dissemination for Rural Electrification with the development of POM Wastes-fired Power Generation and Methane Gases Capturing Project.
a) Gathering of Basic Data/Information
- Analyzing and sorting out the POMs shall be done for prioritized implementation.
b) Selection of Target POMs The POMs that shall be implemented as the Priority Project, will be
properly selected keeping in mind that the POMs are located adjacent to Off-grid Electricity Districts in the Project Area.
3) Verification of the Preliminary Feasibility Study done earlier a. Justification of the Technology adopted for the Project
b. Confirmation of the Heating Values and other Performance Outputs calculated in the earlier studies.
c. Development of Preliminary Design and Cost Estimate e. Confirmation of Economic and Financial Viabilities f. Confirmation of Implementation Agency and other Stakeholders
together with the proposed Implementation and Monitoring Structures
4) Assistance in the Environmental Impact Assessment Study done by the recipient Government
a. Impact after the commencement of Operations (Air Quality, Water Quality, Noise and Vibration, Bad Smell, etc )
b. Impact during the Construction Period (Dust, Exhaust Gases, Noise and Vibration, Water Quality, etc )
c. Impact to Natural Environment (Protected Districts, Protected
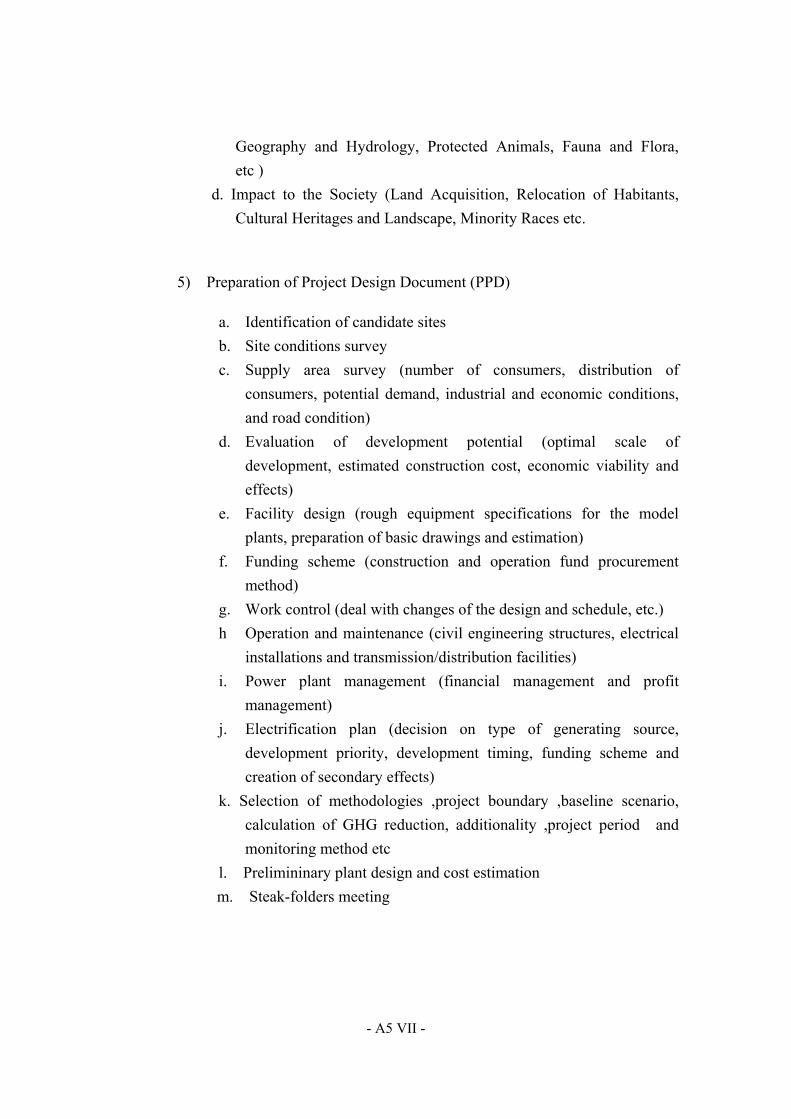
- A5 VII -
Geography and Hydrology, Protected Animals, Fauna and Flora, etc )
d. Impact to the Society (Land Acquisition, Relocation of Habitants, Cultural Heritages and Landscape, Minority Races etc.
5) Preparation of Project Design Document (PPD)
a. Identification of candidate sites b. Site conditions survey c. Supply area survey (number of consumers, distribution of
consumers, potential demand, industrial and economic conditions, and road condition)
d. Evaluation of development potential (optimal scale of development, estimated construction cost, economic viability and effects)
e. Facility design (rough equipment specifications for the model plants, preparation of basic drawings and estimation)
f. Funding scheme (construction and operation fund procurement method)
g. Work control (deal with changes of the design and schedule, etc.) h Operation and maintenance (civil engineering structures, electrical
installations and transmission/distribution facilities) i. Power plant management (financial management and profit
management) j. Electrification plan (decision on type of generating source,
development priority, development timing, funding scheme and creation of secondary effects)
k. Selection of methodologies ,project boundary ,baseline scenario, calculation of GHG reduction, additionality ,project period and monitoring method etc
l. Prelimininary plant design and cost estimation m. Steak-folders meeting

- A5 VIII -
(5) Study Period
The working period is estimated as 6 months.
3. Staff/Personnel Participating in Project Implementation
The estimated number of the Experts for the study is as follows:
- 1 (one) senior engineer as the team leader fully in charge and well experienced in such nature of work
- 1 (one) biomass power engineer - 1 (one) electrical engineer (distribution and consumer) - 1 (one) CDM expert - 1 (one) economist - 1 (one) legal expert
4. Assistance Requested
(1) Counterparts
It is preferable that an equivalent number of counter-parts from local officials can work with the foreign experts.
(2) Reporting and Printing
The following Reports shall be prepared in English and Japanese.
a. Inception Report 10 copies
b. Interim Report 10 copies
c. Draft Final Report and Summary 20 copies
The Government of Indonesia will provide JICA with the comments on the Draft Final Report within one month after its reception.
d. Final Report and Summary 20 copies

インドネシア・スマトラにおける地方電化のためのパームオイル工場廃棄物
発電システムとCDMプロジェクトに関する予備事業性調査
要 約
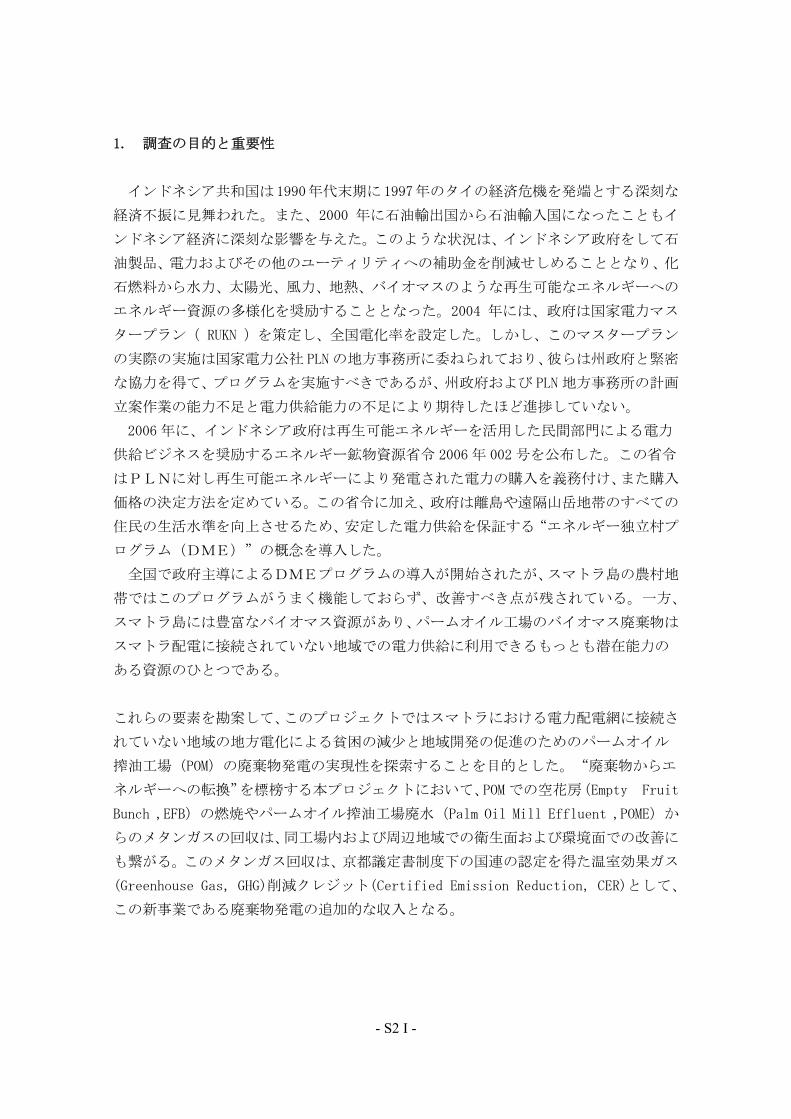
- S2 I -
1. 調査の目的と重要性
インドネシア共和国は1990年代末期に1997年のタイの経済危機を発端とする深刻な
経済不振に見舞われた。また、2000 年に石油輸出国から石油輸入国になったこともイ
ンドネシア経済に深刻な影響を与えた。このような状況は、インドネシア政府をして石
油製品、電力およびその他のユーティリティへの補助金を削減せしめることとなり、化
石燃料から水力、太陽光、風力、地熱、バイオマスのような再生可能なエネルギーへの
エネルギー資源の多様化を奨励することとなった。2004 年には、政府は国家電力マス
タープラン( RUKN )を策定し、全国電化率を設定した。しかし、このマスタープラン
の実際の実施は国家電力公社 PLN の地方事務所に委ねられており、彼らは州政府と緊密
な協力を得て、プログラムを実施すべきであるが、州政府および PLN 地方事務所の計画
立案作業の能力不足と電力供給能力の不足により期待したほど進捗していない。
2006 年に、インドネシア政府は再生可能エネルギーを活用した民間部門による電力
供給ビジネスを奨励するエネルギー鉱物資源省令 2006 年 002 号を公布した。この省令
はPLNに対し再生可能エネルギーにより発電された電力の購入を義務付け、また購入
価格の決定方法を定めている。この省令に加え、政府は離島や遠隔山岳地帯のすべての
住民の生活水準を向上させるため、安定した電力供給を保証する“エネルギー独立村プ
ログラム(DME)”の概念を導入した。
全国で政府主導によるDMEプログラムの導入が開始されたが、スマトラ島の農村地
帯ではこのプログラムがうまく機能しておらず、改善すべき点が残されている。一方、
スマトラ島には豊富なバイオマス資源があり、パームオイル工場のバイオマス廃棄物は
スマトラ配電に接続されていない地域での電力供給に利用できるもっとも潜在能力の
ある資源のひとつである。
これらの要素を勘案して、このプロジェクトではスマトラにおける電力配電網に接続さ
れていない地域の地方電化による貧困の減少と地域開発の促進のためのパームオイル
搾油工場(POM)の廃棄物発電の実現性を探索することを目的とした。“廃棄物からエ
ネルギーへの転換”を標榜する本プロジェクトにおいて、POM での空花房(Empty Fruit
Bunch ,EFB)の燃焼やパームオイル搾油工場廃水(Palm Oil Mill Effluent ,POME)か
らのメタンガスの回収は、同工場内および周辺地域での衛生面および環境面での改善に
も繋がる。このメタンガス回収は、京都議定書制度下の国連の認定を得た温室効果ガス
(Greenhouse Gas,GHG)削減クレジット(Certified Emission Reduction,CER)として、
この新事業である廃棄物発電の追加的な収入となる。
- S2 II -
2. 調査結果の概要
本調査は、インドネシア国の社会経済状況の実態調査、電力分野における既存および
将来の開発計画、“エネルギー独立村”計画の進捗、電力分野およびパームオイル産業
における技術と人材の評価、プロジェクト実施地域内の POM の実態調査、新事業の経済
財務分析その他の調査を含み、その調査結果は以下のように整理・要約される
(1) パームオイル工場廃棄物のバイオマス発電における代替燃料としての意義
インドネシア国は世界 大のパームオイル生産国であり、スマトラ諸州には世界でも
有数のバイオマス発電の中心となる可能性がある。空花房(Empty Fruit Bunch ,EFB)
は、搾油前の油やし房実(Fresh Fruit Bunch, FFB)の重量に対し 23%を占める残渣
で、わずかに農場に肥料として戻される分を除き、これまでパーム搾油工場(Palm Oil
Mill, POM)の廃棄物として活用されることなく処分されて来た。一方、気候変動に影
響を与える温室効果ガスのひとつであるメタンガスは、パーム搾油工場廃水(Palm Oil
Mill Effluent , POME)から回収されずに放置されてきた。本調査は、これらの廃棄物
を回収活用し“廃棄物からエネルギーへの転換”のコンセプトに基づき発電資源として
利用することを提起するものである。本調査期間内に実施された現地調査によれば、ス
マトラ島には 7 社の国営農場会社(PT.Pekebunan Nusantasas , PT.PNs)が経営する
61のパーム搾油工場と数百にのぼる民間企業により運営されるパーム搾油工場がある。
それゆえ、スマトラ島には夥しい量の潜在的な発電用資源が腑存していると言える。こ
れらの資源を活用して発電を行い、特にスマトラ配電網でカバーされていない地域に対
して供給することは、インドネシア国政府の主導で鋭意推進されている「独立エネルギ
ー村」計画の一部として利用されることとなり、検討に値する。
(2) 関係機関および地域コミュニテイによる計画遂行の意向の確認
本調査団は、大統領府経済担当調整省、財務省、国家開発企画庁、国営企業省、農業
省、エネルギー鉱山資源省、工業省、国営農場会社、州政府、国営マンディリ銀行との
一連のインタビュー及び意見交換を通じて、本調査により提案された開発コンセプトは
実施機関と目される国営企業省及びいくつかの国営農場会社はもとより全ての関係機
関に受容され、これらの関係者はこの計画の実施に関心があることを確認した。また、
有力な国営銀行のひとつであるマンディリ銀行はこのプロジェクトに対しツーステッ
プローンが供与された場合、導管機能の役割を果たすことに関心を表明した。また、地
域コミュニテイにとっても、文書による検証を得たわけではないが、本プロジェクトの
目的が地方電化の促進と農村地域での貧困減少に資することであることに鑑み、本プロ
ジェクトを魅力的な計画とみなしていることが窺がわれた。
- S2 III -
(3) バイオマス発電システムとして も適合しかつ 適な技術の選択
プロジェクト対象地域における入手可能な技術や人的資源への細心な評価結果を基
に、本調査団は現地調査の結果得られた POM からのメタンガス回収と EFB を利用する発
電と電力供給のいくつかの代替案を比較検討した。その結果についての詳細な説明は本
報告書 3 章に示されている。
(4) 公営セクターと民間セクターの両方で所有されるプロジェクトの実施モデル
本調査団は、国営企業が保有するパーム搾油工場に対するプロジェクトだけでなく、
民間セクターが所有かつ運営しているパーム搾油工場についても適切なプロジェクト
実施体制の構築を試みた。この事業モデルを確立するにあたり重要な課題となる事項は、
「だれがプロジェクト実施の責任機関となるか」、及び「だれが供与されたソフトロー
ンの導管機能を果たすか」にある。財務省、国家開発企画庁のアドバイスに基づき、本
調査団は 大の国営銀行であるマンディリ銀行に接触した結果、彼らはこのプロジェク
トのために供与されるソフトローンの導管機関になることに強い関心を示した。しかし
ながら、プロジェクトの実施機関については、いくつかの実施省庁が関心を示したが時
間の制約もあり、特定の省庁を本プロジェクトの実施機関として絞り込むまでには至ら
なかった。
(5) プログラム CDM プロジェクトとしての財務的企業化可能性の分析
いくつかの財務評価上のパラメータを仮定して財務的企業化可能性分析を実施した。
財務的企業化可能性分析に当たり設定した主要な前提条件は以下の 2 点である。
① 主要な2大収益源として、PLN への電力販売と温室効果ガス削減クレジット
(京都議定書の Certified of Emission Reduction, CER)を設定、及び
② 初期投資を補うために日本政府からのソフトローンが供与される。
財務的企業化可能性分析の結果、油やし花房(FFB)の処理能力が時間あたり
30 トンの場合、税引き前内部収益率は 11.7%であり、同処理能力が時間あたり 60
トンの場合は 31.7%であった。いくつかの財務評価上のパラメータを変動させた
シナリオに基づく感度分析も実施された。

- S2 IV -
(6) プロジェクト実施のための工程表(ロードマップ)
今回の予備事業化調査では肯定的な指標が得られたが、本格的な企業化調査と環境影
響調査を日本政府関連機関から供与される技術支援スキームを活用し実施することが
推奨される。上記技術支援スキームへの申請や本格的な企業化調査と環境影響調査のた
めの行程表(ロードマップ)は本報告書の第4章に示した。