preparation of nanocomposite titanate...
TRANSCRIPT

12. - 14. 10. 2010, Olomouc, Czech Republic, EU
1
PREPARATION OF NANOCOMPOSITE TITANATE NANOTUBES
Stanislav ŠTARMANa, Václav MATZa, Zdeněk KVÁČAb, Martin MOHYLAb, Vladimír OLŠÁKb,
Mariana KLEMENTOVÁc, Josef HUMLÍČEKd, Michal DRŠTIČKAe
aStarmans electronics, V Zahradách 24, Praha 8, 180 00, Česká republika, [email protected]
bMolecular cybernetics, Strážovská 7, Praha 5, 153 00, [email protected] cÚstav anorganické chemie AV ČR, Husinec - Řež 1001, 250 68, [email protected]
dÚstav fyziky kondenzovaných látek PřF MU, Kotlářská 267/2, Brno, 611 37 [email protected]
eDelong Instruments, Brno, Palackého třída 153 b, Brno, 612 00, [email protected]
Abstract
For polymeric nanocomposite structure it is necessary to use chemically fixed monomer on nanotubes. This
was the main reason for preparation of functionalized titanate nanotubes by multifunctional monomers.
Sodium trititanate was prepared by hydrothermal exfoliation of titanium oxide nanoparticles at concentrated
hydroxide sodium environment. Hybrid monomer – titanate nanotubes was prepared by long term
solvothermal functionalization of titanate nanotubes using basic or acid of multifunctional monomer.
Thermal stability and decomposition of organic component was analyzed by thermal analysis (DSC/DTA).
Bonded organic functional groups were identified by infrared (FTIR) and Raman spectroscopy (RS).
Composition and structure of nanotube was determined by roentgen diffraction (XRD). Nanomorphology of
nanotubes was displayed by scanning electron, transmission and atomic microscopy (SEM, TEM and AFM).
Keywords: nanotubes, titanates, sonolysis, solvothermal, hydrotermal
1. INTRODUCTION
Electrode materials for field emission must have high density electron structure, narrow energy gap and
negative electron affinity for electrons tunneling into vacuum. Materials can be produced based on metalloid
semiconductor basis of TiO2 type [1] treated by organic polymers.
For polymer nanocomposite preparation composited from nanopaticles and macromolecular components it is
necessary to modify basic properties of titanate nanotubes, functional surface properties and apply reaction
of surface hydroxyl groups by organic acids and basis. In literature we found only the functionalization by
benzoic acid[2], metacetonic acid, caproic acid, capric acid, tetradecanoic acid, hexadecanoic acid and
stearic acid[3]. Our first functionalizations within last year were made using monofunctional organic
molecule[4]. In all cases, only molecules with long aliphatic chains or aromatic cycles were bonded. Using
infrared spectroscopy in organic hydroxybasis bonds were identified alkoxides and aroxides reactants. In
organic aminobasis bonds we detected ammonia bonds and carboxyl groups.
2. EXPERIMENTS
2.1. Used methods
2.1.1. Powdered samples
Ternary system of starting compound was prepared for six binary compounds of functional titanate
nanotubes. The first component was nano titanium dioxide P25 (3% weight) and second component was
organic monomer (10% mol doping) solubled in water and third component was sodium hydroxide 10M as
solvent[5], this preparation is in review[6], other preparation of TiNT is in publication[7]. Ternary systems were
12. - 14. 10. 2010, Olomouc, Czech Republic, EU
2
homogenized using sonification by ultrasound and heated in teflon autoclaves (100ml volume) at
temperature 130°C with 24 hours delay.
Compound of titanate nanotubes with functional monomer (TiNT with phthalic acid, rezorcinol, carbamide,
guadinine, ethylenediamine, diethylenetriamine) was prepared by complete ion exchange of sodium after
protons realized 24 leaching at 0.1 M HCl. Product was centrifuged and dryed at room temperature.
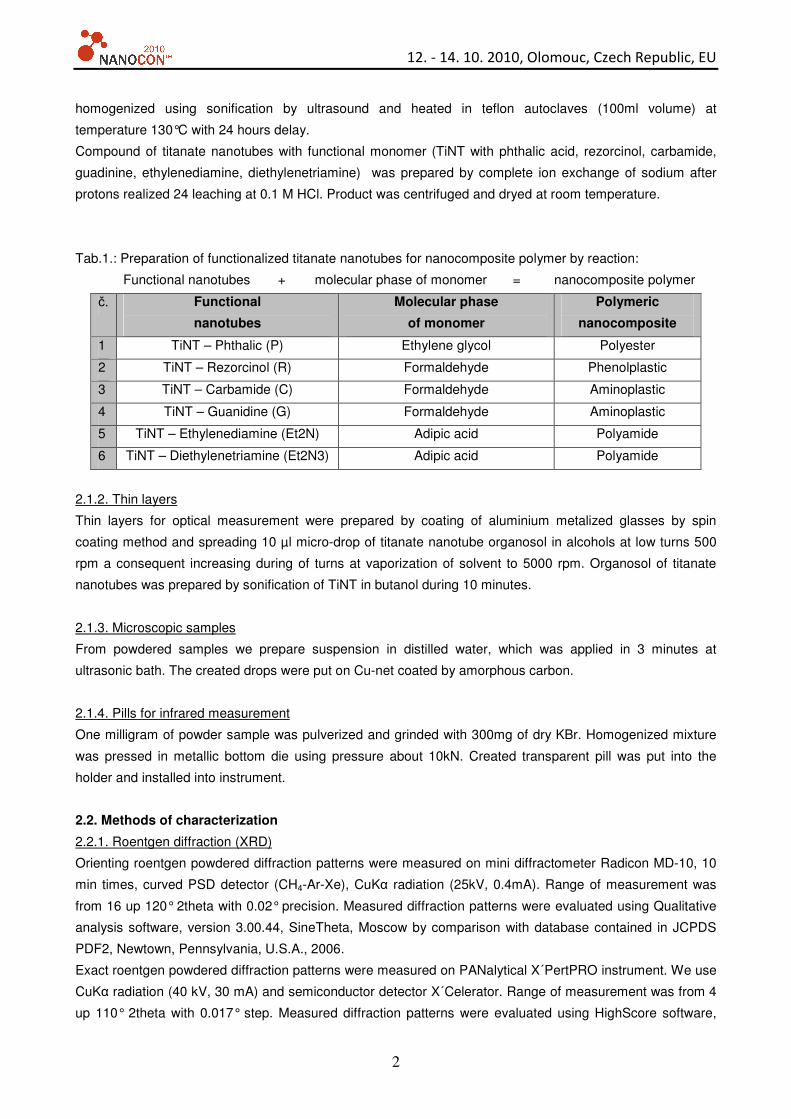
Tab.1.: Preparation of functionalized titanate nanotubes for nanocomposite polymer by reaction:
Functional nanotubes + molecular phase of monomer = nanocomposite polymer
č. Functional
nanotubes
Molecular phase
of monomer
Polymeric
nanocomposite
1 TiNT – Phthalic (P) Ethylene glycol Polyester
2 TiNT – Rezorcinol (R) Formaldehyde Phenolplastic
3 TiNT – Carbamide (C) Formaldehyde Aminoplastic
4 TiNT – Guanidine (G) Formaldehyde Aminoplastic
5 TiNT – Ethylenediamine (Et2N) Adipic acid Polyamide
6 TiNT – Diethylenetriamine (Et2N3) Adipic acid Polyamide
2.1.2. Thin layers
Thin layers for optical measurement were prepared by coating of aluminium metalized glasses by spin
coating method and spreading 10 µl micro-drop of titanate nanotube organosol in alcohols at low turns 500
rpm a consequent increasing during of turns at vaporization of solvent to 5000 rpm. Organosol of titanate
nanotubes was prepared by sonification of TiNT in butanol during 10 minutes.
2.1.3. Microscopic samples
From powdered samples we prepare suspension in distilled water, which was applied in 3 minutes at
ultrasonic bath. The created drops were put on Cu-net coated by amorphous carbon.
2.1.4. Pills for infrared measurement
One milligram of powder sample was pulverized and grinded with 300mg of dry KBr. Homogenized mixture
was pressed in metallic bottom die using pressure about 10kN. Created transparent pill was put into the
holder and installed into instrument.
2.2. Methods of characterization
2.2.1. Roentgen diffraction (XRD)
Orienting roentgen powdered diffraction patterns were measured on mini diffractometer Radicon MD-10, 10
min times, curved PSD detector (CH4-Ar-Xe), CuKα radiation (25kV, 0.4mA). Range of measurement was
from 16 up 120° 2theta with 0.02° precision. Measured diffraction patterns were evaluated using Qualitative
analysis software, version 3.00.44, SineTheta, Moscow by comparison with database contained in JCPDS
PDF2, Newtown, Pennsylvania, U.S.A., 2006.
Exact roentgen powdered diffraction patterns were measured on PANalytical X´PertPRO instrument. We use
CuKα radiation (40 kV, 30 mA) and semiconductor detector X´Celerator. Range of measurement was from 4
up 110° 2theta with 0.017° step. Measured diffraction patterns were evaluated using HighScore software,
12. - 14. 10. 2010, Olomouc, Czech Republic, EU
3
version 1.0d, PANalytical b.v., Almelo, NL by comparison with databases in JCPDS PDF2, Sets 1-54, ICDD,
Newtown, Pennsylvania, U.S.A., 2004.
2.2.2. Thermal analysis (DSC/DTA)
Differential scanning calorimetry Netzsch STA 409 PC/4/H Luxx supported by electrochemical gas sensors.
Measured curves were evaluated using Proteus Analysis software, version 5.1., Netzsch, 2010.
Differential thermal analysis Netzsch STA 409 supported by quadruple spectrometer QMS 403/4 (Balzers)
for product analysis released during the heating of sample in dynamical atmosphere.
2.2.3. Transmission electron microscopy (TEM)
Transmitted microscopy were used on transmission electron microscope JEOL JEM-3010 during 300kV
voltage with resolution 1,7Å, which has EDX detector Oxford Instruments INCA X-sight and CCD camera
with resolution 1024×1024 pixels.
2.2.4. Scanning electron microscopy (SEM)
Scanning microscopy was applied on scanning electron microscope JEOL JSM-7001F during 15kV with
resolution 3.0 nm and SEI detector.
2.2.5. Atomic force microscopy (AFM)
Atomic microscopy was applied on atimic microscope Agilent 5100 with 90 and 9 µm scanners with atomic
resolution 0.2 Å.
2.2.6. Infrared spectroscopy (IR)
Infrared spectrums were measured on infrared spectrometer Nicolet Nexus 670 FT-IR from Thermo Electron
Corporation company. Samples were measured in pills form by tunnel – transmission method. All spectrums
were measured in infrared area in 4000-400 cm-1 range with 4 cm-1 resolution, 64 numbers of scanners,
spectrometer detector DTGS KBr and beamsplitter KBr.
2.2.7. Raman spectroscopy (RS)
Microraman scatter with HeNe excitation by laser with wavelenght 633 nm, with lens 50x measured by
Renishaw inVia Raman spectroscope.
2.2.8. Optical spectroscopy (NIR/VIS/UV)
Reflected optical spectrums were measured using fibre spectroscopy Ocean Optics S2000, 250 - 850nm.
3. EXPERIMENTAL RESULTS
3.1. XRD
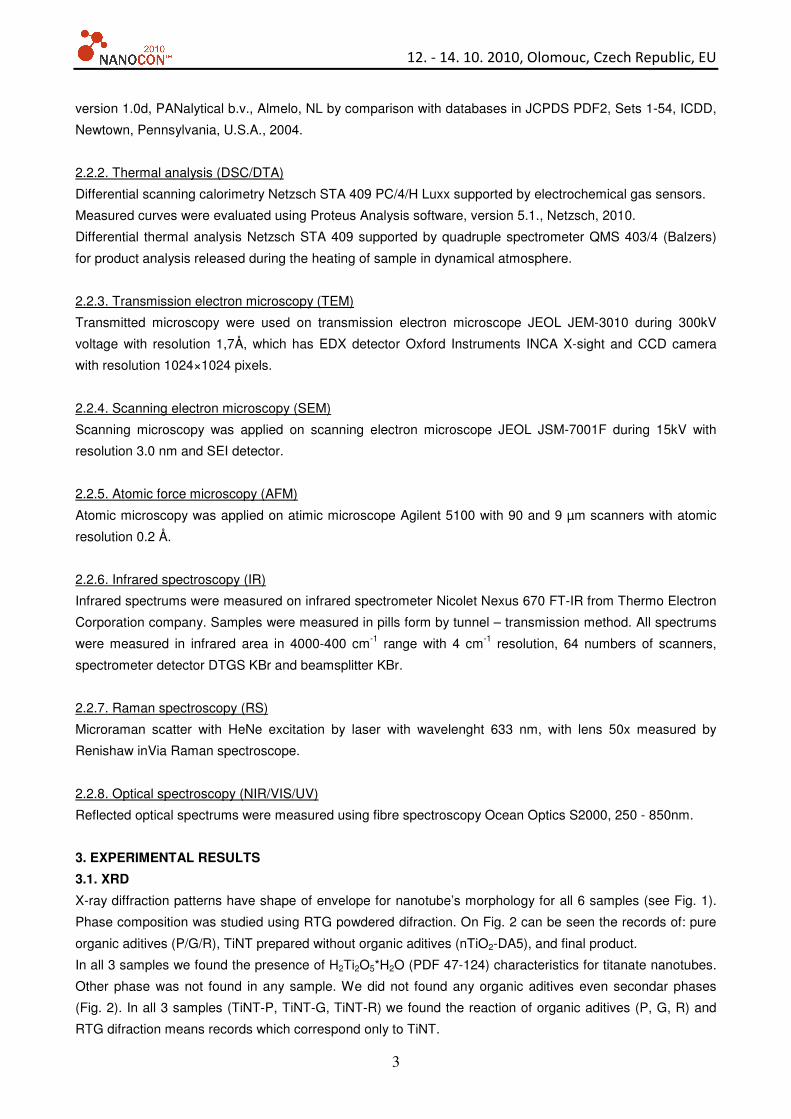
X-ray diffraction patterns have shape of envelope for nanotube’s morphology for all 6 samples (see Fig. 1).
Phase composition was studied using RTG powdered difraction. On Fig. 2 can be seen the records of: pure
organic aditives (P/G/R), TiNT prepared without organic aditives (nTiO2-DA5), and final product.
In all 3 samples we found the presence of H2Ti2O5*H2O (PDF 47-124) characteristics for titanate nanotubes.
Other phase was not found in any sample. We did not found any organic aditives even secondar phases
(Fig. 2). In all 3 samples (TiNT-P, TiNT-G, TiNT-R) we found the reaction of organic aditives (P, G, R) and
RTG difraction means records which correspond only to TiNT.
12. - 14. 10. 2010, Olomouc, Czech Republic, EU
4
0 10 20 30 40 50 60 70
inte
nzit
a
difrakční úhel [2theta/° CuKa]
nTiO2-FT
nTiO2-R
nTiO2-G
nTiO2-DA5
R
G
FT
nTiO2-FT
nTiO2-R
nTiO2-G
nTiO2-DA5
R
G
FT
Fig.1. X-ray diffraction patterns of 6 samples Fig. 2. X-ray diffraction patterns of 3 selected
samples, pure monomers and TiNT standard.
3.2. DSC/DTA
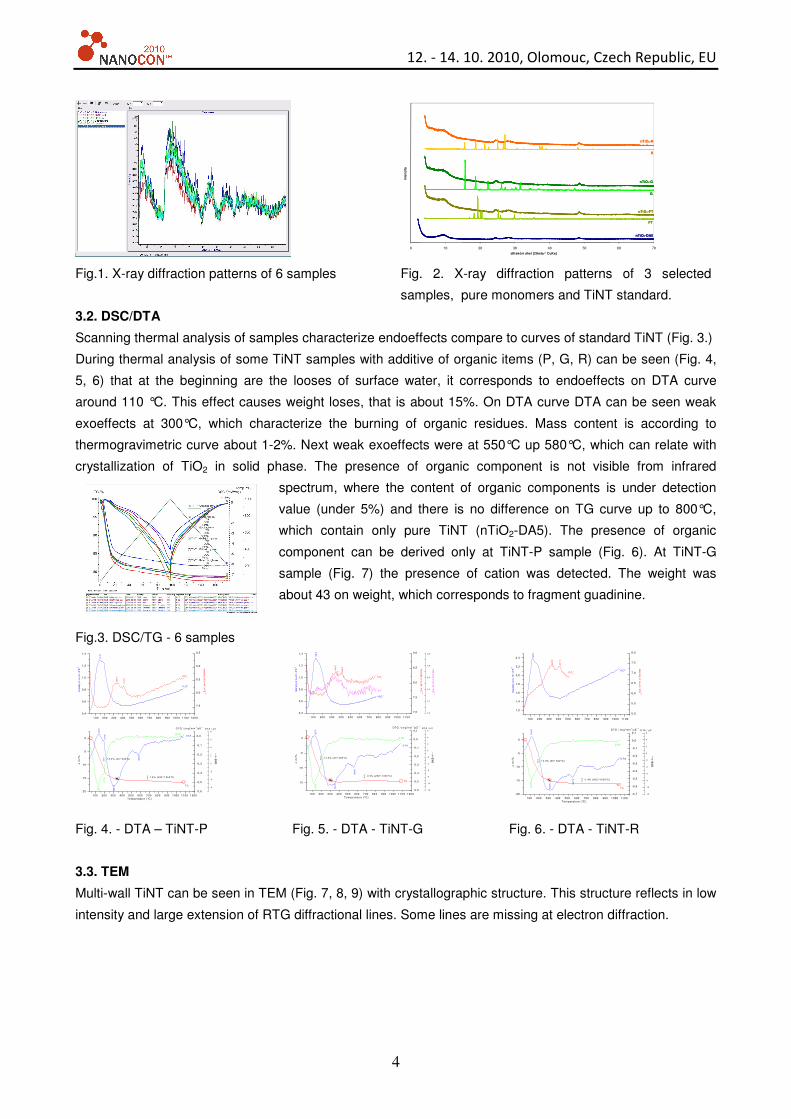
Scanning thermal analysis of samples characterize endoeffects compare to curves of standard TiNT (Fig. 3.)
During thermal analysis of some TiNT samples with additive of organic items (P, G, R) can be seen (Fig. 4,
5, 6) that at the beginning are the looses of surface water, it corresponds to endoeffects on DTA curve
around 110 °C. This effect causes weight loses, that is about 15%. On DTA curve DTA can be seen weak
exoeffects at 300°C, which characterize the burning of organic residues. Mass content is according to
thermogravimetric curve about 1-2%. Next weak exoeffects were at 550°C up 580°C, which can relate with
crystallization of TiO2 in solid phase. The presence of organic component is not visible from infrared
spectrum, where the content of organic components is under detection
value (under 5%) and there is no difference on TG curve up to 800°C,
which contain only pure TiNT (nTiO2-DA5). The presence of organic
component can be derived only at TiNT-P sample (Fig. 6). At TiNT-G
sample (Fig. 7) the presence of cation was detected. The weight was
about 43 on weight, which corresponds to fragment guadinine.
Fig.3. DSC/TG - 6 samples
100 200 30 0 400 50 0 600 7 00 80 0 900 1000 110 0 1200
-20
-15
-10
-5
0
--> exo
289°
C
177
°C17
9°C
130°
C
-1.4% (336°-1050°C )
<+>
580°
C
127
°C
-15.2% (30°-336°C )
<+>
DTADT G
T G
∆ m
/%
Tem perature (°C)
-0,6
-0,5
-0,4
-0,3
-0,2
-0,1
0,0
DT G / (m g*m in -1)xE -1
-6
-4
-2
0
2
4
6
8DT A / µV
1 00 200 300 400 500 600 700 800 900 100 0 1 100 12 00
0,4
0,6
0,8
1,0
1,2
1,4
414°
C
330°
C CO 2
+
141°
C
Intensity of m=44 / A
*E-10
H2O +
Inte
nsity
of
m=1
8 /
A*E
-8
7,5
8,0
8,5
9,0
9,5
100 200 30 0 400 50 0 600 7 00 80 0 900 1000 110 0 1200
-15
-10
-5
0
--> exo
310°
C
125°
C
-0 .5% (2 98 °-10 50 °C)
<+>
558°
C
111
°C
-1 4.2 % (3 0°-29 8°C )
<+>
DT A
D TG
TG
∆ m
/%
Tem perature (°C)
-0,6
-0,5
-0,4
-0,3
-0,2
-0,1
0,0
0,1
DT G / (m g*m in -1)xE -1
-12
-10
-8
-6
-4
-2
0
2
4
6DT A / µ V
10 0 200 3 00 400 5 00 600 700 800 900 1000 110 0
0,4
0,6
0,8
1,0
1,2
1,4
4 3+
336°
C
C O 2
+
406°
C
128°
C
Intensity of m=
44 / A*E
-10
H 2O+
Inte
nsity
of m
=18
/ A
*E-8
Intensity of m=43 / A
*E-11
7,0
7,5
8,0
8,5
9,0
345°
C
2,0
2 ,1
2 ,2
2 ,3
2 ,4
2 ,5
100 200 300 400 500 600 700 800 900 1000 1100
-20
-15
-10
-5
0
305°
C
118°
C
-1.4% (302°-1050°C )
<+>
551°
C
118°
C
-14 .9% (30°-302°C)
<+>
D TA
DTG
TG
∆ m
/%
Tem pera ture (°C )
-0,7
-0,6
-0,5
-0,4
-0,3
-0,2
-0,1
0 ,0
0 ,1
DTG / (m g*min-1)xE -1
-1 2
-1 0
-8
-6
-4
-2
0
2
4
6D TA / µV
100 200 300 400 500 600 700 800 900 1000 1100
1,2
1,4
1,6
1,8
2,0
2,2
2,4
--> exo
329°
C
CO2
+
411°
C
132°
C
Intensity of m
=44 / A
*E-10
H2O+
Inte
nsity
of
m=
18 /
A*E
-8
5 ,0
5 ,5
6 ,0
6 ,5
7 ,0
7 ,5
8 ,0
Fig. 4. - DTA – TiNT-P Fig. 5. - DTA - TiNT-G Fig. 6. - DTA - TiNT-R
3.3. TEM
Multi-wall TiNT can be seen in TEM (Fig. 7, 8, 9) with crystallographic structure. This structure reflects in low
intensity and large extension of RTG diffractional lines. Some lines are missing at electron diffraction.

12. - 14. 10. 2010, Olomouc, Czech Republic, EU
5
Fig. 4. - TEM - TiNT-P Fig. 5. - TEM - TiNT-G Fig. 6. - TEM - TiNT-R
3.4. SEM
Based on monomer the morphology of nanotubes is changed. Phthalic acid (Fig. 7.) catalyze formation of
long nanotubes, resorcinol (Fig. 8.) makes inexpressive growth of nanotubes. The carbamide (Fig. 9.) makes
long nanotubes in contrast to guanidin (Fig. 10.), where can be seen only short nanotubes. The long
filamentous nanotubes can be seen at polyamides – ethylendiamin (Fig. 11.) and diethylentriamin (Fig. 12.).
Fig. 7. - SEM - TiNT-P Fig. 8. - SEM - TiNT-R Fig. 9. - SEM - TiNT-U
Fig. 10. - SEM - TiNT-G Fig. 11. - SEM - TiNT-EtN2 Fig. 12. - SEM – TiNT-Et2N3
3.5. AFM
Atomic microscope has been used to visualization of surface nanocylinder structure of TiNT (Fig. 13, 14) of
titanate nanotubes on HOPG. Nanotubes were adhesed only on graphite and after the sonolysis of
nanotubes in water. The nanotubes become swabbed by AFM tip on micaceous basis.
Fig. 13. - AFM - TiNT Fig. 14. - AFM - TiNT

12. - 14. 10. 2010, Olomouc, Czech Republic, EU
6
4000 3500 3000 2500 2000 1500 1000 5000
10
20
30
40
50
60
70
80
3412
1073
1679
1629
1402
kys.ftalová TiNT+kys.ftalová
Wavenumbers (cm-1)
% T
rans
mita
nce 12
82
0
10
20
30
40
50
60
70
80
4000 3500 3000 2500 2000 1500 1000 50010
20
30
40
50
60
70
80
90
3418
TiNT+quanidin uhličitan quanidylu
Wavenumbers (cm-1)
% T
rans
mita
nce
1633
10
20
30
40
50
60
70
80
90
4000 3500 3000 2500 2000 1500 1000 5000
10
20
30
40
50
60
70
80
90
TiNT+resorcin resorcin
Wavenumbers (cm-1)
% T
rans
mita
nce
0
10
20
30
40
50
60
70
80
90
3407
1622
0 1000 2000 3000 4000 5000
0
200000
400000
6
5
4
3
2
TiNT / Al
Ram_TiNT-aug2010_RamTOT
Ram
an s
igna
l (ar
b.u.
)
WAVENUMBER (cm-1)
1
0 200 400 600 800 1000
0
200000
400000
600000
703
277
383
6
5
4
3
2
TiNT / Al
Ram_TiNT-aug2010_RamLF
Ram
an s
igna
l (ar
b.u.
)
WAVENUMBER (cm-1)
1
447
1000 1200 1400 160060000
80000
100000
120000
6
5
2
TiNT / Al
Ram_TiNT-aug2010_RamMF
Ram
an s
igna
l (ar
b.u.
)
WAVENUMBER (cm-1)
1
2700 2800 2900 30000
50000
100000
150000
200000
250000
6
5
4
3
2
TiNT / Al
Ram_TiNT-aug2010_RamHF
Ra
man
sig
nal (
arb.
u.)
WAVENUMBER (cm-1)
1
3.6. IR
Infrared spectroscopy was used to find the deformations of structures. These deformations demonstrate the
direct connections of organic additives to TiNT. On Fig. 15, 16 and 17 can be seen the comparisons of two
spectrums: pure organic additive (P, G, R) and final product.
The sample TiNT-P, TiNT with 1,2-dicarboxylic acid content, whose spectrum can be seen on Fig.15 is
different than others. The presence of phthalic acid in TiO2 can be demonstrated based on vibrations in ν(C-
O) at 1679 cm-1. In case of associated form of phthalic acid the value of this group of vibrations is
decreasing. Two strong belts 1402 and 1282 cm-1 born from C-O-H in plain and vibrations in ν(C-O), which
interacts together. Under 1200 cm-1 can be seen circled deformations and deformations in plain at C-H.
On Fig.16 is the spectrum of carbonate guanidine and TiNT-G. The characteristic deformation and stretching
vibrations of O-H group can be seen as well. Under 500 cm-1 the vibration of bond Ti-O is also visible. There
are no characteristic vibrations of guanidin or guanidine group C(NH2)3+ as it is at basic material (1662 cm-1 -
C-N and ν(O-H), 1575 cm-1 - δ( N-H) stretching vibration in NH2, 1392 cm-1 - δ( N-H) stretching vibration in
NH3, 1179 cm-1 - rocking ρ vibration NH2 + ν(C-N) stretching vibration.
The sample TiNT-R, TiNT with resorcinol content (benzen-1,3-diol), whose spectrums can be seen on Fig.
17, has the same vibrations of O-H groups as it is in previous sample. Other vibrations can be seen under
500 cm-1 of Ti-O. There are no other characteristic vibrations which mean the presence of resorcinol in TiNT.
The spectrum of resorcinol (2640 cm-1 and 2540 cm-1 overton in (C-O) and δ( O-H), 1932 cm-1 overton
benzene circle, 1489 cm-1 vibrations in benzene halfcircle, 1382 cm-1 vibration δ(C-O-H), 1295 cm-1 in (C-O).
Fig. 15. - IR - TiNT-P Fig. 16. - IR - TiNT-G Fig. 17. - IR - TiNT-R
3.7. RS
The overview of all spectrums for all samples can be seen on Fig. 18. The signal in Stokes branch was really
strong, with characteristic vibration bands on plain background. On Fig. 19, 20, 21 can be seen the
spectrums in lower, middle and higher frequencies. At low frequencies, the vibration structure of all samples
is similar; the differences are in relative weight of plain background. The location of band around 447 cm-1 is
the same as bulk vibration of crystallographic structure of TiO2. The second major band of rutile from Fig. 7 is
not present in measured spectrums. There are no vibrations of TiO bonds in measured spectrums
corresponding to anatase crystal structure of titanium dioxide. High-frequency part of spectrums (Fig. 21) is
different in terms of size of structure; these bands are missing in samples 1,2 and 4 (with high probability it is
a vibration of hydrogen ions). In frequency range 1000-1600 cm-1 (Fig. 20) the sample of 5 strong and sharp
bands is the best. This is the same for samples 1, 2 and 6.

12. - 14. 10. 2010, Olomouc, Czech Republic, EU
7
1 2 3 4 50.0
0.5
1.0
1.5
2.0
65
4
3
2
1
TiNT10a_ReflVsSi1
R /
R(S
i)
PHOTON ENERGY (eV)1 2 3 4 5
0
1
2
36d
6c6b
6a
TiNT10a_ReflVsSi2
R /
R(S
i)
PHOTON ENERGY (eV)
1.8 2.0 2.2 2.41.35
1.40
1.45
1.50
1.55
6
5
TiNT10a_ReflVsSi3
R /
R(S
i)
PHOTON ENERGY (eV)
Fig. 18-21. Raman spectrum of all TiNT samples in all measured region of Stokes shift
3.8. NIR/VIS/UV
The spectrum of reflected/scattered light discovered by fibre spectrometer can be seen on Fig. 22. There are
the signals acquired on special sample and reference plate of monocrystalline Si. Based on scattering of Si,
the NIR-VIS is flat and spectrums can have sharped structures in response of powdered materials. In UV
area can be seen the scattering of Si two strong bands around photon energy 3.4 and 4.4 eV, that can be
seen in spectrums displayed in Fig. 22. Main differences in size of signals between all samples are caused
by coverage of light part, which supports into registered signal. The dependence on sample position
compare to reflexive probe was really strong and from spectrum positions there is no possibility to say strong
conclusions. This is documented by Fig. 23 for sample number. 6. Based on all measurements, the basic
statements arise: the doublet structure is present (detail in Fig. 24).
Fig. 22. Relative size of signal Fig. 23. Relative size of signal Fig. 24. Relative size of signal
reflected/scattered light (n.all) reflected/scattered light (n.6) reflected/scattered light (n.5,6)
4. CONCLUSION
In this paper, the description of preparation of functionalized titanate nanotubes by multifunctional monomers
was presented. During our research we passed all necessary measurements for characterization this
component of nanocomposites. For other preparations of nanocomposites, the concentration of
multifunctional monomers will be increased and will be reactived with molecular phase of second monomers.
ACKNOWLEDGEMENT
This paper and work was financial supported by Ministry of industry and business in FT-TA4/126
project.
REFERENCES
[1] Xiang B., et al. Field-emission properties of TiO2 nanowire arrays. Journal of Physics D-Applied Physics, 2005,
38 (8), 1152-1155
[2] Wang W., et al. Investigation of monolayer dispersion of benzoic acid supported on the surface of H-titanate
nanotubes. Applied Surface Science, 2007, 253, 5393–5399
[3] Wang W., et al. Surface-modification and characterization of H-titanate nanotube. Colloids and Surfaces A.
Physicochem. Eng. Aspects, 2008, 317, 270–276
[4] Kváča Z., et al. Preparation of functionalized titanate nanotubes. Sborník z konference Nanocon 2009. 68,
Ostrava, Tanger, 2009
[5] Li J.R., Tang Z.L., Zhang Z.T. Preparation and characterization of titanium oxide nanotubes.
Rare Metal Materials and Engineering, 2003, 32, 684-687
[6] Ou H.H., Lo S.L. Review of titania nanotubes synthesized via the hydrothermal treatment. Fabrication,
modification, and application. Separation and Purification Technology 2007, 58,179–191
[7] Godbole V.P., et al. Synthesis of titanate nanotubes and its processing by different methods. Electrochimica Acta,
2006, 52, 1781–1787