presentación institucional - santander.com on innovation to increase customer loyalty and ......
TRANSCRIPT

Santander Institutional Presentation
2017
2
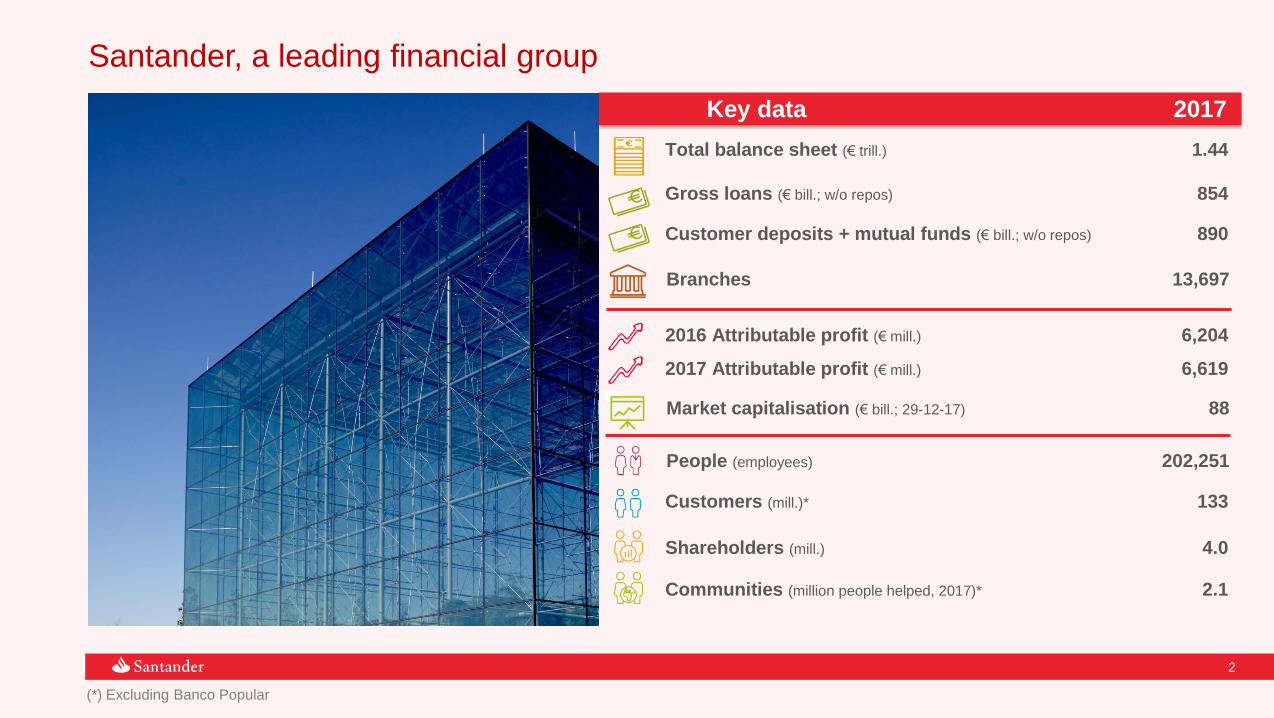
Santander, a leading financial group
(*) Excluding Banco Popular
People (employees) 202,251
Branches 13,697
Market capitalisation (€ bill.; 29-12-17) 88
Shareholders (mill.) 4.0
Customers (mill.)* 133
Total balance sheet (€ trill.) 1.44
2016 Attributable profit (€ mill.) 6,204
Gross loans (€ bill.; w/o repos) 854
Customer deposits + mutual funds (€ bill.; w/o repos) 890
Communities (million people helped, 2017)* 2.1
2017 Attributable profit (€ mill.) 6,619
Key data 2017

3
Our purpose and business model
Aim and value creation
Corporate governance and Internal control
Group structure and business units
2017 Highlights – Results and Activity
Agenda

4
A model of sustainable, predictable growth
to help people and businesses prosper
to be the best retail and commercial bank, earning the lasting
loyalty of our people, customers, shareholders and communities
Our
purpose
Our aim
A bank
that is
Our model and the results it generates show that Santander is on the right track

5
Our strengths to continue to grow and to be successful in the long term
We have SCALE and the potential to grow organically
PREDICTABLE GROWTH: diversification by country and business,
which contributes higher profits in a more stable manner
Focus on INNOVATION to increase customer loyalty and
operational excellence

6
Spain 9%
SCF 15%
Poland 3%
Portugal 3%
UK 19%
Brazil 29%
Mexico 11%
Chile 3%
Argentina 3%
USA 4%Others 1%
02
Customers by country, Dec’17
133million customers
133 million customers in markets with a total population of more than one billion
15.217.3
Dec'16 Dec'17
Loyal customers (millions) Digital customers (millions)
20.925.4
Dec'16 Dec'17
Huge potential for organic growth throughincreased loyalty and digitalisation
Note: All figures excluding Banco Popular
+13%+21%
Our scale gives us efficiency, sources of growth and new business opportunities
SCALE

7
We are leaders in market share in five of our core markets
(1)Lending (2) UK mortgages (excluding Social Housing), Consumer credit and commercial lending (excluding Financial Institutions) (3) Including Santander Consumer Finance business (SCF) (4) In the states where the Group operates. (5) Including SCF UK (6) Including Banco Popular. Excluding it: 13% (7) Argentina and Portugal only include private sector banks.Data: Dec’17 or latest available. Branches do not include Santander Consumer Finance business
USA
Mkt. share1,4: 3%
Branches: 683
Argentina
Mkt. share1: 10%
Branches: 482
Mkt. share1: 16%
Branches: 563
PortugalBrazil
Mkt. share1: 9%
Branches: 3,465
UK
Mkt. share2: 10%
Branches: 808
Mkt. share1,6: 18%
Branches: 2,843
Spain
Mkt. share1: 19%
Branches: 439
Chile
Mkt. share1,3: 10%
Branches: 576
Poland
Mkt. share1: 13%
Branches: 1,401
Mexico
Nº countries5: 15
Branches: 546
SCF
7
SCALE

8
Our model is based on a balanced geographic diversification…
(*) Excluding Corporate Centre and Real Estate Activity Spain(1) Popular included (3%)
Underlying attributable profit 2017*
EuropeAmericas
48% 52%UK, 16%
Spain1; 15%
SCF, 13%
Portugal, 5%
Poland, 3%
USA, 4%
Mexico, 7%
Brazil, 26%
Chile, 6%
Argentina, 4%Other Latam, 1%
Balanced distribution between mature markets, which provide stability, and developing markets, which fuel growth in revenue
GROWTH

9
…with good business mix between products and segments…
Individuals demand deposits, 38%
Individuals time deposits, 13%
Individuals mutual funds, 14%Consumer, 4%
SMEs, 9%
Corporates, 13%
GCB, 9%
Other individuals, 11%
Home mortgages, 36%
Consumer, 18%
SMEs, 9%
Corporates, 15%
GCB, 11%
Note: Excluding Popular. Loans excluding repos. Customer funds: deposits excluding repos + marketed mutual funds
Loan portfolio by business Customer funds by business
Good mix between products for individuals, consumer finance, SMEs, companies and other products
€774bn €816bn
GROWTH

10
…is key to our stable and predictable growth
Profitability drivers
Pre-provision profit / loans
1.02% 1.36% 1.40% 1.65%
2.44%
1.69% 1.43% 1.25% 1.18% 1.07%
2008 2009 2010 2011 2012 2013 2014 2015 2016 2017
3.03% 3.28% 3.26% 3.25% 3.06% 2.94% 3.04% 2.90% 2.83% 2.97%
Note: 2017 figures include Popular.
Source: Bloomberg; Note: GAAP criteria Note: Standard deviation of the quarterly EPS starting from the first available data since Jan’99
Quarterly reported EPS volatility (Jan’99-9M´17)
4x6x1x2x3x2x5x1x-1x-9x1x
711% 358%
128% 113%92%
78%52% 46%
9%
44% 32%
Our unique business model allows us to deliver better results with less volatility and higher growth
Net income increase 1999-2016
EPS volatility calculated using quarterly date from Jan’99-Sep’17
GROWTH
Cost of credit

11
Our profitability allows us to grow, to accumulate capital and to pay dividends
+11% customer
revenues(2017 vs. 2016)
+29 bps10.84% FL CET1
(2017 vs. 2016)
Finance business growth Accumulate capital
GROWTH
+11% Cash dividend
per share (2017 vs. 2016)
Pay dividends

12
Focus on innovation to efficiently improve customer experience
• Santander ONE
• Consignado, 100% digital
• WebCasas
• New digital account opening process
• Investment Hub
• New app
• Digilosofía
• We are market leaders in mobile payments
• Súper Wallet
• Select Me
• Automatic service by bots
• Full digital On Boarding process
• WorkCafé
• Biometric voice solution aimed at large companies
• Electronic guarantees
INNOVATION
Blockchain
Payments
Data & A.I.
Platform &
Services
Focus on digital innovation
We have launched a wide array of initiatives at the bank

13
New digital solutions: agile global platforms
Superdigital
A digital mobile-first payment solution
Openbank
The fully digital bank
Santander Cash Nexus
An agile cash management platform
Machine learning
Global platform to know our customers better
• >1Mn customers
• +2.4x Revenues (2016-17)
• +26% Loyal customers
• +20% Deposit growth
• Single entry point
• Up to 75% workload reduction
• Open source platform and a team of
>100 data scientists
• Learning from >5Bn transactions
• Results obtained on >10Mn customers
INNOVATION

14
Digital transformation: simpler and more personalised and modern products & services…
Smart watch Pay
First bank to offer
smart watch payments
Santander App
Speak directly or set up a meeting
with your banker from your App
Facebook ChatBot
Real time assistant through
Facebook Messenger
INNOVATION

15
…increase digital sales, customer satisfaction and loyalty
Our digital transformation is paying off: as well as more digital
customers, we have more digital transactions and sales
Percentage of transactions and sales in digital channels Top 3 in customer satisfaction
39%of transactionsare digital
31%oftotal salesare digital
INNOVATION

16
Agenda
Our purpose and business model
Aim and value creation
Corporate governance and Internal control
Group structure and business units
2017 Highlights – Results and Activity

17
Aim and value creation
202,251employees
People
133million
Customers
4.0million
Shareholders
2.1million people helped in 2017
Communities
Note: Figures excluding Banco Popular, except number of employees and data on shareholders
Santander is a strong brand
Global Bank of the Year award(The Banker magazine)
6th best global Retail Banking brand (BrandZ ranking)
2nd most valuable bank brand in Europe(Brand Finance Banking 500 ranking)
Risk culture: risk pro
Risk pro defines the way in which we
understand and manage risks in our
day-to-day activities
>94%of employees recognise
and are responsible for the
risks in their daily work

18
Our people management strategy focuses on six key areas
I show
respectI truly listen
I talk
straight
I keep
promises
I actively
encourage
cooperation
I bring
passion
I support
people
I embrace
change
The SPF culture is based on our corporate behaviours
81%employees believe that their
colleagues behave in ways thatare more simple, personal and fair
77%employee
engagement rate in 2017People
Talent management
Knowledge and
development
Remuneration
and benefits
SystemsEmployee
experience
Culture
202,251employees
Dec'17
Our aim is to be
the best bank
to work for
Top 3 leading banks to work for in 5 countries
A new corporate management evaluation model
Global
engagement
survey
45%with university
degrees
55%women
60%what we do
40%how we do it

19
New digital solutions
Our value proposal aims to meet the needs of our different customer profiles
Operational excellence to maximise the bank’s efficiency and customer service quality
17.3 (+13%)million loyalcustomers
25.4 (+21%)million digitalcustomers
(1) Corporate benchmark of customer satisfaction
Innovative, simple, personalised solutions
Customers
Our value proposition for individual customers:
• A new global division: Santander Wealth Management
• A global solution making us partners in SMEs’ growth:
Note: All figures excluding Banco Popular
133millionDec’17
Openbank Santander
Cash NexusSuperdigital Machine
Learning
1|2|3 World Santander Plus As I Want it Account
Santander SMEs
New and redesigned branches
WorkCafé
Smart Red
Digital branch20% more productive
96% customer satisfaction
Increase brand visibility
Top 3 bank in seven countries in customer satisfaction1

20
+11%Cash dividend per
share growth in 20171
Among the best banks
in Europe by profitability
Share capital distribution
(By investor, 31-December-17)
Largest bank in the Eurozone
by stock market valueWe strengthened our capital
Group Strategy Update: sharing the bank's strategy
and outlook with analysts and investors
Chairman, CEO, CFO, UK, Brazil, Spain, USA,
Mexico and Country Heads of the rest of units
Increased shareholder remuneration, maintaining the payment of the four dividends
We offer our shareholders an attractive sustainable returnto maintain their lasting confidence
Shareholders
Note: All figures including Banco Popular. (1) Total dividends charged to 2017's earnings are subject to the Board and AGM approval.
New York, October 2017
4.0millionDec’17
+16.6%Total shareholder
return in 20171
Underlying RoTE
2017
11.8%
Market capitalisation
2017 year end
€88,410Mn
Fully loaded CET1
Dec’17
10.84%
Meeting ourcommitments
61%
1%
38%
Institutional investors
Board
Retail shareholders

21
Contributing to the economic and social progress of
people and businesses in a responsible and sustainable way
44,862scholarships
granted in 2017
1,295agreements with universities
and academic institutionsin 21 countries
Additional information in the 2017 sustainability report (click link )
Communities
In the DJSI socially responsible investment index
(since 2000) and in the FTSE4Good (since 2002)
Note: All figures refer to 2017 and exclude Banco Popular
2.1million people helped in 2017
Firm support of higher education
Community investment: we invest more in supporting
education than any other private company in the world
We support and promote financial inclusion
Firm commitment to the environment
Project finance
to support
renewable energies
€150 millionin microfinance loans
micro-entrepreneurs
supported
>250,000
3,390 MWTotal installed capacity of solar and wind generation supported by the Bank in 2017

22
Employees
Top 3 bank to work for
in the majority of our
geographies
Our 2017 performance makes us highly confident to meet our 2018 targets
(*) Except the US – approaching peers
People Customers1 Shareholders Communities
17 million loyal retail customers
1.6 million loyal SMEs and corporates
Customer loans growth above peers
All geographies top 3 in customer service*
30 million digital
customers (x2)
C. 10% CAGR of fee income 2015-2018
Cost / Income 45-47%
2015-2018 average cost of
credit: 1.2%
RoTE >11.5%
Increasing EPS, reaching double digit growth by 2018
30%-40% cash dividend pay-out: Yearly DPS increase
FL CET1 > 11%
People supported
in our communities:
5.0 mill. in 2016-18
c. 130k scholarships
in 2016-18

23
Agenda
Our purpose and business model
Aim and value creation
Corporate governance and Internal control
Group structure and business units
2017 Highlights – Results and Activity

24
11%
19%
33%36%
2011 2013 2015 2017
Corporate governance
Balanced Board
composition
Respect for
shareholders’ rights
Maximum transparency
in terms of remuneration
At the forefront of best practices
and long-term vision
Clear and robust governance, with well-defined accountabilities
and prudent management of risks and opportunities
Composition of the Board
Percentage of women on the Board
Non-executive directors(independent)
Executive directors
Non-executive directors(neither proprietary nor independent)
Proprietary non-executive directors(proprietary)
57%
22%
14%
7%
(*) Data as of 31/12/2017

25
Internal control framework
Parent-subsidiary governance model
The Group’s appointment and suitability assessment procedure is a key element of Governance
Presence of Santander Group in the Boards ofDirectors of the Subsidiaries and guidelines for Boarddynamics and effectiveness
Reporting of the CEO/ Country Heads to the GroupCEO and Group Executive Committee
Interaction between Group and Subsidiaries Control,Management and Business Functions
1
2
3

26
Agenda
Our purpose and business model
Aim and value creation
Corporate governance and Internal control
Group structure and business units
2017 Highlights – Results and Activity

27
Based on 9 markets and on the consumer finance business in Europe, supported by the Corporate Centre activities and other functions
Group structure
Units and businesses
USABrazilMexicoChileArgentina
UruguayPeru Colombia
Spain
Portugal
United Kingdom
SCF1
Poland
Asia Pacific
Representative offices
Global Corporate Banking
Group functions and Corporate Centre activities
(1) Santander Consumer Finance (SCF) with presence in Austria, Belgium, Denmark, Finland, France, Germany, Italy, the Netherlands, Norway, Poland, Portugal, Spain, Sweden, Switzerland and the UK
Communications, Corporate Marketing and Research
Technology and Operations
General Secretariatand Human Resources
UniversitiesCompliance & Conduct
Santander Digital
Internal Audit
Chairman’s Office and Strategy
Risk
Financial Accounting and Control
FinancialFin. Planning
& Corporate Development
Costs
Wealth Management

28
Spain – excl. Popular
(*) Million euros (**) Including Popular: 15%
Note: Loans excluding repos. Funds: deposits excluding repos + marketed mutual funds
Santander Spain maintains its loyalty-centred strategy and is makingprogress in its digital transformation
2017 Highlights
Branches 2,843
Employees 22,916
Loyal customers (millions) 1.9
Digital customers (millions) 3.2
Gross loans* 148,585
Customer funds* 251,196
Underlying attributable profit* 1,180
Contribution to Group’s profit** 12%
Bank of choice for SMEs and corporates
Integrate Banco Popular combining the best of both banks
Digital transformation to improve efficiency and the customer experience
Profitable, loyalty-based growth
Strategicpriorities

29
Santander Consumer Finance
(*) Million euros. Note: Loans excluding repos. Funds: deposits excluding repos + marketed mutual funds. Underlying profit does not include -€85Mn related to integration costs.(1) UK data considered in SAN UK; (**) Customers with an active contract
• Germany
• Spain
• Italy
• Portugal
• Poland
• France
• Finland
• Norway
• Sweden
• Denmark
• Netherlands
• Austria
• Belgium
• Switzerland
• UK1
SCF is the consumer finance leader in Europe, present in 15 European countries1
Branches 546
Employees 15,131
Customers** (millions) 19.9
Gross loans* 92,431
Customer funds* 35,398
Underlying attributable profit* 1,254
Contribution to Group’s profit 13%
Digital interaction
Mobile payments
Develop innovative products and digitalise the customer cycle processes
Maintain our leadership position
Implement open e-commerce platforms in the businesses and sign new agreements with distributors
Support the transformationof manufacturers and dealers
E-commerce open platform Awards
Strategicpriorities
2017 Highlights

30
Poland
(*) Million euros
Note: Loans excluding repos. Funds: deposits excluding repos + marketed mutual funds
Third bank in Poland reinforced by theacquisition of the retail and private banking
business of Deutsche Bank Polska
Branches 576
Employees 11,572
Loyal customers (thousands) 1,387
Digital customers (thousands) 2,089
Gross loans* 22,974
Customer funds* 27,803
Underlying attributable profit* 300
Contribution to Group’s profit 3%
Gain market share in volumesTop 3 in quality of service, increasing the number of loyal customers
Remain the leader in profitability
Remain the leader in digital channels in Poland
Strategicpriorities
2017 Highlights

31
Portugal – excl. Popular
(*) Million euros
Note: Loans excluding repos. Funds: deposits excluding repos + marketed mutual funds
Portugal’s most profitablebank with high market share
in loans and deposits
Branches 563
Employees 5,895
Loyal customers (thousands) 686
Digital customers (thousands) 558
Gross loans* 31,296
Customer funds* 32,213
Underlying attributable profit* 440
Contribution to Group’s profit 5%
Keep on gaining profitable market share
Integrate Banco Popular Portugal, improving efficiency
Deepen our digital transformation and streamline processes
Increase loyaltyStrategicpriorities
2017 Highlights

32
United Kingdom
(*) Million euros
Note: Loans excluding repos. Funds: deposits excluding repos + marketed mutual funds
One of the leading banks in thecountry, with an innovative value offering for
retail customers and small businesses
Branches 808
Employees 25,971
Loyal customers (millions) 4.2
Digital customers (millions) 5.0
Gross loans* 235,783
Customer funds* 210,305
Underlying attributable profit* 1,498
Contribution to Group’s profit 16%
Achieve profitability growth and a strong balance sheet
Increased customer loyalty as the key driver of business growth
Leverage our Investment Hub and increase cross-border customer relationship
Provide operational anddigital excellence through expertise and innovation
Strategicpriorities
2017 Highlights

33
Brazil
SantanderWay
(*) Million euros
Note: Loans excluding repos. Funds: deposits excluding repos + marketed mutual funds
Santander Brasil met its profitability target thanks to its customer-centred model and a strategy focused on profitable growth
Branches 3,465
Employees 47,135
Loyal customers (millions) 4.2
Digital customers (millions) 8.6
Gross loans* 74,341
Customer funds* 106,959
Underlying attributable profit* 2,544
Contribution to Group’s profit 26%
SMEs Agribusiness
Payrolls
Santander One
Risk and recovery management
Maintain a sustainable profit and solid organic growth
Continue the digital transformation in terms of innovative products and services
Gain market share in acquiring, consumer credit, SMEs, …
Strategicpriorities
2017 Highlights

34
Mexico
Select Me – Women proposition
(*) Million euros
Note: Loans excluding repos. Funds: deposits excluding repos + marketed mutual funds
The second largest bank in Mexico in terms of mortgages and loans to companies, and
the third largest in credit cards
Operational & IT transformation through digital platforms & investment plan
Branches 1,401
Employees 18,557
Loyal customers (thousands) 1,993
Digital customers (thousands) 1,948
Gross loans* 26,962
Customer funds* 35,548
Underlying attributable profit* 710
Contribution to Group’s profit 7%
Boost payrolls & strengthen Santander Plus offering to drive attraction & loyalty
Improve customerservice in all channels andthroughout the Bank
Consolidate our positioning in SMEs and recover leadership in mortgages
Strategicpriorities
2017 Highlights

35
Chile
(*) Million euros
Note: Loans excluding repos. Funds: deposits excluding repos + marketed mutual funds
Chile’s leading private sector bank in terms of assets and customers
Branches 439
Employees 11,675
Loyal customers (thousands) 622
Digital customers (thousands) 1,012
Gross loans* 38,249
Customer funds* 33,104
Underlying attributable profit* 586
Contribution to Group’s profit 6%
Strengthen business with large and medium sized companies through non-lending services
Consolidate commercial transformation via the new branch network model and digital banking
Boost growth among mass consumer market customers
Continue to improve the quality of customer attention and experience for individuals and SMEs
Strategicpriorities
2017 Highlights

36
Argentina
(*) Million euros. Note: Loans excluding repos. Funds: deposits excluding repos + marketed mutual funds(1) Incorporation of Citibank's retail portfolio into balance sheet on March 31st (P&L from 2Q’17)
The country’s leading private sector bank in terms of business market share following
the integration of Citibank's retail bank
Branches 482
Employees 9,277
Loyal customers (thousands) 1,340
Digital customers (thousands) 1,957
Gross loans* 7,608
Customer funds* 12,855
Underlying attributable profit* 359
Contribution to Group’s profit 4%
Growing loans sustaining profitability
Continue the transformation towards a fully digital bank
Develop business with the Public Sector and grow wealth management businesses
New Citi customers: focus on increasing profitability
Strategicpriorities
2017 Highlights

37
United States – excl. Popular
(*) Million euros (**) Santander Bank Note: Loans excluding repos. Funds: deposits excluding repos + marketed mutual funds. Underlying profit does not include -€76Mn related to hurricane provisions, increased stake in SC USA, tax reform and others
Santander US has built a strongpresence in the Northeast of the US
Branches 683
Employees 17,560
Loyal customers** (thousands) 303
Digital customers** (thousands) 814
Gross loans* 75,389
Customer funds* 59,329
Underlying attributable profit* 408
Contribution to Group’s profit 4%
Improve profitabilityImprove customer experienceand loyalty across segments
Continue to comply with regulatory expectations
Provide auto financing to allcustomer segments
Strategicpriorities
2017 Highlights

38
33%
25%
31%
11%
Global Transaction Banking
Global Debt Financing
Global Markets
Capital & Other
Underlying attributable profit* 1,821
Contribution to Group’s profit 20%
SGCB is the global business division for
corporate and institutional customers that
require a tailored service and
value-added wholesale products
2017 Highlights
Santander Global Corporate Banking (SGCB)
Revenuesbreakdown
(2017)
(*) Million eurosNote: excluding Banco Popular
Evolve towards a low capital consumption business
Capture international business flows between the countries in which the Group is present
Be the best bank for its customers in LATAM and Europe, with solid business units in the USA and Asia
Offer value-added products for specialised customers of the retail and commercialbanking network
Strategicpriorities
39
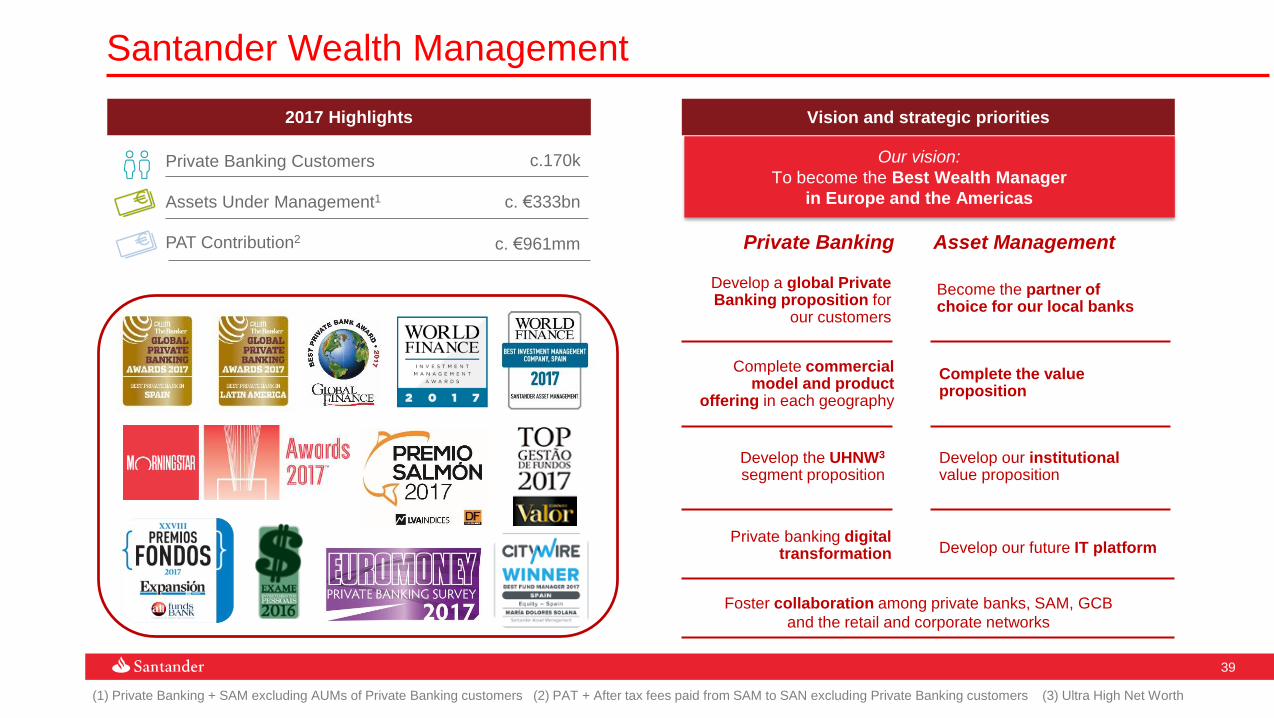
Santander Wealth Management
(1) Private Banking + SAM excluding AUMs of Private Banking customers (2) PAT + After tax fees paid from SAM to SAN excluding Private Banking customers (3) Ultra High Net Worth
Our vision:
To become the Best Wealth Manager
in Europe and the Americas
Develop a global Private Banking proposition for
our customers
Develop the UHNW3
segment proposition
Complete commercial model and product
offering in each geography
Private banking digital transformation
Become the partner of choice for our local banks
Complete the value proposition
Develop our institutionalvalue proposition
Develop our future IT platform
Private Banking Asset Management
Foster collaboration among private banks, SAM, GCB
and the retail and corporate networks
2017 Highlights
Private Banking Customers
Assets Under Management1
PAT Contribution2
c.170k
c. €333bn
c. €961mm
Vision and strategic priorities

40
Banco Popular
Santander acquires Banco Popular, strengthening its leadership
in Spain and Portugal
Strengthening of the franchise • The appointments of new members to the board of
directors and its committees
• A capital increase of Banco Santander of €7,072 million
to support the transaction. The issue was eight times
oversubscribed
• Strong deposit recovery since acquisition
• Disposal of 51% of Banco Popular’s RE business
• Loyalty bonds: €764Mn subscribed, 78% of the total
amount
• Agreement to sell TotalBank: estimated positive impact
in capital (+5 bps)
• Agreement with Labour Unions for the Corporate
Centre integration
Key figures and milestones of this acquisition
Expected return
on investment of
13-14% in year three
Largest bank
in Spain
~19% market share
in business
Portugal’s leading
private bank
~17% market
share in lending
Banco Santander + Banco Popular

41
Agenda
Our purpose and business model
Aim and value creation
Corporate governance and Internal control
Group structure and business units
2017 Highlights – Results and Activity

42
2017 Key achievements
GROWTH PROFITABILITY STRENGTH
+12% (+2% ex-Pop)
Loans1
c.12% (+70 bps)
Underlying RoTE
4.08% (+15 bps)
NPL ratio
+17% (+8% ex-Pop)
Customer funds1
€0.404 (+1%)
EPS
1.07% (-11 bps)
Cost of credit
€45,892Mn (+11%)
Customer revenues
€13,550Mn (+20%)
Underlying PBT
10.84% (+29 bps)
FL CET1
(1) % change in constant euros. Loans excluding repos. Funds: deposits excluding repos + marketed mutual funds

43
Note: Contribution to the SRF (net of tax) recorded in 2Q’16 and 2Q’17. Contribution to the DGF (net of tax) in 4Q’16 and 4Q’17.
Excellent quality and strong top-line growth with performance sustained QoQ
2,582 2,6082,836 2,913
7,6327,969
8,342 8,458
Net interest income 34,296 10 10
Net fees 11,597 14 13
Customer revenues 45,892 11 11
Other income 2,499 -3 -2
Gross income 48,392 10 10
Operating expenses -22,918 9 9
Net operating income 25,473 12 11
Net loan-loss provisions -9,111 -4 -6
Underlying PBT 13,550 20 21
Underlying attrib. profit 7,516 14 14
Net capital gains and provisions -897 115 117
Attributable Profit 6,619 7 7
€Mn Constant
eurosEuros
2017 % vs. 2016
1,6381,523
1,679 1,734 1,790 1,711
2,022 1,993
1,700
1,8541,909
1Q'16 2Q 3Q 4Q 1Q'17 2Q 3Q 4Q
635 535 519 560
1Q'16 2Q 3Q 4Q 1Q'17 2Q 3Q 4Q
NII
Fees
Other
Incl. Pop
Excl. Pop
Quarterly gross income performance excluding Popular (constant €Mn)
Underlying attributable profit (constant €Mn)

44
(€Mn, net of tax)
• Allfunds +297
• Integration processes -385
• Goodwill -603
• Other -206
• Total -897
Net interest income 34,296 10 10
Net fees 11,597 14 13
Customer revenues 45,892 11 11
Other income 2,499 -3 -2
Gross income 48,392 10 10
Operating expenses -22,918 9 9
Net operating income 25,473 12 11
Net loan-loss provisions -9,111 -4 -6
Underlying PBT 13,550 20 21
Underlying attrib. profit 7,516 14 14
Net capital gains and provisions -897 115 117
Attributable Profit 6,619 7 7
€Mn Constant
eurosEuros
2017 % vs. 2016
Results impacted by several one-offs, mainly related to integrations and goodwill

45
RoTE improves +70 bps YoY to c.12%
c.12%
9%
Global
Peers
Europe
8%
Local
peers avg.
12%
Americas
17%17%
(+1pp)
(+2pp)
(YoY)
Local
peers avg.
(YoY)
Source: Company data and Bloomberg. Note: RoTE as of 9M´17 for peers. Global Peers included in the average are Wells Fargo, JP Morgan, Bank of America, UBS, BBVA, ING, BNP Paribas, HSBC,
Unicredit, Lloyds, Citibank, Intesa Sanpaolo, Société Générale, Standard Chartered and Deutsche Bank. Santander vs peers average based on RoTEs in local criteria
Underlying RoTE

46
c.47%
64%
Our cost-to-income improves by 70 bps YoY to c.47%
Global
Peers
Source: Cost to income company data and Bloomberg. Note: Cost-to-income as of 9M´17 for peers. Peers included for average are Wells Fargo, JP Morgan, Bank of America, UBS, BBVA, ING, BNP
Paribas, HSBC, Unicredit, Lloyds, Citibank, Intesa Sanpaolo, Société Générale, Standard Chartered, Deutsche Bank and Barclays
Cost-to-income Top 3 in customer satisfaction

47
2016 2017
1.18
1.07
Loan-loss provisions: lower even though the loan portfolio increased
Better cost of credit at Group level… …and in most geographies

48
3.93 3.74 3.55 3.51 3.38
5.374.24 4.08
D'16 M'17 J'17 S'17 D'17
Including Popular
NPL ratio: The Group's ratio improved YoY for the 4th straight year (ex-Popular)
Group NPL ratio improving YoY… …backed by 8 geographies

49
Progress in reaching our target of fully-loaded CET1 >11% in 2018
10.5510.84
1.14
-1.14
0.53
-0.19 -0.05
Dec’16 Popular acquisition
Corporate transactions
Dec’17Capitalincrease
Organicgeneration
Markets& other
+0.29
Fully-loaded CET1 evolution

50
2017 Targets2017
Loyal customers (Mn) 1717
Digital customers (Mn) 2525
Fee income1 Increase13%
Cost of credit risk Improve1.07%
Cost-to-income Broadly stable47.4%
EPS (€) Increase0.40
DPS (€)2 Increase0.22
FL CET1 +40 bps+53 bps
RoTE3 Increase11.8%
Note: Customer metrics exclude Popular
(1) % change (constant euros) (2) Total dividends charged to 2017 earnings are subject to the Board and AGM approval (3) Underlying
(organic per year)
Delivered all strategic targets ahead of plan

51
Santander financial informationFor more details on the Group & countries, click below
Quarterly Financial Report
Group presentations:
Activity and Results
Units’ presentations
Investor Day 2015 Annual Report 2017 Group Strategy Update 2017
SCF

52
Banco Santander, S.A. ("Santander") cautions that this presentation contains statements that constitute “forward-looking statements” within the meaning of the U.S. Private Securities
Litigation Reform Act of 1995. Forward-looking statements may be identified by words such as “expect”, “project”, “anticipate”, “should”, “intend”, “probability”, “risk”, “VaR”, “RORAC”,
“RoRWA”, “TNAV”, “target”, “goal”, “objective”, “estimate”, “future” and similar expressions. These forward-looking statements are found in various places throughout this presentation
and include, without limitation, statements concerning our future business development and economic performance and our shareholder remuneration policy. While these forward-
looking statements represent our judgment and future expectations concerning the development of our business, a number of risks, uncertainties and other important factors could
cause actual developments and results to differ materially from our expectations. These factors include, but are not limited to: (1) general market, macro-economic, industry,
governmental and regulatory trends; (2) movements in local and international securities markets, currency exchange rates and interest rates; (3) competitive pressures; (4)
technological developments; and (5) changes in the financial position or credit worthiness of our customers, obligors and counterparties. Numerous factors, including those reflected in
the Annual Report on Form 20-F filed with the Securities and Exchange Commission of the United States of America (the “SEC”) –under “Key Information-Risk Factors”- and in the
Documento de Registro de Acciones filed with the Spanish Securities Market Commission (the “CNMV”) –under “Factores de Riesgo”- could affect the future results of Santander and
could result in other results deviating materially from those anticipated in the forward-looking statements. Other unknown or unpredictable factors could cause actual results to differ
materially from those in the forward-looking statements.
Forward-looking statements speak only as of the date of this presentation and are based on the knowledge, information available and views taken on such date; such knowledge,
information and views may change at any time. Santander does not undertake any obligation to update or revise any forward-looking statement, whether as a result of new information,
future events or otherwise.
The information contained in this presentation is subject to, and must be read in conjunction with, all other publicly available information, including, where relevant any fuller disclosure
document published by Santander. Any person at any time acquiring securities must do so only on the basis of such person's own judgment as to the merits or the suitability of the
securities for its purpose and only on such information as is contained in such public information having taken all such professional or other advice as it considers necessary or
appropriate in the circumstances and not in reliance on the information contained in the presentation. No investment activity should be undertaken on the basis of the information
contained in this presentation. In making this presentation available, Santander gives no advice and makes no recommendation to buy, sell or otherwise deal in shares in Santander or
in any other securities or investments whatsoever.
Neither this presentation nor any of the information contained therein constitutes an offer to sell or the solicitation of an offer to buy any securities. No offering of securities shall be
made in the United States except pursuant to registration under the U.S. Securities Act of 1933, as amended, or an exemption therefrom. Nothing contained in this presentation is
intended to constitute an invitation or inducement to engage in investment activity for the purposes of the prohibition on financial promotion in the U.K. Financial Services and Markets
Act 2000.
Note: Statements as to historical performance or financial accretion are not intended to mean that future performance, share price or future earnings (including earnings per share) for
any period will necessarily match or exceed those of any prior year. Nothing in this presentation should be construed as a profit forecast.
The businesses included in each of our geographic segments and the accounting principles under which their results are presented here may differ from the included businesses and
local applicable accounting principles of our public subsidiaries in such geographies. Accordingly, the results of operations and trends shown for our geographic segments may differ
materially from those of such subsidiaries.
Important Information

53
Important Information
In addition to the financial information prepared under International Financial Reporting Standards (“IFRS”), this presentation includes certain alternative performance
measures as defined in the Guidelines on Alternative Performance Measures issued by the European Securities and Markets Authority on 5 October 2015
(ESMA/2015/1415es) as well as Non-IFRS measures. The APMs and Non-IFRS Measures are performance measures that have been calculated using the financial
information from the Santander Group but that are not defined or detailed in the applicable financial information framework and therefore have neither been audited
nor are capable of being completely audited. These APMs and Non-IFRS Measures are been used to allow for a better understanding of the financial performance of
the Santander Group but should be considered only as additional information and in no case as a replacement of the financial information prepared under IFRS.
Moreover, the way the Santander Group defines and calculates these APMs and Non-IFRS Measures may differ to the way these are calculated by other companies
that use similar measures, and therefore they may not be comparable. For further details of the APMs and Non-IFRS Measures used, including its definition or a
reconciliation between any applicable management indicators and the financial data presented in the consolidated financial statements prepared under IFR, see
Section 26 of the Documento de Registro de Acciones for Banco Santander filed with the CNMV on July 4, 2017 (available on the Web page of the CNMV -
www.cnmv.es- and at Banco Santander -www.santander.com), Item 3A of the Annual Report on Form 20-F for the year ended December 31, 2016, filed with the U.S.
Securities and Exchange Commission on March 31, 2017 (the “Form 20-F”) and section Alternative Performance Measures of the Consolidated Directors’ Report
which is part of the 2017 Auditors’ Report and Annual Consolidated Accounts (available at Banco Santander –www.santander.com). For a discussion of the
accounting principles used in translation of foreign currency-denominated assets and liabilities to euros, see note 2(a) to our consolidated financial statements on
Form 20-F and to our consolidated financial statements available on the CNMV’s website (www.cnmv.es) and on Banco Santander’s website (www.santander.com).

Thank you
Our purpose is to help people and
businesses prosper.
Our culture is based on the belief that
everything we do should be