presentation - smoke emission processor and community ... · the smoke emission processor and...
TRANSCRIPT
The SMOKE Emission Processor and CommunityMultiscale Air Quality Model (CMAQ) applied to
Southern Ontario
Xin QiuXin Qiu, Mike , Mike Lepage Lepage and Michael Van and Michael Van AltenaAltenaRWDI, OntarioRWDI, Ontario
CANADACANADA
10th Annual Emission Inventory ConferenceMay 1-3, 2001 Denver

MM5 Nested Modelling DomainsDomain 1: 108 x 108 km grid cells

Domain 2: 36 x 36 km grid cells

Hamilton
Toronto
Buffalo
Domain 3: 12 x 12 km grid cells

ErieLake Erie
Hamilton
London Buffalo
Pennsylvania
Ontario
New York
Toronto Lake Ontario
Domain 4: 4 x 4 km grid cells

Hamilton. Atmospheric Conce ntrations. Downtown and Upwind: Ke lly a nd Lynden Stations.
-20
0
20
40
60
80
100
6-Ju
l-99
7-Ju
l-99
8-Ju
l-99
9-Ju
l-99
10-J
ul-9
9
11-J
ul-9
9
12-J
ul-9
9
13-J
ul-9
9
14-J
ul-9
9
15-J
ul-9
9
16-J
ul-9
9
17-J
ul-9
9
18-J
ul-9
9
19-J
ul-9
9
20-J
ul-9
9
21-J
ul-9
9
22-J
ul-9
9
23-J
ul-9
9
24-J
ul-9
9
25-J
ul-9
9
26-J
ul-9
9
27-J
ul-9
9
28-J
ul-9
9
29-J
ul-9
9
30-J
ul-9
9
31-J
ul-9
9
Time of Day
[O3]
(ppb
v)
Dow ntow n Upw ind
Results from the MOE Samplers for the 1999 AmbientResults from the MOE Samplers for the 1999 AmbientMonitoring Program (OMonitoring Program (O33))
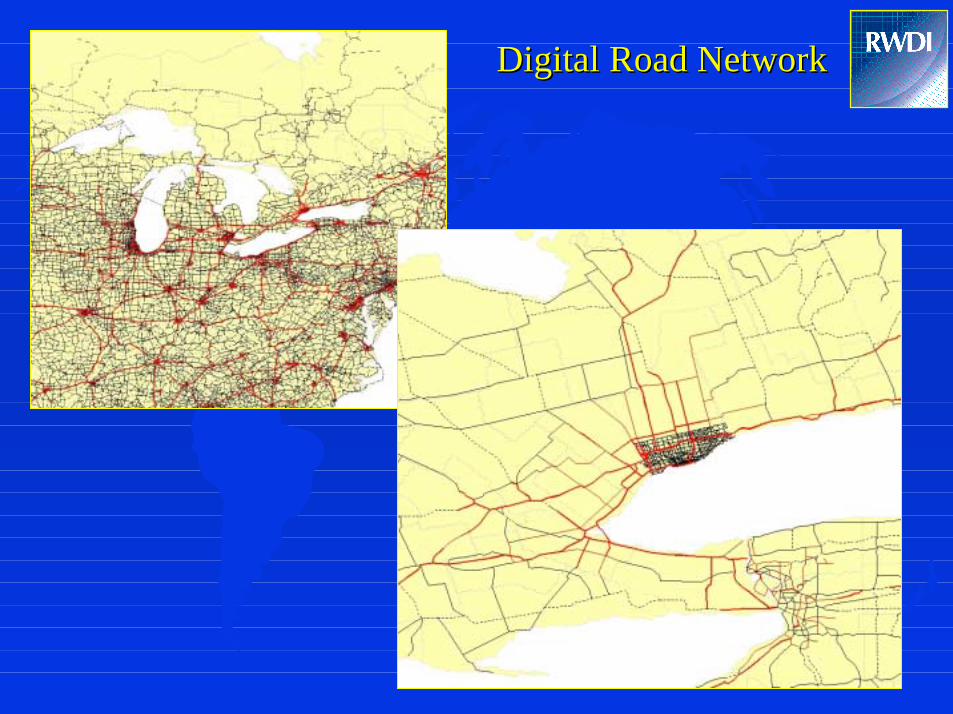
Digital Road Network Digital Road Network

NOx NOx Emissions Processed through SMOKEEmissions Processed through SMOKE
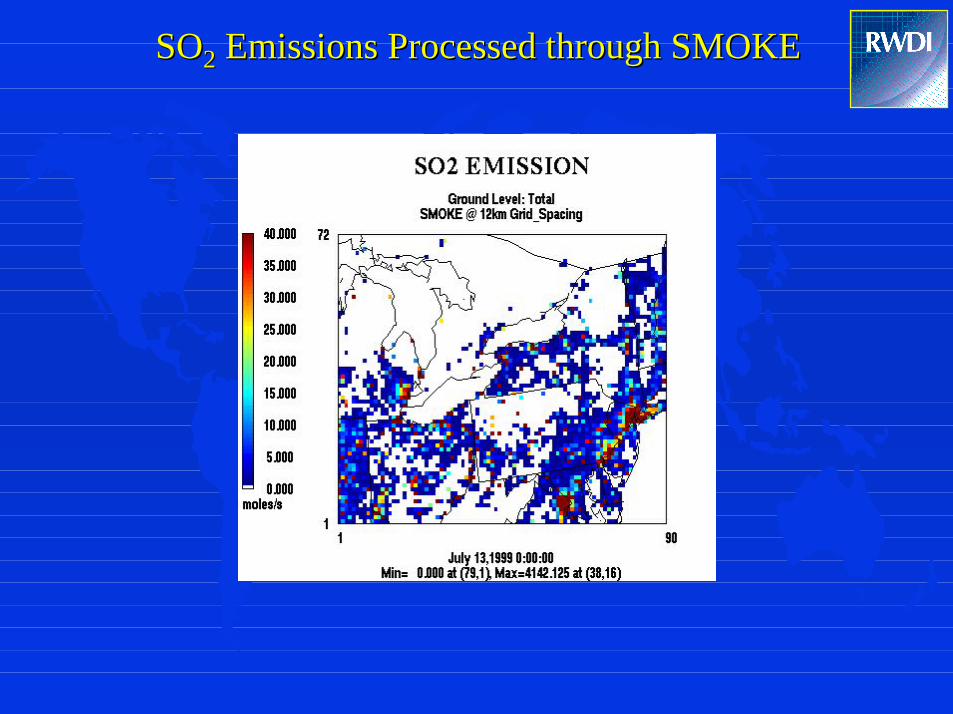
SOSO22 Emissions Processed through SMOKE Emissions Processed through SMOKE
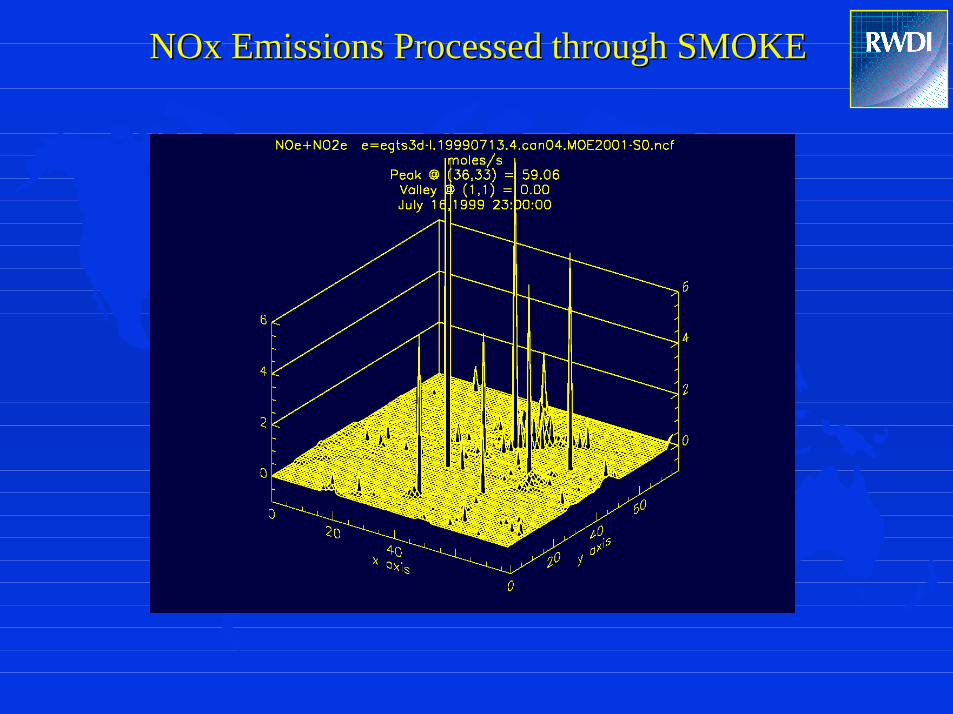
NOx NOx Emissions Processed through SMOKEEmissions Processed through SMOKE
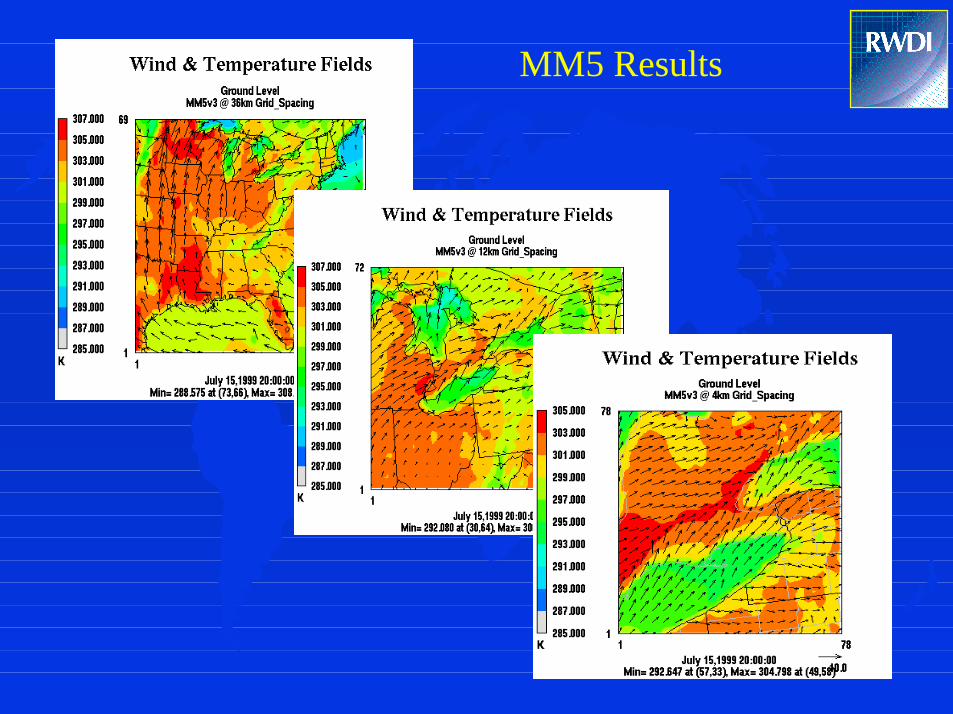
MM5 Results
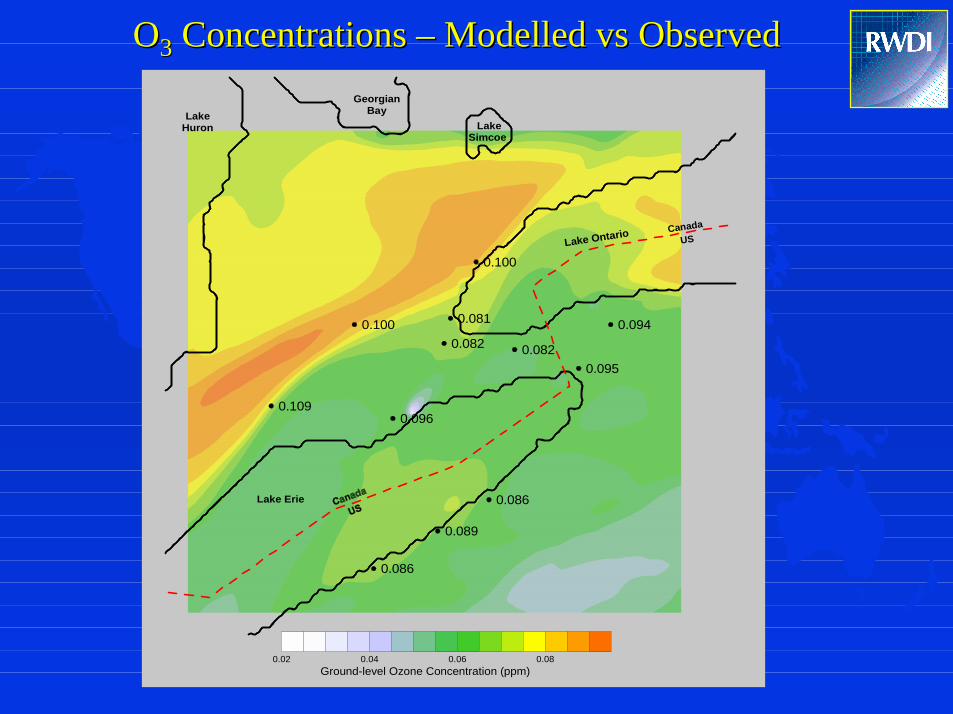
0.100
0.081
0.082
0.1090.096
0.082
0.100
0.086
0.095
0.094
0.086
0.089
USLake Ontario Canada
Lake Erie
LakeSimcoe
GeorgianBayLake
Huron
Ground-level Ozone Concentration (ppm)0.02 0.04 0.06 0.08
OO33 Concentrations – Concentrations – ModelledModelled vs vs ObservedObserved

Modelled Modelled OO33 Concentrations – 12 km Domain Concentrations – 12 km Domain

Modelled Modelled OO33 Concentrations – 4 km Domain Concentrations – 4 km Domain
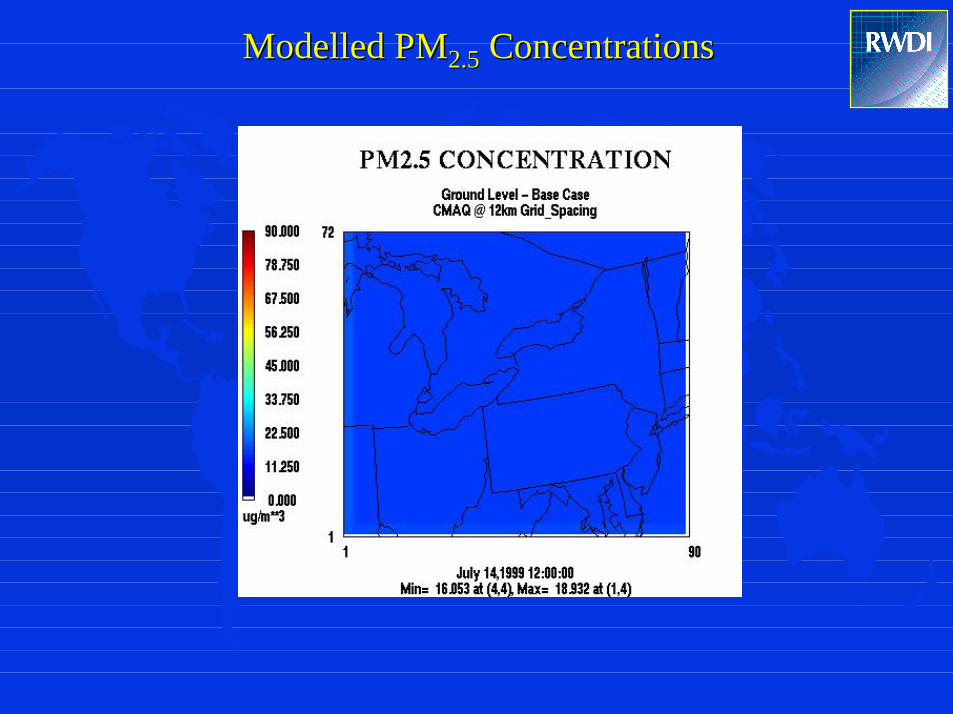
Modelled Modelled PMPM2.52.5 Concentrations Concentrations

Average PMAverage PM2.52.5 Concentrations ConcentrationsModelled vs Modelled vs ObservedObserved

Average SOAverage SO22 Concentrations ConcentrationsModelled vs Modelled vs ObservedObserved

Average OAverage O33 Concentrations ConcentrationsModelled vs Modelled vs ObservedObserved
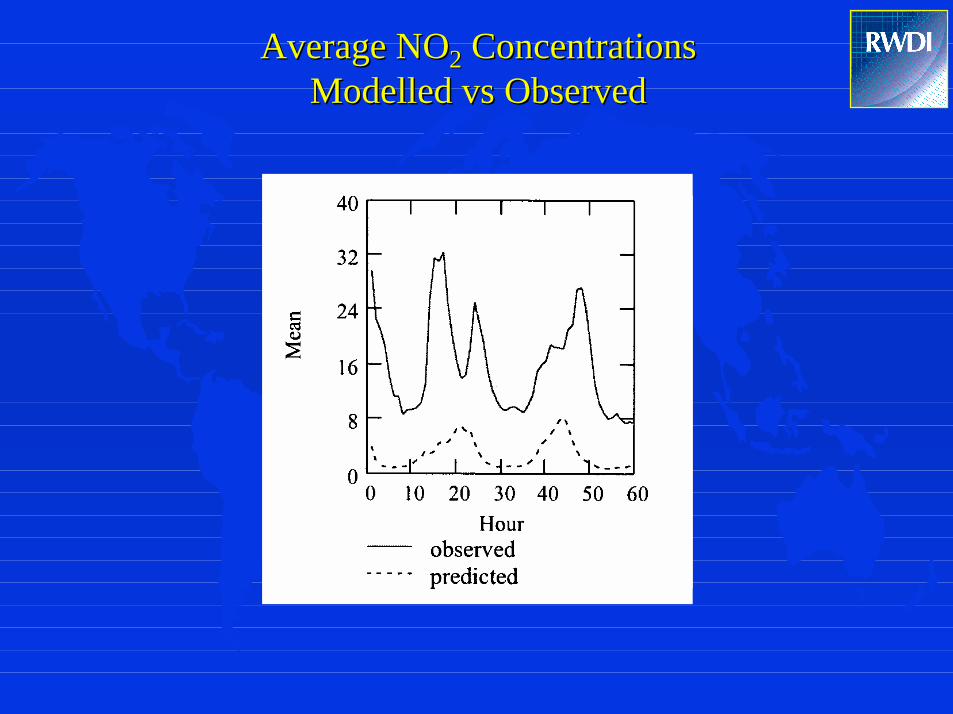
Average NOAverage NO22 Concentrations ConcentrationsModelled vs Modelled vs ObservedObserved

Average NOAverage NO22 Concentrations ConcentrationsModelled vs Modelled vs ObservedObserved
Increased Increased NO NOxx from US Point Sources by 50% from US Point Sources by 50%
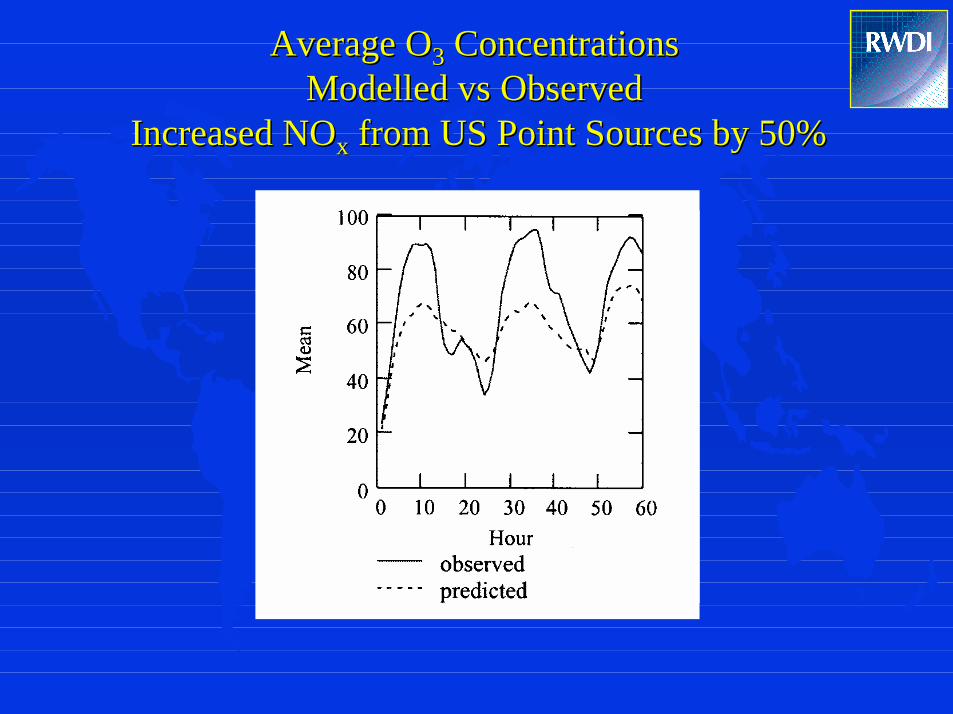
Average OAverage O33 Concentrations ConcentrationsModelled vs Modelled vs ObservedObserved
Increased Increased NO NOxx from US Point Sources by 50% from US Point Sources by 50%

Scenario 1: Turn off all US SO2 Emissions with Scenario 1: Turn off all US SO2 Emissions with no change in Canadano change in Canada

Scenario 1: Turn off all US SO2 Emissions with Scenario 1: Turn off all US SO2 Emissions with no change in Canadano change in Canada

Scenario 1: Turn off all US SO2 Emissions with Scenario 1: Turn off all US SO2 Emissions with no change in Canadano change in Canada

Scenario 2: CMAQ Simulations Based onOPG Power Plants Emission Data Update
◆ From 1995 base year to 1999
◆ Annual emission increased ~90%
◆ Summer emission increased ~40% aboveaverage

Scenario 2: CMAQ Simulations Based onOPG Power Plants Emission Data Update

Scenario 2: CMAQ Simulations Based onOPG Power Plants Emission Data Update

Conclusions
◆ Emission processor SMOKE performed well forCanadian and US inventories
◆ Model output compared reasonably well to monitoringdata for O3
◆ Model output compared well to monitoring data for CO,PM2.5 and SO2
◆ Model underestimated NO2 levels
◆ PM2.5 in Southern Ontario mostly (~ 90%) from major USSO2 sources in summer smog episode
◆ O3 in Southern Ontario mainly (>70%) from US NOx andVOC sources in summer smog episode
Conclusions (cont’d)
◆ SO2 emissions not only affect particulate matter, but alsoground level O3
◆ Major point sources and their temporal profiles play animportant role on ground level concentration predictions
◆ Finer resolutions (12 km and 4 km) were important to resolvelake breeze effects in Southern Ontario
◆ Overall Performance is good and the modelling system(MM5+SMOKE+CMAQ) is ready for running scenarios