presentation to department of finance - cmvmweb3.cmvm.pt/sdi/emitentes/docs/fr59692.pdfnone of novo...
TRANSCRIPT

Investor Presentation
April 2016

The information contained in this document, which has been prepared by Novo Banco S.A. (“Novo Banco”), is provided as at the date hereof
and is subject to updating, revision and amendment. The information in this document has not been independently verified and there is no guarantee of the accuracy or completeness of such data. None of Novo Banco or its subsidiary undertakings (the “Novo Banco Group”), or its financial or other advisers, or their respective directors, officers, employees, agents and affiliates, undertakes or is under any duty to update this document or to correct any inaccuracies in any such information which may become apparent or to provide you with any additional information. To the fullest extent permissible by law, such persons disclaim all and any responsibility or liability, whether arising in tort, contract or otherwise, which they might otherwise have in respect of this document.
Certain information in this document is based on management estimates. Such estimates represent the current beliefs of applic able members of management of the Novo Banco Group. While those management members believe that such estimates are founded on reasonable grounds,
estimates by their nature may not be correct or complete. Accordingly, undue reliance should not be placed on any of the esti mates contained in this document and no representation or warranty is given that such estimates are correct or complete.
This document does not constitute an offer or invitation for the sale, issuance or purchase of securities, nor does it purpor t to give legal, tax or financial advice. Nothing herein shall be taken as constituting the giving of investment advice or an inducement to enter into investment activity in any jurisdiction and this document is not intended to provide, and must not be taken as, the basis of any decision and should not be considered as an invitation, inducement, solicitation or recommendation to purchase, underwrite, subscribe for or otherwise a cquire any securities of Novo Banco. This document is not delivered in connection with any public offer of securities (oferta pública relativa a valores mobiliários) regulated in the Securities Code (Código dos Valores Mobiliarios).
This document may include certain statements relating to the Novo Banco Group that are neither reported financial results nor other historical information. The statements, which may include targets, forecasts, projections, descriptions of anticipated cost savings, sta tements regarding the possible development or possible assumed future results of operations and any statement preceded by, followed by or that includes the words “believes”, “expects”, “aims”, “intends”, “may” or similar expressions or negatives thereof are or may constitute forwa rd-looking statements.
By their nature, forward-looking statements are inherently predictive, speculative and involve risk and uncertainty. There are a number of factors that could cause actual results and developments to differ materially from those expressed or implied by forward-looking statements. These factors include, but are not limited to, changes in economic conditions in individual countries in which the Novo Banco Group conducts its business, fiscal or other policies adopted by various governments and regulatory authorities of Portugal and other jurisdictions, levels of
competition from other banks and financial services companies as well as future exchange rates and interest rates.
2
Disclaimer

None of Novo Banco Group or its financial or other advisers, nor their respective directors, officers, employees, agents or affiliates, ( i)
undertakes any obligation to release publicly any revision to the forward-looking information included in this document to reflect events, circumstances or unanticipated events occurring after the date hereof or (ii) accepts liability for any of such statements.
This document contains operational and financial targets of the Novo Banco Group, and other information derived from such targets. Such information does not constitute nor is it intended to constitute in any way any form of projection or forecast or expectation of future performance of the Novo Banco Group. These targets are presented for illustrative purposes only, and do not constitute nor are they intended to constitute in any way any form or projection or forecast or expectation of future profitability. These targets are based on a number of underlying assumptions made by the management of the Novo Banco Group and which have not been verified by any independent source and are subject to inherent uncertainties and risks and subject to change and there is no assurance that these assumptions will be realised nor that
such targets will be achieved. As such, you should not place undue reliance on them. Novo Banco Group, its financial and other advisers, and their respective directors, officers, employees, agents, and representatives, accept no liability for any loss however arising, directly or indirectly, from any use of these operational and financial targets or in connection therewith.
This document presents data relating to the commercial franchise and side bank of the Novo Banco Group. This information is presented based on internal data used by the management of the Novo Banco Group to monitor the performance of its restructuring plan, with the commercial franchise data representing the assets of the Novo Banco Group identified by management as core banking activities (the “core assets”) and the side bank data representing the assets of the Novo Banco Group identified by management as non-core services and operations (the “non-core assets”). This information should be considered supplemental in nature and is not meant as a substitute for the financia l statements or
figures in this document prepared in accordance with IFRS. Data presented herein relating to the commercial franchise and side bank represent management’s current division of the core assets and non-core assets as at the date hereof. Ongoing assessment may result in certain core assets being reclassified as non-core assets and/or certain non-core assets being reclassified as core assets. As a result, data relating to the commercial franchise and side bank of the Novo Banco Group presented after the date of this document may represent a different classification and division of the core assets and non-core assets comprising the commercial franchise and side bank, respectively.
3
Disclaimer (continued)

• Already achieved:
• Deleveraging of Eur12bn in RWAs (24%) and Eur15bn (21%) in total assets since 4-Aug-14
• Sale of BESI for Eur379mn to Haitong Securities (+80bps impact on CET1) completed in Sep15
• Sale of real estate assets amounting to Eur782mn since 4-Aug-14 at average ~3% premium
• Sale of relevant equity stakes totalling Eur63mn since 4-Aug-14
• Cost reduction of 13%(5), along with reduction of 39 branches and 576 FTEs since 4-Aug-14
• Further potential
• Proactive reduction of non-core assets with targeted ~Eur700mn(6) real estate sales in 2016 and ongoing sale processes for equity stakes
• Cost optimisation in line with Iberian benchmarks with approximately 170 domestic branch closures currently planned in the medium term and ~1,000 FTE reduction in 2016
Novo Banco at a glance
4
• Market leader in Corporate Banking: loans market share of 21%(2) (credit to Corporates and SMEs representing 70%(3) of overall credit portfolio), with network of 23 corporate centres and >100 relationship managers
• Strong penetration of SME segment: ~78%(4) of Portuguese SMEs are Novo Banco clients
• Comprehensive value proposition to support companies with international activity
• Well placed to benefit from Portuguese economic recovery driven by export-oriented SMEs
The leading SME bank(1) in Portugal with a distinctive retail franchise
• Top 3 domestic franchise in retail and private banking with market share of 10%(2) in mortgages and 11%(2) in deposits
• Clear customer segmentation strategy throughout all customer base
• Universal product offering through wholly-owned life insurance and asset management businesses
Independent Portugal-focused banking play
Proven track record in downsizing non-core operations
Restructuring opportunity
3rd(2) largest bank by total
assets in Portugal with ~1.3m clients
(1) Source: management estimates based on corporate banking loans market share of ~21% (2) Source: management estimates based on data published by Banco de Portugal and INE (3) Source: Novo Banco 2015 financial statements
(4) Estimated by management, based on Informa DB (turnover between Eur2.5mn and Eur50mn) (5) 2015 operating expenses vs Aug – Dec 2014 annualised operating expenses (6) Targeted net book value of assets to be sold

Novo Banco timeline
5
3Aug14 Novo Banco created following Resolution measure applied to BES by Banco de Portugal (‘BdP’)
17Sep14 Current senior management appointed led by Eduardo Stock da Cunha as Chairman and CEO
15Sep15 Sale process for Novo Banco suspended by Banco de Portugal decision
14Nov15 Results of Comprehensive Assessment undertaken by ECB with no shortfall in Baseline Scenario and Eur1.4bn shortfall in Adverse Scenario
29Dec15 Banco de Portugal, acting as Resolution Authority, announced several decisions, including re-transfer to BES of 5 series of non-subordinated bonds
15Jan16 Banco de Portugal announced re-launch of the sale process of the Resolution Fund’s holding in Novo Banco
15-Dec-15 Restructuring Plan agreed with DG COMP. Internal separation between Commercial Franchise (core) and Side Bank (non-core)
3Aug14 17Sep14 15Sep15 14Nov15 29Dec15 15Jan16 15-Dec-15 31Mar16
31Mar16 Banco de Portugal announced that both strategic and market (potentially involving cornerstone investors) sale processes will be pursued for Novo Banco and published eligibility criteria for investors

Board of Directors
6
Experienced management team leading Novo Banco
Eduardo Stock da Cunha, Chairman and CEO
• Chairman and CEO since Sep-14
• Formerly with Lloyds Banking Group in London
• Former Member of the Board of Grupo Santander Totta and subsequently Sovereign Bank/Santander Bank N.A. in the United States
• 30 years of banking experience
Jorge Freire Cardoso
• Head of Risk, Credit and Side Bank
• Board member since Sep-14
• Formerly with Caixa Geral de Depósitos, where he was a Member of the Board and of the Executive Committee
• Former CEO of Caixa - Banco de Investimento
• 20 years of banking experience
Francisco Cary
• CFO and Head of Treasury
• Board member since Mar-15
• Former Deputy CEO of Banco Espirito Santo de Investimento
• Previously CEO of Banco Espirito Santo de Investimento Brasil
• 25 years of banking experience
Vítor Fernandes
• Head of Corporate Banking
• Board member since Sep-14
• Former Member of the Board of Banco Comercial Português and Caixa Geral de Depósitos
• Previously CEO of Fidelidade Mundial and Império Bonança insurance companies
• 14 years of banking experience
José João Guilherme
• Head of Retail and Private Banking
• Board member since Sep-14
• Former Member of the Board of Banco Comercial Português
• Previously CEO of Millennium BIG Bank (Poland) and Banco Internacional de Moçambique
• 29 years of banking experience
Francisco Vieira da Cruz
• Head of Legal, HR and Compliance
• Board member since Mar-15
• Former Head of Legal Department at Novo Banco
• 15 years of banking experience
Speakers at the meetings

Restoring profitability (Commercial Franchise)
Strategic priorities: leveraging key commercial strengths and orderly reduction of exposure to non-core assets
7
I II III
2014 2015 2016
Solving liquidity and funding constraints
Managing the capital position
I
II
III
Downsize Side Bank IV
• Deleverage
• Improve liquidity and funding position by
strengthening the customer deposit base (+Eur2.7bn net inflows since 4-Aug-14)
• Reduce non-performing
asset base
• Manage regulatory capital position through deleveraging
• Sale of BESI
• Selected sales of real estate and equity stakes
• Optimisation of RWAs
• Phased-in CET 1 ratio at 13.5% at 31-Dec-15
• Focus on core business with distinctive value proposition
• Normalise funding costs
• Reduce operating costs by simplifying the group structure and reducing footprint
• Increase productivity leveraging on digitalisation
• Reduce cost of risk and impairment charges by reviewing risk appetite and
strengthening governance
• Starting Side Bank asset size of Eur10.8 bn as of 31-Dec-15
• Wind-down or sell non-core international operations
• Accelerated sale of non-core assets (real estate, equity
stakes)
• Recovery or sale of out-of-strategy credit portfolio
IV

8
Novo Banco update

Sovereign debt 39%
Bonds 7% Other
15%
GNB Vida 39%
3.3 2.9
6.0 5.1
4.0
2.8 2.6
2.6
2.4 3.1
3.2
6.2 5.7
5.2
7.2 6.1
8.2
36.7
34.9
31.6
7.8
5.0
2.8
4-Aug-14 31-Dec-14 31-Dec-15
Cash, deposits, loans & advances at central banks
and other banks
Customer loans
Securities portfolio (ex. insurance)
Insurance securities portfolio
Non current assets held for sale
Current and deferred tax assets
Other assets
BESI
Refocus of the balance sheet into traditional commercial banking
9
Asset side of the balance sheet (Net assets, Eur bn) (1)
72.4
65.4
57.5
Customer loans (Dec-15)
Securities portfolio (Dec-15)
Total: Eur13.4bn
Non-current assets held for sale (Dec-15)
1
1
2
2
3
3 (1)
• Gross customer loans declined 6.6% YoY to Eur37.4bn
mainly through the reduction in large exposures
• Provisions amounted to Eur5.8bn, leading to net
customer loans of Eur31.6bn
• Includes Eur8.1bn of gross loans (Eur5.1bn net) allocated to
the Side Bank
• Eur6.6bn (Eur3.8bn net) arising of “out of strategy”
corporate loans and Eur1.3bn (Eur1.2bn net) from BES
Venetie
• The securities portfolio totalled Eur13.4bn and represented
23.2% of assets
• Eur5.1bn of securities portfolio are related to Novo Banco’s
insurance operations (GNB Vida’s exposure)
Finished properties
50%
RE stakes 12%
• Net non-current assets held for sale amounted to Eur3.2bn,
due to provisions of Eur1.2bn and a coverage ratio of 27%
• Net real estate assets owned by Novo Banco amounted
to Eur2.7bn, with coverage ratio of 25%
• Other net non-current assets held for sale amounted to
Eur0.5bn, with coverage ratio of 36%
• It includes Eur2.7bn net non-current assets held for sale
allocated to the Side Bank Land/under
development 32%
Other non-current assets held for sale 7%
Total (gross): Eur4.4bn
Mortgages 26%
Total (gross): Eur37.4bn
Other individual loans 4%
Corporate 48%
Side Bank 22%
(2)
(1) Excluding BESI, net assets for Novo Banco would amount to Eur69.1bn and Eur62.6bn as of August 4, 2014 and December 31, 2014 respectively
(2) Including consolidation adjustments; BESI on a standalone basis had total assets of Eur5.1bn and Eur4.4bn as of August 4, 2014 and December 31, 2014 respectively

24.6 26.6 27.4
140%
126% 113%
4-Aug-14 31-Dec-14 31-Dec-15
Significant deleveraging and deposit gathering effort which has contributed to strengthen the liquidity and capital position
10
8.8% 8.7% 10.3%
4.6% 4.8% 4.5%
9.5% 9.3% 9.4%
14.4% 14.5%
7.4%
24.9%
18.0%
20.5%
37.9%
44.7%
47.9%
4-Aug-14 31-Dec-14 31-Dec-15
Customer deposits
Amounts owed to central banks and other banks
Debt securities
Insurance technical provisions and investment contracts
Other liabilities
Equity
Funding side of the balance sheet (Eur bn) (1)
• Deposit growth in domestic market, driven by increased confidence in the bank despite lower interest rates
• Overall growth in customer deposits of 2.8% YoY, underpinned by retail deposits (+21.3%) and private banking (+17.5%)
• Increasing importance of customer deposits which now represent 48% of the funding side in the balance sheet as of December 31, 2015
Central bank funding (2)
• The resources from ECB totaled Eur7.6bn, -10.6% YoY
• ECB eligible assets amounted to Eur12.7bn (including Eur5.2bn of sovereign debt)
Customer deposits (Eur bn) Net loan-to-deposit ratio
Net loan-to-deposit ratio and deposits (Eur bn)
(1) Excluding BESI (2) As of December 31, 2015
69.1
62.6
57.5
Overdue and Credit at Risk ratios evolution Overdue and Credit at Risk ratios (Dec-15)
Coverage ratios evolution Coverage ratios (Dec-15)
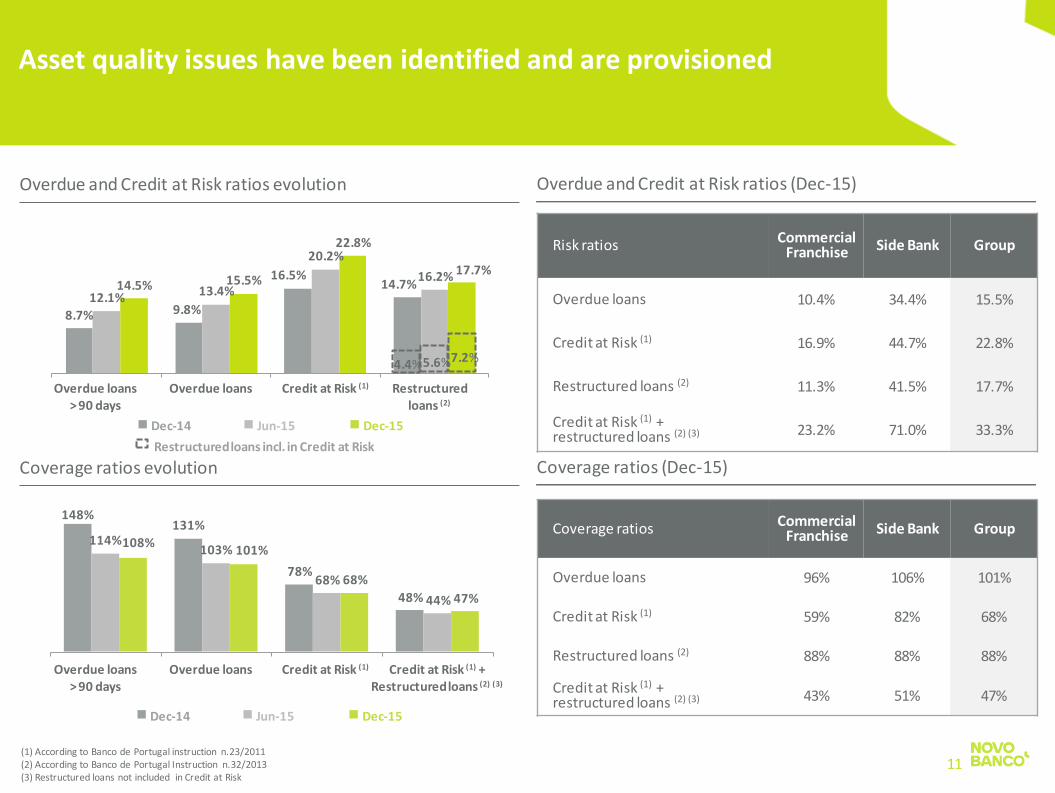
Asset quality issues have been identified and are provisioned
8.7% 9.8%
16.5% 14.7%
12.1% 13.4%
20.2%
16.2% 14.5% 15.5%
22.8%
17.7%
Overdue loans > 90 days
Overdue loans Credit at Risk (1)
Dec-14 Dec-15 Jun-15
(1) According to Banco de Portugal instruction n.23/2011 (2) According to Banco de Portugal Instruction n.32/2013 (3) Restructured loans not included in Credit at Risk
148% 131%
78%
48%
114% 103%
68%
44%
108% 101%
68%
47%
Overdue loans > 90 days
Overdue loans Credit at Risk (1)
Dec-14 Dec-15 Jun-15
11
Restructured loans (2)
Restructured loans incl. in Credit at Risk
Risk ratios Commercial Franchise Side Bank Group
Overdue loans 10.4% 34.4% 15.5%
Credit at Risk (1) 16.9% 44.7% 22.8%
Restructured loans (2) 11.3% 41.5% 17.7%
Credit at Risk (1) + restructured loans (2) (3) 23.2% 71.0% 33.3%
4.4% 5.6% 7.2%
Credit at Risk (1) + Restructured loans (2) (3)
Coverage ratios Commercial Franchise Side Bank Group
Overdue loans 96% 106% 101%
Credit at Risk (1) 59% 82% 68%
Restructured loans (2) 88% 88% 88%
Credit at Risk (1) + restructured loans (2) (3) 43% 51% 47%

12.7% 17.2%
13.5% 13.8%
27.6%
16.5% 16.9%
44.7%
22.8%
Commercial Franchise Side Bank Group
Top-10 corporate exposures (Eur mn)
Focus on reducing largest corporate exposures and contained increase of Credit at Risk in the Commercial Franchise
7,318
6,932
6,526
31-Dec-14 30-Jun-15 31-Dec-15
-10.8%
12
Credit at Risk ratios (1)
4-Aug-14 31-Dec-14 31-Dec-15
(1) For the entire credit portfolio; data for the Side Bank are calculated in accordance with the methodology described in the disclaimer
Provision coverage
67% 63% 59% 160% 109% 82% 88% 78% 68%
Side Bank Eur2,264mn
(77%) Eur2,927mn
Commercial Franchise Eur663mn
(23%)
Change in Credit at Risk between Aug-14 and Dec-15 (1)

Loan provisions formation (Eur mn)
13
Significant reinforcement of provisions throughout asset categories
50
10
20 80
4-Aug-14 –31-Dec-14
H1 2015 H2 2015 [XX]X]
EUR
m
Non-current assets held for sale (Eur mn)
Aug-14 Aug - Dec 14 1H15 2H15 Dec-15
On BS loan provisions / gross loans (accumulated)
11.9% 12.8% 13.7% 15.6%
4,945 186
237
5,833 465
(1) Real estate assets declined on a comparable basis and the increase is explained by consolidation and/or reclassification of real estate and other funds (€973mm) (2) Includes equipment held for sale and investments in subsidiaries (3) This reduction is due to changes in the consolidation perimeter of RE assets: the comparable values at Dec-14 were Eur858mn (GBV) and Eur517mn (NBV) so YoY change is 4% (GBV) and 13% (NBV)
31-Dec-14 30-Jun-15 31-Dec-15 YoY chg.%
Real estate
Book value (gross) 2,768 3,709 (1) 3,567 29%
Provisions 824 871 900 9%
Book value (net) 1,943 2,839 2,667 37%
Coverage 30% 23% 25%
Other non-current assets held for sale (2)
Book value (gross) 1,208 894 (3) 809 -33%
Provisions 405 310 293 -28%
Book value (net) 804 584 516 -36%
Coverage 34% 35% 36%

4.4% 4.5%
11.5% 13.5%
16.9%
22.8%
8.9% 6.6%
10.0% 9.8% 11.3%
17.7%
Bank 3 Bank 4 Bank 1 Bank 2
87% 85%
68% 64% 59%
53%
33% 42%
47% 43% 43%
37%
Bank 3 Bank 4 Bank 1 Bank 2
On BS provision reserve / gross loans (Dec-15) Credit at Risk and restructured loans ratios (Dec-15)
Coverage ratios (Dec-15) Non-current assets held for sale coverage ratio (Dec-15) (3)
Coverage levels in line with domestic peers
15.6%
10.0%
7.3% 7.2% 7.1%
3.8%
Bank 1 Bank 2 Bank 3 Bank 4
Source: Company information and figures for peers as per public disclosure. Note: Peer group includes CGD, Millennium bcp, Santander Totta and BPI. Ratios based on latest information available. Bank 2 and Bank 4 figures for Portuguese operations only except for restructured loans and restructured loans coverage ratios which are for each Group as a whole (1) Pro-forma for disclosed corporate transactions (2) Restructured loans not included in Credit at Risk (3) Bank 2 and Bank 4 figures denote foreclosed assets coverage ratio as of Dec-15 whereas Bank 1 and Bank 3 figures denote coverage ratios for non-current assets held for sale as of Jun-15
14
Commercial Franchise
Commercial Franchise
Credit at Risk Restructured
Commercial Franchise
(1)
37%
32%
27%
18% 16%
Bank 3 Bank 1 Bank 4 Bank 2
Credit at Risk coverage ratio Credit at Risk + Restructured loans (2) coverage ratio

CET1 phased-in ratio evolution Capital ratios (Dec-15)
15
Reinforcement of capital position…
• The CET1 phased-in ratio for 31 December 2015 was 13.5% (Dec-14: 9.5%) given the decrease of Eur8.8bn in RWA and the increase of
Eur0.7bn in own funds as compared to 31 December 2014
• CET1 fully implemented ratio of 11.3% in Dec-15 (7.5% in Dec-14)
Eur mn Phased-in Fully implemented
Total shareholders’ equity (A) 5,989 5,989
Regulatory and prudential deductions
AFS eligible reserves (79) -
Non controlling interests 8 21
Goodwill and other intangible assets (293) (293)
Deferred tax assets (473) (1,210)
Investments in financial entities (49) (186)
Others 39 (39)
Total adjustments (B) (847) (1,707)
Common equity tier 1 (A) + (B) 5,142 4,282
Tier 1 5,142 4,282
Tier 2 - 100
Total capital 5,142 4,382
Risk weighted assets 38,168 37,870
Common equity tier 1 ratio 13.5% 11.3%
Total capital ratio 13.5% 11.6%
10.3%
9.5%
13.5%
4-Aug-14 31-Dec-14 31-Dec-15

38665 451 19 470
2015 net interest income before
reversal of accrued interest on Eur2bn bond
re-transfer
Reversal of accrued interest on Eur2bn bond
re-transfer
2015 stated net interest income
Impact of Eur2bn bond
re-transfer to BESnot reflectedin 2015 net
interest income
Adjusted 2015 net
interest incomeEquity
4.0
Equity5.9
Other6.9
Other6.9
Due to ECB7.6
Due to ECB7.6
Debt securities6.2
Debt securities4.3
Deposits27.4
Deposits27.4
Pre-EUR2bn bond re-transfer to BES After EUR2bn bond re-transfer to BES
Impact on the balance sheet of Eur2bn non-subordinated bonds re-transfer to BES (Eur bn, 31-Dec-15) Estimated impact on phased-in CET1 (31-Dec-15)
Estimated impact on net interest income (Eur mn, 2015)
…following the 29-Dec-15 decision by Banco de Portugal
Insurance technical provisions and investment contracts
5.4
Insurance technical provisions and investment contracts
5.4
16
Aggregate impact of Eur84mn on net
interest income of Eur2bn bond re-
transfer
57.5 57.5
Source: Company information
8.0%
5.5% 13.5%
2015 pre-Eur2bn bondre-transfer to BES
Impact of Eur2bn bond re-transfer to BES
2015

14.7% 13.7% 13.5%
11.1% 10.8%
Bank 3 Bank 2 Bank 4 Bank 1
Phased-in CET1 ratio (Dec-15) Fully implemented CET1 ratio / RWA density (Dec-15)
Novo Banco's capital position compares favourably to its Portuguese peers
Source: Company information and figures for peers as per public disclosure Note: Peer group includes CGD, Millennium bcp, Santander Totta and BPI (1) Pro-forma for disclosed corporate transactions (2) Ratio of RWA to total assets based on phased-in RWA figures (3) As of June 30, 2015
(1)
17
(1)
(1)
Fully implemented CET1 ratio (Dec-15)
14.6%
11.3% 10.2% 10.0% 10.0%
Bank 3 Bank 2 Bank 4 Bank 1
9%
10%
11%
12%
13%
14%
15%
16%
30% 40% 50% 60% 70%
Fully
imp
lem
en
ted
CET
1 ra
tio
(D
ec-
15)
RWA density (Dec-15) (2)
Bank 3
Bank 1 (3)
Bank 2
Bank 4

Commercial banking income of Eur806mn with net interest income
posting an increasing contribution throughout 2015 (NIM of 0.93%), in
spite of the negative impact of the annulment of overdue interest in the
amount of Eur172mn, with a large part of it being related to large non
recurring operations (1)
Operating costs amounted to Eur755mn in 2015 showing a reduction of
12.7% vs. the comparable figure in 2014 (2)
Net operating income was positive Eur125mn highlighting the Group's
ability to deliver positive operating results
Net provisions of Eur1,058mn. The reinforcement of provisions for the real
estate portfolio and for the 50 largest exposures that existed at the time of
the resolution of BES amounted to Eur592mn
Net income in 2015 amounted to a loss of Eur981mn, mostly explained by
the high level of provisions for an amount of Eur1,058mn and the write-off
of Eur160mn of 2013 tax losses carried forward
Results
4-Aug-14 to 31-Dec-14
1-Jan-15 to 31-Dec-15
Net interest income 265.5 450.7
+ Fees and commission 178.2 355.6
= Commercial banking income 443.7 806.2
+ Capital markets 411.4 117.9 + Other results (71.8) (44.5) = Banking income 783.3 879.6
- Operating costs 355.4 754.7
= Net operating income 427.9 125.0
- Net provisions 699.1 1,057.9 Credit 378.1 739.3
Securities 199.7 236.2
Other assets and contingencies 121.2 82.4
= Income before taxes (271.2) (933.0)
- Corporate income tax 215.5 31.0
- Special tax on banks 13.0 31.4
= Income after taxes (499.6) (995.4)
- Non-controlling interest (2.0) (14.8)
= Net income (497.6) (980.6)
Income statement (Eur mn)
18
FY2015 income statement highlights
(1) The annulled interest is related to “legacy” credits (from BES ) (2) Annualized figure for the period 4-Aug-14 to 31-Dec-14 not adjusted for seasonality

19
Investment highlights

Leading domestic
franchise with renewed focus
• Focus on the Portuguese market, supported by reduced international footprint
• Strengthen positioning as a leading corporate / SME franchise(1)
• Grow in retail to reach natural market share of c. 13% in mortgage production and deposits(2) in Portugal, leveraging strong customer focus
Proactive down-sizing of
Side Bank
• Orderly wind-down of non-core and non-productive assets in the context of a focused deleveraging plan
• Side Bank total assets to reduce from Eur10.8bn at end 2015 to a target of Eur4.6bn in the longer term
Reducing funding cost
• Net interest income uplift anticipated on the back of:
• Deposits repricing
• Maturity of wholesale funding instruments
Efficiency optimisation
• Improving efficiency on the back of the restructuring plan, which targets FTE reduction (~1,000 in 2016) and closing of approximately 170 domestic branches in the medium term
Normalisation of cost of risk
• New risk management procedures, focused on attracting customers with low and medium-risk profiles in retail and SME segments
• Following significant provision charges in 2014 and 2015, as well as allocation of out-of-strategy exposures to the Side Bank, the cost of risk of the Commercial Franchise is expected to normalise
20
Investment highlights
1
2
3
4
5
(1) Source: management estimates based on corporate banking loans market share of ~21% (2) Only NB Portugal (excluding Banco BEST, NB Açores and SFE), excludes mortgage securitsations

21
Leading domestic franchise with renewed focus 1
Corporate Banking
Resilient fee income generation capability (2015) Retail banking (Dec-15)
Peer group includes CGD, Millennium bcp, Santander Totta and BPI (1) Press Release for Dec 2015 considers only domestic credit. International credit assumed to be corporate; (2) Press Release for Dec 2015 considers only the activity in Portugal. Calculated as domestic corporate credit over total credit portfolio; (3) Management estimates based on market data; (4) Estimated by management, based on Informa DB (turnover between Eur2.5mn and Eur50mn) (5) Swift; (6) Data published by Banco de Portugal and INE
Weight of corporate credit in overall portfolio (Dec-15)
Clients of Novo Banco
85%(3) of ~3,500 large corporates in Portugal are
NB clients
78%(4) of ~25k SMEs in Portugal are NB
clients
• Specialised, diversified and distinct product offering to meet client needs
• In addition to the 596 branches and the 16 private banking units in Portugal, Novo Banco has a multi-channel approach through internet banking, phone banking, helpdesk services and mobile banking
• Universal product offering including life insurance (through GNB Vida) and asset management (through GNB Gestão de Ativos)
In addition, Private Banking is sub segmented in “Executive Professionals”; “Entrepreneurs”;
“Traditional Family” and “Top Private”. Sub-segmentation leads to a more focused
commercial approach
Small businesses
Affluent
Mass market
Novo Banco’s market share in selected business lines (Dec-15)
Deposits (Eur bn)
2.2
7.4
3.3
Loans (Eur bn)
1.8
3.2
7.4
21.9%
20.7%
19.6%
15.3%
10.0%
13.1%
11.6%
10.7%
7.1%
Trade finance
Corporate credit
POS
Personal loans
Mortgages
Pension plans
Life insurance
Deposits
Asset management
(1) (2)
(5)
(8)
(6)
(6) (7)
(6)
(9) (6)
(8)
(7) SIBS, Unicre; (8) APFIPP, CMVM, management estimates; (9) APS, ASF, management estimates (10) Company information and figures for peers as per public disclosure. Customer volumes defined as customer loans and customer deposits
0.60% 0.59% 0.58% 0.57%
0.37%
Bank 2 Bank 4 Bank 3 Bank 1
Fee
inco
me
/ cu
sto
mer
vo
lum
es
(10)
69.6%
47.4% 45.6% 44.7% 41.0%
Bank 1 Bank 2 Bank 3 Bank 4

2.3
1.0
2.6
3.7
1.2
10.8
International operations
Equity stakes
Real estate
Out-of-strategy
loans
Restructuring funds
Total
Total assets, Eur bn (Dec-15)
Strategic goals Description
• Wind-down on sale or non-core operations
• Selected international operations
• Orderly sale process aimed at value maximisation either initiated or to be initiated
• Selected equity stakes
• Staggered sales with ~Eur500mn(1) sales targeted for 2016
• Owned real estate assets with ~30% impairment recorded
• Orderly deleverage to maximise value • Detailed business plan with identified
options
• Includes noncore loans, of which 44.7% are Credit at Risk with 82% provision coverage • international loans (incl project finance) • real estate development loans • loans for acquisition of shares
• Opportunistic sales • Stakes in real estate and diversified restructuring
funds, with other Portuguese banks as shareholders
22
Proactive down-sizing of Side Bank (1/2)
A
B
2
(2)
(1) ~Eur700mn targeted sales for both Side Bank and Commercial Franchise (2) As of 30 September 2015
Targeted reduction to Eur9bn by 2016YE

Real estate 72.2%
Construction 7.5%
Diversified 20.3%
Restructuring funds (managed by external parties) (Sep-15) Real estate owned assets (Dec-15)
Proactive down-sizing of Side Bank (2/2)
B A
2
Retail 24.2%
Large properties 71.8%
Real estate funds 4.0%
Land 50.1%
Commercial / services 26.3%
Industrial 9.0%
Residential 4.2%
Other 10.5%
23
Eur2.6bn
Eur1.2bn
Eur2.6bn
1,273
(172)
288
352(80)
(506)
451
Loan yield Annulment of overdue interest
Others Retail funds cost Money market Others (1) Net Interest income
Interest income Interest expense
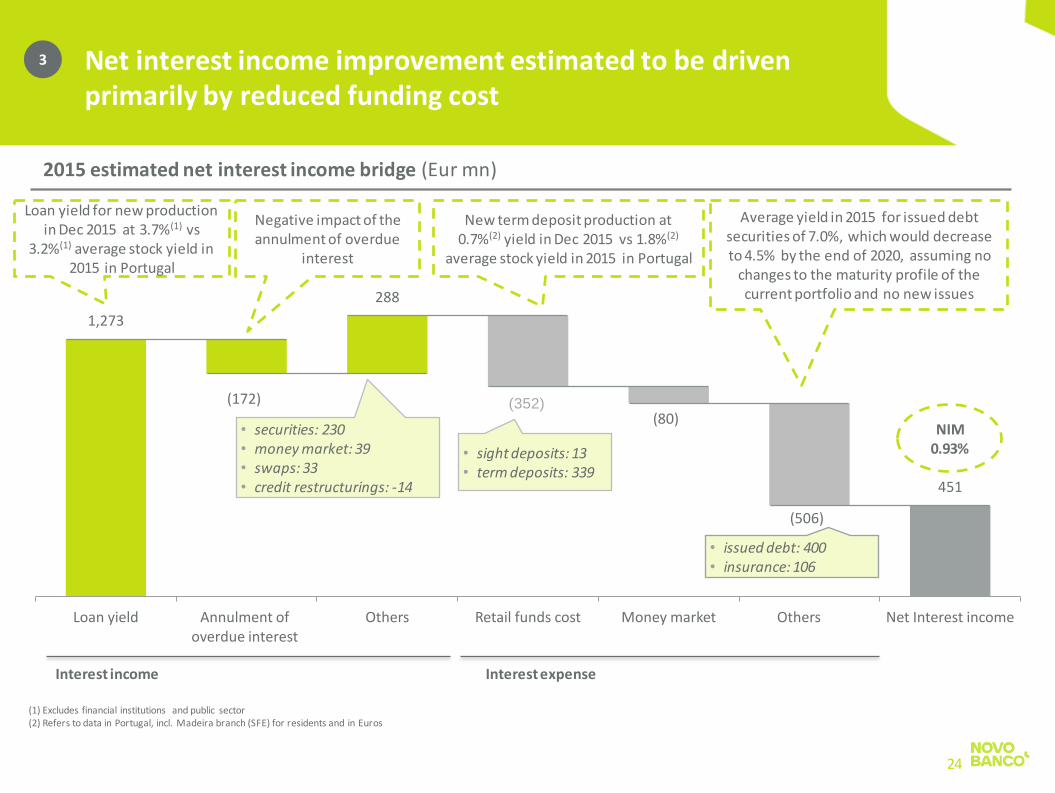
2015 estimated net interest income bridge (Eur mn)
NIM 0.93%
24
Net interest income improvement estimated to be driven primarily by reduced funding cost
3
Loan yield for new production in Dec 2015 at 3.7%(1) vs
3.2%(1) average stock yield in 2015 in Portugal
Negative impact of the annulment of overdue
interest
Average yield in 2015 for issued debt securities of 7.0%, which would decrease to 4.5% by the end of 2020, assuming no
changes to the maturity profile of the current portfolio and no new issues
New term deposit production at 0.7%(2) yield in Dec 2015 vs 1.8%(2)
average stock yield in 2015 in Portugal
• sight deposits: 13 • term deposits: 339
• issued debt: 400 • insurance: 106
(1) Excludes financial institutions and public sector (2) Refers to data in Portugal, incl. Madeira branch (SFE) for residents and in Euros
• securities: 230 • money market: 39 • swaps: 33 • credit restructurings: -14
(352)

3.52% 3.47% 3.27%
3.12% 3.02%
4.91% 4.82%
4.40%
4.19% 3.97%
4Q14 1Q15 2Q15 3Q15 4Q15
Encouraging signals on yields for new lending production…
Customer loan yields(1) (%)
Stock (quarterly average) New production (quarterly average)
Yield on customer loans(1) (%)
25
Stock (average Q4
2015)
New production (average Q4
2015)
Corporate loans 3.59% 3.95%
Mortgages 1.46% 2.50%
Other loans to individuals 5.66% 5.67%
Total 3.02% 3.97%
3
(1) Refers to Portugal only, excludes financial institutions and public sector

… supported by a reduction in deposit costs
2.22%
2.07%
1.83%
1.67% 1.55% 1.52%
1.43%
0.94%
0.77% 0.72%
4Q14 1Q15 2Q15 3Q15 4Q15
6,582
2,940
1,779 1,835 2,029
1.21% 1.51% 1.44%
1.58%
2.30%
1Q16 2Q16 3Q16 4Q16 > 1 year
Term deposit maturities Cost of maturities % of total maturities
43% 19% 12% 12% 13%
Yield on term deposits(1) (%) Maturity profile(1) of term deposits (Eur mn and %)
26
3
(1) Refers to data in Portugal, incl. Madeira branch (SFE) for residents and in Euros
Stock (quarterly average) New production (quarterly average)

27
3 Manageable maturity schedule for wholesale funding
instruments(1)
0.4 0.2
1.0
1.6
2.7
1H16 2H16 2017-2018 2019 >2020
43
0 14
168
120
1H16 2H16 2017-2018 2019 >2020
4.5% 10.4% 1.4% 0.0% 11.0%
Ou
tsta
nd
ing
b
y m
atu
rity
In
tere
st e
xpe
nse
b
y m
atu
rity
C
ost
b
y m
atu
rity
(Eur
mn
) (E
ur b
n)
(%)
(1) Includes debt securities issued
7.3
~6.3
2015 2016
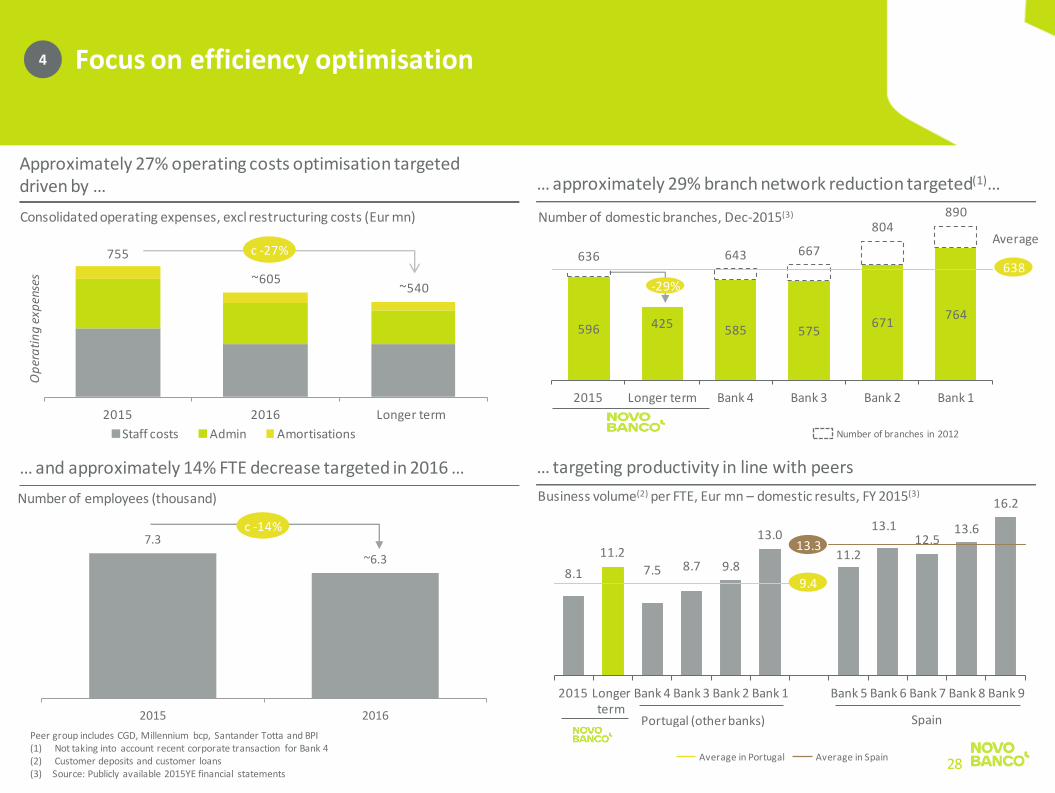
Approximately 27% operating costs optimisation targeted driven by … … approximately 29% branch network reduction targeted(1)…
… and approximately 14% FTE decrease targeted in 2016 … … targeting productivity in line with peers
28
Focus on efficiency optimisation 4
638
Number of domestic branches, Dec-2015(3)
Number of branches in 2012
9.4
13.3
Peer group includes CGD, Millennium bcp, Santander Totta and BPI (1) Not taking into account recent corporate transaction for Bank 4 (2) Customer deposits and customer loans (3) Source: Publicly available 2015YE financial statements
Business volume(2) per FTE, Eur mn – domestic results, FY 2015(3)
c -27%
Consolidated operating expenses, excl restructuring costs (Eur mn)
Number of employees (thousand)
Average in Portugal Average in Spain
Average
c -14%
-29%
755
~605~540
2015 2016 Longer term
Op
era
tin
g e
xpen
ses
Staff costs Admin Amortisations
596 585 575671
764
636
425
643 667
804890
2015 Longer term Bank 4 Bank 3 Bank 2 Bank 1
8.1 7.5 8.7 9.8
13.0
11.2
13.112.5
13.6
16.2
11.2
2015 Longer term
Bank 4 Bank 3 Bank 2 Bank 1 Bank 5 Bank 6 Bank 7 Bank 8 Bank 9
Portugal (other banks) Spain

-
50
100
150
200
250
300
2006 2007 2008 2009 2010 2011 2012 2013 2014 2015
NB Bank 1 Bank 2 Bank 3 Bank 4
Commercial Franchise credit at risk significantly lower than for the group, with strong provision coverage Through the cycle cost of risk of Portuguese banks
Cost of risk normalisation 5
Credit at risk provision coverage
59% 53% 64% 85% 84% Average bps
per bank (2006-2015)
(1) Average of period from 4-Aug-14 to 31- Dec-14 (annualised) and period of 1-Jan-15 to 31-Dec-15 Note: Financials based on latest information available. Peer group includes CGD, Millennium bcp, Santander Totta and BPI. Bank 2 and Bank 4 figures for Portuguese operations only
Commercial Franchise
81
46
136
49
Cre
dit
at
risk
Co
st o
f ri
sk
29
68%
213(1)
13.5%
11.5%
4.5% 4.4%
22.8%
16.9%
Bank 2 Bank 1 Bank 4 Bank 3

2015 actual
Medium term Longer term
Co
mm
erc
ial F
ran
chis
e
Net interest margin(1) (%) ~1.8% >2.0%
Cost/income ratio (%) ~40% <40%
Operating costs (Eur mn)
~520 ~530
Cost of risk(2) (bps) ~120 <100
Sid
e
Ban
k
Total assets (Eur bn) 10.8 ~5.7 ~4.5
Gro
up
Loans/deposits ratio (%) 113% ~95% ~95%
RWA (Eur bn) 38 ~34 ~35
• Management believes uplift in the longer term will be driven by
• normalisation of term deposits cost to the market level (c. ~100bps reduction)
• maturity of high cost debt securities (~250bps reduction)
• loans repricing (~30bps increase in yield)
• Driven by intended FTE reduction and closure of ~170 domestic branches (45% of cost savings in personnel expenses, 45% in SG&A)
• Normalisation of provisions following substantial impairments in 2014 – 2015
Key targets Key drivers
30
Novo Banco: financial targets
1
2
3
1
2
3
Note: 3M Euribor is assumed to increase to 77bps in the longer term (1) Based on average total assets (2) Based on average net loans

31
Appendix Portuguese macro economic overview

32
Significant economic recovery in Portugal
Real GDP growth rate (yoy) Unemployment rate (%) Current account balance (as % of GDP)
Investment in machinery and equipment index (rebased, Q4-13 = 100%) Exports (€bn) Consumer confidence indicator (%)
Source: INE
Source: INE, IMF Source: INE, IMF Source: IMF
Source: IMF Source: INE
12.4
14.7
17.6
15.4 13.9
12.4 11.3 10.9 10.4
2010 2011 2012 2013 2014 2015 2016E 2017E 2018E
(10.2)
(6.0)
(2.0)
1.4 0.6 0.7
2010 2011 2012 2013 2014 2015E
100 100 105 109 112 121
128
131
Q4-13 Q1-14 Q2-14 Q3-14 Q4-14 Q1-15 Q2-15 Q3-15
(30
.9)%
(36
.2)% (2
7.4
)%
(43
.3)%
(41
.3)%
(42
.5)%
(47
.5)%
(50
.0)%
(46
.1)%
(42
.9)%
(49
.6)%
(52
.0)%
(49
.0)%
(45
.7)%
(34
.5)%
(30
.3)%
(24
.8)%
(19
.5)%
(16
.8)%
(17
.6)%
(11
.0)%
(12
.0)%
(10
.5)%
(11
.7)%
Mar
-10
Jun
-10
Sep
-10
Dec
-10
Mar
-11
Jun
-11
Sep
-11
Dec
-11
Mar
-12
Jun
-12
Sep
-12
Dec
-12
Mar
-13
Jun
-13
Sep
-13
Dec
-13
Mar
-14
Jun
-14
Sep
-14
Dec
-14
Mar
-15
Jun
-15
Sep
-15
Dec
-15
38.3 38.8
31.7 37.3
42.8 45.2 47.3 48.1 49.9
2007 2008 2009 2010 2011 2012 2013 2014 2015
1.9
(1.8)
(4.0)
(1.1)
0.9 1.5 1.5 1.4 1.3

Budget deficit and primary balance (as % of GDP) Government debt (as % of GDP)
33
Fiscal consolidation on track in Portugal
Source: INE, Budget 2016 Source: IMF
92101
115 119 120 121 118 117 117
67
7887 90 88
82 79 76 73
148
170
153
172 175
194203 199
193
2010 2011 2012 2013 2014 2015E 2016E 2017E 2018E
Portugal Ireland Greece
(11.2)
(7.4)
(5.7)
(4.8)
(7.2)
(4.4)
(2.2)
(8.2)
(3.1)
(0.8)
(0.0)
(2.3)
0.4
2.4
2010 2011 2012 2013 2014 2015 2016E
Budget deficit Primary balance

Evolution of real estate prices
34
Resilient real estate prices
(1) Values as of 31/01/2005 Source: Bank for International Settlements
5.0%
(2.7)%
31.3%
Change between
2012YE and
2015YE
(19.0)%
(26.6)%
(49.2)%
Change between
2007YE and
2012YE
40
50
60
70
80
90
100
110
120
130
140
2005 2006 2007 2008 2009 2010 2011 2012 2013 2014 2015
Portugal Spain Ireland
2.4%
28.9%
29.5%
Change between
2005(1) and
2007YE