prospectus - cmvmweb3.cmvm.pt/sdi2004/emitentes/docs/fsd14422.pdf1.1 founded in 1896 in basel,...
TRANSCRIPT
PROSPECTUS
dated 26 March, 2009
relating to
the offer of 702,562,700 non-voting equity securities (“Genussscheine”) of
Roche Holding AG
(International Securities Identification Number (“ISIN”) CH0012032048) and the right to purchase such Genussscheine
under the
Roche Genussschein Purchase Plan - Roche Connect (the “Connect Plan”)
to certain employees of Roche Holding AG (the “Company” or “Roche”) and its subsidiaries (together with Roche, the “Group” or the “Roche Group”) in certain member states of the European Economic Area (“EEA”).
See “Risk Factors” in Part 2 of this Prospectus for a discussion of certain risks that should be considered in connection with an investment in the Genussscheine.
Certain terms used in this Prospectus, including all capitalised terms, are defined and explained in Part 8 “Definitions”.

Page 2
CONTENTS
CONTENTS..............................................................................................................................2
PART 1 SUMMARY............................................................................................................5
1. INFORMATION ON ROCHE .......................................................................................5
2. STRATEGY......................................................................................................................5
3. GENENTECH..................................................................................................................6
4. RISK FACTORS..............................................................................................................6
5. SELECTED FINANCIAL INFORMATION................................................................8
6. SUMMARY OF THE CONNECT PLAN .....................................................................9
GERMAN TRANSLATION OF THE SUMMARY / ZUSAMMENFASSUNG ........................12
TEIL 1 ZUSAMMENFASSUNG...........................................................................................12
1. INFORMATIONEN ZU ROCHE................................................................................12
2. STRATEGIE ..................................................................................................................12
3. GENENTECH................................................................................................................13
4. RISIKOFAKTOREN ....................................................................................................14
5. AUSGEWÄHLTE FINANZINFORMATIONEN ......................................................16
6. ZUSAMMENFASSUNG DES CONNECT PLANS ...................................................17
PART 2 RISK FACTORS ..................................................................................................19
PART 3 THE BUSINESS ...................................................................................................27
1. OVERVIEW AND HISTORY......................................................................................27
2. STRATEGY....................................................................................................................28
3. SELECTED FINANCIAL INFORMATION..............................................................29
4. PRINCIPAL ACTIVITIES AND MARKETS............................................................30
PHARMACEUTICALS ................................................................................................30
DIAGNOSTICS..............................................................................................................45
5. PRINCIPAL MARKETS ..............................................................................................55
6. PRINCIPAL INVESTMENTS .....................................................................................55
7. TOTAL RESEARCH AND DEVELOPMENT ..........................................................59
8. EMPLOYEES ................................................................................................................60
9. CURRENT TRADING AND PROSPECTS................................................................60 PART 4 DIRECTORS, EXECUTIVE COMMITTEE AND CORPORATE
GOVERNANCE ...................................................................................................61
1. DIRECTORS AND EXECUTIVE COMMITTEE.....................................................61
2. BIOGRAPHIES OF THE DIRECTORS AND MEMBERS OF THE EXECUTIVE COMMITTEE AND THE ENLARGED EXECUTIVE COMMITTEE .................63
3. CORPORATE GOVERNANCE ..................................................................................78

Page 3
PART 5 OPERATING AND FINANCIAL REVIEW.........................................................80
PART 6 CAPITALISATION AND INDEBTEDNESS .....................................................139
PART 7 ADDITIONAL INFORMATION .......................................................................142
1. INCORPORATION.....................................................................................................142
2. RESPONSIBILITY......................................................................................................142
3. SUMMARY OF CERTAIN PROVISIONS OF THE ARTICLES OF INCORPORATION AND BY LAWS........................................................................142
4. MANDATORY BID RULES ......................................................................................144
5. DIRECTORS’ AND MEMBERS’ OF THE EXECUTIVE COMMITTEE INTERESTS .................................................................................................................145
6. DIRECTORS’ AND MEMBERS OF THE EXECUTIVE COMMITTEES’ TERMS OF EMPLOYMENT ....................................................................................146
7. REMUNERATION OF THE DIRECTORS AND MEMBERS OF THE EXECUTIVE COMMITTEE.....................................................................................153
8. SHAREHOLDINGS ....................................................................................................158
9. RELATED PARTY TRANSACTIONS.....................................................................159
10. SUBSIDIARIES ...........................................................................................................161
11. PRINCIPAL ESTABLISHMENTS ...........................................................................161
12. DIVIDENDS .................................................................................................................164
13. TAXATION..................................................................................................................164
14. LIQUIDITY AND CAPITAL RESOURCES............................................................165
15. FINANCIAL INFORMATION ..................................................................................167
16. WORKING CAPITAL................................................................................................168
17. SIGNIFICANT CHANGES ........................................................................................168
18. EXPENSES...................................................................................................................169
19. PASSPORTING ...........................................................................................................169
20. SELLING RESTRICTIONS ......................................................................................169
21. INFORMATION NOT CONTAINED IN THIS PROSPECTUS ...........................169
22. STATEMENTS REGARDING PRODUCT SALES AND COMPETITIVE POSITION....................................................................................................................169
23. LEGAL AND ARBITRATION PROCEEDINGS....................................................170
24. THE CONNECT PLAN ..............................................................................................174
25. PAYING AND DEPOSITARY AGENT AND EXTERNAL PLAN ADMINISTRATOR.....................................................................................................176
26. EMPLOYEE STOCK OPTIONS AND OTHER EQUITY COMPENSATION BENEFITS....................................................................................................................176
27. INFORMATION REGARDING FORWARD-LOOKING STATEMENTS ........176

Page 4
28. DOCUMENTS AVAILABLE FOR INSPECTION .................................................176
PART 8 DEFINITIONS ...................................................................................................177
ANNEX A CONNECT PLAN REGULATIONS.............................................................178
ANNEX B TERMS AND CONDITIONS OF THE GENUSSSCHEINE......................210
ANNEX C FINANCIAL INFORMATION......................................................................213
CONTENTS……………………..........................................................................................214
AUDITED CONSOLIDATED FINANCIALS STATEMENTS OF THE ROCHE GROUP AS AT AND FOR THE YEAR ENDED 31 DECEMBER 2008 ......................215
AUDITED ACCOUNTS OF ROCHE HOLDING LTD, BASEL FOR THE YEAR ENDED 31 DECEMBER 2008 ...........................................................................................312
AUDITED CONSOLIDATED FINANCIAL STATEMENTS OF THE ROCHE GROUP AS AT AND FOR THE YEAR ENDED 31 DECEMBER 2007 ......................325
AUDITED CONSOLIDATED FINANCIAL STATEMENTS OF THE ROCHE GROUP AS AT AND FOR THE YEAR ENDED 31 DECEMBER 2006 ......................410
SIGNATURES……………………………………………………………………………..487

Page 5
PART 1 SUMMARY
This summary must be read as an introduction to this securities prospectus (the “Prospectus”). Any decision to invest in any Genussscheine should be based on consideration of the Prospectus as a whole. Liability for this summary including any translation thereof attaches to Roche but only if the summary is misleading, inaccurate or inconsistent when read together with the other parts of the Prospectus. Where a claim relating to the information contained in this Prospectus is brought before a court, the plaintiff investor may, under the national legislation of the Member States of the European Economic Area (“EEA”), be required to bear the costs of translating this Prospectus before legal proceedings are initiated.
1. INFORMATION ON ROCHE
1.1 Founded in 1896 in Basel, Switzerland, Roche Holding AG (“Roche” or the “Company”, and together with its subsidiaries, the “Group” or the “Roche Group”) has grown from a small drug laboratory into an international research-based healthcare company. For more than 100 years Roche has been active in the discovery, development, manufacture and marketing of novel healthcare solutions. Roche’s products and services address prevention, diagnosis and treatment of diseases, thus enhancing well-being and quality of life. Roche, led and supported by the group headquarters in Basel, Switzerland employs more than 80,000 people and sells its products in over 150 countries. Roche’s multinational presence reinforces its ability to offer healthcare solutions world-wide and to anticipate needs in all regions of the world.
Divisions
1.2 Roche is divided into two operational sectors: pharmaceuticals and diagnostics. Key pharmaceutical products are in oncology, anaemia, transplantation, virology, and rheumatoid arthritis. Roche’s oncology portfolio is impressive, it markets five medicines for cancer on the market that have been shown to increase patient survival.
Research and Development
1.3 Roche’s focus is not just the diagnosis and treatment of manifest disease but also offering ways of identifying and targeting diseases early, when their damaging effects can still be prevented through vigorous research and development. Global R&D activities are focused on areas of high unmet medical need. Roche’s highly skilled people discover and develop innovative medicines addressing prevention, diagnosis and therapy to offer physicians and patients integrated healthcare solutions. With continuous investment in R&D – in cutting-edge sciences and state-of-the-art technology – Roche does all it can to meet tomorrow’s healthcare needs. Roche believes that it can continue in the future to make innovative contributions to healthcare and provide excellence in the service of health.
2. STRATEGY
Healthcare in the 21st century
2.1 Evolving consumer needs, innovation and market dynamics are likely to be the key drivers of change in healthcare in the years ahead. Despite enormous progress in the fight against disease, there are still many areas of high unmet medical need. And the demand for new and better healthcare products and services is bound to grow as a result of population ageing and other demographic changes. The advances that have occurred in science and technology in recent years clearly have implications for clinical practice, raising hopes that Roche may one day have better treatments for mankind’s most serious diseases, and perhaps even ways of preventing or curing them. But as demand for healthcare grows, so will the pressures to control its costs, which may have the unintended effect of hampering innovation.
A Distinctive Strategy
2.2 Roche’s major divestments over the last several years, most recently the sale of the consumer health business, have been aimed at focusing the Group’s energies entirely on its two innovation-intensive divisions: Pharmaceuticals and Diagnostics. Today’s Roche is a highly focused company, and as a result it is well positioned to be an industry pioneer in healthcare – from predisposition testing and prevention to diagnosis, therapy and treatment monitoring. Roche believes based on data provided by IMS Health Incorporated and/or data published by pharmaceutical companies that it is the market leader in oncology, transplantation and hepatitis and believes that it is a world leader in in vitro diagnostics and diabetes management.

Page 6
2.3 Roche aspires to be distinctive in its ability to drive value creation through the discovery, development and commercialisation of medically differentiated products. More specifically, Roche is pursuing industry leadership in the emerging field of personalised healthcare, which is gaining in importance as advances in areas such as genetic profiling enable earlier diagnosis and facilitate better patient stratification. Because of their clinical and economic benefits, preventive therapies and targeted medicines will appeal not only to consumers but to payers and regulators as well.
2.4 Roche’s pharmaceuticals and diagnostics businesses, including Roche’s majority shareholdings in Genentech and Chugai, are the hub of the Roche innovation network. Because Roche is both a diagnostics and a pharmaceuticals company, Roche can capitalise on broad synergies in research, development and marketing. These capabilities are augmented by technology collaborations and a constellation of alliances to develop individual products and product portfolios.
2.5 Biotechnology is an important factor in Roche’s innovation strategy. Today, biopharmaceuticals account for over half of Group sales.
Creating Value for Today and Tomorrow
2.6 Roche’s business model is focused on creating sustainable value for all Roche’s stakeholders: not just for Roche’s shareholders, but also for patients, Roche’s employees and society at large.
3. GENENTECH
3.1 In July 2008, the Roche Group announced its intention to purchase all of the shares of Genentech not owned by it. Following months of unsuccessful negotiations with the independent directors of Genentech, on 9 February 2009, Roche Investments USA Inc. commenced a cash tender offer for the publicly-held Genentech shares at USD 86.50 per share. On 12 March 2009, Roche entered into a merger agreement with Genentech pursuant to which the Group is making a tender offer to purchase all of the shares of Genentech not owned by the Group for USD 95.00 per share in cash. The tender offer expired at midnight, New York City time, on 25 March 2009. As at the close of the offer on 25 March 2009, 84.7 per cent of the outstanding publicly-held shares of Genentech have been tendered. Roche Investments USA Inc. has accepted for payment all shares validly tendered pursuant to its tender offer. Together with the 55.7 per cent of the outstanding shares already held by Roche, Roche now holds a total of approximately 982.9 million or 93.2 per cent of the 1,054,555,886 Genentech shares outstanding. In addition, a further 3.0 per cent of Genentech’s outstanding shares were guaranteed to be delivered within the next three business days from the closing of the tender offer which, if added to the shares already received in the tender offer and Roche’s existing stake, would represent approximately 96.2% of Genentech’s total outstanding shares. Public shareholders who have tendered their shares will promptly receive USD 95.00 per share for their shares. Pursuant to the merger agreement Roche has caused a short-form merger in which all remaining Genentech stockholders after the tender offer will receive USD 95.00 per Genentech share in cash, subject to stockholders’ statutory appraisal rights. Genentech has become a wholly-owned subsidiary of the Roche Group. Genentech’s common stock will no longer be traded on the New York Stock Exchange after Thursday, 26 March 2009.
3.2 The acquisition of all public shares, including shares issuable under Genentech's outstanding employee stock options and payment of related fees and expenses, costs approximately USD 46.8 billion. The Group has financed the transaction by a combination of the Group's own funds, commercial paper back-stopped by a credit facility, and debt securities. The Group has raised net proceeds of approximately USD 46 billion (based on 20 March 2009 exchange rates) through a series of debt offerings. The series of notes offered to finance the transaction consists of U.S. dollar-denominated notes, Euro-denominated and Sterling-denominated notes, Swiss franc-denominated notes, as well as commercial paper (as of 26 March 2009 a nominal amount of USD 3,250 million).
3.3 On 25 February 2009, Roche completed an offering of U.S. dollar-denominated notes to qualified institutional buyers in the United States under Rule 144A and to persons other than U.S. persons outside the United States under Regulation S of the U.S. Securities Act of 1933. Roche received approximately USD 16,263.7 million in aggregate net proceeds from the issuance and sale of these fixed- and floating-rate notes.
3.4 On 4 March 2009, Roche issued Euro- and Sterling-denominated notes under a European Medium Term Note (EMTN) programme. Roche received approximately EUR 11,176.7 million and GBP 1,237.5 million in
Page 7
aggregate net proceeds from the issuance and sale of these notes. The Euro and Sterling-denominated notes were fixed- and floating-rate senior unsecured notes.
3.5 On 20 March 2009, Roche completed a further offering of U.S. dollar-denominated notes under Rule 144A of the U.S. Securities Act of 1933. Roche received approximately USD 2,499.8 million in aggregate net proceeds from the issuance and sale of these fixed-rate notes.
3.6 The notes mentioned in paragraphs 3.3 to 3.5 are obligations of Roche Holdings, Inc., a wholly-owned subsidiary of Roche Holding Ltd, the ultimate parent company of the Roche Group and the guarantor of the notes.
3.7 On 23 March 2009, Roche Kapitalmarkt AG and Roche Holdings, Inc. completed an offering of Swiss franc-denominated bonds and notes guaranteed by Roche Holding Ltd. Roche received approximately CHF 7,960 million in aggregate net proceeds from the issuance and sale of these fixed-rate bonds and notes.
4. RISK FACTORS
4.1 Roche’s business, results of operations and/or financial condition could suffer from:
● loss of patents or marketing exclusivity or if its patents expire;
● failure through R&D to deliver commercially successful new products;
● the weakness of intellectual property protection in certain countries;
● exposure to litigation (product liability litigation, patent infringement litigation, anti-trust litigation) and government investigations;
● intense competition and potential product substitution;
● pricing controls, pricing pressure, restrictions on reimbursement - governmental and payer;
● regulatory controls;
● interruption of product supply;
● environmental damage/liability;
● employee injuries/damage to health;
● accidents involving hazardous materials;
● loss or restrictions on operating licences, including as a consequence of the occurrence of environment damage/liability, employee injuries/damage to health or accidents involving hazardous materials;
● human resources problems;
● public pressure on the pharmaceutical industry;
● reliance on information technology;
● the ongoing global financial and economic crisis and other changes in global economic conditions and politics which could adversely affect its business and results of operations;
● changes in tax laws adversely affecting the Group’s earnings;
● earthquakes affecting its business and results of operations.

Page 8
4.2 In addition the Group is exposed to various financial risks arising from its underlying operations and corporate finance activities such as:
● foreign exchange risks;
● interest rate risk;
● market risk of financial assets;
● credit risk;
● liquidity risk.
4.3 In addition the Group faces risks related to the acquisition of Genentech’s publicly-held shares such as:
• a limitation of the Group’s operating flexibility as a result of the Group incurring a substantial amount of indebtedness in connection with the proposed acquisition;
• a potential downgrade of Roche’s credit rating;
• the risk that the costs and expenses for the acquisition will be higher than the anticipated;
• the risk that the expected benefits of the acquisition may not be realised because of integration or other challenges.
4.4 In addition there are risks relating specifically to the Genussscheine and the Connect Program:
● the market price of the Genussscheine may be volatile;
● Genussscheine holders in countries with currencies other than the Swiss franc face additional investment risk from currency exchange rate fluctuations;
● Genussscheine holders will generally be ‘locked in’ under the Connect Program for three years;
● Genussscheine holders will be unable to vote at general meetings;
● subscribers to the Connect Plan will be committing themselves to future investments in Genussscheine.
5. SELECTED FINANCIAL INFORMATION
The following selected financial information has been extracted from the audited Consolidated Financial Statements and has been prepared in accordance with International Financial Reporting Standards:
Year ended / as at 31 December 2006 2007 2008
Consolidated Income Statement in millions of CHF
Sales 42,041 46,133 45,617 Operating Profit 11,730 14,468 13,924 Net Income attributable to Roche Shareholders
7,880 9,761 8,969
Research and Development 6,589 8,385 8,845
Consolidated Balance Sheet in millions of CHF
Non-Current Assets 33,519 35,349 37,485
Page 9
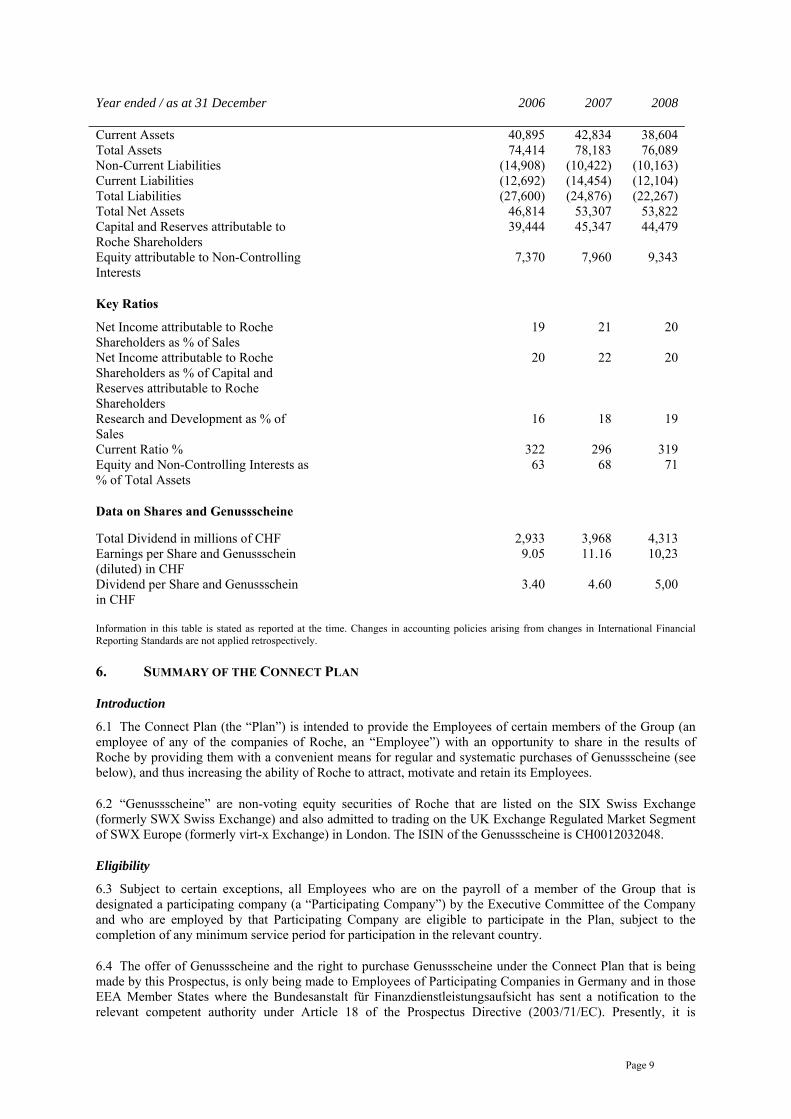
Year ended / as at 31 December 2006 2007 2008
Current Assets 40,895 42,834 38,604 Total Assets 74,414 78,183 76,089 Non-Current Liabilities (14,908) (10,422) (10,163) Current Liabilities (12,692) (14,454) (12,104) Total Liabilities (27,600) (24,876) (22,267) Total Net Assets 46,814 53,307 53,822 Capital and Reserves attributable to Roche Shareholders
39,444 45,347 44,479
Equity attributable to Non-Controlling Interests
7,370 7,960 9,343
Key Ratios
Net Income attributable to Roche Shareholders as % of Sales
19 21 20
Net Income attributable to Roche Shareholders as % of Capital and Reserves attributable to Roche Shareholders
20 22 20
Research and Development as % of Sales
16 18 19
Current Ratio % 322 296 319 Equity and Non-Controlling Interests as % of Total Assets
63 68 71
Data on Shares and Genussscheine
Total Dividend in millions of CHF 2,933 3,968 4,313 Earnings per Share and Genussschein (diluted) in CHF
9.05 11.16 10,23
Dividend per Share and Genussschein in CHF
3.40 4.60 5,00
Information in this table is stated as reported at the time. Changes in accounting policies arising from changes in International Financial Reporting Standards are not applied retrospectively.
6. SUMMARY OF THE CONNECT PLAN
Introduction
6.1 The Connect Plan (the “Plan”) is intended to provide the Employees of certain members of the Group (an employee of any of the companies of Roche, an “Employee”) with an opportunity to share in the results of Roche by providing them with a convenient means for regular and systematic purchases of Genussscheine (see below), and thus increasing the ability of Roche to attract, motivate and retain its Employees.
6.2 “Genussscheine” are non-voting equity securities of Roche that are listed on the SIX Swiss Exchange (formerly SWX Swiss Exchange) and also admitted to trading on the UK Exchange Regulated Market Segment of SWX Europe (formerly virt-x Exchange) in London. The ISIN of the Genussscheine is CH0012032048.
Eligibility
6.3 Subject to certain exceptions, all Employees who are on the payroll of a member of the Group that is designated a participating company (a “Participating Company”) by the Executive Committee of the Company and who are employed by that Participating Company are eligible to participate in the Plan, subject to the completion of any minimum service period for participation in the relevant country.
6.4 The offer of Genussscheine and the right to purchase Genussscheine under the Connect Plan that is being made by this Prospectus, is only being made to Employees of Participating Companies in Germany and in those EEA Member States where the Bundesanstalt für Finanzdienstleistungsaufsicht has sent a notification to the relevant competent authority under Article 18 of the Prospectus Directive (2003/71/EC). Presently, it is

Page 10
expected that such EEA Member States will be Austria, Belgium, the Czech Republic, Denmark, Finland, Greece, Italy, the Netherlands, Norway, Poland, Portugal, Spain, Sweden and the United Kingdom. No offer is being made by this Prospectus to any other persons in any other jurisdiction.
Enrolment in the Connect Plan
6.5 Employees eligible to participate in the Plan will be sent an enrolment form, which will contain details of the plan administrator (the “Plan Administrator”) to whom such enrolment form should be returned. Employees eligible to participate in the Connect Plan must file an enrolment form with the relevant Plan Administrator specified therein between 27 April 2009 and 15 May 2009 (the “Enrolment Period”). The relevant Plan Administrator may, in its sole discretion, but will be under no obligation to, accept enrolment forms filed outside the Enrolment Period.
Contributions
6.6 The enrolment form will permit a participant in the Plan (a “Participant”) to elect a fixed annual rate for contributions in local currency. Generally, the Participant’s annual rate for contributions may not be less than 0.5% of the Participant’s annual base salary and may not exceed 10% of the Participant’s annual base salary. Contributions based on this annual rate will be deducted from a Participant’s base salary on each payday and placed into a “Cash Account” held on behalf of that Participant. In addition, any dividends paid on Genussscheine held in a Participant’s Custody Account (see below) will be credited to that Participant’s Cash Account.
Purchase of Genussscheine
6.7 Once a month, Genussscheine will be purchased on behalf of the Participant by the Plan Administrator using the entire credit balance in the relevant Participant’s Cash Account. Genussscheine so purchased will be deposited in a “Custody Account” held on behalf of that Participant.
6.8 All Genussscheine used for the Plan are purchased in the market by the Plan Administrator. However, Participants do not pay the price that was paid by the Plan Administrator in the market for Genussscheine that are purchased on their behalf. Rather, the average price paid in the market by the Plan Administrator for all Genussscheine purchased in the month is used to determine the purchase price (the “Purchase Price”) that is paid by Participants (and deducted from their Cash Account) for Genussscheine purchased on their behalf. Generally, the Purchase Price will be 80% of the average price paid in the market by the Plan Administrator for Genussscheine, except where the Purchase Price is funded using reinvested dividends, in which case the Purchase Price will be 100% of such average price paid. These percentages are also subject to variation for Participants in certain countries, as set out in the relevant country addenda. Any difference between the price paid in the market by the Plan Administrator for Genussscheine and the Purchase Price applicable to Participants will be funded by Roche.
6.9 The Plan Administrator will ordinarily purchase Genussscheine on the 18thday of each month, or the next trading day following the 18th if the 18th is not a trading day. Participants will be informed of the average market price paid by the Plan Administrator in the month for the Genussscheine allocated to their Custody Account in the quarterly statement referred to in the next paragraph. The Genussscheine will be offered, and the Purchase Price will be determined, on an ongoing basis. Information about the initial Purchase Price will be made available in a printed form for delivery to the public free of charge on 23 July 2009 at the registered office of Roche in Grenzacherstrasse 124, 4058, Basel, Switzerland. Furthermore, Employees of Roche who are eligible for participating in the Connect Plan will be individually informed about the subsequent Purchase Prices on an ongoing basis.
Notification of Total Investment and Number of Genussscheine held
6.10 Participants will be sent a statement on a quarterly basis detailing the total amounts invested by (i) the Participant; (ii) Roche; and (iii) the reinvestment of dividends paid on Genussscheine held in the Participant’s Custody Account, together with the total number of Genussscheine held in the Participant’s Custody Account and the price paid by the Plan Administrator for the purchase of such Genussscheine.
Transferability
6.11 The right to purchase Genussscheine under the Plan is non-tradable and may not be assigned, pledged or transferred.
Page 11
6.12 Generally, Genussscheine acquired under the Plan cannot be transferred or pledged during a “holding period” of three years from their date of purchase. This restriction is generally lifted if a Participant ceases to be employed by Roche for any reason.
Duration
6.13 The Plan may be terminated, amended or suspended by the Executive Committee at any time by the giving of notice to Participants.
Country Addenda
6.14 There are additional terms and conditions for Austria, Belgium Denmark, Finland, Germany, Greece, Italy, the Netherlands, Norway, Portugal, Spain, Sweden and the United Kingdom which are set out in specific country addenda. However, there are no such country addenda for Poland or the Czech Republic.
Further Information
6.15 Employees to whom an enrolment form is sent will be given contact details of a person to whom they can direct queries concerning the Plan, including any country specific rules contained in country addenda as referred to above.

Page 12
GERMAN TRANSLATION OF THE SUMMARY / ZUSAMMENFASSUNG
TEIL 1 ZUSAMMENFASSUNG
Die vorliegende Zusammenfassung ist als Einführung zu diesem Wertpapierprospekt (der "Prospekt") zu verstehen. Anleger sollten daher ihre Entscheidung zur Anlage in die Genussscheine auf die Prüfung des gesamten Prospekts stützen. Roche kann für diese Zusammenfassung, einschließlich jedweder Übersetzungen dieser Zusammenfassung, haftbar gemacht werden, jedoch nur für den Fall, dass die Zusammenfassung irreführend, unrichtig oder widersprüchlich ist, wenn sie zusammen mit den anderen Teilen dieses Prospektes gelesen wird. Für den Fall, dass vor einem Gericht Ansprüche aufgrund der in diesem Prospekt enthaltenen Informationen geltend gemacht werden, könnte der als Kläger auftretende Anleger, die Kosten für die Übersetzung dieses Prospekts in Anwendung der einzelstaatlichen Rechtsvorschriften der Staaten des Europäischen Wirtschaftsraums („EWR“) vor Prozessbeginn zu tragen haben.
1. INFORMATIONEN ZU ROCHE
1.1 Die Roche Holding AG („Roche” bzw. die „Gesellschaft”, und zusammen mit ihren Tochtergesellschaften der "Konzern" oder "Roche-Konzern") wurde 1896 in Basel, Schweiz gegründet und entwickelte sich aus einem kleinen Arzneimittellabor zu einem internationalen, auf Forschung basierenden Unternehmen im Gesundheitssektor. Roche hat sich seit über 100 Jahren aktiv bei der Erforschung, Entwicklung, Herstellung und Vermarktung neuer Lösungen im Bereich des Gesundheitswesens betätigt. Die von Roche angebotenen Produkte und Dienstleistungen zielen auf die Vorbeugung, Diagnose und Therapie von Krankheiten ab und verbessern dadurch den Gesundheitszustand und die Lebensqualität. Unter der Führung und mit der Unterstützung ihres Konzernhauptsitzes in Basel, Schweiz beschäftigt Roche mehr als 80.000 Mitarbeiter und vertreibt seine Produkte in über 150 Ländern. Infolge multinationaler Präsenz ist Roche in der Lage, weltweit Lösungen im Gesundheitsbereich anzubieten und den Bedarf in allen Regionen der Welt frühzeitig zu identifizieren.
Unternehmensbereiche
1.2 Roche ist in zwei Unternehmensbereiche, die Division Pharma und die Division Diagnostics, unterteilt. Die wichtigsten pharmazeutischen Produkte werden in den Bereichen Onkologie, Anämie, Transplantation, Virologie und Gelenkrheumatismus angeboten. Roche kann ein eindrucksvolles Produktportfolio im Bereich Onkologie vorweisen und vertreibt fünf Präparate zur Krebsbehandlung auf dem Markt, die erwiesenermaßen die Überlebensrate der Patienten steigern.
Forschung und Entwicklung
1.3 Roche legt seinen Schwerpunkt nicht nur auf die Diagnose und Behandlung sich bereits manifestierter Krankheiten, sondern bietet auch Möglichkeiten zur frühzeitigen Erkennung und gezielten Behandlung von Krankheiten zu einem Zeitpunkt, wenn deren Auswirkungen noch durch intensive Forschung und Entwicklung verhindert werden können. Die globalen Forschungs- und Entwicklungsaktivitäten haben ihren Schwerpunkt auf Gebieten mit heute noch nicht abgedeckten medizinischen Bedürfnissen. Die hochqualifizierten Mitarbeiter von Roche erforschen und entwickeln innovative Medikamente zur Vorbeugung, Diagnose und Therapie, um Ärzten und Patienten integrierte Gesundheitslösungen anzubieten. Durch laufende Investitionen in die Forschung und Entwicklung - d.h. in modernste Wissenschaften und fortschrittlichste Technologie – unternimmt Roche alles, um den Gesundheitsbedürfnissen von morgen gerecht zu werden. Roche ist davon überzeugt, dass es auch in Zukunft innovative Beiträge zur Gesundheitswesen leisten und herausragende Dienste in diesem Bereich anbieten kann.
2. STRATEGIE
Gesundheitswesen im 21. Jahrhundert
2.1 Veränderte Verbraucherbedürfnisse, Innovation und die Dynamik der Märkte in den kommenden Jahren werden wahrscheinlich die wichtigsten Triebkräfte für den Wandel im Gesundheitssektor sein. Ungeachtet großer Fortschritte im Kampf gegen Krankheiten gibt es weiterhin zahlreiche Gebiete, auf denen noch keine befriedigenden medizinischen Antworten gefunden worden sind. Und dieser Bedarf nach neuen und verbesserten Produkten und Dienstleistungen im Gesundheitswesen wird unweigerlich in Folge einer steigenden Lebenserwartung sowie anderweitiger demografischer Veränderungen weiter zunehmen. Die in den letzten Jahren in Wissenschaft und Technologie erzielten Fortschritte wirken sich deutlich auf die klinische Praxis aus
Page 13
und geben Anlass zu der Hoffnung, dass wir eines Tages möglicherweise über bessere Behandlungsmethoden für die schwerwiegendsten Krankheiten der Menschheit verfügen und vielleicht sogar Wege zur Vorbeugung oder zu ihrer Heilung finden werden.
Eine eigene Strategie
2.2 Das Ziel der wichtigsten Desinvestitionen von Roche in den letzten Jahren, zuletzt der Verkauf des Selbstmedikationsgeschäfts, bestand darin, die gesamten Kräfte des Konzerns auf die beiden innovationsintensiven Geschäftsbereiche Pharma und Diagnostics zu konzentrieren. Roche ist heute ein klar fokussiertes Unternehmen und ist in Folge dessen gut für eine Pionierstellung in der Gesundheitsbranche positioniert – von Prädispositionstests und Vorbeugung bis hin zur Diagnose, Therapie und Behandlungsüberwachung. Roche ist basierend auf den von IMS Health Incorporated und den von anderen pharmazeutischen Unternehmen veröffentlichten Daten der Auffassung, dass der Roche-Konzern marktführend in den Bereichen Onkologie, Transplantation und Virologie ist. Nach Einschätzung von Roche ist zudem der Roche-Konzern weltweit führend in den Bereichen Molekular- und In-vitro-Diagnostik sowie auf dem Gebiet des Diabetes-Managements.
2.3 Roche geht es darum durch die Erforschung, Entwicklung und Vermarktung medizinisch differenzierter Produkte in ganz besonderer Weise zur Wertschöpfung beizutragen. Genauer ausgedrückt strebt Roche eine branchenführende Position in dem neuen Feld der individualisierten Gesundheitsversorgung an, die in dem Maße an Bedeutung gewinnt, wie Fortschritte in Bereichen wie z.B. der Genprofilanalyse, die eine frühzeitigere Diagnose und eine bessere Patientenklassifikation ermöglichen, erzielt werden. Auf Grund ihrer klinischen und wirtschaftlichen Vorteile sind vorbeugende Therapien und gezielte medikamentöse Behandlungen nicht nur für Patienten, sondern auch für Kostenträger und Aufsichtsbehörden von Bedeutung.
2.4 Die Geschäftsbereiche Pharma und Diagnostics stellen einschließlich unserer Mehrheitsbeteiligungen an Genentech und Chugai den Kern des Innovations-Netzwerkes von Roche dar. Da sich Roche als Unternehmen sowohl mit Diagnostik als auch mit Pharmazeutika befasst, kann Roche von umfassenden Synergien bei Forschung, Entwicklung und Marketing profitieren. Diese Kapazitäten werden durch Zusammenarbeit im Bereich Technologie und ein Netz von Allianzen bei der Entwicklung individueller Produkte und Produktportfolios noch gesteigert.
2.5 Biotechnologie ist ein wichtiges Element unserer Innovationsstrategie. Derzeit sind ungefähr die Hälfte der Konzernumsätze auf biotechnologisch hergestellte Pharmazeutika zurückzuführen.
Wertschöpfung für die Gegenwart und die Zukunft
2.6 Das Geschäftsmodell von Roche ist darauf ausgerichtet, nachhaltige Werte für alle Interessengruppen zu schaffen: nicht nur für die Aktionäre von Roche, sondern auch für Patienten, die Mitarbeiter von Roche und die Gesellschaft insgesamt.
3. GENENTECH
3.1 Im Juli 2008 hat der Roche-Konzern bekanntgegeben, alle ihm noch nicht gehörenden Aktien von Genentech erwerben zu wollen. Nach monatelangen Verhandlungen mit den Independent Directors (unabhängige Verwaltungsräte) von Genentech hat Roche Investments USA Inc. am 9. Februar 2009 ein öffentliches Angebot für den Erwerb aller ausstehenden Aktien von Genentech zu einem Preis von US-Dollar 86,50 je Aktie in bar abgegeben. Am 12. März 2009 hat Roche mit Genentech eine Übernahmevereinbarung abgeschlossen, wonach der Konzern ein öffentliches Angebot für den Erwerb aller dem Konzern noch nicht gehörenden Genentech-Aktien für US-Dollar 95,00 je Aktie in bar abgibt. Das öffentliche Angebot endete am 25. März 2009 um 24.00 Uhr (New York Zeit). Bei Angebotsschluss am 25. März 2009 waren 84,7 Prozent der ausstehenden, öffentlich gehaltenen Genentech-Aktien angedient. Die Roche Investments USA Inc. hat alle gemäß ihres Kaufangebotes rechtsgültig angedienten Aktien zur Bezahlung angenommen und damit das öffentliche Angebot beendet. Zusammen mit den 55,7 Prozent der ausstehenden Aktien, die von Roche bereits gehalten wurden, hält Roche nun insgesamt etwa 982,9 Millionen Aktien oder 93,2 Prozent der 1.054.555.886 ausstehenden Genentech-Aktien. Zusätzlich wurde die Lieferung weiterer 3,0 Prozent der ausstehenden Genentech-Aktien innerhalb der nächsten drei Geschäftstage nach Abschluss des öffentlichen Angebots garantiert, was zusammen mit den bereits im Zuge des Kaufangebots eingegangenen Aktien und dem bisherigen Anteil von Roche etwa 96,2 Prozent aller ausstehenden Genentech-Aktien ausmachen würde. Aktionäre, die ihre Aktien angedient haben, werden unverzüglich 95,00 US-Dollar pro Aktie für ihre Anteile erhalten. Gemäß der Übernahmevereinbarung hat Roche eine Fusion in der Form eines Short-form Merger veranlasst, in

Page 14
welchem alle nach dem Übernahmeangebot noch verbleibenden Genentech-Aktionäre einen Betrag von US-Dollar 95,00 in bar je Genentech-Aktie erhalten werden, vorbehaltlich des gesetzlichen Bewertungsrechts der Aktionäre. Genentech ist damit eine hundertprozentige Tochtergesellschaft des Roche-Konzerns. Die Genentech-Aktien werden nach Donnerstag, 26. März 2009 nicht länger an der New Yorker Börse gehandelt.
3.2 Der Erwerb aller verbleibenden Publikumsaktien (einschließlich der aufgrund von Genentech's ausstehenden Mitarbeiteraktienoptionen und für Zahlungen diesbezüglicher Gebühren und Auslagen zu begebenden Aktien) kostet ungefähr USD 46,8 Milliarden. Der Konzern hat die Transaktion durch eine Kombination aus dem Einsatz konzerneigener Mittel, der Ausgabe von Commercial Paper, deren Refinanzierung durch eine Kreditfazilität abgesichert ist, und Schuldverschreibungen finanziert. Der Konzern hat durch eine Serie von Schuldverschreibungsemissionen Reinerlöse von ungefähr US-Dollar 46 Milliarden (basierend auf den Wechselkursen vom 20. März 2009) erzielt. Die zur Finanzierung der Transaktion begebene Serie von Schuldverschreibungen besteht aus auf US-Dollar lautenden Anleihen, auf Euro und Pfund-Sterling lautenden Anleihen, aus auf Schweizer Franken lautenden Anleihen sowie aus Commercial Paper.
3.3 Am 25. Februar 2009 hat Roche ein Angebot von auf US-Dollar lautenden Anleihen an qualifizierte, institutionelle Käufer in den Vereinigten Staaten gemäß Rule 144 A sowie an Personen außerhalb der Vereinigten Staaten, die nicht US-Bürger sind, gemäß Regulation S des U.S. Securities Act von 1933 abgeschlossen. Roche hat aufgrund der Emission und des Verkaufs dieser fest und variabel verzinslichen Anleihen insgesamt einen Reinerlös in Höhe von rund USD 16.263,7 Millionen erzielt.
3.4 Am 4. März 2009 hat Roche Euro- und Pfund-Sterling-Anleihen unter ihrem European Medium Term Note (EMTN) Programm emittiert. Roche hat aufgrund der Emission und des Verkaufs dieser Anleihen insgesamt einen Reinerlös in Höhe von ungefähr EUR 11.176,7 Millionen und GBP 1.237,3 Millionen erzielt. Bei den Euro- und Pfund-Sterling-Anleihen handelt es sich um fest und variabel verzinsliche, nicht nachrangige und unbesicherte Schuldverschreibungen.
3.5 Am 20. März 2009 hat Roche ein weiteres Angebot von auf US-Dollar lautenden Anleihen gemäß Rule 144 A des U.S. Securities Act von 1933 abgeschlossen. Roche hat aufgrund der Emission und des Verkaufs dieser festverzinslichen Anleihen insgesamt einen Reinerlös in Höhe von ungefähr USD 2.499,8 Millionen erzielt.
3.6 Die in den Absätzen 3.3 bis 3.5 genannten Anleihen sind Verbindlichkeiten der Roche Holdings, Inc., einer hundertprozentigen Tochtergesellschaft der Roche Holding AG, der obersten Muttergesellschaft des Roche-Konzerns, die auch Garantiegeberin hinsichtlich der Anleihen ist.
3.7 Am 23. März 2009 haben die Roche Kapitalmarkt AG und die Roche Holdings, Inc. ein Angebot von auf Schweizer Franken lautenden und von der Roche Holding AG garantierten Anleihen abgeschlossen. Roche hat aufgrund der Emission und des Verkaufs dieser festverzinslichen Anleihen insgesamt einen Reinerlös in Höhe von ungefähr Schweizer Franken 7.960 Millionen erzielt.
4. RISIKOFAKTOREN
4.1 Die Geschäfte, Betriebsergebnisse und/oder finanzielle Lage von Roche könnten durch Folgendes beeinträchtigt werden:
● Verlust von Patenten oder der Exklusivität der Vermarktung oder den Ablauf von Patenten;
● keine Schaffung von kommerziell erfolgreichen neuen Produkten durch Forschung und Entwicklung;
● den unzulänglichen Schutz geistigen Eigentums in bestimmten Ländern;
● Rechtsstreitigkeiten (Rechtsstreit auf Grund von Produkthaftung, Verstoß gegen Patentrechte oder Kartellgesetze) und staatliche Ermittlungen;
● intensiven Wettbewerb und potenzielles Ersetzen von Produkten;
● Preisbildungskontrollen, Preisdruck, restriktive Auflagen bei der Rückerstattung – Staat und Kostenträger;

Page 15
● Gesundheitsreform;
● aufsichtsbehördliche Kontrollen;
● Unterbrechung der Produktlieferung;
● umweltbedingter Schadensersatz/Haftung;
● Personenschäden bei Mitarbeitern/gesundheitliche Schäden;
● Unfälle mit gefährlichen Stoffen;
● Verlust bzw. Einschränkung der Betriebserlaubnis, u.a. in Folge des Eintretens umweltbedingter Haftung, Personenschäden bei Mitarbeitern/gesundheitlicher Schäden oder Unfällen mit gefährlichen Stoffen;
● Schwierigkeiten bei der Personalbeschaffung;
● von der Öffentlichkeit auf die pharmazeutische Industrie ausgeübten Druck;
● Abhängigkeit von Informationstechnologie;
● die andauernde globale Finanz- und Wirtschaftskrise sowie weitere Veränderungen der globalen Wirtschaftsbedingungen und Politik, die sich auf das Geschäft und die Betriebsergebnisse auswirken könnte.
● Änderung der Steuergesetze mit negativer Auswirkung auf die Konzernerträge;
● Erdbeben, die sich auf das Geschäft und die Betriebsergebnisse auswirken.
4.2 Darüber hinaus unterliegt der Konzern diversen finanziellen Risiken, die sich aus den ihm zugrunde liegenden Betrieben und betrieblichen finanziellen Aktivitäten ergeben wie z.B.:
● Wechselkursrisiken;
● Zinsrisiko;
● Marktrisiko für finanzielle Vermögenswerte;
● Kreditrisiko;
● Liquiditätsrisiko.
4.3 Zudem bestehen für den Konzern Risiken im Zusammenhang mit dem geplanten Erwerb aller ausstehenden Aktien von Genentech wie z.B.
• eine Einschränkung der Handlungsmöglichkeiten des Konzerns aufgrund einer erheblichen Kreditaufnahme des Konzerns im Zusammenhang mit dem geplanten Erwerb aller ausstehenden Aktien von Genentech;
• eine mögliche Herabstufung des Kreditrating von Roche;
• das Risiko, dass die Kosten und Aufwendungen für den Erwerb sehr viel höher ausfallen als erwartet;
• das Risiko, dass der erwartete Nutzen der Akquisition sich aufgrund Intergrations- oder sonstiger Schwierigkeiten nicht realisiert.

Page 16
4.4 Des Weiteren bestehen Risiken insbesondere im Zusammenhang mit den Genussscheinen und dem Connect Programm:
● der Marktpreis der Genussscheine kann Schwankungen unterliegen;
● Inhaber von Genussscheinen in Ländern mit anderen Währungen als Schweizer Franken sind auf Grund von Wechselkursschwankungen einem weiteren Anlagerisiko ausgesetzt;
● Inhaber von Genussscheinen sind im Allgemeinen zu einer dreijährigen Teilnahme am Connect Programm verpflichtet;
● Inhaber von Genussscheinen können nicht bei Generalversammlungen abstimmen;
● mit Zeichnung verpflichten sich die Teilnehmer des Connect Planes zu zukünftigen Anlagen in Genussscheine.
5. AUSGEWÄHLTE FINANZINFORMATIONEN
Die nachfolgenden ausgewählten Finanzinformationen stellen einen Auszug aus den geprüften Konzernabschlüssen dar und sind gemäß International Financial Reporting Standards erstellt worden:
Zum Jahresende /Stand 31. Dezember 2006 2007 2008
Gewinn- und Verlustrechnung des Konzerns in Millionen CHF
Verkäufe 42,041 46,133 45,617 Betriebsgewinn 11,730 14,468 13,896 Inhabern von Roche-Inhaberaktien und Genussscheinen zuzurechnende Nettoerträge
7,880 9,761 8,969
Forschung und Entwicklung 6,589 8,385 8,845
Konzernbilanz in Millionen CHF
Anlagevermögen 33,519 35,349 37,485 Umlaufvermögen 40,895 42,834 38,604 Gesamtvermögen 74,414 78,183 76,089 Langfristige Verbindlichkeiten (14,908) (10,422) (10,163) Kurzfristige Verbindlichkeiten (12,692) (14,454) (12,104) Gesamtverbindlichkeiten (27,600) (24,876) (22,267) Nettovermögen insgesamt 46,814 53,307 53,822 Inhabern von Roche-Inhaberaktien und Genussscheinen zuzurechnendes Kapital und Rücklagen
39,444 45,347 44,479
Nicht-beherrschende Anteile
7,370 7,960 9,343
Wesentliche Kennzahlen
Inhabern von Roche-Inhaberaktien und Genussscheinen zuzurechnender Konzerngewinn in % der Verkäufe
19 21 20
Inhabern von Roche-Inhaberaktien und Genussscheinen zuzurechnender Konzerngewinn in % des den Inhabern von Roche-Inhaberaktien und Genussscheinen zuzurechnenden Kapitals und Rücklagen
20 22 20
Forschung und Entwicklung in % der Verkäufe 16 18 19 Current ratio in % 322 296 319 Eigene Mittel und nicht-beherrschende Anteile in % des Gesamtvermögens
63 68 71

Page 17
Zum Jahresende /Stand 31. Dezember 2006 2007 2008
Angaben zu Aktien und Genussscheinen
Dividenden insgesamt in Millionen CHF 2,933 3,968 4,313 Erträge je Aktie und Genussschein (verwässert) in CHF
9.05 11.16 10,23
Dividenden je Aktie und Genussschein in CHF
3.40 4.60 5,00
Die in dieser Tabelle enthaltenen Informationen basieren auf den Angaben zum Zeitpunkt des Berichts. Änderungen der Rechnungslegungsgrundsätze auf Grund von Änderungen der International Financial Reporting Standards - IFRS (Internationale Standards zur Rechnungslegung) finden keine rückwirkende Anwendung.
6. ZUSAMMENFASSUNG DES CONNECT PLANS
Einleitung
6.1 Der Connect Plan (der „Plan”) soll bestimmten Mitarbeitern eines Unternehmens des Konzerns (ein Mitarbeiter von irgendeinem Unternehmen von Roche ein "Mitarbeiter) Gelegenheit verschaffen, an den Ergebnissen von Roche teilzuhaben, indem diesen eine passende Möglichkeit zum regelmäßigen und systematischen Erwerb von Genussscheinen (siehe unten) geboten wird, wodurch Roche besser in der Lage ist, Mitarbeiter zu gewinnen, zu motivieren und an sich zu binden.
6.2 „Genussscheine” sind nicht stimmberechtigte Eigenkapitalwertpapiere von Roche, die an der Schweizer Börse SIX Swiss Exchange (vormals SWX) notiert und auch zum Handel an dem im Vereinigten Königreich regulierten Marktsegment der SWX Europe (vormals virt-x Exchange) in London zugelassen sind. Die ISIN der Genussscheine lautet CH0012032048.
Teilnahmeberechtigung
6.3 Alle Mitarbeiter, die auf der Gehaltsliste eines Konzernunternehmens stehen, das von dem Exekutivausschuss der Gesellschaft als teilnehmendes Unternehmen („teilnehmendes Unternehmen”) vorgesehen ist und die bei jenem teilnehmenden Unternehmen angestellt sind, sind vorbehaltlich gewisser Ausnahmen zur Teilnahme an dem Plan berechtigt, mit der Maßgabe, dass sie eine Mindestdienstzeit vollendet haben, die Voraussetzung zur Teilnahme in dem jeweiligen Land ist.
6.4 Das Angebot für Genussscheine und das Recht zum Erwerb von Genussscheinen gemäß dem Connect Plan, das durch diesen Prospekt unterbreitet wird, ergeht ausschließlich an Mitarbeiter von teilnehmenden Unternehmen mit Sitz in Deutschland und in jenen Mitgliedstaaten des Europäischen Wirtschaftsraums, in denen die Bundesanstalt für Finanzdienstleistungsaufsicht gemäß Artikel 18 der Prospektrichtlinie (2003/71/EG) der entsprechenden zuständigen Behörde eine Benachrichtigung zugesandt hat. Derzeit wird davon ausgegangen, dass es sich bei diesen Mitgliedstaaten des Europäischen Wirtschaftsraums um Österreich, Belgien, die Tschechische Republik, Dänemark, Finnland, Griechenland, Italien, die Niederlande, Norwegen, Polen, Portugal, Spanien, Schweden und das Vereinigte Königreich handeln wird. Durch diesen Prospekt ergeht kein Angebot an andere Personen in einer anderen Rechtsordnung.
Beitritt zum Connect Plan
6.5 Mitarbeiter, die zur Teilnahme an dem Plan berechtigt sind, wird ein Beitrittsformular zugesandt, welches Einzelheiten zu dem Verwalter des Plans („Verwalter des Plans“) enthält, an den das betreffende Beitrittsformular zurückgeschickt werden muss. Zur Teilnahme an dem Connect Plan berechtigte Mitarbeiter müssen in der Zeit vom 27. April 2009 bis 15. Mai 2009 bei dem hierin angegebenen Verwalter des Plans ein Beitrittsformular einreichen (die „Beitrittsfrist”). Der betreffende Verwalter des Plans kann in seinem alleinigen Ermessen (ohne jedoch hierzu verpflichtet zu sein) Beitrittsformulare, die außerhalb der Beitrittsfrist eingereicht werden, annehmen.
Beitragszahlungen
6.6 Mit dem Beitrittsformular kann ein Teilnehmer an dem Plan (ein „Teilnehmer”) einen festen Jahressatz für Beitragszahlungen in der Landeswährung auswählen. Im Allgemeinen darf der Jahressatz für Beitragszahlungen nicht weniger als 0,5% des jährlichen Grundgehalts des Teilnehmers betragen und darf 10% des jährlichen

Page 18
Grundgehaltes des Teilnehmers nicht überschreiten. Die auf diesem Jahressatz basierenden Beitragszahlungen werden an jedem Zahltag vom Grundgehalt des Teilnehmers abgezogen und in ein für diesen Teilnehmer geführtes „Barkonto“ eingezahlt. Darüber hinaus werden alle ausgeschütteten Dividenden für Genussscheine, die in einem Depotkonto eines Teilnehmers gehalten werden (siehe unten), werden dem Barkonto dieses Teilnehmers gut geschrieben.
Erwerb von Genussscheinen
6.7 Genussscheine werden einmal im Monat vom Verwalter des Plans für den Teilnehmer unter Verwendung des gesamten, auf dem Barkonto des jeweiligen Teilnehmers befindlichen Guthabens erworben. Die auf diese Weise erworbenen Genussscheine werden auf einem „Depotkonto” verwahrt, das für den Teilnehmer geführt wird.
6.8 Alle für den Plan verwendeten Genussscheine werden von dem Verwalter des Plans im Markt erworben. Teilnehmer zahlen jedoch nicht den Preis, der vom Verwalter des Plans auf dem Markt für Genussscheine, die für sie gekauft wurden, gezahlt wurde. Stattdessen wird der durchschnittliche, vom Verwalter des Plans für alle in einem Monat gekauften Genussscheine am Markt entrichtete Preis verwendet, um den Kaufpreis (der „Kaufpreis”) zu ermitteln, den die Teilnehmer für in ihrem Auftrag erworbene Genussscheine zahlen (und der von ihrem Barkonto abgezogen wird). Im Allgemeinen beträgt der Kaufpreis 80% des vom Verwalter des Plans auf dem Markt für Genussscheine gezahlten durchschnittlichen Preises, außer wenn der Kaufpreis unter Verwendung reinvestierter Dividenden bezahlt wird; in einem solchen Fall beträgt der Kaufpreis 100% des gezahlten durchschnittlichen Preises. Diese Prozentangaben unterliegen auch Abweichungen für Teilnehmer in bestimmten Ländern, wie dies in den jeweiligen Ergänzungen für die betreffenden Länder angegeben ist. Alle Differenzen zwischen dem vom Verwalter des Plans für Genussscheine auf dem Markt bezahlten Preis und dem für Teilnehmer geltenden Kaufpreis werden von Roche übernommen.
6.9 Der Verwalter des Plans kauft gewöhnlich Genussscheine am 18. Tag jedes Monats oder am nächsten auf den 18. folgenden Handelstag, wenn der 18. kein Handelstag ist. Die Teilnehmer werden über den von dem Verwalter des Plans für die ihrem Depotkonto zugeteilten Genussscheine in einem Monat gezahlten durchschnittlichen Marktpreis in dem vierteljährlichen Kontoauszug informiert, auf den im folgenden Absatz eingegangen wird. Die Genussscheine werden fortlaufend öffentliche angeboten und der Kaufpreis wird fortlaufend festgesetzt. Informationen über den anfänglichen Verkaufspreis werden in gedruckter Form zur kostenlosen Ausgabe an das Publikum am 23. Juli 2009 am Sitz von Roche, Grenzacherstrasse 124, 4058 Basel, Schweiz bereitgehalten. Darüber hinaus werden Mitarbeiter von Roche, die an dem Connect Plan teilnehmen können, individuell und fortlaufend über nachfolgende Kaufpreise informiert.
Mitteilung über die insgesamt gehaltenen Anlagen und Anzahl der Genussscheine
6.10 Die Teilnehmer erhalten vierteljährlich einen Kontoauszug, in welchem die Gesamtbeträge angegeben sind, die wie folgt angelegt sind: (i) von dem Teilnehmer; (ii) von Roche und (iii) durch Wiederanlage von Dividenden, die für die in dem Depotkonto des Teilnehmers gehaltenen Genussscheine gezahlt wurden, sowie die Gesamtzahl der in dem Depotkonto des Teilnehmers gehaltenen Genussscheine und der von dem Verwalter des Plans für den Erwerb dieser Genussscheine gezahlte Preis.
Übertragbarkeit
6.11 Das Recht auf den Erwerb von Genussscheinen gemäß dem Plan ist nicht handelbar und darf nicht abgetreten, verpfändet oder übertragen werden.
6.12 Genussscheine, die gemäß dem Plan erworben wurden, können während eines „Besitzzeitraums“ von drei Jahren ab dem Zeitpunkt ihres Erwerbs grundsätzlich weder übertragen noch verpfändet werden. Diese Beschränkung wird im Allgemeinen aufgehoben, wenn ein Teilnehmer nicht mehr in einem Angestelltenverhältnis zu Roche steht, gleich aus welchem Grund.
Laufzeit
6.13 Der Plan kann jederzeit von dem Exekutivausschuss durch Mitteilung an die Teilnehmer gekündigt, geändert oder ausgesetzt werden.
Page 19
Länderanhänge
6.14 Es bestehen zusätzliche Bedingungen für Österreich, Belgien, Dänemark, Finnland, Deutschland, Griechenland, Italien, die Niederlanden, Norwegen, Portugal, Spanien, Schweden und das Vereinigte Königreich. Derartige Länderanhänge existieren jedoch nicht für Polen und die Tschechische Republik.
Weitere Informationen
5.15 Mitarbeiter, denen ein Beitrittsformular zugesandt wird, erhalten genaue Kontaktinformationen zu der Person, an die sie sich bei Fragen zu dem Plan wenden können, einschließlich aller länderspezifischen Regeln, die in den oben erwähnten länderspezifischen Ergänzungen enthalten sind.

Page 20
PART 2 RISK FACTORS
Any investment in the Company’s Genussscheine is subject to a number of risks. Prior to investing in the Genussscheine, employees should consider carefully the risks attaching to any investment in the Company’s Genussscheine, the Group’s business and the industry in which it operates, together with all other information contained in this Prospectus including, in particular, the risk factors described below. Additional risks and uncertainties relating to the Group that are not currently known to the Company may also have an adverse effect on the Company’s business, financial condition and operating results. If this occurs the price of the Genussscheine may decline and employees could lose all or part of their investment. Employees should consider carefully whether an investment in the Company’s Genussscheine is suitable for them in light of the information in this Prospectus and their personal circumstances.
Business Risks
Risk that Research & Development will not deliver Commercially Successful New Products
Continued development of commercially viable new products is critical to the Group’s ability to replace sales of older products that decline upon expiration of exclusive rights, and to increase overall sales. Developing new products is a costly, lengthy and uncertain process. A new product candidate can fail at any stage of the process, and one or more late-stage product candidates could fail to receive regulatory approval. New product candidates may appear promising in development but, after significant investments, fail to reach the market or have only limited commercial success for a variety of reasons, e.g. efficacy or safety concerns, inability to obtain necessary regulatory approvals, difficulty or excessive costs to manufacture, infringement of patents or other intellectual property rights of others or inability to differentiate the product adequately from those with which it competes.
Risk of Loss or Expiration of Patents or Marketing Exclusivity
Patent Infringement Litigation
Efforts by generic manufacturers may involve challenges to the validity of a patent or assertions that the alternative compounds do not infringe the Group’s patents. If the Group is not successful during the patent protection or data exclusivity periods in maintaining exclusive rights to market one or more of its major products, the Group’s turnover and margins would be adversely affected.
Generic drug manufacturers may seek to market generic versions of many of the Group’s products, including prior to the expiration of the Group’s patents, and have exhibited a readiness to do so for other products in the future. The risk that Roche’s products are substituted by generic versions also applies to so-called ‘biosimilars’ for which there is a level of uncertainty with regard to the viability and scope of the related patent protection.
Weakness of Intellectual Property Protection in certain Countries
In some of the countries in which the Group operates, patent protection may be significantly weaker than in Switzerland, the USA or the European Union. In addition, in an effort to control public health crises, some developing countries, such as South Africa and Brazil, have considered plans for substantial reductions in the scope of patent protection for products. In particular, these countries could facilitate competition within their markets from generic manufacturers who would otherwise be unable to introduce competing products for a number of years. Any loss of patent protection, including abrogation of patent rights or compulsory licensing, is likely to affect adversely the Group’s operating results in those national markets. Roche has decided not to file patents and will not enforce patent rights in the least developed countries as a matter of its socially responsible management in attempt to increase access to medicine in these countries. Absence of adequate patent protection could limit the opportunity to look to such markets for future sales growth.
Risk of Substantial Adverse Outcome of Litigation and Government Investigations
Unfavourable resolution of proceedings and governmental investigations in which the Group is currently involved and similar future proceedings or investigations may have a material adverse effect on the Group’s results. The Group has made material provisions in 2008, 2007 and 2006 related to legal proceedings and investigations which reduced its earnings. The Group may also make additional significant provisions related to legal proceedings and investigations in the future, which would reduce its earnings.
The Group is selective in taking out insurance for various insurable risks based on an economic assessment of the related insurance cost. If significant risks materialise that are not covered by insurance, then such risks may affect the Group’s business, results or financial condition.

Page 21
Product Safety and Efficacy
Pre-clinical and clinical trials are conducted during the development of potential products to determine the safety and efficacy of products for use by humans following approval by regulatory bodies. Notwithstanding these efforts, when drugs and vaccines are introduced into the marketplace, unanticipated side effects may become evident. Such observations may necessitate change in labelling and marketing or even product withdrawal. Such events may also give rise to litigation against the Group.
Anti-Trust Litigation
In the USA it has become increasingly common that following an adverse outcome in prosecution of patent infringement actions, the defendants and direct and indirect purchasers and other payers initiate anti-trust actions as well. Claims by direct and indirect purchasers and other payers are typically filed as class actions and the relief sought may include treble damages and restitution claims. Damages in adverse anti-trust verdicts are subject to automatic trebling in the USA.
Governmental Investigations
The Group operates globally in complex legal and regulatory environments that often vary among jurisdictions. The failure to comply with applicable laws, rules and regulations in these jurisdictions may result in civil and criminal legal proceedings. Such proceedings may result in trebling of damages awarded or fines in respect of each violation of law. Criminal proceedings may also be initiated against Group companies or individuals.
Risks of Competition and Substitution
The Group operates in highly competitive businesses. In the pharmaceuticals business, it faces competition both from proprietary products of large international manufacturers and producers of generic pharmaceuticals. Significant product innovations and substitution, technical advances or the intensification of price competition by competitors could adversely affect the Group’s operating results. Continued consolidation and co-operation in the pharmaceutical industry could adversely affect the Group’s competitive position, while continued consolidation and co-operation among the Group’s customers may increase pricing pressures.
The diagnostics business is also highly competitive and Roche encounters competition from several international manufacturers.
If any of the Group’s major products were to become subject to a problem such as loss of patent protection, unexpected side effects, regulatory proceedings, publicity affecting doctor or patient confidence or pressure from competitive products, or if a new, more effective product should be introduced, the adverse impact on the Group’s revenues and operating results could be significant.
Generic products often enter the market upon expiration of patents or data exclusivity periods for the Group’s products. Introduction of generic products typically leads to a dramatic loss of sales and reduces the Group’s revenues and margins for its proprietary products.
Pricing and Reimbursement: Governmental and Payer Controls
Pharmaceutical products are subject to price controls or pressures and other restrictions in many markets. Some governments intervene directly in setting prices. In addition, in some markets major purchasers of pharmaceutical products (whether governmental agencies or private health care providers) have the economic power to exert substantial pressure on prices or the terms of access to formularies. The growth in the number of patients covered through large managed care institutions may also increase pricing pressure on the Group’s products. Changes to government reimbursement policies could reduce the funding that healthcare service providers have available for diagnostic and pharmaceutical product expenditures, which could have a material adverse impact on Roche’s sales and/or profit margin.
The Group cannot predict whether existing controls will increase or new controls will be introduced that will reduce the Group’s margins or affect adversely its ability to introduce new products profitably. Changes in the healthcare market could also force Roche to alter Roche’s approach to selling, marketing, distributing and servicing Roche’s customer base.
Regulatory Controls
The Group must comply with a broad range of regulatory controls on the testing, approval, manufacturing and marketing of many of its pharmaceutical and diagnostic products, particularly in the USA and countries of the European Union, that affect not only the cost of product development but also the time required to reach the market and the uncertainty of successfully doing so.

Page 22
Stricter regulatory controls also heighten the risk of withdrawal by regulators of approvals previously granted, which would reduce revenues and can result in product recalls and product liability lawsuits. In addition, in some cases the Group may voluntarily cease marketing a product or face declining sales based on concerns about efficacy or safety, whether or not scientifically justified, even in the absence of regulatory action. The development of the post-approval adverse event profile for a product or the product class may have a major impact on the marketing and sale of the product.
Risk of Interruption of Product Supply
The products Roche market, distribute and sell are either manufactured at Roche’s own dedicated manufacturing facilities, or through toll manufacturing arrangements or supply agreements with third parties. Since many of Roche’s products are the result of technically complex manufacturing processes, and are sometimes dependent on highly specialised raw materials or regulatory approval, Roche can provide no assurances that supply sources will not be interrupted. In addition, for these same reasons, the volume of production of any product cannot be rapidly altered. As a result, if Roche should fail to accurately predict market demand for any of Roche’s products then Roche may not be able to produce enough of the product to meet that demand, or may produce too much of the product, either of which could affect Roche’s business and operating results.
The manufacture of pharmaceutical products and their constituent materials requires compliance with good manufacturing practice regulations. The Group’s manufacturing sites are subject to review and approval by the U.S. Food and Drug Administration (“FDA”) and other regulatory agencies. Compliance failure by suppliers of key materials or the Group’s own manufacturing facilities could lead to product recalls and seizures, interruption of production and delays in the approvals of new products pending resolution of manufacturing issues. Non-compliance can also result in fines and disgorgement of profits. Any interruption of supply or fines or disgorgement remedy could materially and adversely affect the Group’s financial results. While the Group undertakes business continuity planning, single sourcing for certain components, bulk active materials and finished products creates a risk of failure of supply in the event of regulatory non-compliance or physical disruption at the manufacturing sites.
Risks from the Handling of Hazardous Materials, and Environmental Damage and Waste could negatively impact Roche’s Operating Results
Roche’s operations are subject to the operating risks associated with pharmaceutical and chemical manufacturing, including the related risks associated with processing, storage and transportation of raw materials, products and wastes. These risks include, among other things, the following hazards:
● pipeline and storage tank leaks and ruptures;
● fires and explosions;
● injuries and damage to Roche’s employees’ health;
● malfunction and operational failure; and
● releases, discharges or disposal of toxic and/or hazardous substances resulting from these or other causes.
These operating risks have the potential to cause personal injury (including to Roche’s employees), property damage and environmental contamination, which may result in the shutdown of affected facilities, loss of or restrictions to operating licences, business interruption, the imposition of criminal penalties and civil liabilities in respect of employees’ health/injuries (including by way of class action) and environmental damage, and generally may negatively impact the reputation of the Company. The occurrence of any of these events may significantly reduce the productivity and profitability of the affected manufacturing facility and harm Roche’s operating results. Furthermore, Roche’s property damage, business interruption and casualty insurance policies may not be adequate to cover fully all potential hazards incidental to Roche’s business.
The environmental laws of many jurisdictions impose actual and potential obligations on Roche to remediate contaminated sites. These obligations may relate to sites:
● that Roche acquire, own or operate;
● that Roche formerly owned or operated;
● where waste from Roche’s operations was disposed; or

Page 23
● that are affected by Roche’s operations (for example by contamination of soil, air or water).
These environmental remediation obligations could significantly reduce Roche’s operating results. In particular, Roche’s financial accruals for these obligations may be insufficient if the assumptions underlying the accruals — including Roche’s assumptions regarding the portion of the waste at a site for which Roche is responsible-prove incorrect, or if Roche is held responsible for additional contamination.
Stricter environmental, safety and health laws and enforcement policies could result in substantial costs and liabilities to Roche, and could subject Roche’s handling, manufacture, use, reuse or disposal of substances or pollutants to more rigorous scrutiny than is currently the case. Consequently, compliance with these laws could result in significant capital expenditures as well as other costs and liabilities, thereby harming Roche’s business and operating results.
Human Resources
The Group has more than 80,000 employees around the world and is subject to laws and regulations concerning its employees — including discrimination and harassment, personal privacy, labour relations and working conditions — that vary significantly from jurisdiction to jurisdiction. Changes in such laws and regulations can increase compliance costs and failure to comply with applicable requirements could have a significant adverse affect on the Group. To sustain growth and innovation, the Group is dependent on there being sufficient employees with adequate skills available in the labour market. Unfavourable developments in the labour market could adversely affect the Group.
Public Pressure on the Pharmaceuticals Industry could affect Roche’s Business and Results of Operations.
There is considerable public sentiment against the pharmaceutical industry, and the industry is under the close scrutiny of the public and the media. In addition there is significant pressure on Roche’s industry from certain disadvantaged nations and non-governmental groups to make Roche’s products available to their people at drastically lower costs. Any increase in such negative public sentiment or increase in public scrutiny or pressure from such disadvantaged nations could lead, among other things, to changes in legislation, to changes in the demand for Roche’s products, additional pricing pressures with respect to Roche’s products, or increased efforts to undercut intellectual property protections. Such changes could affect Roche’s business and results of operations.
Reliance on Information Technology
The Group is increasingly dependent on information technology systems, including Internet-based systems, for internal communication as well as communication with customers and suppliers. Any significant disruption of these systems, whether due to computer viruses or other outside incursions, could materially and adversely affect the Group’s operations.
Changes in Global Economic Conditions and Politics could affect the Group’s Business and Results of Operations.
Roche’s future results could be affected by global economic and political changes. The ongoing global economic crisis and related recessionary conditions in many countries where the Group does business could affect sales of the Group’s pharmaceuticals and diagnostics in those markets, as the ability of patients and payors (such as health insurance plans) to pay for these products could be adversely impacted. These and other effects of recent global economic conditions could adversely affect the Group’s business and financial performance.
In the recent past, terrorist attacks have had an impact on global economic conditions. Any additional terrorist attacks which may occur in the future, and any significant military activity around the world, could have a similar impact, which could affect adversely the Group’s business and results of operations.
Changes in Tax Laws could adversely affect the Group’s Earnings.
Changes in the tax laws of the countries in which Roche does significant business, as well as changes in Roche’s effective tax rate for the fiscal year caused by other factors, including changes in the interpretation of tax law by local tax officials, could affect Roche’s net income. It is not possible to predict the impact on Roche’s results of any tax legislation which may be enacted in the future.
Earthquakes could affect Roche’s Business and Results of Operations.
Roche’s corporate headquarters and certain of Roche’s major production facilities are located near major earthquake fault lines in Basel, Switzerland, San Francisco, USA and Tokyo, Japan. In the event of a major

Page 24
earthquake, Roche could experience business interruptions, destruction of facilities and/or loss of life, all of which could materially adversely affect Roche.
Financial Risks
The Group is exposed to various financial risks arising from its underlying operations and finance activities. The Group’s financial risk exposures are predominantly related to changes in foreign exchange rates, interest rates and equity prices as well as the creditworthiness and the solvency of the Group’s counter-parties.
The Group actively measures, monitors and manages its financial risk exposures by various functions pursuant to segregation of duties principles and in accordance with its financial policies. Failure in compliance or in managing these risks in the dynamics of the financial markets may have an adverse effect on the financial results or condition of the Group.
Foreign Exchange Risk
The Group operates across the world and is exposed to movements in foreign currencies affecting its net income and financial position, as expressed in Swiss francs.
Transaction Exposure arises because the amount of local currency paid or received for transactions denominated in foreign currencies may vary due to changes in exchange rates. For many Group companies revenues and operating expenses are primarily in the local currency. Similarly, transaction exposure arises on net balances of monetary assets held in foreign currencies. This may have an adverse effect on net income and/or net assets.
Translation Exposure arises from the consolidation of the foreign currency denominated financial statements of the Group’s foreign subsidiaries.
A significant part of the Group’s cash outflows for research, development, production and administration is denominated in Swiss francs, while a much smaller proportion of the Group’s cash inflows are Swiss franc denominated. As a result, an increase in the value of the Swiss franc relative to other currencies has an adverse impact on consolidated net income.
Interest Rate Risk
Interest rate risk arises from movements in interest rates which could have negative effects on the Group’s net income or financial position. Changes in interest rates may cause variations in interest income and expenses resulting from interest-bearing assets and liabilities. In addition, they can affect the market value of certain financial assets, liabilities and instruments as described in the following section on market risk of financial assets.
Market Risk of Financial Assets
Changes in the market value of certain financial assets and derivative instruments can negatively affect the net income or financial position of the Group.
Credit Risk
Credit risk arises from the possibility that the counter-party to a transaction may be unable or unwilling to meet their obligations causing a financial loss to the Group.
Liquidity Risk
Group companies need sufficient availability of cash to meet their obligations. If group or individual companies’ cash flow is insufficient to meet such obligations, this may increase borrowing costs, which may reduce net income. In addition, it is possible that Roche may, in the future, borrow (more) money (including prolongations of existing debt) and raise (more) fundings on commercially less favourable terms and conditions than in the past.
Risks in connection with the acquisition of Genentech’s publicly-held shares
Specific risks associated with the proposed acquisition of Genentech’s publicly-held shares
On 12 March 2009, Roche entered into a merger agreement with Genentech pursuant to which the Group is making a tender offer to purchase all of the shares of Genentech not owned by the Group for USD 95.00 per share in cash. The tender offer expired on 25 March 2009. As at the close of the offer on 25 March 2009, 84.7 per cent of the outstanding publicly-held shares of Genentech have been tendered. Roche Investments USA Inc. has accepted for payment all shares validly tendered pursuant to its tender offer and closed the tender offer. Together with the 55.7 per cent of the outstanding shares already held by Roche, Roche now holds a total of

Page 25
approximately 982.9 million or 93.2 per cent of the 1,054,555,886 Genentech shares outstanding. In addition, a further 3.0 per cent of Genentech’s outstanding shares were guaranteed to be delivered within the next three business days from the closing of the tender offer which, if added to the shares already received in the tender offer and Roche’s existing stake, would represent approximately 96.2% of Genentech’s total outstanding shares. Public shareholders who have tendered their shares will promptly receive USD 95.00 per share for their shares.
The total amount required to consummate the transaction contemplated by the merger agreement is approximately USD 46.8 billion.
The Group faces risks in connection with the acquisition of Genentech’s publicly-held shares, including, among others, the following:
• In connection with Roche’s announcement of the Genentech offer, several credit rating agencies, including Moody’s Investor Service, Inc. have placed Roche’s credit rating on negative watch and/or have indicated that Roche’s credit rating will be downgraded if it completes the Genentech transaction. The effect of any credit rating downgrade would be to increase Roche’s and the Group’s costs of borrowing in future.
• Genentech recently entered into severance and retention programs for substantially all of its officers and employees, which could result in higher costs to the Group as a result of completion of the Genentech transaction.
• Uncertainty or negative perceptions regarding the acquisition or the combined company's business and prospects could harm relationships with Genentech’s employees and have a negative impact on employee morale as well as Genentech’s ability to hire and retain key employees, any of which could have an adverse impact on Genentech’s or the combined company’s ability achieve its strategic and financial objectives.
The Group has incurred a substantial amount of indebtedness in connection with the acquisition of the publicly-held shares of Genentech, which could limit its operating flexibility
The Group is financing the transaction by using a combination of the Group’s own funds and debt. A substantial portion of the cost of the proposed Genentech transaction has been financed by the issuance of bonds and notes by the Group in the aggregate amount of USD 46 billion (based on 20 March 2009 exchange rates) and with maturities between six months and 30 years and coupons between 1.2% and 7% (in case of fixed rate debt instruments) and of LIBOR/EURIBOR plus 95 to 200 bp (in case of floating rate debt instruments). Additional debt financing includes the issuance of commercial paper (as of 26 March 2009 amount of USD 3,250 billion).
The substantial increase in the Group’s debt could limit its operating flexibility, including, among others, in the following respects:
• A higher portion of the Group’s cash flow from operations must be dedicated to debt service on indebtedness, reducing the available funds to the Group for other purposes; and
• the Group’s higher levels of indebtedness may impair its ability to adjust to changing market conditions or withstand competitive pressures.
The expected benefits of such transaction may not be realised, in the timeframe anticipated or at all, because of integration or other challenges.
Achieving the expected benefits of the transaction will depend on the timely and efficient integration of Genentech’s operations, business culture, technology and personnel with the Group. The integration may not be completed as quickly as expected. If the Group fails to effectively integrate the companies or the integration takes longer than expected, the Group may not achieve the expected benefits of the transaction. The challenges involved in this integration include, among others:
• potential disruption on the Group’s ongoing business;
• distraction of management;
• loss of key employees or customers of Genentech;
• conforming Genentech’s standards, processes, procedures and controls with the Group’s operations;
• hiring additional management and other critical personnel; and
• increasing the scope, geographic diversity and complexity of the Group’s operations.
Risks relating to the Genussscheine and the Connect Program
The Market Price of the Genussscheine may be Volatile

Page 26
The market price of the Genussscheine may be volatile in response to various factors, many of which are beyond Roche’s control. The key factors are the following:
• actual or anticipated fluctuations in Roche’s results or financial condition;
• market expectations of Roche’s financial performance;
• changes in the estimates of Roche’s results by analysts;
• the entrance of new competitors or new products in the markets in which Roche operates; and
• the factors mentioned in this section of the Prospectus.
The market price of the Genussscheine may be adversely affected by any of the preceding or other factors regardless of Roche’s actual results of operations and financial condition.
Genussscheine Holders in Countries with Currencies other than the Swiss Franc face Additional Investment Risk from Currency Exchange Rate Fluctuations
Roche Genussscheine are quoted only in Swiss francs and any future payments of dividends on Roche’s Genussschein will be denominated in Swiss francs. The local currency equivalent of any dividends paid on Genussscheine or received in connection with any sale of any Genussscheine could be adversely affected by the appreciation of the Swiss franc against other currencies.
Genussscheine Holders will generally be ‘locked in’ under the Connect Program for Three Years
Holders of Genussscheine that have been purchased under the Connect Program will generally be unable to sell or transfer those Genussscheine during a holding period of at least three years after their purchase date. Therefore, Genussscheine holders will be unable to sell or transfer their Genussscheine if, for instance the market value of Genussscheine falls, until the expiry of this holding period.
Genussscheine do not carry Voting Rights and if the Holders of Shares take Actions that are not in the Best Interests of Genussscheine Holders, it may harm the Value of any Investment in Genussscheine.
Genussscheine do not carry voting rights that are exercisable at General Meetings and therefore, Genussscheine holders are unable to vote on resolutions that might affect the Company and, as a consequence, the value of the Genussscheine.
Subscribers under the Connect Plan commit themselves to investing a certain Amount of their Income in Genussscheine. They must consider their Individual Constraints on Disposable Income as well as the Factors mentioned in this part of the Prospectus to assess the Investment Risk in Genussscheine under the Connect Plan.

Page 27
PART 3 THE BUSINESS
1. OVERVIEW AND HISTORY
Overview
Roche is a leading healthcare company with a uniquely broad spectrum of innovative solutions. For more than 100 years, Roche has been active in the discovery, development, manufacture and marketing of novel healthcare solutions. Roche’s products and services address prevention, diagnosis and treatment of diseases, thus enhancing well-being and quality of life.
Roche’s focus is not just the diagnosis and treatment of manifest diseases. The integrated healthcare approach is increasingly offering ways of identifying and targeting diseases early, when their damaging effects can still be prevented.
Arranged in two operative divisions, Roche’s global mission today and tomorrow is to create exceptional added value in healthcare. These two divisions are Pharmaceuticals and Diagnostics.
History
Roche was founded by Fritz Hoffmann-La Roche on 1 October 1896. In 1897, subsidiaries in Germany and Italy were established. In 1903, a subsidiary was established in France. In 1905 the first New York subsidiary was established, and the first UK and Russian subsidiaries followed in 1908 and 1910, respectively. In 1919 Roche was transformed into a limited liability company. From 1920 to 1952, Roche saw a steady growth in its international business and by 1938, vitamins were the company’s mainstay. Corporate growth took place during these years in Europe, South America and the Far East, creating a large trading and production network.
Between the mid 1950s and 1960s, pharmaceutical research at Roche was extremely diverse and there were important developments in the field of tranquillisers. During this period, Roche was also busily pursuing a course of acquisitions entering new business fields such as flavours and fragrances. Between 1965 and 1978, Roche diversified into markets spanning the whole spectrum of healthcare, and the diagnostic arm of Roche was established. This was also the beginning of Roche’s involvement in basic biomedical research. The move towards separate business units began in the mid 1970s when Roche was divided into three divisions: pharmaceuticals, vitamins and fine chemicals, and diagnostics.
In 1990 Roche acquired a major interest in Genentech, a leader in the field of genetic engineering, and conducted a takeover of Syntex Corporation, a research oriented company, which strengthened Roche’s position in the global healthcare market. Later in the 1990s, Roche purchased Nicholas, a non-prescription medicine producer and Boehringer Mannheim, a diagnostic company. In 1999, Roche acquired the remaining shares in Genentech of which 42% were subsequently floated in a public offering on the New York Stock Exchange. At the start of the new millennium, Roche formed an alliance with Chugai in Japan to create a leading research driven Japanese pharmaceutical company. The merged company, known as Chugai, is a fully consolidated subsidiary of the Group. In 2001, Novartis International Ltd became a major shareholder in Roche (see page 159 of this Prospectus for more details) and Roche Diagnostics acquired Amira. In 2002 the vitamins and fine chemicals business was sold, enabling Roche to concentrate on its core pharmaceuticals and diagnostic businesses. In 2003, Disetronic and Igen were acquired by Roche. In 2004, Roche sold its Consumer Health business to Bayer. In 2007 Roche acquired four US companies: 454 Life Sciences, Therapeutic Human Polyclonals, Inc., BioVeris, NimbleGen Systems, Inc, and Genentech acquired a 100% controlling interest in the US company Tanox, Inc. In 2008 Roche acquired the US companies Ventana Medical Systems, Inc. (now also known as Roche Tissue Diagnostics) and Mirus Bio Corporation (now renamed Roche Madison Inc.), the UK privately owned biotechnology company Piramed Ltd., a 100% controlling interest in the Canadian publicly owned biotechnology company ARIUS Research Inc. and completed its acquisition of the German-based company Swisslab GmbH, a provider of laboratory information systems. In October 2008 Roche sold its wholly-owned subsidiary Cenexi SAS, including the manufacturing facility in Fontenay-sous-Bois, France. Following a merger agreement and successful tender offer, in January 2009 Roche fully acquired US-based Memory Pharmaceuticals Corp., which develops innovative drug candidates for the treatment of debilitating central nervous system disorders such as Alzheimer‘s desease and schizophrenia, in an all-cash transaction at a price of approximately CHF 48 million. On 16 March 2009 Roche has signed a definite agreement under which Roche will acquire 100% of innovatis AG, a privately held company based in Bielefeld, Germany, which is a provider of automated cell analysis solutions, especially focussing on cell counting, viability testing, and cell function analysis in research, as well as bioproduction. The purchase price is EUR 15 million. The transaction is expected to be completed within the next few weeks, subject to shareholder approval and regulatory clearance.

Page 28
2. STRATEGY
Responding to demographic challenges
Despite significant advances in medicine, the need for innovative new products to diagnose and treat disease is greater than ever. One reason for this is demographic – the fact that the world’s population is growing and ageing. As life expectancy increases, so does the incidence of age-related diseases such as cancer, Alzheimer’s, diabetes and rheumatoid arthritis. These and other diseases are already placing an ever greater financial burden on healthcare systems. Another factor is that today people are better informed about medical advances and available treatments than they used to be. Well-informed patients and patient organisations can and do influence medical decision-making in ways that add to the overall demand for healthcare services. As a result, there is mounting political pressure to control health spending more effectively. Increasingly, this is also an issue in developing countries, where healthcare systems are massively under-resourced and many patients cannot afford to pay for treatment themselves.
To stay competitive in an increasingly cost-sensitive marketplace, research-based healthcare companies like Roche aim to develop products with economic as well as clinical benefits. Medicines that extend patients’ lives or reduce costly complications and side effects can deliver both. And so can diagnostic tests that help physicians detect diseases earlier and choose the most appropriate therapies for their patients the first time around. This leads to better and more cost-effective outcomes for both patients and healthcare providers.
Focusing on innovation in therapeutics and diagnostics
Roche's focus is on two research-intensive businesses: pharmaceuticals and diagnostics. Within these businesses Roche prioritises those areas of significant unmet need where Roche has the expertise to make a difference. Roche's aim is to develop new and improved drugs, diagnostic tests and services offering significant benefits over existing options. For this reason, Roche invests heavily in research and development – 8.8 billion Swiss francs in 2008 alone – and Roche will continue to do so in future.
The clinical return on this investment has been impressive. Roche supplies a wide range of rapid, reliable instruments and tests for disease screening and diagnosis in laboratories, at the point of care in hospitals and doctors’ offices, and for patient self-management. In therapeutics Roche's achievements include developing five anticancer medicines which have been shown to prolong patients’ lives. These medicines represent significant advances in a therapeutic area which for decades saw little real progress.
Research network spurs innovation
Roche's innovation model relies on the drug and diagnostics research of its own operating divisions augmented by a global collaborative R&D network. Within the Group, Roche's majority-owned subsidiaries Genentech in the United States and Chugai in Japan operate largely independently. This encourages a greater diversity of ideas and approaches, increasing the chances of bringing new products to patients.
To make sure Roche has broad access to new technologies and products of interest, Roche also maintains a host of scientific and commercial collaborations with external biotech companies, universities and research organisations around the world. Identifying and investing in important emerging technologies is critical for ensuring the future strength of Roche's product pipeline. Recent investments include the acquisitions of Ventana Medical Systems Inc. (now also known as Roche Tissue Diagnostics), Piramed Ltd, Mirus Bio Corporation (now renamed Roche Madison Inc.) and ARIUS Research Inc. in 2008 as well as an alliance giving Roche access to Alnylam’s RNAi technologies and the acquisitions of 454 Life Sciences, BioVeris Corporation and NimbleGen Systems, Inc., all completed in 2007.
The acquisition of Ventana Medical Systems Inc. in February 2008 enabled Roche to move into the fast-growing market for tissue-based diagnostics and strengthen Roche's capabilities for developing companion diagnostic tests. These make it possible to assess or predict patients’ responses to particular medicines so that drug therapy can be tailored more specifically, effectively and cost-efficiently to individual patients’ needs.
In early 2007 Roche Pharmaceuticals realigned its global research and development activities around five new organisational units known as Disease Biology Areas (DBAs): Oncology, Virology, Inflammation, Metabolism and Central Nervous System. Each DBA covers all activities from research and development to strategic marketing in a particular therapeutic field. By enhancing the flow of information and streamlining decision-making, this realignment will support the efforts of Roche to efficiently translate research activity into clinically differentiated medicines.

Page 29
Personalised healthcare – a key element of Roche’s strategy
Two patients can have the same diagnosis yet respond in dramatically different ways to the same medicine. One patient may be helped by treatment, while the other experiences unwanted side effects without the desired clinical benefit. Some of this variability is due to genetic and other biological differences between patients. The idea of personalised medicine is to use insights into these differences at the molecular level to develop treatments and tests tailored to the needs of specific patient populations.
Being one of the first companies to recognise the potential of personalised healthcare (PHC), today personalised healthcare is central to the Group’s strategy.
The approach of personalised healthcare is to use new molecular insights and molecular diagnostic tests to better tailor medicines and better manage diseases. Roche aims at tailoring medicine as closely as possible to patients’ needs.
Over the last few years, Roche has provided various examples of how interweaving diagnostic and pharmaceutical expertise paves the way for personalised healthcare. Examples of Roche's current PHC portfolio are, for instance, in the area of oncology, measuring the presence of a growth factor (HER2) in breast cancer with specific tests such as the one supplied by Roche Tissue Diagnostics (Ventana Medical Systems Inc.) which identifies patients who are likely to respond to Herceptin, a therapy that specifically targets this growth factor or, with respect to colorectal cancer, the K-RAS Mutation Test which identifies tumor-specific mutations that are on indication of disease prognosis in patients with colorectal cancer. Some drugs used to treat colorectal and other cancers are only indicated for patients who do not carry mutations. Thus, the test helps doctors in identifying patients who will benefit from a specific cancer therapy based on their mutation status.
Personalised healthcare has enormous potential to make healthcare better, safer and more cost-effective. It will still take some time before the potential of personalised healthcare is fully realised, but the market is clearly shifting away from ‘one size fits all’ products. Roche sees it as a key enabler helping the Group increase the success rate in drug development and bring more clinically differentiated medicines to patients. Therefore, Roche is actively pursuing PHC and has made it one of the cornerstones of its strategy of innovation.
Creating sustainable value for all stakeholders
Roche's focus is on enduring success. This can only be achieved by adopting and adhering to sustainable business practices. Roche recognises that it must manage all aspects of its business – whether economic, ethical, social or environmental – in a responsible way. One factor that is vital to the Company’s long-term prosperity is the ability to recruit and retain the best people.
Looking beyond the financial bottom line, Roche strives to identify and address the societal, environmental and other management issues of greatest importance to Roche's stakeholders.
Roche makes the greatest contribution to a sustainable future by developing clinically differentiated healthcare products that meet the needs of patients, healthcare providers, payers and society.
3. SELECTED FINANCIAL INFORMATION
The following selected financial information has been extracted from the audited Consolidated Financial Statements and has been prepared in accordance with IFRS:
Year ended / as at 31 December 2006 2007 2008
Consolidated Income Statement in millions of CHF
Sales 42,041 46,133 45,617 Operating Profit 11,730 14,468 13,924 Net Income attributable to Roche shareholders
7,880 9,761 8,969
Research and Development 6,589 8,385 8,845
Consolidated Balance Sheet in millions of CHF
Non-Current Assets 33,519 35,349 37,485 Current Assets 40,895 42,834 38,604 Total Assets 74,414 78,183 76,089

Page 30
Year ended / as at 31 December 2006 2007 2008
Non-Current Liabilities (14,908) (10,422) (10,163) Current Liabilities (12,692) (14,454) (12,104) Total Liabilities (27,600) (24,876) (22,267) Total Net Assets 46,814 53,307 53,822 Capital and Reserves attributable to Roche Shareholders
39,444 45,347 44,479
Equity attributable to Non-Controlling Interests
7,370 7,960 9,343
Key Ratios
Net Income attributable to Roche Shareholders as % of Sales
19 21 20
Net Income attributable to Roche Shareholders as % of Capital and Reserves attributable to Roche Shareholders
20 22 20
Research and Development as % of Sales
16 18 19
Current Ratio % 322 296 319 Equity and Non-Controlling Interests as % of Total Assets
63 68 71
Data on Shares and Genussscheine
Total Dividend in millions of CHF 2,933 3,968 4,313 Earnings per Share and Genussscheine (diluted) in CHF
9.05 11.16 10,23
Dividend per Share and Genussscheine in CHF
3.40 4.60 5,00
Information in this table is stated as reported at the time. Changes in accounting policies arising from changes in International Financial Reporting Standards are not applied retrospectively.
4. Principal Activities and Markets
PHARMACEUTICALS
Overall Results1 The Pharmaceuticals Division maintained its strong performance throughout 2008, with solid growth of the underlying business more than compensating for the expected sharp decline in pandemic sales of Tamiflu to governments and corporations. Divisional sales increased 5% in local currencies (-2% in Swiss francs; 8% in US dollars) to 36.0 billion Swiss francs.2 Excluding pandemic sales of Tamiflu, pharmaceutical sales grew 10% in local currencies, or around twice the global market growth rate – the sixth double-digit increase in as many years. Growth was driven primarily by key products in the division’s oncology, inflammation and transplant, virology and metabolism/bone portfolios. On the same basis, the division recorded above-market growth in all key regions. The division’s sales performance is broadly based: in 2008 nine products generated annual turnover of more than 1 billion Swiss francs each, three of which achieved sales of over 5 billion francs each.
In 2008 the Pharmaceuticals Division’s operating profit advanced even faster than sales, rising 8% in local currencies (0% in Swiss francs) to 13.0 billion Swiss francs. The corresponding margin increased 0.7 percentage 1 The financial information contained in Annex C and in this Part 3 is as reported at the date the relevant financial statements were
published. Please note that there have been a number of changes in IFRS and Roche’s accounting policies from 2006 to 2008. Accordingly, the financial information contained in a particular year’s financial statements may not be fully comparable with the financial information contained in an earlier or later year’s financial statements due to changes in IFRS and Roche’s accounting policies.
2 Unless otherwise stated, all growth rates are in local currencies.

Page 31
points to 36.2% compared with 2007 despite significantly lower Tamiflu pandemic sales and increased investments in research and development.
As in 2006, in 2007 the Pharmaceuticals Division continued its strong, above-market performance. Sales for the full year rose 11% in local currencies and 10% in Swiss francs (15% in US dollars) to 36.8 billion Swiss francs, around twice the global market growth rate (6%). Excluding pandemic stockpiling sales of Tamiflu to governments and corporations, pharmaceutical sales grew 13% for the year. Regional sales growth significantly outpaced the market average in North America (15% vs 5%) and Europe (10% vs 7%). In Japan, at 3%, sales development was slightly below market growth.
The major growth drivers were key products in the oncology, transplantation, metabolism/bone and virology franchises, as well as Genentech’s ophthalmology medicine Lucentis. The division’s operating profit advanced 22% in local currencies to 13.0 billion Swiss francs, and the operating margin 3.8 percentage points to 35.5%. Sales growth and higher royalty and other operating income more than compensated for – in particular – substantially higher research and development expenses, with significant investments in Roche's strong pipeline reflecting the expanded portfolio and large number of late-stage clinical trials. EBITDA3 totalled 14.7 billion francs or 40.0% of sales, compared with 36.5% in 2006.
The Pharmaceuticals Division set new records in 2006. Sales for the full year rose 21% in local currencies and 22% in Swiss francs (21% in US dollars) to 33.3 billion Swiss francs – 6 billion francs more than 2005 and over three times the global market growth rate. Roche has now outperformed the global pharmaceuticals market every quarter for the last four years. Regional sales growth significantly outpaced the market average in North America (27% vs 8%) and Europe (22% vs 5%). In Japan sales declined 1%, in line with the market average, due to government mandated price cuts and healthcare reimbursement changes.
Overall, growth was driven primarily by strong demand for the division's key oncology products, the influenza medicine Tamiflu, Genentech’s ophthalmology drug Lucentis, and the osteoporosis medicine Bonviva/Boniva.
The division’s operating profit before exceptional items advanced 40% to 10.5 billion Swiss francs, and the operating margin 4.1 percentage points to 31.7%. The margin increase was the result of the strong sales growth combined with further productivity improvements, particularly in manufacturing. These factors more than outweighed significantly higher investments in marketing and distribution, and research and development. EBITDA totalled 12.2 billion Swiss francs or 36.5% of sales, compared with 33.3% in 2005.
Therapeutic areas Oncology
Introduction
According to the latest International Agency for Research on Cancer (IARC) estimate, in 2008 over 12 million people worldwide were diagnosed with cancer, and some 7.6 million died of the disease. The IARC anticipates that cancer will surpass heart disease as the leading cause of death worldwide in 2010 and also forecasts that by 2030 there will be over 26 million new cases and 17 million deaths per year from cancer. In Europe alone, one in three people can expect to develop cancer in their lifetime. Cancer is not one disease but a group of more than 100 distinct disorders, each with its own medical challenges.
Based on data provided by IMS Health Incorporated and/or data published by pharmaceutical companies, Roche believes that in 2008 the Roche Group continued to strengthen its position as the world’s leading supplier of medicines to treat cancer. Sales of the Pharmaceuticals Division’s oncology portfolio (main products: MabThera/Rituxan, Herceptin, Avastin, Tarceva, Xeloda, NeoRecormon, Kytril, Neutrogin, Neupogen, Bondronat, Roferon-A, Furtulon, Vesanoid) rose 15% to 19.7 billion Swiss francs for the year, or 55% of total pharmaceutical sales, with all key brands contributing double-digit growth. Just as importantly, the Group advanced key development programmes and filed marketing applications aimed at making more effective treatment options available to doctors and cancer patients or expanding the range of conditions for which innovative medicines such as MabThera/Rituxan, Avastin, Herceptin, Tarceva and Xeloda can be prescribed.
Sales of the Roche Group’s oncology portfolio grew by 20% in 2007 and accounted for 50% of pharmaceutical sales. Excluding supportive care products, combined sales of cancer therapeutics rose 23%, increasing the Roche Group’s share of the global market for cancer medicines to just under 30%.
3 Earnings before financial income, financing costs, tax, depreciation and amortisation, including impairment.

Page 32
In 2006 sales of the Roche Group’s oncology portfolio grew by 37% and accounted for 46% of pharmaceutical sales.
Non-Hodgkin’s lymphoma (NHL) and Chronic lymphocytic leukemia (CLL)
Non-Hodgkin’s lymphoma (NHL), a group of over 30 cancers that affect the lymphatic system, has grown in incidence by 80% since the early 1970s. This class of cancer currently affects over 1.5 million people worldwide.
Chronic lymphocytic leukaemia (CLL) is the most common type of leukemia in adults, accounting for approximately 25–30% of all forms of leukemia. The incidence of CLL in Western countries is around 2–4 per 100,000, and it is twice as common in men as in women.
MabThera/Rituxan (rituximab) is, in the opinion of Roche, the leading treatment for patients with non-Hodgkin’s lymphoma (NHL) and the first and only selective B cell therapy approved for the treatment of rheumatoid arthritis. In 2008 combined sales of the product in the oncology and inflammation/autoimmune segments grew 16% versus the prior-year period to 5.9 billion Swiss francs. Strong to solid growth was recorded in Europe/Rest of World (RoW)4 (19%), the US (14%) and Japan (10%). Growth in oncology is being driven by sustained expansion in the use of MabThera/Rituxan for induction and maintenance therapy of NHL and improved access in emerging markets for all approved indications.
During the year 2008 Roche and Genentech and Biogen Idec achieved important milestones in the ongoing development of MabThera/Rituxan. In January 2009 Roche announced results of a major phase III trial (CLL8) of MabThera as first-line treatment for chronic lymphocytic leukemia (CLL). The study showed that combined treatment with MabThera and the current standard chemotherapy achieved significantly better outcomes than chemotherapy alone. Roche used these data to support an application, filed in July 2008, to add this new indication to the medicine’s EU marketing authorisation. On 27 February 2009 the EU Commission has approved MabThera in this indication. In December 2008 Roche received approval in Switzerland for MabThera as initial (first-line) treatment in certain patients with CLL.
In October 2008 a study of MabThera/Rituxan in patients with relapsed or refractory CLL (REACH) met its primary endpoint, demonstrating that patients treated with MabThera combined with the current standard chemotherapy showed a significant improvement in progression-free survival (the time patients live without their cancer getting worse) compared with those who received chemotherapy alone. These data formed the basis for a regulatory filing in the EU for this indication, submitted by Roche in January 2009. The results of both CLL8 and REACH were presented at the American Society of Hematology annual meeting in December 2008. Genentech and Biogen Idec are evaluating the data from both trials and expect to submit supplementary Biologic License Applications for these indications in the US by the third quarter of 2009.
MabThera/Rituxan (rituximab) maintained strong sales growth throughout 2007. Increases were driven by the use of MabThera for maintenance treatment in follicular lymphoma, the most common form of indolent lymphoma, as well as first-line treatment for indolent forms of the disease in all markets, particularly in Europe and other countries except Japan and the United States. This growth was supported by strong uptake of first-line treatment of patients with aggressive NHL in emerging markets. In January 2008 the European Commission approved an application filed by Roche in July 2007 to extend the product’s existing first-line indolent lymphoma indication to include the use of MabThera with any chemotherapy combination. The expanded indication made treatment with MabThera available to a wider group of patients across Europe.
Sales of MabThera/Rituxan continued to advance strongly throughout 2006. Growth was supported by increased use of the product as first-line treatment for both forms of the disease, particularly in Europe and emerging markets such as Russia and Latin America. High treatment rates with Rituxan in the US were maintained through-out the year. In July 2006 Roche received EU regulatory approval to market MabThera for maintenance therapy of relapsed or refractory follicular NHL, the most common form of indolent NHL. In the US Genentech received marketing approvals for three additional indications for Rituxan, including treatment of previously untreated follicular lymphoma.
Colorectal Cancer and Kidney Cancer
Colorectal cancer – cancer of the large intestine or rectum – accounts for over 1 million new cases (around 10% of all newly diagnosed cancers) worldwide each year. It is the second most common cause of cancer deaths in Europe and the third most common worldwide.
4 Roche defines Europe/Rest of World as covering Europe and all other countries except Japan and the United States.

Page 33
Kidney cancer is a type of cancer that is newly diagnosed in around 200,000 people and causes 100,000 deaths worldwide every year, rates that are expected to increase. Renal cell carcinoma accounts for 90% of all kidney cancers.Avastin (bevacizumab) is the first targeted anti-angiogenic therapy to demonstrate overall and/or progression-free survival benefits in patients with advanced colorectal, breast, lung and kidney cancer. Avastin inhibits the growth of blood vessels into tumours, thus cutting off the blood supply tumours need to grow and spread.
Global sales of Avastin rose strongly throughout 2008, advancing 37% to 5.2 billion Swiss francs, with all key regions contributing. Dynamic sales growth in Europe/RoW (67%) was driven primarily by increased use of the medicine for metastatic colorectal and breast cancer. Sales in Europe also benefited from the rollout of new indications and increasing uptake for non-small cell lung cancer and renal cell carcinoma. In the United States solid double-digit growth continued (17%), driven primarily by increased use in metastatic non-small cell lung and metastatic breast cancer following accelerated approval by the US Food and Drug Administration (FDA). In Japan, where Avastin is approved for metastatic colorectal cancer, sales continue to grow strongly.
Avastin received additional regulatory approvals in key markets during the year 2008. In January 2008 the EU authorities approved an extension of the product’s metastatic colorectal cancer indication, permitting the combination of Avastin with the most commonly used chemotherapy regimens in all lines of treatment. As a result, virtually all patients with metastatic colorectal cancer can now have access to the proven survival benefits of Avastin. In February 2008 Genentech received accelerated approval from the FDA for Avastin, in combination with paclitaxel chemotherapy, for the first-line treatment of patients with HER2-negative metastatic breast cancer.
In July 2008 Roche filed an application to expand and update the current EU approval for Avastin in metastatic breast cancer with final data from the AVADO study, which were also presented at the 2008 meeting of the American Society of Clinical Oncology (ASCO) in June. This phase III clinical study confirmed the results of an earlier trial (E2100), showing that Avastin combined with taxane chemotherapy significantly improves progression-free survival in this setting. In September 2008 Genentech filed a supplementary application with the FDA for approval of Avastin in combination with interferon alfa to treat advanced renal cell carcinoma. In November 2008 Genentech also applied for US approval of the medicine as monotherapy for people with previously treated (relapsed) glioblastoma, the most aggressive form of brain tumour, based on positive results from a phase II clinical trial (BRAIN). Roche applied for EU approval of Avastin alone and combined with chemotherapy for the same indication in December 2008. In November 2008 Chugai filed a supplementary application in Japan for expansion of the product’s marketing approval to include non-small cell lung cancer.
Other important clinical data on the benefits of Avastin in breast and lung cancer were published during the year 2008. In November 2008 Roche announced that a phase III trial (RIBBON-1) investigating Avastin in first-line metastatic HER2-negative breast cancer in combination with commonly used chemotherapies met its primary endpoint of increasing the time women with breast cancer lived without their disease advancing (progression-free survival) compared with chemotherapy alone. After AVADO and E2100, RIBBON-1 is the third study to confirm the benefit of Avastin combined with chemotherapy for women with metastatic breast cancer. In October 2008 Roche announced the first results from a phase III study (BeTa Lung) investigating the use of Avastin plus Tarceva for the second-line treatment of patients with advanced non-small cell lung cancer. While the combination did not meet the primary endpoint of overall survival, there was clear evidence of clinical activity, with improvements in the secondary endpoints of progression-free survival and response rate when Tarceva was added to Avastin.
In 2007 Avastin recorded strong sales growth in all regions. Sales growth in the United States was driven primarily by increased use in advanced non-small cell lung cancer (NSCLC). In Europe sales growth was boosted by further uptake of the product in the metastatic colorectal cancer setting. In March 2007 the European authorities approved Avastin for the treatment of metastatic breast cancer in combination with chemotherapy (paclitaxel). The approval is based on clinical trial data showing that patients have the chance to live twice as long without their cancer progressing if treated with Avastin plus paclitaxel, compared with paclitaxel alone. Avastin was approved in April 2007 in Japan for advanced or recurrent colorectal cancer and in August 2007 was approved in Europe, in combination with platinum-based chemotherapy, for the treatment of advanced NSCLC. Avastin is the first medicine to prolong the life of NSCLC patients beyond one year. In December the EU authorities approved Avastin in combination with interferon for the treatment of advanced renal cell carcinoma, the most common form of kidney cancer.
In 2006 sales of Avastin grew strongly (total sales rose by 76%). In October 2006, following priority review, the US Food and Drug Administration (FDA) approved Avastin for the treatment of non-small cell lung cancer (NSCLC), the most common form of the disease.

Page 34
Interim analysis of a major phase III trial (AVOREN) released in December 2006 has shown that Avastin is also effective in a fourth type of cancer: it significantly improves progression free survival when given as a first-line treatment for advanced renal cell carcinoma.
Breast Cancer
Breast cancer is the most common cancer among women worldwide, with over 1 million women newly diagnosed and almost 500,000 dying from the disease each year. As there are different types of breast cancer, knowledge of tumour characteristics is important for treatment decisions. Some 20–30% of women with breast cancer have tumours with abnormally high levels of a protein known as HER2. HER2-positive tumours are particularly aggressive, fast-growing and likely to relapse.
Herceptin (trastuzumab), for early and advanced HER2-positive breast cancer, posted solid double-digit sales growth (12%) throughout 2008, for a total of 5.1 billion Swiss francs. Growth was especially strong in Japan (47%) due to continuing uptake after approval of Herceptin for early breast cancer in February 2008. Solid single-digit growth was recorded in the United States (7%), while double-digit gains were achieved in Europe/RoW (13%). The main contributions to growth in the latter region came from the CEMAI5 countries and key emerging markets. More modest growth in the US and Western Europe reflects the product’s high market penetration in these regions, particularly in the early breast cancer setting. Adoption of Herceptin for metastatic breast cancer remained stable. In January 2008 the FDA approved the use of Herceptin as a single agent for the adjuvant treatment of HER2-positive breast cancer following multimodality anthracycline-based therapy. In May 2008 Genentech received FDA approval for a supplemental regimen for adjuvant HER2-positive breast cancer combining Herceptin with docetaxel and carboplatin chemotherapy. This combination has been shown to reduce the rate of heart problems observed when Herceptin is given with anthracycline-containing regimens, thereby potentially allowing more patients to benefit from Herceptin.
The final analysis of a phase III trial (GBG-26), presented at ASCO 2008 in June 2008, confirmed that Herceptin helps women with metastatic HER2-positive breast cancer live longer without their cancer progressing (progression-free survival). The results also showed that Herceptin continued to be effective in women who needed additional treatment after their cancer progressed during previous Herceptin treatment. Results of the Gepar-Quattro and NOAH trials presented at medical conferences in April and December 2008, respectively, showed that Herceptin, given in combination with standard chemotherapy before surgery (known as neoadjuvant therapy), helps shrink locally advanced tumours, enabling breast-conserving surgery and improving long-term outcomes. Final analysis of the NOAH data showed that adding Herceptin to chemotherapy eradicated the tumour in nearly twice as many patients as treatment with chemotherapy alone.
Herceptin (trastuzumab) delivered strong growth throughout the year 2007. This performance was primarily driven by growth in the adjuvant (early-stage) breast cancer segment in Germany, France, Italy, Spain and the United Kingdom, the top five European markets. Due to earlier, rapid adoption of Herceptin for adjuvant treatment, the product’s market penetration in the United States stabilised at a high level during 2007. In the metastatic setting, adoption rates and treatment duration remained stable both in the US and in the top five European markets. New data from the NeoAdjuvant Herceptin (NOAH) study released in June 2007 show that treatment with Herceptin to reduce tumour size before surgery helps eradicate HER2-positive tumours and may reduce the need for breast removal. These results add to the substantial evidence supporting Herceptin as the foundation of care for women with HER2-positive breast cancer at all stages of the disease. In May 2007 Roche gained EU approval for the use of Herceptin in combination with hormonal therapy (aromatase inhibitor) for the treatment of patients with metastatic breast cancer that is both HER2-positive and hormone receptor-positive.
Worldwide sales of Herceptin nearly doubled in 2006. In addition to strong uptake by the medical community, growth was driven mainly by reimbursement approvals in the EU, the US and other key markets for wider use of the product after surgery in early-stage breast cancer. These approvals are based on clinical trial results showing that in this setting Herceptin can reduce the risk of cancer recurrence by up to 50% and the risk of death by about a third. In October 2006 Roche filed an application with the EU authorities for approval of Herceptin combined with hormonal therapy to treat advanced (metastatic) breast cancer that is both hormone receptor-positive and HER2-positive. In November 2006 Chugai filed an application with the Japanese Ministry of Health, Labour and Welfare (MHLW), seeking expansion of the product’s marketing licence to include operable early-stage HER2-positive breast cancer.
5 Central and Eastern Europe, Middle East, Africa, Central Asia, Indian Subcontinent

Page 35
Lung Cancer and Pancreatic Cancer
Lung cancer is the most common form of cancer worldwide and the leading cause of cancer deaths. There are an estimated 1.4 million new cases annually. Non-small cell lung cancer (NSCLC) is the most common form of lung cancer, accounting for approximately 80% of all cases.
Pancreatic cancer is a particularly aggressive disease that is extremely difficult to treat. It kills a higher proportion of patients in the first year after diagnosis than any other cancer. The fifth leading cause of cancer deaths in the developed world, pancreatic cancer claims nearly 80,000 lives every year.
Tarceva (erlotinib) is the only oral medicine targeting the epidermal growth factor receptor with proven and significant survival and symptom benefits in a broad range of patients with non-small cell lung cancer (NSCLC). Since its initial launch four years ago, Tarceva has been approved in over 90 countries and used to treat more than a quarter of a million patients. In addition, in combination with chemotherapy, Tarceva is the first treatment in over a decade to have shown a significant survival benefit in treating patients with pancreatic cancer. Sales of Tarceva continued to increase strongly in 2008, growing 23% to 1.2 billion Swiss francs overall, with the main contributions coming from Western Europe and the Asia–Pacific region. Market uptake is particularly strong in Japan and China. Market penetration in Western Europe also continued to expand strongly, while double-digit sales growth was maintained in the United States. Expanding uptake in all regions reflects doctors’ growing experience with and confidence in the product. In November 2008 the UK’s National Institute for Health and Clinical Excellence (NICE) issued final guidance for Tarceva as an alternative to docetaxel chemotherapy for the second-line treatment of NSCLC, opening the way for reimbursement by the National Health Service.
New data from the phase II FAST-ACT trial, presented at the 2008 ASCO and European Society for Medical Oncology meetings, showed that first-line treatment with Tarceva alternating with chemotherapy and followed by Tarceva maintenance therapy significantly improved progression-free survival in Asian patients with advanced NSCLC compared with chemotherapy alone, irrespective of tumour type or mutation status. In November 2008 Roche announced that the phase III SATURN study had met its primary endpoint, demonstrating that first-line maintenance treatment with Tarceva (given immediately following initial treatment with platinum-based chemotherapy) significantly extended progression-free survival for patients with advanced NSCLC. The results show for the first time that earlier treatment with Tarceva delays lung cancer progression. Roche will discuss the data with regulatory agencies and plans to submit a marketing application for this new indication. OSI Pharmaceuticals, in collaboration with Genentech and Roche, expects to submit a supplemental New Drug Application to the US FDA in the first half of 2009 based on the SATURN data.
Tarceva grew strongly in 2007, mainly thanks to increased uptake in NSCLC and launches in additional countries. Tarceva was launched in China early in 2007, and in December 2007 Chugai launched the product in Japan for the second- and third-line treatment of NSCLC. Tarceva was approved in 87 countries worldwide for the second- and third-line treatment of patients with advanced NSCLC. The EU launch in pancreatic cancer also contributed to Tarceva’s strong performance. In 2007 Tarceva was approved in more than 60 countries for patients with this difficult to treat disease.
In 2006 Tarceva continued to increase strongly. Tarceva was approved for the second and third-line treatment of NSCLC in over 75 countries worldwide. In April 2006 Chugai filed an application in Japan for approval of Tarceva in advanced or recurrent NSCLC; the filing has been given priority review status by the authorities. Market uptake of Tarceva for the treatment of pancreatic cancer was also strong, and the product is now the market leader in the US for this indication. In January 2007, after re-examining the data supporting Roche’s supplementary marketing application, the EU authorities approved Tarceva for the treatment of metastatic pancreatic cancer.
Gastric (Stomach) Cancer
Gastric (stomach) cancer accounts for close to 1 million new cases and well over 800,000 deaths each year, making it the second-largest cause of cancer deaths worldwide. The vast majority of cases occur in Asia, where, with lung cancer, it is the leading malignancy.
Xeloda (capecitabine), an oral chemotherapy medicine for colorectal, stomach and breast cancer, recorded sustained double-digit sales growth throughout 2008, with sales increasing 13% to 1.2 billion Swiss francs. Growth in Japan was particularly strong (74%), and solid increases were also achieved in the United States (9%) and Europe/RoW (14%). Sales were driven by expanded indications approved in 2007 and 2008, notably stomach cancer and advanced colorectal cancer, along with continued uptake in breast cancer. Growth is also being helped by new clinical data and reimbursement approvals, as combination regimens with Xeloda gain acceptance as standard therapy in these indications. Xeloda is generating strong double-digit sales growth in China following approval there in September 2008 for advanced stomach cancer. In February 2008 the EU

Page 36
authorities approved Xeloda for the treatment of metastatic colorectal cancer in combination with any chemotherapy in all lines of treatment, with or without Avastin. This approval provides new treatment options for the large number of patients with metastatic disease. Also in February 2008, Chugai filed an application in Japan to expand the product’s approval to allow its combination with oxaliplatin chemotherapy, with or without Avastin, for the treatment of metastatic colorectal cancer.
Xeloda recorded double-digit sales growth in 2007, with the main contributions coming from the US (+19%) and Europe and all other countries except Japan and the United States (+19%). Sales were boosted by EU approval of Xeloda for the treatment of advanced gastric (stomach) cancer and by positive data on its use in colorectal cancer. In December the CHMP recommended approval of an application filed by Roche in April 2007 to broaden the product’s EU marketing authorisation to allow Xeloda to be used in any therapeutic combination in any line of metastatic (advanced) colorectal cancer treatment, including combinations with Avastin. In December 2007 Chugai received approval in Japan for Xeloda as therapy for adjuvant (post-surgery) colon cancer. Five-year follow-up data from the X-ACT trial presented at the European Cancer Conference (ECCO) in September 2007 shows that patients with advanced colon cancer whose disease has progressed live longer when taking Xeloda compared with intravenous 5-fluorouracil plus folinic acid, the current standard treatment. In addition, data from a major trial in breast cancer published in December 2007 show that Xeloda in combination with Herceptin and docetaxel extended survival in HER2-positive patients by a further five months.
Strong sales growth in 2006 was fuelled mainly by increased use of the product in the adjuvant treatment of colon cancer in the US and Europe.
Transplantation
Each year, around 70,000 organ transplants are performed worldwide. As medical science extends the life expectancy of patients with transplanted organs, demand continues to increase for safe, effective immunosuppressants to control transplant rejection and for medicines to combat infections associated with transplantation.
CellCept (mycophenolate mofetil), a leading component of immunosuppressant combination therapy to prevent rejection of solid organ transplants, again recorded a double-digit increase in sales in 2008, advancing 13% to 2.1 billion Swiss francs. Growth was driven primarily by strong demand in the US and Japan.
Revenue growth of CellCept in 2007 was driven by solid sales in both the US and Europe, based on physicians’ recognition of the long-term protective benefits of CellCept compared with other, more toxic therapies.
Sales of CellCept continued to show solid growth in 2006, driven by particularly strong demand in the US. Thanks to its proven long-term survival benefits and low toxicity, CellCept remained the leading product in the mycophenolic acid market and the cornerstone of immunosuppressant therapies.
Anaemia
Anemia occurs when the level of red blood cells and/or the hemoglobin they contain falls below normal, starving organs and tissues of oxygen. It is seen in more than 80% of patients with chronic kidney (renal) disease, a condition that affects more than 500 million people worldwide. In addition, anemia affects three out of four cancer patients undergoing chemotherapy. Patients with untreated anemia may need blood transfusions. The potential long-term effects of anemia include cardiovascular disease in renal patients, while in patients with cancer it is associated with reduced survival and diminished quality of life.
The Roche Group’s anemia franchise includes three erythropoietin-stimulating agents (ESAs): Roche’s Mircera (methoxy polyethylene glycol-epoetin beta), the first continuous erythropoietin receptor activator, and the established shorter-acting ESAs NeoRecormon and Epogin (epoetin beta), from Roche and Chugai, respectively. All three medicines are used to treat symptomatic anemia in patients with chronic kidney disease. In addition, NeoRecormon is approved to treat chemotherapy-induced anemia in cancer patients.
Combined sales of NeoRecormon and Epogin declined 13% to 1.8 billion Swiss francs in 2008, in an increasingly competitive, highly cost-sensitive market, characterised by heavily discounted contract tenders and group purchasing. New guidelines on the use of ESAs in cancer and renal patients issued during the year by the European Medicines Agency (EMEA) and other regulators also contributed to the overall contraction of the global anemia market. In Europe/RoW erosion of NeoRecormon sales has been moderate (-10%) despite the entry of several biosimilar versions of epoetin alfa since late 2007. In Japan, where Epogin remains the market leader, an 18% decline in sales of the medicine was due primarily to sustained pricing pressure and government-mandated price cuts that came into effect in April 2008. As of January 2009 Mircera has been approved in 72

Page 37
countries worldwide and launched in 56, including the major EU markets. Physician feedback in the early launch markets is positive. Sales are modest but are progressing as the product’s global rollout continues.
In 2007 combined sales of the erythropoietin-stimulating agents (ESAs) NeoRecormon and Epogin (epoetin beta) from Roche and Chugai, respectively, declined in a market that remains highly competitive due to pricing pressure from branded competitors and the entry of biosimilar versions of epoetin alfa in Europe. While the decline in NeoRecormon sales was slight, sales of Epogin in Japan were affected by competitive pricing pressures and, in the first quarter, the residual impact of government-mandated price cuts and reimbursement changes.
In 2006, despite sustained pricing pressure, sales of NeoRecormon (epoetin beta) rose 6% to 1.5 billion Swiss francs, with the product retaining a strong position in cancer-related anemia and its market leadership in renal anemia in the regions where it is sold. Market share gains in the oncology setting were driven by continued adoption of the convenient once-weekly prefilled syringe formulation. In Japan sales of Epogin (epoetin beta) declined due to government mandated price cuts and the introduction of flat-rate reimbursement for epoetin products used in dialysis patients, which has reduced the overall size of the anemia market. Combined sales of NeoRecormon and Epogin declined slightly overall for 2006.
Following EU marketing approval in July 2007, Mircera (methoxy polyethylene glycol-epoetin beta), Roche’s innovative continuous erythropoietin receptor activator for the treatment of anemia associated with chronic kidney disease (CKD), was launched in Germany, the United Kingdom, Ireland, Sweden, Austria, Slovenia and Hungary, as well as in Norway and Switzerland. Initial sales have been in line with expectations. In November 2007 the FDA approved Mircera for the same indication, and further applications for marketing approval are pending worldwide. Mircera allows stable hemoglobin levels with once-monthly dosing during maintenance treatment. It enables correction of anemia with twice-monthly dosing and direct conversion from dosing schedules of up to three times a week with other ESAs to once-monthly dosing in all CKD patients.
In October 2007 a US District Court in Massachusetts found in favour of Amgen in a patent infringement lawsuit brought by Amgen relating to Mircera. Roche is currently evaluating its legal options, including the possibility of an appeal.
Virology
Hepatitis B and C Viruses
The hepatitis B and C viruses (HBV, HCV), which are commonly transmitted through blood-to-blood contact, cause acute and chronic liver disease, potentially leading to liver failure, cirrhosis and liver cancer. Worldwide, 350 million people are thought to be chronically infected with HBV, a highly infectious pathogen that is responsible for an estimated 1 million deaths annually. More than 170 million people around the world are infected with HCV, and 3 to 4 million new cases occur each year. Hepatitis C is the main reason for liver transplantation. A recent study on the HCV-related burden of disease in 22 European countries6 estimated that between seven and nine million people, or over 1% of the population, are infected with HCV.
Pegasys (peginterferon alfa-2a) is indicated for the treatment of chronic hepatitis B and C. It is used alone in the treatment of hepatitis B, and in combination with Copegus (ribavirin) in the treatment of hepatitis C. In addition, Pegasys is the pegylated interferon of choice for use in clinical trials with the new generation of direct antiviral agents, which are expected to increase cure rates and/or shorten treatment duration. Roche believes that in 2008 Pegasys maintained its clear leadership of the global pegylated interferon market and continued to gain market share worldwide. Global sales advanced 6% to 1.6 billion Swiss francs, driven by strong growth in Japan and key emerging markets, combined with solid market-share growth in the United States, where Pegasys now accounts for 70% of new prescriptions for hepatitis C. In June 2008 the EU authorities approved a shortened course of treatment with Pegasys plus Copegus for patients with genotype 2 or 3 HCV infection who have very low virus levels and show a rapid virological response. The approval personalises therapy for these patients, offering a chance for cure with only four months’ treatment. This new approach is made possible by Roche Diagnostics’ highly sensitive, real-time cobas PCR diagnostic tests. In November 2008 Roche also received EU approval for the retreatment of patients whose chronic HCV infection did not respond to previous treatment with interferon alfa (pegylated or non-pegylated), alone or in combination with ribavirin. Pegasys is the first and only pegylated interferon to be indicated for retreatment of up to 72 weeks, allowing therapy to be personalised and
6 Nikolai Mühlberger/Ruth Schwarzer/Beate Lettmeier/Gabi Sroczynski/Stefan Zeuzem/Uwe Siebert “HCV-related burden of disease in
Europe: a systematic assessment of incidence, prevalence, morbidity, and mortality” published on 22 January 2009 in BMV Public Health by BioMed Central (available under www.biomedcentral.com).

Page 38
optimised. The recommended retreatment period depends on the HCV genotype, the type of previous treatment and the patient’s virological response during retreatment.
As in 2006, throughout 2007 sales of Pegasys (peginterferon alfa-2a) for the treatment of hepatitis B and C remained strong despite an overall decline in market volume in the US and Western Europe. Growth was particularly strong in emerging markets such as China and Turkey. Copegus (ribavirin) sales were up 6% compared with 2006, as the launch in Japan more than outweighed declines due to generic competition in the United States and Europe and other countries except Japan and the United States. There has been a positive market response in Japan to the rollout of combined Pegasys plus Copegus for hepatitis C. Final results from a landmark study in previous non-responders, presented at the annual meeting of the American Association for the Study of Liver Diseases in November, show that Pegasys plus Copegus is a promising treatment option for patients who have failed to respond to treatment with another anti-HCV medicine.Despite an overall decline in market volume in the US and competition from a combination treatment in Japan, sales of Pegasys continued to grow in 2006. The product remains the leading pegylated interferon treatment for chronic hepatitis C. Sales of Copegus (ribavirin) continued to decline overall due to generic competition in the US. In January 2007 Chugai received approval to market Copegus in Japan for the treatment of chronic hepatitis C in combination with Pegasys.
Influenza, or Flu
Influenza, or flu, is a highly contagious viral illness that occurs mainly in the autumn and winter months in temperate climates and year-round in tropical areas. It is particularly dangerous for young children, the elderly and people with chronic health problems. Each year, 100 million people fall ill with the flu in Europe, Japan and the US alone. It is estimated that more than 500,000 people globally die each year from the disease or its complications. Pandemics, or global epidemics, are caused by novel strains of influenza to which people have no immunity. Pandemics are associated with significant levels of illness and death and occur every 10 to 40 years. The World Health Organization (WHO) and medical experts continue to warn that the next influenza pandemic may be imminent.
As forecast, total sales of the anti-influenza medicine Tamiflu (oseltamivir) continued to decline in 2008, with the fall of 68% to 609 million Swiss francs due to substantially reduced pandemic stockpiling orders from governments and corporations. The expected sharp fall-off in pandemic sales, down 1.6 billion Swiss francs compared with 2007, more than outweighed a significant increase in seasonal sales, which rose 76% to 372 million Swiss francs. The main contributions to seasonal sales came from the United States, where the 2007/2008 flu season was particularly severe. As part of its policy to help ensure pandemic readiness, Roche continued to work with governments worldwide on appropriate Tamiflu stockpiles, in line with WHO recommendations. Based on data provided by Roche and Chugai, the authorities in the United States, Japan, Canada, Australia and elsewhere have increased the shelf-life of government stockpiles of Tamiflu to seven years. Roche has filed data to support similar shelf-life extensions in other countries.Sales of the anti-influenza medicine Tamiflu declined sharply in the second half of 2007 due to the completion of most of the existing pandemic stockpiling orders from governments and corporations. Guidelines issued by the WHO in 2007 have reinforced the position of Tamiflu as the treatment of choice for avian influenza. Seasonal sales of Tamiflu in Japan were negatively affected by restrictions imposed by the authorities on the use of the medicine in adolescents. This was compensated, however, by a substantial increase in pandemic sales to the Japanese government. The global manufacturing network put in place by Roche can produce 400 million treatment courses of Tamiflu annually, if required. Production levels have been tailored to current demand but can be increased should the need arise. In July and September 2007, respectively, Roche received marketing approvals in US and Europe for a smaller, lower-strength capsule formulation of Tamiflu intended primarily for use in children.
In 2006 worldwide sales of Tamiflu continued to rise strongly, driven mainly by pandemic stockpiling, as governments increased their population coverage. Since 2004 over 75 countries have placed orders for pandemic stocks of Tamiflu, with some purchasing enough to cover 25-50% of their populations. Through a collaborative network of its own facilities and those of other companies, Roche had access to manufacturing capacity for Tamiflu that exceeds all government orders received to date. Research into the most effective utilisation of Tamiflu against the H5N1 virus was continuing, both at Roche and through collaborations with independent experts, the World Health Organization and other institutions. Following EU approval of Tamiflu for influenza prophylaxis in children aged 1-12 years, the medicine could be prescribed for treatment or prophylaxis in all patients aged one year or older.
With its proven medicines and diagnostic tests, Roche contributes to the global effort to combat HIV infection and AIDS. Roche will continue to help improve the standard of HIV care worldwide by initiating and supporting projects that can make a difference at the local level.

Page 39
Combined sales of Valcyte (valgancyclovir) and Cymevene (ganciclovir), the standard of care for the treatment of cytomegalovirus (CMV) retinitis in patients with HIV/AIDS and for the prevention of CMV disease in at-risk transplant patients, rose 10% to 553 million Swiss francs in 2008. Robust growth throughout the year was driven mainly by demand in Europe/RoW, with very strong gains recorded in Germany and Spain. In July the FDA granted pediatric exclusivity for Valcyte in the United States. This extends the medicine’s patent protection for six months, to September 2015.
In the third quarter of 2008, following extensive toxicology studies by Roche, both the EU and the Swiss authorities confirmed that the presence of a chemical impurity in some batches of the HIV medicine Viracept (nelfinavir) last year did not present a risk to patients. The authorities have determined that there is now no need to follow patients in registries. The discovery of the impurity led to a global recall of Viracept in June 2007. Since then, Viracept has been reintroduced in the EU, Switzerland and other markets where Roche supplies the product.
As in 2006, combined sales of Valcyte) and Cymevene, the standard of care for the treatment of cytomegalovirus infections in transplant patients and people with HIV/AIDS, again grew strongly in 2007.
Combined sales of Valcyte and Cymevene continued to grow strongly in 2006, driven by increasing recognition among doctors of the need to prevent and treat cytomegalovirus infections in transplant patients, which can be fatal. Sales are also being helped by increased use of the products to treat cytomegalovirus infection in HIV/AIDS patients.
Inflammation and Autoimmune Disorders
Autoimmune Disorders
Autoimmune disorders occur as a result of a mistaken immune response to the body’s own tissues. The causes are unknown. Rheumatoid arthritis, multiple sclerosis and lupus erythematosus are among the most common autoimmune disorders, which affect millions of people worldwide.
Rheumatoid arthritis (RA) is a chronic, progressive inflammatory disease of the joints and surrounding tissues that is associated with intense pain, irreversible joint destruction and systemic complications. B cells (a type of immune cell) are known to play a key role in the inflammation associated with RA. Several key cytokines, or proteins, are also involved, including TNF alfa, interleukin-1 (IL-1) and interleukin-6 (IL-6). IL-6 has been identified as having a pivotal role in the inflammation process. Around 21 million people worldwide are thought to be affected by RA.
Estimated sales7 of MabThera/Rituxan (rituximab) in the inflammation/autoimmune segment amounted to approximately 800 million Swiss francs in 2008, driven by strong worldwide uptake of the product for the treatment of severe rheumatoid arthritis. The first and only selective B cell therapy approved in this indication, MabThera/Rituxan has rapidly established itself as a proven choice for RA patients with inadequate response to tumour necrosis factor (TNF) inhibitor therapy and is now the market leader in this indication outside the US. Observational data showing the superiority of MabThera/Rituxan over sequential use of TNF inhibitors and the product’s increasingly positive long-term efficacy and safety profile are convincing more and more rheumatologists to move patients to MabThera/Rituxan following inadequate response to their first TNF inhibitor. The use of MabThera/Rituxan in this setting is supported by a growing body of evidence, including new clinical trial data presented at medical conferences in 2008 showing sustained or improved reduction of disease activity with repeated treatment courses and sustained inhibition of the progression of joint damage.
Roche, Genentech and Biogen Idec continued development programmes evaluating additional RA settings in which MabThera/Rituxan may provide benefit to patients. Two major trials in a phase III programme investigating the medicine for use in RA patients with less advanced disease met their primary endpoints in 2008. In January results from the SERENE study in patients with an inadequate response to previous therapy with disease-modifying antirheumatic drugs (DMARDs) showed that significantly more patients treated with MabThera/Rituxan plus methotrexate (MTX) achieved an improvement in disease signs and symptoms compared with those who received MTX alone. In December Roche announced that IMAGE, a radiographic study assessing the ability of MabThera/Rituxan to inhibit structural joint damage in patients not previously treated with MTX, had also met its primary endpoint. Roche plans to use the signs and symptoms data in conjunction with the radiographic data to support a combined EU regulatory filing for additional RA indications in 2009. In September, based on the SERENE data, Genentech filed a supplementary marketing application in the US seeking approval for Rituxan in RA patients with inadequate response to DMARD therapy. 7 Based on data from Genentech and Roche territories.

Page 40
Adoption by physicians of MabThera/Rituxan Data published in May 2007 show that, in patients whose RA had not responded adequately to TNF inhibitor therapy, treatment with MabThera controlled disease activity more effectively than switching to an alternative TNF inhibitor. In February 2007 new data were added to the European prescribing information on the ability of MabThera to significantly slow progression of joint damage in patients with inadequate response or intolerance to TNF inhibitor therapy. In August 2007 MabThera was recommended by the National Institute for Clinical Excellence (NICE) in England and Wales, making it the first and only therapy recommended by the Institute for patients with an inadequate response to at least one TNF inhibitor.
In 2006 first approvals in this indication were issued by the FDA and the EMEA, for use in patients with active RA who have an inadequate response to or are unable to tolerate anti-TNF therapy. Launches in the US, EU and elsewhere were commenced.
Actemra (tocilizumab) is a first-in-class therapy based on IL-6 inhibition, representing a novel approach to the treatment of patients with moderate to severe RA. Following approval in April of Actemra for RA in adults and for related pediatric disorders and the subsequent rollout by Chugai, sales uptake in Japan has been very encouraging. In December 2008 the Swiss authorities approved RoActemra for the treatment of moderately severe to severe, active rheumatoid arthritis in adult patients who have not responded adequately to treatment with DMARDs or TNF inhibitors. Roche received EU marketing approval for RoActemra in the same indication in January 2009. In September 2008, in a complete response letter to Roche’s US marketing application for Actemra, the FDA requested additional documentation. Following further discussions and as a result of the FDA’s evolving Risk Evaluation and Mitigation Strategy (REMS) requirements for medications, in December 2008 the agency asked Roche to prepare a REMS plan for Actemra. In addition, based on the evolving requirements for approval of new biologics, the FDA has asked Roche for non-clinical animal model data, beyond that which was included in the original marketing application. Roche is performing the requested preclinical studies and expects to submit the complete response for Actemra to the FDA in the third quarter of 2009. The FDA has not requested additional clinical studies prior to approval.
In 2007 four phase III trials reported significant clinical benefits for a wide range of RA patients who received Actemra. Based on these results, Roche filed marketing applications for Actemra in RA in the US and the EU in November. The Japanese authorities are reviewing an application filed by Chugai in 2006 for approval of Actemra in adult RA and systemic onset juvenile idiopathic arthritis. Furthermore the product has been approved in Japan for the treatment of Castleman's disease, a rare lymphatic condition.
Metabolic Disorders
Osteoporosis is a systemic skeletal disease characterised by a loss of bone mass, leading to bone weakness and a susceptibility to fracture. Millions of people worldwide are affected –one in three postmenopausal women and one in five men over the age of 50.
Bonviva/Boniva (ibandronic acid) is a highly effective and well tolerated medicine for women with postmenopausal osteoporosis. It is available as a once-monthly tablet and a three-monthly injection. In an increasingly competitive market environment Bonviva/Boniva recorded solid overall sales performance in 2008, with sales increasing 35% to 1.1 billion Swiss francs. Further market-share gains supported robust growth in Europe/RoW and the United States despite the entry of generic versions of competitor products in the US and Europe. New data from a retrospective observational study in over 64,000 postmenopausal women (VIBE) presented at a major European rheumatology congress in June 2008 provided additional evidence for the effectiveness of once-monthly Bonviva compared with weekly bisphosphonates in preventing vertebral, non-vertebral and hip fractures. In November 2008, the FDA expanded the existing marketing approval for once-monthly Boniva to include prevention of postmenopausal osteoporosis.
In a highly competitive market, sales of Bonviva/Boniva continued to show strong growth in 2007. The majority of sales were in the US, where the product’s market share (total prescriptions) increased to over 15%. Sustained growth was also helped by successful launches of Bonviva once-monthly tablets in France and Spain, additional launches of Bonviva Injection, and new efficacy data showing that the product can reduce the risk of non-vertebral fractures (fractures at sites other than the spine).
As the worldwide rollout gathered pace, full-year sales of the product continued to rise strongly. In the US Boniva accounted in 2006 for some 16% of new bisphosphonate prescriptions. Bonviva/Boniva Injection was approved in the US and Europe in January and March 2006, respectively, and is currently being launched in those markets. Given once every three months, this new formulation offers effective treatment to women unable to take or tolerate oral bisphosphonates.
Bonviva/Boniva was launched by Roche and its co-promotion partner GlaxoSmithKline in the US in April and in Europe in September 2005. Sales totalled 86 million Swiss francs and were expected to gain further

Page 41
momentum as physicians and patients recognised and preferred the simplicity and convenience of a once-monthly tablet. In January 2006 Boniva Injection became the first intravenous medication to be approved in the US for the treatment of post-menopausal osteoporosis, providing the proven bone-strengthening benefits of bisphosphonate therapy to more women. Given once every three months, Boniva Injection is designed to meet the needs of patients who are unable to take or tolerate oral bisphosphonates.
In 2007 sales of the prescription weight-loss medication Xenical (orlistat 120 mg) declined worldwide, especially in the United States, where Roche’s partner GlaxoSmithKline successfully launched non-prescription orlistat 60 mg under the brand name alli in June 2007. As licensor, Roche receives royalties on sales of alli in the US. GSK has exclusive rights to market non-prescription formulations of orlistat globally, except in Japan. In 2008 the sales of Xenical decreased 13% to 502 million Swiss francs.
Global sales of Xenical, for weight loss, grew steadily in 2006, despite the launch of a new competitor in a number of markets. Growth has been helped by increasing awareness of the risks associated with overweight and obesity. Following receipt of an ‘approvable’ letter from the FDA in April 2006 to market low-dose orlistat as an over-the-counter medicine for weight loss, Roche’s partner GlaxoSmithKline was in discussions with the agency regarding its application to sell orlistat 60 mg as a non-prescription weight-loss aid in the US.
Research and Development In 2008 the Pharmaceuticals Division continued to build the value of its research and development portfolio, advancing twelve projects in the areas of oncology, metabolic and inflammatory–autoimmune diseases into phase III clinical testing.
Over the last 18 months Roche Pharmaceuticals has decentralised the management of its Research and Development (R&D) projects by creating five Disease Biology Areas (DBAs). The Oncology, Viral Diseases, Inflammation, Metabolic Diseases and Central Nervous System DBAs set priorities and make portfolio decisions for their specific diseases. This is already helping to streamline the research portfolio and is expected to increase the number and quality of programmes being advanced into clinical development.
The Group’s R&D activities are focused on creating clinically differentiated medicines based on small molecules (chemical compounds) and therapeutic proteins (mainly monoclonal antibodies and peptides), including glycoengineering and next-generation biologics. In addition, Roche R&D is now exploring small interfering ribonucleic acid molecules (also known as RNA interference, or RNAi), a promising approach based on the concept of targeted gene silencing that it is hoped will eventually yield powerful new therapeutic options.
In addition, on the basis of its own data Roche believes that it is uniquely positioned to help realise the promise of personalised healthcare, an approach that seeks to tailor treatments to specific patient subpopulations based on knowledge of the biological differences between patients and the characteristics of their disease. The Roche Group’s combined pharmaceuticals and diagnostics expertise gives Roche a clear competitive advantage in this area. Roche has already achieved notable successes with this approach in oncology and virology, and Roche expects its focus on personalised healthcare to contribute greater value in the future, thus meeting growing stakeholder expectations for safer, more effective and more cost-efficient treatments.
Research & Development Pipeline
Drugs in the R&D pipeline are classified into four phases: phase 0 – transition from preclinical to clinical development; phase I – initial studies in healthy volunteers and possibly in patients; phase II – efficacy, tolerability and dose-finding studies in patients; phase III – large-scale studies in patients for statistical confirmation of safety and efficacy.
In 2008 the Pharmaceuticals Division filed 11 major new marketing applications and gained 13 major regulatory approvals. At the beginning of 2009 the division’s R&D pipeline comprised 120 clinical projects, including 62 new molecular entities (NMEs) and 58 additional indications. Forty NMEs are currently in phase 1, 16 in phase II and six in phase III or filed for regulatory review.
Roche Pharmaceuticals currently has 100 projects in preclinical research across five therapeutic areas and 84 development projects in five therapeutic areas, including five in phase 0 (transition from preclinical to clinical development).
In 2008 twelve Roche-managed projects were terminated: six in phase I, four in phase II and two in phase III. Two of these projects reverted to our R&D partners, and decisions were taken to outlicense another two.
In 2007 the Pharmaceuticals Division filed 14 major new marketing applications and gained 18 major regulatory approvals. Twenty-five NMEs were in phase I, 18 in phase II and five in phase III or filed for regulatory review.

Page 42
In 2006 the Pharmaceuticals Division filed 13 new marketing applications and gained 14 regulatory approvals. However, fifteen projects were either terminated or reverted to Roche's R&D partners. Of these, eight were in phase I, six in phase II and one in phase III.
Pharma Partnering Update
Licensing and targeted acquisitions play an important role in strengthening Roche’s R&D portfolio and expanding the company’s technology capabilities. In 2008 Roche Pharmaceuticals signed a total of 57 new agreements, including seven product transactions and 43 research and technology collaborations.
In May 2008 Roche acquired Piramed Limited, a UK company with therapeutic research programmes targeting the PI3-kinase pathway in oncology and inflammatory disease. In June Roche consolidated its leading position in the antiangiogenesis field through a licensing agreement with ThromboGenics and BioInvent for their jointly developed anticancer agent TB-403 (R7334). The acquisition of Mirus Bio Corporation (now Roche Madison Inc.) in September enables Roche to further advance its research in the field of ribonucleic acid interference (RNAi) delivery.
In September 2008 Roche completed the acquisition of ARIUS Research Inc., which has a proprietary antibody platform that rapidly identifies and selects antibodies based on their functional ability to affect disease. Following a merger agreement and successful tender offer, in January 2009 Roche acquired US-based Memory Pharmaceuticals, which develops innovative drug candidates for the treatment of debilitating central nervous system disorders such as Alzheimer's disease and schizophrenia. Memory’s nicotinic alpha-7 agonist drug candidates in these disease areas were already in partnered programmes with Roche.
Major Development Activities
Oncology
The global development programme for Avastin currently includes more than 450 clinical trials with around 40,000 patients in over 30 different tumour types. Phase III studies in diseases such as ovarian, prostate and gastric (stomach) cancer are scheduled to report over the next two years. Final results from a key clinical trial of Avastin in the early colon cancer setting (NSABP C08) are expected in 2009, with the results of another trial in the same setting (AVANT) due in 2010. Important milestones were passed in several Avastin programmes in 2008: BETH, a global phase III trial of Avastin combined with Herceptin in adjuvant HER2-positive breast cancer, started in May 2008; patient recruitment for the phase III AVAGAST trial in first-line advanced gastric cancer was completed in December 2008; and BERNIE, a phase II trial to assess Avastin in combination with standard chemotherapy in children and adolescents with sarcoma, commenced in July 2008. In October 2008 the EU authorities approved a pediatric investigation plan for Avastin; the studies included will eventually provide physicians with new data on dosing and safety that can improve clinical outcomes specifically for children.
In collaboration with OSI Pharmaceuticals and Genentech, Roche is conducting an extensive development programme of more than 130 clinical studies with Tarceva at earlier stages of lung cancer and in combination with other treatments, including Avastin, to further evaluate the life-extending benefits of Tarceva for patients with NSCLC. Ongoing and planned phase III studies in the Tarceva development programme include a randomised phase III trial (ATLAS) evaluating the addition of Tarceva to Avastin for maintenance therapy following first-line treatment with Avastin and chemotherapy in patients with advanced NSCLC. Initial results from this trial are expected in the first half of 2009.
Several studies are currently evaluating Herceptin in combination with Avastin or pertuzumab in patients with HER2-positive breast cancer. In addition to BETH (see above, Avastin), CLEOPATRA and NEOSPHERE (see below, pertuzumab), Herceptin is also being studied in a global phase III study (AVEREL) in combination with Avastin in the first-line treatment of advanced breast cancer. Herceptin is also being investigated in HER2-positive advanced gastric cancer in the phase III ToGA study. Around 20% of patients with gastric cancer have HER2-positive disease.
Interim results from a phase III trial with 1500 patients by the Finnish Breast Cancer Group, presented at the San Antonio Breast Cancer Symposium in December, suggest that Xeloda, which is already approved for advanced breast cancer, may also reduce cancer recurrence and extend survival in patients with early breast cancer. A similar Roche-sponsored study with Xeloda in early breast cancer (NO17629) is ongoing. Roche plans to seek regulatory approval for Xeloda in this indication. A phase III trial of the medicine in early colon cancer (NO16968) is due to report in 2009, and data from a phase IV adjuvant study in patients with gastric cancer are expected in 2010.
Pertuzumab (R1273), currently being studied in combination with Herceptin and standard chemotherapy in HER2-positive breast cancer, entered phase III development in 2008. Pertuzumab inhibits the pairing of HER2
Page 43
with other HER receptors, a key mechanism of tumour growth. CLEOPATRA, a phase III study evaluating the addition of pertuzumab to Herceptin and chemotherapy in first-line treatment of patients with advanced disease, commenced in the first quarter of 2008. In addition, NEOSPHERE, a phase II trial investigating neoadjuvant (presurgical) treatment with pertuzumab, started in the first half of the year. Data from a phase II trial (17929) presented at ASCO 2008 showed that half of the patients with advanced HER2-positive breast cancer whose disease had progressed during previous treatment with a regimen including Herceptin benefited from a combination of Herceptin and pertuzumab.
In 2008 progress was also made with a range of oncology projects in earlier stages of development, including one that will soon move into phase III, the last stage of clinical testing before a marketing application is filed. Trastuzumab-DM1 (T-DM1, R3502) is a novel antibody–drug conjugate linking trastuzumab (the active ingredient of Herceptin) and the cytotoxic agent DM1. By targeting the HER2 proteins expressed by tumours, the conjugate delivers chemotherapy to the cancer cells in a precise manner. T-DM1 has shown promising clinical efficacy and good tolerability in phase II clinical trials in women with HER2-positive metastatic breast cancer. Roche and Genentech have decided to move T-DM1 into phase III development for second-line HER2-positive metastatic breast cancer; the first trial in this programme is scheduled to start in the first half of 2009.
R1507 is a monoclonal antibody targeting the IGF-1R receptor. The IGF pathway is important for the growth and survival of a variety of cancers. R1507 is well tolerated and is currently in phase II development for sarcoma, non-small cell lung cancer, and breast cancer.
R7159 (GA101), a fully humanised, type II, glyco-engineered third-generation anti-CD20 monoclonal antibody developed by GlycArt and Roche, is being co-developed with Chugai, Genentech and Biogen Idec for the treatment of CD20-positive hematological malignancies, including CLL and NHL. R7159 targets the same B cell protein (CD20) as MabThera/Rituxan and has been engineered to increase both direct and indirect tumour cell death, thereby enhancing efficacy. In phase I studies R7159 has shown good tolerability and very encouraging clinical activity in patients with no other treatment options who have previously received MabThera/Rituxan. Phase II development in NHL commenced in December 2008.
R7204 is a novel inhibitor of B-Raf kinase being co-developed by Plexxikon and Roche. Currently in phase I testing, R7204 selectively targets the product of the mutant B-RafV600E gene, an abnormality that has been shown to drive certain cancers. The mutation occurs only in tumour cells. It is found in many thyroid cancers and malignant melanomas and in a small proportion of colorectal cancers. A diagnostic test is being developed in collaboration with Roche Molecular Diagnostics to select patients who carry the B-RafV600E mutation and are therefore most likely to respond to treatment with R7204.
R7334 (TB-403), a human monoclonal antibody targeting placental growth factor (PlGF), entered the Roche portfolio in June 2008 via a licensing agreement with ThromboGenics and BioInvent. Malignancy of solid tumours is dependent on new blood vessel formation, a process known as angiogenesis, and PlGF is an important growth factor in this process. It is anticipated that R7334 will be used in combination with other antiangiogenic treatments such as Avastin. R7334 is currently being tested in a phase I study in patients with solid tumours.
Inflammation and Autoimmune Diseases
In the second quarter of 2008 Roche and Genentech decided to discontinue development of MabThera/Rituxan in systemic lupus erythematosus after a phase II/III study failed to reach its primary endpoint. Phase III development of the drug for lupus nephritis is continuing as planned, and the results of a clinical trial (LUNAR) investigating the benefits of adding MabThera/Rituxan to CellCept are expected in the first half of 2009.
Ocrelizumab (R1594) is a humanised anti-CD20 monoclonal antibody being developed by Roche, Genentech and Chugai for the treatment of autoimmune diseases. Like MabThera/Rituxan, ocrelizumab also targets B cells. As a humanised antibody, it has the potential to be less immunogenic, better tolerated and more convenient to administer. An extensive global phase III programme was started in 2007 and involving more than 2,700 patients with rheumatoid arthritis is ongoing, and recruitment for a phase III trial in lupus nephritis is continuing as planned. In May 2008 a phase III trial of ocrelizumab in systemic lupus erythematosus was discontinued due to the negative results of a trial with MabThera/Rituxan in a similar patient population.
Promising early-stage projects in the inflammation/autoimmune area are proceeding on track, including R667, currently in phase II clinical testing for emphysema, and R4930 (huMAb anti-OX40L), a novel biologic being jointly developed by Roche and Genentech as a treatment for asthma (currently in phase I). In November 2008 Actelion and Roche agreed to progress R3477, a selective S1P1 receptor agonist, into phase II clinical development for autoimmune diseases.

Page 44
Metabolic and Cardiovascular Diseases
Many people with elevated levels of certain blood fats remain at risk of heart attack or stroke despite treatment with currently available medications. This risk may be reduced by new treatments that increase high-density lipoprotein cholesterol (HDLC), sometimes called ‘good’ cholesterol. Dalcetrapib (R1658, JTT-705, licensed from Japan Tobacco) increases levels of HDLC by blocking the action of the cholesteryl ester transfer protein (CETP), thereby potentially reducing the risk of cardiovascular disease and death in high-risk patients. A phase III morbidity and mortality study of dalcetrapib (dal-OUTCOMES) started in April 2008, and patient recruitment is proceeding well. Phase II data presented at the American Congress of Cardiology in March 2008 show that dalcetrapib is well tolerated and has a good general and cardiovascular safety profile when given alone or in combination with statins. Additional data presented at the American Heart Association meeting in November 2008 showed that dalcetrapib has a unique chemical structure and, unlike certain other CETP inhibitors, does not activate enzymes or genes involved in blood-pressure regulation.
Diabetes
Diabetes is recognised as a global epidemic by the World Health Organization. The International Diabetes Federation estimates that some 380 million people worldwide will have diabetes by 2025. According to the WHO, type 2 (adult onset) diabetes accounts for around 90% of all cases.
Taspoglutide (R1583, BIM 51077, licensed from Ipsen), the first once-weekly human glucagon-like peptide-1 (GLP-1) hormone analogue, is being developed by Roche for type 2 diabetes. The structure of the molecule is similar to that of the natural human hormone. In clinical trials to date, taspoglutide was generally well tolerated and significantly improved glucose control and weight loss after only eight weeks of treatment. Roche initiated an extensive phase III clinical development programme with taspoglutide in July. In late 2008 the FDA issued new guidance on the clinical testing of new treatments for type 2 diabetes. Roche is reviewing the taspoglutide programme to comply with these recommendations.
Roche currently has compounds targeting several mechanisms of action in development for use in patients with type 2 diabetes. One of these, aleglitazar (R1439), is a dual PPAR agonist that has demonstrated effects on blood fats, blood pressure and blood glucose. Phase II clinical testing is nearing completion, and Roche expects to make a decision in the first half of 2009 on phase III development of the compound. Phase II development of R1579, a dipeptidyl peptidase IV (DPP-IV) inhibitor, was completed in the second half of the year. While demonstrating adequate glucose reduction and excellent tolerability, the compound did not satisfy Roche’s internal clinical differentiation criteria for transition into phase III testing, and Roche has therefore decided to outlicense it.
Virology
Development of R1626, a polymerase inhibitor being investigated as a treatment for hepatitis C infection, was terminated during the year due to new and unexpected safety findings from a Phase IIb study. Roche’s pipeline of direct antiviral agents for HCV remains robust, with the polymerase inhibitor R7128 (collaboration with Pharmasset) and the protease inhibitor R7227 (collaboration with InterMune) in phase I clinical development. Both of these oral agents are being investigated in combination with Pegasys and Copegus. In addition, Roche has started a clinical trial with combined R7128 and R7227, an important first step in evaluating the therapeutic potential of an all-oral, interferon-free combination treatment for hepatitis C.
Central Nervous System Diseases
Evidence is evolving on the role of B cells in the multiple sclerosis disease process. Based on promising phase II data with MabThera/Rituxan in relapsing-remitting multiple sclerosis (RRMS), Roche and its partners are conducting a phase II dose-finding study with the next-generation anti-CD20 antibody ocrelizumab in this disease. In April 2008 a phase II/III study (OLYMPUS) of MabThera/Rituxan in primary progressive MS (PPMS), led by Genentech, did not meet its primary endpoint. However, as secondary analysis suggests that the medicine may benefit certain patient subgroups, Genentech and Roche are evaluating possibilities for further development of anti-CD20 therapy in progressive MS.
R1678, an inhibitor of glycine transporter type 1 (GlyT1), is in phase II development for the treatment of schizophrenia. Preclinical and clinical evidence suggests that this novel mechanism of action may improve negative symptoms of schizophrenia, an area of high unmet medical need not adequately addressed by current treatments. R3487, a nicotinic alpha7 receptor agonist, is being developed to treat cognitive impairment in schizophrenia and Alzheimer’s disease. R3487 is expected to provide significant improvement in memory and ability to perform activities of daily living compared with current treatments. First results from a phase II trial investigating the benefit of R3487 in cognitive impairment associated with schizophrenia are expected towards the middle of 2009. A phase IIb study in Alzheimer’s disease is scheduled to start in the first part of 2009.

Page 45
Manufacturing Infrastructure
Biotech manufacturing uses cell-culture technology to produce bulk quantities of genetically engineered active pharmaceutical ingredients such as monoclonal antibodies and other therapeutic proteins while meeting strict quality requirements. The manufacturing process – comprising cell growth, fermentation, purification and filling operations – takes place under highly controlled conditions. The facilities are subject to rigorous regulatory inspection and approval procedures. The Roche Group’s Pharmaceuticals Division currently operates six major biotech manufacturing facilities worldwide, including those at Roche Phamaceuticals’ Basel and Penzberg sites, Genentech’s plants in South San Francisco, Vacaville and Oceanside, and Chugai’s Utsunomiya facility.
Roche’s new biotech production facilities in Penzberg (Germany) and Basel (Switzerland) are now fully operational. Roche received European Medicines Agency (EMEA) approval in May 2008 for the production of trastuzumab (the active ingredient of Herceptin) at the Penzberg facility for European markets, just under four years after the start of construction work. Roche filed for approval of production of bevacizumab (the active ingredient of Avastin) in the new Basel facility with the EMEA in December 2008.
In 2008 the Group made further progress with important infrastructure projects. Construction of a new technical research and development building at Roche’s Basel site commenced in October 2008. In addition, new sterile vial filling capacity is being installed at Roche’s Kaiseraugst (Switzerland), Genentech’s Hillsboro (Oregon, USA) and Chugai’s Utsunomiya (Japan) sites.
In 2008 Roche Pharmaceuticals continued to optimise its global manufacturing network. During the year the decision was taken to close manufacturing in Nutley (New Jersey, USA) by 2010 and to phase out chemical manufacturing in Mannheim (Germany) over three years. Products currently manufactured in Mannheim and Nutley will be transferred to other sites. In addition, the Cenexi galenical manufacturing site in Fontenay sous Bois (France) was sold. In addition to these and other steps to strengthen and focus its manufacturing network, Roche further improved its supply chain management systems to ensure continuous worldwide supply of its innovative medicines.
DIAGNOSTICS
Overall Results In 2008 Roche’s Diagnostics Division recorded sales of 9.7 billion Swiss francs, an increase of 10% in local currencies (3% in Swiss francs; 15% in US dollars) over the previous year.8 Once again, this was faster than global IVD market growth, which is estimated at between 5% and 6%. Despite recent sector consolidation, based on its own data Roche believes that Roche’s Diagnostics Division maintained its leading market position.
Divisional sales continued to grow ahead of or in line with the market in all regions, with double-digit gains in North America (including the positive impact of the Ventana acquisition), Asia–Pacific and Latin America and strong mid-single-digit growth in the EMEA region (Europe, Middle East and Africa) and Japan. Four of the five divisional business areas posted rising sales, with the biggest contributions to growth coming from the Professional Diagnostics, Applied Science and Tissue Diagnostics units. Within these businesses, immunoassay systems, DNA sequencing products and advanced staining remained the major growth drivers, respectively. Roche Diabetes Care posted a modest sales decline overall in a highly competitive market, but achieved strong growth with its new products. Roche Molecular Diagnostics’ growth continued to be driven by sales of automated real-time PCR virology and blood screening systems. Roche Tissue Diagnostics (Ventana), the US-based leader in automated tissue staining acquired in February, posted sales of 376 million Swiss francs in the 11 months to 31 December 2008, accounting for 4% of the division’s full-year sales.
Operating profit in the Diagnostics Division decreased 22% in local currencies to 1,187 million Swiss francs in 2008, and the operating margin decreased 5.3 percentage points to 12.3%. More than half of the margin decline resulted from the impact of recent acquisitions, including amortisation of acquired intangible assets and investments to develop the acquired businesses. The rest was mainly due to strong competition in the US diabetes care market and portfolio mix effects.
Based on its own data Roche believes that Roche Diagnostics was the global market leader in 2007 with a market share of approximately 19%. Divisional sales for the year totalled 9.3 billion Swiss francs, an increase of 6% in local currencies (7% in Swiss francs; 12% in US dollars) over 2006. The Professional Diagnostics and Diabetes Care businesses posted solid single-digit sales increases. Roche Applied Science’s sales grew at a 8 Unless otherwise stated, all growth rates are in local currencies.

Page 46
double-digit rate. As expected, pressure on industrial reagent prices continued to affect Roche Molecular Diagnostics’ sales, which were down 2% for the year. Excluding industrial reagents, this business area posted 3% top-line growth.
All regions contributed to growth, with sales advancing at double-digit rates in Latin America and Asia–Pacific and at single-digit rates in Europe, North America and Japan. Sales in Asia–Pacific grew almost twice as fast as the market.
The acquisitions of 454 Life Sciences, BioVeris Corporation and NimbleGen Systems, Inc., were completed in May, June and August 2007, respectively. In February 2008 Roche completed its acquisition of Ventana Medical Systems, Inc., of Tucson (Arizona) which has marked Roche's entry into tissue-based diagnostics and be an important step in the Group’s strategy of delivering personalised healthcare solutions to patients.
Divisional operating profit rose 14% to 1.6 billion Swiss francs, while the operating profit margin increased 1.3 percentage points to 17.6%. The margin improvement was driven by sales growth and was positively impacted by the reversal of royalty accruals relating to BioVeris and the absence in 2007 of the significant impairment charges recorded on intangible assets in 2006. These factors compensated for continued heavy investments in launch activities and significantly reduced industrial reagent sales in 2007. EBITDA totalled 2.6 billion Swiss francs, or 27.6% of sales, compared with 28.6% in 2006. This is well above the industry average.
Roche Diagnostics remained the global leader in 2006 in an increasingly competitive market, with a market share of 19%. Divisional sales increased 5% for the year in local currencies (6% in Swiss francs; 5% in US dollars), fuelled by new product launches. This was slightly above the market growth rate. The Centralized Diagnostics, Near Patient Testing and Applied Science units were the main contributors to growth. Roche Diabetes Care’s sales grew 3%.
In October 2006 the Food and Drug Administration (FDA) lifted an import alert barring the US sale of Accu-Chek insulin pumps from Disetronic Medical Systems.
Divisional operating profit (before exceptional items) declined 21% to 1.4 billion Swiss francs, resulting in a margin decline of 5.2 percentage points. This was primarily due to increased investments in launch activities, impairment charges on intangible assets and lower royalty income from licences. The impairment charges mainly relate to intangible assets recorded following the Disetronic acquisition in 2003. The decline in royalty income followed the worldwide expiry of the foundational patents on polymerase chain reaction (PCR) technology in many countries outside the US. EBITDA totalled 2.5 billion francs, or 28.6% of sales, compared with 31.7% in 2005; this was well above the industry average.
Business Areas Professional Diagnostics
Roche Professional Diagnostics (formerly Centralized Diagnostics and Near Patient Testing) supplies instrument systems, tests, software, workflow automation and services that help clinical laboratories deliver accurate diagnostic results more quickly, efficiently and cost-effectively. It is also a leader in the growing market for decentralised testing products to support clinical decision-making close to the patient, in doctors’ offices, intensive care units and other primary and specialty care settings. A dedicated IT group develops laboratory information, workflow and data management solutions as well as connectivity components to maximise testing efficiency and support interpretation of increasingly complex test results.
In 2008 Roche Professional Diagnostics’ sales rose 9% to 4,422 million Swiss francs, compared with estimated market growth of 6%. Sales in Asia–Pacific and Latin America showed strong double-digit growth; gains in other regions were in the high single-digit range.
In December 2008 Roche completed its acquisition of German-based Swisslab GmbH, a leading provider of laboratory information systems (LIS) and related services. The acquisition complements Roche’s existing LIS portfolio and significantly strengthens its position as a supplier of IT solutions for laboratory automation and data management in large laboratory organisations.
In 2007 Roche Professional Diagnostics gained market share on overall sales growth of 8%. Immunochemistry remained the biggest growth driver, with sales revenues rising 13% for the year; this was the seventh consecutive year of above-market growth in immunochemistry sales. Sales of clinical chemistry products grew 3% in a highly competitive, cost-sensitive market.
The increase in immunochemistry sales was fuelled by continued strong demand for assays for the cardiac markers NT-proBNP and troponin T and for a TSH (thyroid-stimulating hormone) assay used to assess thyroid function. A vitamin D assay to diagnose osteoporosis and an assay for monitoring mycophenolic acid (MPA)
Page 47
therapy in heart and kidney transplant recipients were launched in the second half of the year and are expected to contribute to future growth. Monitoring MPA, the active form of Roche’s leading immunosuppreseant CellCept, enables physicians to maintain adequate immunosuppression at critical time points such as when initiating therapy or when reducing other, more toxic anti-rejection drugs.
Demand for the cobas 6000 analyser series for medium-workload laboratories (up to about 500 tests per day) remains very strong and helped drive immunochemistry and clinical chemistry sales. Introduced in 2006, the cobas 6000 was the first of several new modular platforms designed to integrate and improve the efficiency of immunochemistry and clinical chemistry testing in different-sized laboratories. Two new configurations were launched in 2007, increasing the platform’s competitiveness..
The rollout of the cobas 4000 series of benchtop instruments for small- to medium-size laboratories began in early 2007 with the launch of the cobas e 411 immunochemistry analyser.
In 2006, before the business areas Roche Centralized Diagnostics and Roche Near Patient Testing were merged in 2007, Roche Centralized Diagnostics posted above-market sales growth of 5% and remained the industry leader with a market share of about 13%. The rollout of the medium-throughput cobas 6000 analyser series and the European launch of the cobas c 111 analyser for customers with small testing volumes marked important steps in a business strategy centred on making clinical chemistry and immunochemistry testing simpler and more efficient. An application for US marketing approval for the cobas c 111 analyser was submitted to the FDA in late 2006. The cobas 6000 analyser series is a fully automated, integrated system capable of handling more than 95% of the routine tests performed daily by a medium-volume laboratory. Thanks to its flexible, modular design, it can be configured exactly to customers' individual needs, and new modules can be added at any time as those needs grow.
With respect to the former business area Roche Near Patient Testing, in June 2007 Roche and Sysmex Corporation of Japan strengthened their long-standing partnership by extending an agreement that gives Roche exclusive distribution rights for Sysmex hematology instruments in some markets in Europe, Latin America, Southern Africa and Oceania. Hematology sales showed strong double-digit growth in all regions covered by the new 10-year agreement. A separate agreement with Sysmex covering urinalysis products was also extended; these products achieved above-market growth in 2007.
Sales of point-of-care diagnostic products rose 7%, helped by the continued trend towards testing outside the laboratory. Coagulation monitoring sales grew 14%, driven by the CoaguChek XS monitor for patient use and the CoaguChek XS Plus monitor for healthcare professionals, both launched in their first markets in 2006. These systems were released in the United States and Japan in the first half of 2007, and uptake in these major additional markets has been strong. Cardiac marker sales accelerated steadily following the launch of the cobas h 232 system in early 2007. This portable cardiac testing device provides highly reliable results in just 15 minutes. Sales of Accu-Chek Inform hospital blood glucose meters and test strips grew significantly, particularly as a result of the increasing adoption of tight glycemic control protocols in US hospitals.
The ambulatory care portfolio was strengthened in November 2007 by the launch of Accutrend Plus (cobas h 152), a hand-held instrument capable of measuring cholesterol, triglyceride and glucose levels (important indicators of cardiac risk) and lactate in blood.
Integration of BioVeris Corporation, acquired in June 2007, is proceeding as planned. The transaction, which gives Roche ownership of all patents relating to the electrochemiluminescence (ECL) detection technology used in its Elecsys product line, will enable Roche to expand its fast-growing immunochemistry business into new areas such as life science research, clinical trials and drug development.
In November 2007 Roche signed a licensing agreement with Ortho-Clinical Diagnostics, Inc., and Novartis Vaccines & Diagnostics giving Roche access to their broad portfolio of hepatitis C virus (HCV) patents for use in immunodiagnostics. The agreement also includes cross-licensing of patents owned by Roche Diagnostics. Based on its own data Roche believes that it is already a leader in nucleic acid testing for HCV, and the agreement will strengthen Roche's position as a supplier of immunoassays for this major cause of liver disease, including chronic hepatitis, cirrhosis and liver cancer.
In 2006, before the business areas Roche Centralized Diagnostics and Roche Near Patient Testing were merged in 2007, the overall sales of Roche Near Patient Testing helped by the continued trend towards decentralised testing.
Roche Near Patient Testing's coagulation monitoring systems, CoaguChek XS for patient self-monitoring and CoaguChek XS Plus for healthcare professionals, commenced their European rollout in January and October, respectively. CoaguChek XS received FDA approval in the third quarter of 2006. These systems provide

Page 48
patients taking oral anticoagulants and their health professionals accu-rate, on-the-spot results from a single drop of blood. Their successful launch has strengthened Roche's global leadership in coagulation monitoring.
The Accu-Chek Inform meter and Accu-Chek Advantage and Accu-Chek Sensor test strips were the core products driving Roche's growing market share in the segment of hospital-based blodd glucose monitoring.
Diabetes Care
Diabetes results from the body’s inability to regulate blood glucose and often leads to serious complications, including heart and kidney disease, stroke and blindness. Worldwide diabetes affects over 250 million people and is a leading cause of premature death. By 2025 the number of people with the disease is expected to reach 380 million. While there is no cure, people with diabetes can take steps to manage their disease and lower the risk of complications.
Roche Diabetes Care’s products are designed to make living with diabetes easier. The portfolio covers the entire diabetes self-management spectrum, from glucose monitoring to insulin delivery. Monitoring systems with integrated lancets and test strips and software for storing and analysing data are an important part of Roche’s diabetes care portfolio because they improve blood glucose control for many users, in addition to offering greater convenience.
Based on its own data Roche believes that Roche Diabetes Care remains the global market leader. In 2008 its sales reached 2,971 million Swiss francs, a 1% decline from 2007. Single-digit sales increases in the EMEA region, Asia–Pacific and Japan and a double-digit increase in Latin America did not quite offset lower US sales. Following a strong second quarter, US sales fell in the third and fourth quarters as a result of an accelerating decline in sales of older monitoring products, strong competition and continued pricing pressures. The older products that are being phased out of the portfolio now account for less than 30% of Roche Diabetes Care’s sales.
The new generation of Accu-Chek blood glucose monitoring systems delivered robust growth. Accu-Chek Aviva, Roche Diabetes Care’s largest-selling glucose monitoring system, posted a strong double-digit sales increase over 2007. The Accu-Chek Performa, launched in most markets during the first half of 2008, has experienced a strong uptake; the global rollout continued with the December launch in China and is now almost complete.
The global rollout of the Accu-Chek Compact Plus system was completed in November 2008. Combined sales of Accu-Chek Compact Plus test strips grew at a double-digit rate in countries where this device was launched in late 2007.
In the coming months Roche Diabetes Care will be launching four important new diabetes monitoring products. The Accu-Chek Aviva Nano and Accu-Chek Performa Nano blood glucose meters will be available in the European Union, their first market, starting in the first quarter of 2009. Offering the same functionality as the Accu-Chek Aviva and Accu-Chek Performa systems in a sleeker, more discreet design, the Nano meters are aimed especially at young high-frequency testers. The new Accu-Chek Active, targeted particularly at emerging markets, will also begin rolling out in the first quarter of 2009.
The fourth new offering, Accu-Chek Mobile, is expected to strengthen Roche Diabetes Care’s lead in the market segment for integrated blood glucose monitoring systems. Accu-Chek Mobile offers complete integration of testing and lancing in a single device and features a unique strip-free technology that employs a continuous tape of 50 tests instead of single-use test strips.
In the first quarter of 2009 Roche Diabetes Care will start updating its glucose monitoring systems to a new testing method that avoids the risk of maltose interference. This will offer additional safety to certain dialysis patients who also monitor their blood glucose.
The innovative Accu-Chek Combo system, scheduled for launch in the European Union in the first quarter of 2009, will be a strong addition to Roche Diabetes Care’s insulin delivery portfolio. Accu-Chek Combo combines an Accu-Chek Spirit insulin pump and a high-end glucose meter with remote-control and bolus calculator capabilities. Users can deliver a bolus insulin dose anytime, anywhere, without having to touch their pump. The Accu-Chek Combo also offers small dose increments for optimised insulin dosing and fine-tuned glucose control. Premarketing activities have already started to secure the current customer base in preparation for the launch of this new system.
In 2007 its full-year sales increased 5%, slightly below average growth in an increasingly competitive market. Healthcare system changes affecting pricing and reimbursement had a negative impact on sales growth in several major markets.

Page 49
The Accu-Chek Aviva and Accu-Chek Compact blood glucose monitoring systems both posted sales increases, compensating for declining sales of the older Accu-Chek Advantage. Accu-Chek Aviva sales were up sharply from 2006 as a result of additional launches and continued market penetration. Accu-Chek Active, a compact, robust meter enabling discreet testing anywhere, also sold well, particularly in some EMEA (European, Middle Eastern and African) and South American markets.
Roche’s insulin delivery business posted double-digit growth, led by sales increases in Europe and North America. Consumer uptake of the Accu-Chek Spirit insulin pump in the United States was positive during its first full year on the US market.
Three new products were added to the diabetes care portfolio in 2007. Accu-Chek Performa, a blood glucose meter launched in the first quarter, automatically minimises the effects of temperature and other factors on test integrity. In the fourth quarter a new model of the Accu-Chek Compact meter was introduced in Germany, the United Kingdom and Norway. Among its features and benefits, this all-in-one system has a built-in test strip drum and is self-coding, for greater safety and only half the usual number of test steps. Accu-Chek 360°, last year’s third new product, is a software package that enables people with diabetes and their health professionals to store, track and analyse blood glucose readings, insulin dosages and other health information quickly and conveniently.
In 2006, following 1% growth in the first half-year, sales rose 5% in the third quarter and 6% in the fourth. Full-year sales were up 3% from the previous year.
The new Accu-Chek product portfolio included in 2006 the Accu-Chek Aviva and Accu-Chek Go blood glucose monitoring systems and Accu-Chek Compact Plus, an all-in-one system integrating a glucose meter with an automatic test strip dispenser and a lancing device as well as the Accu-Chek Multiclix lancing device, which features a unique preloaded lancet drum for safer, more convenient and comfortable blood sampling. Market uptake of these products was strong, spurring additional sales growth and helping to off-set declining sales of the Accu-Chek Advantage system, one of Roche Diabetes Care’s most successful products for nearly a decade. The rollout of new monitoring systems was completed in mid-2006 with the launch of the Accu-Chek Compact Plus in North America and Accu-Chek Aviva in Japan. In 2006 the entire new family of Accu-Chek products has become available worldwide.
In the United States customers have had access to the complete Roche portfolio of insulin delivery products since the FDA lifted its import alert on Accu-Chek insulin pumps in October 2006. The customer response there to the Accu-Chek Spirit pump, which is now available in more than 30 countries, was very positive during its first three months on the US market. Roche Diabetes Care's insulin delivery business posted double-digit growth.
Molecular Diagnostics
Roche Molecular Diagnostics develops and commercialises innovative diagnostic and blood screening platforms and tests based on Roche’s proprietary real-time polymerase chain reaction (PCR) technology. Because these products directly detect the genetic material (DNA or RNA) of infecting pathogens such as HIV or hepatitis viruses, they can identify and quantify infections earlier and more specifically than tests based on the body’s immune response to infection. As a result, patients can be treated and monitored with greater precision, and the risk of their infecting others through blood or organ donations is reduced. In addition to tests for HIV and hepatitis, Roche’s molecular diagnostics portfolio includes tests for other infectious diseases and tests to identify patients likely to respond to particular cancer therapies.
Based on its own information, Roche Molecular Diagnostics remains the industry leader, with a 33% share of a fast-growing but increasingly competitive market. Sales totalled 1,122 million Swiss francs in 2008, an increase of 5% from a year earlier. Sales showed double-digit growth in Asia–Pacific and Latin America, with single-digit growth in North America and the EMEA region.
Virology testing, Roche Molecular Diagnostics’ largest segment by sales, remained the most significant contributor to growth. Virology sales grew 4%, led by demand for automated real-time PCR platforms and tests for HIV-1 (the most common form of the virus that causes AIDS in humans) and hepatitis C and hepatitis B virus (HCV, HBV). Roche Molecular Diagnostics’ virology portfolio includes systems for automated sample preparation and real-time PCR analysis. The combined Cobas AmpliPrep/Cobas TaqMan (CAP/CTM) system is the only platform available worldwide that offers customers fully automated real-time PCR testing for clinical diagnostic use.
In October 2008 the US Food and Drug Administration (FDA) approved the CAP/CTM HCV Test, which quantifies the amount of hepatitis C virus (viral load) in a patient’s blood. A month earlier, in September, the Cobas TaqMan HBV Test became the first hepatitis B viral load test to receive FDA approval. This, along with
Page 50
the fully automated CAP/CTM HIV-1 Test approved in 2007, completed initial automation of Roche’s major virology products in the US market. Physicians use these tests to establish baseline levels of infection prior to treatment and to monitor patients’ responses to therapy by tracking changes in their virus levels during treatment. Numerous US laboratories have already signed contracts for the HCV and HBV tests, including one of the nation’s largest reference laboratories, which converted to the Roche HBV test just weeks after it was approved.
Second-generation versions of the CAP/CTM HIV-1 and HBV tests received CE Mark certification in December 2008, allowing them to be sold for clinical use in the European Union. The new HIV test has a unique dual-target design enabling simultaneous detection of two separate regions of the HIV genome. This provides greater test reliability when viral mutations are present. In addition, both new tests have even broader dynamic ranges (ability to quantify very low and very high viral loads) than earlier-generation tests. This is a critical advantage, since very high or very low levels of virus can indicate the need for more or less aggressive therapy. Regulatory filings for the new CAP/CTM HIV-1 and HBV tests are currently under review in Japan.
Sales of blood screening products, Molecular Diagnostics’ second-largest segment by sales, advanced 2% for the year, as additional blood centres in Europe, Asia Pacific and Latin America began routine screening with the multiplex cobas TaqSreen MPX Test on the fully automated cobas s 201 platform. The decline seen in this segment earlier in 2008, which resulted from price pressure and the ongoing effect of accounts lost in 2007, is levelling off, and further growth is expected in 2009.
In December 2008 the FDA approved the cobas TaqScreen MPX Test for use on the cobas s 201 system. This test is the most comprehensive nucleic acid test of its kind available today, offering the unique ability to detect HIV-1 groups M and O, HIV-2, HCV and HBV in a single automated assay. Originally launched in Europe in 2006, the cobas TaqScreen MPX Test has already been widely adopted by and demonstrated excellent performance in blood centres worldwide. In Japan the test has been used since September 2008 on the fully integrated cobas s 401 system to screen 100% of the Japanese blood supply.
The Cobas TaqMan CT Test v2.0, for improved detection of Chlamydia trachomatis (CT), was launched for clinical use in Europe, Asia–Pacific and Latin America in the second half of 2008. The transition to this new test, which runs on the automated Cobas TaqMan 48 real-time PCR analyser, has been completed in the majority of the markets where it is available. The Cobas TaqMan CT Test v2.0 simultaneously detects two targets within the Chlamydia cryptic plasmid and genome target DNA. As a result, it is able to detect infections caused by all known strains of CT, even if there are unexpected changes to the bacterial genome, as in the case of the recently discovered Swedish variant. Chlamydial infection is one of the most commonly reported sexually transmitted diseases. If left untreated, it can lead to serious complications such as pelvic inflammatory disease and infertility in women.
The Amplicor and Linear Array tests for detecting and identifying low- and high-risk strains of human papillomavirus (HPV) showed double-digit growth. Persistent infection with certain high-risk strains of HPV can progress to pre-cancerous conditions or cervical cancer. The Amplicor HPV test was approved and launched in Japan in September 2008.
In June 2008 Roche signed an exclusive deal with DxS Ltd. (UK) for distribution of the TheraScreen K-RAS Mutation Test, which Roche began distributing in December, and the TheraScreen EGFR 29 Mutation Test. Both tests are real-time PCR assays and have CE Mark certification. Used in conjunction with other clinically relevant information, K-RAS and EGFR mutation testing can aid doctors in determining patients’ suitability for certain cancer therapies.
Based on its own data Roche believes that Roche Molecular Diagnostics remained the industry leader in 2007 with a 36% share of a growing but increasingly competitive market. Overall sales decreased 2% as revenues from the industrial reagents business continued to decline. Excluding industrial reagents, sales advanced 3% compared with 2006.
Sales of virology products rose 4% in 2007, with placements of the automated Cobas AmpliPrep/Cobas TaqMan (CAP/CTM) platform continuing to show good growth in Europe and Asia–Pacific. This platform was successfully launched in the US and Japanese markets in the second half of the year. Virology is Roche Molecular Diagnostics’ largest segment by sales.
Automated tests for HIV-1 and hepatitis B and hepatitis C virus (HBV, HCV) were launched for the CAP/CTM platform in Japan, and the HIV-1 test was also introduced during the year in the United States. Uptake of all three tests remains strong in Europe, where they have been available since 2005. By the end of the year 122 supply contracts for the HIV-1 test had been signed with US laboratories, including a three-year contract with LabCorp of America. In 2008 Roche anticipates US approval and commercial launches of the HCV test for the
Page 51
CAP/CTM platform and an HBV test for the Cobas TaqMan 48 system; this will make Roche the first company to market a full suite of automated real-time PCR tests for major viral markers in the United States.
In the second largest segment, blood screening, full-year sales were down 1% in a very competitive market. In October Roche signed a five-year contract, effective from 2008, to supply its fully automated and integrated cobas s 401 instrument and cobas TaqScreen MPX (multiplex) Test to screen the entire Japanese Red Cross blood supply (roughly 5 million blood donations annually). Capable of simultaneously detecting HIV-1 (Groups M & O), HIV-2, HBV and HCV in donated blood and plasma, the cobas TaqScreen MPX Test has already been adopted by more than 50 sites across Europe, which run it on the fully automated modular cobas s 201 blood screening system.
The Amplicor and Linear Array tests for detecting and identifying low- and high-risk strains of human papillomavirus (HPV) also contributed to growth. Persistent infection with some strains of HPV is a major cause of cervical cancer.
In 2006, Roche Molecular Diagnostics maintained its leading market share at about 38% as sales advanced 3% for the year. Virology – the largest segment by sales – grew 5% in 2006, in line with the virology market.
In June 2006 Roche began rolling out the new fully automated cobas s 201 modular blood screening system and cobas TaqScreen MPX multiplex test across Europe. The cobas TaqScreen MPX test, which simultaneously detects HIV, HCV and HBV in donated blood, received CE Mark (Conformite europeenne) certification in March 2006. From that point of time these products were available in all European countries.
During 2006 additional large US laboratories signed on to offer the AmpliChip CYP450 Test, a microarray-based test that detects genetic variations which can affect the way patients respond to treatment with many widely prescribed drugs.
Applied Science
The life sciences encompass disciplines ranging from biology and biotechnology to medical research into major disease areas like cancer and virology. Roche Applied Science supplies a broad and growing array of instruments and highly specific test reagents and test kits for use in this diverse research market. Its product portfolio and capabilities are especially strong in genomics and proteomics, sciences that are transforming Roche's understanding and the treatment of disease.
In 2008 Roche Applied Science recorded sales of 765 million Swiss francs. This was an increase of 19% for the year, more than three times the estimated market growth rate (6%). Sales of DNA sequencing products, led once again by the ultra-fast Genome Sequencer FLX (GS FLX), nearly doubled, despite increased pressure from competitors. Roche Applied Science is the market leader in placements of next-generation sequencing systems. Products for real-time quantitative PCR (qPCR) analysis, particularly the LightCycler 480 instruments and reagents, delivered robust double-digit growth, with strong sales increases in North America and China. Total instrument placements roughly doubled in 2008. Microarray systems made a significant contribution to full-year sales; sequential quarterly sales growth for these products has been steady and strong since Roche acquired NimbleGen in August 2007.
Biochemical and industrial reagents, which account for a major part of Roche Applied Science’s revenues, showed moderate growth overall in a market impacted by flat government funding for life science research.
In late September 2008 Roche Applied Science launched its GS FLX Titanium series of next-generation sequencing products (including new reagents and software). Compared with standard GS FLX sequencing, Titanium increases throughput by a factor of five. Roche NimbleGen’s SeqCap (sequence capture) arrays, which help laboratories to take full advantage of this sequencing capacity, were introduced in initial markets in March 2008 and are now available worldwide. These high-density arrays produce targeted, sequencing-ready samples much faster and more cost-effectively than conventional methods of sample preparation, thus easing a major bottleneck in genomic research.
Other major launches included MagNa Pure 2.0, a redesigned and improved instrument for automated qPCR sample preparation, and the first of a new family of pre-plated, ready-to-use qPCR assays called RealTime ready. The RealTime assays will make the LightCycler systems even more competitive and are expected to be an important sales driver. The LightCycler series was also strengthened by the launch of the LightCycler 480 II in the first half of 2008. The new LightCycler instrument features enhanced analysis software for greater efficiency over a range of applications.
In the second half of 2008 Roche Applied Science successfully launched single- and multi-plate versions of the xCELLigence cell analyser, a system co-developed with ACEA Biosciences, Inc. The analyser uses a technology that eliminates the need for labour- and cost-intensive steps like cell labelling and cell fixation and

Page 52
measures changes in cell morphology, cell proliferation and cell death in real time. Very importantly, it could significantly reduce the use of animal testing in pharmaceutical research and toxicology, among other areas. Initial placements have already occurred in all regions.
Roche Applied Science’s sales increased 11% in 2007, well ahead of the average growth of the life sciences market. Once again the main growth drivers were the LightCycler 480 instrument, the Genome Sequencer systems and research reagents. All of the business area’s main products sold well. Roche Applied Science maintained its share of the genomics systems market while more than doubling its share of the rapidly expanding market for DNA sequencing products. This significant increase was due primarily to the versatile, ultra-fast Genome Sequencer FLX system, launched in the first half of 2007. Gene scanning software and reagents, also launched in 2007, have enhanced the versatility of the LightCycler 480 system, which can now be used to screen DNA samples for previously unknown variations in genes as well as to detect known genetic variants.
The integration of 454 Life Sciences and NimbleGen Systems, Inc., both acquired by Roche in 2007, was proceeding in 2007 as planned. As a result of these acquisitions, Roche now offers the industry’s most comprehensive, high-throughput workflow solutions for unlocking the secrets of the genome. In November the business area also strengthened its capabilities in cell analysis by signing an exclusive agreement with ACEA Biosciences Inc. to develop, supply and distribute systems based on ACEA’s real-time cell assay technology.
Industrial reagents and substrates, which account for a major part of Roche Applied Science’s sales revenues, remained important contributors to growth in 2007.
Roche Applied Science’s sales grew 12% in 2006, nearly twice the market growth rate. Growth was driven primarily by the LightCycler 480 instrument and Genome Sequencer 20 system. LightCycler 480 is a highly versatile high-through-put gene expression and mutation analysis platform based on the polymerase chain reaction (PCR) technology pioneered by Roche. The innovative Genome Sequencer 20 system, first launched in late 2005, marked Roche’s successful entry into the attractive DNA sequencing research market. It can sequence long DNA fragments and entire genomes 60 times faster than conventional commercially available instruments.
Roche Applied Science is also a supplier of industrial reagents and substrates, which account for a major part of its sales revenues. These products were important contributors to growth in 2006.
Tissue Diagnostics
Ventana Medical Systems, now also known as Roche Tissue Diagnostics, is the world’s leading tissue-based cancer diagnostic company. Roche Tissue Diagnostics develops and manufactures medical diagnostic instruments and reagent systems that provide leading-edge automation technology for use in the diagnosis and prognosis of cancer and infectious disease. In addition, the company offers premier workflow solutions designed to improve laboratory testing efficiency, providing automated safeguards to enhance the quality of patient healthcare worldwide. Also, its discovery research aids pharmaceutical and biotech companies to accelerate the identification of potential biomarkers and new drug targets.
Roche Tissue Diagnostics demonstrated a strong year of solid revenue and product development performance since being acquired in February 2008. Commercial operations have now been integrated into Roche, and efforts are well under way to expand the business into new markets in Europe, Latin America and Asia–Pacific. The business area remains headquartered in the United States and will continue to operate as Ventana Medical Systems, Inc. in North America.
Roche’s consolidated full-year results for 2008 include Roche Tissue Diagnostics sales of 376 million Swiss francs, representing sales from the date of acquisition in February to 31 December 2008. These additional sales contributed four percentage points to the Diagnostics Division’s local-currency sales growth. On a stand-alone basis, Roche Tissue Diagnostics’ sales for the entire year reached 369 million US dollars, an increase of 23% in local currencies (26% in US dollars) over 2007. This was significantly faster than the estimated market growth rate of 14%. Sales increased at above-market rates in North America, EMEA and Asia–Pacific, helped by new products for advanced and primary staining and workflow management.
Advanced tissue staining (immunohistochemistry and in situ hybridisation) remained the business area’s biggest growth driver, delivering robust reagent sales and an even stronger increase in instrument sales. Sales of the fully automated BenchMark XT and BenchMark LT instruments and immunohistochemistry reagents all increased at high double-digit growth rates.
BenchMark Ultra, a new system that performs immunohistochemistry and in situ hybridisation testing simultaneously on a single continuous and random access platform was launched in the United States and Canada in August and in Europe in November. The BenchMark Ultra has 30 individual staining chambers, each

Page 53
of which can be accessed at any time without interrupting workflow. As a result, test turnaround times are reduced significantly, and STAT samples (those requiring rush testing) can be added at any time for expedited patient diagnosis. The market response to the BenchMark Ultra has been very positive, with a significant number of placements in 2008 and substantial sales acceleration expected in 2009.
In 2008 Roche Tissue Diagnostics expanded its immunohistochemistry menu with a total of ten new CONFIRM antibodies for various cancers, including thyroid, lung, prostate and breast cancers and lymphoma.
US placements of the Symphony instrument for hematoxylin and eosin staining accelerated in the second half of 2008, following upgrades that further enhance system reliability and staining interpretation. Symphony’s commercial performance in the high-volume primary staining market is expected to improve further in 2009; launches in Europe and Australia are planned for the second and third quarters of the year. Overall, sales of primary staining instruments and reagents were up 27% for the year.
Uptake of the Vantage workflow solution launched in the United States in April 2008 was even stronger than expected, with orders well over forecast for 2008. Vantage is a complete workflow information management system for the anatomical pathology laboratory, providing tracking capabilities that streamline and integrate lab work and information flows for greater productivity and patient safety. The product will be rolled out in Europe and Australia starting in the third quarter of 2009.
Research and Development Roche Diagnostics continues to invest heavily in innovation. In 2008 research and development (R&D) costs increased 26% to 941 million Swiss francs (2007: CHF 787 million), reflecting investments in the sequencing business, new immunoassays, molecular diagnostic tests and platforms for infectious diseases and cancer, new products for diabetes care, advanced staining systems and laboratory information management solutions. These areas will continue to be R&D priorities in 2009. R&D spending as a percentage of sales increased to 9.7%, up from 8.4% in 2007.
Professional Diagnostics
Roche Professional Diagnostics’ single most important launch in 2009 will be the cobas 8000 series of modular Serum Work Area instruments for high-volume laboratories. This addition to the cobas instrument family will be one of the fastest integrated systems available and offer a wider choice of configurations than any other high-workload solution currently on the market. It replaces existing Roche systems and is expected to significantly enhance Roche’s competitiveness in both immunoassays and clinical chemistry. Launches in most key markets outside the United States are planned for 2009, with a US launch expected in 2010.
Other significant new systems and system enhancements reaching the market in 2009 will include the cobas p 501 and cobas p 701 post-analytical sample storage and retrieval modules, which will be launched globally, and the cobas b 123 multiparameter blood gas analyser for use in critical care settings, scheduled for launch this year in Europe, Japan and the United States. The cobas e-LabPerformance portal for benchmarking Serum Work Area results will be rolled out in the first quarter of 2009.
Roche also continues to expand its immunoassay and clinical chemistry menus, with a number of important new tests scheduled for launch in 2009.
Roche Professional Diagnostics and the Pharmaceuticals Division are working closely in a number of areas to support the Group’s strategic focus on personalised healthcare. These include joint marketing activities for the use of Elecsys bone markers to monitor osteoporosis in patients receiving Bonviva/Boniva. They also include joint exploratory biomarker programmes using an innovative multiplex technology developed by Roche. These programmes are supporting late-stage drug development projects in rheumatoid arthritis and oncology. Additionally, synergies between the two divisions are being utilised to develop new high-medical-value diagnostics for these two important disease areas.
Diabetes Care
Research and development spending in 2008 went to support the new product launches planned for 2009 and to develop future technology platforms. Near-term investment focused particularly on the new Accu-Chek Mobile integrated blood glucose monitoring system and updated Accu-Chek Aviva and Accu-Chek Performa platforms, all slated for launch in the first quarter of 2009. Roche Diabetes Care stepped up investment in commercially developing its proprietary continuous glucose monitoring technology. This is a long-term project aimed at producing a small, easy-to-use continuous monitoring system suitable for a broad spectrum of customers. Roche continues to investigate the value of blood glucose monitoring for diabetes management, particularly in type 2 diabetes, in clinical trials. Activities aimed at integrating glucose monitoring and data management with insulin

Page 54
delivery are ongoing and may one day result in systems that closely mimic the way the healthy pancreas regulates blood glucose levels.
Molecular Diagnostics
Roche Molecular Diagnostics is pursuing new tests and automation platforms to improve the diagnosis and treatment of disease, with a focus on infectious disease and oncology.
Development of the cobas 4800 system, a new platform combining fully automated DNA extraction and real-time PCR amplification and detection, is on track, with a European launch planned for 2009. It will initially be offered with assays for HPV, Chlamydia trachomatis and Neisseria gonorrhoeae.
Enrolment for Roche’s clinical trial to support US registration of its HPV tests is well under way and will continue in 2009. The trial is evaluating the tests’ performance in detecting high-grade cervical disease in women undergoing routine cervical cancer screening.
Development of a test to screen for methicillin-resistant Staphylococcus aureus (MRSA), a form of staph infection that is difficult to treat and which can be deadly, is also on track for a launch in 2009. Reducing the spread of MRSA is a major public health concern worldwide.
The business area continues to work closely with Roche’s Pharmaceuticals Division and others on companion tests for new therapeutics. A microarray-based test to identify mutations in the p53 tumour suppressor gene, for example, is being explored as a companion diagnostic for a new class of anticancer drugs called Nutlins, currently in early development at Roche. Work is also progressing on a real-time PCR test to screen for a common cancer-causing mutation of the B-Raf kinase gene. The B-Raf test may aid the development of a targeted cancer therapy which Roche and Plexxikon Inc. are working on and which selectively inhibits this mutated form of the B-Raf gene.
Applied Science
Efforts at Roche Applied Science’s research and development facilities in Penzberg (Germany) and Branford and Madison (both US) remain focused on enhancing the efficiency and expanding the range of uses of the LightCycler, Genome Sequencer and NimbleGen microarray technologies. In 2008 this resulted, for example, in the launch of a new generation of genome discovery arrays (NimbleGen HD2) combining the speed and efficiency of a multiplex platform with the ability to deliver high-resolution, high-quality data. Another ongoing priority is to integrate and increase the throughput of the LightCycler and MagNA Pure platforms. Supporting the Roche Group’s strategic focus on personalised healthcare, Roche Applied Science and the Pharmaceuticals Division are pursuing projects aimed at discovering and validating biomarkers which may facilitate drug development or have potential diagnostic applications, particularly in the areas of oncology and inflammatory disease. In addition, potential uses for microarrays and genome sequencing are being investigated across all of the Pharmaceuticals Division’s major research areas of interest, and a similar joint evaluation of the xCELLigence analyser is also under way.
Tissue Diagnostics
Roche Tissue Diagnostics has multiple platforms and technologies in various stages of development that will continue to advance anatomical pathology through increased test efficiency and enhanced medical value.
Together with Roche’s Pharmaceuticals Division, the business area continues to develop exploratory tests with a view to capturing long-term companion diagnostics opportunities for Roche therapies. Notable projects include the development of dual colour immunohistochemistry and in situ hybridisation assays. Such tests are part of a trend in personalised healthcare towards evaluating more than one analyte per diagnostic kit. Quantum dot (Qdot) assays expand multiplexing even further. In oncology, work is under way on an automated Qdot assay to detect protein levels in human tissue samples using monoclonal antibodies. Collaboration is also under way on an enhanced HER-2 test which is expected to be available outside the United States in the second quarter of 2009.

Page 55
5. PRINCIPAL MARKETS
This table sets out the principal markets in which Roche competes, including a breakdown of total sales by division and geographical area.
2006 2007 2008
Sales by Division in millions of CHF
Pharmaceuticals 33,294 36,783 35,961 Diagnostics 8,747 9,350 9,656 Total 42,041 46,133 45,617
Sales by Geographical Area in millions of CHF
Switzerland 471 489 509 European Union 13,823 15,465 15,601 - of which Germany 2,993 3,277 3,200 Rest of Europe 1,307 1,620 1,521 Europe 15,601 17,574 17,631 United States
15,685
17,069 16,362
Rest of North America 985 1,004 932 North America 16,670 18,073 17,294 Latin America
2,539
2,784 2,975
Japan
3,713
3,562 3,532
Rest of Asia 2,384 2,681 2,920 Asia 6,097 6,243 6,452 Africa, Australia and Oceania
1,134
1,459 1,265
Total 42,041 46,133 45,617
European Union information is based on members of the EU as at 31 December 2008. The comparative information has been restated to include EU members for the whole five-year period.
6. PRINCIPAL INVESTMENTS
6.1 In the past three years, the Group conducted the following principal investments:
The principal investments of the Group in 2008 included the acquisition of 100% controlling interests in four companies (two US companies, a Canadian and a UK company) for a total purchase consideration of 4,337 million Swiss francs including directly attributable transaction costs in an aggregate amount of 47 million Swiss francs (6 million Swiss francs related to acquisitions by the Pharmaceuticals Division and 41 million Swiss francs related to acquisitions by the Diagnostics Division).
Effective 8 February 2008 the Group acquired a further 70.5% of the outstanding shares of Ventana Medical Systems, Inc. (‘Ventana’) and obtained control of Ventana. Ventana is a publicly owned US company based in Tucson, Arizona that had been listed on the NASDAQ under the symbol ‘VMSI’. Prior to 8 February 2008, the Group owned shares in Ventana representing 0.4% of the outstanding shares of Ventana. Ventana develops, manufactures and markets instrument/reagent systems that automate slide preparation and staining in clinical histology and drug discovery laboratories. Ventana’s clinical systems are used in the diagnosis and treatment of cancer and infectious diseases and their drug discovery systems are used by pharmaceutical and biotechnology companies to accelerate the discovery of new drug targets and to evaluate the safety of new drug compounds. Ventana is now reported as part of the Diagnostics operating segment. The acquisition of Ventana, a leader in the fast-growing histopathology (tissue-based diagnostics) business segment, will allow the Group to broaden its diagnostic offerings and complement its world leadership in both in-vitro diagnostic systems and oncology therapies. The purchase consideration was 2,532 million Swiss francs in cash. The Group recognised a gain of 5 million Swiss francs as a result of measuring at fair value its 0.4% equity interest in Ventana held prior to the

Page 56
acquisition date. This gain is included in financial income for 2008. Directly attributable acquisition-related costs of 41 million Swiss francs were incurred in the transaction. These are reported within general and administration expenses in the current period as part of the operating result of the Diagnostics operating segment.
Subsequent to the effective date of the acquisition on 8 February 2008, the Group purchased the remaining shares in Ventana held by third parties to give the Group a 100% interest in Ventana. The cash consideration was 1,285 million Swiss francs, which has been recorded to equity as a change in ownership interest in subsidiaries.
Effective 23 May 2008 the Group acquired a 100% controlling interest in Piramed Ltd. ('Piramed'), a privately owned biotechnology company based in the UK. Piramed discovers and develops new medicines primarily for the treatment of cancer and immune inflammatory disorders such as arthritis and asthma. Piramed is a leading company in the discovery of highly selective drugs that inhibit different isoforms of PI3-K enzymes that are increasingly recognised as key players in a wide variety of disease processes. Piramed is reported as part of the Roche Pharmaceuticals operating segment. The acquisition will further strengthen the Group’s research and development pipeline in oncology and inflammatory disease. The purchase consideration was 183 million Swiss francs. This consisted of 176 million Swiss francs paid in cash and 7 million Swiss francs from a contingent consideration arrangement. The contingent consideration arrangement consists of a potential milestone payment of 15 million US dollars which is due upon the commencement of phase II clinical trials for Piramed’s oncology programme. A liability of 7 million US dollars (7 million Swiss francs) was recognised at the acquisition date, based on management’s best estimate of the probability–adjusted expected cash outflow from the arrangement. As at 31 December 2008 the amount recognised for this arrangement was unchanged, based on the most recent management estimates.
Effective 24 September 2008 the Group acquired a 100% controlling interest in ARIUS Research Inc. ('ARIUS'), a publicly owned Canadian biotechnology company that had been listed on the TSX under the symbol ‘ARI’. ARIUS discovers and develops antibody therapeutics to treat cancer and other diseases, including a proprietary antibody platform, which rapidly identifies and selects antibodies based on their functional ability to affect disease before progressing into clinical development. ARIUS is reported as part of the Roche Pharmaceuticals operating segment. The acquisition will further strengthen the Group’s developmental portfolio, initially within the areas of oncology and inflammatory diseases where this new technique offers potentially broad therapeutic applications. The purchase consideration was 201 million Swiss francs, paid in cash.
Effective 30 September 2008 the Group acquired a 100% controlling interest in Mirus Bio Corporation ('Mirus'), a privately owned US biotechnology company based in Madison, Wisconsin. Mirus (now renamed Roche Madison Inc.) focuses on the discovery and development of innovative nucleic acid based technologies, including a proprietary RNAi (ribonucleic acid interference) delivery platform. Mirus is reported as part of the Roche Pharmaceuticals operating segment. The acquisition will further strengthen the Group’s research and development pipeline in RNAi therapeutics, which provides the capabilities to target complex diseases such as cancer, respiratory or metabolic disorders. The purchase consideration was 136 million Swiss francs, paid in cash.
There were other minor business combinations with a total purchase consideration of 17 million Swiss francs.
The principal investments of the Group in 2007 included the acquisition of 100% controlling interests in five US companies for a total purchase consideration of 2,443 million Swiss francs including directly attributable costs in an aggregate amount of 15 million Swiss francs.
Effective 26 June 2007 the Group acquired a 100% controlling interest in BioVeris Corporation (‘BioVeris’), a publicly owned US company that had been listed on the NASDAQ under the symbol ‘BIOV’. BioVeris is a healthcare and biosecurity company based in Gaithersburg, Maryland, that specialises in developing proprietary technologies in diagnostics. BioVeris is reported as part of the Diagnostics operating segment. The purchase consideration was 745 million Swiss francs, which consisted of 741 million Swiss francs of cash and 4 million Swiss francs of directly attributable costs.
Furthermore as of 2 August 2007, Genentech acquired a 100% controlling interest in Tanox, Inc. (‘Tanox’), a publicly owned US company that had been listed on the NASDAQ under the symbol ‘TNOX’. Tanox is a biotechnology company based in Houston, Texas, that specialises in the discovery and development of biotherapeutics based on monoclonal antibody technology. Genentech and Tanox have been working together in collaboration with Novartis since 1996 to develop and commercialise Xolair. The purchase consideration was 1,124 million Swiss francs, which consisted of 1,114 million Swiss francs of cash and 10 million Swiss francs of directly attributable costs.

Page 57
Effective 28 March 2007 the Group acquired a 100% controlling interest in Therapeutic Human Polyclonals, Inc. ('THP'), a privately owned US biotechnology company based in California and Germany. THP is reported as part of the Roche Pharmaceuticals operating segment. The purchase consideration paid was 69 million Swiss francs in cash.
Effective 25 May 2007 the Group acquired a 100% controlling interest in 454 Life Sciences, a majority-owned US subsidiary of CuraGen Corporation. 454 Life Sciences develops and commercialises novel instrumentation for high-throughput DNA sequencing and is based in Branford, Connecticut. 454 Life Sciences is reported as part of the Diagnostics operating segment. The purchase consideration paid was 189 million Swiss francs in cash, which consisted of 188 million Swiss francs of cash and 1 million Swiss francs of directly attributable costs.
Effective 8 August 2007 the Group acquired a 100% controlling interest in NimbleGen Systems, Inc. (‘NimbleGen’), a privately owned US company. NimbleGen develops and commercialises high density DNA microarrays and is based in Madison, Wisconsin. NimbleGen is reported as part of the Diagnostics operating segment. The purchase consideration was 316 million Swiss francs in cash.
There were other minor business combinations with a total purchase consideration of 18 million Swiss francs.
There were no acquisitions of subsidiaries or associated companies during 2006.
The largest investing cash flows in 2006 are for expenditure on property, plant and equipment of 3.6 billion Swiss francs, particularly for biotechnology manufacturing facilities. The investing cash flows in 2006 comprise a broad range of different investments and there have been no individual principal investments in 2006. In 2005 cash flows include expenditure on property, plant and equipment of 3.3 billion Swiss francs, in particular the 0.5 billion Swiss francs used by Genentech, Inc. (‘Genentech’), in which Roche holds a majority interest of 55,7% (at 31 December 2005), to purchase the Oceanside biologics manufacturing facility.
In the past three financial years, the following additions to property, plant and equipment were made (by division and geographical area):
2006 2007 2008
Additions to property, plant and equipment by division in millions of CHF
Pharmaceuticals 3,030 2,588 1,940 Diagnostics 846 1,058 1,245 Corporate 2 2 2 Total 3,878 3,648 3,187 Additions to property, plant and equipment by geographical area in millions of CHF
Switzerland 350 418 421 European Union 995 993 960 - of which is Germany 661 660 591 Rest of Europe 15 30 17 Europe 1,360 1,441 1,398 United States
2,061
1,679 1,212
Rest of North America 47 34 21 North America 2,108 1,713 1,233 Latin America
101
133 127
Japan
201
230 292
Rest of Asia 69 103 116 Asia 270 333 408 Africa, Australia and Oceania
39
28 21
Total 3,878 3,648 3,187
European Union information is based on members of the EU as at 31 December 2008. The comparative information has been restated to include new EU members for the whole five-year period.
Page 58
6.2 The Group has non-cancellable capital commitments for the purchase or construction of property, plant and equipment totalling 2.0 billion Swiss francs (2007: 2.3 billion Swiss francs). The capital expenditure is mostly in biotechnology manufacturing plants in Switzerland (such as a new technical research and development building in Basel), Japan and the US (for further information on geographical areas please refer to pages 237, 238 of this Prospectus).
6.3 Since 1 Januray 2009 the Group has entered into several minor business combinations including, among others, the acquisition of Memory Pharmaceuticals Corp. which (except for the acquisition of Memory Pharmaceuticals Corp.) are subject to shareholder approval and regulatory clearance as appropriate. The total purchase consideration, excluding transaction costs, is approximately 100 million Swiss francs in cash, including approximately 48 million Swiss francs for Memory Pharmaceuticals Corp. Funds will be or have been provided from the Group’s cash on hand at the time of closing.
6.4 In July 2008, the Roche Group announced its intention to purchase all of the shares of Genentech not owned by it. Following months of unsuccessful negotiations with the independent directors of Genentech, on 9 February 2009, Roche Investments USA Inc. commenced a cash tender offer for the publicly-held Genentech shares at USD 86.50 per share. The tender offer was subject, among others, to the following conditions: (1) holders of at least a majority of the outstanding publicly-held shares accept the offer and (2) Roche obtains sufficient financing.
On 12 March 2009, Roche entered into a merger agreement with Genentech pursuant to which the Group is making a tender offer to purchase all of the shares of Genentech not owned by the Group for USD 95.00 per share in cash.
The tender offer expired on 25 March 2009. As at the close of the offer on 25 March 2009, 84.7 per cent of the outstanding publicly-held shares of Genentech have been tendered. Roche Investments USA Inc. has accepted for payment all shares validly tendered pursuant to its tender offer and closed the tender offer. Together with the 55.7 per cent of the outstanding shares already held by Roche, Roche now holds a total of approximately 982.9 million or 93.2 per cent of the 1,054,555,886 Genentech shares outstanding. In addition, a further 3.0 per cent of Genentech’s outstanding shares were guaranteed to be delivered within the next three business days from the closing of the tender offer which, if added to the shares already received in the tender offer and Roche’s existing stake, would represent approximately 96.2% of Genentech’s total outstanding shares. Public shareholders who have tendered their shares will promptly receive USD 95.00 per share for their shares.
Pursuant to the merger agreement Roche has caused a short-form merger in which all remaining Genentech stockholders after the tender offer will receive USD 95.00 per Genentech share in cash, subject to stockholders’ statutory appraisal rights. Genentech has become a wholly-owned subsidiary of the Roche Group. Following the merger, Genentech’s common stock will no longer be traded on the New York Stock Exchange after Thursday, 26 March 2009.
The acquisition of all public shares, including shares issuable under Genentech's outstanding employee stock options and payment of related fees and expenses, costs approximately USD 46.8 billion. The Group has financed the transaction by a combination of the Group's own funds, commercial paper back-stopped by a credit facility, and debt securities. The Group has raised net proceeds of approximately USD 46 billion (based on 20 March 2009 exchange rates) through a series of debt offerings.
The series of notes offered to finance the transaction consists of U.S. dollar-denominated notes, Euro-denominated and Sterling-denominated notes, Swiss franc-denominated notes, as well as commercial paper.
On 25 February 2009, Roche completed an offering of U.S. dollar-denominated notes to qualified institutional buyers in the United States under Rule 144A and to persons other than U.S. persons outside the United States under Regulation S of the U.S. Securities Act of 1933 (as amended). Roche received approximately USD 16,263.7 million in aggregate net proceeds from the issuance and sale of these notes.
The U.S. dollar-denominated notes were fixed- and floating-rate senior unsecured notes with the following principal terms:

Page 59
Maturity Type Coupon Amount, USD bn 1 year Floating rate LIBOR+100 bp 3.00 2 years Floating rate LIBOR+200 bp 1.25 3 years Fixed rate 4.500% 2.50 5 years Fixed rate 5.000% 2.75 10 years Fixed rate 6.000% 4.50 30 years Fixed rate 7.000% 2.50 Total 16.50
On 4 March 2009, Roche completed an offering of Euro and Sterling-denominated notes under a European Medium Term Note (EMTN) programme. Roche received approximately EUR 11,176.7 million and GBP 1,237.5 million in aggregate net proceeds from the issuance and sale of these notes. The Euro and Sterling-denominated notes were fixed- and floating-rate senior unsecured notes with the following principal terms:
Maturity Type Coupon Amount, EUR bn 1 year Floating rate EURIBOR+95 bp 1.50 4 years Fixed rate 4.625% 5.25 7 years Fixed rate 5.625% 2.75 12 years Fixed rate 6.500% 1.75 Total 11.25
Maturity Type Coupon Amount, GBP bn 6 years Fixed rate 5.500% 1.25
On 20 March 2009, Roche Holdings, Inc. issued U.S. dollar-denominated notes with a face value of USD 2.5 billion and a fixed-rate coupon of 1.95% with a six month maturity. The notes issued pursuant to Rule 144A of the U.S. Securities Act of 1933 (as amended) which are exempt from registration. Roche received approximately USD 2,499.8 million in aggregate net proceeds from the issuance and sale of these notes. The notes mentioned above are obligations of Roche Holdings, Inc., a wholly-owned subsidiary of Roche Holding Ltd, the ultimate parent company of the Roche Group and the guarantor of the notes. Roche Holding Ltd is rated AA- (stable outlook) by Standard & Poor’s and Aa1 (under review for downgrade) by Moody’s. On 23 March 2009, Roche Kapitalmarkt AG and Roche Holdings, Inc. completed an offering of Swiss franc-denominated bonds and notes. Roche received approximately CHF 7,960 million in aggregate net proceeds from the issuance and sale of these bonds and notes. The Swiss franc-denominated bonds were fixed-rate notes with the following principal terms
Maturity Type Coupon Amount, USD bn 6 month Fixed rate 1.2% 4.00 3 years Fixed rate 2.5% 2.50 8 years Fixed rate 4.5% 1.50 Total 8.00
The Swiss franc-denominated bonds and notes above are also guaranteed by Roche Holding Ltd. As of 26 March 2009 Roche Holdings, Inc. has a nominal amount of USD 3,250 million of commercial paper outstanding under its USD 7.5 billion U.S. commercial paper program. Roche received approximately USD 3,248.4 million in aggregate amount net proceeds from the issuance and sale of these commercial paper.
7. TOTAL RESEARCH AND DEVELOPMENT
7.1 The total amount spent by Roche on research and development (in millions of CHF) in 2008 was CHF 8,845, in 2007 was CHF 8,385, and in 2006 it was CHF 6,589.

Page 60
8. EMPLOYEES
The following table sets out the Group’s total employees at the end of each financial year split by business division.
Year Pharmaceuticals Diagnostics Other Total
2006 53,241* 20,712 419 74,372
2007 55,091* 23,062 451 78,604
2008 54,141* 25,404 535 80,080 * Including the employees of Chugai (6,590 employees, 2007: 6,465) and Genentech (11,029 employees, 2007: 11,060).
The following table sets out the Group’s total employees at the end of each financial year split by geographical location.
2008 2007 2006
Number of Employees by Region
Europe 34,570 34,510 32,818 Switzerland alone 9,991 9,523 8,908
North America 25,823 24,765 23,239 Latin America 4,988 5,007 4,632 Asia 13,065 12,751 12,119
Japan alone 7,291 7,113 6,815 Others 1,634 1,571 1,564
There have been no material changes to the number and location of employees as set out in the above two tables since the 31 December 2008.
9. CURRENT TRADING AND PROSPECTS
Barring unforeseen events, the Roche Group expects to continue to perform strongly in 2009. Full-year sales in both the Pharmaceuticals Division and the Diagnostics Division are expected to grow ahead of the market, with increases in the mid-single-digit range in local currencies. Roche will continue to invest in the large-scale confirmatory clinical trials that are vital to the Roche’s long-term success. Despite the higher research and development costs involved and the expected lower net financial result, Roche is aiming for Core Earnings per Share (Core EPS) at constant exchange rates to remain at the same high level as in 2008. Following the proposed acquisition of the outstanding Genentech shares, Roche expects that the acquisition will have a positive impact on Core EPS within the first year after closing.
The cost development in the first two months of the year 2009 is in a reasonable proportion to the development of the entire business of the Company and there has been no material adverse change in the prospects of the Company since 31 December 2008.
Page 61
PART 4 DIRECTORS, EXECUTIVE COMMITTEE AND CORPORATE GOVERNANCE
1. DIRECTORS AND EXECUTIVE COMMITTEE
1.1 The Board of Directors and the Executive Committee are two of the most important executive bodies of the Company.
Directors
1.2 The Board of Directors, as administrative body of the Company, is responsible for the overall governance of the Company and of the Group and for overseeing the management of their affairs. This includes formulating a medium and long term strategy, laying down guidelines for corporate policy and establishing the basic organisational structure of the Company. The Board also defines the guidelines for accounting and financial planning and make key decisions of substantial strategic significance. All directors are non-executive directors. None of the non-executive members of the Board of Directors has been a member of Roche's Executive Committee or served in an executive capacity at any Group subsidiary during the three financial years preceding the current reporting period except for the Chairman of the Board Franz B. Humer who served in an executive capacity as Chief Executive Officer (CEO) until 4 March 2008. At the 2008 Annual General Meeting on 4 March 2008, Franz B. Humer stepped down as CEO of the Roche Group and has since then focused on his role as Chairman of the Board of Directors. Effective from the same date for this reason, the role and responsibilities of the Independent Lead Director, a position previously held by Bruno Gehrig has been incorporated into the role of the Chairman of the Board with part of the Independent Lead Director's remit reassigned to the Vice-Chairmen. Bruno Gehring and André Hoffmann continue to serve as Vice-Chairmen. The Directors of the Company are as follows: Name, Year of Birth
Committee Membership
Position
Term ends First
elected
Board of Directors
Dr Franz B. Humer (1946) D*, E Chairman 2012 1995
Prof. Dr Bruno Gehrig (1946) C*, D, E Vice-Chairman 2011 2004
André Hoffmann (1958) C, D, E Vice-Chairman 2012 1996
Prof. Dr Pius Baschera (1950) A, E 2011 2007
Prof. Sir John Irving Bell (1952)
C, E 2012 2001
Peter Brabeck-Letmathe (1944)
E 2010 2000
Lodewijk J.R. de Vink (1945) C, E 2011 2004
Walter Frey (1943) A, B, E 2011 2001
Dr DeAnne Julius (1949) B*, E 2010 2002
Dr Andreas Oeri (1949) A*, E 2011 1996
Dr Wolfgang Ruttenstorfer (1950)
B, E 2011 2007
Prof. Dr Horst Teltschik (1940) A, B, E 2010 2002
Prof. Dr Beatrice Weder di Mauro (1965)
A, B, E 2010 2006
A Corporate Governance and Sustainability Committee. D Presidium of the Board of Directors/Nomination Committee.
B Audit Committee. E Non-executive director.
C Remuneration Committee.
* Committee chairperson

Page 62
Secretary to the Board of Directors
Dr. Gottlieb A. Keller (1954)
1.3 The Secretary to the Board of Directors is elected by the Board of Directors and need not be a Director himself. The secretary takes the minutes of the Board meetings which shall be signed by the person chairing the meeting and by the secretary.
Executive Committee
1.4 The Executive Committee is the management body of the Company. The members of the Executive Committee shall be appointed by the Board of Directors upon proposal by the Nomination Committee chaired by the Executive Chairman. They do not have fixed terms. The scope of the duties of the Executive Committee includes investments, leasing transactions or divestments that exceed CHF 10 million, submitting proposals in respect of investments in excess of CHF 100 million, setting the annual salary parameters for employees, drawing up a five-year plan for the budget, and operating transactions with a commercial value in excess of CHF 5 million. The Enlarged Executive Committee members are entitled to join all the meetings and participate in the discussions of the Executive Committee. However, they are not members of the Executive Committee. The Executive Committee and Enlarged Executive Committee members are as follows:
Name, Year of Birth Appointed to Position Position
Executive Committee Dr Severin Schwan (1967)
2008 Chief Executive Officer (CEO) of the Roche Group
Dr Erich Hunziker (1953) 2001 Chief Financial Officer (CFO) and Deputy Head of the Executive Committee
William M. Burns (1947) 2005 Pharmaceuticals Division, CEO Division Roche Pharmaceuticals
Dr Jürgen Schwiezer (1944)
2008 Diagnostics Division, CEO Division Roche Diagnostics
Prof. Dr Jonathan K.C. Knowles (1947)
1998 Head of Group Research
Dr Gottlieb A. Keller (1954)
2004 Head of Corporate Services and General Counsel
Sylvia Ayyobi (1953) 2008 Head of Human Resources
Enlarged Executive Committee
Burkhard G. Piper (1961) 2005 Head of Roche Diagnostics’ business area Roche Diabetes Care
Per-Olof Attinger (1960) 2009 Head of Global Corporate Communications
Dr Pascal Soriot (1959) 2007 Head of Commercial Operations Pharmaceuticals Division
Osamu Nagayama (1947) 1992 President and CEO, Chugai
Secretary to the Executive Committee
René Kissling (1966)
1.5 The business address of each of the Directors and members of the Executive Committee is Grenzacherstrasse 124, 4058 Basel, Switzerland.

Page 63
1.6 Mr André Hoffmann, Vice-Chairman of the Board of Directors, and Dr Andreas Oeri, member of the Board of Directors, are cousins. There are no other family relations between the members of the Board of Directors and/or the Executive Committee and/or the Enlarged Executive Committee.
2. BIOGRAPHIES OF THE DIRECTORS AND MEMBERS OF THE EXECUTIVE COMMITTEE AND THE ENLARGED EXECUTIVE COMMITTEE
Franz B. Humer Nationality: Swiss, Austrian Studies: University of Innsbruck, Doctor of Law, INSEAD, MBA Honorary Doctorate from the Faculty of Science, University of Basel Honorary Doctorate of Science, London School of Pharmacy Professional Career: 1971 - 1973: ICME Zurich
1973 - 1981: Schering Plough Corporation including General Manager, Ecuador, UK, Portugal
1981 - 1995: Glaxo Holdings plc Area Manager, Southern Europe Director of Marketing Development and Product Licensing Chief Operating Director
since 1995: F. Hoffmann-La Roche Ltd Member of the Board of Directors of the Roche Holding Ltd, Basel, and Head of the Pharmaceuticals Division
1996: Chief Operating Officer of F. Hoffmann-La Roche Ltd
1998: Chief Executive Officer Roche Holding Ltd
2001 - 2008 Chief Executive Officer of Roche Holding Ltd
since 2001: Chairman of the Board of Directors
Bruno Gehrig Nationality: Swiss
Date of Birth:
December 26, 1946
Studies: 1971 - 1980: Assistant and, from 1978, lecturer at the University of Bern
1975: Doctorate in economics (Dr. rer. pol.) from the University of Bern
1978: Qualification as lecturer at the University of Bern with a study on monetary policy, following studies with Prof. Karl Brunner at the University of Rochester (NY), USA
2006: Honorary Doctorate of Laws from the University of Rochester (NY), USA
Professional Career: 1981 - 1984: Head of Economics Section at Union Bank of Switzerland
1985: Year spent studying International Banking
1986 - 1989: Stock Markets and Securities Sales Division, UBS Group, as Head of Division from 1988

Page 64
1989 - 1991: Chairman of the Executive Board of Bank Cantrade Ltd., Zurich, with responsibility for the other parts of the group
1992 - 1996: Professor of Business Administration at the University of St. Gallen and Head of its Swiss Institute Banking and Finance
1996 - 2000: Member of the Governing Board of the Swiss National Bank
2001 - 2003: Vice Chairman of the Governing Board of the Swiss National Bank
since July 2003:
Chairman of the Board of Directors of Swiss Life Holding
John Irving Bell Nationality: Canadian (UK Permanent Resident)
Date of Birth:
July 1, 1952
Studies: 1966 - 1971: Ridley College, Canada
1975: B Med Sci (Honours). University of Alberta
1976: BA (Honours), Physiological Sciences, 1st Class, Magdalen College, Oxford University
1979: BM, BCh. Magdalen College, Oxford University
1990: DM Magdalen College, Oxford University
1992: FRCP Royal College of Physicians, London
Posts previously held: 1979 - 1982: Postgraduate Clinical Training in Oxford and London
1982 - 1987: Clinical Fellow, Department of Medicine, Stanford University, Stanford, California, USA
1982 - 1987: Postdoctoral Fellow, Department of Medical Microbiology, Stanford University, Stanford, California, USA
1987 - 1989: Wellcome Senior Clinical Fellow and Honorary Consultant Physician, Nuffield Departments of Clinical Medicine and Surgery, John Radcliffe Hospital, Oxford
1989 - 1992: University Lecturer, Nuffield Department of Clinical Medicine, Oxford University
1992 - 2002: Nuffield Professor of Clinical Medicine, Oxford University
since 2002: Regius Professor of Medicine, Oxford University
Peter Brabeck-Letmathe Nationality: Austrian
Date of Birth:
November 13, 1944
Studies: Economics at the University of World Trade in Vienna
Professional Career: 1968: Nestlé, Austria Specialist for new products

Page 65
1970 - 1980: Nestlé, Chile first as national Sales Manager later as Director of Marketing
1981: Nestlé Ecuador Managing Director
1983: Nestlé Venezuela S.A. Chairman and Managing Director
1987: Nestlé, International headquarters Vevey Senior Vice President, Culinary Products Division, Nestlé S.A.
1992: Nestlé S.A. Executive Vice President, worldwide responsibility for Strategic Business Group 2, Marketing, Communication and Public Affairs
1997: Nestlé S.A. Chief Executive Officer
2001: Nestlé S.A. Vice-Chairman of the Board of Directors and CEO
2005: Nestlé S.A. Chairman of the Board of Directors and CEO
Lodewijk J.R. de Vink Nationality: American
Date of Birth:
February 12, 1945
Studies: The Netherlands School of Business (Economy) B.B.A., Washburn University, 1968 M.B.A., American University, 1969
Professional Career: 1969 - 1988: Schering-Plough/Schering International
1988 - 2000: Warner-Lambert Company
1999 - 2000: Chairman of the Board, President and Chief Executive Officer
2000 - 2002: Credit Suisse First Boston Chairman of Global Health Care Partners
2002 - 2003: International Health Care Partners Chairman
since 2003: Blackstone Healthcare Partners, LLC Founding member and consultant

Page 66
Walter Frey Nationality: Swiss
Date of Birth:
July 30, 1943
Studies: Business studies at the University of Zurich Business studies at the London School of Economics Professional Career: 1966: Director Emil Frey Ltd
1969: Chairman and CEO of the Emil Frey Group
Other Activities: 1983 - 2003: Member of the Board of Zumtobel Staff AG
1987 - 2001: Member of the Swiss parliament
1997: President of the Board ZLE Betriebs AG
2001: Member of the Board of Allianz Suisse
2006: Member of the Board of Rhomberg Bau AG
2006: Member of the Board of Rhomberg Bahntechnik AG
2008: Board Member of economiesuisse
André Hoffmann Nationality: Swiss
Date of Birth:
May 31, 1958
Studies: 1977 - 1978: Geneva Medical School, Geneva, Switzerland
1979 - 1982: St. Gallen School of Economics, St. Gallen, Switzerland
1990: INSEAD, Fontainebleau, France: MBA
Professional Career: 1983 - 1985: Station Biologique de la Tour du Valat, Camargue, France Acting Administrator
1985 - 1989: James Capel and Co., London Manager, European Mergers & Acquisitions (latest position)
1991 - 1993: Nestlé UK Ltd. Special Project Manager, Food division (latest position)
since 1994: Private Investment Activities

Page 67
DeAnne Julius Nationality: American, British
Date of Birth:
April 14, 1949
Studies: University of California MA, Ph.D, Economics Iowa State University, BSc, Economics Honorary degrees from University of Warwick. University of Birmingham, Southbank University, University of Bath (UK) Professional Career: 1970 - 1971: Economic Analyst, US Government Civil Service, Washington DC
1972 - 1975: Lecturer and Teaching Assistant, University of California
1975 - 1982: Economic Advisor, World Bank, Washington DC
1983 - 1986: Managing Director, Logan Associates Inc, Washington DC and London
1986 - 1989: Director of International Economics Programme, Royal Institute of International Affairs (Chatham House), London
1989 - 1993: Chief Economist, Royal Dutch Shell Group, London
1993 - 1997: Chief Economist, British Airways PLC, London
1997 - 2001: Member, Monetary Policy Committee, Bank of England
2001 - 2004: Member, Court of Bank of England
since 2003: Chairman, Royal Institute of International Affairs
Andreas Oeri Nationality: Swiss
Date of Birth:
April 7, 1949
Studies: University of Basel (Switzerland) Medical Studies at the University of Basel; Swiss Medical Diploma Doctorate of Medicine Professional Career: 1977 - 1985: Assistant Physician in:
- The Surgical Clinic of the Cantonal Hospital “Kantonsspital” Liestal, - the Institute for Physical Medicine of the Cantonal Hospital “Kantonsspital” Basel, - the Surgical Department of the University of Basel and - Basel University Orthopedic Hospital
1986 - 1988: Acting Senior Physician of the Basel University Orthopedic Hospital
1988: Specialist in Orthopedic Surgery (FMH)
since 1988: Own practice for Orthopedic Surgery in Basel

Page 68
Horst Teltschik Nationality: German
Date of Birth:
June 14, 1940
Studies: 1960: High School Diploma (“Abitur”), Tegernsee/Upper Bavaria
1967: Diploma in Political Science from Free University Berlin. Majored in Political Science, Contemporary History and International Law
1968 - 1970: Assistant Professor at Otto-Suhr-Institute, Free University Berlin
Professional Career: 1970 - 1972: Head of the International Policy and Intra-German Relations Group at the Christian Democratic
Union (CDU), Federal Headquarters, Bonn
1972 - 1976: Executive Ministerial Counsellor to the Prime Minister Rhineland-Palatinate State Chancellery
1977 - 1982: Chief of Staff of the Chairman of the CDU/CSU Parliamentary Group, German Bundestag, Bonn
1982 - 1990: Ministerial Director at the Federal Chancellery, Head of the Directorate-General for Foreign and Intra-German Relations, Development Policy, External Security
1983 - 1990 Deputy Chief of Staff of the Federal Chancellery
1991 - 1992: CEO of the Bertelsmann Foundation
1993 - 2000: Member of the Board of Management of BMW Group, Economic and Governmental Affairs (Public Affairs)
1993 - 2003 Chairman of the BMW Foundation Herbert Quandt
2000 - 2003 Representative of the Board of Management of BMW for Central- and Eastern Europe, Asia and Middle East
2003 - 2006: President Boeing Germany
Beatrice Weder di Mauro Nationality: Swiss and Italian
Date of Birth:
August 3, 1965
Education and Awards: University of Basel, Department of Economics Lizentiat 1989, Ph.D. 1993, Habilitation 1999 World Economic Forum, Geneva Named “Young Global Leader” at World Economic Forum at Davos, 2005-present Regierungsrat Basel-Stadt Award for Outstanding Research, 1999 Professional Career: 1993 – 1994: Post-Doctoral Research Fellow, University of Basel
1994 – 1996: Economist International Monetary Fund, Washington D.C.
1996 – 1997: Economist, The World Bank, Washington D.C.

Page 69
1997 – 1998: Research Fellow, United Nations University, Tokyo
1998 – 2000: Assistant Professor of Economics, University of Basel
2000 – 2001: Associate Professor of Economics, University of Basel
since 2001: Professor of Economics, University of Mainz
since 2004: Member of the German Council of Economic Experts, Wiesbaden
Visiting Position: ● National Bureau of Economic Research (NBER), Cambridge MA.
● Federal Reserve Board of New York
● International Monetary Fund, Washington DC.
● Harvard University, Cambridge MA.
Pius Baschera Nationality: Swiss and Italian
Date of Birth:
November 12, 1950
Studies: Swiss Federal Institute of Technology, Zurich: Mechanical Engineering (diploma) with Scientific Management Dr. sc. techn. ETH doctorate Titular professor Professional Career: 1979 – 1981: Hilti Corporation, Schaan
Vice President production controlling
1982 – 1984: Hilti Inc. Tulsa, USA Vice President corporate development Western hemisphere
1985 – 1985: Hilti (Switzerland) AG General Manager
1985 – 1989: Hilti Deutschland GmbH General Manager
1989 – 1990: Hilti Corporation, Schaan Vice President market region Europe 1
1990 – 1993: Member of Executive Board Chief Financial Officer
1994 – 2006: Chief Executive Officer
since 2007: Chairman of the Board of Directors

Page 70
Wolfgang Ruttenstorfer Nationality: Austrian
Date of Birth:
October 15, 1950
Studies: University of Economics and Business Administration Vienna Doctorate in Economics and Business Administration Professional Career: 1976 – 1984: OMV Controller
1985 – 1989: Head Planning and Strategic Development
1990 – 1992: Head Marketing and Distribution of mineral oil products
1992 – 1996: Member of Executive Board of Directors responsible for Finance, Controlling and Chemical
1996 – 1997: Member of Executive Board of Directors responsible for Exploration & Production, Natural Gas & Chemical
1997 – 1999: Austrian Federal Ministry of Finance Secretary of State (Deputy Minister), responsible for Economic and Monetary Union, International Financial Institutions, capital markets and public services
2000 – 2002: OMV Deputy Chairman, responsible for Gas and Chemicals
since 2002: Chief Executive Officer and Chairman of the Executive Board
William M. Burns Nationality: British
Year of Birth:
1947
Studies: University Strathclyde, Bachelor of Art (Honours Degree) Professional Career: 1969 – 1986: Beecham Pharmaceuticals
1986 – 1988: Director of Sales & Marketing, Roche UK
1988 – 1991: Head of Pharmaceuticals Division, Roche UK
1991 – 1998: Global Head of Strategic Marketing & Business Development, F. Hoffmann-La Roche Ltd, Basel
1998 – 2000: Head of Pharma Europe/International
2000: Member of the Executive Committee of the Roche Group
2001: Head of the Pharmaceuticals Division
2002: Board Member of Chugai Pharmaceuticals, Japan (Roche Subsidiary)
2004 Board Member of Genentech, USA, (Roche Subsidiary)
2005: Chief Executive Officer Division Roche Pharmaceuticals
Page 71
Severin Schwan Nationality: Austrian
Year of Birth:
1967
Studies: Economics at University of Innsbruck, University of York and University of Oxford Mag. rer.soc.oec. (Innsbruck, 1991) Law at University of Innsbruck Mag. iur. (Innsbruck, 1991) Doctorate in Law at University of Innsbruck Research studies at University Louvain, Belgium Dr. iur. (Innsbruck, 1993) Professional Career: 1993 - 1995: Trainee at Corporate Finance, Roche Basel
1995 - 1998: Head Finance & Administration, Roche Brussels
1998 - 2000: Head Finance & Informatics at Roche Grenzach, Germany and Member of the Executive Board of Roche Deutschland Holding GmbH
2000 - 2004: Head Global Finance & Services, Roche Diagnostics, Basel
2004 - 2006: Head Region Asia Pacific, Roche Diagnostics Singapore
since 2006: Chief Executive Officer Division Roche Diagnostics
since 2008: Chief Executive Officer of Roche Group
Erich Hunziker
Nationality: Swiss
Year of Birth:
1953
Studies: Ph.D. in Industrial Engineering, Swiss Federal Institute of Technology (ETH), Zurich
Professional Career: 1978: Head of Assistants, Institute of Management & Industrial Engineering ETH, Zurich
1980: Chairman, Swiss Student Travel Office (SSR)
1983: Vice President Group Strategy Pharmaceuticals Corange Ltd., Switzerland (Holding company Boehringer Mannheim Group)
1988: Managing Director Boehringer Mannheim, Switzerland
1992: Head of Finance, Member of the Executive Board Boehringer Mannheim, Germany
1994: Head of Finance, Chairman of the Executive Board Boehringer Mannheim, Germany
1995: President Pharmaceuticals Division, Member of the Executive Committee Boehringer Mannheim Group, Netherlands
Page 72
1997: Chief Financial Officer Corange Ltd., Bermuda/UK
1998: Chief Executive Officer Diethelm Group, Switzerland
2000: Chief Executive Officer Diethelm Keller Group, Switzerland
2001: Member of the Executive Committee of the Roche Group and Chief Financial Officer
2004 Board Member of Genentech, USA, (Roche Subsidiary)
2005: Chief Financial Officer and Deputy Head of the Executive Committee of the Roche Group
2006: Board Member of Chugai Pharmaceuticals, Japan (Roche Subsidiary)
Jürgen Schwiezer
Nationality: German
Year of Birth:
1944
Studies: Studies in Chemistry in Hannover and Münster, Germany PhD in Chemistry in Münster
Professional Career: 1976-1977: Boehringer Mannheim GmbH, Mannheim, Germany, Market Research Diagnostics
1977-1989: Various positions with increasing responsibilities in Marketing and Sales
1989-1990: Head of Sales Force Germany, Mannheim
1990-1994: Head of Laboratory Systems within Marketing & Sales Germany
1994-1995 Head of Marketing and Sales, Germany , Member of the Executive Board of Boehringer Mannheim GmbH
1995-1998: Chairman of the Executive Board of Boehringer Mannheim GmbH
1998: Member of the Executive Board of Roche Deutschland Holding GmbH, Head of Marketing and Sales Diagnostics Germany, President of Europe, Middle-East, Africa (EMEA), Diagnostics Division
since 2000: Chairman of the Executive Board of Roche Diagnostics GmbH
since 2007: President EMEA and Latin America, Diagnostics Division
since 2008: Chief Executive Officer Division Roche Diagnostics
Jonathan K.C. Knowles Nationality: British
Year of Birth:
1947
Studies: Magdalen College School, Oxford

Page 73
1st Class Honours Degree in Molecular Genetics, University of East Anglia, England 1969 Ph.D. in Genetics of Mitochondria with Professor G.H. Beale F.R.S., University of Edinburgh, Scotland, 1973 Positions held: 1973-1974: S.R.C. Post Doctoral Research Fellow with Professor G.H. Beale, F.R.S., Department of
Genetics, University of Edinburgh, Scotland
1975: EMBO short term fellowship at Centre de Génétique Moléculaire, CNRS, Gif-sur-Yvette, France
1975-1977: Royal Society European Exchange Fellowship at Centre de Génétique Moléculaire, CNRS, Gif-sur-Yvette, France (with Professor P. Slonimski and Dr J. Beisson)
1977: Volkswagen fellowship at the University of Tübingen and Max-Planck Institut, Tübingen, Germany 3 months NIH fellowship at the University of Colorado Medical Centre, Dept. of Microbiology and Immunology, Denver
1978-1980: EMBO fellowship to Department of Medical Chemistry and Department of Genetics, University of Helsinki, Finland
1979: Visiting Assistant Professor, Albert Einstein College of Medicine, NY Appointed Docent of the University of Helsinki
1980-1986: Head of the recombinant DNA group at the Biotechnical Laboratory, VTT, Helsinki, Finland
1986-1989: Research Professor and Head of Molecular Biology at the Biotechnical Laboratory, VTT, Helsinki, Finland
1989-1997: Director of the Glaxo Institute for Molecular Biology, Geneva, Switzerland
1995-1997: Research Director, Glaxo Wellcome Europe Responsible for all preclinical research at the four European sites at Verona, Paris, Madrid and Geneva (500 people)
1997: Head of Research, F. Hoffmann-La Roche Ltd
1998: Member of the Executive Committee of the Roche Group
1998: Member of the Board of Directors of Genentech (Roche Subsidiary)
2003: Member of the Board of Directors of Chugai Pharmaceuticals (Roche Subsidiary)
2004: Chairman of the Research Directors’ Group (RDG) of EFPIA (European Federation of Pharmaceutical Industry Associations)
Gottlieb A. Keller Nationality: Swiss
Year of Birth:
1954
Studies: University of Basel (law and economics) Doctor of Law (Dr. iur), 1980 Admission as Attorney, 1981 Notary public Basel, 1984 (not practising) Professional Career: 1984: Corporate Law Department of the Roche Group
1989: Head of Business Development and Pharma Marketing Services Roche Grenzach, Germany
1992: Assistant to the Chairman of the Board of Directors of Roche Holding Ltd

Page 74
1996: Head of Human Resources Hoffmann-La Roche Ltd, Germany
1998 Speaker of the Management Board, Hoffmann-La Roche Ltd, Germany
1999 Chairman of the Executive Board of Roche Deutschland Holding GmbH
1999: Secretary to the Board of Directors of Roche Holding Ltd and Corporate Compliance Officer of the Roche Group
2003: Head of Corporate Human Resources and Pharma Site Management Basel and Kaiseraugst and Member of the Executive Committee of the Roche Group
2004 - 2008: Head of Corporate Services and Human Resources
since 2008: Head of Corporate Services and General Counsel
Silvia Ayyoubi Nationality: Swiss
Year of Birth:
1953
Studies: Diploma in commercial economics Business School, Basel Professional Career: 1974: Swiss Ministry of Foreign Affairs Switzerland, Sweden, Egypt, Jordan
1986: Effifreight, Basel
1987: Public Relations Assistant, Pharma Communications of F. Hoffmann-La Roche Ltd, Basel
1989: Public Relations and Issue Manager
1991: Corporate Human Resources Head of Executive Resource Planning Pharma
1996: Corporate Human Resources Head of Executive Development
2001 Diagnostics Division Head of Global Human Resources
2008: Head of Corporate Human Resources Member of the Executive Committee
Burkhard G. Piper Nationality: German
Year of Birth:
1961
Studies: Diploma in industrial economics Business Academy, Mannheim Professional Career: 1985: Boehringer Mannheim GmbH:
Sales Managers Industrial Biochemicals

Page 75
1986: BM International Management Trainee
1987: Boehringer Mannheim, Spain: Product Manager, Reflotron
1990: Boehringer Mannheim Pharmaceuticals, UK: Product Manager, Ostac and Regional Sales Manager
1991: Corange, London, UK: Project Manager to CEO
1992: Boehringer Mannheim, Luxembourg: Supply Chain Manager
1993: Boehringer Mannheim, Spain: Divisional Director, Patient Care
1996: Boehringer Mannheim GmbH: Vice President, Global Product Marketing Diabetes Care
1999: Roche Diagnostics Canada: President/General Manager, Roche Diagnostics
2002: Roche Diagnostics GmbH: Head of Business Area Roche Centralized Diagnostics
2003: Roche Diagnostics GmbH: Member of the Executive Board Head of Business Area Roche Centralized Diagnostics
2005: Head of Business Unit Roche Diabetes Care, Mannheim, Germany Member of the Executive Board of Roche Diagnostics GmbH
2006: Head of Roche Diabetes Care and Member of the Enlarged Executive Committee
Per-Olof Attinger Nationality: Swiss
Year of Birth:
1960
Studies Chemical Engeniering at Federal Institute of Technology (ETH), Zurich/Switzerland (1984) Thesis at Imperial College, London/England Master in Business Administration at INSEAD, Fontainebleau/France (1992) Professional Career 1986: Sandoz, Basel
Engineer Chemical Process Development
1992: Roche, Basel Manager Merger & Acquisitions
2000: Roche, Basel Assistant to Head of Diagnostics Division
2002: Roche, Rotkreuz General Manager
2005: Roche, Rotkreuz Head of Business Area Services
2006: Roche, Rotkreuz Head of Global Platforms and Support

Page 76
Member of the Diagnostics Executive Committee
2008: Roche, Basel Head of Ventana Integration
2009 Roche, Basel Head of Global Corporate Communications and Member of the Enlarged Executive Committee
Pascal Soriot
Nationality: French
Year of Birth:
1959
Studies Veterinary Surgeon, Maisons Alfort, France. MBA with major in finance, HEC Paris. Professional Career 1986: Roussel Uclaf
Financial Controller, Asia Pacific Region 1987: Roussel New Zealand
District Sales Manager
1989: Roussel Australia Sales and Marketing Manager General Manager
1994: Roussel Uclaf Pharmaceuticals Division Global Marketing Manager
1996: Hoechst Marion Roussel Australia General Manager
1997: Hoechst Marion Roussel Tokyo Regional Vice President Asia Pacific
2000: Aventis Bridgewater (US) Senior VP, Head of Global Marketing & Medical Affairs
2002: Aventis USA (Sanofi Aventis USA from 2004) Chief Operating Officer
2006: Roche Head of Strategic Marketing
2007: Head of Commercial Operations Member of the Enlarged Executive Committee
__________________________________________________________________________________________
Page 77
Osamu Nagayama Nationality: Japanese
Year of Birth:
1947
Studies Faculty of Business and Commerce, Keio University Current Position Chairman of the Board of Directors, President and CEO of Chugai Professional Career 1971: The Long-Term Credit Bank of Japan
1975: London Branch, The Long-Term Credit Bank of Japan
1978: Chugai Pharmaceutical Co., Ltd.
1983: Director, Pharmaceutical Sales & Marketing Division and International Business Division
1985: Deputy General Manager, Pharmaceutical Research and Development Division Member of the Board of Directors
1986: Deputy General Manager, Personal Healthcare Division
1987: Senior Vice President
1989: Deputy President
1992: President (present)

Page 78
3. CORPORATE GOVERNANCE
Conflicts of Interest
There are no potential conflicts of interests between any duties owed by the directors or Executive Committee Members to Roche and their private interests or other duties.
Trading Restrictions
Each year, several black out periods are imposed during which all senior employees (including the Directors and members of the Executive Committee) are prohibited from trading in company stock. The following black-out periods are in effect for 2009:
1 January to 4 February
1 April to 16 April
1 July to 23 July
1 October to 15 October
Black-out periods can be changed by the Chairman of the Board of Directors if circumstances warrant.
Compliance
The Roche Group meets all of the requirements with respect to Corporate Governance complying with the existing legal regulations, the SIX Swiss Exchange Directives (including their Commentaries) and the Swiss Code of Best Practice for Corporate Governance as promulgated by the Swiss business federation ‘economiesuisse’. The existing internal company regulations, in particular the Company’s Articles of Incorporation and Bylaws, consider all the principles that govern the management and supervision of Roche’s company including the necessary checks and balances in order to ensure good corporate governance.
Presidium/Nomination Committee
The Chairman and two Vice-Chairman including the Independent Lead Director serve jointly as the Presidium as well as a Nomination Committee. In the latter capacity they prepare proposals to the Board of Directors regarding the appointment of new Board members and are concerned with succession planning and the evaluation of candidates for the Executive Committee.
The membership of the Company’s Presidium/Nomination Committee is described on page 61.
Remuneration Committee
The Remuneration Committee decides on the remuneration of the Chairman and the Chairman of the Executive Committee (who must not be present at the time). Furthermore, it is responsible for approving, upon proposal by the Chairman (other than in the case of his own compensation):
● the Group’s remuneration policy;
● the compensation packages of members of the Executive Committee, those of certain other senior or special employees, and those of the general managers of the largest subsidiaries;
● stock options, bonuses and similar profit-sharing schemes, and for approving in principle pension fund benefits and other post-employment benefit plans.
The membership of the Company’s Remuneration Committee is described on page 61.
Audit Committee
The Audit Committee assists the Board of Directors in overseeing the Management of the Group’s businesses, particularly with respect to financial matters. In particular the committee reviews:
● accounting systems and procedures;
● the organisation and scope of financial controlling including internal auditing;
● financial reporting to shareholders and the general public as well as the relationship with external auditors;
● financial planning;

Page 79
● investments of liquid assets and financial investments, including investments of assets by the Company’s post-retirement benefit plans (investment principles and policies, funding status, investment instruments diversification, return on investments, etc);
● longer-term business plans and strategy and communication of the same in the Company’s annual reports;
● risk management, internal control systems, risk plans and risk assessment of the Executive Committee.
The membership of the Company’s Audit Committee is described on page 61.
Corporate Governance and Sustainability Committee
The Corporate Governance and Sustainability Committee assists the Board of Directors in matters relating to corporate governance and in promoting sustainable management of the Company’s activities. The Committee supervises compliance of internal business principles and principles of behaviour with respect to legal as well as safety and environmental matters.
The Corporate Governance and Sustainability Committee also oversees the preparation of the sustainability report.
The membership of the Company’s Corporate Governance and Sustainability Committee is described on page 61.

Page 80
PART 5 OPERATING AND FINANCIAL REVIEW
The section that follows should be read in conjunction with “The Business” in Part 3 and the financial information set out in Annex C. Prospective employees should read the entire Prospectus and not just rely on the summary information set out below. The financial information considered in this Part 5 is extracted from the Financial Information for the Company set out in Annex C. The Consolidated Financial Statements referred to in this discussion have been prepared under IFRS.
The financial information contained in Annex C and in this Part 5 is as reported at the date the relevant financial statements were published. Please note that there have been a number of changes in IFRS and Roche’s accounting policies from 2006 to 2008. Accordingly, the financial information contained in a particular year’s financial statements may not be fully comparable with the financial information contained in an earlier or later year’s financial statements due to changes in IFRS and Roche’s accounting policies. In particular, the financial information for 2007 has been restated in the 2008 financial statements and the financial information for 2006 has been restated in the 2007 financial statements. See Note 1 to the 2008 Consolidated Financial Statements (pages 222 to 234 of this Prospectus), Note 1 to the 2007 Consolidated Financial Statements (pages 332 to 344 of this Prospectus), and Note 1 to the 2006 Consolidated Financial Statements (pages 417 to 429 of this Prospectus), for a summary of significant accounting policies applied to the 2008, 2007 and 2006 Consolidated Financial Statements and for details of restatements of prior periods. Year ended 31 December 2008
In 2008 the Group continued the strong underlying operating performance from previous years. The Pharmaceuticals Division further increased its operating profit margin as the growth in the underlying business more than compensated for the expected sharp decline in Tamiflu pandemic sales and the planned increases in research and development. In the Diagnostics Division the impact of recent acquisitions and competition in the US diabetes care market resulted in a decline in the operating profit margin. The strengthening of the Swiss franc against most currencies had a substantial negative impact on the Group’s overall operating results when translated from local currencies into Swiss francs.
Total sales grew by 6% in local currencies (-1% in Swiss francs; 10% in US dollars) to 45.6 billion Swiss francs, with the Pharmaceuticals Division representing 79% of Group sales and the Diagnostics Division contributing 21%. The sales increase in the underlying business more than compensated for the anticipated fall in Tamiflu pandemic government and corporate sales from 1.9 billion Swiss francs in 2007 to 237 million Swiss francs in 2008. Local currency sales growth excluding Tamiflu pandemic sales was 10%. The strength of the Swiss franc over the last twelve months resulted in approximately 3.2 billion lower sales when translated into Swiss francs.
Demand for the Group’s oncology drugs Avastin, MabThera/Rituxan, Herceptin, Tarceva and Xeloda continued to grow strongly. Additional growth drivers in the Pharmaceuticals Division were Bonviva/Boniva in metabolism/bone and CellCept in transplantation. In the Diagnostics Division the main growth areas were Professional Diagnostics, Applied Science and Tissue Diagnostics, with these business areas growing above their respective markets. Following the acquisition of Ventana at the beginning of February 2008, sales in the new Tissue Diagnostics business area were 376 million Swiss francs, contributing 4 percentage points to local currency sales growth of the Diagnostics Division.
The Group’s operating profit increased by 4% in local currencies to 13.9 billion Swiss francs. The operating profit margin declined by 0.9 percentage point to 30.5% due to a margin reduction in the Diagnostics Division

Page 81
of 5.3 percentage points. The Pharmaceuticals margin increased to 36.2% from 35.5% in 2007 despite significantly lower Tamiflu pandemic sales and increased investments in the strong development pipeline. More than half of the fall in the margin of the Diagnostics Division was due to the impact of recent acquisitions (one-time charges, amortisation of acquired intangible assets and investments to develop the acquired businesses) and the rest was mainly due to strong competition in the US diabetes care market and portfolio mix effects.
In 2008 the average US dollar exchange rate against the Swiss franc was 10% lower than in the comparative period. The euro was 4% lower whereas the Japanese yen was 3% higher. The movements in exchange rates have had a significant impact on Swiss franc growth rates: Sales and operating profit growth rates reported in Swiss francs were 7 and 8 percentage points below local currency growth respectively. Natural hedges in the structure of the Group’s operations meant that the Group operating margin was not significantly impacted by foreign exchange movements.
In the Pharmaceuticals Division there were two exceptional items: income of 271 million Swiss francs from the settlement of Genentech’s litigation with the City of Hope Medical Center and expenses of 243 million Swiss francs from the initial stages of Pharmaceuticals Division US reorganisation. The net impact of these on the Group and divisional results is not significant.
Group operating results for 2008
Pharmaceuticals
(mCHF) Diagnostics
(mCHF) Corporate
(mCHF) Group
(mCHF) Sales 35,961 9,656 - 45,617 Operating profit before exceptional items 12,974 1,187 (265) 13,896 - margin, % of sales 36.1 12.3 - 30.5 Operating free cash flow 12,053 600 (275) 12,378 - margin, % of sales 33.5 6.2 - 27.1
Group operating results – Development of results compared to 2007
Pharmaceuticals Diagnostics Corporate Group Sales - % increase in local currencies +5 +10 - +6 Operating profit before exceptional items - % increase in local currencies +8 -22 +19 +4 - margin: percentage point increase +0.6 -5.3 - -0.9 Operating free cash flow - % increase in local currencies +31 -33 -38 +27 - margin: percentage point increase +6.2 -5.2 - +4.0
Pharmaceuticals operating results The Pharmaceuticals Division increased its sales by 5% in local currencies (-2% in Swiss francs; 8% in US dollars) to 36.0 billion Swiss francs. Excluding Tamiflu pandemic government and corporate sales, local sales growth was 10% outpacing global market growth by a factor of around two. Operating profit before exceptional items was 13.0 billion Swiss francs, and the corresponding margin 36.1%, an increase of 0.6 percentage points compared to 2007 despite significantly lower Tamiflu pandemic sales and increased investments in research and development.
Marketing costs increased moderately in local currencies in spite of continued support for the growing oncology and rheumatoid arthritis portfolios. Investments were made in the broader indications particularly for Avastin, as well as investments for the launch of Actemra/RoActemra. The strong expected increase in research and development expenses, significantly above the increase in sales, was due to continued high investments in the strong pipeline and expanded portfolio as well as the large number of clinical trials.
For more information on the divisional business and its pipeline, see the Business Report (Part 1 of this Annual Report).

Page 82
Sales
The major growth drivers were key products in the therapeutic areas oncology, inflammation/autoimmune/transplantation, virology (excluding Tamiflu pandemic sales) and metabolism/bone. Sales in the therapeutic area renal anemia decreased in an increasingly competitive, cost-sensitive market.
Pharmaceuticals Division - Sales by therapeutic area for 2008*
Therapeutic area Sales
(mCHF) % of sales % change
(local currencies) Oncology 19,654 55 +15 Virology 3,408 9/91 -27/+71 Inflammation/Autoimmune/Transplantation 3,264 9 +19 Metabolism/Bone 2,839 8 +7 Renal anemia 1,318 4 -11 Others 5,478 15 -5 Total 35,961 100 +5/+101
1) Excluding Tamiflu pandemic government and corporate sales. * The figures are sourced from the unaudited internal accounting systems and records of the Group. In 2008 the Top 20 Pharmaceuticals products, which represented 86% of the Pharmaceuticals portfolio, grew 8% (14% excluding Tamiflu pandemic sales) with the majority of products showing sales growth. The local sales growth of the Pharmaceuticals Division was driven by seven products: Avastin, MabThera/Rituxan, Herceptin, Bonviva/Boniva, CellCept, Tarceva and Xeloda. These products represent 61% of the portfolio (2007: 53%; 2006: 48%) and together generated over 2 billion Swiss francs of additional sales compared to 2007 despite the strong negative currency impact mainly from the US dollar. Sales of Tamiflu declined due to non-recurring pandemic sales. Other sales declines were primarily due to generic erosion following patent expiry, strong competition in certain franchises and the return by Chugai of a group of marketed products in Japan to Sanofi-Aventis.
Pharmaceuticals Division – Sales of Top 20 products for 2008*
Product Sales
(mCHF) % of sales
% change (local
currencies) Franchise MabThera/Rituxan 5,923 16 +16 Oncology / IAT1) Avastin 5,207 15 +37 Oncology Herceptin 5,092 14 +12 Oncology CellCept 2,099 6 +13 IAT1)

Page 83
NeoRecormon/Epogin 1,774 5 -13 Renal anemia, Oncology Pegasys 1,635 5 +6 Virology Tarceva 1,215 3 +23 Oncology Xeloda 1,211 3 +13 Oncology Bonviva/Boniva 1,108 3 +35 Metabolism/Bone Lucentis 960 3 +7 Ophthalmology Tamiflu 609 2 -68 Virology - of which pandemic 237 1 -86 Virology Xolair 560 2 +10 Respiratory diseases Valcyte/Cymevene 553 2 +10 Virology Xenical 502 1 -13 Metabolism/Bone Pulmozyme 496 1 +12 Respiratory diseases Nutropin 413 1 -2 Metabolism/Bone Neutrogin 404 1 -3 Oncology Rocephin 344 1 -10 Infectious diseases Activase/TNKase 342 1 -1 Cardiovascular diseases Madopar 311 1 +4 Nervous System Total Top 20 products 30,758 86 +8 Other products 5,203 14 -12 Total 35,961 100 +5
Excluding Tamiflu pandemic government and corporate sales
Total Top 20 products 30,521 85 +14 Other products 5,203 15 -12 Total 35,724 100 +10
1) Inflammation/Autoimmune/Transplantation. * The figures are sourced from the unaudited internal accounting systems and records of the Group. MabThera/Rituxan: Double-digit sales growth was driven by increasing use in oncology indications and rheumatoid arthritis. In Europe and the US most of the oncology sales growth was due to increasing usage of MabThera/Rituxan following first-line therapy of indolent non-Hodgkin’s lymphoma (NHL), including maintenance use. The already high penetration rates for first-line treatment of indolent and aggressive NHL were sustained in the US and Europe’s five largest markets (France, Germany, Italy, Spain and the United Kingdom), while increasing adoption in these settings was seen in emerging markets. Adoption in rheumatoid arthritis (RA) continued to increase in both the US and Europe/Rest of World (RoW). An estimated 800 million Swiss francs of sales were generated in the RA indication. Avastin: Sales increased 37% worldwide compared to 2007, with strong growth in all regions, particularly Europe/RoW (+67%). In the US growth was driven primarily by increased usage in metastatic breast cancer following accelerated approval by the US Food and Drug Administration (FDA) in February. Sales growth in Europe was driven primarily by increased use of the medicine for metastatic colorectal and breast cancer. Sales in Europe also benefited from the rollout of new indications and increasing uptake for non-small cell lung cancer and renal cell carcinoma. Herceptin: Growth continued to be driven by increasing adoption in adjuvant (early stage) HER2-positive breast cancer. Roche estimates that by the end of 2008 the product’s market share in the adjuvant setting was approximately 75% (versus 70% a year earlier) in the five largest European markets. Elsewhere, market penetration in this setting also continues to build. In the US penetration into this market flattened during 2008 due to earlier, more rapid adoption of Herceptin for adjuvant treatment. In the metastatic setting, adoption rates and treatment duration remained stable both in the US and in the top five European markets. CellCept: The immunosuppressant CellCept continued to record double digit sales growth worldwide (+13%), driven by solid demand in both the US and Europe. Growth continues to be driven by physicians’ recognition of

Page 84
the long-term protective benefits of CellCept in transplant patients compared with other, more toxic therapeutic options. NeoRecormon/Epogin: Combined sales of Roche’s NeoRecormon and Chugai’s Epogin (epoetin beta) were down 13% in a market that remains highly competitive due to pricing pressure from branded competitors and the entry of biosimilar versions of epoetin alfa in Europe. The market share of NeoRecormon has decreased only slightly, with global sales down 10% in 2008. In Japan, where Epogin remains the market leader, a decline in sales of 18% for the medicine was due primarily to sustained pricing pressure. Pegasys: In 2008 Pegasys maintained its clear leadership of the global pegylated interferon market and continued to gain market share. Global sales increased 6% to 1.6 billion Swiss francs, driven by strong growth in Japan of 54% and growth in key emerging markets. This was combined with solid growth in the United States, where Pegasys now accounts for 70% of new prescriptions for hepatitis C. Tarceva: Tarceva recorded strong growth in 2008 (+23%), particularly in the Europe/RoW sales region (+27%), which now accounts for 55% of overall sales. US sales increased by 10% in a competitive market environment. Tarceva is still the only epidermal growth factor receptor inhibitor with a proven survival benefit in advanced lung and pancreatic cancer. Xeloda: Xeloda recorded sustained double-digit sales growth throughout 2008. Growth in Japan was particularly strong at 74%, and solid increases were also recorded in the US (+9%) and Europe/RoW (+14%). Sales were driven by expanded indications approved in 2007 and 2008, notably stomach cancer and advanced colorectal cancer, along with uptake in breast cancer. Bonviva/Boniva: In a highly competitive market, sales of Bonviva/Boniva (ibandronic acid) for the treatment of postmenopausal osteoporosis, increased by 221 million Swiss francs to 1.1 billion Swiss francs compared with 2007. The majority of sales come from the US, where the product’s market share remained robust despite the entry of generic versions of competitor products. Bonviva gained reimbursement status and was launched in many European markets in 2006. Lucentis: Sales of Lucentis for the treatment of neovascular (wet) age-related macular degeneration (wet AMD) in the US grew 7% in 2008, driven primarily by an increased number of Lucentis dosage per patient. New patient share was broadly stable as off-label usage of an unapproved therapy in wet AMD remained high. Outside the US, Lucentis is marketed by Novartis. Tamiflu: Sales of Tamiflu in 2008 declined by 1.5 billion Swiss francs or 68% versus 2007. Seasonal sales were 143 million Swiss francs higher and pandemic sales decreased by 1.6 billion Swiss francs compared to 2007, as most stockpiling programmes from governments and corporations were completed in 2007. Seasonal sales of Tamiflu in Japan were negatively affected by the mild 2007/2008 flu season. In addition, there was a substantial decrease in pandemic sales to the Japanese government. Sales by region: Sales excluding Tamiflu pandemic government and corporate sales continued to grow across all regions. Growth in North America was 10% in local currencies compared to an almost stagnant market, driven by products marketed by Genentech (oncology products, Lucentis, Xolair and Pulmozyme) as well as the Roche Pharmaceuticals products Tamiflu (seasonal sales), Bonviva/Boniva, CellCept, Pegasys and Xeloda. Roche Pharmaceuticals continued to gain market share in the Western Europe and Latin America regions, driven by further strong sales growth of Avastin, MabThera/Rituxan, Herceptin, Bonviva/Boniva, Tarceva and CellCept. Sales in Japan increased, as the launches of Avastin, the combination therapy Pegasys plus Copegus and Tarceva compensated for normal biennial price cuts in Japan, which became effective 1 April 2008, and the return of a group of marketed products to Sanofi-Aventis. Tamiflu sales decreased sharply due to the completion of most pandemic stockpiling orders from governments and corporations in 2007 particularly in Western Europe, Japan and the CEMAI region.

Page 85
Pharmaceuticals Division - Sales by region for 2008*
Region Sales
(mCHF) % of sales % change
(local currencies) North America 14,679 41 +102/+5 Western Europe 10,330 29 +82/+5 CEMAI 1) 3,187 9 +122/+5 Japan 3,336 9 +42/-4 Latin America 2,394 6 +162/+15 Asia-Pacific 1,698 5 +92/+6 Other regions 337 1 +12/-1 Total 35,961 100 +102/+5
1) Central and Eastern Europe, Middle East, Africa, Central Asia, Indian Subcontinent. 2) Excluding Tamiflu pandemic government and corporate sales. * The figures are sourced from the unaudited internal accounting systems and records of the Group. Operating results
Royalties and other operating income: The increase of 91 million Swiss francs or 12% in local currencies was due to higher royalty income and gains on disposal of products which offset 302 million Swiss francs lower income from out-licensing agreements. The fall in out-licensing income was mainly due to a number of significant milestone payments in 2007 such as for orlistat OTC rights from GlaxoSmithKline, 80 million Swiss francs as part of a third-party collaboration agreement at Genentech and 42 million Swiss francs relating to Lucentis for approval in the European Union and filing in Japan. Gains on product divestments were 235 million Swiss francs higher than in 2007 and include a gain of 132 million Swiss francs from the second stage of the disposal of three products to Actavis, a gain of 50 million Swiss francs from the disposal of products in Turkey as well as a gain of 158 million Swiss francs from Meda and a gain of 96 million Swiss francs from a sale of other product rights, all being part of the continuous realignment of the product portfolio. The increase in royalty income was driven by Genentech. Royalties and other operating income as percentage of sales increased by 0.4 percentage points to 6.0%.
Pharmaceuticals Division – Royalties and other operating income
2008
(mCHF) 2007
(mCHF) % change
(local currencies) Royalty income 1,234 1,076 +26 Income from out-licensing agreements 420 722 -38 Income from disposal of products and other 494 259 +95 Total 2,148 2,057 +12
Cost of sales: Costs remained stable in local currencies mainly driven by an 8% decline in manufacturing cost of goods sold and period costs. This was due to manufacturing efficiencies, favourable product mix effects and the comparison period in 2007 including 135 million Swiss francs Viracept recall costs. Amortisation of intangible assets decreased by 17% in local currencies as some intangible assets became fully amortised. All of the above compensated for the 19% local currency increase in collaboration and profit sharing agreements and the 6% local currency increase in royalty expenses on product sales to 2,105 million Swiss francs (2007: 2,089 million Swiss francs). Genentech’s collaboration profit-sharing expenses with its partners Biogen Idec, Novartis and OSI increased due to higher sales of MabThera/Rituxan, Tarceva and Xolair, respectively and reached 1,330 million Swiss francs (2007: 1,297 million Swiss francs), despite being impacted by the weaker US dollar. The gross profit share to GlaxoSmithKline has increased to 478 million Swiss francs (2007: 379 million Swiss francs) following increased Bonviva/Boniva sales. Royalty expenses on Tamiflu were lower in 2008 due to less pandemic sales, however this has been more than offset by strong growth in other royalty-bearing products, in particular Cellcept (autoimmune), Tarceva, Herceptin and Avastin, and additionally often the royalty rates are tiered to certain sales levels. As a percentage of sales, cost of sales decreased to 24.9% from 25.8% in 2007.

Page 86
Pharmaceuticals Division – Cost of sales
2008
(mCHF) 2007
(mCHF)
% change (local
currencies) Manufacturing cost of goods sold and period costs (4,463) (5,041) -8 Royalty expenses (2,105) (2,089) +6 Collaboration and profit-sharing agreements (1,908) (1,755) +19 Amortisation of intangible assets (477) (614) -17 Impairment of property, plant and equipment (10) (3) +287 Impairment of intangible assets - - - Total (8,963) (9,502) 0
Marketing and distribution: Costs increased 2% in local currencies and reached 6.7 billion Swiss francs (2007: 7.0 billion Swiss francs). Significant investments continued in leveraging the rich oncology portfolio, with the rollout of additional approved indications and in particular the pan-tumour positioning of Avastin. Heavy levels of investment continued in Bonviva/Boniva and Pegasys and additionally there were preparations for the launch of Actemra/RoActemra in rheumatoid arthritis. These increases were offset by the absence of last year’s pre-launch preparation for Mircera in the United States. Marketing and distribution costs as a percentage of sales decreased 0.5 percentage points to 18.6% (2007: 19.1%). Research and development: The increase of 11% in local currencies to almost 8 billion Swiss francs reflects continued investment to realise the full potential of the strong development portfolio. This investment includes the late-stage clinical testing of promising compounds such as dalcetrapib (CETP inhibitor for dyslipidemia), ocrelizumab (autoimmune disorders), pertuzumab (breast cancer), and taspoglutide (GLP-1 analogue for type 2 diabetes). Investments were also made in numerous programmes aimed at expanding the use of Roche’s leading anticancer medicines into additional indications, such as Avastin in adjuvant colon cancer. Moreover, impairments of intangible assets were higher than in the comparative period. Research and development costs as a percentage of sales were 22.0% compared to 20.7% in 2007 and 21.3% in the first half of 2008. The Pharmaceuticals Division in total spent 363 million Swiss francs on the in-licensing of pipeline compounds and technologies, which are capitalised as intangible assets as required by IFRS. In total the division spent 8.1 billion Swiss francs on internal and purchased R&D from in-licensing and other alliance deals, representing 22.6% of sales. In addition, Roche Pharmaceuticals spent a further 513 million Swiss francs on the acquisitions of the biotechnology companies Piramed, Mirus and ARIUS.
Pharmaceuticals Division – Investments in research and development
2008
(mCHF) 2007
(mCHF)
% change (local
currencies) Research and development expenses 7,904 7,598 +11 Less non-cash items - Amortisation of intangible assets (34) (31) +22 - Impairment of intangible assets (99) (58) +77 Research and development expenses excluding non-cash items 7,771 7,509 +11 Product intangibles – not available for use 363 739 -46 Technology intangibles - 3 -100 Research and development related capital expenditure 363 742 -46 Total investments in research and development 8,134 8,251 +6
General and administration: Overall costs remained stable in local currencies due to lower legal and restructuring expenses and lower implementation costs for a business harmonisation project including the establishment of a European shared services centre in Budapest, in spite of the loss on the divestment of 46 million Swiss francs for the Cenexi business in France. General and administration expenses as a percentage of sales decreased to 4.4% from 4.6%.

Page 87
Pharmaceuticals Division – General and administration
2008
(mCHF) 2007
(mCHF)
% change (local
currencies) Administration (1,497) (1,665) -4 Legal and environmental settlements (1) (15) -78 Business combinations – transaction expenses (8) - - Gain (loss) on divestment of businesses (46) - - Restructuring expenses (32) (107) -67 Gains (losses) on disposal of property, plant and equipment (7) 17 - Other general items 19 90 -82 Total (1,572) (1,680) 0
Sub-divisional results
Pharmaceuticals sub-divisional results
2008 Sales
(mCHF)
Operating profit
before exceptional
items (mCHF)
Operating profit
before exceptiona
l items as % of
sales
Operating free
cash flow (mCHF)
Operating free cash
flow as % of sales
Roche Pharmaceuticals 22,164 6,795 30.7 6,579 29.7 Genentech 10,461 5,821 55.6 5,089 48.6 Chugai 3,336 591 17.7 385 11.5 Elimination within division 1) - (233) - - - Pharmaceuticals Division 35,961 12,974 36.1 12,053 33.5 2007 Roche Pharmaceuticals 22,970 7,225 31.5 5,595 24.4 Genentech 10,414 5,298 50.9 3,880 37.3 Chugai 3,399 610 17.9 569 16.7 Elimination within division 1) - (91) - - - Pharmaceuticals Division 36,783 13,042 35.5 10,044 27.3
1) Unrealised internal profits on inventories that have been sold from one sub-division to another, but which have not yet been sold on to external customers at the balance sheet date are eliminated as a consolidation entry. Roche Pharmaceuticals: Sales increased by 3% in local currencies despite the impact from declining Tamiflu pandemic government and corporate sales. Excluding these, local sales growth was 9%. Operating profit margin before exceptional items decreased by 0.8 percentage points to 30.7%. Higher investments in research and development and higher expenses to alliance and collaboration partners as well as lower income from out-licensing agreements outweighed favourable developments in cost of sales from manufacturing efficiencies and some product mix impacts and the inclusion of the Viracept recall costs in the 2007 results. Royalty expenses to third parties were 1,316 million Swiss francs (2007: 1,344 million Swiss francs) and royalty expenses to Genentech were 1,702 million Swiss francs (2007: 1,417 million Swiss francs) following the continued success of the oncology portfolio outside the US. Genentech: Sales grew by 11% in local currencies and the operating profit margin before exceptional items improved by 4.7 percentage points to 55.6%. The main drivers here were strong sales growth and higher royalty and other operating income both from third parties and from Roche Pharmaceuticals which more than compensated for continued heavy investments in research and development and higher collaboration profit sharing expenses with Biogen Idec.

Page 88
Chugai: Sales decreased by 4% in local currencies, driven primarily by governmental Tamiflu pandemic stockpiling in 2007. Excluding Tamiflu pandemic, sales increased 4% in local currencies, driven by the successful launches of Avastin, the combination therapy Pegasys plus Copegus and Tarceva, which outweighed 18% lower Epogin sales and the decline in sales from the return of a group of marketed products to Sanofi-Aventis in early 2008. This product group had a sales value of around 110 million Swiss francs in 2007 and reduced Chugai’s reported sales growth by 3 percentage points in 2008. Operating profit decreased by 8% in local currencies driven by lower sales. In spite of lower sales, increased support for product launches and the stable high level of research and development expenses, the operating profit margin of 17.7% was only slightly lower compared to 17.9% in 2007. In June 2008 the Group increased its ownership interest in Chugai’s outstanding shares to 61.5% through a tender offer. Additional information on the Pharmaceuticals Division’s sub-divisional results is given in Note 2 to the Consolidated Financial Statements (page 236 of this Prospectus) and further information on Genentech and Chugai is given in Notes 3 (pages 238 to 242 of this Prospectus) and 4 (pages 242 to 245 of this Prospectus).
Exceptional items
Major legal cases: Following the California Supreme Court decision of 24 April 2008, Genentech’s litigation with the City of Hope National Medical Center was settled with a positive net impact on the operating results of 271 million Swiss francs. Additional information is given in Note 25 to the Consolidated Financial Statements (pages 279 to 284 of this Prospectus). Changes in Group organisation: On 21 July 2008 the Group announced a proposal to purchase all of the outstanding shares of Genentech and also a reorganisation of the Group’s US Pharmaceuticals business. During 2008 expenses of 243 million Swiss francs were incurred for already committed costs, mainly for termination costs for the closure of manufacturing operations at Nutley, New Jersey, and the research site at Palo Alto, California. Additional information is given in Note 8 to the Consolidated Financial Statements (pages 254, 255 of this Prospectus).
Pharmaceuticals Division – Total operating results Roche
Pharmaceuticals Genentech Chugai Pharmaceuticals Division 1)
2008 (mCHF)
2007 (mCH
F)
2008 (mCH
F)
2007 (mCH
F)
2008 (mCH
F)
2007 (mCH
F)
2008 (mCH
F)
2007 (mCH
F) Operating profit before exceptional items
6,795 7,225 5,821 5,298
591 610
12,974 13,042
Major legal cases - - 271 - - - 271 - Changes in Group organisation
(149) - (94) - - - (243) -
Operating profit 6,646 7,225 5,998 5,298 591 610 13,002 13,042 1) Includes unrealised internal profits of 233 million Swiss francs (2007: 91 million Swiss francs) on inventories that have been sold from one sub-division to another, but which have not yet been sold on to external customers at the balance sheet date and which are eliminated as a consolidation entry. Operating free cash flow
All three sub-divisions of the Pharmaceuticals Division continue to generate strong cash flows. The cash generated supports the expansion of the business with the investments in new production facilities and in intellectual property through in-licensing deals. At Genentech in particular, a significant part of the free cash flow has usually been used in their equity compensation plans, including the purchase of their own equity to maintain Roche’s ownership percentage. In 2008 this was equivalent to 109 million Swiss francs (2007: 1,071 million Swiss francs) with the considerable fall in 2008 being due to the prepayment of some repurchases by Genentech at the end of 2007 and the increased cash inflows from exercise of options by Genentech employees. Overall operating free cash flow increased by 31% in local currencies driven by improved net working capital

Page 89
management and lower capital expenditures and outflows for equity compensation plans. As a percentage of sales, operating free cash flow of the Pharmaceuticals Division increased to 33.5% compared to 27.3% in 2007.
Pharmaceuticals Division - Operating free cash flow
2008
Roche Pharmaceutical
s (mCHF)
Genentech (mCHF)
Chugai (mCH
F)
Elimination within division 1)
(mCHF)
Pharmaceuticals Division (mCHF)
Operating profit 6,646 5,998 591 (233) 13,002 Operating profit cash adjustments 2) 1,290 2 204 - 1,496 (Increase)/decrease in net working capital (281) 179 (146) 233 (15) Investments in property, plant and equipment (907) (850) (264) - (2,021) Investments in intangible assets (169) (240) - - (409) Operating free cash flow 6,579 5,089 385 - 12,053 - as % of sales 29.7 48.6 11.5 - 33.5 2007 Operating profit 7,225 5,298 610 (91) 13,042 Operating profit cash adjustments 2) 724 (61) 166 - 829 (Increase)/decrease in net working capital (866) 133 42 91 (600) Investments in property, plant and equipment (987) (1,310) (241) - (2,538) Investments in intangible assets (501) (180) (8) - (689) Operating free cash flow 5,595 3,880 569 - 10,044 - as % of sales 24.4 37.3 16.7 - 27.3
1) Unrealised internal profits on inventories that have been sold from one sub-division to another, but which have not yet been sold on to external customers at the balance sheet date are eliminated as a consolidation entry.
2) Operating profit cash adjustments consist of the elimination of depreciation, amortisation and impairment charges and the replacement of the operating income/expenses for provisions, equity compensation plans and disposals of property, plant and equipment and intangibles assets with their cash equivalents.

Page 90
DIAGNOSTICS OPERATING RESULTS
The Diagnostics Division increased sales to 9.7 billion Swiss francs, growing 10% in local currencies (3% in Swiss francs; 15% in US dollars), leveraged by additional sales from the Ventana acquisition, while strengthening its leading market position in most of the existing businesses. The operating profit decreased by 22% in local currencies to 1.2 billion Swiss francs and the corresponding margin declined 5.3 percentage points to 12.3%. More than half of this decline was due to acquisition impacts, including amortisation of acquired intangible assets and investments to develop the acquired businesses. The remainder of the decline was mostly due to strong competition in the US diabetes care market and portfolio mix effects. In the first half of 2008 the division completed the acquisition of Ventana for a total consideration of 3.8 billion Swiss francs.
Sales
Diagnostics continued to grow well above the market with an increase of 10% in local currencies over the previous year. Major drivers of sales growth were Professional Diagnostics leveraged by Immunodiagnostics, Applied Science, in particular the DNA sequencing business, and Tissue Diagnostics through sales of advanced staining instruments and reagents. Roche Diabetes Care’s sales decreased by 1% mainly as a result of strong competition in the US diabetes care market. Molecular Diagnostics’ sales increased by 5%, driven by sales of automated real-time PCR virology and blood screening products. The acquisition of Ventana was completed at the beginning of February 2008 and sales in the new Tissue Diagnostics business area were 376 million Swiss francs for the eleven months to 31 December 2008. These contributed 4 percentage points to local currency sales growth of the Diagnostics Division.
Diagnostics Division – Sales by business area for 2008*
Business area Sales
(mCHF) % of sales % change
(local currencies) Professional Diagnostics 4,422 46 +9 Diabetes Care 2,971 31 -1 Molecular Diagnostics 1,122 11 +5 Applied Science 765 8 +19 Tissue Diagnostics 376 4 n/a Total 9,656 100 +10
* The figures are sourced from the unaudited internal accounting systems and records of the Group. Professional Diagnostics: Roche Professional Diagnostics continued to gain market share in 2008 as its sales increased 9% in local currencies to 4.4 billion Swiss francs. Immunochemistry sales rose 19% in local currencies to 1.4 billion Swiss francs, showing double-digit sales growth for the eighth consecutive year. Growth was fuelled by a strong uptake of the anti-HCV assay (diagnosis of hepatitis C infection) which was launched in the first half of 2008 outside the US. Growth was also driven by continued demand for the Elecsys NT-proBNP and Troponin T cardiac tests. The new immunoassays launched in 2007/early 2008, were rolled out

Page 91
across European markets providing further growth. These included tests for anti-TSH receptor (thyroid marker), Toxo IgG (toxoplasmosis), vitamin D (osteoporosis), anti-CCP (rheumatoid arthritis), anti-CMV IgG/ IgM for diagnosis CMV infection and Brahms Procalcitonin (sepsis). The first two were also approved in the US in the third quarter of 2008, strengthening our offering in the largest market. With the launch of these new tests, Roche has one of the broadest immunoassay menus, and rollout to new markets will continue to drive growth. The clinical chemistry business grew in line with the market amid continuing price erosion in this mature segment. Demand for the cobas 6000 analyser series for medium-workload laboratories remained strong, with additional configurations launched in 2008 increasing its competitiveness. The rollout of the smaller cobas 4000 instruments for small- to medium-size laboratories, continued with the July 2008 launch of the cobas c 311 clinical chemistry analyser in all markets outside the US. Sales of decentralised testing products rose 10% in local currencies to 793 million Swiss francs, helped by the continued move towards testing at the point-of-care (POC). Coagulation monitoring sales grew double-digit driven by the CoaguChek XS monitor for healthcare professionals and patient self-testing. The Accutrend Plus, the first hand-held device capable of measuring cholesterol, glucose, triglycerides and lactate - important indicators of cardiac risk - is now available in all markets after its initial release at the end of 2007. POC cardiac assays posted double-digit growth, fuelled by continual up-take of the Roche Cardiac proBNP assay and the cobas h 232 portable cardiac testing system, which also runs tests for troponin T, D-dimer, heart type creatine kinase and myoglobin. In July 2008 the Accu-Chek Inform II, the first and only wireless system for hospital glucose testing, was launched outside the US.
Diabetes Care: Roche Diabetes Care maintained market leadership with sales of 3.0 billion Swiss francs, a decrease of 1% in local currencies, primarily impacted by strong competition in the US market. The new blood glucose monitoring products - Accu-Chek Aviva, Accu-Chek Performa and Accu-Chek Compact Plus – almost compensated for declining sales of the older Accu-Chek Advantage. Older products that are in the process of being phased out now account for less than 30% of Diabetes Care sales. Accu-Chek Aviva is now the largest selling system, with strong double-digit growth. The Accu-Chek Compact Plus was launched in the US and Japan in April and June 2008, respectively, and global rollout is now complete for both systems. Roche’s insulin delivery business declined due to strong competition in the US market. Four important new product launches are planned for 2009 to support sales. The Accu-Chek Aviva Nano and Accu-Chek Performa Nano meters will start rollout in their first markets in the first quarter of 2009. The meters are sleeker and more discreetly versioned, targeting the young testers segment. The Accu-Chek Mobile offers complete integration of testing and lancing in a single device and features a unique ‘strip-free’ technology that employs a continuous tape of 50 tests instead of single-use strips. Rollout will commence in the first quarter of 2009. Also scheduled for EU markets beginning of 2009 is the Accu-Chek Combo system, which combines an Accu-Chek Spirit insulin pump and glucose meter with remote-control and bolus calculator capabilities. Molecular Diagnostics: Roche Molecular Diagnostics remained the market leader in an increasingly competitive market, with sales of 1.1 billion Swiss francs, and an overall increase of 5% in local currencies. Sales of virology products, the largest segment, grew 4% in local currencies, driven by continued demand for the automated Cobas AmpliPrep/Cobas TaqMan (CAP/CTM) platform in Europe, Japan and Asia-Pacific. The FDA approved the automated Cobas TaqMan HBV Test and the fully-automated HCV Test in September and October 2008, respectively. Combined with the Cobas TaqMan HIV Test launched in 2007, the initial automation of this virology trio is now completed in the US. Blood screening sales increased by 2% in local currencies, as additional blood centres in Europe, Asia-Pacific and Latin America converted to the fully automated cobas s 201 platform and the comprehensive cobas TaqScreen MPX multiplex test (detects HIV-1 Groups M&O, HIV-2, HCV and HBV in donated blood or plasma). In December 2008 the FDA approved the multiplex test for use on the cobas s 201 system. Earlier in September the Japanese Red Cross (JRC) completed its transition to the fully automated cobas s 401 system and cobas TaqScreen MPX multiplex test, now used to screen 100% of the Japanese blood supply. In June 2008 Roche signed an exclusive deal with DxS Ltd. (UK) for distribution of the TheraScreen K-RAS Mutation Test and TheraScreen EGFR 29 Mutation Test. Both tests are real-time PCR assays and have CE Mark certification. Used in conjunction with other clinically relevant information, K-RAS and EGFR mutation testing can aid doctors in determining patients’ suitability for certain cancer therapies.

Page 92
Applied Science: Roche Applied Science’s sales grew more than three times the Life Sciences market, rising 19% in local currencies to 765 million Swiss francs. The main growth drivers were again the LightCycler 480 system and reagents (for high-throughput real-time PCR) along with the ultrafast Genome Sequencer systems (DNA sequencing), where the business area gained significant market share and is the leader in instrument placement. Biochemical and industrial reagents showed moderate growth in a market impacted by flat government research funding and decreased biotech spending. Microarray systems also contributed strongly from increasing demand since Roche acquired NimbleGen in August 2007. Tissue Diagnostics: Roche Tissue Diagnostics sales totalling 376 million Swiss francs, representing sales from the date of acquisition in February to 31 December 2008, contributed 4 percentage points to the Division’s local-currency sales growth. On a stand-alone basis, Roche Tissue Diagnostics’ sales for the entire year reached 369 million US dollars, an increase of 23% in local currencies over 2007. Significantly exceeding the estimated market growth rate, this increase was due to robust instrumentation sales of BenchMark XT and LT and immunohistochemistry reagent sales in the advanced staining segment. Commercial operations outside North America are largely integrated into Roche, with a focus on market expansion in Europe and Latin America. A significant number of distributor relationships have now been replaced by dedicated Roche sales teams. Two major new systems, BenchMark Ultra and Vantage, were launched in 2008. BenchMark Ultra, the first automated system to simultaneously perform immunohistochemistry and in situ hybridisation on a single platform, was launched in the Unites States, Canada and Europe in the second half of the year. The Vantage workflow solution was launched in the US in April 2008 and is a complete workflow information management system for the anatomical pathology lab providing tracking capabilities that streamline and integrate lab work and information flow for greater productivity and patient safety. In addition, 10 new antibodies for various cancer diagnostics were launched to further complement the portfolio. See the Business Report for more information on Roche’s diagnostics products and Business Areas. Sales by regions: Overall sales continued to grow ahead or in line with the total market in all regions. In North America the increase of 14%, which includes 12 percentage points from Ventana, was driven by the Professional Diagnostics, Applied Science and Tissue Diagnostics business areas which more than compensated for the 12% decline in Diabetes Care in the North American market. Japan grew significantly more than its market with a 7% increase, while strong performance was also seen in emerging markets in Europe, Asia-Pacific and Latin America.
Diagnostics Division – Sales by region for 2008*
Region Sales
(mCHF) % of sales % change
(local currencies) EMEA 1) 5,238 54 +7 North America 2,550 26 +14 Asia-Pacific 826 9 +18 Latin America 556 6 +18 Japan 450 5 +7 Other regions 36 - -18 Total 9,656 100 +10
1) Europe, Middle East and Africa. * The figures are sourced from the unaudited internal accounting systems and records of the Group. Operating results
Royalties and other operating income: Income of 139 million Swiss francs was 21% lower in local currencies compared to 2007, which included higher out-licensing income.
Diagnostics Division – Royalties and other operating income
2008
(mCHF) 2007
(mCHF)
% change (local
currencies) Royalty income 102 126 -13

Page 93
Income from out-licensing agreements 33 55 -38 Income from disposal of products and other 4 5 -21 Total 139 186 -21
Cost of sales: The overall increase of 19% in local currencies was considerably higher than sales growth. This was primarily a result of a number of impacts from the acquisitions made by the division over the last two years. Firstly, amortisation of product intangibles increased by 45% in local currencies, partly due to 2008 including a full twelve months amortisation charge from the 2007 acquisitions and 11 months from Ventana. Secondly, manufacturing cost of goods sold and period costs includes an acquisition accounting effect of 33 million Swiss francs of expenses relating to the fair-value write-up of Ventana’s inventory which was fully written off during the first half of 2008. Finally, royalty expenses in 2007 include the reversal of 57 million Swiss francs of BioVeris royalty accruals. Excluding acquisition accounting impacts, the underlying manufacturing cost of goods sold and period costs grew by 14% in local currencies, primarily driven by continued investment in instrument and meter placements to expand market share, and total cost of sales as a percentage to sales increased to 47.1% in 2008 compared to 46.0% in 2007.
Diagnostics Division – Cost of sales
2008
(mCHF) 2007
(mCHF) % change
(local currencies) Manufacturing cost of goods sold and period costs (3,956) (3,696) +15 Royalty expenses (278) (215) +39 Collaboration and profit-sharing agreements (1) - - Amortisation of product intangibles (450) (328) +45 Impairment of property, plant and equipment (8) (2) +299 Impairment of product intangibles (5) - - Total (4,698) (4,241) +19
Marketing and distribution: The increase of 15% in local currencies was mainly due to investments to increase market share, especially in Diabetes Care, and to competitively fund the sequencing and array businesses in Applied Science. Excluding the impact of the newly acquired Tissue Diagnostics business, marketing and distribution costs grew 10% in local currencies. Marketing and distribution as a percentage of sales was 25.6% compared to 24.7% in 2007. Research and development: Costs increased by 26% in local currencies reflecting investments into the sequencing and array businesses, and into molecular oncology tests. Tissue Diagnostics contributed 10 percentage points to this growth. As a percentage of sales, research and development costs increased to 9.7% from 8.4% in 2007.
Diagnostics Division – Investments in research and development
2008
(mCHF) 2007
(mCHF)
% change (local
currencies) Research and development expenses 941 787 +26 Less non-cash items - Amortisation of intangible assets (8) (3) +168 - Impairment of intangible assets - - - Research and development expenses excluding non-cash items 933 784 +26
General and administration: General and administration costs decreased by 4% in local currencies. The administration growth of 9% in local currencies is exclusively due to the acquired Tissue Diagnostics business. In the first half of 2008, there were 41 million Swiss francs of transaction expenses relating to the Ventana

Page 94
acquisition. Restructuring costs were lower in 2008, mainly due to 2007 including 29 million Swiss francs of post-acquisition restructuring expenses at BioVeris. Restructuring costs in 2008 were 27 million Swiss francs mainly relating to the transfer of production in Professional Diagnostics from the United States to Germany and Switzerland. Moreover expenses for legal and environmental settlements were significantly lower in 2008.
Diagnostics Division – General and administration
2008
(mCHF) 2007
(mCHF)
% change (local
currencies) Administration (384) (373) +9 Legal and environmental settlements (15) (80) -81 Business combinations – transaction expenses (41) - - Restructuring expenses (27) (39) -25 Gains (losses) on disposal of property, plant and equipment (2) (1) +159 Other general items (26) (58) -55 Total (495) (551) -4
Operating free cash flow
Lower operating profit was the main driver of the decline in operating free cash flow while higher investments in property, plant and equipment, particularly in instrument placements, were compensated by lower investments in intangible assets.
Diagnostics Division - Operating free cash flow
2008
(mCHF) 2007
(mCHF) Operating profit 1,187 1,648 Operating profit cash adjustments1) 1,122 1,121 (Increase)/decrease in net working capital (464) (374) Investments in property, plant and equipment (1,237) (1,069) Investments in intangible assets (8) (257) Operating free cash flow 600 1,069 - as % of sales 6.2 11.4
1) Operating profit cash adjustments consist of the elimination of depreciation, amortisation and impairment charges and the replacement of the operating income/expenses for provisions, equity compensation plans and disposals of property, plant and equipment and intangibles assets with their cash equivalents.
CORPORATE OPERATING COSTS
General and administration: Costs in 2008 were 19% higher at 265 million Swiss francs (222 million Swiss francs in 2007). The 2008 results include 18 million Swiss francs of costs due to the realignment of divisional human resource activities into corporate human resources. In 2007, these costs were part of the Pharmaceuticals and Diagnostics divisional results. Operating free cash flow was a net outflow of 275 million Swiss francs (2007: net outflow of 442 million Swiss francs). FOREIGN EXCHANGE IMPACT ON OPERATING RESULTS
The Group's exposure to movements in foreign currencies affecting its operating results, as expressed in Swiss francs, is summarised by the following key figures and comments.
Growth* % change (local currencies) % change (CHF) 2008 2007 2008 2007
Sales +6 +10 -1 +10 Operating profit before exceptional items +4 +22 -4 +23
* The figures are sourced from the unaudited part of the Roche Annual Report 2008, Part 2 Finance Report (page 19).
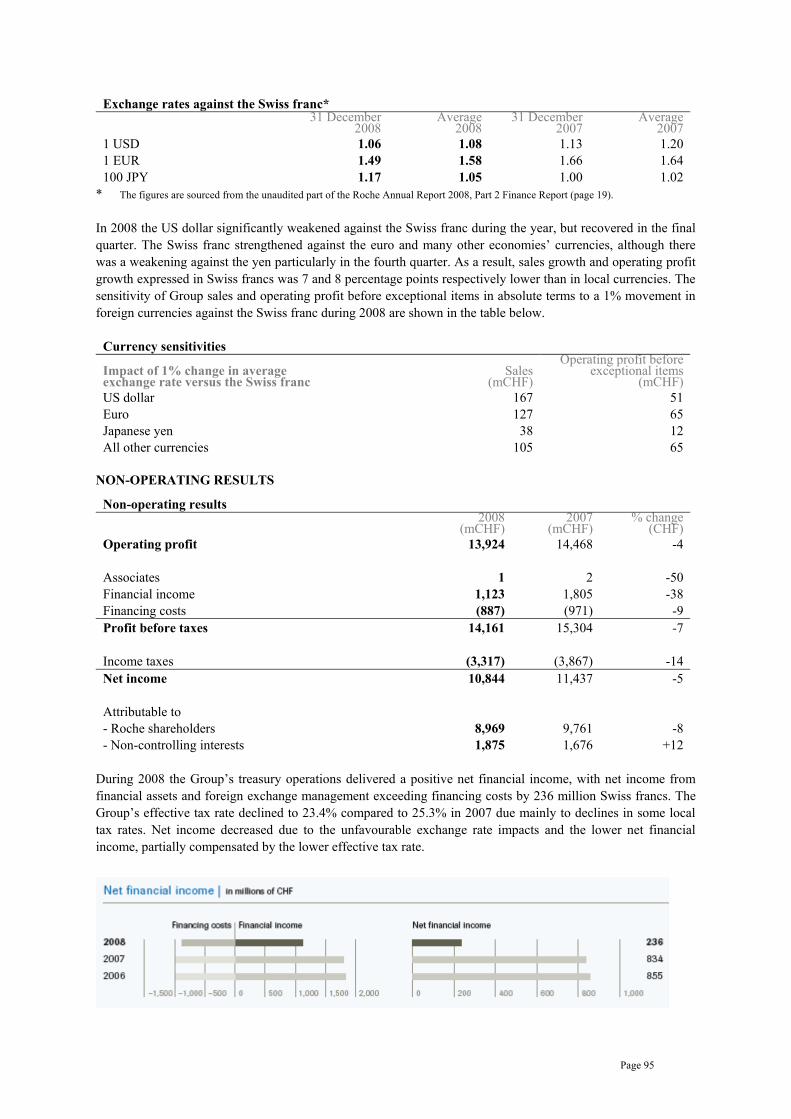
Page 95
Exchange rates against the Swiss franc*
31 December
2008 Average
2008 31 December
2007 Average
2007 1 USD 1.06 1.08 1.13 1.20 1 EUR 1.49 1.58 1.66 1.64 100 JPY 1.17 1.05 1.00 1.02
* The figures are sourced from the unaudited part of the Roche Annual Report 2008, Part 2 Finance Report (page 19). In 2008 the US dollar significantly weakened against the Swiss franc during the year, but recovered in the final quarter. The Swiss franc strengthened against the euro and many other economies’ currencies, although there was a weakening against the yen particularly in the fourth quarter. As a result, sales growth and operating profit growth expressed in Swiss francs was 7 and 8 percentage points respectively lower than in local currencies. The sensitivity of Group sales and operating profit before exceptional items in absolute terms to a 1% movement in foreign currencies against the Swiss franc during 2008 are shown in the table below.
Currency sensitivities
Impact of 1% change in average exchange rate versus the Swiss franc
Sales (mCHF)
Operating profit before exceptional items
(mCHF) US dollar 167 51 Euro 127 65 Japanese yen 38 12 All other currencies 105 65
NON-OPERATING RESULTS
Non-operating results
2008
(mCHF) 2007
(mCHF) % change
(CHF) Operating profit 13,924 14,468 -4 Associates 1 2 -50 Financial income 1,123 1,805 -38 Financing costs (887) (971) -9 Profit before taxes 14,161 15,304 -7 Income taxes (3,317) (3,867) -14 Net income 10,844 11,437 -5 Attributable to - Roche shareholders 8,969 9,761 -8 - Non-controlling interests 1,875 1,676 +12
During 2008 the Group’s treasury operations delivered a positive net financial income, with net income from financial assets and foreign exchange management exceeding financing costs by 236 million Swiss francs. The Group’s effective tax rate declined to 23.4% compared to 25.3% in 2007 due mainly to declines in some local tax rates. Net income decreased due to the unfavourable exchange rate impacts and the lower net financial income, partially compensated by the lower effective tax rate.

Page 96
Financial income
Financial income was 1,123 million Swiss francs, declining 38% compared to 2007. Interest income and income from debt securities were 392 million Swiss francs, down 61% due to lower holdings, lower US interest rates and a weaker US dollar compared to the Swiss franc. Also contributing to the lower result were losses on the sale of debt securities caused by limited investor demand during the current financial market crisis. Losses of 64 million Swiss francs were incurred on fixed income securities carried at ‘fair-value-through-profit-and-loss’, losses of 44 million Swiss francs were incurred on derivatives relating to debt securities, and impairments of 53 million Swiss francs were recorded on debt securities. Net income from equity securities was 133 million Swiss francs compared to 313 million Swiss francs in 2007. The result includes impairments of 115 million Swiss francs on equity securities. Funds continue to be invested with a conservative risk profile, with low exposures to equities. Expected returns on pension plan assets were 688 million Swiss francs, up 3% compared to 2007. Net foreign exchange losses were 65 million Swiss francs compared to losses of 153 million Swiss francs in 2007. During the second half of 2008, the erosion of certain emerging market currencies caused a significant increase in the corresponding hedge expenses. A full analysis of financial income is given in Note 5 to the Consolidated Financial Statements (pages 245, 246 of this Prospectus). Financial costs
Financing costs were 887 million Swiss francs, 9% lower compared to 2007 reflecting the redemption of several debt instruments during 2007 and 2008, as well as a weaker US dollar compared to the Swiss franc. Time costs of provisions were 21 million Swiss francs, 48 million Swiss francs lower than in 2007, reflecting the settlement of the City of Hope litigation in the second quarter of 2008. The interest cost of pension plans was 652 million Swiss francs, an increase of 7% compared to 2007, due to changes in discount rates used for actuarial calculations. A full analysis of financing costs is given in Note 5 to the Consolidated Financial Statements (pages 245, 246 of this Prospectus). Income taxes
The Group’s effective tax rate declined to 23.4% compared to the 2007 rate of 25.3%. The main driver is a significantly lower tax rate at Roche, with an underlying effective tax rate of 10.1% compared to 15.6% in 2007. This reflects lower taxable profits in certain high tax jurisdictions and certain one-time effects, notably a favourable change in tax rates in Basel that was effective in 2008. The improvement is despite an increasing pre-tax profit contribution from Genentech.
Analysis of the Group’s effective tax rate 2008 2007
Profit before tax
(mCHF)
Income taxes
(mCHF) Tax rate
(%)
Profit before tax
(mCHF)
Income taxes
(mCHF) Tax rate
(%) Roche (excl. Genentech and Chugai) 7,402 (745) 10.1 9,201 (1,436) 15.6 Genentech 6,096 (2,331) 38.2 5,470 (2,189) 40.0 Chugai 663 (241) 36.3 633 (242) 38.2 Group’s effective tax rate 14,161 (3,317) 23.4 15,304 (3,867) 25.3
NET INCOME AND EARNINGS PER SHARE

Page 97
In 2008 Group net income decreased by 5% to 10.8 billion Swiss francs. Of the total 1,875 million Swiss francs non-controlling interests, 1,659 million Swiss francs are attributable to Genentech non-controlling interests and 200 million Swiss francs to Chugai non-controlling interests. The net impact of exceptional items on net income was minor and had no impact on the net income growth rate or on the absolute amount of 10.8 billion Swiss francs.
Diluted EPS
2008
(CHF) 2007
(CHF) % change Group 10.23 11.16 -8 Core 11.04 11.85 -7
The decrease in diluted EPS was due to the decrease in net income attributable to Roche shareholders, as described above. The Core EPS, which excludes exceptional items and amortisation and impairment of intangible assets, decreased by 7%. In local currencies Core EPS increased by 2%. This includes calculations of Core EPS and reconciles these to the Group’s published IFRS results. CASH FLOWS AND NET CASH
Free cash flow
2008 Pharmaceutic
als(mCHF)
Diagnostics
(mCHF) Corporate
(mCHF) Group
(mCHF) Operating profit 13,002 1,187 (265) 13,924 Operating profit cash adjustments 1,496 1,122 (7) 2,611 (Increase)/decrease in net working capital (15) (464) (2) (481) Investments in property, plant and equipment (2,021) (1,237) (1) (3,259) Investments in intangible assets (409) (8) - (417) Operating free cash flow 12,053 600 (275) 12,378 Treasury activities 166 Taxes paid (3,514) Dividends paid (4,051) Free cash flow 4,979 2007 Operating profit 13,042 1,648 (222) 14,468 Operating profit cash adjustments 829 1,121 (16) 1,934 (Increase)/decrease in net working capital (600) (374) (202) (1,176) Investments in property, plant and equipment (2,538) (1,069) (2) (3,609) Investments in intangible assets (689) (257) - (946) Operating free cash flow 10,044 1,069 (442) 10,671 Treasury activities 832 Taxes paid (4,494) Dividends paid (3,027) Free cash flow 3,982
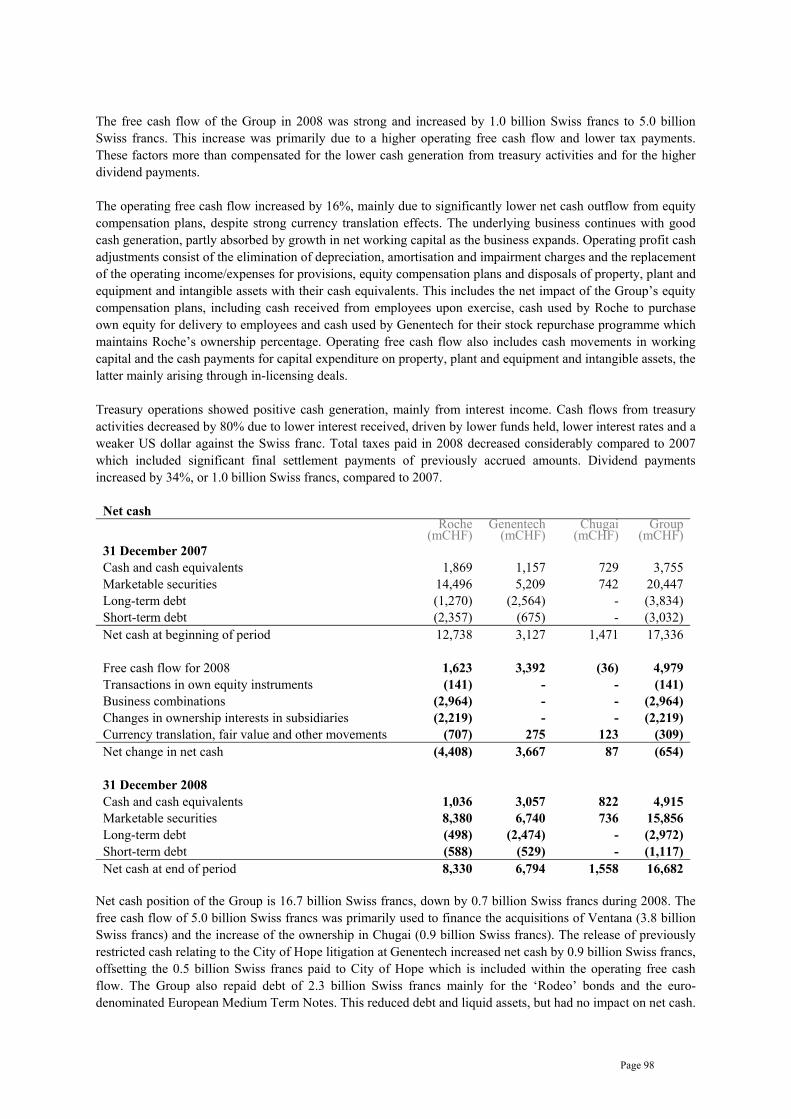
Page 98
The free cash flow of the Group in 2008 was strong and increased by 1.0 billion Swiss francs to 5.0 billion Swiss francs. This increase was primarily due to a higher operating free cash flow and lower tax payments. These factors more than compensated for the lower cash generation from treasury activities and for the higher dividend payments. The operating free cash flow increased by 16%, mainly due to significantly lower net cash outflow from equity compensation plans, despite strong currency translation effects. The underlying business continues with good cash generation, partly absorbed by growth in net working capital as the business expands. Operating profit cash adjustments consist of the elimination of depreciation, amortisation and impairment charges and the replacement of the operating income/expenses for provisions, equity compensation plans and disposals of property, plant and equipment and intangible assets with their cash equivalents. This includes the net impact of the Group’s equity compensation plans, including cash received from employees upon exercise, cash used by Roche to purchase own equity for delivery to employees and cash used by Genentech for their stock repurchase programme which maintains Roche’s ownership percentage. Operating free cash flow also includes cash movements in working capital and the cash payments for capital expenditure on property, plant and equipment and intangible assets, the latter mainly arising through in-licensing deals. Treasury operations showed positive cash generation, mainly from interest income. Cash flows from treasury activities decreased by 80% due to lower interest received, driven by lower funds held, lower interest rates and a weaker US dollar against the Swiss franc. Total taxes paid in 2008 decreased considerably compared to 2007 which included significant final settlement payments of previously accrued amounts. Dividend payments increased by 34%, or 1.0 billion Swiss francs, compared to 2007.
Net cash
Roche
(mCHF) Genentech
(mCHF) Chugai
(mCHF) Group
(mCHF) 31 December 2007 Cash and cash equivalents 1,869 1,157 729 3,755 Marketable securities 14,496 5,209 742 20,447 Long-term debt (1,270) (2,564) - (3,834) Short-term debt (2,357) (675) - (3,032) Net cash at beginning of period 12,738 3,127 1,471 17,336 Free cash flow for 2008 1,623 3,392 (36) 4,979 Transactions in own equity instruments (141) - - (141) Business combinations (2,964) - - (2,964) Changes in ownership interests in subsidiaries (2,219) - - (2,219) Currency translation, fair value and other movements (707) 275 123 (309) Net change in net cash (4,408) 3,667 87 (654) 31 December 2008 Cash and cash equivalents 1,036 3,057 822 4,915 Marketable securities 8,380 6,740 736 15,856 Long-term debt (498) (2,474) - (2,972) Short-term debt (588) (529) - (1,117) Net cash at end of period 8,330 6,794 1,558 16,682
Net cash position of the Group is 16.7 billion Swiss francs, down by 0.7 billion Swiss francs during 2008. The free cash flow of 5.0 billion Swiss francs was primarily used to finance the acquisitions of Ventana (3.8 billion Swiss francs) and the increase of the ownership in Chugai (0.9 billion Swiss francs). The release of previously restricted cash relating to the City of Hope litigation at Genentech increased net cash by 0.9 billion Swiss francs, offsetting the 0.5 billion Swiss francs paid to City of Hope which is included within the operating free cash flow. The Group also repaid debt of 2.3 billion Swiss francs mainly for the ‘Rodeo’ bonds and the euro-denominated European Medium Term Notes. This reduced debt and liquid assets, but had no impact on net cash.

Page 99
BALANCE SHEET
Condensed balance sheet
31 December 2008
(mCHF)
31 December 2007
(mCHF) %
change Property, plant and equipment 18,190 17,832 +2 Goodwill and intangible assets 15,474 13,181 +17 Other non-current assets 3,821 4,518 -15 Cash and marketable securities 20,771 24,202 -14 Other current assets 17,833 18,632 -4 Total assets 76,089 78,365 -3 Debt (current and non-current) (4,089) (6,866) -40 Other non-current liabilities (7,191) (6,634) +8 Other current liabilities (10,987) (11,422) -4 Total liabilities (22,267) (24,922) -11 Total net assets 53,822 53,443 +1 Capital and reserves attributable to Roche shareholders 44,479 45,483 -2 Equity attributable to non-controlling interests 9,343 7,960 +17 Total equity 53,822 53,443 +1
A full consolidated balance sheet is given on page 30 of the Consolidated Financial Statements (page 218 of this Prospectus). Non-current assets: Property, plant and equipment increased due to capital expenditure on new production facilities by Genentech, the Diagnostics Division and Chugai. This was partly offset by exchange rate impacts, primarily due to the US dollar and euro being 6% and 10% lower at 31 December 2008 compared to 31 December 2007. Goodwill and intangible assets increased by 2.3 billion Swiss francs, mainly from the Ventana, Piramed, Mirus and ARIUS acquisitions and in-licensing transactions. Current assets: Within current assets, inventories and accounts receivable were slightly higher in local currencies, while there was a significant decrease in cash and marketable securities as shown in net cash above. Debt: There was a reduction in debt by a further 2.8 billion Swiss francs, of which 1.0 billion Swiss francs relates to the redemption on maturity of the ‘Rodeo’ Swiss franc bonds and 1.2 billion Swiss francs to the redemption on maturity of the euro-denominated European Medium Term Notes. Most of the remaining decrease is due to exchange rate impacts. Other non-current and current liabilities: The overall balance was stable with an increase of 1.0 billion Swiss francs in pension obligations being largely offset by the reduction of 0.7 billion Swiss francs in legal and other provisions following settlements made in 2008, notably at Genentech for the City of Hope litigation.

Page 100
Total net assets/equity: The most significant movements in equity were the net income of 10.8 billion Swiss francs and the dividend payments of 4.1 billion Swiss francs, currency translation losses of 3.0 billion Swiss francs, the impact of the change in ownership interests in Ventana and Chugai of 2.2 billion Swiss francs in total and the impact of actuarial losses on post-employment plans of 1.5 billion Swiss francs, net of tax. Strong financial condition: The Group remains solidly financed, with equity (including non-controlling interests) representing 71% of total assets and 84% of total assets financed long-term. PENSIONS AND OTHER POST-EMPLOYMENT BENEFITS
Post-employment benefit plans are classified as ‘defined contribution plans’ if the Group pays fixed contributions into a separate fund or to a third-party financial institution and will have no further legal or constructive obligation to pay further contributions. In 2008 expenses for the Group’s defined contribution plans were 253 million Swiss francs (2007: 259 million Swiss francs). All other plans are classified as ‘defined benefit plans’, even if the Group’s potential obligation is relatively minor or has a relatively remote possibility of arising. The funding and asset management of the Group’s various defined benefit plans is overseen at a corporate level. Plans are usually established as trusts independent of the Group and are funded by payments from the Group and by employees, but in some cases the plan is unfunded and the Group pays pensions to retired employees directly from its own financial resources.
Funding status of defined benefit pension and other post-employment benefit plans
2008
(mCHF) 2007
(mCHF) Funded plans - Fair value of plan assets 9,438 12,170 - Defined benefit obligation (10,504) (10,646) - Over (under) funding (1,066) 1,524 Unfunded plans - Defined benefit obligation (3,078) (3,344)
Funding status: Overall the Group’s defined benefit plans continue to be adequately funded despite the financial turbulence during 2008 with the funding status at 90% compared to 114% at the beginning of the year. The main movements came from a reduction of the fair value of plan assets following declines in global financial markets. Expenses recorded in income statement: Total pension expenses in 2008 relating to the Group’s defined benefit plans were 281 million Swiss francs compared to 312 million Swiss francs in 2007. The decrease of 10% is mainly due to changes in discount rates adopted at the end of 2007. Based on the revised actuarial assumptions at the end of 2008, total pension expenses for 2009 are expected to increase compared to 2008 due to a lower expected return on plan assets. Full details of the Group’s pensions and other post-employment benefits are given in Note 10 to the Consolidated Financial Statements (pages 256 to 261 of this Prospectus). ROCHE SECURITIES
The Roche securities performed broadly in line with the MSCI Europe Pharmaceutical Index and the global pharmaceutical sector.
Share price and market capitalisation (at 31 December)
2008 2007 % change Share price (CHF) 168.70 213.00 -21 Non-voting equity security (Genussschein) price (CHF) 162.50 195.60 -17 Market capitalisation (billions of CHF) 141 171 -18
* The figures are sourced from the unaudited part of the Roche Annual Report 2008, Part 2 Finance Report (page 25).
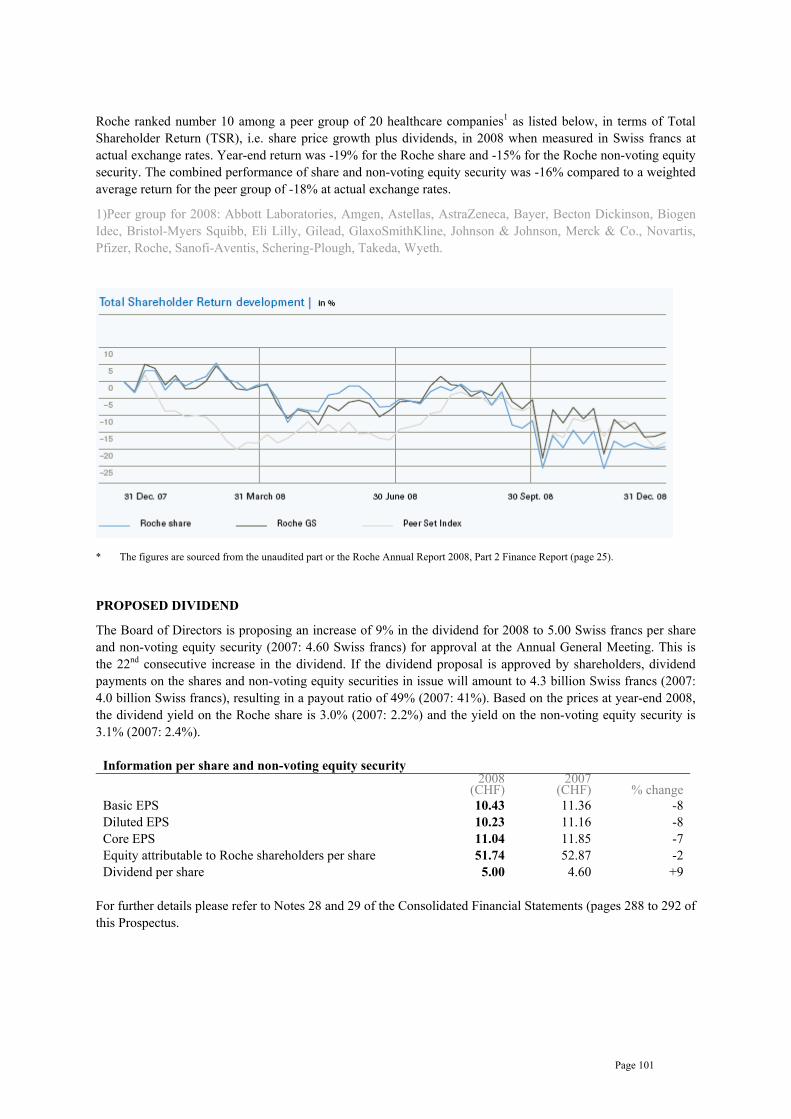
Page 101
Roche ranked number 10 among a peer group of 20 healthcare companies1 as listed below, in terms of Total Shareholder Return (TSR), i.e. share price growth plus dividends, in 2008 when measured in Swiss francs at actual exchange rates. Year-end return was -19% for the Roche share and -15% for the Roche non-voting equity security. The combined performance of share and non-voting equity security was -16% compared to a weighted average return for the peer group of -18% at actual exchange rates.
1)Peer group for 2008: Abbott Laboratories, Amgen, Astellas, AstraZeneca, Bayer, Becton Dickinson, Biogen Idec, Bristol-Myers Squibb, Eli Lilly, Gilead, GlaxoSmithKline, Johnson & Johnson, Merck & Co., Novartis, Pfizer, Roche, Sanofi-Aventis, Schering-Plough, Takeda, Wyeth.
* The figures are sourced from the unaudited part or the Roche Annual Report 2008, Part 2 Finance Report (page 25). PROPOSED DIVIDEND
The Board of Directors is proposing an increase of 9% in the dividend for 2008 to 5.00 Swiss francs per share and non-voting equity security (2007: 4.60 Swiss francs) for approval at the Annual General Meeting. This is the 22nd consecutive increase in the dividend. If the dividend proposal is approved by shareholders, dividend payments on the shares and non-voting equity securities in issue will amount to 4.3 billion Swiss francs (2007: 4.0 billion Swiss francs), resulting in a payout ratio of 49% (2007: 41%). Based on the prices at year-end 2008, the dividend yield on the Roche share is 3.0% (2007: 2.2%) and the yield on the non-voting equity security is 3.1% (2007: 2.4%).
Information per share and non-voting equity security
2008
(CHF) 2007
(CHF) % change Basic EPS 10.43 11.36 -8 Diluted EPS 10.23 11.16 -8 Core EPS 11.04 11.85 -7 Equity attributable to Roche shareholders per share 51.74 52.87 -2 Dividend per share 5.00 4.60 +9
For further details please refer to Notes 28 and 29 of the Consolidated Financial Statements (pages 288 to 292 of this Prospectus.

Page 102
FINANCIAL RISKS
The Group manages its financial assets and liabilities in a conservative way, with Treasury activities servicing the Group’s business requirements without materially affecting the Group’s risk profile. Asset allocation: Surplus liquid funds are either held as cash or are invested in high-quality, investment grade fixed income securities. The majority holdings are in liquid, short term instruments with maturities of up to three months. On some longer-term holdings, Roche experiences wider credit spreads and reduced liquidity caused by the current financial markets situation. During the first quarter of 2008, Roche sold almost all remaining equity positions classified as marketable securities. Their share declined to less than one percent (31 December 2007: 1%) of total liquid funds. In addition, the Group owns equity securities classified as financial long-term assets (see Note 16 to the Consolidated Financial Statements, page 275 of this Prospectus) which are venture capital positions in connection with the Group’s strategic alliance efforts. These positions total 0.6 billion Swiss francs (31 December 2007: 0.8 billion Swiss francs).
Cash and marketable securities
2008
(mCHF) 2008
(% of total) 2007
(mCHF) 2007
(% of total) Cash and cash equivalents 4,915 24 3,755 16 Money market instruments 7,961 38 11,132 46 Bonds, debentures and other investments 7,844 38 9,023 37 Shares 51 0 292 1 Total cash and marketable securities 20,771 100 24,202 100
Credit risk: Credit risk arises from the possibility that counterparties to transactions may default on their obligations, causing financial losses for the Group. Despite significant market difficulties in 2008, the rating profile of the Group’s 20.7 billion Swiss francs fixed income marketable securities remained strong, with 96% being invested in the A-AAA range. The counterparty profile of the Group’s 9.8 billion Swiss francs trade receivables remains well diversified across types of customer and regions, with some wholesaler concentration in the US. Market risks: Market risk arises from changing market prices of the Group’s financial assets or financial liabilities. The exposures are predominantly related to changes in foreign exchange rates, interest rates and equity prices. The Group uses Value-at-Risk (VaR) to assess the impact of market risk on its financial instruments. VaR data indicates the value range within which a given financial instrument will fluctuate with a pre-set probability as a result of movements in market prices. The VaR data in the table below indicate the loss level over a period of one month which with 95% probability will not be exceeded. Actual future gains and losses associated with our treasury activities may differ materially from the VAR analyses performed due to the inherent limitations associated with predicting the timing and amount of changes to interest rates, foreign currency exchanges rates and equity investment prices, particularly in periods of high market volatilities. Furthermore, the VaR numbers below do not include a credit risk component.
Market risk of financial instruments
31 December 2008
(mCHF) 31 December 2007
(mCHF) VaR – Foreign exchange component 96 75 VaR - Interest rate component 27 40 VaR - Other price component 62 93 Diversification (52) (65) VaR – Total 133 143
At 31 December 2008, the total VaR of the financial assets and liabilities was 133 million Swiss francs (31 December 2007: 143 million Swiss francs). The foreign exchange VaR increased and comes mainly from hedging of non-US dollar cash flows from future royalty income over the next five years at Genentech. The lower contribution from the interest rate component was caused by the ageing of fixed-term liabilities. Other

Page 103
price risk arises mainly from movements in the prices of equity securities. The decrease of the other price component is due to the significantly reduced equity security holdings. At 31 December 2008, the Group held equity securities with a market value of 0.6 billion Swiss Francs (31 December 2007: 1.1 billion Swiss francs). This number includes holdings in biotechnology companies, which were acquired in the context of licensing transactions or scientific collaborations. The lower holdings in equity securities resulted in a lower VaR for other price risk. Further information on financial risk management and financial risks and the VaR methodology is included in Note 32 to the Consolidated Financial Statements (pages 295 to 301 of this Prospectus). INTERNATIONAL FINANCIAL REPORTING STANDARDS
The Roche Group has been using International Financial Reporting Standards (IFRS) to report its consolidated results since 1990. The Group has made changes to its accounting policies with respect to new and revised International Financial Reporting Standards and interpretations. The Group has implemented the revised versions of IFRS 3 ‘Business Combinations’ and IAS 27 ‘Consolidated and Separate Financial Statements’. The main impacts of these on the 2008 results are that transaction costs from business combinations are now expensed instead of being included as part of the acquisition price. The Group has also implemented IFRIC interpretation 14 which relates to IAS 19 ‘Employee benefits’ which results in an increase in the pension assets recorded on the Group’s balance sheet and a corresponding increase in the Group’s equity. Year ended 31 December 2007 Operating Results Group operating results
The 2007 results show continuing strong operating performance both at a sales and an operating profit margin level, with the main impetus coming from the Pharmaceuticals Division. Total sales grew by 10% in local currencies (10% in Swiss francs; 15% in US dollars) to 46.1 billion Swiss francs, with the Pharmaceuticals Division representing 80% of Group sales and the Diagnostics Division contributing 20%. The incremental sales increase of 4.1 billion Swiss francs was achieved through organic growth. Demand for the Group’s oncology drugs Avastin, Herceptin, MabThera/Rituxan, Tarceva and Xeloda continued to be strong. Additional growth drivers in the Pharmaceuticals Division were the ophthalmology drug Lucentis, Bonviva/Boniva in metabolism/bone, CellCept in transplantation and Pegasys in virology. In the Diagnostics Division the growth areas were Professional Diagnostics, Diabetes Care and Applied Science. The Group’s operating profit increased by 22% in local currencies to 14.5 billion Swiss francs. The corresponding operating profit margin grew by 3.5 percentage points to 31.4%, driven by the increase in Pharmaceuticals of 3.8 percentage points, and by the 1.3 percentage point increase in Diagnostics. This margin growth was achieved at the same time as the Group continued to increase investments in launch and pre-launch activities and in particular in the strong development pipeline. The increase in the Diagnostics margin was driven by the sales growth, a release of accruals following the BioVeris acquisition and the positive effect of the absence in 2007 of intangible asset impairment charges.

Page 104
The exchange rate impact on sales and operating profit growth as expressed in Swiss francs was moderate, with Swiss-franc sales growth being equal to local-currency growth, while Swiss-franc operating profit growth was around 1 percentage point higher. In 2007 the average exchange rate for the euro was 4% higher than in the comparative period while the US dollar was 4% lower, and the Japanese yen lost around 6%.
Group operating results for 2007 Pharmaceuticals
(mCHF) Diagnostics
(mCHF) Corporate
(mCHF) Group
(mCHF) Sales 36,783 9,350 - 46,133 Operating profit 13,042 1,648 (222) 14,468 - margin, % of sales 35.5 17.6 - 31.4 EBITDA 14,706 2,580 (218) 17,068 - margin, % of sales 40.0 27.6 - 37.0
Group operating results – Development of results compared to 2006 Pharmaceuticals Diagnostics Corporate Group
Sales - % increase in local currencies +11 +6 - +10 Operating profit - % increase in local currencies +22 +14 -7 +22 - margin: percentage point increase +3.8 +1.3 - +3.5 EBITDA - % increase in local currencies +20 +2 -7 +17 - margin: percentage point increase +3.5 -1.0 - +2.7
Pharmaceuticals operating results The Pharmaceuticals Division increased its sales by 11% in local currencies (10% in Swiss francs; 15% in US dollars) to 36.8 billion Swiss francs, approximately twice the global market growth rate. Operating profit was 13.0 billion Swiss francs, representing growth of 22% in local currencies, and the corresponding margin increased by 3.8 percentage points to 35.5%. The increase in marketing costs was significantly less than the growth in sales due to continued productivity improvements. The increase reflects support costs for the growing oncology portfolio with broader indications particularly for Avastin, as well as investments for the launch of Bonviva/Boniva, Lucentis and Mircera and the re-launch of Tamiflu for seasonal use. The growth in research and development expenses exceeded the increase in sales driven by the significant investments in the strong pipeline reflecting the expanded portfolio and the large number of clinical trials.
Pharmaceuticals Division results
2007 (mCHF)
2006 (mCHF)
% change (CHF)
% change (local
currencies) Sales 36,783 33,294 +10 +11 Royalties and other operating income 2,057 1,209 +70 +76 Cost of sales (9,502) (9,032) +5 +8 Marketing and distribution (7,018) (6,859) +2 +3 Research and development (7,598) (6,590) +15 +18 General and administration (1,680) (1,477) +14 +17 Operating profit 13,042 10,545 +24 +22 - margin, % of sales 35.5 31.7 +3.8 EBITDA 14,706 12,168 +21 +20 - margin, % of sales 40.0 36.5 +3.5

Page 105
Sales: Sales of the division’s oncology portfolio grew by 20% in 2007 and now account for 50% of pharmaceutical sales. Excluding supportive care products, combined sales of cancer therapeutics rose 23%, increasing the Roche Group’s share of the global market for cancer medicines to just under 30%. Other therapeutic areas also performed strongly, notably Metabolism/Bone and Inflammation/ Autoimmune/ Transplantation, two key pillars of growth for Roche.
Pharmaceuticals Division - Sales by therapeutic area for 2007* Therapeutic area
Sales (mCHF)
% of sales % change (local currencies)
Oncology 18,261 50 +20 Inflammation/Autoimmune/Transplantation 2,956 8 +11 Virology 5,002 81)/13 -51)/-8 Metabolism/Bone 2,818 8 +16 Renal anemia 1,520 4 -9 Others 6,226 17 +10 Total 36,783 100 +11
1) Excluding Tamiflu pandemic government and corporate sales. * The figures are sourced from the unaudited internal accounting systems and records of the Group. In 2007 the division’s top 20 products, representing 83% of the Pharmaceuticals portfolio, grew by 15%, with most products recording strong sales growth. The main sales growth of the Pharmaceuticals Division was driven by the following key products: Avastin, Herceptin, MabThera/Rituxan, Lucentis, Bonviva/Boniva, Tarceva, Xeloda, CellCept and Pegasys. Together, these products accounted for 60% of total sales and generated an additional 4.4 billion Swiss francs of sales revenue compared with 2006. Only six of the top 20 products (Tamiflu, NeoRecormon/Epogin, Kytril, Xenical, Nutropin and Rocephin) recorded sales decreases. After peak pandemic stockpiling sales of 2.1 billion Swiss francs in 2006, the governmental and corporate uptake of Tamiflu slowed, as expected, with sales of 1.9 billion Swiss francs in 2007, down by 11%. The decrease in product sales for renal anemia was in particular due to significantly lower Epogin revenue in Japan, reflecting the ongoing impact of government-mandated price cuts and reimbursement changes. Following patent expiry of a competitor product in the United States, Kytril sales decreased by 12%. The decline of 4% in the ‘Other products’ category resulted primarily from generic erosion and reduced sales of Viracept following the recall announced on 6 June 2007.
Pharmaceuticals Division – Sales of Top 20 products for 2007*
Product Sales (mCHF) % of sales
% change (local
currencies) Franchise
MabThera/Rituxan 5,516 15 +15 Oncology / IAT1) Herceptin 4,852 13 +23 Oncology Avastin 4,106 11 +41 Oncology NeoRecormon/Epogin 2,094 6 -7 Renal anemia, Oncology Tamiflu 2,085 6 -19 Virology - of which pandemic 1,856 5 -11 Virology CellCept 2,012 5 +10 IAT1) Pegasys 1,637 4 +11 Virology Xeloda 1,151 3 +19 Oncology Tarceva 1,062 3 +31 Oncology Lucentis 991 3 +117 Ophthalmology Bonviva/Boniva 887 2 +85 Metabolism/Bone Xenical 632 2 -10 Metabolism/Bone Xolair 567 2 +10 Respiratory diseases Valcyte/Cymevene 542 2 +12 Virology Pulmozyme 483 1 +12 Respiratory diseases Nutropin 470 1 -1 Metabolism/Bone

Page 106
Kytril 425 1 -12 Oncology Neutrogin 405 1 +13 Oncology Rocephin 399 1 -4 Infectious diseases Activase/TNKase 382 1 +9 Cardiovascular diseases Total Top 20 products 30,698 83 +15 Other products 6,085 17 -4 Total 36,783 100 +11
Excluding Tamiflu pandemic government and corporate sales
Total Top 20 products 28,842 83 +17 Other products 6,085 17 -4 Total 34,927 100 +13
1) Inflammation/Autoimmune/Transplantation. * The figures are sourced from the unaudited internal accounting systems and records of the Group. Mabthera/Rituxan: Double-digit sales growth was driven by increasing use in oncology indications and rheumatoid arthritis. In Europe and the US most of the oncology sales growth was due to increasing usage of MabThera/Rituxan following first-line therapy of indolent non-Hodgkin’s lymphoma (NHL), including maintenance use. The already high penetration rates for first-line treatment of indolent and aggressive NHL were sustained in the US and Europe’s five largest markets (France, Germany, Italy, Spain and the United Kingdom), while increasing adoption in these settings was seen in emerging markets. Adoption in rheumatoid arthritis continued to increase in both the US and Europe/RoW. Herceptin: Growth continued to be driven by increasing adoption in adjuvant (=early stage) HER2-positive breast cancer. Roche estimates that by the end of 2007 the product’s market share in the adjuvant setting was approximately 70% (versus 40% a year earlier) in the five largest European markets. Elsewhere, market penetration in this setting also continues to build. In the US penetration into this market flattened during 2007 due to earlier, more rapid adoption of Herceptin for adjuvant treatment. In the metastatic setting, adoption rates and treatment duration remained stable both in the US and in the top five European markets. Avastin: Sales increased 41% worldwide compared with 2006, with strong growth in all regions, particularly Europe/RoW (+64%). In the US growth was driven primarily by increased usage in advanced non-small cell lung cancer (NSCLC), an indication approved in late 2006. In Europe sales growth was propelled by further uptake of the product in the metastatic colorectal cancer setting. Avastin received EU approval in metastatic breast cancer in March and for first-line treatment of patients with NSCLC in August 2007, and initial uptake in these new indications is encouraging. In 2007 Avastin was approved and launched in Japan for the treatment of metastatic colorectal cancer. Neorecormon/Epogin: Combined sales of Roche’s NeoRecormon and Chugai’s Epogin (epoetin beta) were down 7% in a market that remains highly competitive due to pricing pressure from branded competitors and the entry of biosimilar versions of epoetin alfa in Europe. While the decline in NeoRecormon sales was 4%, sales of Epogin in Japan (-14%) were affected by competitive pricing pressures and, in the first quarter of 2007, the residual impact of government-mandated price cuts and reimbursement changes. Tamiflu: Sales of Tamiflu in 2007 declined by 542 million Swiss francs or 19% versus 2006. Seasonal sales were 265 million Swiss francs lower and pandemic sales decreased by 277 million Swiss francs compared to 2006, as most stockpiling programmes from governments and corporations were completed. Seasonal sales of Tamiflu in Japan were negatively affected by the mild 2006/2007 flu season. This was more than outweighed, however, by a substantial increase in pandemic sales to the Japanese government. Cellcept: The immunosuppressant CellCept continued to record steady sales growth worldwide (+10%), driven by solid demand in both the US and Europe. Growth continues to be driven by physicians’ recognition of the long-term protective benefits of CellCept in transplant patients compared with other, more toxic therapeutic options.

Page 107
Pegasys: With market share of over 60%, based on IMS Health Incorporated and on its own data Roche believes that Pegasys remains the global market leader in the treatment of hepatitis C. Sales were driven by increased use in Europe/RoW, offsetting a decline in the US from an overall market volume decline. Market response has been positive in Japan following the 2007 rollout of combined Pegasys plus Copegus for hepatitis C. Xeloda: The main contributions to double-digit growth of Xeloda (+19%) in 2007 came from the US (+19%) and Europe/RoW (+19%). Sales growth was driven by increased usage of Xeloda in the adjuvant colon and metastatic colorectal cancer settings, as well as the European launch in gastric cancer. Tarceva: Tarceva recorded strong growth in 2007 (+31%), particularly in the Europe/RoW sales region (+76%), which now accounts for 53% of overall sales. US sales increased by 4% in a competitive market environment. Tarceva is still the only epidermal growth factor receptor inhibitor with a proven survival benefit in advanced lung and pancreatic cancer. Lucentis: Following US approval in June 2006, Lucentis experienced very rapid uptake driven by high demand for the treatment of neovascular (wet) age-related macular degeneration (wet AMD). Lucentis sales in the US grew 117% in 2007, however during the year sales growth flattened as the medicine captured a significant market share, while off-label usage of an unapproved therapy in wet AMD remained high. Outside the US, Lucentis is marketed by Novartis. Bonviva/Boniva: In a highly competitive market, sales of Bonviva/Boniva (ibandronic acid), for the treatment of postmenopausal osteoporosis, increased by 399 million Swiss francs to 887 million Swiss francs compared with 2006. The majority of sales come from the US, where the product’s market share (total prescriptions) increased to around 15%. Bonviva gained reimbursement status and was launched in many European markets in 2006. Xenical: Sales of the prescription weight-loss medication Xenical (orlistat 120mg) declined 10% worldwide and 27% in the United States, where Roche’s partner GlaxoSmithKline has successfully launched non-prescription orlistat 60mg under the brand name alli. As licensor, Roche receives royalties on sales of alli. Sales by region: Sales continued to grow across all regions, particularly in North America, Europe and emerging markets. North American sales grew at almost three times the market rate, driven by products marketed by Genentech (+19%). Roche continued to gain market share in Europe and Rest of World, driven by further strong sales growth of Herceptin, Avastin, MabThera/Rituxan, Tarceva, Pegasys, and Bonviva/Boniva.
Pharmaceuticals Division - Sales by region for 2007* Region
Sales (mCHF)
% of sales
% change (local currencies)
North America 15,485 42 +15 Europe 12,353 34 +10 Japan 3,399 9 +3 Latin America 2,260 6 +6 Other regions 3,286 9 +17 Total 36,783 100 +11
* The figures are sourced from the unaudited internal accounting systems and records of the Group.
Royalties and other operating income: The increase of 848 million Swiss francs, or 76% in local currencies, was mainly due to high out-licensing income. Royalty income increased by 213 million Swiss francs or 29% in local currencies, driven by income from Novartis (Lucentis), Amgen (Enbrel) and GSK (alli). There was an increase of 242 million Swiss francs in income from out-licensing orlistat OTC rights to GlaxoSmithKline (GSK). Genentech generated an additional 114 million Swiss francs of out-licensing income, including 80 million Swiss francs recorded as part of a new third-party collaboration agreement and 42 million Swiss francs milestone income relating to Lucentis for approval in the European Union and filing in Japan. At Chugai there were 58

Page 108
million Swiss francs of additional third-party royalties and other operating income, including milestone income from the co-development and co-marketing agreement with Taisho on Bonviva. Gains on product divestments were also significantly higher compared to 2006 and include a gain of 62 million Swiss francs from the disposal of several cardiovascular products and a gain of 152 million Swiss francs from the first stage of the disposal of three products to Actavis as part of the continuous realignment of the product portfolio. Royalties and other operating income as percentage of sales increased by 2.0 percentage points to 5.6%.
Royalties and other operating income 2007
(mCHF) 2006
(mCHF) % change
(local currencies) Royalty income 1,076 863 +29 Income from out-licensing agreements 722 320 +134 Income from disposal of products and other 259 26 +908 Total 2,057 1,209 +76
Cost of sales: The increase of 8% in local currencies was below the increase in sales. There was a growth of 11% in royalty expenses on product sales, driven by the success of MabThera/Rituxan, Herceptin, Tarceva, CellCept, Lucentis and Avastin, partially off-set by lower expenses for Tamiflu, NeoRecormon and Viracept. Genentech’s collaboration profit-sharing expenses with its partners Biogen Idec, Novartis and OSI increased to 1,297 million Swiss francs (2006: 1,260 million Swiss francs) due to increased sales of MabThera/Rituxan, Xolair and Tarceva, respectively. Additionally the gross profit share to GlaxoSmithKline, increased to 379 million Swiss francs (2006: 219 million Swiss francs) following increased Bonviva/Boniva sales. These factors were largely compensated for by manufacturing efficiencies and product mix effects, despite some 135 million Swiss francs of costs for the Viracept recall. Amortisation of intangible assets remained stable. As a percentage of sales, cost of sales decreased to 25.8% from 27.1% in 2006.
Cost of sales 2007
(mCHF) 2006
(mCHF) % change
(local currencies)
Manufacturing cost of goods sold and period costs (5,041) (4,886) +5 Royalty expenses (2,089) (1,941) +11 Collaboration and profit-sharing agreements (1,755) (1,546) +18 Amortisation of intangible assets (614) (619) +1 Impairment of property, plant and equipment (3) (40) -93 Impairment of intangible assets - - - Total (9,502) (9,032) +8
Marketing and distribution: The increase of 3% in local currencies was significantly below sales growth due to continued productivity improvements. Major activities in 2007 included the support for the strong oncology portfolio, notably for Avastin in lung and breast cancer indications as well as Tarceva in pancreatic cancer in Europe. Other main areas of focus were Pegasys and Bonviva/Boniva. In addition there were pre-launch and launch costs for Mircera and in Japan the sales force was significantly increased in preparation for the launches of Avastin, Tarceva and Actemra. In addition Tamiflu’s use in both seasonal flu and pandemic planning has been further promoted. Marketing and distribution costs as a percentage of sales were 19.1% (2006: 20.6%). Research and development: The increase of 1.0 billion Swiss francs, or 18% in local currencies, to almost 7.6 billion Swiss francs reflects higher spending as a result of the increased portfolio size and large number of late-stage clinical trials. Significant work took place on late-stage projects driven by the many potential line extensions, especially for Avastin in oncology and for MabThera/Rituxan and Actemra in rheumatoid arthritis. Research and development costs as a percentage of sales were 20.7% compared to 19.8% in 2006. In addition the Pharmaceuticals Division in total spent 735 million Swiss francs on capitalised assets for pipeline compounds and technologies through in-licensing. In total the division spent 8.2 billion Swiss francs on internal and purchased R&D from in-licensing deals, representing 22.4% of sales.

Page 109
Investments in research and development 2007
(mCHF) 2006
(mCHF) % change
(local currencies)
Research and development expenses 7,598 6,590 +18 Less non-cash items - Amortisation of intangible assets (31) (27) +17 - Impairment of intangible assets (58) (13) +366 Research and development expenses excluding non-cash items 7,509 6,550 +17 Product intangibles – not available for use 732 540 +41 Technology intangibles 3 - - Research and development related capital expenditure 735 540 +41 Total investments in research and development 8,244 7,090 +19
General and administration: The overall increase of 203 million Swiss francs or 17% in local currencies was due to a variety of factors. Administration costs, which grew by 8%, include a project to harmonise the business processes and SAP systems across Europe as well as to establish a European shared services centre in Budapest. Legal expenses, which are also included in Administration costs, were substantially higher compared to 2006. Excluding these items, administration costs increased by 3%. In addition restructuring expenses were significantly higher primarily as a result of a reduction of the sales forces in the US and Europe. General and administration expenses as a percentage of sales increased to 4.6% from 4.4%.
General and administration 2007
(mCHF) 2006
(mCHF) % change
(local currencies)
Administration (1,665) (1,578) +8 Legal and environmental settlements (15) 4 - Restructuring expenses (107) (18) +496 Gains (losses) on disposal of property, plant and equipment 17 8 +102 Other general items 90 107 -19 Total (1,680) (1,477) +17
Pharmaceuticals sub-divisional results
2007
Sales
(mCHF)
EBITD
A (mCH
F)
EBITDA as % of
sales
Operating
profit (mCHF)
Operating profit
as % of sales
Roche Pharmaceuticals 22,970 8,171 35.6 7,225 31.5 Genentech 10,414 5,856 56.2 5,298 50.9 Chugai 3,399 770 22.7 610 17.9 Elimination within division 1) - (91) - (91) - Pharmaceuticals Division 36,783 14,706 40.0 13,042 35.5 2006 Roche Pharmaceuticals 20,666 7,144 34.6 6,139 29.7 Genentech 9,125 4,464 48.9 4,002 43.9 Chugai 3,503 725 20.7 569 16.2 Elimination within division 1) - (165) - (165) - Pharmaceuticals Division 33,294 12,168 36.5 10,545 31.7
1) Unrealised internal profits on inventories that have been sold from one sub-division to another, but which have not yet been sold on to external customers at the balance sheet date are eliminated as a consolidation entry.

Page 110
Roche Pharmaceuticals: Sales increased strongly by 9% in local currencies and the operating profit margin increased by 1.8 percentage points to 31.5% in spite of significantly higher research and development expenses. Positive developments include increased income from out-licensing and product disposals and a lower marketing and distribution cost ratio. These more than compensated for higher expenses to alliance and collaboration partners, which include royalty expenses to third parties of 1.3 billion Swiss francs and to Genentech of 1.4 billion Swiss francs as well as profit sharing arrangements, and also higher general and administration costs. Moreover, Roche Pharmaceuticals continued to significantly increase its investments in research and development. Costs of around 135 million Swiss francs for sales returns, inventory provisions and other costs were recorded following the recall of Viracept announced on 6 June 2007. Genentech: Sales grew by 19% in local currency. The operating profit margin significantly improved by 7.0 percentage points to 50.9%, mainly driven by substantially higher royalty and other operating income from third parties, by royalty income from Roche Pharmaceuticals and also by the growth in marketing and distribution expenses being considerably below sales growth, all of the above compensating for the strong increase in investments in R&D. Chugai: Sales increased 3% in local currencies, which is slightly below market growth in Japan. Chugai’s sales excluding Tamiflu pandemic rose by 1% in local currencies. Operating profit at Chugai increased by 21% in local currency due to out-licensing income from third parties and from Roche Pharmaceuticals, offsetting an unfavourable product mix impact driven by an increased share of Tamiflu government pandemic sales. In Swiss franc terms, this resulted in an increase of 1.7 percentage points in the operating profit margin to 17.9%. Additional information on the Pharmaceuticals Division’s sub-divisional results is given in Note 2 to the Consolidated Financial Statements (see page 346 of this Prospect). Diagnostics operating results Based on its own data Roche believes that in 2007 Roche’s Diagnostics Division remained the global leader in the in vitro diagnostics market with a market share of around 19%. Divisional sales increased to 9.3 billion Swiss francs, growing 6% in local currencies (7% in Swiss francs; 12% in US dollars) compared to 2006. Operating profit increased by 14% in local currencies to 1.6 billion Swiss francs and the operating profit margin improved by 1.3 percentage points to 17.6%. Cash generation of the business remains well above industry average with an EBITDA margin of 27.6%. The operating profit margin improvement was driven by sales growth and positively impacted by the reversal of royalty accruals following the acquisition of BioVeris and the absence of the significant impairment charges on intangible assets recorded in the second half of 2006. These factors compensated for continued investments in new and existing products, considerably higher general and administration costs, mainly due to increased provisions for legal and environmental settlements, and post-acquisition restructuring expenses at BioVeris. During 2007 the division completed the acquisition of BioVeris, 454 Life Sciences and NimbleGen for a total consideration of 1.2 billion Swiss francs.
In January 2008 the Group signed an agreement to acquire Ventana Medical Systems for approximately 3.4 billion US dollars and in February 2008 Roche's wholly-owned subsidiary Rocket Acquisition Corporation accepted for payment all shares validly tendered pursuant to its tender offer for all outstanding shares of common stock of Ventana Medical Systems, Inc. at USD 89.50 per share in cash. After expiration of the subsequent offering period on 15 February 2008, Roche completed the acquisition of Ventana on 19 February 2008 through a purchase of a total of approximately 34,545,323 shares of Ventana common stock, respresenting 93,7% of Ventana's outstanding shares on the basis of the tender offer made by Rocket Acquisition Corporation and through a short-form merger without a vote or meeting of Ventana's shareholders. In connection with the short-form merger all shares of Ventana not owned by Roche and its subsidiaries (other than shares as to which appraisal rights are validly exercised) were converted into the right to receive the same cash consideration per share as was paid in the tender offer.

Page 111
Diagnostics Division results
2007 (mCHF)
2006 (mCHF)
% change (CHF)
% change (local
currencies) Sales 9,350 8,747 +7 +6 Royalties and other operating income 186 182 +2 +4 Cost of sales (4,241) (4,253) 0 -2 Marketing and distribution (2,309) (2,095) +10 +10 Research and development (787) (775) +2 +1 General and administration (551) (384) +43 +43 Operating profit 1,648 1,422 +16 +14 - margin, % of sales 17.6 16.3 +1.3 EBITDA 2,580 2,500 +3 +2 - margin, % of sales 27.6 28.6 -1.0
Sales: The Professional Diagnostics, Diabetes Care and Applied Science businesses were the growth drivers, with the biggest contributions coming from their immunochemistry, blood glucose monitoring and DNA sequencing products, respectively. Molecular Diagnostics continued to be affected by the declining sales of industrial reagents due to expiration of Roche’s foundational PCR patents. Excluding this part of the business, Molecular Diagnostics sales grew 3%.
Diagnostics Division – Sales by business area for 2007* Business area
Sales (mCHF)
% of sales
% change (local currencies)
Professional Diagnostics 4,294 46 +8 Diabetes Care 3,216 34 +5 Molecular Diagnostics 1,148 12 -2 Applied Science 692 8 +11 Total 9,350 100 +6
* The figures are sourced from the unaudited internal accounting systems and records of the Group.
Professional diagnostics: Roche Professional Diagnostics gained market share in 2007 as its sales increased 8% in local currencies to 4.3 billion Swiss francs. Immunochemistry sales rose 13% in local currencies to 1.3 billion Swiss francs, outpacing the market for the seventh consecutive year. Growth was fuelled by demand for the Elecsys NT-proBNP and Troponin T cardiac tests and an assay for TSH (thyroid-stimulating hormone). New tests launched in the second half of 2007 for vitamin D (osteoporosis) and MPA (therapeutic monitoring of CellCept and other mycophenolic acid therapies in transplant recipients) are expected to contribute to future growth. The clinical chemistry business grew despite the highly competitive, cost-sensitive market. Demand for the cobas 6000 analyser series for medium-workload laboratories remained strong. Introduced in 2006, this series was the first of several modular platforms designed to integrate and improve the efficiency of clinical chemistry and immunochemistry testing in different sized laboratories. The cobas e 411 immunochemistry analyser, the first of the cobas 4000 instruments for small- to medium-size laboratories, was released in the first half of the year. The cobas c 311 clinical chemistry analyser is on track for launch in 2008. The acquisition of BioVeris was completed in June 2007, enabling Roche to expand its immunochemistry business into new market segments such as life science research, drug development and clinical trials. Also in June 2007 Roche and Sysmex Corporation of Japan signed a ten-year extension of an agreement giving Roche exclusive distribution rights for Sysmex hematology instruments in some markets in Europe, Latin America, Southern Africa and Oceania. In November Roche signed a licensing agreement with Ortho-Clinical Diagnostics, Inc., and Novartis Vaccines & Diagnostics giving Roche access to their broad portfolio of hepatitis C virus (HCV) patents, further strengthening its immunochemistry menu. Sales of point-of-care (POC) diagnostics, (previously Near Patient Testing), rose 7% in local currencies to 814 million Swiss francs, helped by improved marketing of the business area’s broad portfolio and by the continued move towards decentralised testing. Coagulation monitoring sales increased driven by the CoaguChek XS

Page 112
monitor for patient use and the CoaguChek XS Plus monitor for healthcare professionals. These systems were released in the US and Japan in the first half of 2007. Sales of POC cardiac markers accelerated further following the launch of the cobas h 232 portable cardiac testing system in February. In the ambulatory care arena, the launch in November of the Accutrend Plus is expected to boost growth in 2008. This is the first hand-held instrument capable of measuring cholesterol, triglyceride, glucose and lactate levels in blood, using a single meter.
Diabetes care: Based on its own data Roche believes that Roche Diabetes Care remained the global market leader with sales of 3.2 billion Swiss francs, an increase of 5% in local currencies. The Accu-Chek Aviva and Accu-Chek Compact blood glucose systems both sold well, compensating for lower sales of the older Accu-Chek Advantage. Accu-Chek Active sales were especially strong in some EMEA and South American markets. Roche’s insulin delivery business grew 12% in local currencies driven primarily by the European and North American markets. US market uptake of the Accu-Chek Spirit insulin pump was positive. The business introduced two new glucose systems during 2007: the Accu-Chek Performa, which automatically corrects for environmental factors that can affect test results, and the new all-in-one Accu-Chek Compact meter and lancing device launched in the fourth quarter in Germany, the UK and Norway. Accu-Chek 360°, a software package that helps people with diabetes and their healthcare professionals to store, access and review detailed health information quickly and conveniently, was also added to the portfolio. The rollout of all three new products will continue in 2008. Molecular diagnostics: Based on its own data Roche believes that Roche Molecular Diagnostics remained the clear leader in a market with an increasing number of players, with sales of 1.1 billion Swiss francs, and an overall decline of 2% in local currencies. Excluding industrial reagent sales, which markedly declined as expected, growth was 3%. Sales of virology products grew 4% in local currencies, driven by continued placements of the automated Cobas AmpliPrep/Cobas TaqMan (CAP/CTM) platform in Europe and Asia-Pacific and the rollout of this platform in the US and Japanese markets in the second half of 2007. Blood screening sales decreased 1% in local currencies. Uptake of the cobas s 201 modular blood screening system remained strong. In Europe more than 50 sites have adopted this system and the cobas TaqScreen MPX multiplex test (which simultaneously detects HIV, HCV and HBV in donated blood or plasma) since their European rollout in 2006. Roche introduced the cobas s 201 system in the US with a West Nile virus test in the second half of 2007. Notable contracts for 2007 include a three-year deal to supply an automated CAP/CTM HIV-1 test to LabCorp in the US and a five-year contract with the Japanese Red Cross (JRC) for the fully automated and integrated cobas s 401 system and cobas TaqScreen MPX multiplex test, which will be used to screen all of the JRC’s roughly five million annual blood donations. Applied Science: Roche Applied Science’s sales grew well ahead of the market, rising 11% in local currencies to 692 million Swiss francs. The main growth drivers were again the LightCycler 480 system (for high-throughput real-time PCR), the Genome Sequencer systems (DNA sequencing) and research reagents. The business area gained significant market share in the fast-growing sequencing area and retained its share of the genomics systems market. Marketing of NimbleGen arrays has started under Roche’s name and the integration of NimbleGen and 454 Life Sciences into the business area is progressing as planned. Roche has more than doubled its share of the rapidly expanding market for DNA sequencing products. Sales by regions: Sales continued to grow ahead of or in line with the market in all regions. All regions contributed to growth, with sales advancing at double-digit rates in Latin America and Asia–Pacific and at single-digit rates in Europe, North America and Japan. Sales in Asia–Pacific grew almost twice as fast as the market.
Diagnostics Division – Sales by region for 2007* Region
Sales (mCHF)
% of sales
% change (local currencies)
EMEA 1) 5,116 55 +5 North America 2,481 27 +5 Asia-Pacific 784 8 +18 Latin America 509 5 +19 Japan 411 4 +2 Other regions 49 1 -54

Page 113
Total 9,350 100 +6 1) Europe, Middle East and Africa. * The figures are sourced from the unaudited internal accounting systems and records of the Group.
Royalties and other operating income: Income of 186 million Swiss francs was 4% higher in local currencies than in 2006 despite the expiration of foundational PCR patents in most countries outside the US as of March 2006. Royalties and other operating income as a percentage of sales decreased by 0.1 percentage points to 2.0%.
Royalties and other operating income 2007
(mCHF) 2006
(mCHF) % change
(local currencies)
Royalty income 126 121 +7 Income from out-licensing agreements 55 55 +2 Income from disposal of products and other 5 6 -15 Total 186 182 +4
Cost of sales: The overall decrease was 2% in local currencies. Manufacturing cost of goods sold and period costs increased 7%, slightly more than sales. Royalty expenses decreased considerably by 44% in local currencies to 215 million Swiss francs. This is primarily due to the reversal in the first half of 2007 of 57 million Swiss francs of BioVeris royalty accruals. In the second half of 2006 BioVeris royalty accruals of 111 million Swiss francs were booked. Excluding BioVeris, royalty expenses were 272 million Swiss francs, an increase of 6% in local currencies which is in line with the increase in sales. Furthermore, cost of sales in 2006 included an impairment charge for intangible assets of 118 million Swiss francs. As a percentage of sales, cost of sales decreased to 45.4% from 48.6% in 2006. Excluding BioVeris royalties and the impairment of intangibles it was stable at 46.0% in both years.
Cost of sales 2007
(mCHF) 2006
(mCHF) % change
(local currencies) Manufacturing cost of goods sold and period costs
(3,696) (3,431) +7
Royalty expenses (215) (351) -44 Collaboration and profit-sharing agreements - - - Amortisation of product intangibles (328) (322) +2 Impairment of property, plant and equipment (2) (31) -92 Impairment of product intangibles - (118) -100 Total (4,241) (4,253) -2
Marketing and distribution: The increase of 10% in local currencies was higher than the increase in sales, mainly due to strong investments in new product launches, such as cobas 6000, Gene Sequencing GS FLX, and several initiatives to further support and grow market share, especially in Professional Diagnostics and Diabetes Care. Marketing and distribution as a percentage of sales increased to 24.7% from 24.0% in the comparative period. Research and development: Costs increased by 1% in local currencies. The comparative period included a 66 million Swiss francs impairment charge for intangible assets. Excluding the impairment charge, R&D growth was 10% in local currencies reflecting the impact of recent acquisitions and investments in R&D projects. Research and development expenses as a percentage of sales increased to 8.4% from 8.1% in 2006, excluding the impairment charge.
Investments in research and development 2007
(mCHF) 2006
(mCHF) % change
(local currencies)
Research and development expenses 787 775 +1

Page 114
Less non-cash items - Amortisation of intangible assets (3) (9) -65 - Impairment of intangible assets - (66) -100 Research and development expenses excluding non-cash items 784 700 +11
General and administration: General and administration costs increased by 43% in local currencies, mainly driven by increased provisions for legal and environmental settlements in 2007, while 2006 results included income from settlement agreements. Also within general items are post-acquisition restructuring expenses at BioVeris of 29 million Swiss francs. Growth of administration costs was 5% compared to a sales growth of 6%. General and administration expenses as a percentage of sales increased to 5.9% from 4.4% in the comparative period.
General and administration 2007
(mCHF) 2006
(mCHF) % change
(local currencies)
Administration (373) (354) +5 Legal and environmental settlements (80) 10 - Restructuring expenses (39) (17) +141 Gains (losses) on disposal of property, plant and equipment (1) 6 - Other general items (58) (29) +79 Total (551) (384) +43
Corporate operating costs General and administration: Costs were 7% lower in local currencies at 222 million Swiss francs (237 million Swiss francs in 2006). Foreign exchange impact on operating results The Group's exposure to movements in foreign currencies affecting its operating results, as expressed in Swiss francs, is summarised by the following key figures and comments.
Growth* % change (local currencies) % change (CHF) 2007 2006 2007 2006
Sales +10 +17 +10 +18 Operating profit +22 +27 +23 +28
* The figures are sourced from the unaudited part of the Roche Annual Report 2007, Part 2 Finance Report (page 15).
Exchange rates against the Swiss franc* 31 December
2007 Average
2007 31 December
2006 Average
2006 1 USD 1.13 1.20 1.22 1.25 1 EUR 1.66 1.64 1.61 1.57 100 JPY 1.00 1.02 1.03 1.08
* The figures are sourced from the unaudited part of the Roche Annual Report 2007, Part 2 Finance Report (page 15). In 2007 the US dollar and the Japanese yen weakened against the Swiss franc, while the euro and many other economies’ currencies appreciated against the Swiss franc. Overall there is almost no difference between sales growth and operating profit growth expressed in Swiss francs or in local currencies. In absolute terms, the sensitivity of Group sales to a movement in the US dollar against the Swiss franc of 0.01 Swiss francs during 2007 was approximately 144 million Swiss francs, and the corresponding sensitivities for the euro and yen were approximately 77 million Swiss francs and 37 million Swiss francs respectively. The sensitivities of Group operating profit were approximately 29, 37 and 15 million Swiss francs respectively.

Page 115
Non-operating Results
Non-operating results 2007
(mCHF) 2006
(mCHF) % change
(CHF) Operating profit 14,468 11,730 +23 Associated companies 2 2 0 Financial income 1,805 1,829 -1 Financing costs (971) (974) 0 Profit before taxes 15,304 12,587 +22 Income taxes (3,867) (3,436) +13 Profit from continuing businesses 11,437 9,151 +25 Profit from discontinued businesses - 20 -100 Net income 11,437 9,171 +25 Attributable to - Roche shareholders 9,761 7,880 +24 - Minority interests 1,676 1,291 +30
During 2007 the Group’s treasury operations delivered a positive net financial income, with net income from financial assets and foreign exchange management exceeding financing costs by 834 million Swiss francs. The Group’s effective tax rate declined to 25.3% from 27.3%, despite an increased pre-tax profit contribution from Genentech. Net income increased due to the combination of positive developments on the operating and tax lines.
Financial income: Financial income was 1,805 million Swiss francs, declining 1% compared to 2006. Interest income and income from debt securities were 1,001 million Swiss francs, up 28% due to higher holdings and increases in interest rates. This result improved despite a write-down of debt securities of 68 million Swiss francs (2006: zero). Net income from equity securities was 313 million Swiss francs compared to 390 million Swiss francs in 2006. Funds continue to be invested with a conservative risk profile. Expected returns on pension plan assets were 670 million Swiss francs, up 5% compared to 2006. Net foreign exchange losses were 153 million Swiss francs compared to losses of 24 million Swiss francs in 2006, driven by losses on cash flow hedge contracts, which suffered from strong appreciation of most currencies against the Swiss franc. A full analysis of financial income is given in Note 5 to the Consolidated Financial Statements (pages 355, 356 of this Prospectus). Financing costs: Financing costs were 971 million Swiss francs, basically stable compared to 2006. The increase in interest rates had only a small impact on financing costs, as most of the outstanding debt has fixed interest rates. Amortisation of debt discounts was 32 million Swiss francs lower, following the redemption of ‘LYONs V’ notes. The gain from favourable market value movements on the debt instruments designated as ‘fair-value-through-profit-or-loss’ was 1 million Swiss francs, down from 51 million Swiss francs in 2006. A

Page 116
full analysis of financing costs is given in Note 5 to the Consolidated Financial Statements (pages 355, 356 of this Prospectus). Income taxes: The Group’s effective tax rate declined to 25.3% compared to the 2006 rate of 27.3%. The increasing pre-tax profit contribution from Genentech acted to increase the overall Group tax rate. However this was offset by a fall in the effective tax rate at Genentech to 40.0% from 41.6%. Excluding Genentech and Chugai, the underlying effective tax rate is 15.6%, which is considerably lower than the equivalent rate in 2006 of 18.9%. This reflects the Group’s on-going efforts to optimise its tax structure, the relatively lower profits in high tax jurisdictions and also one-time effects such as the reduction in corporate tax rates in Germany effective 2008 with a corresponding reduction in deferred tax balance sheet positions. Further information on the Group’s income taxes is given in Note 6 to the Consolidated Financial Statements (pages 356, 357 of this Prospectus).
Analysis of the Group’s effective tax rate 2007 2006 Profit
before tax (mCHF)
Income taxes
(mCHF)
Tax rate (%)
Profit before tax
(mCHF)
Income taxes
(mCHF)
Tax rate (%)
Roche (excl. Genentech and Chugai)
9,201 (1,436) 15.6 7,835 (1,477) 18.9
Genentech 5,470 (2,189) 40.0 4,163 (1,730) 41.6 Chugai 633 (242) 38.2 589 (229) 38.9 Group’s effective tax rate 15,304 (3,867) 25.3 12,587 (3,436) 27.3
Discontinued businesses: There were no discontinued operations in 2007. The comparative results show a small release of no longer required provisions from the finalisation of the divestments of the vitamins and OTC businesses. Further information is given in Note 8 to the Consolidated Financial Statements.
Net income: In 2007 Group net income increased by 25% to 11.4 billion Swiss francs. Net income attributable to Roche shareholders was 24% higher while the net income attributable to minorities increased by 30%. The higher increase in minority interests is due to the increased contribution from Genentech. Of the total 1.7 billion Swiss francs minority interests, 1.5 billion Swiss francs are attributable to Genentech minority interests and 0.2 billion Swiss francs to Chugai minority interests.
Diluted EPS 2007
(CHF) 2006
(CHF)
% change Group 11.16 9.05 +23 Core 11.85 9.86 +20
Earnings per share: The increase in diluted EPS was due to the increase in net income attributable to Roche shareholders, as described above. The Core EPS, which excludes amortisation and impairment of intangible assets, increased by 20%. This includes calculations of Core EPS and reconciles these to the Group’s published IFRS results.

Page 117
Cash flows and net cash
Condensed cash flow statement 2007
(mCHF) 2006
(mCHF) Cash generated from operations 18,480 15,975 (Increase) decrease in working capital (1,207) (1,897) Other operating cash flows (1,051) (952) Operating activities before income taxes 16,222 13,126 Income taxes paid (all activities) (4,494) (2,797) Operating activities 11,728 10,329 Investing activities (5,788) (7,450) Financing activities (5,270) (3,715) Net effect of currency translation on cash (125) (182) Increase (decrease) in cash 545 (1,018)
A full consolidated cash flow statement is given on page 27 of the Consolidated Financial Statements (page 329 of this Prospectus). Operating cash flows: The Group's business operations continued to show strong cash generation of 18.5 billion Swiss francs, driven by continued growth in EBITDA. The development of the business led to an increase in working capital, mainly in inventories and trade receivables. Payments of income taxes were higher by 1.7 billion Swiss francs, of which 0.7 billion Swiss francs relate to Genentech. The remaining 1.0 billion Swiss francs represent tax payments from the increased taxable profits in 2006 and also include the payment of previously accrued amounts relating to final settlement with the German tax authorities for a number of years up to and including 2006. Overall cash flows from operating activities increased by 13% to 11.7 billion Swiss francs. Investing cash flows: The largest investing cash flows in 2007 are for expenditure on property, plant and equipment of 3.5 billion Swiss francs. Investing cash flows also include payments made for acquisitions of 2.3 billion Swiss francs, driven by the 0.7 billion Swiss francs consideration for BioVeris and the 1.0 billion Swiss francs net cash cost of Tanox. The net cash outflow from purchases and sales of marketable securities was 0.2 billion Swiss francs. Financing cash flows: Significant financing cash flows in 2007 and 2006 relate to dividend payments and the redemption of debt instruments. Dividends paid in 2007 were 2.9 billion Swiss francs (2006: 2.2 billion Swiss francs) and cash used for the retirement of debt instruments was 1.9 billion Swiss francs (2006; 1.3 billion Swiss francs). In 2007 Genentech issued commercial paper resulting in a cash inflow of 0.7 billion Swiss francs. Following from the retirement of the ‘LYONs V’ exchangeable notes the Group further reduced its own equity instruments holdings in 2007, realising a net cash inflow of 1.1 billion Swiss francs (2006: 1.4 billion Swiss francs). Genentech received 0.5 billion Swiss francs from stock option exercises during 2007. At the same time Genentech and Chugai both repurchased their own shares for a total of 1.9 billion Swiss francs.

Page 118
Net cash
31 December 2007 (mCHF)
31 December 2006 (mCHF)
% change
Cash and cash equivalents 3,755 3,210 +17 Marketable securities 20,447 21,121 -3 Long-term debt (3,834) (6,199) -38 Short-term debt (3,032) (2,044) +48 Net cash 17,336 16,088 +8
Net cash increased by 1.2 billion Swiss francs during 2007. The cash inflow from operating activities of 11.7 billion Swiss francs was used for the dividend payments of 2.9 billion Swiss francs and also for capital expenditure. This included acquisitions, primarily of BioVeris and Tanox, and purchases of property, plant and equipment and intangible assets which totalled 6.8 billion Swiss francs. Genentech and Chugai share repurchases reduced net cash by 1.9 billion Swiss francs, which was partly offset by 0.5 billion Swiss francs received from the exercise of employee stock options. Balance sheet
Condensed balance sheet 31 December
2007 (mCHF)
31 December 2006 (mCHF)
%
change Property, plant and equipment 17,832 16,417 +9 Goodwill and intangible assets 13,181 11,383 +16 Other non-current assets 4,336 5,719 -24 Cash and marketable securities 24,202 24,331 -1 Other current assets 18,632 16,564 +12 Total assets 78,183 74,414 +5 Debt (current and non-current) (6,866) (8,243) -17 Other non-current liabilities (6,588) (8,709) -24 Other current liabilities (11,422) (10,648) +7 Total liabilities (24,876) (27,600) -10 Total net assets 53,307 46,814 +14 Capital and reserves attributable to Roche shareholders 45,347 39,444 +15 Equity attributable to minority interests 7,960 7,370 +8 Total equity 53,307 46,814 +14
A full consolidated balance sheet is given on page 26 of the Consolidated Financial Statements (page 328 of this Prospectus). Non-current assets: The fall in the US dollar to 1.13 against the Swiss franc at 31 December 2007 compared to 1.22 at the end of 2006 decreased long-term assets in Swiss franc terms as many of the Group’s production

Page 119
facilities and intangible assets are denominated in US dollars. Property, plant and equipment increased primarily from capital expenditure on new production facilities by Roche Pharmaceuticals and Genentech. Goodwill and intangible assets increased by 1.8 billion Swiss francs, mainly from the BioVeris and Tanox acquisitions and the Group’s various in-licensing transactions. Current assets: Within current assets, inventories and accounts receivable were slightly higher in local currencies, which largely offset the decrease in cash and marketable securities as described above. The surety bond totalling 0.9 billion Swiss francs posted by Genentech in connection with the City of Hope litigation is now classified as short-term. Debt: There was a reduction in debt by a further 1.4 billion Swiss francs following the redemption of the 750 million US dollar ‘European Medium Term Notes’, the conversion of the remaining ‘LYONs V’ notes, and debt repayments. This was partly offset by an 0.7 billion Swiss francs additional debt under the Genentech commercial paper program. Other non-current and current liabilities: Most of the decrease of 1.3 billion Swiss francs was due to the reduction in income tax liabilities of 0.6 billion Swiss francs and the reduction of 0.3 billion Swiss francs in legal provisions following settlements made in 2007. The provision of 0.9 billion Swiss francs recorded by Genentech in connection with the City of Hope litigation is now classified as short-term. Total net assets/equity: The most significant movements in equity were the net income of 11.4 billion Swiss francs and the dividend payments of 2.9 billion Swiss francs. Genentech and Chugai share repurchases reduced equity by 1.9 billion Swiss francs; however this was offset by increases in equity of 1.1 billion Swiss francs from the sale of Roche’s own equity, together with 1.0 billion Swiss francs from equity compensation plans. Currency translation losses were 1.9 billion Swiss francs, mainly driven by the fall in the US dollar compared to the Group’s reporting currency the Swiss franc. Strong financial condition: The Group remains solidly financed, with equity (including minority interests) representing 68% of total assets and 82% of total assets financed long-term. Pensions and other post-employment benefits
Post-employment benefit plans are classified as ‘defined contribution plans’ if the Group pays fixed contributions into a separate fund or to a third-party financial institution and will have no further legal or constructive obligation to pay further contributions. In 2007 expenses for the Group’s defined contribution plans were 259 million Swiss francs (2006: 214 million Swiss francs). All other plans are classified as ‘defined benefit plans’, even if the Group’s potential obligation is relatively minor or has a relatively remote possibility of arising. The funding and asset management of the Group’s various defined benefit plans is overseen at a corporate level. Plans are usually established as trusts independent of the Group and are funded by payments from the Group and by employees, but in some cases the plan is unfunded and the Group pays pensions to retired employees directly from its own financial resources.
Funding status of defined benefit pension and other post-employment benefit plans 2007
(mCHF) 2006
(mCHF) Funded plans - Fair value of plan assets 12,170 11,632 - Defined benefit obligation (10,646) (11,002) - Over (under) funding 1,524 630 Unfunded plans - Defined benefit obligation (3,344) (3,596)
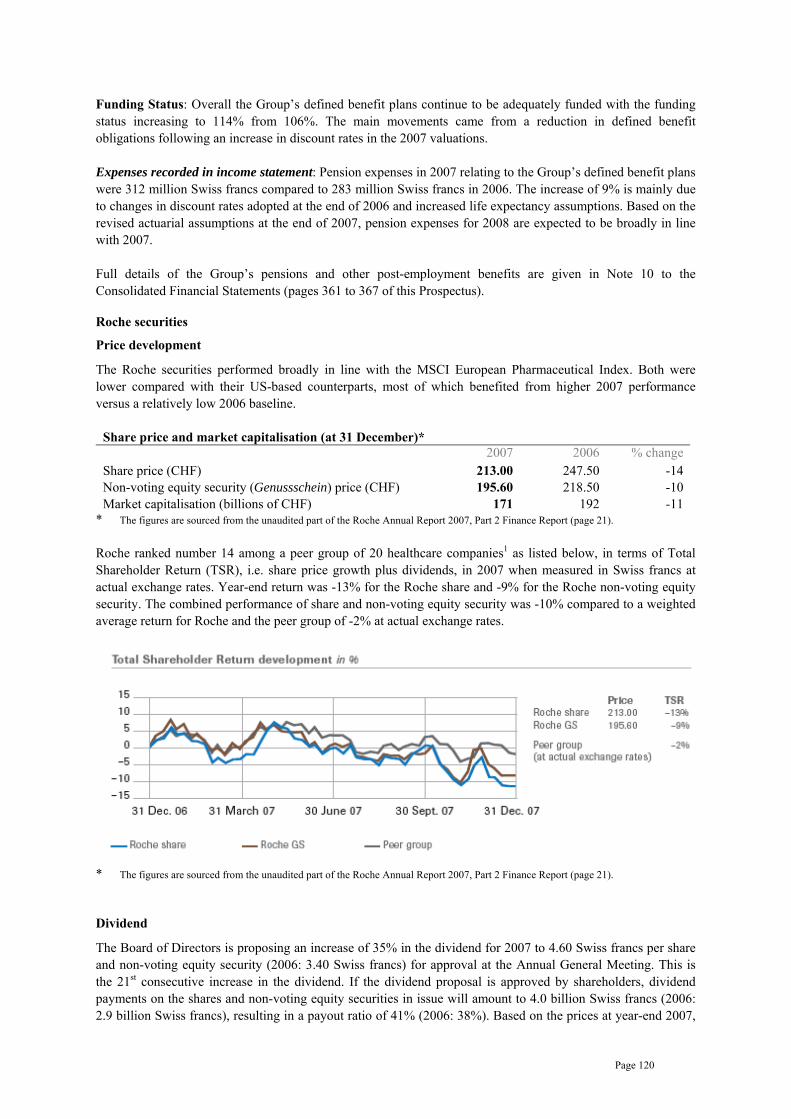
Page 120
Funding Status: Overall the Group’s defined benefit plans continue to be adequately funded with the funding status increasing to 114% from 106%. The main movements came from a reduction in defined benefit obligations following an increase in discount rates in the 2007 valuations. Expenses recorded in income statement: Pension expenses in 2007 relating to the Group’s defined benefit plans were 312 million Swiss francs compared to 283 million Swiss francs in 2006. The increase of 9% is mainly due to changes in discount rates adopted at the end of 2006 and increased life expectancy assumptions. Based on the revised actuarial assumptions at the end of 2007, pension expenses for 2008 are expected to be broadly in line with 2007. Full details of the Group’s pensions and other post-employment benefits are given in Note 10 to the Consolidated Financial Statements (pages 361 to 367 of this Prospectus). Roche securities
Price development
The Roche securities performed broadly in line with the MSCI European Pharmaceutical Index. Both were lower compared with their US-based counterparts, most of which benefited from higher 2007 performance versus a relatively low 2006 baseline.
Share price and market capitalisation (at 31 December)* 2007 2006 % change
Share price (CHF) 213.00 247.50 -14 Non-voting equity security (Genussschein) price (CHF) 195.60 218.50 -10 Market capitalisation (billions of CHF) 171 192 -11
* The figures are sourced from the unaudited part of the Roche Annual Report 2007, Part 2 Finance Report (page 21). Roche ranked number 14 among a peer group of 20 healthcare companies1 as listed below, in terms of Total Shareholder Return (TSR), i.e. share price growth plus dividends, in 2007 when measured in Swiss francs at actual exchange rates. Year-end return was -13% for the Roche share and -9% for the Roche non-voting equity security. The combined performance of share and non-voting equity security was -10% compared to a weighted average return for Roche and the peer group of -2% at actual exchange rates. 1 Peer group for 2007: Abbott Laboratories, Amgen, Astellas, AstraZeneca, Bayer, Becton Dickinson, Biogen Idec, Bristol-Myers Squibb, Eli Lilly, Gilead, GlaxoSmithKline, Johnson & Johnson, Merck & Co., Novartis, Pfizer, Roche, Sanofi-Aventis, Schering-Plough, Takeda, Wyeth.
* The figures are sourced from the unaudited part of the Roche Annual Report 2007, Part 2 Finance Report (page 21). Dividend
The Board of Directors is proposing an increase of 35% in the dividend for 2007 to 4.60 Swiss francs per share and non-voting equity security (2006: 3.40 Swiss francs) for approval at the Annual General Meeting. This is the 21st consecutive increase in the dividend. If the dividend proposal is approved by shareholders, dividend payments on the shares and non-voting equity securities in issue will amount to 4.0 billion Swiss francs (2006: 2.9 billion Swiss francs), resulting in a payout ratio of 41% (2006: 38%). Based on the prices at year-end 2007,
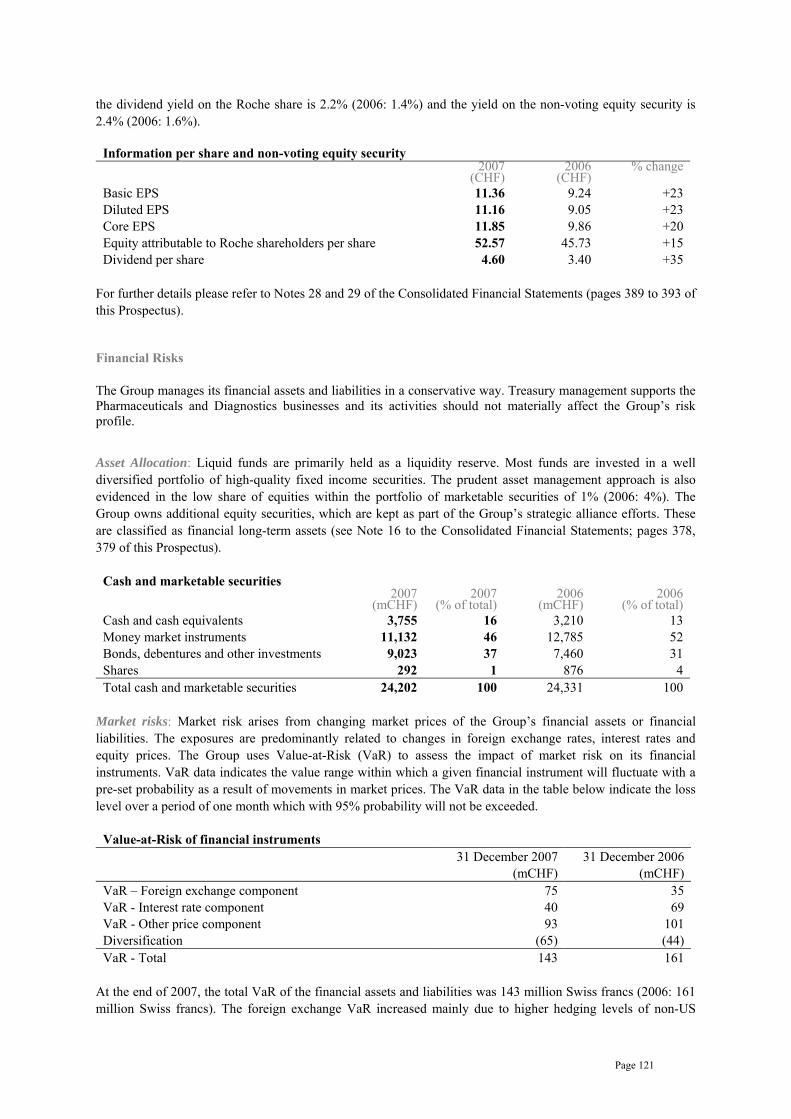
Page 121
the dividend yield on the Roche share is 2.2% (2006: 1.4%) and the yield on the non-voting equity security is 2.4% (2006: 1.6%).
Information per share and non-voting equity security 2007
(CHF) 2006
(CHF) % change
Basic EPS 11.36 9.24 +23 Diluted EPS 11.16 9.05 +23 Core EPS 11.85 9.86 +20 Equity attributable to Roche shareholders per share 52.57 45.73 +15 Dividend per share 4.60 3.40 +35
For further details please refer to Notes 28 and 29 of the Consolidated Financial Statements (pages 389 to 393 of this Prospectus). Financial Risks The Group manages its financial assets and liabilities in a conservative way. Treasury management supports the Pharmaceuticals and Diagnostics businesses and its activities should not materially affect the Group’s risk profile.
Asset Allocation: Liquid funds are primarily held as a liquidity reserve. Most funds are invested in a well diversified portfolio of high-quality fixed income securities. The prudent asset management approach is also evidenced in the low share of equities within the portfolio of marketable securities of 1% (2006: 4%). The Group owns additional equity securities, which are kept as part of the Group’s strategic alliance efforts. These are classified as financial long-term assets (see Note 16 to the Consolidated Financial Statements; pages 378, 379 of this Prospectus).
Cash and marketable securities 2007
(mCHF) 2007
(% of total) 2006
(mCHF) 2006
(% of total) Cash and cash equivalents 3,755 16 3,210 13 Money market instruments 11,132 46 12,785 52 Bonds, debentures and other investments 9,023 37 7,460 31 Shares 292 1 876 4 Total cash and marketable securities 24,202 100 24,331 100
Market risks: Market risk arises from changing market prices of the Group’s financial assets or financial liabilities. The exposures are predominantly related to changes in foreign exchange rates, interest rates and equity prices. The Group uses Value-at-Risk (VaR) to assess the impact of market risk on its financial instruments. VaR data indicates the value range within which a given financial instrument will fluctuate with a pre-set probability as a result of movements in market prices. The VaR data in the table below indicate the loss level over a period of one month which with 95% probability will not be exceeded.
Value-at-Risk of financial instruments 31 December 2007
(mCHF) 31 December 2006
(mCHF) VaR – Foreign exchange component 75 35 VaR - Interest rate component 40 69 VaR - Other price component 93 101 Diversification (65) (44) VaR - Total 143 161
At the end of 2007, the total VaR of the financial assets and liabilities was 143 million Swiss francs (2006: 161 million Swiss francs). The foreign exchange VaR increased mainly due to higher hedging levels of non-US

Page 122
dollar cash flows from future royalty income over the next five years at Genentech. The lower contribution from the interest rate component was caused by the ageing of fixed-term liabilities. Other price risk arises mainly from movements in the prices of equity securities. In 2007, the Group held equity securities with a market value of 1.1 billion Swiss Francs (2006: 1.7 billion Swiss francs). This number includes holdings in biotechnology companies, which were acquired in the context of licensing transactions or scientific collaborations. The lower holdings in equity securities resulted in a lower VaR for other price risk. Further information on financial risk management and financial risks and the VaR methodology is included in Note 32 to the Consolidated Financial Statements. (pages 395 to 401 of this Prospectus) International Financial Reporting Standards The Roche Group has been using International Financial Reporting Standards (IFRS) to report its consolidated results since 1990. The International Accounting Standards Board (IASB) has published a number of new and revised standards and interpretations which the Group has implemented from 1 January 2007. The changes relate mainly to disclosure items in the annual financial statements. In addition the Group has made changes to the presentation of its operating results in the income statement. The Group has made these presentational changes to more accurately reflect the underlying business, to further improve comparability of its results to those of other healthcare companies and to allow readers to make a more accurate assessment of the sustainable earnings capacity of the Group. Total operating profit is unchanged, and the presentational changes have no effect on the non-operating results, net income and earnings per share. Full details of the changes are given in Note 1 to the Consolidated Financial Statements (pages 332 to 344 of this Prospectus). Year ended 31 December 2006 Operating Results
The 2006 annual results once again show a strong operating performance both in terms of top-line growth as well as profit margins, mainly driven by the Pharmaceuticals Division.
Total sales grew by 17% in local currencies (18% in Swiss francs; 18% in US dollars) to 42.0 billion Swiss francs, with the Pharmaceuticals Division contributing 79% to Group sales and the Diagnostics Division representing 21%. The incremental sales increase of 6.5 billion Swiss francs was achieved through organic growth and primarily driven by strong demand for the Group’s oncology drugs Herceptin, Avastin, MabThera/Rituxan and Tarceva, by the anti-influenza drug Tamiflu, and by Bonviva/Boniva and Lucentis. This sales increase is after absorbing over 500 million Swiss francs of lower Rocephin sales globally following the product’s US patent expiry in July 2005.
The Group’s operating profit before exceptional items increased by 27% in local currencies to 11.7 billion Swiss francs and the corresponding operating profit margin grew by 2.0 percentage points to 27.9%. This was driven by an increase in Pharmaceuticals of 4.1 percentage points which more than offset a decline in the margin in Diagnostics of 5.2 percentage points. This overall margin growth was achieved at the same time as the Group continued to increase investments in the strong development pipeline and in launch and pre-launch activities.

Page 123
The exchange rate impact on sales and operating profit growth as expressed in Swiss francs was moderate, with Swiss-franc growth being 0 to 1 percentage point higher than local-currency growth. In 2006, the average exchange rate for the US dollar was 1% higher and the euro was 2% higher, while the Japanese yen lost 5%. Group operating results 2006 Pharmaceuticals
(mCHF) Diagnostics
(mCHF) Corporate
(mCHF) Group
(mCHF) Sales 33,294 8,747 — 42,041 Operating Profit before Exceptional Items 10,545 1,422 (237) 11,730 — margin 31.7 16.3 — 27.9 EBITDA 12,168 2,500 (232) 14,436 — margin 36.5 28.6 — 34.3 Group operating results – Development of results compared to 2005 Pharmaceuticals Diagnostics Corporate Group Sales % Increase in Local Currencies +21 +5 — +17 Operating Profit before Exceptional Items% Increase in Local Currencies +40 -21 +96 +27 — margin: Percentage Point Increase +4.1 -5.2 — +2.0 EBITDA - % Increase in Local Currencies +34 -5 +99 +24 — margin: Percentage Point Increase +3.2 -3.1 — +1.7 Pharmaceuticals Operating results The Pharmaceuticals Division showed a strong sales increase, with growth of 21% in local currencies (22% in Swiss francs; 21% in US dollars) to 33.3 billion Swiss francs, outpacing growth in the global market by a factor of more than three. Operating profit before exceptional items was 10.5 billion Swiss francs, representing a growth of 40% in local currencies. Consequently there was a further margin increase of 4.1 percentage points to 31.7%.
Marketing and distribution costs significantly increased by 17% in local currencies to 8.8 billion Swiss francs reflecting the support for recently launched on-market products and pre-launch activities for global rollouts and new indications. R&D investment in the pipeline continued with 5.9 billion Swiss francs of expenditure, an increase of 19% in local currencies.
Sales: The major growth drivers were the oncology, transplantation and virology franchises (including Tamiflu), with the key oncology franchise again significantly outpacing the market. The renal anaemia franchise declined slightly due to biennial selling price cuts and a change in the reimbursement system for Epogin in the Japanese market. Pharmaceuticals Division – Sales by therapeutic area*
Therapeutic area Sales 2006
(mCHF) % of Sales % Change
(local currencies) Oncology 15,278 46 +37

Page 124
Inflammation/Autoimmune/Transplantation 2,753 8 +14 Virology 5,443 81)/16 +11)/+24 Metabolism/Bone 2,228 7 +23 Renal anemia 1,660 5 -3 Others 5,932 18 0 Total 33,294 100 +21 1) Excluding Tamiflu.
* The figures are sourced from the unaudited internal accounting systems and records of the Group.
The growth and profitability of the Pharmaceuticals Division is primarily due to ten products (Herceptin, Avastin, Tamiflu, MabThera/Rituxan, Lucentis, Tarceva, Bonviva/Boniva, Xeloda, CellCept and Xolair). These represent 59% of the portfolio (2005: 47%; 2004: 37%). Together they grew 50% in 2006, generating over 6.5 billion Swiss francs of additional sales. Overall the Top 20 products grew by 30% and of these only Rocephin was in real decline, due to the US patent expiry in 2005. The decline of 6% for all other products is primarily due to generic erosion affecting Copegus and Roaccutane. Pharmaceuticals Division - Sales of Top 20 products*
Sales 2006
(mCHF) % of Sales % Change
(local currencies) Therapeutic Area MabThera/Rituxan 4,839 15 +15 Oncology / IAT1) Herceptin 3,927 12 +81 Oncology Avastin 2,962 9 +76 Oncology Tamiflu 2,627 8 +68 Virology NeoRecormon/Epogin 2,227 7 -1 Anemia, Oncology CellCept 1,842 6 +7 IAT Pegasys 1,467 4 +3 Virology Xeloda 971 3 +20 Oncology Tarceva 813 2 +108 Oncology Xenical 693 2 +7 Metabolism / Bone Xolair 537 2 +31 Respiratory diseases Kytril 498 2 0 Oncology Nutropin 494 2 +3 Metabolism / Bone Bonviva/Boniva 488 1 +462 Metabolism / Bone Valcyte/Cymevene 488 1 +22 Virology Lucentis 478 1 - Ophthalmology Pulmozyme 436 1 +10 Respiratory diseases Rocephin 416 1 -56 Infectious diseases Neutrogin 379 1 +9 Oncology Avtivase/TNKase 362 1 +15 Cardiovascular diseases Total Top 20 products 26,944 81 +30 Other products 6,350 19 -6 Total 33,294 100 +21 1) Inflammation/Autoimmune/Transplantation.
* The figures are sourced from the unaudited internal accounting systems and records of the Group.
MabThera/Rituxan: Sales growth was driven by higher sales volumes, particularly in Europe and the rest of the world excluding the US and Japan. This is primarily due to increased usage of MabThera/Rituxan in first-line treatment of indolent and aggressive non-Hodgkin’s lymphoma (NHL). In the US, the already high treatment rates for NHL were maintained and price increases in 2005 and 2006 also contributed to sales growth. Initial sales were recorded for the treatment of new rheumatoid arthritis indication in both the US and Europe/the rest of the world (i.e. the world excluding the US, Japan and Europe, the "RoW"), which was an additional driver of the overall growth. Further growth potential is also expected from the maintenance indication/treatment immediately following first-line therapy in indolent non-Hodgkin’s lymphoma.
Herceptin: Growth of the second highest selling product continues to be driven by increased market share in HER2-positive adjuvant breast cancer (adj. BC) and the launch of this indication in additional countries. Roche estimates that by the end of 2006, Herceptin had around 40% market share in adj. BC in the five key EU markets (France, Germany, Italy, Spain and United Kingdom). Penetration rates in this setting outside these countries are still considerably lower. In the US, growth rates appear to have flattened out due to the earlier and

Page 125
rapid adoption of adjuvant treatment. Also contributing to growth, to a lesser extent, was a price increase effective in 2006.
Avastin: Sales continue to grow strongly, particularly in Europe/RoW where Avastin has now been launched in most markets worldwide in the initial indication for first-line metastatic colorectal cancer (mCRC). In the US, Avastin has already achieved high penetration rates following its launch in early 2004. The continued US growth is primarily driven by the usage of Avastin in first-line advanced non-small cell lung cancer (NSCLC) which was approved by the US Food and Drug Administration (FDA) in combination with chemotherapy in October 2006, and also by unapproved usage in metastatic breast cancer (mBC). There was also growth in 2006 from modest increased usage in first-line mCRC. During 2006 Roche filed for first-line advanced NSCLC in Europe and first-line mBC was filed in both the US and EU. Additional filings to enlarge the European first-line mCRC label to match the broader US label are planned for the first half of 2007. A filing for the treatment of advanced renal cell carcinoma (RCC) in Europe is scheduled for 2007.
Tamiflu: Sales continued to increase mainly due to governmental pandemic stockpiling which contributed 71% of total sales. There was also an increase in retail sales related to pandemic preparedness. Seasonal sales were lower than last year due to the absence of a sever flu season in the US, Europe and Japan during the calendar year 2006. Significant pandemic orders are still due for delivery during 2007.
NeoRecormon/Epogin: Growth of NeoRecormon was driven by increased usage in both the oncology (+10%) and renal anemia segments (+4%), which offset continued pricing pressure. Epogin sales in Japan declined due to biennial selling price cuts and a change in the reimbursement system. Overall, sales of the anemia franchise also slightly declined.
CellCept: Sales of the leading treatment in the mycophenolic acid (MPA) market were particularly strong in the US, driven by transplant indications and increased usage in the treatment of certain autoimmune indications (currently not approved). Continued sales growth in Western European countries offset the sales decline in some Latin American countries where generic competition commenced.
Pegasys: With 53% market share, Pegasys remains the global market leader in the treatment of hepatitis C (pegylated interferons). Sales were driven by increased use in Europe/RoW, offsetting a decline in the US from an overall decline in market volume. In Japan sales declined due to competition from a combination treatment, however the Pegasys+Copegus combination was approved in this market in January 2007.
Xeloda: The main growth driver was further increased usage of Xeloda for the treatment of both adjuvant colon cancer and mCRC. A filing for gastric cancer was submitted in Europe. Filings to include further combinations on the mCRC label, including use in combination with Avastin, are on track for the first half of 2007.
Tarceva: Sales continued to increase both in the US and in Europe/RoW, which now accounts for close to 40% of overall sales just 14 months after obtaining approval. US sales were driven by approval in the second indication, metastatic pancreatic cancer, as well as pricing increases in 2005 and 2006. In Europe, Tarceva was approved for the treatment of advanced pancreatic cancer in January 2007.
Xolair: Sales growth was primarily driven by increased penetration in the asthma market and, to a lesser extent, by pricing increases in 2005 and 2006. Outside the US, Xolair is marketed by Novartis. In the first half of 2007 Genentech expects to complete the acquisition of Tanox, its partner in the development of Xolair.
Bonviva/Boniva: The vast majority of sales come from the US, where Boniva has now captured approximately 15% market shares (total prescriptions). Bonviva has been granted reimbursement and was launched in many European markets during 2006.
Lucentis: Following US approval on 30 June 2006, initial sales were driven by high demand among existing age-related macular degeneration (AMD) patients previously on other therapies and use by newly diagnosed patients. Outside the US, Lucentis is marketed by Novartis.
Rocephin: Sales continued to decline rapidly in the US following the patent expiry in July 2005. As US sales are now significantly lower, the marginal effect of the generic competition is now abating.
Sales by region: Sales continued to grow in all major regions. In North America, sales grew more than three times above the market, driven by products marketed by Genentech (Avastin, Herceptin, Lucentis, MabThera/Rituxan, Tarceva and Xolair) as well as Tamiflu, Bonviva/Boniva, CellCept, Xeloda and Valcyte/Cymevene. Together these more than compensated for the over 450 million Swiss francs decline in US sales of Rocephin following US patent expiry in July 2005. In Europe the Group continued to gain market share, driven by continuing strong sales growth of Herceptin, Tamiflu, Avastin, MabThera/Rituxan, Tarceva, Pegasys,

Page 126
Xeloda and NeoRecormon. Sales in Japan declined by 1% due to the biennial government-mandated price cuts effective 1 April 2006. There was growth in Tamiflu sales in Japan, where government pandemic sales more than compensated for the lower seasonal flu sales. Sales growth for Herceptin, Neutrogin and Evista was mainly offset by a decline in Epogin sales. These declined due to the biennial price cuts and new rules introducing flat-rate reimbursement for epoetin products used in dialysis patients, which has reduced the size of the anemia market as a whole in Japan.
Pharmaceuticals Division – Sales by regions*
Region Sales 2006
(mCHF) % of Sales % Change
(local currencies) North America 14,064 42 +27 Europe 10,800 32 +22 Japan 3,503 11 -1 Other Regions 4,927 15 +24 Total 33,294 100 +21 * The figures are sourced from the unaudited internal accounting systems and records of the Group.
Royalties and other operating income: The increase of 8% in local currencies was due to higher royalty income and upfront income at Genentech and increased out-licensing income at Roche Pharmaceuticals. Gains on product divestments were not significant at 16 million Swiss francs compared to 55 million Swiss francs in 2005.
Cost of sales: The increase of 11% in local currencies was significantly below the 21% increase in sales. This is due to economies of scale in production and some product mix effects. In addition there are continuing productivity improvements and benefits from concentrating on a smaller number of production sites. These factors more than compensated for the 32% increase in royalty expenses on product sales to 1,714 million Swiss francs from 1,294 Swiss francs in 2005, driven by the success of MabThera/Rituxan, Tarceva, Xolair and Tamiflu, and for the gross profit share to GlaxoSmithKline from increased Bonviva/Boniva sales.
Marketing and distribution: These costs increased by 17% in local currencies, which is lower than the growth in sales in spite of the continuing intensive support for recent product launches and pre-launch activities for upcoming launches. Significant investments were made in the US for Boniva and Lucentis, in Europe and RoW markets for Avastin and Tarceva, and worldwide for Pegasys and for MabThera/Rituxan in its new indication, rheumatoid arthritis. In addition, there were pre-launch costs in the US for Avastin for NSCLC and breast cancer and for Mircera. In Japan, strategic marketing functions were strengthened and the sales force was significantly increased by reorganising the specialised oncology/renal representatives. Additionally in Japan there was preparation for the much earlier than originally anticipated launches of Avastin and Tarceva and also for the launch of Actemra in rheumatoid arthritis. Furthermore, over the past 12 to 18 months Roche has established a number of new affiliates in Central and Eastern Europe. Costs relating to Tamiflu increased to properlycommunicate its role in both seasonal flu and pandemic planning. Marketing and distribution costs as a percentage of sales were 26.3% compared to 27.4% in 2005.
Research and development: The increase of over 900 million Swiss francs, or 19% in local currencies, to almost 5.9 billion Swiss francs reflects higher spending on both late-stage clinical trials and early-stage projects. This is driven by the many additional indications, in particular for the oncology portfolio and for MabThera/Rituxan and Actemra in rheumatoid arthritis. Research and development costs as a percentage of sales were 17.7% compared to 18.2% in 2005. In addition Roche spent almost 600 million Swiss francs on the in-licensing of pipeline compounds and technologies, which are capitalised as intangible assets as required by IFRS. In total Roche spent 6.5 billion Swiss francs on internal and purchased R&D from in-licensing and other alliance deals, representing 19.4% of sales and an increase of 22% in local currencies.
General and administration: These costs grew by 3% in local currencies. Favourable developments included lower restructuring costs, in particular at Chugai, and gains made on the disposal of property. Overall these compensated for the costs for a project to harmonise SAP systems across Europe and establish a shared service centre for European affiliates, for higher royalty expenses on royalty income at Genentech and for the creation of new affiliates in Central and Eastern Europe.
Amortisation and impairment of intangible assets: The decline of 3% in local currencies primarily arose from Genentech, as some intangible assets were fully amortised by mid-2005. An impairment charge of 13 million Swiss francs was recorded in the second half of 2006, which relates to the decision to terminate development of one compound with an alliance partner.

Page 127
Pharmaceuticals sub-divisional results
2006 Sales
(mCHF) EBITDA(mCHF)
EBITDAas % of sales
Operating Profit before Exceptional
Items (mCHF)
OperatingProfit beforeExceptional
Itemsas % of sales
Roche Pharmaceuticals 20,666 7,030 34.0 6,025 29.2 Genentech 9,125 4,413 48.4 3,951 43.3 Chugai 3,503 725 20.7 569 16.2 Pharmaceuticals Division 33,294 12,168 36.5 10,545 31.7 2005 Roche Pharmaceuticals 16,955 5,577 32.9 4,618 27.2 Genentech 6,614 2,522 38.1 2,214 32.1 Chugai 3,699 974 26.3 797 21.5 Pharmaceuticals Division 27,268 9,073 33.3 7,539 27.6
Within the Pharmaceutical Division, Roche Pharmaceuticals showed a very string performance with a sales increase of 20% in local currencies, an increase in operating profit of 29% in local currencies, and an increase in the operating profit margin of 2.0 percentage points to 29.2% in local currencies. Economies of scale, a favourable product mix development and lower costs ratios in marketing and distribution, research and development and general and administration offset the impact of higher royalty expenses and an increased gross profit share to GlaxoSmithKline following higher Bonviva/Boniva sales. At Genentech, overall costs grew less than the significantly increased sales. Additionally, Genentech received considerably higher royalty income from Roche Pharmaceuticals due to the sales success of Herceptin, Avastin, MabThera/Rituxan and Tarceva. As a consequence the operating profit margin improved by 11.2 percentage points to 43.3%. Chugai reported slightly lower sales in local currencies, mainly as a result of government price cuts. Increased Tamiflu sales from government pandemic planning did not fully offset the impact of these price cuts. Operating profit at Chugai declined by 228 million Swiss francs due to the price cuts and Epogin reimbursement changes mentioned previously and also due to the marketing activities described above. Additional information on the Pharmaceuticals Division’s sub-divisional results is given in Note 3 to the Consolidated Financial Statements (page 432 of this Prospectus) and further information on Genentech and Chugai is given in Notes 4 and 5 (pages 433 to 438 of this Prospectus). Diagnostics operating results The Diagnostics Division increased its sales to 8.7 billion Swiss francs, growing 5% in local currencies (6% in Swiss francs; 5% in US dollars) while maintaining its leading market position. The operating profit before exceptional items decreased by 21% in local currencies to 1,422 million Swiss francs. Although there was a margin decline of 5.2 percentage points to 16.3%, the cash generation of the business remains well above industry average with an EBITDA of 28.6%. The lower margin was primarily due to further investments in product launches and continued selling price pressure, combined with impairment charges on intangible assets (2.1% of sales) in the second half of 2006. Additionally, 2006 royalty and other operating income was substantially lower, mainly due to the expiry of some PCR-related patents during 2006 and certain one-time income in 2005. Despite the decline in the operating margin in 2006, it remains above the average of the division’s major competitors.
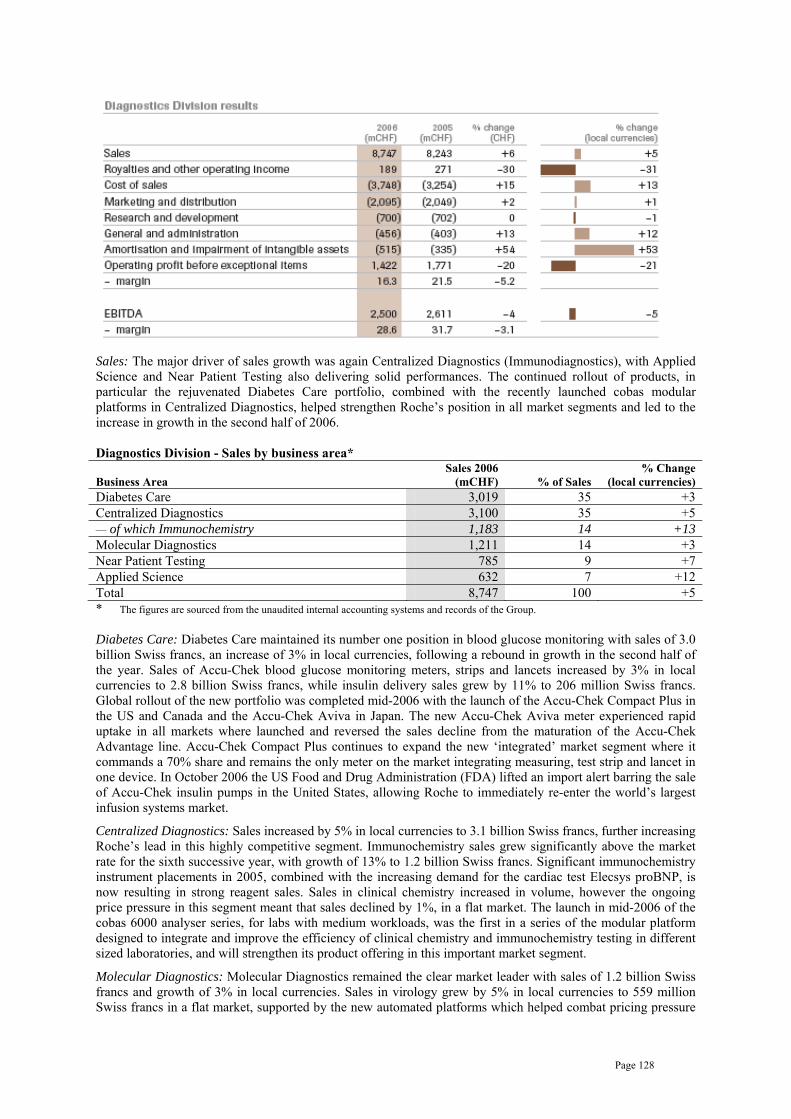
Page 128
Sales: The major driver of sales growth was again Centralized Diagnostics (Immunodiagnostics), with Applied Science and Near Patient Testing also delivering solid performances. The continued rollout of products, in particular the rejuvenated Diabetes Care portfolio, combined with the recently launched cobas modular platforms in Centralized Diagnostics, helped strengthen Roche’s position in all market segments and led to the increase in growth in the second half of 2006. Diagnostics Division - Sales by business area*
Business Area Sales 2006
(mCHF) % of Sales % Change
(local currencies) Diabetes Care 3,019 35 +3 Centralized Diagnostics 3,100 35 +5 — of which Immunochemistry 1,183 14 +13 Molecular Diagnostics 1,211 14 +3 Near Patient Testing 785 9 +7 Applied Science 632 7 +12 Total 8,747 100 +5 * The figures are sourced from the unaudited internal accounting systems and records of the Group. Diabetes Care: Diabetes Care maintained its number one position in blood glucose monitoring with sales of 3.0 billion Swiss francs, an increase of 3% in local currencies, following a rebound in growth in the second half of the year. Sales of Accu-Chek blood glucose monitoring meters, strips and lancets increased by 3% in local currencies to 2.8 billion Swiss francs, while insulin delivery sales grew by 11% to 206 million Swiss francs. Global rollout of the new portfolio was completed mid-2006 with the launch of the Accu-Chek Compact Plus in the US and Canada and the Accu-Chek Aviva in Japan. The new Accu-Chek Aviva meter experienced rapid uptake in all markets where launched and reversed the sales decline from the maturation of the Accu-Chek Advantage line. Accu-Chek Compact Plus continues to expand the new ‘integrated’ market segment where it commands a 70% share and remains the only meter on the market integrating measuring, test strip and lancet in one device. In October 2006 the US Food and Drug Administration (FDA) lifted an import alert barring the sale of Accu-Chek insulin pumps in the United States, allowing Roche to immediately re-enter the world’s largest infusion systems market.
Centralized Diagnostics: Sales increased by 5% in local currencies to 3.1 billion Swiss francs, further increasing Roche’s lead in this highly competitive segment. Immunochemistry sales grew significantly above the market rate for the sixth successive year, with growth of 13% to 1.2 billion Swiss francs. Significant immunochemistry instrument placements in 2005, combined with the increasing demand for the cardiac test Elecsys proBNP, is now resulting in strong reagent sales. Sales in clinical chemistry increased in volume, however the ongoing price pressure in this segment meant that sales declined by 1%, in a flat market. The launch in mid-2006 of the cobas 6000 analyser series, for labs with medium workloads, was the first in a series of the modular platform designed to integrate and improve the efficiency of clinical chemistry and immunochemistry testing in different sized laboratories, and will strengthen its product offering in this important market segment.
Molecular Diagnostics: Molecular Diagnostics remained the clear market leader with sales of 1.2 billion Swiss francs and growth of 3% in local currencies. Sales in virology grew by 5% in local currencies to 559 million Swiss francs in a flat market, supported by the new automated platforms which helped combat pricing pressure

Page 129
in this highly competitive segment. Blood screening showed evidence of slowing growth (sales 310 million Swiss francs, a decline of 1% in local currencies) with an increase in the number of centres coming online offset by a process reduction in Japan earlier in the year. In June 2006 Roche began rolling out across Europe the new fully automated cobas s 201 modular blood screening system and cobas TaqScreen MPX multiplex test, which simultaneously detects HIC, HCV and HBV in donated blood or plasma. Roche is on track to submit filings to the FDA in the first half of 2007 for tests to detect and genotype low and high-risk types of human papillomavirus (HPV).
Near Patient Testing: Sales rose 7% to 785 million Swiss francs, helped by improved marketing of the business area’s broad portfolio and by the continued move towards decentralised testing. Coagulation sales increased by 6% in local currencies to 196 million Swiss francs, due to the growing trend towards patient self-monitoring. The new coagulation monitoring systems, CoaguChek XS for patient self-monitoring and CoaguChek XS Plus for healthcare professionals, commenced their European rollout in January and October, respectively, and a full US launch of the CoaguChek XS for professional use is planned for the first quarter of 2007.
Applied Science: In a highly fragmented and competitive life science market, Applied Science grew at 12% to 632 million Swiss francs, this being twice the market rate. The major contributors were sales of the Genome Sequencer 20 system (for DNA sequencing), the LightCycler 480 system (for high-throughput real-time PCR) and the industrial business (reagents for industrial processes).
Sales by regions: Sales continued to grow ahead of the local market in all regions with the exception of North America. North America returned to positive growth in the second half of 2006, helped by Immunochemistry and the rebound in Diabetes Care. Sales growth in Japan was particularly strong given the across-the-board price cut of 10% in April. Diagnostics Division – Sales by regions*
Region Sales 2006
(mCHF) % of Sales % Change
(local currencies) North America 2,455 28 +2 EMEA1) 4,190 48 +5 Japan 426 5 +3 Other Regions 1,676 19 +8 Total 8,747 100 +5 1) Europe, Middle East and Africa (excl. Iberia).
* The figures are sourced from the unaudited internal accounting systems and records of the Group.
Royalties and other operating income: At 189 million Swiss francs, royalty and other operating income was 31% in local currencies or 82 million Swiss francs lower than in the comparative period which included substantial one-off income from out-licensing agreements. Royalty income in 2006 was lower due to the expiry in March 2006 of the foundational PCR patents in most countries outside the US. In the US, the patents expired in March 2005.
Cost of sales: The overall increase of 13% in local currencies was considerably higher than sales growth. This was the result of business area mix and product mix impacts and higher depreciation resulting from the significantly increased leased-out instruments base. Royalty expenses of 263 million Swiss francs in 2006 were 10% higher in local currencies primarily due to Centralized Diagnostics. Costs of sales as a percentage of sales increased to 42.8% from 39.5% in 2005.
Marketing and distribution: These costs remained stable at the 2005 level with increased overall investment in 2006 offset by the significant launch expenses for a number of new Diabetes Care products in the 2005 comparative numbers. In addition, sample consumption and inventory write-offs were lower in 2006, and some global functions across the division and business areas were streamlined. Marketing and distribution as a percentage of sales declined to 24.0% from 24.9% in 2005.
Research and development: Costs decreased slightly by 1% in local currencies. The decline reflects changes in the timing of projects and lower expenses from third-party collaborations. As a percentage of sales, research and development costs declined to 8% from 8.5% in 2005.
General and administration: These costs increased 12% in local currencies, mainly due to increased accruals for prior year royalties following from ongoing discussions with various contract partners. In addition there were restructuring expenses of 17 million Swiss francs.
Amortisation and impairment of intangible assets: The increase is due to impairment charges of 184 million Swiss francs recorded in the second half of 2006, following updating of the division’s business plans and

Page 130
technology assessments. These charges relate to intangible assets recorded from the Disetronic acquisition in 2003. Corporate operating costs General and administration: Costs increased to 237 million Swiss francs (121 million Swiss francs in 2005), which is explained by the inclusion in the 2005 results of a gain of 127 million Swiss francs from the settlement of pensions plans at Chugai. Excluding this, corporate operating costs declined by 4%. Exceptional operating items Major legal cases: There were no income statement impacts from developments in major legal cases in 2006. Additional information on major legal cases is given in Note 7 to the Consolidated Financial Statements (pages 439 to 442 of this Prospectus). Total operating results Pharmaceuticals Diagnostics Corporate Group
2006
(mCHF) 2005
(mCHF) 2006
(mCHF) 2005
(mCHF) 2006
(mCHF) 2005
(mCHF) 2006
(mCHF) 2005
(mCHF)
Operating Profit before Exceptional Items 10,545 7,539 1,422 1,771 (237) (121) 11,730 9,189
Major Legal Cases - (210) - (146) — — - (356)
Operating Profit 10,545 7,329 1,422 1,625 (237) (121) 11,730 8,833
Operating profit: The increase of 2,897 million Swiss francs or 33% in local currencies reflects the strong business expansion, the continued improvement in the Group’s operating performance and the inclusion of exceptional items for major legal cases in the comparative 2005 results. Non-operating results During 2006 the Group’s treasury operations and pension management delivered a positive net financial income with net income from financial assets and foreign exchange management exceeding financing costs by 855 million Swiss francs. The Group’s effective tax rate increased by 2.4 percentage points to 27.3% from 24.9% mainly due to an increase in the effective tax rate at Genentech. Profit from continuing businesses and net income increased due to the combination of positive developments on the operating and financial lines and the absence of major legal case expenses in 2006, which more than compensated for the increase in the effective tax rate. Non-operating results
2006
(mCHF) 2005
(mCHF) % Change Operating Profit 11,730 8,833 +33 Associated Companies 2 1 +100 Financial Income 1,829 1,313 +39 Financing Costs (974) (985) -1 Profit before Taxes 12,587 9,162 +37 Income Taxes (3,436) (2,284) +50 Profit from Continuing Businesses 9,151 6,878 +33 Profit from Discontinued Businesses 20 (12) — Net Income 9,171 6,866 +34 Attributable to — Roche Shareholders 7,880 5,923 +33 — Minority Interests 1,291 943 +37

Page 131
Financial income: Financial income showed a strong increase compared to 2005. Net income from equity securities was 390 million Swiss francs compared to 258 million Swiss francs in 2005, driven by strongly performing equity markets during 2006 and the disposal of some equity investments. Interest income and income from debt securities more than doubled to 780 million Swiss francs due to higher holdings and increases in interest rates. Expected returns on pension plan assets were 636 million Swiss francs, in line with 2005. Net foreign exchange losses were 24 million Swiss francs compared to losses of 34 million Swiss francs in 2005. A full analysis of financial income is given in Note 8 to the Consolidated Financial Statements (pages 442, 443 of this Prospectus).
Financing costs: Financing costs were 974 million Swiss francs and declined by 1% compared to 2005. Interest expenses increased as a result of the 2 billion US dollar Senior Notes issued at Genentech in mid-2005. This was only partly compensated by lower interest expenses resulting from the partial conversion of ‘LYONs V’ notes and some bank debt redemption. As most debt instruments are fixed, increasing interest rates did not have a major impact on financing costs. Interest costs of defined benefit plans were 571 million Swiss francs, slightly lower than 2005. A full analysis of financing costs is given in Note 8 to the Consolidated Financial Statements (pages 442, 443 of this Prospectus).
Income taxes: The Group’s effective tax rate was 27.3% compared to the 2005 rate of 24.9%. The main influence was the increase in effective tax rate at Genentech (to 42% from 36%). As in the 2006 interim results, the accounting for equity compensation plans adversely affected the effective tax rate at Genentech, as the development of the Genentech share price in 2006 meant that only a small accounting tax benefit was recorded from the expensing of equity compensation plans. In addition the 2005 tax charge at Genentech includes certain tax credits. Excluding Genentech and Chugai, the underlying effective tax rate of 18.9% is slightly lower than the 2005 rate of 20.2%. An analysis of the effective tax rate is given in Note 9 to the Consolidated Financial Statements (pages 443 to 445 of this Prospectus).
Profit from continuing businesses: The increase of 33% compared to 2005 is due to the positive developments in the operating and financial lines. Excluding the 2005 exceptional item major legal cases, profit from continuing businesses increased by 2.1 billion Swiss francs or 29%.
Discontinued businesses: There were no significant results from discontinued operations, with 2006 showing a small release of provisions that are no longer required. The comparative results include the operating results for the remaining 2% of the Consumer Health (OTC) business that was transferred to Bayer in 2005. Further information about discontinued businesses is given in Note 11 to the Consolidated Financial Statements (pages 446, 447 of this Prospectus).
Net income: In 2006 Group net income increased by 34% to 9.2 billion Swiss francs and the return on sales margin was 21.8%. Net income attributable to the Roche shareholders was 33% higher than in the comparative period. The share of net income attributable to minorities increased by 37% to 1,291 million Swiss francs due to the continually improving profit contribution by Genentech. Within this, 1,077 million Swiss francs are attributable to Genentech minority interests and 202 million Swiss francs to Chugai minority interests.
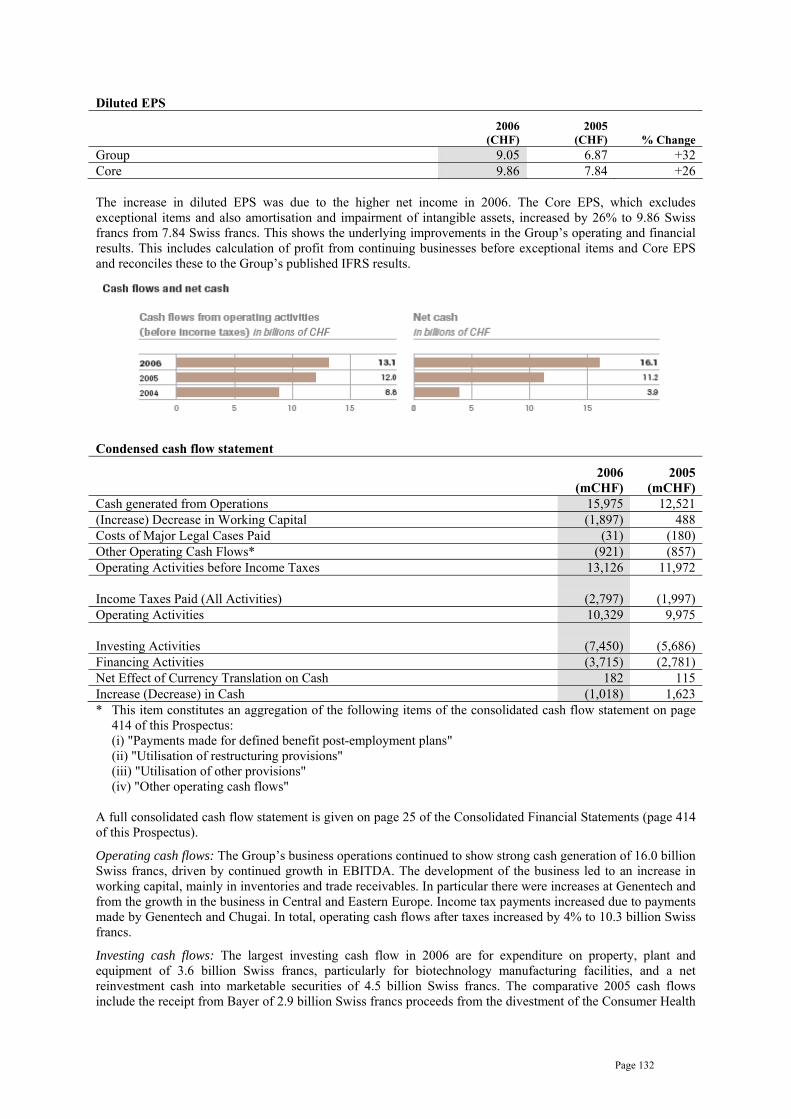
Page 132
Diluted EPS
2006
(CHF) 2005
(CHF) % Change Group 9.05 6.87 +32 Core 9.86 7.84 +26 The increase in diluted EPS was due to the higher net income in 2006. The Core EPS, which excludes exceptional items and also amortisation and impairment of intangible assets, increased by 26% to 9.86 Swiss francs from 7.84 Swiss francs. This shows the underlying improvements in the Group’s operating and financial results. This includes calculation of profit from continuing businesses before exceptional items and Core EPS and reconciles these to the Group’s published IFRS results.
Condensed cash flow statement
2006 (mCHF)
2005(mCHF)
Cash generated from Operations 15,975 12,521 (Increase) Decrease in Working Capital (1,897) 488 Costs of Major Legal Cases Paid (31) (180) Other Operating Cash Flows* (921) (857) Operating Activities before Income Taxes 13,126 11,972 Income Taxes Paid (All Activities) (2,797) (1,997) Operating Activities 10,329 9,975 Investing Activities (7,450) (5,686) Financing Activities (3,715) (2,781) Net Effect of Currency Translation on Cash 182 115 Increase (Decrease) in Cash (1,018) 1,623 * This item constitutes an aggregation of the following items of the consolidated cash flow statement on page
414 of this Prospectus: (i) "Payments made for defined benefit post-employment plans" (ii) "Utilisation of restructuring provisions" (iii) "Utilisation of other provisions" (iv) "Other operating cash flows"
A full consolidated cash flow statement is given on page 25 of the Consolidated Financial Statements (page 414 of this Prospectus).
Operating cash flows: The Group’s business operations continued to show strong cash generation of 16.0 billion Swiss francs, driven by continued growth in EBITDA. The development of the business led to an increase in working capital, mainly in inventories and trade receivables. In particular there were increases at Genentech and from the growth in the business in Central and Eastern Europe. Income tax payments increased due to payments made by Genentech and Chugai. In total, operating cash flows after taxes increased by 4% to 10.3 billion Swiss francs.
Investing cash flows: The largest investing cash flow in 2006 are for expenditure on property, plant and equipment of 3.6 billion Swiss francs, particularly for biotechnology manufacturing facilities, and a net reinvestment cash into marketable securities of 4.5 billion Swiss francs. The comparative 2005 cash flows include the receipt from Bayer of 2.9 billion Swiss francs proceeds from the divestment of the Consumer Health

Page 133
(OTC) business and the 0.5 billion Swiss francs used by Genentech to purchase the Oceanside biologics manufacturing facility.
Financing cash flows: Significant financing cash flows in 2006 and 2005 relate to dividend payments and the redemption of debt instruments. Dividends paid by Roche in 2006 were 2.2 billion Swiss francs (2005: 1.7 billion Swiss francs) and cash used for the redemption of debt instruments was 1.3 billion Swiss francs (used to purchase equity instruments to cover partial conversion of the ‘LYONs V’ notes) compared to 1.2 billion Swiss francs in 2005 (used for the ‘Sumo’ bonds). Following the conversion of the ‘LYONs V’ notes the Group reduced its own equity instruments holdings in 2006, realising a cash inflow of 1.4 billion Swiss francs. In 2005 Genentech issued 2 billion US dollars of Senior Notes resulting in a cash inflow equivalent to 2.6 billion Swiss francs. In 2006 Genentech received 0.5 billion Swiss francs from stock option exercises (2005: 1.0 billion Swiss francs) and repurchased shares for 1.2 billion Swiss francs (2005: 2.5 billion Swiss francs). Net cash
31 December 2006
(mCHF)
31 December 2005
(mCHF) % Change Cash and Cash Equivalents 3,210 4,228 -24 Marketable Securities 21,121 16,657 +27 Long-Term Debt (6,199) (9,322) -34 Short-Term Debt (2,044) (348) +487 Net Cash 16,088 11,215 +43 Net cash further increased during 2006 to 16.1 billion Swiss francs. The main drivers were the strong cash inflow from operating activities of 10.3 billion Swiss francs, expenditures for property, plant and equipment and the Roche dividend payment. The increase in short-term debt is due to the reclassification of the ‘LYONs V’ notes and US dollar European Medium Term Notes from long-term to short-term debt.
Condensed balance sheet
31 December 2006
(mCHF)
31 December 2005
(mCHF) %
Change Property, Plant and Equipment 16,417 15,097 +9 Goodwill and Intangible Assets 11,383 12,388 -8 Other Non-Current Assets 5,719 6,084 -6 Cash and Marketable Securities 24,331 20,885 +16 Other Current Assets 16,564 14,741 +12 Total Assets 74,414 69,195 +8 Debt (Current and Non-Current) (8,243) (9,670) -15 Other Non-Current Liabilities (8,709) (10,223) -15 Other Current Liabilities (10,648) (9,144) +16 Total Liabilities (27,600) (29,037) -5 Total Net Assets 46,814 40,158 +17 Capital and Reserves attributable to Roche Shareholders 39,444 33,334 +18 Equity attributable to Minority Interests 7,370 6,824 +8 Total Equity 46,814 40,158 +17

Page 134
A full consolidated balance sheet is given on page 24 of the Consolidated Financial Statements (page 413 of this Prospectus).
Non-current assets: The decrease in the US dollar to 1.22 against the Swiss franc at 31 December 2006 from 1.31 at 31 December 2005 decreased long-term assets in Swiss franc terms since many of the Group’s production facilities and intangible assets are denominated in US dollars. This was offset by capital expenditure of 4.5 billion Swiss francs.
Current assets: Inventories and accounts receivable were higher in local currencies following from the growth of the business. The total balance of cash and marketable securities increased by 3.4 billion Swiss francs as a result of the Group’s strong cash generation.
Debt: The partial conversion of the ‘LYONs V’ notes and further repayment of bank loans reduced debt by 1.4 billion Swiss francs. The remaining 0.6 billion Swiss francs carrying value of the ‘LYONs V’ notes is now classified as short-term debt, due to the Group’s option to redeem the notes from 25 July 2007 onwards. Additionally the movement in the US dollar exchange rate decreased the Swiss franc carrying value of the Group’s US dollar-denominated debt instruments.
Other non-current and current liabilities: There were no significant movements in the overall balance in local currencies, with most of the movement being due to currency translation or transfers between current and non-current liabilities.
Total net assets/equity: The most significant movements were the net income of 9.2 billion Swiss francs, the Roche dividend payments of 2.2 billion Swiss francs and currency translation losses of 1.5 billion Swiss francs. The currency translation losses mainly arose from the decrease in the US dollar relative to the Swiss franc, which particularly affects the balance sheet values of assets and liabilities that have concentrations in the US, such as property, plant and equipment, goodwill and other intangible assets and debt.
Strong financial condition: The Group remains solidly financed, with equity (including minority interests) representing 63% of total assets and 83% of total assets financed long-term. Pensions and other post-employment benefits Post-employment benefit plans are classified as ‘defined contribution plans’ if the Group pays fixed contributions into a separate fund or to a third-party financial institution and will have no further legal or constructive obligation to pay further contributions. In 2006 expenses for the Group’s defined contribution plans were 214 million Swiss francs (2005: 174 million Swiss francs), the increase arising mainly from Genentech. All other plans are classified as ‘defined benefit plans’, even if the Group’s potential obligation is relatively minor or has a relatively remote possibility of arising. The funding and asset management of the Group’s various defined benefit plans is overseen at a corporate level. Plans are usually established as trusts independent of the Group and are funded by payments from the Group and by employees, but in some cases the plan is unfunded and the Group pays pensions to retired employees directly from its own financial resources. Funding status of defined benefit pension and other post-employment benefit plans
2006 (mCHF)
2005(mCHF)
Funded Plans - Fair Value of Plan Assets 11,632 10,858 - Defined Benefit Obligation (11,002) (10,976) - Over (Under) Funding 630 (118) Unfunded Plans - Defined Benefit Obligation (3,596) (3,630) Funding status: Overall the Group’s defined benefit plans continue to be adequately funded, with the main movements arising from better than expected returns on plan assets and currency translation effects from plans denominated in US dollars and euros. The funding status increased to 106% from 99%. An increase in the discount rate used in the 2006 valuations of Eurozone plans reduced the defined benefit obligations slightly.
Expenses recorded in income statement: Pension expenses in 2006 relating to the Group’s defined benefit plans were 283 million Swiss francs, more than double the 2005 expenses of 117 million Swiss francs. This is mainly due to the one-time settlement gain in 2005 of 127 million Swiss francs that arose when Chugai returned part of its employees’ pension fund to the Japanese government. Excluding this, pension costs in 2006 increased by

Page 135
16% mainly due to changes in discount rates adopted at the end of 2005. The revised actuarial assumptions included in the actuarial valuations at the end of 2006 are expected to lead to further increases in 2007, which partly arise from increased life expectancy.
Full details of the Group’s pensions and other post-employment benefits are given in Note 13 of the Consolidated Financial Statements (pages 448 to 452 of this Prospectus). Roche Securities Price development The Roche securities outperformed again a peer group of 17 healthcare companies but rose slightly less than the Swiss market. Share price and market capitalisation (at 31 December)*
2006 2005 % change Share Price (CHF) 247.50 219.20 +13 Genussscheine Price (CHF) 218.50 197.30 +11 Market Capitalisation (CHF billion) 192 171 +12 * The figures are sourced from the unaudited part of the Roche Annual Report 2006, Part 2 Finance Report (page 18). Roche ranked number 5 among its peers in terms of Total Shareholder Return (TSR), i.e. share price growth plus dividends, in 2006 when measured in Swiss francs. Year end return was 14% for the Roche share and 12% for the Roche Genussscheine. The combined performance of share and Genussscheine was 13% compared to a weighted average return for Roche and the peer group of 6% at actual exchange rates.
The figures are sourced from the unaudited part of the Roche Annual Report 2006, Part 2 Finance Report (page 18).
Dividend The Board of Directors is proposing a 36% increase in the dividend for 2006 to 3.40 Swiss francs per share and Genussscheine (2005: 2.50 Swiss francs) for approval at the Annual General Meeting. This is the 20th consecutive increase in the dividend. If the dividend proposal is approved by shareholders, dividend payments on the shares and Genussscheine in issue will amount to 2.9 billion Swiss francs (2005: 2.2 billion Swiss francs), resulting in a payout ratio of 38% (2005: 36%). Based on the prices at year-end 2006, the dividend yield on the Roche share is 1.4% (2005: 1.1%) and the yield on the Genussscheine is 1.6% (2005: 1.3%). Information per Share and Genussscheine Information per Share and Genussscheine
2006
(CHF) 2005
(CHF) % change Basic EPS 9.24 7.01 +32 Diluted EPS 9.05 6.87 +32 Core EPS 9.86 7.84 +26 Equity attributable to Roche shareholders per Share 45.73 38.56 +18 Dividend per Share 3.40 2.50 +36

Page 136
For further details please refer to Notes 31 and 32 of the Consolidated Financial Statements (pages 473 to 477 of this Prospectus). Financial Risks Value-at-Risk and Earnings-at-Risk analysis tools The Value-at-Risk (VaR) calculations are used to indicate the ranges within which the value of the respective assets or liabilities may fluctuate with a certain probability over a certain time period (holding period). The VaR measure is a statistical measure, implicitly assuming that the value changes of the recent past are indicative of value changes in the future. Market shocks are included in this calculation to the extent that they occurred in the observation period. The Group uses statistically relevant observation periods and applies holding periods, which reflect the time period required to change the respective risk exposure if deemed appropriate. With longer holding periods, the probability of higher value changes increases and so does the VaR measure.
Earnings-at-Risk (EaR) is equivalent to the VaR methodology, but rather than potential value changes, it indicates the potential changes to profits (losses) with a certain probability and over a certain time period. The same constraints and limitations apply to this methodology.
All VaR and EaR figures for interest rate risks are measured using a historical simulation approach. For each historical scenario (representing all price and rate changes of all individual instruments over a specific 20-day period in the past 10 years), all financial instruments are fully revalued (using valuation models) and the total change in value and earnings is determined. All VaR and EaR calculations below are based on 95% confidence level and a holding period of 20 trading days.
The Group cannot predict future market movements. The VaR and EaR figures given below do not represent the actual losses which are expected or might be incurred on financial assets and liabilities, nor the possible worst loss over the period stated, nor do they consider the effect of favourable changes in market rates. Foreign exchange risk The Group’s exposure to movements in foreign currencies affecting its net income and financial position, as expressed in Swiss francs, is summarised by the following key figures and comments. Growth (continuing businesses)*
% Change
2006 (Local Currencies)
2005 % Change
2006 (CHF)
2005 Sales +17 +19 +18 +20 Operating Profit before Exceptional Items +27 +33 +28 +33 * The figures are sourced from the unaudited part of the Roche Annual Report 2006, Part 2 Finance Report (page 19). Exchange rates against the Swiss franc*
31 December
2006 Average
2006 31 December
2005 Average
2005 1 USD 1.22 1.25 1.31 1.25 1 EUR 1.61 1.57 1.56 1.55 1 GBP 2.40 2.31 2.27 2.26 100 JPY 1.03 1.08 1.12 1.13 * The figures are sourced from the unaudited part of the Roche Annual Report 2006, Part 2 Finance Report (page 20). On average in 2006 the US dollar and the euro slightly strengthened against the Swiss franc compensating for the weaker yen. Consequently there is almost no difference between sales growth and operating profit growth expressed in Swiss francs or in local currencies. In absolute terms, the sensitivity of Group sales of continuing businesses to a movement in the US dollar against the Swiss franc by 0.01 Swiss francs during 2006 was approximately 130 million Swiss francs, and the corresponding sensitivities for the euro and yen were approximately 70 million Swiss francs and 35 million Swiss francs respectively.
In 2006 the Group further pursued a strategy to continuously lock in favourable developments of foreign exchange rates by entering into derivative contracts. Due to increased hedging activities associated with the strong sales growth of the Group, the foreign exchange transaction VaR increased compared to a very low exposure at year end 2005. In absolute terms it still remained at a low level.

Page 137
Foreign exchange risks*
31 December2006
(mCHF)
31 December2005
(mCHF) % Change VaR of Monetary Positions 20 9 +122 * The figures are sourced from the unaudited part of the Roche Annual Report 2006, Part 2 Finance Report (page 20). Interest rate risk Interest rate risk arises from movements in interest rates which could have adverse effects on the Group’s net income or financial position. Changes in interest rates cause variations in interest income and expenses on interest-bearing assets and liabilities. In addition, they can affect the market value of certain financial assets, liabilities and instruments. Where appropriate, the Group uses financial derivatives such as swaps to manage its interest rate risk.
During 2006 the Group unwound most of its fair value hedges on fixed-rate capital market debt, leading to an increased interest rate VaR. The effect was partly compensated by a debt reduction of 1.4 billion Swiss francs due to the redemption of outstanding bank debt and partial conversion of LYONs V convertible notes. The effect of higher liquid funds on interest rate VaR was small, as most instruments have a short duration.
The comparatively small risks from re-pricing or re-financing were contained at reasonable levels. However Earnings-at-risk (EaR) has increased mainly as a result of more liquid funds held with short interest rate commitments and because of the generally higher interest rate levels, which allow more room for downward changes of interest rates. Interest rate risks*
31 December2006
(mCHF)
31 December2005
(mCHF) % change VaR of Instruments Sensitive to Interest Rates 29 23 +26 EaR of Instruments Sensitive to Interest Rates 39 26 +50 * The figures are sourced from the unaudited part of the Roche Annual Report 2006, Part 2 Finance Report (page 20). Market risk of financial assets and liabilities Changes in the market value of financial assets and liabilities can affect the net income or financial position of the Group. Market risk arises from movements in stock prices, interest rates or foreign exchange rates.
The Group’s financial assets are mostly held in highly liquid bonds and money market instruments. The equity allocation in the Group’s portfolio of cash and marketable securities is 0.9 billion Swiss francs, or 4% of total cash and marketable securities. This figure remained stable compared to 2005 (0.8 billion Swiss francs, or 4% of total cash and marketable securities). International Financial Reporting Standards The Roche Group has been using International Financial Reporting Standards (IFRS) to report its consolidated results since 1990. The International Accounting Standards Board (IASB) has published a number of new and revised standards and interpretations that first became effective in 2006, which the Group implemented from 1 January 2006. The only significant changes that relate to the Roche Group financial statements arise from IAS 19 (revised) ‘Employee benefits’, in particular with respect to defined benefit pension and other post-employment benefits. These changes have been implemented effective 1 January 2006 and the comparative 2005 results have been restated for these changes from those previously published. Defined benefit plans – Actuarial gains and losses: All actuarial gains and losses are now recognised immediately and recorded directly to equity. Previously actuarial gains and losses below a certain threshold were not recognised and those above this threshold were only recognised progressively. As a result of this change the Group’s consolidated balance sheet more accurately represents the funding status of the various plans.
Defined benefit plans – Expected return on plan assets and interest cost: The Group now reports the expected return on plan assets and interest costs from defined benefit plans as part of financial income and financing costs, respectively. Previously these were reported as part of the divisional operating results. This change in presentation aligns the reporting of the Group’s results more closely with its internal management and organisation structure.

Page 138
Full details of the changes are given in Note 1 to the Consolidated Financial Statements (pages 417 to 429 of this Prospectus). Roche Holding Limited, Basel Year ended 31 December 2008
There is no additional information resulting from the 2008 Financial Statements of Roche Holding Limited which has not already been disclosed above in connection with the 2008 Consolidated Financial Statements.

Page 139
PART 6 CAPITALISATION AND INDEBTEDNESS
6.1 The following table shows the capitalisation of the Group as of 31 December 2008, based on the IFRS 2007 Consolidated Financial Statements included in Annex C of this Prospectus.
Shareholders’ Equity in millions of CHF
Capital and Reserves attributable to Roche Shareholders 44,479
Equity attributable to Non-Controlling Interests 9,343
Total Shareholders’ Equity 53,822
6.2 The following table shows the indebtedness of the Group as of 31 December 2008, based on IFRS Financial Information included in Annex C of this Prospectus and as adjusted to reflect the issuance of the U.S. dollar-denominated notes on 25 February 2009 to qualified institutional buyers in the United States under Rule 144A and to persons other than U.S. persons outside the United States under Regulation S of the U.S. Securities Act of 1933 (as amended), the issuance of Euro-denominated and Sterling-denominated notes under the Roche EMTN programme on 4 March 2009, the issuance of further U.S. dollar-denominated notes on 20 March 2009, as well as the issuance of Swiss franc-denominated bonds and notes on 23 March 2009. Further, as of 26 March 2009 Roche Holdings, Inc. has a nominal amount of USD 3,250 million of commercial paper outstanding under its USD 7.5 billion U.S. commercial paper program. All debt is unsecured and ungaranteed by third parties.
31 December 2008 As
reported As adjusted
in millions of CHF
in millions of CHF
in millions of USD1)
in millions of EUR2)
in millions of GBP3)
Debt: Recognised Liabilities Debt Instruments 3,564 Amounts due to Banks and other Financial Institutions
77
Genentech Leasing Obligations 337 Finance Lease Obligations 4 Other Borrowings 107 Total Debt 4,089 Reported as -Long-Term Debt 2,972 2,972 USD Floating rate notes due 2011 1,411 1,250 USD 4.50% notes due 2012 2,821 2,500 USD 5.00% notes due 2014 3,104 2,750 USD 6.00% notes due 2019 5,079 4,500 USD 7.00% notes due 2039 2,821 2,500 EUR 4.625% notes due 2013 8,028 5,250 EUR 5.625% notes due 2016 4,205 2,750 EUR 6.5% notes due 2021 2,676 1,750 GBP 5.5% notes due 2015 2,034 1,250 CHF 2.5% bonds due 2012 2,500 CHF 4.5% bonds due 2017 1,500 Total Long-Term Debt 2,972 39,151 13,500 9,750 1,250 -Short-Term Debt 1,117 1,117 USD Floating rate notes due 2010 3,386 3,000 EUR Floating rate notes due 2010 2,294 1,500

Page 140
As reported
As adjusted
in millions of CHF
in millions of CHF
in millions of USD1)
in millions of EUR2)
in millions of GBP3)
USD 1.95% notes due 2009 2,821 2,500 CHF 1.2% notes due September 2009 4,000 USD commercial paper 3,688 3,250 Total Short-Term Debt 1,117 17,286 5,500 1,500 0 Total Debt 4,089 56,437 19,000 11,250 1,250 Debt: Repayment Terms in millions of CHF
Within one year 1,117 17,286 5,500 1,500 Between one and two years 565 1,976 1,250 0 0 Between two and three years 6 5,327 2,500 0 0 Between three and four years 4 8,032 0 5,250 0 Between four and five years 3 3,107 2,750 0 0 More than five years 2,394 20,709 7,000 4,500 1,250 Total Debt 4,089 56,437 19,000 11,250 1,250 1) Amounts in these column has been translated for convenience into Swiss francs at CHF 1.1286 = USD 1.00
(ECB exchange rate of 20 March 2009). 2) Amounts in these column has been translated for convenience into Swiss francs at CHF 1.5291 = EUR 1.00
(ECB exchange rate of 20 March 2009). 3) Amounts in these column has been translated for convenience into Swiss francs at CHF 1.6276 = GBP 1.00
(ECB exchange rate of 20 March 2009).
As of 31 December 2008, the fair value of the debt instruments was 3.5 billion Swiss francs (2007: 6.2 billion Swiss francs) and the fair value of total debt was 4.0 billion Swiss francs (2007: 6.8 billion Swiss francs). This is calculated based on the observable market prices of the debt instruments or the present value of the future cash flows on the instrument, discounted at a market rate of interest for instruments with similar credit status, cash flows and maturity periods.
There are no pledges on the Group’s assets in connection with debt.
Amounts due to Banks and other Financial Institutions: These amounts are denominated in various currencies, notably in Chinese renmimbi. The average interest rate was 4.5%. The average interest rate in 2007 was 5.8%, when the balance was primarily denominated in euros. Repayment dates are up to five years and 61 million Swiss francs (2007: 105 million Swiss francs) are due within one year. Subsequent Events:
6.3 Issuance of notes in connection with the proposed acquisition of outstanding publicly-held shares of Genentech
On 25 February 2009, Roche completed an offering of U.S. dollar-denominated notes to qualified institutional buyers in the United States under Rule 144 A and to persons other than U.S. persons outside the United States under Regulation S of the U.S. Securities Act of 1933. Roche received approximately USD 16,263.7 million in aggregate net proceeds from the issuance and sale of these notes.
On 4 March 2009, Roche issued Euro and Sterling-denominated notes under a European Medium Term Note (EMTN) programme. Roche received approximately EUR 11,176.7 million and GBP 1,237.5 million in aggregate net proceeds from the issuance and sale of these notes. The Euro and Sterling-denominated notes were fixed- and floating-rate senior unsecured notes with the following principal terms:
The notes are obligations of Roche Holdings, Inc., a wholly-owned subsidiary of Roche Holding Ltd, the ultimate parent company of the Roche Group and the guarantor of the notes.

Page 141
The net proceeds of the above-mentioned offerings has been used to finance a portion of the tender offer for the remaining publicly-held shares of common stock of Genentech Inc.
The acquisition of all public shares, including shares issuable under Genentech's outstanding employee stock options and payment of related fees and expenses, costs approximately USD 46.8 billion. The Group has financed the transaction by a combination of the Group's own funds, commercial paper back-stopped by a credit facility, and debt securities.
6.5 Issues of notes under the Genentech commercial paper program
Notes issued by Genentech under its annual commercial paper program outstanding as at 31 December 2008 in a principal amount of USD 500 million (CHF 529 million) were redeemed by various dates until 23 January 2009. In 2009 new notes have been issued by Genentech under the commercial paper program in the aggregate amount of USD 600 million outstanding as of the date of this Prospectus.
Page 142
PART 7 ADDITIONAL INFORMATION
1. INCORPORATION
1.1 The Company was incorporated and registered in Switzerland under Swiss Law on 1 October 1896. It has been a public company limited by shares (Aktiengesellschaft - AG) under Swiss law since 1919. The Company is registered with the commercial register of Kanton Basel Stadt under the registration number CH-270.3.005.159-0. The legal name of the Company is Roche Holding AG. Its commercial name is Roche.
1.2 The Company’s registered office and principal place of business is at Grenzacherstrasse 124, 4058 Basel, Switzerland and its telephone number is +41 (0) 61 688 11 11.
2. RESPONSIBILITY
Roche Holding AG, Grenzacherstrasse 124, 4058 Basel, Switzerland accepts responsibility for the information contained in this Prospectus. To the knowledge of Roche Holding AG, the information contained in this Prospectus is in accordance with the facts and no material facts have been omitted.
Roche Holding AG, Grenzacherstrasse 124, 4058 Basel, Switzerland accepts responsibility for the information contained in this Prospectus. To the best of the knowledge of Roche Holding AG (who has taken all reasonable care to ensure that such is the case), the information contained in this Prospectus is in accordance with the facts and contains no omission likely to affect the import of such information.
3. SUMMARY OF CERTAIN PROVISIONS OF THE ARTICLES OF INCORPORATION AND BY LAWS
Summary of the By Laws and Articles of Incorporation of the Company
Articles of Incorporation
Purpose
3.1 Article 1.1 of the Company’s Articles of Incorporation states that the Company is a joint-stock company whose purpose is to hold shares in companies that manufacture and sell pharmaceutical and chemical products of all kinds, and that the Company may also participate in other industrial enterprises and holding companies.
Board of Directors
3.2 The Board of Directors is made up of at least seven members. In the past, the members were to be elected for a period of four years. As from the 2008 AGM the term of office of any directors who are to be elected or re-elected has been shortened from four to three years. A portion of the Board of Directors is to be elected each year. The Board of Directors elects a Chairman and one or two Vice-Chairmen from among its members. The Secretary is elected by the Board of Directors and need not be a Director himself. The Board of Directors is the highest authority for the management of the Company and for supervision of the management of the business. The Board of Directors is entrusted with the ultimate management of the Company, establishing the organisation of the Company and Structuring of the accounting system, and preparation of the annual report. The Board of Directors can delegate management and can appoint an Executive Committee.
3.3 Ordinary meetings of the Board shall be convened by the Chairman. An extraordinary meeting of the Board shall be convened by the senior (longer-serving) Vice-Chairman should any Board member request that a meeting be held without the Chairman. One-half of the members of the Board of Directors shall constitute a quorum and resolutions shall be passed by a simple majority of votes cast. The Board of Directors shall be responsible for the overall governance of the Company. Every member of the Board shall be entitled to seek information on all the Company’s affairs.
Chairman and President of the Board
3.4 The Chairman shall have specific duties and powers set out in the By Laws such as exercising day-to-day supervision over the affairs of the Company and the Group. The Vice-Chairmen and the Chairman shall together make up the Presidium of the Board and are responsible for preparing resolutions, fulfilling corporate governance duties and other duties set out in the By Laws.

Page 143
Executive Committee
3.5 The Chairman of the Executive Committee shall implement the strategic objectives of the Company, convene and chair meetings of the Executive Committee and carry out other duties set out in the By Laws. The Executive Committee shall be appointed by the Board and the scope of their duties includes drawing up five year plans and investments, leasing transactions or divestments over CHF 10 million.
Other Committees
3.6 The Audit Committee assists the Board in supervising the management of the Company, particularly with respect to financial matters and in relation to financial planning, budgets and investments of liquid assets and other financial investments. The Audit Committee will also submit long term business plans and risk plans and assessment. The Corporate Governance and Sustainability Committee assists the Board of Directors in matters relating to corporate governance and in promoting sustainable management of the Company’s activities. The Corporate Governance and Sustainability Committee also supervises compliance of internal business principles and principles of behaviour with respect to legal as well as safety and environmental matters. The Corporate Governance and Sustainability Committee will also oversee the preparation of the sustainability report. The Remuneration Committee is responsible for approving the Group’s remuneration policy, compensation packages, stock options and other schemes. See Part 4 above for further details on the Audit Committee, the Corporate Governance and Sustainability Committee and the Remuneration Committee.
Share Capital
Shares
3.7 The Company’s share capital is CHF 160,000,000 divided into 160,000,000 fully paid up bearer shares with a nominal value of 1 Swiss Franc each (the "Shares"). Existing bearer shares can be converted at any time into registered shares by ordinary resolution. Currently, there are no registered shares. There have been no changes to the share capital of the Company from 1 January 2003 to the date of this Prospectus.
Genussscheine
3.8 In addition there are 702,562,700 bearer Genussscheine. They are not part of the share capital and have no voting rights. However, they have the same rights to participate in the available earnings and in any remaining proceeds from liquidation following repayment of the share and participation certificate capital.
3.9 Each Genussschein carries one vote at meetings of Genussscheine holders. Meetings are convened by the Board of Directors by publication of the agenda in two notices in the journals chosen by the Company. The second notice must be published no longer than 20 days before the date of the meeting. A meeting of Genussscheine holders can pass resolutions if at least half of the Genussscheine issued are represented. Resolutions are passed by a majority of two thirds votes cast which must include the absolute majority of the bearers of all the votes represented. If at a meeting of Genussscheine holders, the necessary quorum is not represented, a second meeting must be called which is empowered to pass resolutions by an absolute majority of votes represented.
3.10 The meeting of Genussscheine holders can decide any changes to the rights of Genussscheine but a decision to waive some or all rights requires the agreement of the holders of the majority of all outstanding Genussscheine. All resolutions of the meeting of Genussscheine holders must be approved by the general meeting of all Shareholders.
3.11 The Company can at all times exchange Shares or participation certificates ("PCs") for all or some of the Genussscheine without the consent of the bearers. In the event of exchange against Shares, each such share can participate in earnings and liquidation proceeds in the same way as the Shares. If PCs are exchanged, each Genussscheine shall be replaced by a PC with a nominal value equivalent to one of the Shares. The general meeting decides on the timing at which rights attaching to Genussscheine called in for exchange terminate and are replaced by the rights attaching to the new Shares or PCs.
3.12 The Genussscheine have been created pursuant to Art. 657 of the Swiss Code of Obligations (Schweizerisches Obligationenrecht) and the Articles of Incorporation of Roche. Annex B contains the full terms and conditions of the Genussscheine as extracted from Roche’s Articles of Incorporation.

Page 144
3.13 The Genussscheine are bearer securities in securitised form. The records are kept by UBS AG, Wertschriften Services, Bahnhofstrasse 45, 8001 Zürich.
Participation Certificates ‘PCs’
3.14 The General Meeting can create PC capital and increase said capital, or authorise the Board of Directors to take decisions to this effect. The PCs are bearer certificates and have a nominal value. The issuing terms are to be fixed by the Board of Directors. The Company can at any time exchange Genussscheine for PCs. PCs confer the same entitlement in respect of the available earnings and liquidation proceeds as to the Shares. PCs do not have voting rights. Subscription rights of PCs are governed by general meeting resolutions. Notice of general meeting must be communicated to PC holders no later than 20 days before the date of the meeting in a notice published once in a journal.
Subscription Rights
3.15 In the event of new equity securities being issued the subscription rights of shareholders, Genussscheine holders and PC holders are as follows: If PC capital is being created for the first time, shareholders and Genussscheine holders have subscription rights pro rata to the total number of Shares or Genussscheine they already possess. If the share capital alone is increased, holders of all categories of securities have proportionate subscription rights. If the PC capital alone or the number of Genussscheine alone is increased, holders of all categories of securities have proportionate subscription rights. If the share capital and PC capital are increased simultaneously and in the same proportion, the shareholders subscription rights relate solely to Shares and those of the PC and Genussscheine holders, solely to PCs.
General Meetings
3.16 The General Meeting is convened by the Board of Directors. The meeting is published by two successive notices in journals designated for this purpose. The first notice must be given at the latest 20 days before the day of the general meeting. Shareholders representing Shares with a nominal value of CHF 1,000,000 can request inclusion of items in the agenda until 60 days before the General Meeting. Shareholders wishing to attend a General Meeting must deposit their Shares, at the latest five days before the day of the meeting at depositaries to be designated by the Board of Directors. At the General Meeting each Share carries one vote. Extraordinary General Meetings are held when the Board of Directors or the Auditors regard them as necessary, when one or more Shareholder holding one-tenth of the share capital requests a Meeting by a written application or if a general meeting so requires.
3.17 The Articles of Incorporation can generally be amended by a resolution in General Meeting passed by an absolute majority of the votes represented. For certain matters, including the restriction of subscription rights, a resolution of shareholders passed with at least two thirds of the votes represented and the absolute majority of the nominal value of Shares represented is required.
Dividends
3.18 From the available earnings remaining after deduction of all expenses, interest payable, losses, provisions and general legal reserve (up to 5% of net earnings), an amount corresponding to a dividend of 5% of the share capital shall be initially distributed to the Shareholders. An amount equal to that paid on Shares must be paid simultaneously on the Genussscheine and an amount be paid on PCs in proportion to their nominal value compared to Shares. The remaining amount is to be distributed by General Meeting but have to be allotted equally to the Shares, and to the Genussscheine, and an amount in proportion to their nominal value compared to Shares must be paid on PCs. Holders of Shares and Genussscheine on the third SIX Swiss Exchange trading day after the AGM each year are entitled to dividend payment. The entitlement to dividends which have not been drawn within five years of maturity lapses.
4. MANDATORY BID RULES
4.1 According to the Swiss Federal Act on Stock Exchanges and Securities Trading (Bundesgesetz über die Börsen und den Effektenhandel), persons who, directly, indirectly or in concert with third parties acquire more than 33⅓% of the voting rights (whether exercisable or not) in the Company have to make a takeover bid to the remaining shareholders. An exemption from the mandatory bid rules may be granted by the FBC or, within limits, by the Swiss Takeover Board. If no exemption is granted, the mandatory takeover bid must be made pursuant to the procedural rules set out in the Swiss Stock Exchange Act and the implementing ordinances enacted thereunder, within two months after the threshold of 33⅓% of voting rights is first exceeded. A

Page 145
mandatory takeover bid has not been triggered by the shareholders’ group with pooled voting rights who hold together more than 50% of the share capital of the Company (see section 7 below) because the acquisition was made prior to the mandatory bid rules coming into force.
5. DIRECTORS’ AND MEMBERS’ OF THE EXECUTIVE COMMITTEE INTERESTS
5.1 Share Capital
The interests in the share capital of the Company of the Directors and members of the Executive Committee (all of which, unless otherwise stated, are beneficial) as at 31 December 2008, as notified to the Company, is as shown in the tables below.
There have been no material changes to the holdings set out in table below since 31 December 2008.
Directors:
Name: Number of Bearer Shares F.B. Humer 3 B. Gehrig 50 A. Hoffmann -* P. Baschera 1 J.I. Bell 300 P. Brabeck-Letmathe 800 L.J.R. de Vink - W. Frey 72,500 D.A. Julius 350 A. Oeri 90,000* W. Ruttenstorfer 1,000 H. Teltschik 385 B. Weder di Mauro 200 Total* 165,589 * not including any shares held by a shareholders’ group with pooled voting rights, comprising Ms Vera Michalski-Hoffmann, Ms Maja Hoffmann, Mr André Hoffmann, Dr Andreas Oeri, Ms Sabine Duschmalé-Oeri, Ms Catherine Oeri, Ms Beatrice Oeri and Ms Maja Oeri, and collectively holding 80,020,000 shares (= 50.01% of issued shares). On 28 January 2009 the pool members announced that, effective 1 April 2009, Ms Beatrice Oeri would leave the pool and that Mr Jörg Duschmalé and Mr Lukas Duschmalé would join the pool. The group would continue to hold a total 80,020,000 shares with pooled voting rights as previously.
Members of the Executive Committee:
Name: Number of Bearer Shares
S. Schwan 3
S. Ayyoubi 3
W.M. Burns 3
E. Hunziker 3
G.A. Keller 1,063
J.K.C. Knowles 3
J. Schwiezer 3
Total 1,081

Page 146
5.2 Stock Options / Stock-settled Stock Appreciation Rights
At 31 December 2008 the Chairman of the Board of Directors9 and the members of the Executive Committee held options (S-SARs; first introduced on 1 January 2005) as shown in the table below. There have been no material changes to these holdings of the current members of the Executive Committee since 31 December 2008.
All of the options shown in the table were issued by Roche as employee stock options. Each option entitles the holder to purchase one Genussschein.
Under the terms of this multi-year option plan, the strike price of the options shown was the closing price for Genussscheine on the last day of trading prior to the Roche Annual Media Conference. All of the options shown are non-tradable. One-third of the options are subject to a vesting period of one year, one-third have a vesting period of two years, and one-third a vesting period of three years. Unvested options lapse without compensation if employment is terminated voluntarily (for reasons other than retirement), while vested options must be exercised within a limited period of time. The fair value of the options is calculated at the date of issue using the Black-Scholes formula and as if the options were tradable, with an 11% deduction for the average two-year vesting period. The S-SARs shown in the table above were introduced by Roche on 1 January 2005 in place of stock options. S-SARs entitle holders to benefit financially from any increase in the value of Genussscheine between the grant date and the exercise date. The strike price for S-SARs under the terms of this multi-year plan was the closing price for Genussscheine on the first day of trading after the Roche Annual Media Conference. All S-SARs vest within three years of the grant date: i.e. one-third vest at the end of one year, one-third at the end of two years, and one-third at the end of three years. Vested S-SARs must be exercised (converted into Genussscheine) within seven years of the grant date, and unexercised S-SARs lapse without compensation. The fair value of the options is calculated at the date of issue using the Black–Scholes formula and as if the options were tradable, with an 11% deduction for the average two-year vesting period. The strike prices, expiry dates and grant values for options and S-SARs are shown in the table below. The number of options and S-SARs as calculated at the time of issue have been entered as values in the table “Remuneration of members of the Executive Committee, B. Stock options/Stock-settled Stock Appreciation Rights” on page 156.
Stock Options and S-SARs
Number of Stock Options and S-SARs held by current and former Members of the Executive Committee on31 December 2008 (S-SARs first issued in 2005)
Year of Issue 20081) 20071) 20061) 20051) 20042) 20032) 20022) Total Number 494,097 236,859 159,807 174,288 105,398 24,377 1,900 Strike Price in CHF 195,80 229.60 195 123 129.50 77.80 115.50 Expiry Date 31.1.2015 8.2.2014 2.2.2013 3.2.2012 3.2.2011 25.2.2010 26.2.2009 Grant Value per Option and (starting in 2005) per S-SAR in CHF (Black-Scholes Value minus 11%) 21,08 36.59 34.02 20.89 31.92 16.27 30.10 1) S-SARs 2) Stock options
6. DIRECTORS’ AND MEMBERS OF THE EXECUTIVE COMMITTEES’ TERMS OF EMPLOYMENT
6.1 The Directors and the members of the Executive Committee and their functions are set out in Part 4 - “Directors, Executive Committee and Corporate Governance”.
6.2 None of the Directors or members of the Executive Committee have service contracts with Roche or any of its subsidiaries provides for benefits upon termination of employment.
9 As of 2008 Franz B. Humer did not receive any additional S-SARs.
Page 147
6.3 There is no arrangement under which any Director or member of the Executive Committee has waived or agreed to waive future emoluments nor has there been any waiver of emoluments during the financial year immediately preceding the date of this Prospectus.
6.4 The Directors and Executive Committee Members are or have been directors or partners of the following companies, partnerships, associations and foundations at any time in the previous five years (not including directorships with Group companies):
Directors/Executive Committee Members
Company/Partnership Position Currently held?
Franz B. Humer Swiss Business Federation
Vice-Chairman -
European Federation of Pharmaceutical Industries Association
Chairman -
Diageo Plc Non-Executive Chairman
Allianz SE Supervisory Board Member
Cadbury Schweppes Public Limited Company
Directorship -
Zurich Financial Services Directorship -
Allied Zurich p.l.c Directorship -
JPMorgan International Council
Member
International Business Leaders’ Advisory Council for the Mayor of Shanghai
Member
Salzburg University Board Member
Friends of Phelophepa Foundation, Switzerland
Chairman
International Advisory Board of the National Center for Missing and Exploited Children
Member
European Round Table of Industrialists (ERT)
Member
EU-Russia Industrialists Round Table (IRT) Council
Member -
Humer Stiftung Chairman
INSEAD Chairman
Bruno Gehrig Swiss National Bank Board Member -
Swiss Life Holding Chairman of the Board of Directors
-
Kartause Ittingen, Canton of Thurgau, Switzerland
Member of the Board of Trustees
Swiss Air Transport Foundation
Chairman of the Board of Trustees

Page 148
Directors/Executive Committee Members
Company/Partnership Position Currently held?
UBS AG Member of the Board of Directors
Foundation Antidoping Schweiz
Member of the Board of Trustees
Pius Baschera Hilti Corporation Chairman
Vorwerk, Wuppertal Member of Advisory Board
Ardex GmbH, Witten Member of Advisory Board
Venture Incubator AG, Zug
Chairman of the Board of Directors
Schindler Holding AG, Hergiswil
Member of the Board of Directors
John Irving Bell Wellcome Trust Centre for Human Genetics
Founder
Oxford Centre for Diabetes, Endocrinology and Metabolism
Chairman of the Partnership Board
Trials and Epidemiology Building, Oxford
Chairman
Academy of Medical Sciences, UK
President
Peter Brabeck-Letmathe Nestlé S.A. CEO and Chairman of the Board of Directors
Alcon Inc. Vice-Chairman -
Cereal Partners Worldwide
Co-Chairman of the Supervisory Board
Credit Suisse Group Member of the Board of Directors
Dreyer’s Grand Ice Cream Holdings, Inc. (US)
Vice Chairman of the Board of Directors
-
L’Oréal S.A., France Vice Chairman
World Economic Forum, Switzerland
Member of the Foundation Board
European Roundtable of Industrialists (ERT)
Member
Foundation for the International Federation of Red Cross and Red Crescent Societies
Member of the Foundation Board
-
Lodewijk J.R. de Vink Alcon Inc. Board Member
Blackstone Healthcare Partners, LLC
Founding member and consultant
National Foundation for Board Member -

Page 149
Directors/Executive Committee Members
Company/Partnership Position Currently held?
Infectious Diseases
United Negro College Fund
Board Member -
Nijenrode University Board Member -
The National Actors Theater
Board Member -
Sotheby’s International Advisory Board
Member
European Advisory Council, Rothschild & Cie.
Member
International Health Care Partners
Chairman -
Flamel Technologies Board Member
Stiefel Laboratories Inc. Board Member
Walter Frey Allianz Suisse Board Member
Emil Frey Group Chairman and CEO
ZLE Betriebs AG President of the Board
Rhomberg Bau AG Board Member
Rhomberg Bahntechnik AG
Board Member
Zumtobel Staff AG Board Member -
economiesuisse Board Member
André Hoffmann Givaudan Ltd., Vernier (Geneva)
Vice-Chairman
Glyndebourne Productions Ltd., Lewes, UK
Board Member
Brunswick Leasing Ltd., Moscow, Russia
Board Member
Nemadi Advisors Ltd., London
Chairman
Living Planet Fund Management Co, Luxembourg
Chairman
Amazentis SA, Lausanne, Switzerland
Board Member
MedAssurant Inc., USA Board Memeber
WWF International, Gland, Switzerland
Vice President
Fondation les Corbillettes – Agir pour les personnes en situation de handicap mental, Geneva,
Board Member

Page 150
Directors/Executive Committee Members
Company/Partnership Position Currently held?
Switzerland
IRP, Institut International de Recherche en Paraplégie, Geneva, Switzerland
Board Member
Stiftung Patronatskomitee Kunstmuseum Basel, Switzerland
Founding Member
Roche Research Foundation, Basel, Switzerland
Board Member
Tate Gallery, London, UK
International Council Member
Fondation Pro Valat, Basel, Switzerland
Chairman of the Board
Fondation Tour du Valat, Arle, Frances
Vice Chairman of the Board
Takh, “Association pour le Cheval de Przewalski”, Arles, France
Board Member
FIBA, Fondation Internationale du Banc d’Arguin, Nouakchott, Mauritanie
President
International Institute for Strategic Studies, London, UK
Member of the Executive Committee
Oxford University; Oxford, UK
Member of the Court of Benefactors
Paul Sacher Stiftung, Basel, Switzerland
Member of the Executive Committee
Fondation du grand Théâtre de Genéve
Member of the Foundation Board
-
Fondation Dr Henri Dubois-Ferrière Dinu Lipatti, Geneva, Switzerland
Member of the Foundation Board
Global Footprint Network, Oakland, USA
Board Member
Fondation Harafi, Morges, Switzerland
President
Fondation MAVA, Basel, Switzerland
Treasurer
Chatham House Panel of Senior Advisors, London, UK
Member
ISIS International Sustainability Innovation
Member

Page 151
Directors/Executive Committee Members
Company/Partnership Position Currently held?
Council of Switzerland
Peace Parks Foundation, Stellenbosch, South Africa
Board Member
DeAnne Julius BP Non-Executive Director
Court of Bank of England Member -
Lloyds TSB Bank Non-Executive Director -
Royal Institute of International Affairs
Chairman
Serco Group Non-Executive Director -
Society of Business Economists
Vice President
Jones Lang LaSalle Inc. Non-Executive Member of the Board of Directors
Andreas Oeri - -
Wolfgang Ruttenstorfer OMV Chief Executive Officer and Chairman of the Executive Board
Horst Teltschik BMW Foundation Herbert Quandt
Chairman -
Boeing Germany President -
BMW for Central and Eastern Europe, Asia and Middle East
Representative of the Board of Management
-
German-Japanese Dialogue Forum
Member -
German-Indian Consultative Group
Member -
Munich Conference on Security Policy
Chairman
German-Chinese Steering Committee for Infrastructure Projects
Chairman -
University Council of the Munich Academy of Arts
Member -
Society of the Munich Philharmonic Orchestra
President -
German-Israelian Business Society (DIW)
President -
International Advisory Board of the Council on Foreign Relations, New York
Member
Senat of the "Deutsche Nationalstiftung"
Member
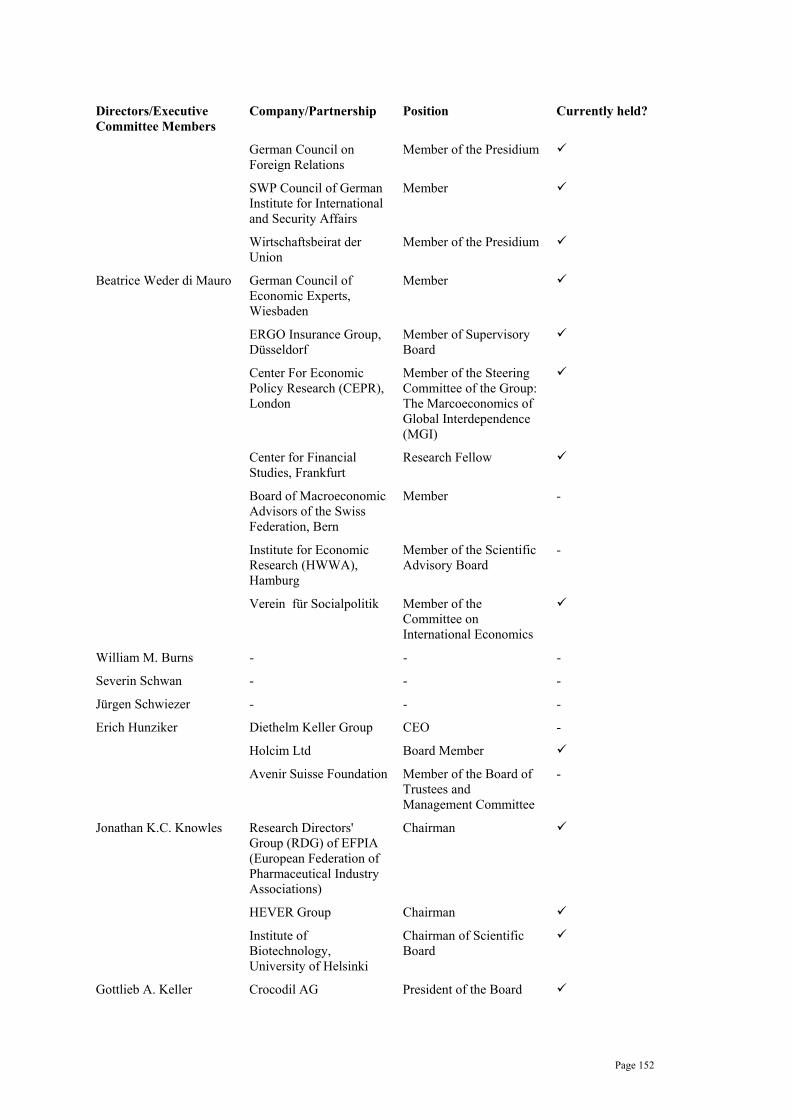
Page 152
Directors/Executive Committee Members
Company/Partnership Position Currently held?
German Council on Foreign Relations
Member of the Presidium
SWP Council of German Institute for International and Security Affairs
Member
Wirtschaftsbeirat der Union
Member of the Presidium
Beatrice Weder di Mauro German Council of Economic Experts, Wiesbaden
Member
ERGO Insurance Group, Düsseldorf
Member of Supervisory Board
Center For Economic Policy Research (CEPR), London
Member of the Steering Committee of the Group: The Marcoeconomics of Global Interdependence (MGI)
Center for Financial Studies, Frankfurt
Research Fellow
Board of Macroeconomic Advisors of the Swiss Federation, Bern
Member -
Institute for Economic Research (HWWA), Hamburg
Member of the Scientific Advisory Board
-
Verein für Socialpolitik Member of the Committee on International Economics
William M. Burns - - -
Severin Schwan - - -
Jürgen Schwiezer - - -
Erich Hunziker Diethelm Keller Group CEO -
Holcim Ltd Board Member
Avenir Suisse Foundation Member of the Board of Trustees and Management Committee
-
Jonathan K.C. Knowles Research Directors' Group (RDG) of EFPIA (European Federation of Pharmaceutical Industry Associations)
Chairman
HEVER Group Chairman
Institute of Biotechnology, University of Helsinki
Chairman of Scientific Board
Gottlieb A. Keller Crocodil AG President of the Board

Page 153
Directors/Executive Committee Members
Company/Partnership Position Currently held?
Basilea Pharmaceutica AG
Board Member
VSUD Committee Member
Chamber of Commerce Germany-Switzerland
Member of the Chairman’s Committee
International School of the Basel Region AG
Board Member
Fritz Gerber Foundation for talented young people and Paul Sacher Foundation
Member of the Board of Trustees
SGCI Chemie Pharma Schweiz
Board Member
economiesuisse Board Member
Humer Foundation Member of the Board of Trustees
Burkhard G. Piper - - -
Per-Olof Attinger - - -
Silvia Ayyoubi - - -
Dr. Pascal Soriot - - -
Osamu Nagayama Chugai Pharmaceuticals Ltd
Chairman of the Board of Directors, President and CEO
6.5 No member of the administrative or management bodies and the senior management of Roche has any convictions in relation to fraudulent offences within the previous five years.
6.6 Within the previous five years, no member of the administrative or management bodies and the senior management of Roche has been associated as members of the administrative, management or supervisory bodies, partners with unlimited liability or, in the case of a limited partnership, with a share capital, founders and the senior management of an issuer with any bankruptcies, receiverships or liquidations.
6.7 No member of the administrative or management bodies and the senior management of Roche has, within the previous five years, received any official public incrimination and/or sanctions by any statutory or regulatory authorities (including designated professional bodies) and have not been disqualified by a court from acting as a member of the administrative, management or supervisory bodies of an issuer or from acting in the management or conduct of the affairs of any issuer within the previous five years.
7. REMUNERATION OF THE DIRECTORS AND MEMBERS OF THE EXECUTIVE COMMITTEE
Remuneration of Members of the Board of Directors
7.1 In 2008 the members of the Board of Directors of Roche Holding Ltd received the remuneration shown in the table set out below for serving on the Board: Remuneration 2008
(in CHF) Additional Compensation
2008 for Committee Members/Chairs1 (in CHF)
Other Compensation 2008 (in CHF)
F.B. Humer (refer to the table below)
50,000 (Remuneration as CEO until 4 March 2008 and Chairman of the Board
of Directors, refer to

Page 154
the table below)
B. Gehrig 408,8712 - -
A. Hoffmann 400,0003 - -
P. Baschera 300,000 30,000 -
J.I. Bell 300,000 30,000 -
P. Brabeck-Letmathe 300,000 - -
L.J.R. de Vink 300,000 30,000 -
W. Frey 300,000 60,000 -
D.A. Julius 300,000 60,000 -
A. Oeri 300,000 60,000 -
W. Ruttenstorfer 300,000 30,000 -
H. Teltschik 300,000 60,000 31,023
B. Weder di Mauro 300,000 60,000 -
Total 3,808,871 470,000
1) With the exception of members of the Presidium and the Vice-Chairmen, Board members receive CHF 30,000 per committee membership/year and CHF 60,000 per committee chair/year. The Chairman of the Board received CHF 50,000.
2) Remuneration for serving as Independent Lead Director until 4 March 2008 and Vice-Chairman of the Board.
3) Renumeration for serving as Vice-Chairman of the Board.
Remuneration and additional compensation paid to non-executive members of the Board of Directors for serving in the aforementioned capacities totalled 4,278,871 Swiss francs in 2008 (previous year: 4,163,488 Swiss francs).
Franz. B. Humer as the Chairman was the Member of Board with the highest total remuneration for 2008. The Chairman’s remuneration consists of base salary and bonus awards. As Chairman of the Board after the handover of his excutive function as CEO at the Annual General Meeting on 4 March 2008 he will not receive any additional S-SARs or Genussscheine from new Performance Share Plan (PSP) cycles and will no be longer be enrolled in any Roche stock option plan or S-SARs. His salary was as shown in the table below, which includes his remuneration as CEO until 4 March 2008 and in addition the possible future values of PSP awards received in the past as CEO (subject to changes in allocations and computations relating to the three-year Performance Share Plan (PSP) period 2007-2009).
Total remuneration of Franz B. Humer as Chairman of the Board of Directors
2008(in CHF)
Cash payments (salary and bonus) 11,030,0004
S-SARs None
Performance Share Plan1 (2006-2008, 2007-2009)2 Total 918,613
Pension funds/MGB3 2,955,697
Roche Connect 64,585
Total (value) 15,228,9515 1) Franz B. Humer does not take part in the PSP 2008-2010.
2) PSP 2006-2008: 75% of the originally targeted Genussscheine awarded (75% of 10,365 NES, for 2006-2008, spread over the relevant period or time, i.e. 1/3 for the year 2008, value calculated using the year-end price as of 31 December 2008, CHF 162,50 per non-voting equity security). PSP 2007-2009: Estimated value calculated using the year-end price as of 31 December 2008, CHF 162,50 per Genussschein, based on a number of NES originally targeted (9,185 Genussscheine) subject to changes in the number and value of Genussscheine

Page 155
awardable under the plan on 31 December 2009 and spread over the relevant period of time, i.e. 1/3 for the year 2008. The Board of Directors will vote on the actual allocation of Genussscheine originally targeted on 31 December 2009 according to the TSR achieved.
3) MGB: Stiftung der F. Hoffmann-La Roche AG für Mitarbeiter-Gewinnbeteiligung (employee profit-sharing foundation supplementing occupational pension benefits).
4) The cash payments include the compensation in the amount of CHF 50,000 for serving as Chairman of the Board of Directors.
5) Includes an annual espense allowance, payments for tax consulting services, remuneration for serving on the Chugai Board, not including employer contribution to AHV/IV/ALV (CHF 1,520,754).
7.2 The non-executive members of the Board of Directors were not awarded any Shares, Genussscheine, Stock-settled Stock Appreciation Rights (S-SARs) or stock options in 2008 and, as of 31 December 2008, held no unvested options awarded in previous years.
7.3 Horst Teltschik received honoraria (including expenses) amounting to 19,635 euros (31,023 Swiss francs) for serving on the boards of several Roche subsidiaries in Germany.
7.4 Otherwise, no additional remuneration was paid to members of the Board of Directors for serving on the Board of Directors.
Remuneration of Members of the Executive Committee
7.5 The Remuneration Committee decides on the remuneration of the members of the Executive Committee (cash payments, bonus, stock options, S-SARs and (approving in principle) pension fund benefits) and the Board of Directors upon proposal of the Remuneration Committee decides on the Performance Share Plan (PSP). The compensation components of the S-SARs and the PSP plan are intended to align compensation with the long-term success of the company.
7.6 In 2008 the members of the Executive Committee received the salaries, bonuses, stock options/Stock-settled Stock Appreciation Rights (S-SARs) and Genussscheine as shown in the following tables. Members of the Executive Committee additionally receive annual expense allowances of 30,000 Swiss francs. In 2008 the members of the Executive Committee in total received expense allowances totalling 210,000 Swiss francs.
7.7 After stepped down as CEO at the 2008 Annual General Meeting on 4 March 2008, Chairman of the Board Franz B. Humer has not received any additional S-SARs or Genussscheine from new Performance Share Plan (PSP) cycles. From the start of 2008 he will no longer be enrolled in any Roche stock option plan or the PSP. His remuneration will consist of his base salary and bonus awards.
A. Cash Payments (in CHF)
Annual salary 2008
Annual salary 2007
Annual salary 2006
Bonus for 2008
Bonus for 2007
Bonus for 2006
S. Schwan 2,283,340 1,100,000 762,500 3,000,000 2,500,000 1,000,000
S. Ayyoubi
481,670 * * 500,000 * *
W. M. Burns
2,000,000 2,000,000 1,875,000 2,500,000 2,500,000 2,000,000
E. Hunziker
2,000,000 2,000,000 1,900,000 2,200,000 2,200,000 2,000,000
G. A. Keller
1,350,000 900,000 850,000 1,000,000 1,000,000 500,000
J. K. C. Knowles
1,350,000 1,350,000 1,325,000 308,900 1,000,000 800,000
S. Schwiezer
1,200,000 * * 1,000,000 * *
Total 10,665,010 10,508,000* Not a Member of the Executive Committee.

Page 156
B. Stock options / Stock-settled Stock Appreciation Rights (S-SARs)
S-SARs1)
2008 (value in CHF2 )
S-SARs1)
2007 (value in CHF2 )
S-SARs1) 2006
(value in CHF2 )
S. Schwan 2,225,542 1,068,062 533,978
S. Ayyoubi 445,146 * *
W. M. Burns 2,225,542 1,780,140 889,963
E. Hunziker 1,958,480 1,780,140 889,963
G. A. Keller 1,335,313 890,125 533,978
J. K. C. Knowles 1,335,313 890,125 533,978
J. Schwiezer 890,229 * *
Total 10,415,565
* Not a Member of the Executive Committee.
1) Refer to ‘Stock options/Stock-settled Stock Appreciation Rights (S-SARs)’.
2) Black-Scholes valuation as described in section ‘Stock options/Stock-settled Stock Appreciation Rights (S-SARs)’ on pages 146 above.
C. Performance Share Plan (PSP)
7.8 The members of the Executive Committee and other members of senior management (some 117 individuals worldwide) participate in the Performance Share Plan (PSP).
7.9 In 2006 the PSP moved to overlapping three-year performance cycles, with a new cycle beginning each year. In 2008 there were thus three cycles in progress (PSP 2006-2008, PSP 2007-2009 and PSP 2008-2010); the PSP 2006-2008 ended on 31 December 2008. Under the provisions of this plan, a number of Genussscheine have been reserved for the participants in each cycle. The number of securities actually awarded will depend on whether and to what extent an investment in Roche securities (shares and Genussscheine) outperforms the average return on an investment in securities issued by a peer set of comparator companies (Peer set for 2008: Abbott Laboratories, Amgen, Astellas, AstraZeneca, Bayer, Beckton, Dickinson, Biogen Idec, Bristol-Myers Squibb, Eli Lilly, Gilead, GlaxoSmithKline, Johnson & Johnson, Merck & Co., Novartis, Pfizer, Sanofi-Aventis, Schering-Plough, Takeda, Wyeth). Comparisons are based on the securities’ market prices and dividend yields, i.e. on Total Shareholder Return (TSR). To reduce the effect of any short-term market fluctuations, security prices are averaged over the three months (October to December) prior to the start of a performance cycle and over the three months (October to December) at the end of the cycle. If Roche securities perform as well as or better than those of 75% of the peer set and, in addition, Roche’s TSR increases at least 10% during a cycle, the Board of Directors can elect to increase the maximum Genussscheine award by as much as two-fold. In the event that an investment in Roche securities underperforms the average return delivered by the peer companies, fewer or no Genussscheine will be awarded. In 2008 Genussscheine were reserved under the plan for members of the Executive Committee as shown in the table below. The Board of Directors will decide on the actual level of Genussscheine or cash-equivalent awards for the cycles 2007-2009 and 2008-2010 after the close of the 2009 and 2010 financial years, respectively. The aim of the PSP is to provide an incentive to participants to achieve steady value growth.
7.10 Over the six years since the PSP was established in 2002, Roche securities (Shares and Genussscheine), including dividend yields, have almost doubled in value, out performing nine-fold the 11% value growth delivered by a peer set of major pharmaceuticals and diagnostics companies.
7.11 At the end of two years and one year, respectively, of the PSP 2005-2007 and PSP 2006-2008 performance cycles (both based on a three-month moving average at constant exchange rates) Roche ranked 2 and 10 compared with its peer set of 19 companies operating in the same industry.
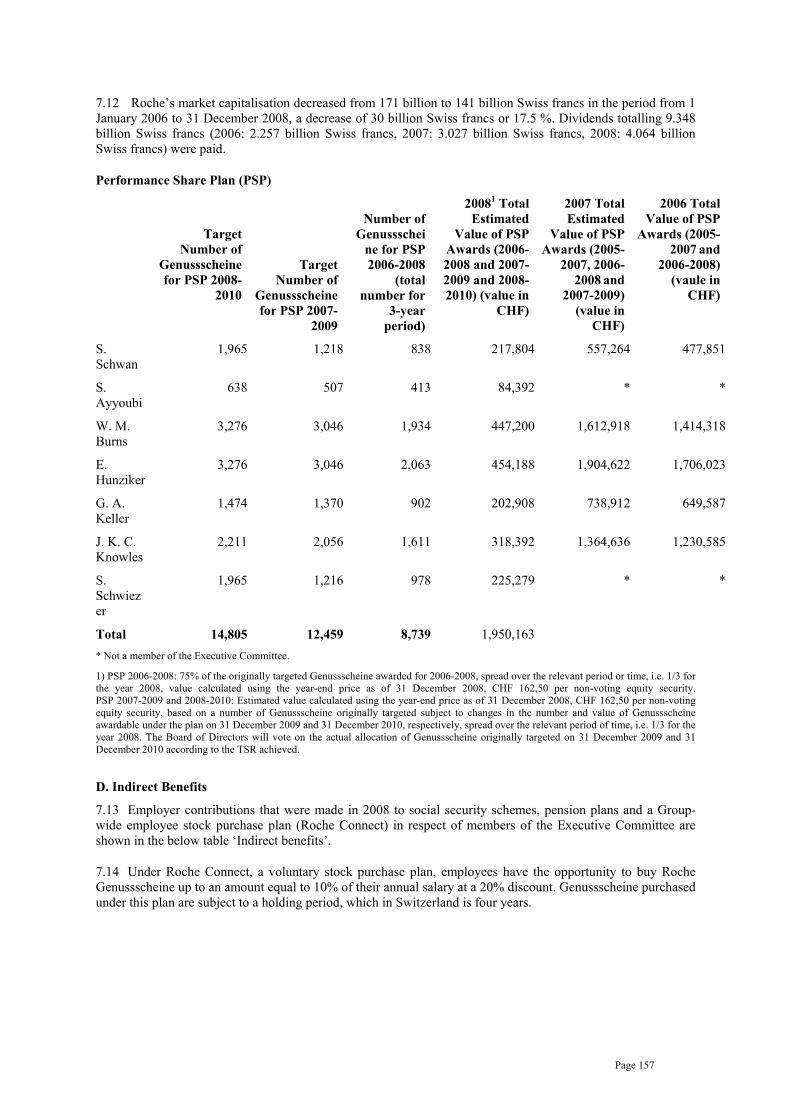
Page 157
7.12 Roche’s market capitalisation decreased from 171 billion to 141 billion Swiss francs in the period from 1 January 2006 to 31 December 2008, a decrease of 30 billion Swiss francs or 17.5 %. Dividends totalling 9.348 billion Swiss francs (2006: 2.257 billion Swiss francs, 2007: 3.027 billion Swiss francs, 2008: 4.064 billion Swiss francs) were paid.
Performance Share Plan (PSP)
Target Number of
Genussscheine for PSP 2008-
2010
Target Number of
Genussscheine for PSP 2007-
2009
Number of Genussschei
ne for PSP 2006-2008
(total number for
3-year period)
20081 Total Estimated
Value of PSP Awards (2006-2008 and 2007-2009 and 2008-2010) (value in
CHF)
2007 Total Estimated
Value of PSP Awards (2005-
2007, 2006-2008 and
2007-2009) (value in
CHF)
2006 Total Value of PSP
Awards (2005-2007 and
2006-2008) (vaule in
CHF)
S. Schwan
1,965 1,218 838 217,804 557,264 477,851
S. Ayyoubi
638 507 413 84,392 * *
W. M. Burns
3,276 3,046 1,934 447,200 1,612,918 1,414,318
E. Hunziker
3,276 3,046 2,063 454,188 1,904,622 1,706,023
G. A. Keller
1,474 1,370 902 202,908 738,912 649,587
J. K. C. Knowles
2,211 2,056 1,611 318,392 1,364,636 1,230,585
S. Schwiezer
1,965 1,216 978 225,279 * *
Total 14,805 12,459 8,739 1,950,163* Not a member of the Executive Committee.
1) PSP 2006-2008: 75% of the originally targeted Genussscheine awarded for 2006-2008, spread over the relevant period or time, i.e. 1/3 for the year 2008, value calculated using the year-end price as of 31 December 2008, CHF 162,50 per non-voting equity security. PSP 2007-2009 and 2008-2010: Estimated value calculated using the year-end price as of 31 December 2008, CHF 162,50 per non-voting equity security, based on a number of Genussscheine originally targeted subject to changes in the number and value of Genussscheine awardable under the plan on 31 December 2009 and 31 December 2010, respectively, spread over the relevant period of time, i.e. 1/3 for the year 2008. The Board of Directors will vote on the actual allocation of Genussscheine originally targeted on 31 December 2009 and 31 December 2010 according to the TSR achieved.
D. Indirect Benefits
7.13 Employer contributions that were made in 2008 to social security schemes, pension plans and a Group-wide employee stock purchase plan (Roche Connect) in respect of members of the Executive Committee are shown in the below table ‘Indirect benefits’.
7.14 Under Roche Connect, a voluntary stock purchase plan, employees have the opportunity to buy Roche Genussscheine up to an amount equal to 10% of their annual salary at a 20% discount. Genussscheine purchased under this plan are subject to a holding period, which in Switzerland is four years.

Page 158
Indirect Benefits in 2008
Pension Funds/MGB(1)
(in CHF) AHV/IV/ALV(2)
(in CHF)Roche Connect
(in CHF)
Payments for tax consulting services
(in CHF)
S. Schwan 202,320 287,106 48,956 10,921
S. Ayyoubi 318,373 87,099 1,125 1,990
W. M. Burns 37,064 389,459 30,000 18,012
E. Hunziker 605,482 409,100 49,992 8,799
G. A. Keller 364,489 216,141 31,250 -
J. K. C. Knowles 728,401 321,641 22,500 31,376
J. Schwiezer 166,223 66,465 7,600 6,682
Total 2,422,352 1,777,011 191,423 77,7801) MGB: Stiftung der F. Hoffmann-La Roche AG für Mitarbeiter-Gewinnbeteiligung (employee profit-sharing foundation supplementing occupational pension benefits). 2) AHV/IV/ALV: Swiss social security programmes providing retirement, disability and unemployment benefits.
E. Other Remuneration, Emoluments and Loans to Corporate Officers
7.15 Pensions totalling 2,043,896 Swiss francs were paid to two former Executive Committee members.
7.16 In 2008 Erich Hunziker, William M. Burns and Jonathan K.C. Knowles received in total USD 62,500 (67,500 Swiss francs) for serving on the Chugai Board. Erich Hunziker, William M. Burns and Jonathan K.C. Knowles are on the Genentech Board but have declined remuneration for serving in this capacity.
7.17 Otherwise, no additional remuneration was paid to current or former members of the Executive Committee.
F. Pensions
7.22 Roche contributed CHF 7,155,060 to provide pension and retirement benefits for members of the Executive Committee and to Franz B. Humer. Members of the Board do not receive any payments in respect of pensions and retirement benefits, other than Franz B. Humer, who receives them in his capacity as Chief Executive Officer until 3 March 2008. 8. SHAREHOLDINGS
Major Shareholders
8.1 The Swiss Stock Exchange Act requires that persons who, directly, indirectly or in concert with third parties, acquire or dispose of Shares and thereby reach, exceed or fall below the thresholds of 5%, 10%, 20%, 33 1/3%, 50%, or 66 2/3% of the voting rights in the Company notify the Company and SIX Swiss Exchange of such acquisition or disposal in writing within four trading days, whether or not the voting rights can be exercised. Following receipt of such notification, the Company must inform the public within two trading days. An additional disclosure obligation exists under Swiss company law pursuant to which the Company must disclose the identity and size of shareholdings of all of its shareholders and shareholder groups acting in concert who hold more than 5% of the voting rights. This disclosure must be made once a year in the notes to the financial statements as published in the Company’s annual report.
8.2 In so far as is known to the Directors, they are aware of the following major shareholders whose shareholdings represent directly or indirectly, 5 per cent. or more of the issued share capital of the Company on 31 December 2008 (the latest practicable date prior to publication of this Prospectus):
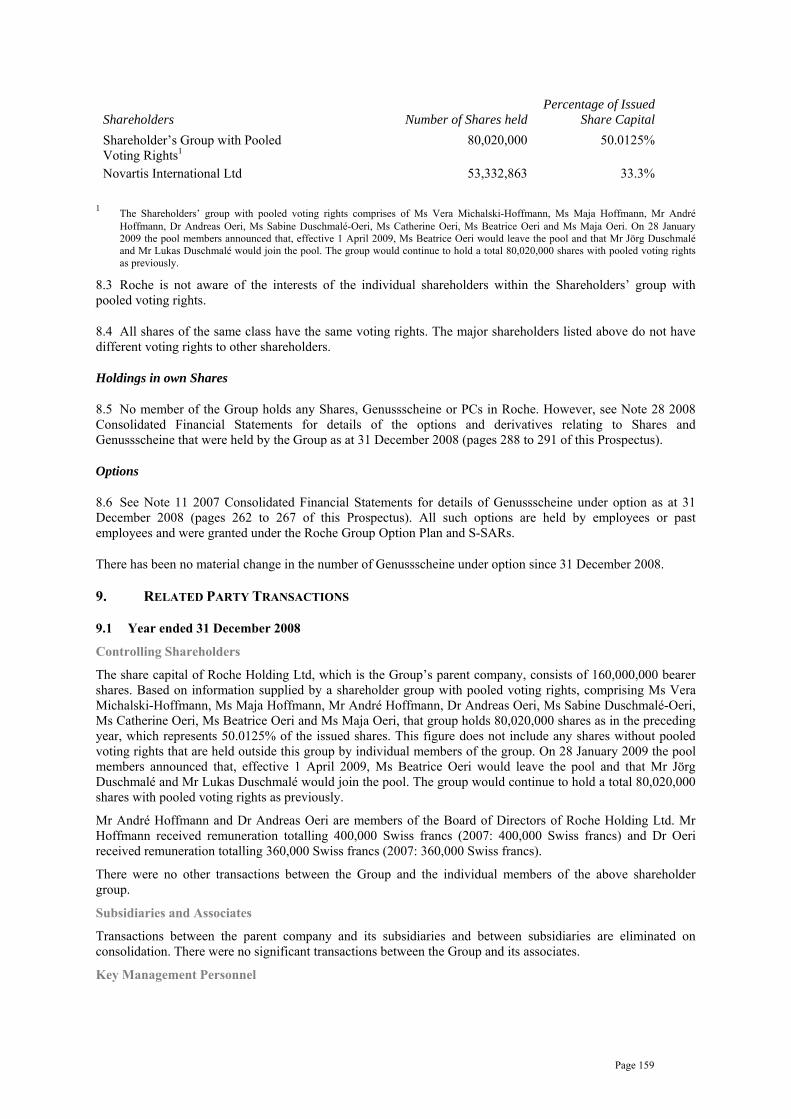
Page 159
Shareholders Number of Shares held Percentage of Issued
Share Capital Shareholder’s Group with Pooled Voting Rights1
80,020,000 50.0125%
Novartis International Ltd 53,332,863 33.3%
1 The Shareholders’ group with pooled voting rights comprises of Ms Vera Michalski-Hoffmann, Ms Maja Hoffmann, Mr André Hoffmann, Dr Andreas Oeri, Ms Sabine Duschmalé-Oeri, Ms Catherine Oeri, Ms Beatrice Oeri and Ms Maja Oeri. On 28 January 2009 the pool members announced that, effective 1 April 2009, Ms Beatrice Oeri would leave the pool and that Mr Jörg Duschmalé and Mr Lukas Duschmalé would join the pool. The group would continue to hold a total 80,020,000 shares with pooled voting rights as previously.
8.3 Roche is not aware of the interests of the individual shareholders within the Shareholders’ group with pooled voting rights.
8.4 All shares of the same class have the same voting rights. The major shareholders listed above do not have different voting rights to other shareholders.
Holdings in own Shares
8.5 No member of the Group holds any Shares, Genussscheine or PCs in Roche. However, see Note 28 2008 Consolidated Financial Statements for details of the options and derivatives relating to Shares and Genussscheine that were held by the Group as at 31 December 2008 (pages 288 to 291 of this Prospectus).
Options
8.6 See Note 11 2007 Consolidated Financial Statements for details of Genussscheine under option as at 31 December 2008 (pages 262 to 267 of this Prospectus). All such options are held by employees or past employees and were granted under the Roche Group Option Plan and S-SARs.
There has been no material change in the number of Genussscheine under option since 31 December 2008.
9. RELATED PARTY TRANSACTIONS
9.1 Year ended 31 December 2008
Controlling Shareholders
The share capital of Roche Holding Ltd, which is the Group’s parent company, consists of 160,000,000 bearer shares. Based on information supplied by a shareholder group with pooled voting rights, comprising Ms Vera Michalski-Hoffmann, Ms Maja Hoffmann, Mr André Hoffmann, Dr Andreas Oeri, Ms Sabine Duschmalé-Oeri, Ms Catherine Oeri, Ms Beatrice Oeri and Ms Maja Oeri, that group holds 80,020,000 shares as in the preceding year, which represents 50.0125% of the issued shares. This figure does not include any shares without pooled voting rights that are held outside this group by individual members of the group. On 28 January 2009 the pool members announced that, effective 1 April 2009, Ms Beatrice Oeri would leave the pool and that Mr Jörg Duschmalé and Mr Lukas Duschmalé would join the pool. The group would continue to hold a total 80,020,000 shares with pooled voting rights as previously.
Mr André Hoffmann and Dr Andreas Oeri are members of the Board of Directors of Roche Holding Ltd. Mr Hoffmann received remuneration totalling 400,000 Swiss francs (2007: 400,000 Swiss francs) and Dr Oeri received remuneration totalling 360,000 Swiss francs (2007: 360,000 Swiss francs).
There were no other transactions between the Group and the individual members of the above shareholder group.
Subsidiaries and Associates
Transactions between the parent company and its subsidiaries and between subsidiaries are eliminated on consolidation. There were no significant transactions between the Group and its associates.
Key Management Personnel

Page 160
Members of the Board of Directors of Roche Holding Ltd receive an annual remuneration and payment for their time and expenses related to their membership of Board committees. Total remuneration of the Board of Directors, excluding the Chairman, in 2008 totalled 4 million Swiss francs (2007: 4 million Swiss francs).
9.2 Year ended 31 December 2007
Controlling Shareholders
The share capital of Roche Holding Ltd, which is the Group’s parent company, consists of 160,000,000 bearer shares. Based on information supplied by a shareholder group with pooled voting rights, comprising Ms Vera Michalski-Hoffmann, Ms Maja Hoffmann, Mr André Hoffmann, Dr Andreas Oeri, Ms Sabine Duschmalé-Oeri, Ms Catherine Oeri, Ms Beatrice Oeri and Ms Maja Oeri, that group holds 80,020,000 shares as in the preceding year, which represents 50.0125% of the issued shares. This figure does not include any shares without pooled voting rights that are held outside this group by individual members of the group.
Mr André Hoffmann and Dr Andreas Oeri are members of the Board of Directors of Roche Holding Ltd and in this capacity each received an annual remuneration of 300,000 Swiss francs in both 2007 and 2006. Since 28 February 2006, Mr Hoffmann has been a Vice-Chairman of the Board of Directors and in 2007 he received 100,000 Swiss francs in this capacity (2006: 83,333 Swiss francs). Dr Oeri is Chairman of the Corporate Governance and Sustainability Committee and in 2007 received 60,000 Swiss francs for his time and expenses in this capacity (2006: 10,000 Swiss francs).
There were no other transactions between the Group and the individual members of the above shareholder group.
Subsidiaries and Associated Companies
A listing of the major Group subsidiaries and associated companies is included in Note 35. Transactions between the parent company and its subsidiaries and between subsidiaries are eliminated on consolidation. There were no significant transactions between the Group and its associated companies.
Key Management Personnel
Members of the Board of Directors of Roche Holding Ltd receive an annual remuneration and payment for their time and expenses related to their membership of Board committees. Total remuneration of the Board of Directors in 2007 totalled 5 million Swiss francs (2006: 4 million Swiss francs).
9.3 Year ended 31 December 2006
Controlling Shareholders
The share capital of Roche Holding Ltd, which is the Group's parent company, consists of 160,000,000 bearer shares. Based on information supplied by a shareholder group with pooled voting rights, comprising Ms Vera Michalski-Hoffmann, Ms Maja Hoffmann, Mr Andre Hoffmann, Dr Andreas Oeri, Ms Sabine Duschmale-Oeri, Ms Catherine Oeri, Ms Beatrice Oeri and Ms Maja Oeri, that group holds 80,020,000 shares as in the preceding year, which represents 50.0125% of the issued shares. This figure does not include any shares without pooled voting rights that are held outside this group by individual members of the group.
Mr Andre Hoffmann and Dr Andreas Oeri are members of the Board of Directors of Roche Holding Ltd and in this capacity each receive an annual remuneration of 300,000 Swiss francs. Since 28 February 2006, Mr Hoffmann is a Vice-Chairman of the Board, and in 2006 he received a further 83,333 Swiss francs in this capacity. Dr Oeri is Chairman of the Corporate Governance and Sustainability Committee and receives 10,000 Swiss francs for his time and expenses in this capacity.
There were no other transactions between the Group and the individual members of the above shareholder group.
Subsidiary and Associated Companies
Transactions between the parent company and its subsidiaries and between subsidiaries are eliminated on consolidation. There were no significant transactions between the Group and its associated companies.
Key Management Personnel
Members of the Board of Directors of Roche Holding Ltd receive an annual remuneration and payment for their time and expenses related to their membership of Board committees.
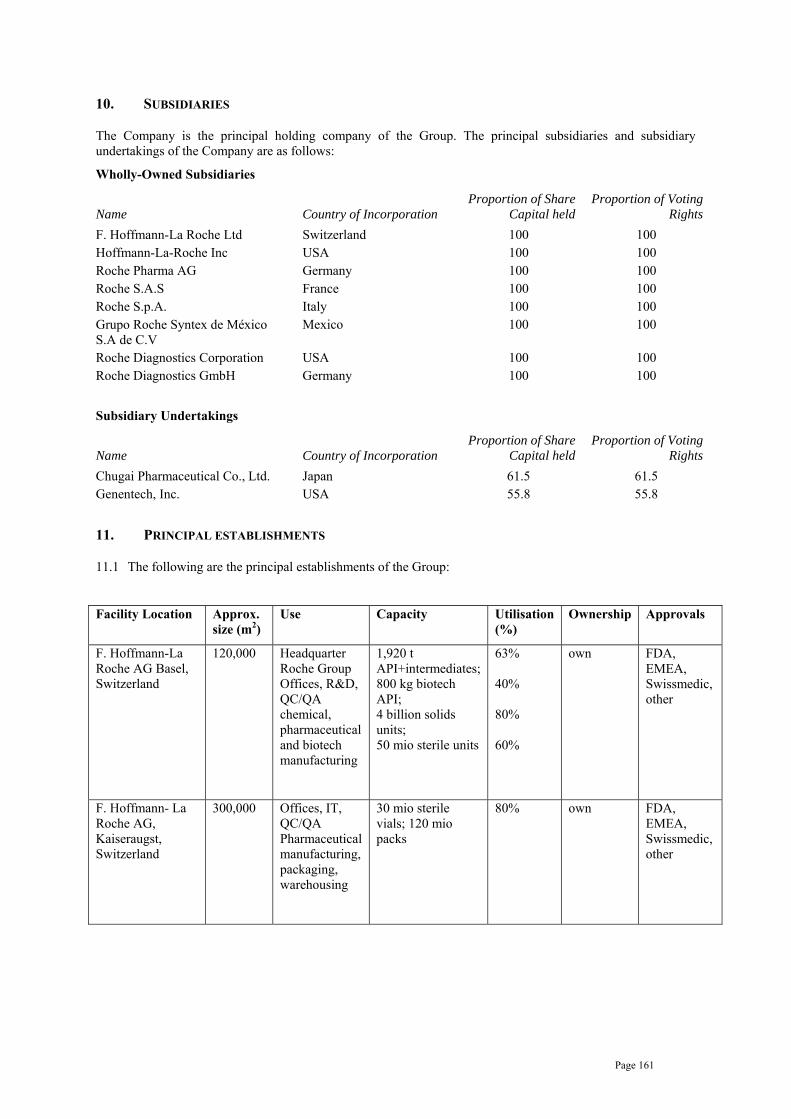
Page 161
10. SUBSIDIARIES
The Company is the principal holding company of the Group. The principal subsidiaries and subsidiary undertakings of the Company are as follows:
Wholly-Owned Subsidiaries
Name Country of Incorporation Proportion of Share
Capital held Proportion of Voting
Rights F. Hoffmann-La Roche Ltd Switzerland 100 100 Hoffmann-La-Roche Inc USA 100 100 Roche Pharma AG Germany 100 100 Roche S.A.S France 100 100 Roche S.p.A. Italy 100 100 Grupo Roche Syntex de México S.A de C.V
Mexico 100 100
Roche Diagnostics Corporation USA 100 100 Roche Diagnostics GmbH Germany 100 100
Subsidiary Undertakings
Name Country of Incorporation Proportion of Share
Capital held Proportion of Voting
Rights Chugai Pharmaceutical Co., Ltd. Japan 61.5 61.5 Genentech, Inc. USA 55.8 55.8
11. PRINCIPAL ESTABLISHMENTS
11.1 The following are the principal establishments of the Group:
Facility Location Approx. size (m2)
Use Capacity Utilisation(%)
Ownership Approvals
F. Hoffmann-La Roche AG Basel, Switzerland
120,000 Headquarter Roche Group Offices, R&D, QC/QA chemical, pharmaceutical and biotech manufacturing
1,920 t API+intermediates; 800 kg biotech API; 4 billion solids units; 50 mio sterile units
63% 40% 80% 60%
own FDA, EMEA, Swissmedic, other
F. Hoffmann- La Roche AG, Kaiseraugst, Switzerland
300,000 Offices, IT, QC/QA Pharmaceutical manufacturing, packaging, warehousing
30 mio sterile vials; 120 mio packs
80% own FDA, EMEA, Swissmedic, other

Page 162
Facility Location Approx. size (m2)
Use Capacity Utilisation(%)
Ownership Approvals
Roche Diagnostics GmbH, Mannheim, Germany
460,000 Offices, R&D, QC/QA Chemical – pharmaceutical – Diagnostics manufacturing, packaging, warehousing
12,300t API+intermediates14.1 mio vials/ 20 mio syringes 3.6 billion teststrips, 15.6 mio reagents
70% own FDA, EMEA, other
Roche Diagnostics GmbH, Penzberg, Germany
352,000 Offices, R&D, QC/QA Biotech – Pharmaceutical – Diagnostics manufacturing
950kg API 2.5 mio units 25 mio bottles
83% 80% 80%
own FDA, EMEA, other
Hoffmann-La Roche Inc., Nutley NJ, USA
514,000 Offices, R&D, QC/QA Pharmaceutical manufacturing, packaging, warehousing
1 billion tablets/capsules 30 mio packs
50% 50%
own FDA, EMEA, JFDA, other
Roche Carolina Inc., Florence SC, USA
5,870,000 Chemical development and manufacturing, QC/QA
650 t API 70% own FDA, EMEA, JFDA, other
Roche Diagnostics Corp.,Indianapolis, IN, USA
607,035 Offices, R&D Diagnostics manufacturing, packaging, warehousing
2.5 billion reagent tests (CD) 1,835 Lots (AS) 3.5 billion teststrips (DC)
70% 75% 85%
own FDA
Roche Molecular Systems Inc. Branchburg NJ, USA
46,000 Diagnostics manufacturing, packaging, warehousing, QC/QA
1.8 mio packages 70% own FDA, EPA,OSHA
Roche Colorado Corp., Boulder, CO, USA
76,890 Chemical development and manufacturing, QC/QA
125 t of different API’s and intermediates
55% own FDA, EMEA, JFDA, other
Roche S.p.A. Segrate, Milan, Italy
82,300 Offices, IT, QC/QA Pharmaceutical manufacturing, packaging, warehousing
Pharma: 3 billion units Packaging: 60 mio packs
70% own EMEA, FDA, other

Page 163
Facility Location Approx. size (m2)
Use Capacity Utilisation(%)
Ownership Approvals
Roche Ireland Ltd. Clarecastle, Ireland
360,000 Chemical manufacturing, QC/QA
680 t API + Intermediates
51% own FDA, EMEA, JFDA, other
Disetronic Medical Systems AG Burgdorf, Switzerland
16,300 Diagnostics manufacturing, packaging, warehousing, QC/QA
90k insulin pumps & sterile products
57% own FDA, SwissMedix, ISO 13485, ISO 9001
Roche Diagnostics Graz GmbH, Austria
13,000 Diagnostics manufacturing, packaging, warehousing, QC/QA
3,500 Instruments
180k Sensors
720k packs Reagnats
75%
85%
90%
own FDA, EMEA, ISO 13485, ISO 9001, JFDA
Roche Diagnostics AG, Rotkreuz, Switzerland
79,250 Diagnostics manufacturing, packaging, warehousing, QC/QA
79,300 reagant kits
473,700 vials
6,200 Instruments
<50%
80%
own EMEA, IVD
FDA, EMEA, IVD
Shanghai Roche Pharmaceutical Ltd., Shanghai, China
70,000 Pharmaceutical manufacturing, packaging, warehousing, QC/QA
200 tons low-potent solids
70 tons high-potent solids
10 mio vials of Rocephin
2 mio vials of WFI (sterile liquids)
ca 70% Joint venture (70% Roche/ 30% Sunve)
Chinese FDA,
EMEA-approval for WFI targeted for end 2007
Ventana Medical Systems, Inc., Tucson, Arizona (USA)
32,500 Headquarters Roche Tissue Diagnostics – Business Area Offices, R&D, QC/QA instrument and reagent manufacturing
Instruments 730 units
Reagents 78,000 kits
60% (6 days; 2 shift)
60% (6 days; 2 shift)
own FDA, TUV
GNE South San Francisco, CA, USA
n/a Headquarter GNE, Offices, R&D, QC/QA, pharmaceutical and biotech manufacturing
1,000 kg API
10 mio sterile units and packs
n/a GNE FDA, EMEA
GNE Oceanside, CA, USA
260,000 Offices, R&D, QC/QA, and biotech manufacturing
1,100 kg API n/a GNE FDA, EMEA
GNE Vacaville, CA, USA
400,000 Offices, QC/QA, and biotech manufacturing
2,200 kg API n/a GNE FDA, EMEA

Page 164
Facility Location Approx. size (m2)
Use Capacity Utilisation(%)
Ownership Approvals
GNE Hillsboro, OR, USA
300,000 Pharmaceutical manufacturing, packaging, warehousing, QC/QA
20 mio sterile units and packs from 2010 on
n/a GNE Under construction
GNE, Tuas, Singapore
n/a Offices, R&D, QC/QA, and biotech manufacturing
950 kg API from 2010 on
n/a n/a Under construction
Environmental Issues
11.2 At the time there are no known environmental issues that would affect Roche’s utilisation of the assets / properties other than Roche’s general obligation to comply with all applicable regulations.
11.3 The Group has provisions for environmental remediation costs, which at 31 December 2008 total 161 million Swiss francs. They include various separate environmental issues in a number of countries. The Group estimates that approximately 28% of the amount provided for may result in cash outflows over the next three years (see Note 25 of the 2008 Consolidated Financial Statements, page 279 to 28477 of this Prospectus).
11.4 The material components of the environmental provisions consist of costs to fully clean and refurbish contaminated sites and to treat and contain contamination at certain other sites. Future remediation expenses are affected by a number of uncertainties that include, but are not limited to, the detection of previously unknown contaminated sites, the method and extent of remediation, the percentage of waste material attributable to the Group at the remediation sites relative to that attributable to other parties, and the financial capabilities of the other potentially responsible parties.
11.5 Management believes that the total provisions for environmental matters are adequate based upon currently available information. However, given the inherent difficulties in estimating liabilities in this area, it cannot be guaranteed that additional costs will not be incurred beyond the amounts accrued. The effect of resolution of environmental matters on the results of operations cannot be predicted due to uncertainty concerning both the amount and the timing of future expenditures. Such changes that arise could impact the provisions recognised in the balance sheet in future periods.
12. DIVIDENDS
12.1 The dividends paid by Roche in the last three years is as follows: 2008: CHF 5,00, 2007: CHF 4.60 and 2006: 3.40. Roche intends to continue raising the dividend payout ratio over the next three years.
12.2 The Shareholders decide on the payment of dividends, if any, on a year-by-year basis. Holders of Shares and Genussscheine on the third SIX Swiss Exchange trading day after the AGM each year are entitled to dividend payment.
12.3 There are no specific procedures for the payment of dividends to foreign shareholders. Such shareholders have to contact the paying agent (UBS AG, Wertschriften Services, Bahnhofstrasse 45, 8001 Zürich) directly, or through their custody bank.
13. TAXATION
Federal Withholding Tax
13.1 Dividend payments and similar cash or in-kind distributions as well as the payment of liquidation proceeds of any kind made by the Company to a holder of a Genussscheine are subject to Swiss federal withholding tax (Verrechnungssteuer) at a rate of 35% (the “Withholding Tax”).
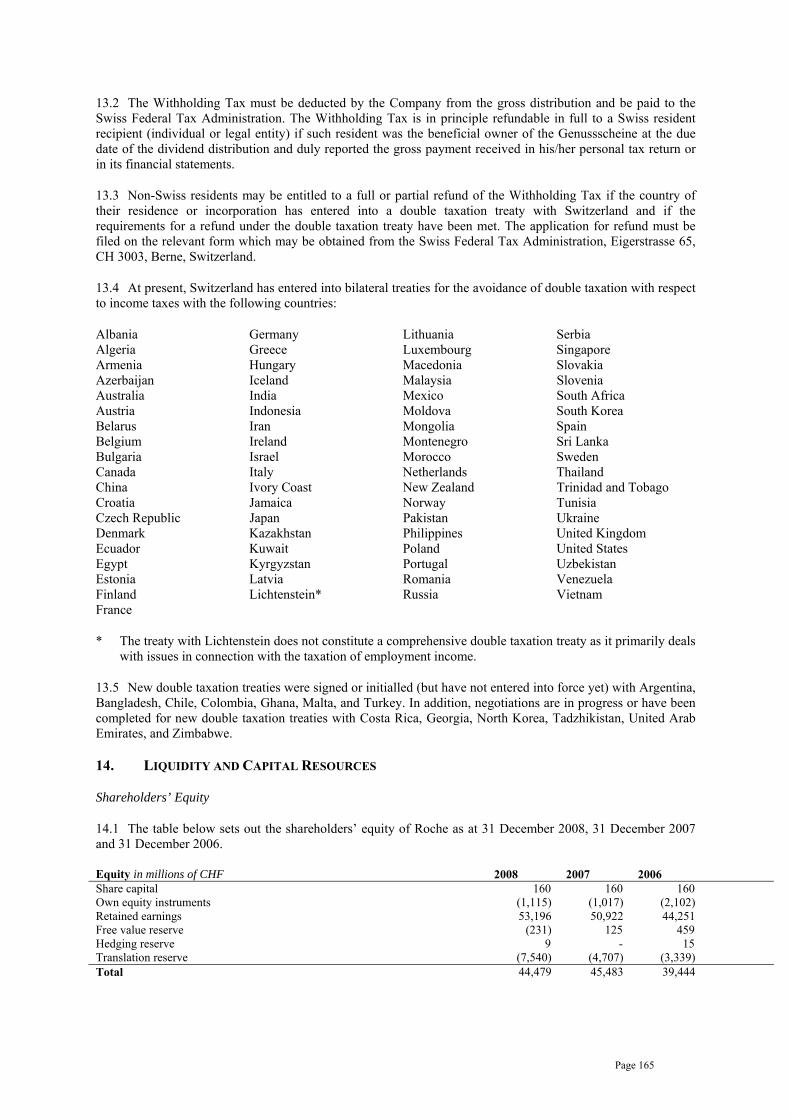
Page 165
13.2 The Withholding Tax must be deducted by the Company from the gross distribution and be paid to the Swiss Federal Tax Administration. The Withholding Tax is in principle refundable in full to a Swiss resident recipient (individual or legal entity) if such resident was the beneficial owner of the Genussscheine at the due date of the dividend distribution and duly reported the gross payment received in his/her personal tax return or in its financial statements.
13.3 Non-Swiss residents may be entitled to a full or partial refund of the Withholding Tax if the country of their residence or incorporation has entered into a double taxation treaty with Switzerland and if the requirements for a refund under the double taxation treaty have been met. The application for refund must be filed on the relevant form which may be obtained from the Swiss Federal Tax Administration, Eigerstrasse 65, CH 3003, Berne, Switzerland.
13.4 At present, Switzerland has entered into bilateral treaties for the avoidance of double taxation with respect to income taxes with the following countries:
Albania Germany Lithuania Serbia Algeria Greece Luxembourg Singapore Armenia Hungary Macedonia Slovakia Azerbaijan Iceland Malaysia Slovenia Australia India Mexico South Africa Austria Indonesia Moldova South Korea Belarus Iran Mongolia Spain Belgium Ireland Montenegro Sri Lanka Bulgaria Israel Morocco Sweden Canada Italy Netherlands Thailand China Ivory Coast New Zealand Trinidad and Tobago Croatia Jamaica Norway Tunisia Czech Republic Japan Pakistan Ukraine Denmark Kazakhstan Philippines United Kingdom Ecuador Kuwait Poland United States Egypt Kyrgyzstan Portugal Uzbekistan Estonia Latvia Romania Venezuela Finland Lichtenstein* Russia Vietnam France
* The treaty with Lichtenstein does not constitute a comprehensive double taxation treaty as it primarily deals with issues in connection with the taxation of employment income.
13.5 New double taxation treaties were signed or initialled (but have not entered into force yet) with Argentina, Bangladesh, Chile, Colombia, Ghana, Malta, and Turkey. In addition, negotiations are in progress or have been completed for new double taxation treaties with Costa Rica, Georgia, North Korea, Tadzhikistan, United Arab Emirates, and Zimbabwe.
14. LIQUIDITY AND CAPITAL RESOURCES
Shareholders’ Equity
14.1 The table below sets out the shareholders’ equity of Roche as at 31 December 2008, 31 December 2007 and 31 December 2006.
Equity in millions of CHF 2008 2007 2006 Share capital 160 160 160 Own equity instruments (1,115) (1,017) (2,102) Retained earnings 53,196 50,922 44,251 Free value reserve (231) 125 459 Hedging reserve 9 - 15 Translation reserve (7,540) (4,707) (3,339) Total 44,479 45,483 39,444

Page 166
Capital Resources
14.2 The Group maintains sufficient reserves of cash and readily realisable marketable securities to meet its liquidity requirements at all times. The two tables below set out Roche’s reserves of cash and marketable securities as at 31 December 2008, 31 December 2007 and 31 December 2006:
Marketable Securities
Marketable Securities in millions of CHF
2008 2007 2006Financial Assets at Fair-Value-through-Profit-or-Loss Held-for-Trading Investments – Bonds and Debentures 1,027 1,129 783Designated as Fair-Value-through-Profit-or-Loss – Bonds and Debentures - 78 82– Money Market Instruments and Time Accounts over three months
- 167 161
– Other Investments - 178 62Total Financial Assets at Fair-Value-through-Profit-or-Loss 1,027 1,552 1,088 Available-for-Sale Financial Assets – Shares 51 292 876– Bonds and Debentures 6,814 7,624 6,533– Money Market Instruments and Time Accounts over three months
7,961 10,965 12,624
– Other Investments 3 14 -Total Available-for-Sale Financial Assets 14,829 18,895 20,033 Total Marketable Securities 15,856 20,447 21,121
Marketable securities are held for fund management purposes and are classified as current. They are primarily denominated in Swiss francs, euros and US dollars. Other investments held for strategic purposes are classified as non-current (see Note 16 of the 2008 Consolidated Financial Statements, page 275 of this Prospectus).
Shares: These consist primarily of readily saleable equity securities.
Bonds and Debentures in millions of CHF
2008 2007 2006
Contracted Maturity Amount
Average Effective Interest
Rate Amount
Average Effective Interest
Rate Amount
Average Effective Interest
RateWithin one year 2,612 5,81% 2,367 5.05% 2,087 4.32%Between one and five years 4,178 5,81% 5,690 4.89% 4,552 4.55%More than five years 1,051 5,35% 774 5.40% 759 4.33%Total Bonds and Debentures 7,841 5,75% 8,831 4.98% 7,398 4.46%
Money Market Instruments: These generally have fixed interest rates ranging from 0.05% to 5.50% (2007: 0.72% to 6.13%) depending upon the currency in which they are denominated. They are contracted to mature within one year of 31 December 2008.
Cash and Cash Equivalents
Cash and Cash Equivalents in millions of CHF 2008 2007 2006Cash – Cash in Hand and in Current or Call Accounts 1,999 2,792 1,662Cash Equivalents – Time Accounts with a Maturity of three months or less 2,916 963 1,548Total Cash and Cash Equivalents 4,915 3,755 3,210
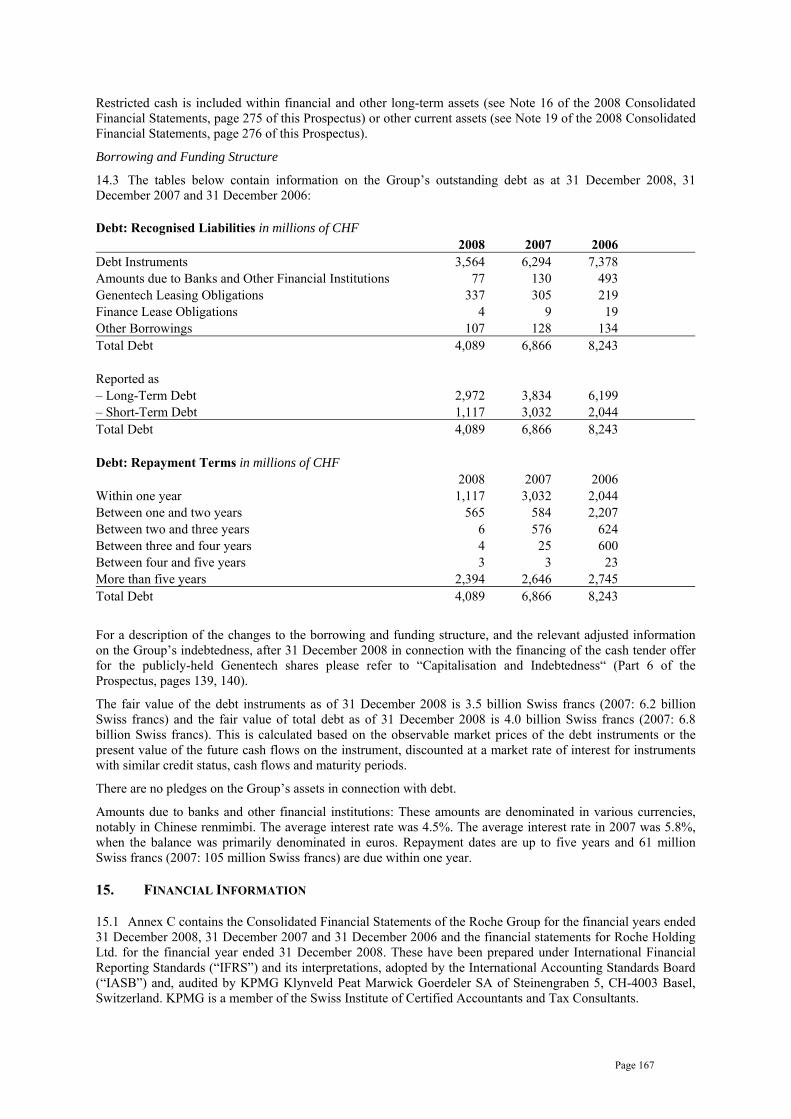
Page 167
Restricted cash is included within financial and other long-term assets (see Note 16 of the 2008 Consolidated Financial Statements, page 275 of this Prospectus) or other current assets (see Note 19 of the 2008 Consolidated Financial Statements, page 276 of this Prospectus).
Borrowing and Funding Structure
14.3 The tables below contain information on the Group’s outstanding debt as at 31 December 2008, 31 December 2007 and 31 December 2006:
Debt: Recognised Liabilities in millions of CHF 2008 2007 2006Debt Instruments 3,564 6,294 7,378Amounts due to Banks and Other Financial Institutions 77 130 493Genentech Leasing Obligations 337 305 219Finance Lease Obligations 4 9 19Other Borrowings 107 128 134Total Debt 4,089 6,866 8,243 Reported as – Long-Term Debt 2,972 3,834 6,199– Short-Term Debt 1,117 3,032 2,044Total Debt 4,089 6,866 8,243 Debt: Repayment Terms in millions of CHF 2008 2007 2006Within one year 1,117 3,032 2,044Between one and two years 565 584 2,207Between two and three years 6 576 624Between three and four years 4 25 600Between four and five years 3 3 23More than five years 2,394 2,646 2,745Total Debt 4,089 6,866 8,243
For a description of the changes to the borrowing and funding structure, and the relevant adjusted information on the Group’s indebtedness, after 31 December 2008 in connection with the financing of the cash tender offer for the publicly-held Genentech shares please refer to “Capitalisation and Indebtedness“ (Part 6 of the Prospectus, pages 139, 140).
The fair value of the debt instruments as of 31 December 2008 is 3.5 billion Swiss francs (2007: 6.2 billion Swiss francs) and the fair value of total debt as of 31 December 2008 is 4.0 billion Swiss francs (2007: 6.8 billion Swiss francs). This is calculated based on the observable market prices of the debt instruments or the present value of the future cash flows on the instrument, discounted at a market rate of interest for instruments with similar credit status, cash flows and maturity periods.
There are no pledges on the Group’s assets in connection with debt.
Amounts due to banks and other financial institutions: These amounts are denominated in various currencies, notably in Chinese renmimbi. The average interest rate was 4.5%. The average interest rate in 2007 was 5.8%, when the balance was primarily denominated in euros. Repayment dates are up to five years and 61 million Swiss francs (2007: 105 million Swiss francs) are due within one year.
15. FINANCIAL INFORMATION
15.1 Annex C contains the Consolidated Financial Statements of the Roche Group for the financial years ended 31 December 2008, 31 December 2007 and 31 December 2006 and the financial statements for Roche Holding Ltd. for the financial year ended 31 December 2008. These have been prepared under International Financial Reporting Standards (“IFRS”) and its interpretations, adopted by the International Accounting Standards Board (“IASB”) and, audited by KPMG Klynveld Peat Marwick Goerdeler SA of Steinengraben 5, CH-4003 Basel, Switzerland. KPMG is a member of the Swiss Institute of Certified Accountants and Tax Consultants.

Page 168
15.2 In 2004, there was a formal audit tender process, led by the Audit and Corporate Governance Committee. Following this process, KPMG was appointed as auditors for Roche.
15.3 The financial information contained in Annex C and in this Prospectus is as reported at the date the relevant financial statements were published. Please note that there have been a number of changes in IFRS and Roche’s accounting policies from 2006 to 2008. Changes in accounting policies that arise from the application of new or revised standards and interpretations are applied retrospectively, unless otherwise specified in the transitional requirements of the particular standard or interpretation. Retrospective application requires that the results of the comparative period and the opening balances of that period are restated as if the new accounting policy had always been applied. In addition comparatives have been reclassified or extended from the previously reported results to take into account presentational changes. IFRS requires some changes to be applied prospectively. Accordingly, the financial information contained in a particular year’s financial statements may not be fully comparable with the financial information contained in an earlier or later year’s financial statements due to changes in IFRS and Roche’s accounting policies. In particular, the financial information for 2006 has been restated in the 2007 financial statements and the financial information for 2007 has been restated in the 2008 financial statements. See Note 1 to the 2008 Consolidated Financial Statements (pages 222 to 234 of this Prospectus), Note 1 to the 2007 Consolidated Financial Statements (pages 332 to 344 of this Prospectus) and Note 1 to the 2006 Consolidated Financial Statements (pages 417 to 429 of this Prospectus) for a summary of significant accounting policies applied to the 2008, 2007 and 2006 Consolidated Financial Statements and for details of restatements of prior periods.
15.4 Percentages in tables have been rounded and accordingly may not add up to 100 per cent. Certain financial data has been rounded. As a result of this rounding, the totals of data presented in this Prospectus may vary slightly from the actual arithmetic totals of such data.
15.5 KPMG has given and not withdrawn their written consent to the inclusion of the 2008, 2007 and 2006 financial statements in Annex C of this Prospectus, in the form and context in which it appears.
16. WORKING CAPITAL
The Roche Holding AG is of the opinion that, taking into account available bank and other facilities, the Group has sufficient working capital for its present requirements, that is, for at least the next 12 months from the date of this Prospectus.
17. SIGNIFICANT CHANGES
Subsequent Event:
On 25 February 2009, Roche completed an offering of U.S. dollar-denominated notes to qualified institutional buyers in the United States under Rule 144 A and to persons other than U.S. persons outside the United States under Regulation S of the U.S. Securities Act of 1933 (as amended). Roche received approximately U.S. $16,263.7 million in aggregate net proceeds from the issuance and sale of these notes.
On 4 March 2009, Roche issued Euro and Sterling-denominated notes under a European Medium Term Note (EMTN) programme. Roche received approximately CHF 18,643.6 million (EUR 11,176.7 million and GBP 1,237.5 million) in aggregate net proceeds from the issuance and sale of these floating- and fixed-rate notes.
On 20 March 2009, Roche completed a further offering of U.S. dollar-denominated notes under Rule 144A of the U.S. Securities Act of 1933. Roche received approximately USD 2,499.8 million in aggregate net proceeds from the issuance and sale of these fixed-rate notes.
The notes above are obligations of Roche Holdings, Inc., a wholly-owned subsidiary of Roche Holding Ltd, the ultimate parent company of the Roche Group and the guarantor of the notes.
On 23 March 2009, Roche Kapitalmarkt AG and Roche Holdings, Inc. completed an offering of Swiss franc-denominated bonds and notes guaranteed by Roche Holding Ltd. Roche received approximately CHF 7,960 million in aggregate net proceeds from the issuance and sale of these fixed-rate bonds and notes.
As of 26 March 2009 Roche Holdings, Inc. has a nominal amount of USD 3,250 million of commercial paper outstanding under its USD 7.5 billion U.S. commercial paper program. Roche received approximately USD 3,248.4 million in aggregate amount net proceeds from the issuance and sale of these commercial paper.

Page 169
The net proceeds of the above-mentioned offerings has been used to finance a portion of the tender offer for the remaining publicly-held shares of common stock of Genentech Inc.
The acquisition of all public shares, including shares issuable under Genentech's outstanding employee stock options and payment of related fees and expenses, costs approximately USD 46.8 billion. The Group has financed the transaction by a combination of the Group's own funds, commercial paper back-stopped by a credit facility, and debt securities,.
For a description of the relevant adjusted information on the Group’s indebtedness, after 31 December 2008 in connection with the financing of the cash tender offer for the publicly-held Genentech shares please refer to “Capitalisation and Indebtedness“ (Part 6 of the Prospectus, pages 139, 140).
Except for the above, there has been no significant change in the financial or trading position of the Group since 31 December 2008, the date to which the last audited annual Consolidated Financial Statements of the Company were prepared.
18. EXPENSES
The expenses relating to the offer under the Connect, professional fees and expenses and the costs of printing and distribution of documents are estimated to amount to CHF 200,000 and are payable by the Company.
19. PASSPORTING
The Company will request the German Federal Financial Supervisory Authority (Bundesanstalt für Finanzdienstleistungsaufsicht) (“BaFin”) to provide the competent authorities in Austria, Belgium, the Czech Republic, Denmark, Finland, Greece, Italy, the Netherlands, Norway, Poland, Portugal, Spain, Sweden and the United Kingdom with a certificate of approval attesting that the Prospectus has been drawn up in accordance with the German Securities Prospectus Act (Wertpapierprospektgesetz) (“WpPG”) which implements the Prospectus Directive into German law (the “Notification”). The Company may request BaFin to provide competent authorities in additional host member states of the EEA with such Notification.
20. SELLING RESTRICTIONS
The offer of Genussscheine and the right to purchase Genussscheine under the Connect Plan that is being made by this Prospectus, is only being made to Employees of Participating Companies in Germany and in those EEA Member States where the Bundesanstalt für Finanzdienstleistungsaufsicht has sent a notification to the relevant competent authority under Article 18 of the Prospectus Directive (2003/71/EC). Presently, it is expected that such EEA Member States will be Austria, Belgium, the Czech Republic, Denmark, Finland, Greece, Italy, the Netherlands, Norway, Poland, Portugal, Spain, Sweden and the United Kingdom. No offer is being made by this Prospectus to any other persons in any other jurisdiction.
21. INFORMATION NOT CONTAINED IN THIS PROSPECTUS
No person has been authorised to give any information or make any representation other than those contained in this Prospectus and, if given or made, such information or representation must not be relied upon as having been so authorised.
22. STATEMENTS REGARDING PRODUCT SALES AND COMPETITIVE POSITION
22.1 Roche operates in markets in which it is difficult in certain cases to obtain precise market, economic and industry information. Subject to paragraph 22.2 below, the market, economic and industry data in this Prospectus about Roche and the Group constitutes Roche’s estimates, using underlying data from various industry sources where appropriate. Where market, economic and industry data is derived from industry and other independent sources, the publications in which they are contained generally state that the information they contain has been obtained from sources believed to be reliable, but that the accuracy and completeness of such information is not guaranteed.
22.2 Where information contained in this Prospectus has been sourced from third parties such as IMS Health Incorporated, the Company confirms that such information has been accurately reproduced and, as far as the Company is able to ascertain from information published by such third parties, no facts have been omitted which would render the reproduced information inaccurate or misleading.
Page 170
22.3 Roche believes that, based on data provided by IMS Health Incorporated and/or data published by pharmaceutical companies, it is market leader in the areas of oncology, transplantation, hepatitis C virus (HCV) treatment, it is a leading specialty company and that it is the leader in biotechnology.
22.4 Sales information in this Prospectus that relates to specific products or product areas has not been audited and has been extracted from Roche’s internal accounting systems and records.
23. LEGAL AND ARBITRATION PROCEEDINGS
Except as described below, Roche is not, and has not been in the previous 12 months, subject to any governmental, legal or arbitration proceedings, including any such proceedings which are pending or threatened of which it is aware, which may have, or have had in the recent past, significant effects on Roche’s and/or the Group’s financial position or profitability.
Roche Pharmaceuticals Legal Cases
Hoffmann-La Roche Inc. (‘HLR’) and various other Roche affiliates have been named as defendants in numerous legal actions in the United States and elsewhere relating to the acne medication Accutane. The litigation alleges that Accutane caused certain serious conditions, including, but not limited to, inflammatory bowel disease (‘IBD’), birth defects and psychiatric disorders. As of 31 December 2008 HLR is defending approximately 560 actions brought in various federal and state courts throughout the United States for personal injuries allegedly resulting from their use of Accutane. Most of the actions allege IBD as a result of Accutane use. All of the actions pending in federal court alleging IBD were consolidated for pre-trial proceedings in a Multi-District Litigation in the United States District Court for the Middle District of Florida, Tampa Division. In July 2007 the District Court granted summary judgment in favour of HLR in the lead federal IBD cases. The plaintiffs appealed and in August 2008 these rulings were affirmed by the United States Court of Appeals for the Eleventh Circuit. All of the actions pending in state court in New Jersey alleging IBD were consolidated for pre-trial proceedings in the Superior Court of New Jersey, Law Division, Atlantic County. As of 31 December 2008 juries in the Superior Court have ruled in favour of the plaintiff in five cases, assessing total compensatory damages totalling 26 million US dollars. HLR has appealed in one case to the Superior Court of New Jersey, Appellate Division and is reviewing its post-trial option in the other cases. In October 2007 a jury in the Circuit Court of Escambia County, Florida, returned a verdict in favour of the plaintiff, assessing total compensatory damages of 7 million US dollars, subsequently reduced to 6.8 million US dollars by the court, against the Company. HLR has appealed to the District Court of Appeal, State of Florida. As of 31 December 2008 the Group has recorded provisions totalling 96 million US dollars (102 million Swiss francs) in respect of these matters. Additional trials are scheduled for 2009. Individual trial results depend on a variety of factors, including many that are unique to the particular case and therefore the trial results to date may not be predictive of future trial results. The Group continues to defend vigorously the remaining personal injury cases and claims. Genentech Legal Cases
On 10 June 2002 Genentech announced that a Los Angeles County Superior Court jury voted to award City of Hope Medical Center (‘City of Hope’) approximately 300 million US dollars in compensatory damages based on a finding of a breach of a 1976 agreement between Genentech and the City of Hope. On 24 June 2002 the jury voted to award City of Hope 200 million US dollars in punitive damages in the same case. On 13 September 2002 Genentech filed a notice of appeal of the jury verdict and damages awards with the California Court of Appeal. On 21 October 2004 the Court of Appeal affirmed the verdict and damages awards in all respects. Also, on 21 October 2004 Genentech announced that it would seek review by the California Supreme Court, which has discretion over which cases it will review. On 24 November 2004 Genentech filed its petition for review by the California Supreme Court and on 2 February 2005 the California Supreme Court granted this petition. The appeal to the California Supreme Court was heard on 5 February 2008 and on 24 April 2008

Page 171
overturned the award of 200 million US dollars in punitive damages to the City of Hope, but upheld the award of 300 million US dollars in compensatory damages. On 9 May 2008 Genentech paid 476 million US dollars to the City of Hope, reflecting the amount of compensatory damages awarded, plus interest thereon from the date of the original decision on 10 June 2002.
During the appeals process interest had accrued on the total amount of the damages at a simple annual rate of 10%. During 2008 interest of 11 million Swiss francs (2007: 60 million Swiss francs) was recorded as the time cost of provisions within financing costs. A full provision, totalling 776 million US dollars as at 31 December 2007, had been recorded for these awards. As a result of the 24 April 2008 California Supreme Court decision, provisions totalling 310 million US dollars were released to income as a favourable litigation settlement, of which 200 million US dollars relates to the original award recorded in 2002 as an exceptional major legal case expense and 110 million US dollars relates to interest accrued as a charge to financing costs in the intervening periods. On 3 October 2002 Genentech entered into an arrangement with third-party insurance companies to post a surety bond in connection with this judgement. As part of this arrangement Genentech had pledged 788 million US dollars in cash and investments to secure this bond. This amount, which is equivalent to 889 million Swiss francs at 31 December 2007, was recorded as restricted cash within other current assets in the Annual Financial Statements. During the third quarter of 2008 the court completed certain administrative procedures to dismiss the case. As a result the restrictions were lifted from the restricted cash and investments and the funds became available for use in Genentech’s operations.
Genentech and City of Hope are in discussions but have not yet reached agreement regarding additional royalties and other amounts that Genentech owes to City of Hope under the 1976 agreement for third-party product sales and settlement of a third-party patent litigation that occurred after the 2002 judgement. Additional accruals have been made representing management’s best estimate of the final obligation.
On 4 October 2004 Genentech received a subpoena from the United States Department of Justice, requesting documents related to the promotion of Rituxan. Genentech is co-operating with the associated investigation. Through counsel Genentech are having discussions with government representatives about the status of their investigation and Genentech’s views on this matter, including potential resolution. Previously the investigation had been both civil and criminal in nature. Genentech was informed in August 2008 by the criminal prosecutor who handled this matter that the government has declined to prosecute Genentech criminally in connection with this investigation. The civil matter is still ongoing. The outcome of this matter cannot be determined at this time.
On 11 April 2003 Medlmmune, Inc. (‘Medlmmune’) filed a lawsuit against Genentech, the City of Hope National Medical Center, and Celltech R&D Ltd., in the US District Court for the Central District of California, Los Angeles. The lawsuit relates to US Patent No. 6,331,415 (‘the Cabilly patent’) that is co-owned by Genentech and the City of Hope National Medical Center and under which Medlmmune and other companies have been licensed and are paying royalties. The lawsuit includes claims for violation of antitrust, patent and unfair competition laws. The lawsuit included claims for violation of antitrust, patent and unfair competition laws. On 11 June 2008 Genentech announced that it had settled its patent litigation with MedImmune. Under the terms of the settlement agreement the litigation which was pending before the US District Court for the Central District of California has now been fully resolved and dismissed. The lawsuit included claims for violation of antitrust, patent and unfair competition laws. On 11 June 2008 Genentech announced that it had settled its patent litigation with MedImmune. Under the terms of the settlement agreement the litigation which was pending before the US District Court for the Central District of California has now been fully resolved and dismissed..
On 13 May 2005 a request was filed by a third party for re-examination of the Cabilly patent. On 7 July 2005 the US Patent and Trademark Office ordered a re-examination of this patent. On 13 September 2005 the US Patent Office issued an initial ‘non-final’ Office action rejecting the claims of the patent. Genentech filed a response on 25 November 2005. A second re-examination request for this same patent was filed on 23 December 2005 by another third party and on 23 January 2006 the Patent Office granted the re-examination request. On 6 June 2006 the two re-examinations were combined by the US Patent and Trademark Office into a single re-examination. On 16 August 2006 the Patent Office issued a non-final Office action in the merged proceeding, rejecting the claims of the Cabilly patent based on the issues raised in the two re-examination requests. Genentech filed its response on 30 October 2006. On 16 February 2007 the Patent Office mailed a final Office action rejecting all thirty six claims of the Cabilly patent. On 21 May 2007 Genentech responded to the final Office action and petitioned for continued re-examination. On 31 May 2007 the Patent Office granted Genentech’s petition, withdrew the finality of the February 2007 Office action and agreed to treat Genentech’s 21 May 2007 filing as a response to a first Office action. On 25 February 2008 the Patent Office mailed a final Patent Office action rejecting all the claims of the Cabilly patent. Genentech filed a response to that final Patent Office action on 6 June 2008. On 19 July 2008 the Patent Office mailed an advisory action replying to Genentech’s response and confirming the rejection of all claims of the Cabilly patent. Genentech filed a notice of appeal challenging the rejection on 22 August 2008. Genentech’s opening appeal brief was on 9 December

Page 172
2008. The Cabilly patent, which expires in 2018, relates to methods used by Genentech and others to make certain antibodies or antibody fragments, as well as cells and DNA used in these methods. Genentech has licensed the Cabilly patent to other companies and derives significant royalties from these licences. The claims of the Cabilly patent remain valid and enforceable throughout the re-examination process. No provisions have been recorded in respect of this litigation as the final outcome of this matter cannot be determined at this time. During the fourth quarter of 2008 the process of recognising revenue from the Cabilly patents was changed from an estimated accruals basis to a cash basis. As a result of this change, net royalties decreased by approximately 66 million US dollars, equivalent to 71 million Swiss francs, in the fourth quarter of 2008 compared to the third quarter. The Cabilly patent licences contributed operating profit of 156 million US dollars in 2008, equivalent to 169 million Swiss francs (2007: 133 million US dollars, equivalent to 160 million Swiss francs).
On 30 May 2008 Centocor, Inc. filed a patent lawsuit against Genentech and City of Hope in the US District Court for the Central District of California. The lawsuit relates to the Cabilly patent and seeks a declaratory judgment of patent invalidity and unenforceability with regard to the Cabilly patent and of patent non-infringement with regard to certain of Centocor’s products. Centocor filed an amended complaint on 3 September 2008. Genentech answered the complaint on 19 September 2008 and also filed counterclaims against Centocor alleging that four Centocor products infringe certain Genentech patents. Genentech filed an amendment to those counterclaims on 10 October 2008 and Centocor answered these counterclaims on 26 November 2008. A status conference has been set in the case for 9 February 2009. The outcome of this matter cannot be determined at this time.
In 2006 Genentech made development decisions involving its humanised anti-CD20 programme, and its collaborator, Biogen Idec Inc., disagreed with certain of Genentech’s development decisions related to humanised anti-CD20 products. Under Genentech’s 2003 collaboration agreement with Biogen Idec, Genentech believe that it is permitted to proceed with further trials of certain humanised anti-CD20 antibodies, but Biogen Idec disagreed with Genentech’s position. The disputed issues have been submitted to arbitration. In the arbitration, Biogen Idec filed motions for a preliminary injunction and summary judgment seeking to stop Genentech from proceeding with certain development activities, including planned clinical trials. On 20 April 2007, the arbitration panel denied Biogen Idec’s motion for a preliminary injunction and Biogen Idec’s motion for summary judgment. Resolution of the arbitration could require that both parties agree to certain development decisions before moving forward with humanised anti-CD20 antibody clinical trials (and possibly clinical trials of other collaboration products, including Rituxan), in which case Genentech may have to alter or cancel planned clinical trials in order to obtain Biogen Idec’s approval. Each party is also seeking monetary damages from the other. The arbitrators held hearings on this matter over several days in September 2008 and closing arguments on 9 December 2008. The hearings formally closed on 8 January 2009. A final decision from the arbitrators is expected by no later than July 2009. The outcome of this matter cannot be determined at this time.
On 28 June 2003 Mr Ubaldo Bao Martinez filed a lawsuit against Porriño Town Council and Genentech España S.L. in the Contentious Administrative Court Number One of Pontevedra, Spain. The lawsuit challenges the Town Council’s decision to grant licenses to Genentech España S.L. for the construction and operation of a warehouse and biopharmaceutical manufacturing facility in Porriño, Spain. On 21 January 2008 the Administrative Court ruled in favour of Mr Bao on one of the claims in the lawsuit and ordered the closing and demolition of the facility, subject to certain further legal proceedings. On 12 February 2008, Genentech and the Town Council filed appeals of the Administrative Court decision at the High Court in Galicia, Spain. In addition, Genentech are evaluating with legal counsel in Spain whether there may be other administrative remedies available to overcome the Administrative Court’s ruling. Genentech sold the assets of Genentech España S.L., including the Porriño facility, to Lonza Group Ltd. (‘Lonza’) in December 2006, and Lonza has operated the facility since that time. Under the terms of that sale, Genentech retained control of the defence of this lawsuit and agreed to indemnify Lonza against certain contractually defined liabilities up to a specified limit, which is currently estimated to be approximately 100 million US dollars. No provisions have been recorded in respect of this litigation as the outcome of this matter and Genentech’s indemnification obligation to Lonza, if any, cannot be determined at this time.
On 8 May, 11 June, 8 August, and 29 September of 2008, Genentech was named as a defendant, along with InterMune, Inc. and its former chief executive officer, W. Scott Harkonen, in four separate class-action complaints filed in the US District Court for the Northern District of California on behalf of plaintiffs who allegedly paid part or all of the purchase price for a product that was licensed by Genentech to Connectics Corporation and was subsequently assigned to InterMune. The complaints are related in part to royalties that Genentech received. The 8 May, 11 June, 8 August complaints have been consolidated into a single amended complaint that claims and seeks damages for violations of federal racketeering laws, unfair competition laws, and consumer protection laws, and for unjust enrichment. The 29 September complaint includes six claims, but only names Genentech as a defendant in one claim for damages for unjust enrichment. This matter was formally
Page 173
related to the consolidated complaint on 10 December 2008. Genentech’s motion to dismiss these matters is currently scheduled for hearing on 2 February 2009. The outcome of these matters cannot be determined at this time.
Subsequent to the Roche Proposal, more than thirty shareholder lawsuits have been filed against Genentech and/or the members of its Board of Directors, and various Roche entities including Roche Holdings, Inc. (RHI) and Roche Holding Ltd. (Roche Holding AG). The lawsuits are currently pending in various state courts, including the Delaware Court of Chancery and San Mateo County Superior Court, as well as in the United States District Court for the Northern District of California. The lawsuits generally assert class-action claims for breach of fiduciary duty and aiding and abetting breaches of fiduciary duty based in part on allegations that, in connection with Roche’s offer to purchase the remaining shares, some or all of the defendants have failed to properly value Genentech, have failed to solicit other potential acquirers and are engaged in improper self-dealing. Several of the suits also seek the invalidation, in whole or in part, of the July 1999 Affiliation Agreement between Genentech and RHI (Affiliation Agreement), and an order deeming Articles 8 and 9 of Genentech’s Amended and Restated Certificate of Incorporation inapplicable or invalid to a potential transaction with Roche. The outcome of these matters cannot be determined at this time.
On 27 October 2008 Genentech and Biogen Idec Inc. filed a complaint against Sanofi-Aventis Deutschland GmbH (‘Sanofi’), Sanofi-Aventis US LLC and Sanofi-Aventis US Inc. in the Northern District of California seeking a declaratory judgement that certain Genentech products, including Rituxan, do not infringe Sanofi’s US Patents 5,849,522 (‘the ‘522 patent’) and 6,218,140 (‘the ‘140 patent’) and a declaratory judgement that the ‘522 and ‘140 patents are invalid. On 2 December 2008 Sanofi filed a motion to dismiss this complaint for lack of jurisdiction. A discovery hearing relating to this motion has taken place on 13 February 2009 Also on 27 October 2008 Sanofi filed suit against Genentech and Biogen Idec in the Eastern District of Texas, Lufkin Division, claiming that Rituxan and at least eight other Genentech products infringe the ‘522 and ‘140 patents. On 22 January 2009 Genentech filed a motion to transfer this matter to the Northern District of California. Sanofi is seeking preliminary and permanent injunctions, compensatory and exemplary damages, and other relief. In addition on 24 October 2008 Hoechst GmbH filed with the ICC International Court of Arbitration (Paris) a request for arbitration with Genentech, relating to a terminated agreement between Hoechst’s predecessors and Genentech that pertained to the above patents and related patents outside the United States. Genentech’s answer to the arbitration request was filed on 19 January 2009. Hoechst is seeking payments on royalties on sales of Genentech products, damages for breach of contract, and other relief. Genentech intends to vigorously defend itself. The outcome of these matters cannot be determined at this time.
On 29 July 2005 a former Genentech employee, whose employment ended in April 2005, filed a non-public (Qui Tam) complaint under seal in the United States District Court for the District of Maine against Genentech and Biogen Idec, alleging violations of the False Claims Act and retaliatory discharge of employment. On 20 December 2005 the US District Court filed notice of its election to decline intervention in the lawsuit. The complaint was subsequently unsealed and Genentech was served on 5 January 2006. Genentech filed a motion to dismiss the complaint and on 14 December 2006 the Magistrate Judge issued a Recommended Decision on this motion. The Magistrate Judge recommended that the False Claims Act portion of the complaint be dismissed, leaving as the only remaining claim against Genentech the plaintiff’s retaliatory discharge claim. The plaintiff, Genentech and Biogen Idec each subsequently filed objections with the District Court Judge concerning certain aspects of the Magistrate Judge's Recommended Decision. On 24 July 2007 the District Court Judge affirmed the dismissal of both claims related to the False Claims Act but denied Genentech’s motion to dismiss the plaintiff’s federal retaliatory discharge claim and granted the plaintiff’s motion for leave to file a Second Amended Complaint asserting an additional state law employment claim. No provisions have been recorded in respect of this litigation as the potential outcome cannot be determined at this time.
Genentech’s annual report and quarterly SEC filings contain the detailed disclosures on litigation matters that are required by US GAAP. These include further details on the above matters as well as including information on other litigation that is not currently as significant as the matters referred to above.
Vitamin Case
Following the settlement agreement with the US Department of Justice on 20 May 1999 regarding pricing practices in the vitamin market and the overall settlement agreement to a class action suit brought by the US buyers of bulk vitamins, the Group recorded provisions in respect of the vitamin case in 1999. These provisions were the Group’s best estimate at that time of the total liability that may arise, taking into account currency movements and the time value of money. Provisions for legal fees were recorded separately. The Group recorded additional provisions in 2001 and 2002, based on the development of the litigation and settlement negotiations in the US, Europe and elsewhere.

Page 174
On 17 January 2003 the District of Columbia Circuit Court of Appeals ruled in a class action litigation brought on behalf of non-US purchasers of bulk vitamins from the Group and other manufacturers that non-US plaintiffs may bring claims in US courts under US anti-trust laws for alleged damages suffered from transactions outside the United States. On 14 June 2004 the Supreme Court of the United States nullified the decision of the District of Columbia Circuit Court of Appeals. The Supreme Court remanded the case to the lower court to review alternative arguments which might permit such claims to proceed in the United States. On remand, on 28 June 2005 a panel of the District of Columbia Circuit Court of Appeals ruled unanimously that US courts do not have jurisdiction over the plaintiffs’ claims and affirmed the initial dismissal of the complaint. On 26 October 2005 the plaintiffs petitioned the US Supreme Court for further discretionary review. On 9 January 2006 the US Supreme Court issued an order denying the plaintiffs’ petition. On 1 March 2006 the plaintiffs filed a motion in the trial court seeking relief from the final judgement so that plaintiffs could advance European Union law claims in the trial court. The trial court has denied that motion, and the plaintiffs’ time to appeal the trial court’s ruling has expired. The Group considers this matter closed.
The Group is seeking to resolve the remaining outstanding issues; however the timing and the final amounts involved are uncertain. The remaining provisions are not discounted as the time value of money is not considered material in this case. As the litigation and negotiations progress, it is possible that the ultimate liability may be different from the amount of provisions currently recorded.
24. THE CONNECT PLAN
Please note that the following is a summary of the Connect Plan and is qualified by the full Connect Plan Regulations (the “Regulations”) and the country addenda to the Regulations for Austria, Belgium (Local Conditions), Denmark, Finland, Germany, Greece, Italy, The Netherlands, Norway, Portugal, Spain, Sweden and the United Kingdom each contained in Annex A to this Prospectus (there are no specific country addenda for the Czech Republic and Poland).
Introduction
24.1 The Connect Plan (the “Plan”) is intended to provide certain employees of any member of the Group (“Employee”) with an opportunity to share in the results of Roche by providing them with a convenient means for regular and systematic purchases of Genussscheine (see below), and thus increasing the ability of Roche to attract, motivate and retain its Employees.
24.2 “Genussscheine” are non-voting equity securities of Roche that are listed on the SIX Swiss Exchange (formerly SWX Swiss Exchange) and also admitted to trading on the UK Exchange Regulated Market Segment of SWX Euorpe (formerly virt-x Exchange) in London. On 11 November 2008 the SIX Group announced that the trading in Swiss shares (including Roche Genussscheine), which currently is conducted on SWX Europe in London, will be relocated to SIX Swiss Exchange in Zurich as of mid-2009 and thus become subject to Swiss regulation and supervision only. The ISIN of the Genussscheine is CH0012032048.
Eligibility
24.3 Subject to certain exceptions, all Employees who are on the payroll of a member of the Group that is designated a participating company (a “Participating Company”) by the Executive Committee of the Company and who are employed by that Participating Company are eligible to participate in the Plan, subject to the completion of any minimum service period for participation in the relevant country.
24.4 The offer of Genussscheine and the right to purchase Genussscheine under the Connect Plan that is being made by this Prospectus, is only being made to Employees of Participating Companies in Germany and in those EEA Member States where the Bundesanstalt für Finanzdienstleistungsaufsicht has sent a notification to the relevant competent authority under Article 18 of the Prospectus Directive (2003/71/EC). Presently, it is expected that such EEA Member States will be Austria, Belgium, the Czech Republic, Denmark, Finland, Greece, Italy, the Netherlands, Norway, Poland, Portugal, Spain, Sweden and the United Kingdom. No offer is being made by this Prospectus to any other persons in any other jurisdiction.
Enrolment in the Connect Plan
24.5 Employees eligible to participate in the Plan will be sent an enrolment form, which will contain details of the plan administrator (the “Plan Administrator”) to whom such enrolment form should be returned. Employees eligible to participate in the Connect Plan must file an enrolment form with the relevant Plan Administrator specified therein between 27 April 2009 and 15 May 2009 (the “Enrolment Period”). The relevant Plan

Page 175
Administrator may, in its sole discretion, but will be under no obligation to, accept enrolment forms filed outside the Enrolment Period.
Contributions
24.6 The enrolment form will permit a participant in the Plan (a “Participant”) to elect a fixed annual rate for contributions in local currency. Generally, the Participant’s annual rate for contributions may not be less than 0.5% of the Participant’s annual base salary and may not exceed 10% of the Participant’s annual base salary. Contributions based on this annual rate will be deducted from a Participant’s net salary on each payday and placed into a “Cash Account” held on behalf of that Participant. In addition, any dividends paid on Genussscheine held in a Participant’s Custody Account (see below) will be credited to that Participant’s Cash Account.
Purchase of Genussscheine
24.7 Once a month, Genussscheine will be purchased on behalf of the Participant by the Plan Administrator using the entire credit balance in the relevant Participant’s Cash Account. Genussscheine so purchased will be deposited in a “Custody Account” held on behalf of that Participant.
24.8 All Genussscheine used for the Plan are purchased in the market by the Plan Administrator. However, Participants do not pay the price that was paid by the Plan Administrator in the market for Genussscheine that are purchased on their behalf. Rather, the average price paid in the market by the Plan Administrator for all Genussscheine purchased in the month is used to determine the purchase price (the “Purchase Price”) that is paid by Participants (and deducted from their Cash Account) for Genussscheine purchased on their behalf. Generally, the Purchase Price will be 80% of the average price paid in the market by the Plan Administrator for Genussscheine, except where the Purchase Price is funded using reinvested dividends, in which case the Purchase Price will be 100% of such average price paid. These percentages are also subject to variation for Participants in certain countries, as set out in the relevant country addenda. Any difference between the price paid in the market by the Plan Administrator for Genussscheine and the Purchase Price applicable to Participants will be funded by Roche.
24.9 The Plan Administrator will ordinarily purchase Genussscheine on the 18thday of each month, or the next trading day following the 18th if the 18th is not a trading day. Participants will be informed of the average market price paid by the Plan Administrator in the month for the Genussscheine allocated to their Custody Account in the quarterly statement referred to in the next paragraph. The Genussscheine will be offered, and the Purchase Price will be determined, on an ongoing basis. Information about the initial Purchase Price will be made available in a printed form for delivery to the public free of charge on 23 July 2009 at the registered office of Roche in Grenzacherstrasse 24, 4058, Basel, Switzerland. Furthermore, Employees of Roche who are eligible for participating in the Connect Plan will be individually informed about the subsequent Purchase Prices on an ongoing basis.
24.10 The Genussscheine were purchased and sold, for the purposes of the Connect Plan, by Citigroup Global Markets Inc. 787 Seventh Avenue, New York, NY 10019 until June 30, 2008. Starting from July 1, 2008, the Genussscheine are purchased and sold by UBS AG, Bahnhofstrasse 45, 8001 Zürich, Switzerland.
Notification of Total Investment and Number of Genussscheine held
24.11 Participants will be sent a statement on a quarterly basis detailing the total amounts invested by (i) the Participant; (ii) Roche; and (iii) the reinvestment of dividends paid on Genussscheine held in the Participant’s Custody Account, together with the total number of Genussscheine held in the Participant’s Custody Account and the price paid by the Plan Administrator for the purchase of such Genussscheine.
Transferability
24.12 The right to purchase Genussscheine under the Plan is non-tradable and may not be assigned, pledged or transferred.
24.13 Generally, Genussscheine acquired under the Plan cannot be transferred or pledged during a “holding period” of three years from their date of purchase. This restriction is generally lifted if a Participant ceases to be employed by Roche for any reason.

Page 176
Duration
24.14 The Plan may be terminated, amended or suspended by the Executive Committee at any time by the giving of notice to Participants.
Further Information
24.15 Employees to whom an enrolment form is sent will be given contact details of a person to whom they can direct queries concerning the Plan, including any country specific rules contained in country addenda as referred to above.
24.16 Members of the Board of Directors are not eligible to participate in the Connect Plan, save for Franz B. Humer who was eligible by virtue of his former position on the Executive Committee. Roche is not aware as to whether members of the Executive Committee intend to cease participation in the Connect Plan for the future.
25. PAYING AND DEPOSITARY AGENT AND EXTERNAL PLAN ADMINISTRATOR
The paying and depository agent for the Genussscheine for all relevant countries is UBS AG, Wertschriften Services Bahnhofstrasse 45, 8001 Zürich. The external administrator of the Plan until June 30, 2008 was Abacus Corporate Services International Limited, Exchange Tower, 8th Floor, 19 Canning Street, Edinburgh EH3 8EG, United Kingdom. Starting from July 1, 2008, the Genussscheine are purchased and sold by UBS AG, Bahnhofstrasse 45, 8001 Zürich, Switzerland.
26. EMPLOYEE STOCK OPTIONS AND OTHER EQUITY COMPENSATION BENEFITS
See Note 11 to the 2008 Consolidated Financial Statements for a description of the arrangements for involving Employees in the capital of Roche (pages 262 to 267 of this Prospectus).
27. INFORMATION REGARDING FORWARD-LOOKING STATEMENTS
This Prospectus includes forward-looking statements. These forward-looking statements include all matters that are not historical facts. In particular, the statements under the headings “Summary,” “Risk Factors,” “Operating and Financial Review”, “The Business” and “Dividends“ regarding Roche’s financial condition, and future events or prospects are forward-looking statements.
These forward-looking statements reflect Roche’s judgment at the date of this prospectus and, without prejudice to the responsibility statement made under section 2 of this Part VII above, are not intended to give any assurances as to future results.
Except where required by law, Roche undertake no obligation to update these forward-looking statements, and Roche will not publicly release any revisions Roche may make to these forward-looking statements that may result from events or circumstances arising after the date of this Prospectus.
28. DOCUMENTS AVAILABLE FOR INSPECTION
Copies of the following documents are available for inspection during usual business hours on any weekday (Saturdays, Sundays and public holidays excepted) for a period of 12 months following the publication of this Prospectus at the offices of Roche, Grenzacherstrasse 124, 4058 Basel, Switzerland:
(a) the bylaws and articles of incorporation of Roche;
(b) the reports of the statutory auditors in relation to (c);
(c) the historical financial information for the Group in respect of the three financial years ended 31 December 2008, 31 December 2007 and 31 December 2006 and the historical financial information for Roche Holding Ltd in respect of the financial year ended 31 December 2008.

Page 177
PART 8 DEFINITIONS
The following definitions apply throughout this Prospectus unless the context requires otherwise:
“Board” or “Directors” the Board of Directors of the Company
Bundesanstalt für Finanzdienstleistungsaufsicht (BaFin)
German Financial Supervisory Authority
“Company” Roche Holding AG / Roche Holding Ltd
“Connect Plan” the Roche Genussscheine Purchase Plan as described in Annex A and Section 15 of Part VII of this Prospectus
“Corporate Executive Committee” please refer to “Executive Committee”
“EEA” the European Economic Area
“EU” the European Union
“Employee” an Employee of any of the Companies of Roche
“Executive Committee” the Executive Committee of the Company (also referred to as the Corporate Executive Committee of the Company)
“FDA” U.S. Food and Drug Administration
“Group” or “Roche Group” The Company and its Consolidated Subsidiaries and Subsidiary Undertakings from time to time
“Genussscheine” A Roche Genussschein, a non-voting equity security of Roche Holding AG that is listed on the SIX Swiss Exchange (formerly SWX Swiss Exchange) and also admitted to trading on the UK Exchange Regulated Segment of SWX Europe (formerly virt-x Exchange) in London with ISIN number CH0012032048. On 11 November 2008 the SIX Group announced that the trading in Swiss shares (including Roche Genussscheine), which currently is conducted on SWX Europe in London, will be relocated to SIX Swiss Exchange in Zurich as of mid-2009 and thus become subject to Swiss regulation and supervision only.
“IFRS” International Financial Reporting Standards
“Member States” Member States of the EEA
“Prospectus” this Securities Prospectus, including Annexes A to D
“Prospectus Directive” EU Prospectus Directive (2003/71/EC)
“R & D” Research and Development
“Roche” The Company or the Group, as the context requires
“Shareholders” the Holders of Shares (including holders of Genussscheine where the context requires) in the capital of the Company
“Shares” Shares (including Genussscheine where the context requires) in the capital of the Company
Page 178
ANNEX A
CONNECT PLAN REGULATIONS
This Annex A contains the Regulations relating to the Roche Genussscheine Purchase Plan and the country addenda to the Regulations for Austria, Belgium (Local Conditions), Denmark, Finland, Germany, Greece, Italy, The Netherlands, Norway, Portugal, Spain, Sweden, and the United Kingdom. Please note there are no country addenda for Poland or the Czech Republic.
To the extent that certain paragraphs of the Articles of the Regulation relating to the Roche Genussschein Purchase Plan are not changed by the Local Conditions, this is indicated in the relevant country addendum by inserting the word "unchanged" in square brackets, i.e. [unchanged]. The square brackets shall not mean that the relevant terms are optional, as it is market practice in base prospectuses for the offering of debt instruments in Germany, in which case the individual offer are concretised in the final terms.
Regulations relating to the
Roche Genussschein Purchase Plan
“Roche Connect”
effective on June 12, 2002, amended on February 17, 2004

Page 179
ARTICLE 1
Purpose
The purpose of the Plan is to provide Employees of Roche with an opportunity to share in the results of the Company by providing them with a convenient means for regular and systematic purchases of Genussscheine, and thus providing an increased incentive for these Employees to contribute to and participate in the success and prosperity of Roche, and increasing the ability of Roche to attract, motivate and retain its Employees.
ARTICLE 2
Rules of Interpretation
The Plan is valid for the Participants in its entirety only. No statements made in reference to any part of the Plan are permissible to be construed without reference lo the Plan as a whole.
ARTICLE 3
Definitions
The following terms shall have the meaning described below when used in the Plan:
“Base Salary” shall mean base compensation (regular gross base salary unless locally defined otherwise), paid by Roche to a Participant in accordance with the terms of his or her employment, but excluding all forms of special compensation.
“Cash Account” shall mean the account established on behalf of the Participant in which the Participant’s Plan contributions and dividends according to Article 13 are held for purposes of purchasing Genussscheine under the Plan.
“Custody Account” shall mean the account established on behalf of the Participant in which the Participant’s Genussscheine acquired under the Plan are held.
“Employee” shall mean an employee of any of the companies of Roche.
“Enrollment Form” shall mean the proper form for application by the Participant to participate in the Plan (see example Appendix A).
“Executive Committee”
shall mean the Corporate Executive Committee of Roche Holding AG
“Genussscheine” shall mean a Roche Genussscheine, a non-voting equity security of Roche Holding AG that is listed on the SIX Swiss Exchange in Zurich and also traded on virt-x Exchange Limited in London.
“Holding Period” shall mean the period during which Genussscheine acquired under the Plan cannot be transferred or pledged.
“Participant” shall mean an eligible Employee who elects to participate in the Plan.

Page 180
“Participating Company”
shall mean a Roche company which has been identified as a Participating Company by the Executive Committee and whose employees are eligible to participate in the Plan.
“Payday” shall mean the effective date on which salary is paid to the Employee for each Pay Period.
“Pay Period” shall mean the timeframe for which salary is paid to the Employee on the Payday.
“Plan” shall mean the Roche Securities (Genussscheine) Purchase Plan, “Roche Connect” (including addenda).
“Plan Administrator(s)”
shall mean the person(s) or company(ies) appointed by the Executive Committee who is (are) responsible for administrative duties pursuant to this Plan.
“Purchase Price” shall mean the price at which Genussscheine may be purchased pursuant to the Plan.
“Regulations” shall mean the provisions relating to the Plan, as adopted by the Executive Committee.
“Roche” shall mean the group companies consisting of Roche Holding AG and all of its Subsidiaries.
“Roche Holding” shall mean the Holding AG or any successor in ownership of all or substantially all of its assets and its Subsidiaries.
“Subsidiary” shall mean any foreign or domestic corporation owned, in whole or in part, directly or indirectly, by Roche Holding AG.
“U.S. Person” shall mean a U.S. Person as defined in Regulation S under the Securities Act of the United States of America and shall include any residents of the United States.
ARTICLE 4
Administration of the Plan 1 Unless otherwise provided in the Plan, the Executive Committee administers the Plan and has full power to construe and interpret the Plan, establish and amend rules and regulations for its administration, and perform all other actions relating to the Plan, that it believes reasonable and proper including the delegation of responsibilities. The Executive Committee shall, in particular but not limited to, appoint the Plan Administrator(s) and shall delegate the appropriate duties to each of these person(s) or company(ies). 2 All decisions made by the Executive Committee pursuant to the provisions of the Plan shall be final, conclusive and binding.
ARTICLE 5
Genussscheine subject to the Plan 1 For purposes of satisfying its obligations under the Plan, Roche shall purchase the Genussscheine in the open market or from third parties. 2 Roche shall not be required to segregate any cash or any Genussscheine to cover its obligations under the Plan and the Plan shall constitute an unfunded plan of Roche.

Page 181
ARTICLE 6
Eligibility 1 All Employees who are on the payroll of a Participating Company and who are employed by a Participating Company for an indefinite term are eligible to participate in the Plan, unless provided otherwise in the addenda to the Plan. 2 An Employee who goes on a long-term international assignment with Roche will be eligible to participate in the Plan while on assignment only if the host country employer is a Participating Company.
3 Neither the establishment of the Plan, nor the granting of the right to purchase Genussscheine under the Plan, nor the payment of any benefits nor any action of the Executive Committee shall be held or construed to confer upon any Participant any legal right to continue to be eligible to participate in this Plan regardless of the length of time the Employee has been granted benefits under the Plan.
ARTICLE 7
Participation 1 An eligible Employee may participate in the Plan by filing with the Plan Administrator, in accordance with such terms and conditions as the Executive (Committee in its sole discretion may impose, an Enrollment Form (see example in Appendix A) for such purpose. The Executive Committee will approve the Enrollment Form and the procedure for its acceptance. Such Enrollment Form authorizes regular contributions to the Plan from Base Salary. The Participating Company and the Plan Administrator will make every effort to begin the deductions from Base Salary with the first applicable Pay Period which begins in the month following the month in which the Enrollment Form has been received by the Plan Administrator according to this Article 7. The participation in the Plan continues until the Employee either (i) has ceased making contributions under Article 8 and has withdrawn all Genussscheine purchased on Employee’s behalf from the Custody Account or (ii) ceases to be eligible to participate in the Plan due to termination of employment according to Article 14. 2 Participation in the Plan on the part of the Employee is voluntary and such participation is not a condition of employment nor does participation in the Plan entitle a Participant to be retained as an Employee. Further, the Employee will not receive any compensation if he chooses not to participate in the Plan.
ARTICLE 8 Contributions and Cash Account
1 The Enrollment Form described in Article 7 will permit a Participant to elect a fixed annual rate for contributions in local currency. The Participant’s annual rate for contributions may not be less than 0.5% of the Participant’s annual Base Salary and may not exceed 10% of the Participant’s annual Base Salary. The contribution amount to be deducted each Payday is equal to the Participant’s annual rate for contributions divided by the number of regular Pay Periods in the year. In its sole discretion, the Executive Committee may establish an absolute minimum contribution limit, denominated in Swiss Francs (CHF), and may also alter the minimum and/or maximum contribution amounts for certain jurisdictions. 2 The Participant may, once each calendar year during a specified period as established by the Executive Committee, and in accordance with such terms and conditions as the Executive Committee in its sole discretion may impose, alter the annual rate for contributions or cease making contributions by filing with the Plan Administrator an election provided for this purpose. Roche and the Plan Administrator will make every effort to ensure that the change will

Page 182
be in effect for the first applicable Pay Period which begins in the month following the month in which the election has been received by the Plan Administrator. 3 The contributions from Base Salary continue to be deducted each Payday until the employee either (i) files a new or amended election according to this Article 8 or (ii) ceases to be eligible to participate in the Plan due to termination of employment according to Article 14. 4 A Participant who takes parental leave for the birth of a child is permitted to make additional elections to alter the contribution amount or cease making contributions at the start of the parental leave period and also upon recommencing work at the end of the parental leave period. 5 A Participant who transfers employment from one Roche entity to another within a single country may not change his contributions to the Plan at the time of transfer if both Roche entities are Participating Companies. However, if either of the Roche entities involved is not a Participating Company, then the Participant may either begin making contributions or cease making contributions to the Plan at the time of such transfer. The Participant may be required to file an additional Enrollment Form with the company to which employment is transferred. 6 If a Participant on a long-term international assignment with Roche, remains eligible to participate in the Plan while on assignment pursuant to Article 6, and is a Participant during the assignment, all contributions shall be made through the host country system and in host country currency. The Participant may alter the level of contribution at the start of the international assignment and upon recommencing work at the end of the international assignment and may be required to file an additional Enrollment Form with the company in the host country. While on international assignment no contributions can be made pursuant to the Plan under the home country agreement, except as otherwise determined by the Executive Committee. 7 A Participant may reduce the contribution amount or cease making contributions, subject to such limitations as the Executive Committee in its sole discretion may impose. 8 The Participant’s contributions to the Plan shall be deducted on each regular Payday. All contributions will be converted into Swiss Francs (CHF) at the average interbank exchange rates on the day of conversion. The contributions (denominated in CHF) will be credited to the Participant’s Cash Account as determined by the Executive Committee in its sole discretion. 9 Except as otherwise determined by the Executive Committee, no interest will be paid on contributions deposited in a Participant’s Cash Account. 10 A Participant may not make any contributions into the Cash Account other than the contributions approved by the Executive Committee.
ARTICLE 9
Acquisition of Genussscheine 1 Once a month, Genussscheine (including fractional Genussscheine, where necessary) will be purchased on behalf of the Participant at a price specified in Article 10. The entire credit balance in the Participant’s Cash Account which has been communicated to the Plan Administrator prior to the date such purchase is made will be used to purchase Genussscheine on the Participant’s behalf. The Executive Committee and the Plan Administrator will set up a process for this purpose and will undertake all efforts needed to invest the amounts at the first possible date. 2 All Genussscheine, including fractional Genussscheine, purchased under the Plan shall be deposited in a Custody Account on behalf of the Participant. The Genussscheine shall not be withdrawn from the Custody Account prior to the end of the Holding Period, as described in Article 12, or such earlier time as prescribed by the Plan.

Page 183
ARTICLE 10
Purchase Price of Genussscheine 1 With the exception of Genussscheine purchased with dividend payments pursuant to Article 13 and unless otherwise defined in an Addendum, the Purchase Price shall be equal to eighty percent (80%) of the average price paid by the Plan Administrator for the Genussscheine which are allocated in a given month. 2 The Purchase Price of Genussscheine purchased with dividend payments pursuant to Article 13 shall be equal to one hundred percent (100%) of the average price paid by the Plan Administrator for the Genussscheine which are allocated in a given month.
ARTICLE 11
Transferability of Right to Purchase 1 The right to purchase Genussscheine under the Plan is non-tradable and may not be assigned, pledged or transferred. 2 The amounts credited to a Cash Account may not be assigned, pledged or transferred except by reason of death.
ARTICLE 12
Holding Period of Genussscheine 1 Subject to paragraph 2 below, the Genussscheine acquired under the Plan cannot be transferred or pledged during a Holding Period of 3 years from the date of purchase. 2 At the sole discretion of the Executive Committee, the Holding Period described in this Article 12 maybe extended in certain jurisdictions. 3 In the event of termination of employment with Roche for any reason, according to Article 14, the Holding Period (described in this Article 12 shall be lifted. 4 At the end of the Holding Period, all Genussscheine in the Participant’s Custody Account shall be available to the Participant for withdrawal in either cash or Genussscheine after the withholding of any applicable taxes which Roche is obliged to withhold, subject to the terms and conditions established by the Executive Committee. Fractional Genussscheine shall be withdrawn in cash. 5 The balance of the Participant’s Custody Account will be reviewed at least once per year. If, at this time, the only Genussscheine in the Participant’s Custody Account which remain subject to the Holding Period are Genussscheine which were purchased with dividend payments pursuant to Article 13, then the Holding Period of such Genussscheine shall be immediately lifted. 6 At the sole discretion of the Executive Committee, the Holding Period described in this Article 12 may be lifted or reduced in certain circumstances.
ARTICLE 13
Dividends on Genussscheine
Any dividends paid on Genussscheine, which are held in the Participant’s Custody Account, shall be credited to the Participant’s Cash Account, net of any applicable withholding taxes. The dividends paid shall be used to purchase Genussscheine, without discount, in accordance with Article 10.

Page 184
ARTICLE 14
Termination of Employment 1 Upon termination of employment with Roche, pursuant to retirement on or after attainment of retirement age pursuant to the law, to early retirement with the consent of the Executive Committee, or to a retirement plan of Roche, such Participant’s participation in the Plan will cease on the date of termination of employment. The entire credit balance in such Participant’s Cash Account and all Genussscheine held in such Participant’s Custody Account shall be paid out at the Participant’s choice, in either Cash and/or Genussscheine as soon as possible following termination of employment. 2 Upon termination of employment with Roche as a result of disability, such Participant’s participation in the Plan will cease on the date of termination of employment. Disability means inability to engage in any substantial gainful activity by reason of a medically determinable physical or mental impairment, which constitutes a permanent and total disability. The determination whether a Participant has suffered a disability shall be made by the Executive Committee based upon such evidence as it deems necessary and appropriate. The entire credit balance in such Participant’s Cash Account and all Genussscheine held in such Participant’s Custody Account shall be paid out at the Participant’s choice, in either cash and/or Genussscheine as soon as possible following termination of employment. 3 Upon the death of a Participant, such Participant’s participation in the Plan will cease immediately. The entire credit balance in such Participant’s Cash Account and all Genussscheine held in such Participant’s Custody Account shall be paid out at the choice of the Participant’s heir(s) according to applicable inheritance laws, in either cash and/or Genussscheine as soon as possible following the Participant’s death. 4 Upon termination of employment with Roche as a result of redundancy, such Participant’s participation in the Plan will cease immediately. The entire credit balance in such Participant’s Cash Account and all Genussscheine held in such Participant’s Custody Account shall be paid out at the Participant’s choice, in either cash and/or Genussscheine as soon as possible following such termination. 5 Upon termination of employment with Roche for any reason other than those mentioned above, such Participant’s participation in the Plan will cease on the dale of termination of employment. The entire credit balance in such Participant’s Cash Account and; all Genussscheine held in such Participant’s Custody Account shall be paid out at the Participant’s choice, in either cash and/or Genussscheine as soon as possible after termination of employment. 6 In the event a choice with respect to the method of payout is not made within one month of termination of employment, the Genussscheine in the Participant’s Custody Account will be sold. The proceeds together with any balance in the Participant’s Cash Account shall be paid out in cash after the withholding of any applicable taxes and selling costs. 7 A transfer of a Participant between Roche companies, or a leave of absence, duly authorised in writing by Roche for military service or sickness or for any other purpose approved by Roche, provided the Participant’s right to re-employment is guaranteed either by a statute or by contract, shall not be deemed a termination of employment. If employment is terminated prior to the re-employment of the Participant, then the provisions of this Article 14 are applicable.
ARTICLE 15
No Right of Continued Employment
Neither the establishment of the Plan, nor the eligibility to participate in the Plan, nor the payment of any benefit nor any action of the Executive Committee shall be held or construed to confer upon any Participant any legal right to continue to be employed by Roche, regardless of the length of time the Participant has been granted benefits under the Plan.

Page 185
ARTICLE 16
Administration and Selling Costs 1 The Participating Companies shall pay for the cost of transferring funds into the Participant’s Cash Account. Roche shall pay for all ongoing Plan administration costs, including all transaction/dealing costs related to the purchase of the Genussscheine under the Plan. Roche shall also pay for all Cash Account and Custody Account fees as long as the Genussscheine are held in the centrally administered Custody Account. 2 The Participant shall be responsible for any costs related to the sale of the Genussscheine and/or the transfer of the Genussscheine and/or proceeds into the Participant’s personal account.
ARTICLE 17
Tax and Social Security Contributions 1 Each Participant is responsible for the appropriate tax and social security declarations and payments according to the respective legislation applicable. 2 Roche has the right to make withholdings from a Participant’s salary or retain Genussscheine to meet salary Withholding obligations, unless the funds are provided otherwise to Roche in accordance with the procedures determined by the Executive Committee.
ARTICLE 18
Reorganization and Liquidation 1 In case of liquidation, corporate reorganization including spin-offs or divestitures, the Executive Committee shall, to the extent permissible by the law, make any adjustment related to the Plan that it deems reasonable and proper, at its own discretion.
ARTICLE 19
Duration and Amendment 1 The provisions of this Plan have been established for the purchase of Genussscheine in the year 2002 and all subsequent years, until the Executive Committee decides, in its sole discretion, to terminate the Plan. 2 The Plan may be supplemented by addenda defining country specific variations where these are required. The Executive Committee may amend or suspend the Plan at any time, in its sole discretion. 3 Termination, amendment or suspension of the Plan shall be communicated by the Executive Committee to all Participants.
ARTICLE 20
Data Protection 1 The Participant consents to the collection and processing of personal data relating to the Participant by Roche, the Executive Committee, the Plan Administrator and any other person Roche may find appropriate for the administration of the Plan. The data will be used for the aforementioned parties to fulfil their obligations and exercise their rights under the Plan, issue certificates (if any), issue statements and communications relating to the Plan and generally administer and manage the Plan, including keeping records of participation levels.

Page 186
2 In particular, the Participant expressly consents to the transfer of personal data about the Participant by the Executive Committee, the Plan Administrator and any other person Roche may find appropriate for the administration of the Plan. Data may be transferred worldwide for the purpose described in paragraph 1 above. All national and international transfer of personal data is only done in order to fulfil the obligations land rights under the Plan of the Executive Committee, the Plan Administrator or any other person Roche may find appropriate for the administration of the Plan. 3 The Participant has the right to be informed whether Roche, the EC, the Executive Committee, the Plan Administrator, or any other person Roche may find appropriate for the administration of the Plan holds personal data about the Participant and, to the extent they do so, to have access to such personal data at no charge and require it to be corrected if it is inaccurate or to be destroyed if the Participant wishes to withdraw his or her consent. The Participant is entitled to all the other rights provided for by applicable data protection law, including those detailed in any applicable documentation or guidelines provided to the Participant by Roche.
ARTICLE 21
Applicable Law and Choice of Jurisdiction 1 This Plan and any related document shall be governed by and construed in accordance with the substantive laws of Switzerland, ignoring principles of conflict of laws, and subject to the limitations of compulsorily applicable local employment laws. 2 This Plan is established in the English language. It may be translated into other languages. In case of divergence between the English and another version, the English version shall take precedence. 3 Any disputes relating to the interpretation of the Plan shall be resolved by the Courts of Basel, Switzerland. However, any disputes relating to the employment relationship will be handled by the courts of the territory of the Participant’s employer. 4 The participation in the Plan or any related right implies the consent to the choice of law and jurisdiction established in this Article 21. 5 By executing the related Enrollment Form, the Participant shall expressly acknowledge and accept the terms and conditions of the Plan and all its related documents, as well as the powers of the Executive Committee to complete, interpret and implement it through further documentation which it may, from lime to time, determine necessary or relevant.
ARTICLE 22
U.S. Selling Restrictions 1 As long as Genussscheine acquired under this Plan have not been registered under the U.S. Securities Act of 1933, such Genussscheine may not be offered or sold within the United States or to, or for the account or benefit of, U.S. Persons except in certain transactions exempt from the registration requirements of the U.S. Securities Act of 1933, as amended. 2 In connection with the acquisition of Genussscheine, each Participant represents and agrees that such Participant:
- is not acquiring Genussscheine for the account or benefit of any other person or entity; and
- has not offered or sold, and will not offer, sell or deliver, any of the Genussscheine within the United States or to, or for the account or benefit of, any U.S. Person except pursuant to either registration under the U.S. Securities Act of 1933, as amended, or an available exemption from such registration.

Page 187
- understands that the Genussscheine are subject to restrictions on resale in the United States, imposed by federal and state securities law.
ARTICLE 23
Adoption 1 The Plan shall be effective on the date of adoption of the Regulations by the Executive Committee. 2 The Regulations were adopted by the Executive Committee on June 12, 2002 and amended on February 17, 2004.
Page 188
Roche Genussschein Purchase Plan
“Roche Connect”
Addendum Austria As of 12 June 2002
This Addendum for Austria applies solely to eligible Employees as defined in Article 6 of the Regulations relating to the Roche Genussschein Purchase Plan (the “Regulations”) who are employed by a Participating Company in Austria or to Employees the Executive Committee may prescribe
Article 6. Article 8 and Article 12 of the Regulations will be adjusted as follows:
ARTICLE 6 Eligibility
1-3 [unchanged] 4 The Employee must be in continuous employment with Roche for at least 1 month.
ARTICLE 8 Contributions and Cash Account
1 The Enrollment Form described in Article 7 will permit a Participant to elect a fixed annual rate for contributions in local currency. The Participant’s annual rate for contributions may not be less than 0.5% of the Participant’s annual Base Salary and may not exceed 10% of the Participant’s annual Base Salary or the maximum amount of Euro 5’840 per employee and year. The contribution amount to be deducted each Payday is equal to the Participant’s annual rate for contributions divided by the number of regular Pay Periods in the year.
2-10 [unchanged]
ARTICLE 12 Holding Period of Genussscheine
1 The Genussscheine acquired under the Plan cannot be transferred and pledged during a Holding Period of 5 years. The Holding Period starts at the beginning of the calendar year following the year in which the Genussscheine were allocated.
2 (cancelled)

Page 189
3-6 (unchanged)
This Addendum for Austria was agreed by the Executive Committee based on Article 19 Paragraph 2 of the Regulations on 6 August 2002. This addendum shall become effective from 12 June 2002 and shall be applicable only to those Employees as defined above.

Page 190
ROCHE SECURITIES (GENUSSSCHEIN) PURCHASE PLAN
“ROCHE CONNECT”
LOCAL CONDITIONS - BELGIUM10
The following local terms and conditions (the “Local Conditions”) form, together with the “Regulations relating to the Roche Genussschein Purchase Plan - Roche Connect” (the “Global Conditions”), the Abridged Prospectus and any other ancillary document, an integral part of the Roche Securities (Genussschein) Purchase Plan (the “Plan”) adhered to by and between Roche SA/NV and Roche Diagnostics (hereinafter individually a “Belgian Subsidiary” and collectively the “Belgian Subsidiaries”) and an employee of such Belgian Subsidiary.
Capitalised terms, not otherwise defined herein, shall have the meaning ascribed to them in article 3 of the Global Conditions.
In the event of conflict between the Global Conditions and the Local Conditions, the Global Conditions shall prevail over the Local Conditions.
1. ELIGIBILITY
Eligible employees are employees bound by an employment contract for undefined or defined duration with any of the Belgian Subsidiaries and who have a minimum seniority of 6 months. Expatriate employees who are eligible to participate in the Plan in their home country and who have been assigned to a Belgian Subsidiary will also be considered as eligible employees in Belgium and shall participate through the Belgian system without being able to participate further in their home country.
2. MINIMUM/MAXIMUM ANNUAL RATE OF CONTRIBUTIONS
2.1 Notwithstanding the definition provided for in Article 3 of the Global Conditions, the white-collar employees’ gross yearly base salary (hereinafter “Base Salary”) that will be taken into account for calculating the minimum and maximum annual rate of contributions, consists in the employees’ gross yearly fixed salary, thirteenth month and double holiday pay to which the employee is entitled according to Belgian legislation. As for blue-collar employees of the Belgian Subsidiaries, for the purpose of the implementation of the Plan in Belgium such gross yearly base salary is determined according to the following formula: gross hourly base salary multiplied by 2,200 hours (excluding weekend-work and shift premiums).
2.2 The employees’ annual rate of contributions may not be less than 0.5% of the annual Base Salary and may not exceed 10% of the employees’ annual Base Salary.
10 Please note that this Addenda refers to an ‘Abridged Prospectus’. Such references are no longer applicable since the requirement for
such Abridged Prospectus has been superseded by the Prospectus.
Page 191
3. PURCHASE PRICE
3.1 In accordance with article 10, 1° of the Global Conditions, the Purchase Price of the Genussscheine shall be equal to eighty percent (80%) of the average price paid by the Plan Administrator for the Genussscheine which are allocated in a given month.
3.2 For practical and administrative purposes only, the 20% discount will be achieved in a different manner, i.e. the Local Companies will add an amount equal to twenty five percent (25%) of the Participants’ contribution to the Cash Account. The total sum will then be used to purchase the Genussscheine at one hundred percent (100%) of the average price paid by the Plan Administrator in a given month. This twenty five percent (25%) contribution by the Local Company shall, however, not constitute an acquired right for the Participant in the event of termination of employment.
4. ALTERATION OF CONTRIBUTION
4.1 In accordance with article 8, 2° of the Global Conditions, a Participant may alter (increase or decrease) the level of his or her contribution or cease such contribution, during the Open Enrollment Period once each calendar year as established by the Executive Committee, and in accordance with such terms and conditions as the Executive Committee in its sole discretion may impose. Such fixed period to alter/cease the contribution does not prevent the Participant from altering/ceasing his or her contribution in the event of a change of employment status (infrah article 6 Local Conditions).
4.2 To this effect, the Participant must complete the Change or Withdrawal Form (a copy of which is attached in Appendix) and send it to his or her local Human Resource Department within the aforementioned period. The local Human Resource Department will make every effort to ensure that the alteration of the contribution shall be in effect for the first applicable Pay Period that begins in the month following the month in which the Change or Withdrawal Form has been received.
5. HOLDING PERIOD OF GENUSSSCHEINE
5.1 The Genussscheine acquired under the Plan may not be transferred or pledged during a Holding Period of 3 years from the date of the purchase.
5.2 In the event of termination of employment with Roche for any reason other than the Participant’s death, Article 12 (3) shall not apply and the Holding Period described in paragraph 5.1 above shall not be lifted.
6. CHANGE OF EMPLOYMENT STATUS
6.1 After consulting the Belgian Subsidiary with which the Participant has an employment relationship, a Participant whose employment contract is/will be (wholly/partly) suspended may reconsider the level of his or her contribution at the time of such suspension or, if possible, prior to the starting date of such suspension. At that time the employee may alter such contribution, cease it or leave it unchanged. The following shall be regarded as suspension for the purpose of this article (without any limitation): maternity leave, parental leave, career interruption/time credit sickness leave due to illness or accident (including industrial accidents and professional diseases) as from the moment the salary is no longer to
Page 192
be guaranteed by the Belgian Subsidiary. For periods of suspension covered by a guaranteed salary paid by the Belgian Subsidiary, the aforementioned possibility does not apply (e.g. period of guaranteed income during sickness, paid holidays, etc.).
Retirement, as defined in the Global Conditions, includes the standard statutory pension and any other forms of retirement such as anticipated retirement, bridge pension (based on CLA no. 17), etc.
Disability, as defined in the Global Conditions, is defined as the moment as from which the Participant’s injury or sickness has become permanent and the employee is entitled to an invalidity allowance.
6.2 In case of suspension (article 6.1.), the Participant must complete the Change or Withdrawal Form (a copy of which is attached in Appendix) and send it to his or her local Human Resource Department as soon as possible. The local Human Resource Department shall make every effort to ensure that the literati on of the contribution shall be effective for the first applicable Pay Period that begins in the month following the month in which the Change or Withdrawal Form has been received.
7. TERMINATION OF EMPLOYMENT
7.1 In the event of termination of employment, the Participant will no longer have the opportunity to purchase Genussscheine as from the termination of employment. All Genussscheine purchased under the Plan shall become available to the Participant at the end of the Holding Period.
7.2 For the purposes of application of article 8 (i) b. of the Salomon Smith Barney account opening form, the termination of employment, as described in this article 8 (i) b., a ‘Final Release Date’ will be notified to Salomon Smith Barney and Abacus. The ‘Final Release Date’ being the last date on which the Holding Period of 3 years for Genussscheine purchased with the participant’s contributions expires. Article 14 of the Global Conditions only applies after the ‘Final Release Date’, except in case of termination of employment by reason of death (Article 14 (3)).To this end, the Participant engages itself to inform the Belgian Subsidiary that previously employed him of any changes in its relevant personal data as from the date of termination of its employment through the end of the Holding Period.
8. PROSPECTUS
In accordance with article 29 of the Belgian Royal Decree no. 185 of 9 July 1935, the Belgian Subsidiaries have drafted each an abridged prospectus (the “Abridged Prospectus”) in relation to the Global Conditions that has been approved by the Belgian Banking and Finance Commission. The Abridged Prospectus and its terms constitute, together with the other documents detailed in the preamble to the present Local Plan Conditions, an integral part of the Plan adhered to by and between the Belgian Subsidiaries and an employee thereof.
9. LANGUAGE
The Global Conditions, the Local Conditions and any related documents are drawn up in Dutch or in French depending on the location of the relevant Belgian Subsidiary, as required by the Belgian mandatory language law regulations. In case of discrepancy between these

Page 193
versions and the versions made up in another language, the Dutch or French documents shall take precedence.
10. AMENDMENT OF THE PLAN AND LOCAL CONDITIONS
The Global Conditions and Local Conditions may be amended unilaterally by the Executive Committee or the Belgian Subsidiary (after the Executive Committee’s approval) at any time, at its sole discretion since the participation in the Plan and the benefits resulting therefrom do not constitute an essential element of the Participant’s employment contract.
11. APPLICABLE LAW AND DISPUTES
11.1 The Global Conditions, the Local Conditions and any related documents are governed by and construed in accordance with the substantive laws of Switzerland, ignoring principles of conflict of laws, and subject to the limitations of compulsorily Belgian employment law.
11.2 Any disputes relating to the interpretation of the Global Conditions, the Local Conditions and any related documents shall be resolved by the Belgian Courts.

Page 194
Roche Genussschein Purchase Plan
“Roche Connect”
Addendum Denmark
As of 12 June 2002
This Addendum for Denmark applies solely to eligible Employees as defined in Article 6 of the Regulations relating to the Roche Genussschein Purchase Plan (the “Regulations”) who are employed by a Participating Company in Denmark or to Employees the Executive Committee may prescribe.
Article b of the Regulations will be adjusted as follows:
ARTICLE 6 Eligibility
1 All Employees who are on the payroll of a Participating Company and who are employed by a Participating Company for an indefinite term and all Employees who are employed by a Participating Company on a fixed term contract are eligible to participate in the Plan, subject to the requirements of paragraph 4 of this article 2 [unchanged] 3 [unchanged] 4 The Employee must be in continuous employment with Roche for at least 6 months.
This Addendum for Denmark was agreed by the Executive Committee based on Article 19 Paragraph 2 of the Regulations on 6 August 2002. This addendum shall become effective from 12 June 2002 and shall be applicable only to those Employees as defined above.

Page 195
Roche Genussschein Purchase Plan
“Roche Connect”
Addendum Finland
As of 12 June 2002
This Addendum for Finland applies solely to eligible Employees as defined in Article 6 of the Regulations relating to the Roche Genussschein Purchase Plan (the “Regulations”) who are employed by a Participating Company in Finland or to Employees the Executive Committee may prescribe.
Article 6 of the Regulations will be adjusted as follows:
ARTICLE 6 Eligibility
1 All Employees who are on the payroll of a Participating Company and who are employed by a Participating Company for an indefinite term and all Employees who are employed by a Participating Company on a fixed term contract are eligible to participate in the Plan, subject to the requirements of paragraph 4 of this article. 2 [unchanged] 3 [unchanged] 4 The Employee must be in continuous employment with Roche for at least 6 months.
This Addendum for Finland was agreed by the Executive Committee based on Article 19 Paragraph 2 of the Regulations on 6 August 2002. This addendum shall become effective from 12 June 2002 and shall be applicable only to those Employees as defined above.

Page 196
Roche Genussschein Purchase Plan
“Roche Connect”
Addendum Germany
As of 12 June 2002
This Addendum for Germany applies solely to eligible Employees as defined in Article 6 of the Regulations relating to the Roche Genussschein Purchase Plan (the “Regulations”) who are employed by a Participating Company in Germany or to Employees the Executive Committee may prescribe.
Article 6 of the Regulations will be adjusted as follows:
ARTICLE 6 Eligibility
1 All Employees who are on the payroll of a Participating Company and who are employed by a Participating Company for an indefinite term and all Employees who are employed by a Participating Company on a fixed term contract are eligible to participate in the Plan, subject to the requirements of paragraph 4 of this article.
2 [unchanged] 3 [unchanged] 4 The minimum age for joining the plan is 18 years and the Employee must be in continuous employment with Roche for at least 6 months. Apprentices are excluded from participating in the Plan.
This Addendum for Germany was agreed by the Executive Committee based on Article 19 Paragraph 2 of the Regulations on 6 August 2002. This addendum shall become effective from 12 June 2002 and shall be applicable only to those Employees as defined above.

Page 197
Roche Genussschein Purchase Plan
“Roche Connect”
Addendum Greece
As of 12 June 2002
This Addendum for Greece applies solely to eligible Employees as defined in Article 6 of the Regulations relating to the Roche Genussschein Purchase Plan (the “Regulations”) who are employed by a Participating Company in Greece or to Employees the Executive Committee may prescribe.
Article 6 and Article 8 of the Regulations will be adjusted as follows:
ARTICLE 6 Eligibility
1-3 [unchanged]
4 The Employee must be in continuous employment with Roche for at least 6 months.
ARTICLE 8 Contributions and Cash Account
1-3 [unchanged] 4 A Participant who goes on maternity leave or long-term sick leave shall not make contributions during the period of such leave. 5-10 [unchanged]
This Addendum for Greece was agreed by the Executive Committee based on Article 19 Paragraph 2 of the Regulations on 6 August 2002. This addendum shall become effective from 12 June 2002 and shall be applicable only to those Employees as defined above.
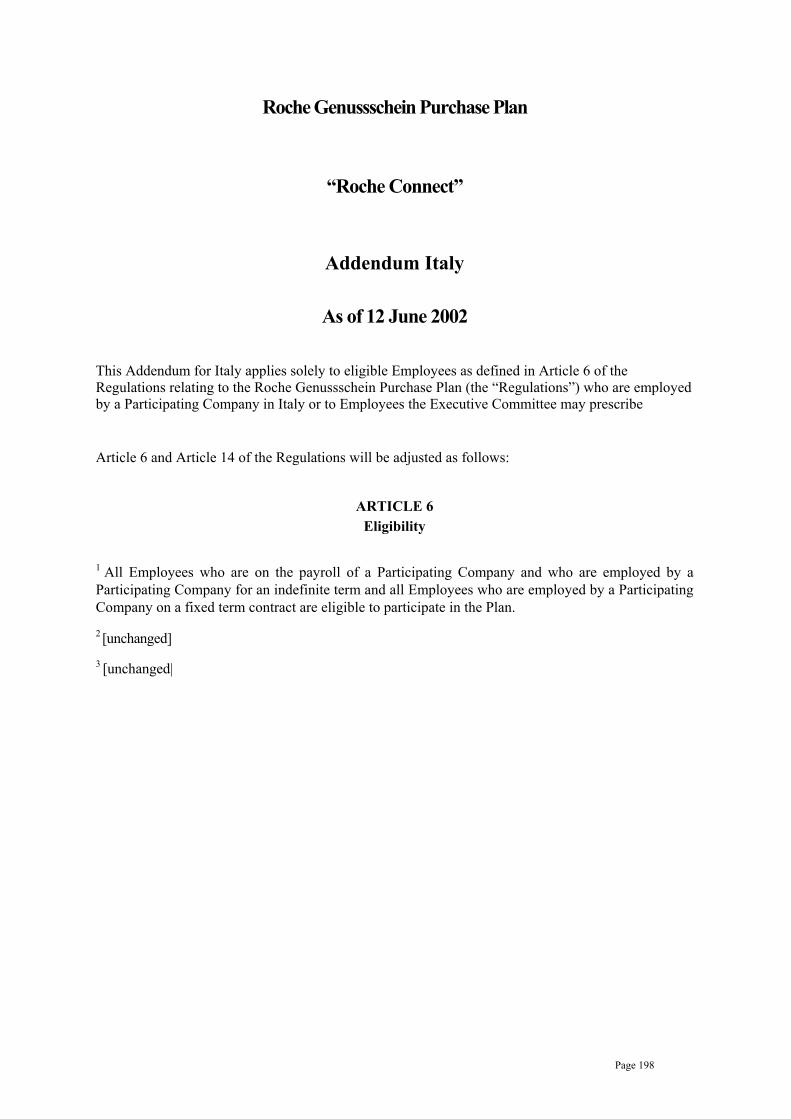
Page 198
Roche Genussschein Purchase Plan
“Roche Connect”
Addendum Italy
As of 12 June 2002
This Addendum for Italy applies solely to eligible Employees as defined in Article 6 of the Regulations relating to the Roche Genussschein Purchase Plan (the “Regulations”) who are employed by a Participating Company in Italy or to Employees the Executive Committee may prescribe
Article 6 and Article 14 of the Regulations will be adjusted as follows:
ARTICLE 6 Eligibility
1 All Employees who are on the payroll of a Participating Company and who are employed by a Participating Company for an indefinite term and all Employees who are employed by a Participating Company on a fixed term contract are eligible to participate in the Plan.
2 [unchanged] 3 [unchanged|

Page 199
ARTICLE 14 Termination of Employment
1-7 [unchanged] 8 Should the Participant elect to receive the balance of the Custody Account in cash, the Genussscheine held in the Custody Account will be sold on the open market and the proceeds realised will be paid to the participant.
This Addendum for Italy was agreed by the Executive Committee based on Article 19 Paragraph 2 of the Regulations on 6 August 2002. This addendum shall become effective from 12 June 2002 and shall be applicable only to those Employees as defined above.

Page 200
Roche Genussschein Purchase Plan
“Roche Connect”
Addendum The Netherlands
As of 12 June 2002
This Addendum for The Netherlands applies solely to eligible Employees as defined in Article 6 of the Regulations relating to the Roche Genussschein Purchase Plan (the “Regulations”) who are employed by a Participating Company in The Netherlands or to Employees the Executive Committee may prescribe.
Article 6 of the Regulations will be adjusted as follows:
ARTICLE 6 Eligibility
1 All Employees who are on the payroll of a Participating Company and who are employed by a Participating Company for an indefinite term and all Employees who are employed by a Participating Company on a fixed term contract are eligible to participate in the Plan. 2 [unchanged] 3 [unchanged]
This Addendum for The Netherlands was agreed by the Executive Committee based on Article 19 Paragraph 2 of the Regulations on 6 August 2002. This addendum shall become effective from 12 June 2002 and shall be applicable only to those Employees as defined above.

Page 201
Roche Genussschein Purchase Plan
“Roche Connect”
Addendum Norway
As of 12 June 2002
This Addendum for Norway applies solely to eligible Employees as defined in Article 6 of the Regulations relating to the Roche Genussschein Purchase Plan (the “Regulations”) who are employed by a Participating Company in Norway or to Employees the Executive Committee may prescribe
Article 6 of the Regulations will be adjusted as follows:
ARTICLE 6 Eligibility
1-3 [unchanged] 4 The Participant must be in continuous employment with Roche for at least 6 months.
This Addendum for Norway was agreed by the Executive Committee based on Article 19 Paragraph 2 of the Regulations on 6 August 2002. This addendum shall become effective from 12 June 2002 and shall be applicable only to those Employees as defined above.

Page 202
Roche Genussschein Purchase Plan
“Roche Connect”
Addendum Portugal
As of 12 June 2002
This Addendum for Portugal applies solely to eligible Employees as defined in Article 6 of the Regulations relating to the Roche Genussschein Purchase Plan (the “Regulations”) who are employed by a Participating Company in Portugal or to Employees the Executive Committee may prescribe.
Article 6 of the Regulations will be adjusted as follows:
ARTICLE 6 Eligibility
1 All Employees who are on the payroll of a Participating Company and who are employed by a Participating Company for an indefinite term and all Employees who are employed by a Participating Company on a fixed term contract are eligible to participate in the Plan.
2 [unchanged]
3 [unchanged]
This Addendum for Portugal was agreed \by the Executive Committee based on Article 19 Paragraph 2 of the Regulations on 13 August 2002. This addendum shall be effective from 12 June 2002 and shall be applicable only to those Employees as defined above.

Page 203
Roche Genussschein Purchase Plan
“Roche Connect”
Addendum Spain
As of 12 June 2002
This Addendum for Spain applies solely to eligible Employees as defined in Article 6 of the Regulations relating to the Roche Genussschein Purchase Plan (the “Regulations”) who are employed by a Participating Company in Spain or to Employees the Executive Committee may prescribe.
Article 6 of the Regulations will be adjusted as follows:
ARTICLE 6 Eligibility
1 All Employees who are on the payroll of a Participating Company and who are employed by a Participating Company for an indefinite term and all Employees who are employed by a Participating Company on a fixed term contract are eligible to participate in the Plan.
2 [unchanged] 3 [unchanged]
This Addendum for Spain was agreed by the Executive Committee based on Article 19 Paragraph 2 of the Regulations on 13 August 2002. This addendum shall be effective from 12 June 2002 and shall be applicable only to those Employees as defined above.
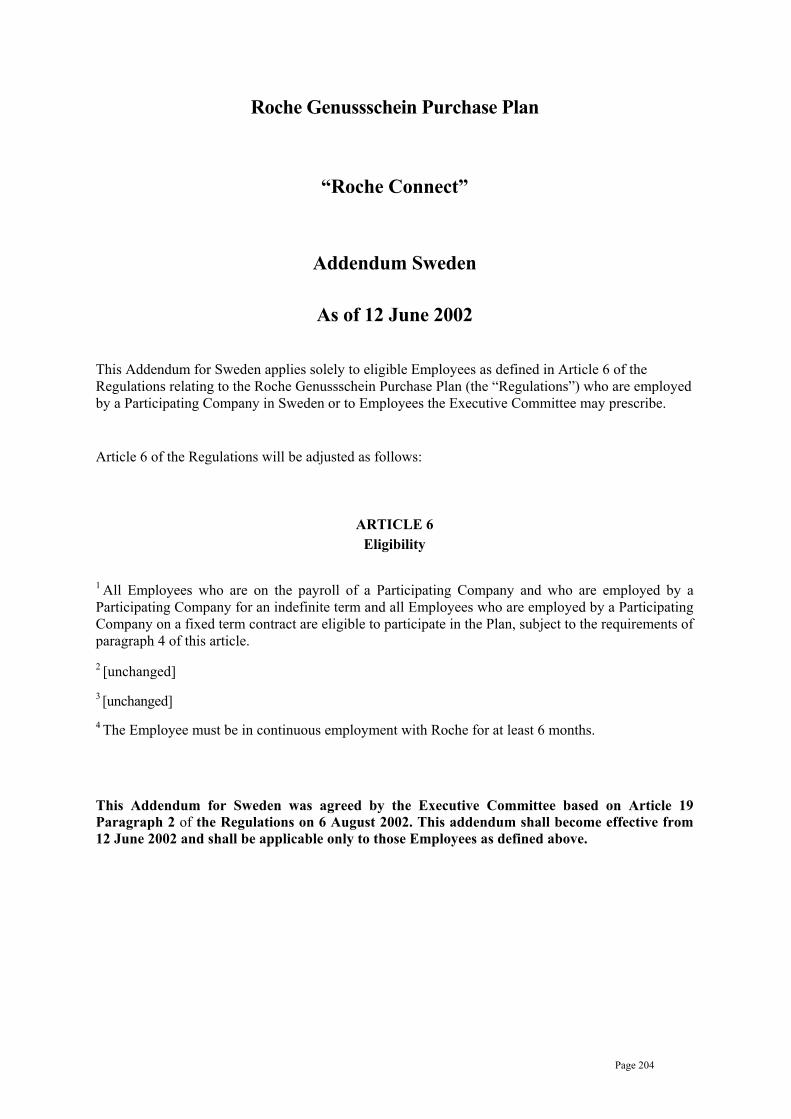
Page 204
Roche Genussschein Purchase Plan
“Roche Connect”
Addendum Sweden
As of 12 June 2002
This Addendum for Sweden applies solely to eligible Employees as defined in Article 6 of the Regulations relating to the Roche Genussschein Purchase Plan (the “Regulations”) who are employed by a Participating Company in Sweden or to Employees the Executive Committee may prescribe.
Article 6 of the Regulations will be adjusted as follows:
ARTICLE 6 Eligibility
1 All Employees who are on the payroll of a Participating Company and who are employed by a Participating Company for an indefinite term and all Employees who are employed by a Participating Company on a fixed term contract are eligible to participate in the Plan, subject to the requirements of paragraph 4 of this article.
2 [unchanged] 3 [unchanged] 4 The Employee must be in continuous employment with Roche for at least 6 months.
This Addendum for Sweden was agreed by the Executive Committee based on Article 19 Paragraph 2 of the Regulations on 6 August 2002. This addendum shall become effective from 12 June 2002 and shall be applicable only to those Employees as defined above.

Page 205
Roche Genussschein Purchase Plan
“Roche Connect”
Addendum United Kingdom
As of 12 June 2002
This Addendum for the United Kingdom applies solely to eligible Employees as defined in Article 6 of the Regulations relating to the Roche Genussschein Purchase Plan (the “Regulations”) who are employed by a Participating Company in the United Kingdom or to Employees the Executive Committee may prescribe.
Article 6 and Article 20 of the Regulations will be adjusted as follows:
ARTICLE 6 Eligibility
1 All employees who are on the payroll of a Participating Company are eligible to participate in the Plan. 2 [unchanged] 3 [unchanged]
ARTICLE 20 Data Protection
1 The Participant consents to the collection and processing of personal data relating to the Participant by Roche, the Executive Committee, the Plan Administrator and any other person Roche may find appropriate for the administration of the Plan. The data will be used for the aforementioned parties to fulfil their obligations and exercise their rights under the Plan, issue certificates (if any), issue statements and communications relating to the Plan and generally administer and manage the Plan, including keeping records of participation levels. Roche is satisfied that such third parties are under an obligation to apply the same technical and organisational security measures to the data processing function as Roche would use. Accordingly, a Participant’s personal data will be obtained and processed only for the purposes; set out in this Plan and will not be processed further in any manner incompatible with those purposes.
2-7 [unchanged]

Page 206
8 All Participants have certain statutory rights concerning the provision by Roche of information regarding the manner in which Roche stores and processes personal data. If a participant wishes to raise an issue relating to their personal data or data protection, the Participant should take the matter up first with Roche’s Data Protection Compliance Officer, whose contact details are as follows:
Name: Richard DanielAddress: Roche Products Limited P.O. Box 8 Welwyn Garden City Hertfordshire AL7 3AY Contact no: 01707 366710 Email: [email protected]
9 The rights that a Participant has under this Plan do not affect any rights that he/she may have under national legislation or any other rules or regulations.
This Addendum for the United Kingdom was agreed by the Executive Committee based on Article 19 Paragraph 2 of the Regulations on 6 August 2002. This addendum shall become effective from 12 June 2002 and shall be applicable only to those Employees as defined above.

Page 207
APPENDIX A
ENROLMENT FORM: [PARTICIPATING Company NAME] Roche Genussschein Purchase Plan “Roche Connect” – effective June 12, 2002
To be completed by Employees of Roche who are eligible to join the Plan (“Roche Connect”) and wish to enroll.
Title (e.g. Dr, Mr, Mrs etc.):__________ Personnel Number:
Last name: First Name:
Address:
Telephone number:
Nationality: Date of Birth:
Participating Company: [Participating Company name]
I subscribe to Roche Connect in accordance with the terms and conditions contained in the Regulations. My annual rate for contributions is:
Annual amount in local current [insert currency](minimum 0.5% and maximum 10% of my Base Salary).
My annual rate for contributions will be divided by the number of regular Pay Periods in the year to determine the contribution amount to be deducted each Payday. (e.g. divided by 12 for Participants on a 12, 13 or 14 month payment cycle).
PLAN DETAILS
Details regarding this Plan can be found in the employee guide and in the legally binding Regulations of the Roche Genussschein Purchase Plan “Roche Connect”.
PARTICIPATION AND CONTRIBUTION
Contributions will be deducted from salary or other amounts paid to me by [Participating Company name]. I will have the opportunity once per year to decide if I wish to change the contribution amount, or to stop contributing. [In 2003,] this will be in April/May for contributions effective in June onwards.
DIVIDENDS ON GENUSSSCHEINE
Any dividends paid on Genussscheine which are held in my Custody Account, shall be credited to my Cash Account net of any applicable withholding taxes. The dividends paid shall be used to purchase Genussscheine without any discount.
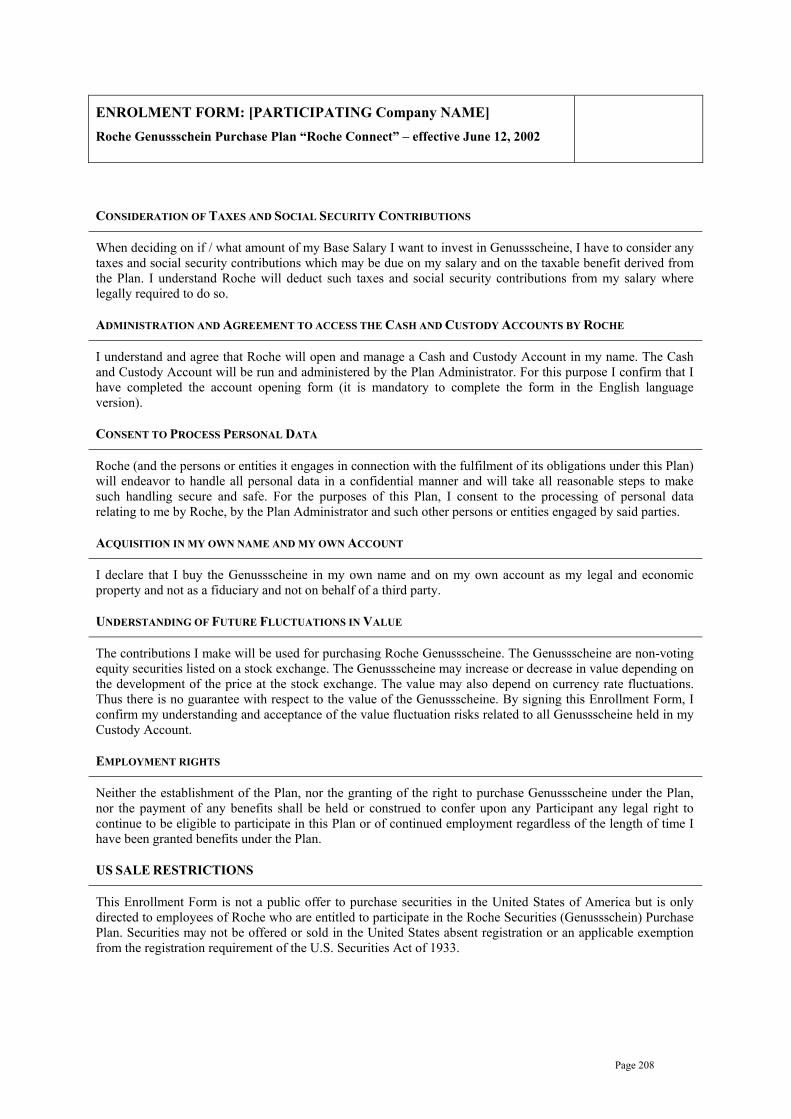
Page 208
ENROLMENT FORM: [PARTICIPATING Company NAME] Roche Genussschein Purchase Plan “Roche Connect” – effective June 12, 2002
CONSIDERATION OF TAXES AND SOCIAL SECURITY CONTRIBUTIONS
When deciding on if / what amount of my Base Salary I want to invest in Genussscheine, I have to consider any taxes and social security contributions which may be due on my salary and on the taxable benefit derived from the Plan. I understand Roche will deduct such taxes and social security contributions from my salary where legally required to do so.
ADMINISTRATION AND AGREEMENT TO ACCESS THE CASH AND CUSTODY ACCOUNTS BY ROCHE
I understand and agree that Roche will open and manage a Cash and Custody Account in my name. The Cash and Custody Account will be run and administered by the Plan Administrator. For this purpose I confirm that I have completed the account opening form (it is mandatory to complete the form in the English language version).
CONSENT TO PROCESS PERSONAL DATA
Roche (and the persons or entities it engages in connection with the fulfilment of its obligations under this Plan) will endeavor to handle all personal data in a confidential manner and will take all reasonable steps to make such handling secure and safe. For the purposes of this Plan, I consent to the processing of personal data relating to me by Roche, by the Plan Administrator and such other persons or entities engaged by said parties.
ACQUISITION IN MY OWN NAME AND MY OWN ACCOUNT
I declare that I buy the Genussscheine in my own name and on my own account as my legal and economic property and not as a fiduciary and not on behalf of a third party.
UNDERSTANDING OF FUTURE FLUCTUATIONS IN VALUE
The contributions I make will be used for purchasing Roche Genussscheine. The Genussscheine are non-voting equity securities listed on a stock exchange. The Genussscheine may increase or decrease in value depending on the development of the price at the stock exchange. The value may also depend on currency rate fluctuations. Thus there is no guarantee with respect to the value of the Genussscheine. By signing this Enrollment Form, I confirm my understanding and acceptance of the value fluctuation risks related to all Genussscheine held in my Custody Account.
EMPLOYMENT RIGHTS
Neither the establishment of the Plan, nor the granting of the right to purchase Genussscheine under the Plan, nor the payment of any benefits shall be held or construed to confer upon any Participant any legal right to continue to be eligible to participate in this Plan or of continued employment regardless of the length of time I have been granted benefits under the Plan.
US SALE RESTRICTIONS
This Enrollment Form is not a public offer to purchase securities in the United States of America but is only directed to employees of Roche who are entitled to participate in the Roche Securities (Genussschein) Purchase Plan. Securities may not be offered or sold in the United States absent registration or an applicable exemption from the registration requirement of the U.S. Securities Act of 1933.

Page 209
ENROLMENT FORM: [PARTICIPATING Company NAME] Roche Genussschein Purchase Plan “Roche Connect” – effective June 12, 2002
APPLICABLE LAW AND DISPUTES
The Plan and any related document shall be governed by and construed in accordance with the substantive laws of Switzerland, ignoring principles of conflict of laws, and subject to the limitations of compulsorily applicable local employment laws. Any disputes relating to the interpretation of the Plan shall be resolved by the courts of Basel, Switzerland. However, any disputes relating to the employment relationship will be handled by courts of the territory of the individual Participant’s employer.
I acknowledge and accept the terms and conditions of the Plan and all its related documents, as well as the powers of the Executive Committee to complete, interpret and implement it through further documentation which it may, from time to time, determine necessary or relevant.
I understand that Roche will review the information I have included in the Enrolment Form and will send written confirmation of my participation in the Plan.
Place / Date Participant
Please return this signed Enrolment Form to [country administrator] and keep a copy for your records.
This Enrollment Form is a sample only. The actual document received by the Participant may vary from this sample.

Page 210
ANNEX B
TERMS AND CONDITIONS OF THE GENUSSSCHEINE
The Genussscheine have been created pursuant to Art. 657 of the Swiss Code of Obligations in connection with the Articles of Incorporation of Roche. Art. 657 of the Swiss Code of Obligation provides that the articles of incorporation of a Swiss company may provide for the creation of Genussscheine in favor of persons who are linked with the Company by way of a previous capital participation, or as shareholder, oblige, employee or in a similar way.
The following sections, extracted from Roche’s Articles of Incorporation, deal with the creation and terms and conditions of Genussscheine:
Section 4
1. There are 702,562,700 bearer Genussscheine.
2. The Genussscheine are numbered 1– 702,562,700.
3. They are not part of the share capital and confer no voting rights. However, each Genussschein does confer the same rights as any one of the shares numbered 1–160,000,000 to participate in the available earnings and in any remaining proceeds from liquidation following repayment of the share and the participation certificate (PC) capital.
4. The subscription rights of Genussschein holders are governed by the provisions set out in section 5.
5. Genussscheine are bound by the Balance Sheet and the Income Statement approved by the General Meeting as well as by the appropriation of available earnings decided by the General Meeting.
6. All notices of the Company concerning the Genussscheine are issued by being published twice in the journals designated for this purpose by the Company (which is presently the Schweizerisches Handelsamtsblatt).
7. The Company is entitled at all times to exchange shares or PCs for all or some of the Genussscheine without the consent of the bearers thereof. In the event of exchange against shares, each such share shall participate in available earnings and liquidation proceeds in the same way as any one of the shares numbered 1-160,000,000. In the event of exchange against PCs, each Genussschein shall be replaced by PCs with a total nominal value equivalent to the nominal value of one of the shares numbered 1–160,000,000. If only part of Genussscheine are exchanged, selection shall be made by drawing lots.
8. Genussscheine selected for exchange are called in by a notice published once in the journals designated by the Company. The General Meeting decides on the timing at which the rights attaching to Genussscheine called in for exchange terminate and are replaced by the rights attaching to the new shares or PCs.
9. Meetings of Genussschein holders are convened whenever the Board of Directors regards this as desirable.
10. Every Genussschein holder is entitled to attend these meetings. He can give written authorization for another Genussschein holder to represent him at these meetings.
11. Each Genussschein carries one vote. To be able to exercise voting rights, Genussschein holders must deposit their Genussscheine at the latest one week before the meeting at the office of the Company or at such depositaries outside the Company as may be indicated in the notice, or they must show evidence of their ownership of Genussscheine in the manner prescribed by the Board of Directors.
12. Meetings are convened by the Board of Directors by publication of the agenda in two notices in the journals designated by the company for this purpose (which is presently the Schweizerisches Handelsamtsblatt). The second notice must be published no later than 20 days before the date of the meeting. Meetings are presided over by the Chairman, a Vice-Chairman or another member of the Board of Directors. The minutes must be signed by the Chairman and the Secretary of the meeting.
13. A meeting of Genussschein holders can pass resolutions if at least half of the Genussscheine issued are present or represented. Resolutions are passed by a majority of two thirds of votes cast, which must include the absolute majority of the bearers of all the votes represented, subject to section 4 subsection 15.

Page 211
14. If at a meeting of Genussschein holders the necessary quorum of Genussscheine is not represented, a second meeting must be called which is empowered to pass resolutions by an absolute majority of votes represented. Notice of convocation of such a second meeting of Genussschein holders can be given simultaneously with the notice of the convocation of the first meeting, and the meeting can be held immediately after the first meeting, subject to section 4 subsection 15.
15. The meeting of Genussschein holders can decide in a manner binding for all Genussscheine any changes to the rights of Genussscheine defined by the Articles, but a decision to waive some or all rights conferred by Genussscheine requires the agreement of the holders of the majority of all outstanding Genussscheine.
16. All resolutions of the meeting of Genussschein holders must be approved by the General Meeting of Shareholders.
Section 5
In the event of new equity-type securities being issued, the subscription rights of shareholders, Genussschein holders and PC holders are defined as follows:
(a) If PC capital is being created for the first time, shareholders and Genussschein holders have subscription rights in proportion to the number of securities already in their possession.
(b) If the share capital alone is increased, holders of all categories of securities have proportionate subscription rights.
(c) If the PC capital alone or the number of Genussscheine alone is increased, holders of all categories of securities have proportionate subscription rights.
(d) If the share capital and PC capital are increased simultaneously and in the same proportion, the shareholders’ subscription rights relate solely to shares and those of the PC and Genussschein holders solely to PCs.
(e) Subscription rights are subject to preclusion for valid reasons. In particular, the exchange of Genussscheine for shares or PCs is considered a valid reason.
Section 6
Shares, Genussscheine and PCs are signed by two members of the Board of Directors; facsimile signatures are sufficient.
Section 7
Dividends and share of profits which have not been drawn within five years of maturity are credited to the free reserves.
Section 27
The books are closed on 31 December of each year, and the Income Statement of the Company and the Balance Sheet are drawn up in accordance with the provisions of the Swiss Code of Obligations (Art. 662 et seq.).
Section 28
1. From the available earnings remaining after deduction of all expenses, interest payable, losses and provisions set aside in advance, at least 5% shall initially be allocated to the General Legal Reserves as long as such Reserves do not equal 20% of the share capital.
2. From the available earnings remaining after contribution to the General Legal Reserves, an amount corresponding to a dividend of 5% of the share capital is distributed to the shareholders; this distribution is subject to the condition that an amount equal to that paid on shares be paid simultaneously on the Genussscheine, which, under the terms of the Articles, rank pari passu with the shares in respect of distribution of available earnings, and that an amount be paid on PCs in proportion to their nominal value compared to that of the shares.
3. The available earnings remaining after distribution to the shareholders and holders of Genussscheine and to holders of any existing participation certificates in accordance with section 28 subsection 2 of these Articles is at the disposal of the General Meeting, which is free to distribute it as it thinks fit, provided that the part of the available earnings earmarked for distribution is allotted equally to the shares and to the Genussscheine, which, under the terms of the Articles of Incorporation, rank pari passu with the shares, as well as to the PCs proportionately to their nominal value compared with that of the shares.

Page 212
Section 29
1. All reserves form part of the Company’s assets; they are not administered separately, nor do they accrue interest separately.
2. Prescriptions as to use exist only with regard to the General Legal Reserves. Allocations from these Reserves must be proposed by the Board of Directors and approved by the General Meeting.
3. All other reserves are at the disposal of the Board of Directors unless the General Meeting decides otherwise.
Section 30
The Ordinary General Meeting, after having considered the relevant proposals of the Board of Directors and the Report of the Auditors, decides on the appropriation of the amounts placed at its disposal and fixes the dividends.
Section 31
The General Meeting may totally or partially allocate to reserve accounts the part of the available earnings placed at its disposal in accordance with section 28.
Section 32
1. Dissolution and liquidation are effected as determined by law, unless these Articles stipulate otherwise.
2. The proceeds of liquidation are distributed equally to all shares, Genussscheine and PCs in accordance with the rights adherent to them under these Articles

Page 213
ANNEX C
FINANCIAL INFORMATION
Comparability
The audited financial information contained in Annex C is as reported at the date the relevant financial statements were published. Please note that there have been a number of changes in IFRS and Roche’s accounting policies from 2006 to 2008. Changes in accounting policies that arise from the application of new or revised standards and interpretations are applied retrospectively, unless otherwise specified in the transitional requirements of the particular standard or interpretation. Retrospective application requires that the results of the comparative period and the opening balances of that period are restated as if the new accounting policy had always been applied. In addition comparatives have been reclassified or extended from the previously reported results to take into account presentational changes. IFRS requires some changes to be applied prospectively. Accordingly, the financial information contained in a particular year’s financial statements may not be fully comparable with the financial information contained in an earlier or later year’s financial statements due to changes in IFRS and Roche’s accounting policies. In particular, the financial information for 2007 has been restated in the 2008 Consolidated Financial Statements and the financial information for 2006 has been restated in the 2007 Consolidated Financial statements. See Note 1 to the 2008 Consolidated Financial Statements, (pages 222 to 234 of this Prospectus) Note 1 to the 2007 Consolidated Financial Statements (pages 332 to 344 of this Prospectus), and Note 1 to the 2006 (pages 417 to 429 of this Prospectus) Consolidated Financial Statements, for a summary of significant accounting policies applied to the 2008, 2007 and 2006 Consolidated Financial Statements and for details of restatements of prior periods.
Page Numbering
Please note that the page numbers at the top of the pages in Annex C are the page numbers from the original 2006, 2007 and 2008 Annual Reports. These have been added so that the audit reports in Annex C refer to the correct pages of the financial statements.

Page 214
CONTENTS
PAGE
Consolidated Financial Statements of the Roche Group 2008 215 Consolidated Income Statement for the Year Ended 31 December 2008 216 Consolidated Income Statement for the Year Ended 31 December 2007 217 Consolidated Balance Sheet 218 Consolidated Cash Flow Statement 219 Consolidated Statement of Recognised Income and Expense 220 Consolidated Statement of Changes in Equity 221 Notes to the Roche Group Consolidated Financial Statements 222 Report of Roche Management on Internal Control over Financial Reporting 307 Report of the Statutory Auditor 308 Report on Other Legal Requirements 309 Report of the Independent Auditors on Internal Control over Financial Reporting 310
Financial Statements of Roche Holding Ltd, Basel 2008 312
Income Statement 313 Balance Sheet at 31 December 2008 314 Notes to the Financial Statements 315 Appropriation of Available Earnings 322 Report of the Statutory Auditor 323 Report to Other Legal Requirements 324
Consolidated Financial Statements of the Roche Group 2007 325
Consolidated Income Statement for the Year Ended 31 December 2007 326 Consolidated Income Statement for the Year Ended 31 December 2006 327 Consolidated Balance Sheet 328 Consolidated Cash Flow Statement 329 Consolidated Statement of Recognised Income and Expense 330 Consolidated Statement of Changes in Equity 331 Notes to the Roche Group Consolidated Financial Statements 332 Report of Roche Management on Internal Control over Financial Reporting 407 Report of the Group Auditors 408 Report of the Group Auditors on Internal Control over Financial Reporting 409
Consolidated Financial Statements of the Roche Group 2006 410
Consolidated Income Statement for the Year Ended 31 December 2006 411 Consolidated Income Statement for the Year Ended 31 December 2005 412 Consolidated Balance Sheet 413 Consolidated Cash Flow Statement 414 Consolidated Statement of Recognised Income and Expense 415 Consolidated Statement of Changes in Equity 416 Notes to the Roche Group Consolidated Financial Statements 417 Report of the Group Auditors 486

Page 215
AUDITED CONSOLIDATED FINANCIALS STATEMENTS OF THE ROCHE GROUP AS AT AND FOR THE YEAR ENDED 31 DECEMBER 2008*
* Please note that the page numbers at the top of the pages in this section are the page numbers from the
original 2008 Annual Report, Part 2 Finance Report commencing on page 28 and ending on page 123 (comprising in total 96 pages).
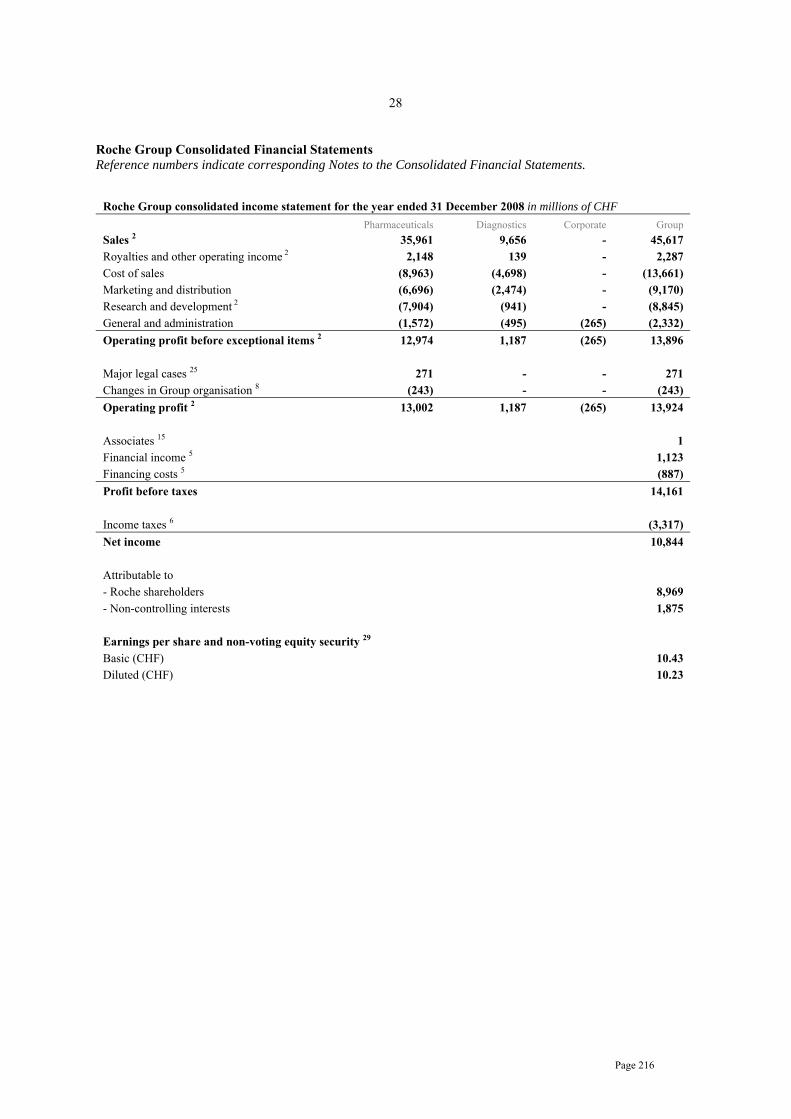
Page 216
28
Roche Group Consolidated Financial Statements Reference numbers indicate corresponding Notes to the Consolidated Financial Statements.
Roche Group consolidated income statement for the year ended 31 December 2008 in millions of CHF
Pharmaceuticals Diagnostics Corporate Group Sales 2 35,961 9,656 - 45,617 Royalties and other operating income 2 2,148 139 - 2,287 Cost of sales (8,963) (4,698) - (13,661) Marketing and distribution (6,696) (2,474) - (9,170) Research and development 2 (7,904) (941) - (8,845) General and administration (1,572) (495) (265) (2,332) Operating profit before exceptional items 2 12,974 1,187 (265) 13,896 Major legal cases 25 271 - - 271 Changes in Group organisation 8 (243) - - (243) Operating profit 2 13,002 1,187 (265) 13,924 Associates 15 1 Financial income 5 1,123 Financing costs 5 (887) Profit before taxes 14,161 Income taxes 6 (3,317) Net income 10,844 Attributable to - Roche shareholders 8,969 - Non-controlling interests 1,875 Earnings per share and non-voting equity security 29 Basic (CHF) 10.43 Diluted (CHF) 10.23

Page 217
29
Roche Group consolidated income statement for the year ended 31 December 2007 in millions of CHF
Pharmaceuticals Diagnostics Corporate Group Sales 2 36,783 9,350 - 46,133 Royalties and other operating income 2 2,057 186 - 2,243 Cost of sales (9,502) (4,241) - (13,743) Marketing and distribution (7,018) (2,309) - (9,327) Research and development 2 (7,598) (787) - (8,385) General and administration (1,680) (551) (222) (2,453) Operating profit 2 13,042 1,648 (222) 14,468 Associates 15 2 Financial income 5 1,805 Financing costs 5 (971) Profit before taxes 15,304 Income taxes 6 (3,867) Net income 11,437 Attributable to - Roche shareholders 9,761 - Non-controlling interests 1,676 Earnings per share and non-voting equity security 29 Basic (CHF) 11.36 Diluted (CHF) 11.16

Page 218
30
Roche Group consolidated balance sheet in millions of CHF
31 December
2008 31 December
2007 Non-current assets Property, plant and equipment 12 18,190 17,832 Goodwill 13 8,353 6,835 Intangible assets 14 7,121 6,346 Associates 15 9 9 Financial long-term assets 16 940 1,333 Other long-term assets 16 451 527 Deferred income tax assets 6 1,829 1,317 Post-employment benefit assets 10 592 1,332 Total non-current assets 37,485 35,531 Current assets Inventories 17 5,830 6,113 Accounts receivable 18 9,755 9,804 Current income tax assets 6 268 263 Other current assets 19 1,980 2,452 Marketable securities 20 15,856 20,447 Cash and cash equivalents 21 4,915 3,755 Total current assets 38,604 42,834 Total assets 76,089 78,365 Non-current liabilities Long-term debt 27 (2,972) (3,834) Deferred income tax liabilities 6 (1,409) (1,527) Post-employment benefit liabilities 10 (4,669) (3,696) Provisions 25 (654) (688) Other non-current liabilities 26 (459) (723) Total non-current liabilities (10,163) (10,468) Current liabilities Short-term debt 27 (1,117) (3,032) Current income tax liabilities 6 (2,193) (2,215) Provisions 25 (804) (1,517) Accounts payable 22 (2,017) (1,861) Accrued and other current liabilities 23 (5,973) (5,829) Total current liabilities (12,104) (14,454) Total liabilities (22,267) (24,922) Total net assets 53,822 53,443 Equity Capital and reserves attributable to Roche shareholders 28 44,479 45,483 Equity attributable to non-controlling interests 30 9,343 7,960 Total equity 53,822 53,443
As disclosed in Note 1, post-employment benefit assets, deferred tax liabilities and equity have been restated in the 31 December 2007 balance sheet following the adoption of IFRIC interpretation 14 in 2008. A reconciliation to the previously published balance sheet is provided in Note 1.

Page 219
31
Roche Group consolidated cash flow statement in millions of CHF
Year ended 31 December 2008 2007
Cash flows from operating activities Cash generated from operations 31 17,626 18,480 (Increase) decrease in working capital (524) (1,207) Payments made for defined benefit post-employment plans 10 (353) (352) Utilisation of provisions 25 (1,061) (696) Other operating cash flows 3 (3) Cash flows from operating activities, before income taxes paid 15,691 16,222 Income taxes paid (3,514) (4,494) Total cash flows from operating activities 12,177 11,728 Cash flows from investing activities Purchase of property, plant and equipment (3,139) (3,519) Purchase of intangible assets (418) (946) Disposal of property, plant and equipment 69 116 Disposal of intangible assets - - Disposal of products 472 247 Business combinations 7 (3,004) (2,310) Divestments of subsidiaries 34 40 - Interest and dividends received 31 611 1,079 Sales of marketable securities 16,666 13,165 Purchases of marketable securities (12,758) (13,377) Other investing cash flows (261) (243) Total cash flows from investing activities (1,722) (5,788) Cash flows from financing activities Proceeds from issue of long-term debt instruments 27 - 719 Repayment and redemption of long-term debt instruments 27 (2,188) (1,908) Increase (decrease) in other long-term debt (234) 4 Increase (decrease) in short-term borrowings (190) (389) Transactions in own equity instruments 28 (98) 1,085 Change in ownership interest in subsidiaries - Chugai 4 (934) - - Ventana 7 (1,285) - Interest and dividends paid 31 (4,267) (3,324) Exercises of equity-settled equity compensation plans 11 598 450 Genentech and Chugai share repurchases 3, 4 (844) (1,895) Other financing cash flows - (12) Total cash flows from financing activities (9,442) (5,270) Net effect of currency translation on cash and cash equivalents 147 (125) Increase (decrease) in cash and cash equivalents 1,160 545 Cash and cash equivalents at 1 January 3,755 3,210 Cash and cash equivalents at 31 December 21 4,915 3,755

Page 220
32
Roche Group consolidated statement of recognised income and expense in millions of CHF Year ended 31 December 2008 2007
Available-for-sale investments - Valuation gains (losses) taken to equity 28 (671) (198) - Transferred to income statement on sale or impairment 28 163 (128) Cash flow hedges - Gains (losses) taken to equity 28 (55) (45) - Transferred to income statement 28 83 (3) - Transferred to the initial balance sheet carrying value of hedged items 28 - - Currency translation of foreign operations - Exchange differences 28 (2,982) (1,906) - Accumulated differences transferred to income statement on divestment 28 (16) - Defined benefit post-employment plans - Actuarial gains (losses) 28 (2,820) 1,178 - Limit on asset recognition 28 636 (636) Income taxes on items taken directly to or transferred from equity 28 738 (214) Net income recognised directly in equity (4,924) (1,952) Net income recognised in income statement 10,844 11,437 Total recognised income and expense 5,920 9,485 Attributable to - Roche shareholders 28 4,285 8,341 - Non-controlling interests 30 1,635 1,144 Total 5,920 9,485 Effect of changes in accounting policy attributable to - Roche shareholders 1 - 297 - Non-controlling interests 1 - - Total - 297
As disclosed in Note 1, the entries for defined benefit post-employment plans have been restated in the statement of recognised income and expense for 2007 following the adoption of IFRIC interpretation 14 in 2008. A reconciliation to the previously published statement of recognised income and expense is provided in Note 1.

Page 221
33
Roche Group consolidated statement of changes in equity in millions of CHF
Roche
shareholders Non-controlling
interests Total Year ended 31 December 2007 At 1 January 2007 – as previously published 39,444 7,370 46,814 Changes in accounting policy 1 297 - 297 At 1 January 2007 – restated 39,741 7,370 47,111 Net income recognised directly in equity (1,420) (532) (1,952) Net income recognised in income statement 9,761 1,676 11,437 Total recognised income and expense 8,341 1,144 9,485 Dividends paid 28, 30 (2,930) (97) (3,027) Transactions in own equity instruments 28 1,085 - 1,085 Equity compensation plans 28, 30 559 449 1,008 Genentech and Chugai share repurchases 28, 30 (1,044) (851) (1,895) Convertible debt instruments 28, 30 (324) - (324) Changes in non-controlling interests 28, 30 55 (55) - At 31 December 2007 45,483 7,960 53,443 Year ended 31 December 2008 At 1 January 2008 45,483 7,960 53,443 Net income recognised directly in equity (4,684) (240) (4,924) Net income recognised in income statement 8,969 1,875 10,844 Total recognised income and expense 4,285 1,635 5,920 Ventana acquisition 7 - 321 321 Dividends paid 28, 30 (3,969) (95) (4,064) Transactions in own equity instruments 28 (98) - (98) Equity compensation plans 28, 30 789 574 1,363 Genentech and Chugai share repurchases 28, 30 (472) (372) (844) Changes in ownership interests in subsidiaries - Chugai 4 (530) (404) (934) - Ventana 7 (964) (321) (1,285) Changes in non-controlling interests 28, 30 (45) 45 - At 31 December 2008 44,479 9,343 53,822
As disclosed in Note 1, equity as at 1 January 2007 and the entries for defined benefit post-employment plans have been restated in the statement of recognised income and expense for 2007 following the adoption of IFRIC interpretation 14 in 2008. A reconciliation to the previously published statement of recognised income and expense is provided in Note 1.
Page 222
34 NOTES TO THE ROCHE GROUP CONSOLIDATED FINANCIAL STATEMENTS
1. SUMMARY OF SIGNIFICANT ACCOUNTING POLICIES
Basis of preparation of the consolidated financial statements The consolidated financial statements of the Roche Group have been prepared in accordance with International Financial Reporting Standards (IFRS) and comply with Swiss law. They have been prepared using the historical cost convention except that, as disclosed in the accounting policies below, certain items, including derivatives and available-for-sale investments, are shown at fair value. They were approved for issue by the Board of Directors on 29 January 2009 and are subject to approval by the Annual General Meeting of shareholders on 10 March 2009. The preparation of the consolidated financial statements requires management to make estimates and assumptions that affect the reported amounts of revenues, expenses, assets and liabilities, and the disclosure of contingent liabilities at the date of the financial statements. If in the future such estimates and assumptions, which are based on management’s best judgement at the date of the financial statements, deviate from the actual circumstances, the original estimates and assumptions will be modified as appropriate in the year in which the circumstances change. Changes in accounting policies that arise from the application of new or revised standards and interpretations are applied retrospectively, unless otherwise specified in the transitional requirements of the particular standard or interpretation. Retrospective application requires that the results of the comparative period and the opening balances of that period are restated as if the new accounting policy had always been applied. In some cases the transitional requirements of the particular standard or interpretation specify that the changes are to be applied prospectively. Prospective application requires that the new accounting policy only be applied to the results of the current period and the comparative period is not restated. In addition comparatives have been reclassified or extended from the previously reported results to take into account any presentational changes. Consolidation policy These financial statements are the consolidated financial statements of Roche Holding Ltd, a company registered in Switzerland, and its subsidiaries (‘the Group’). The subsidiaries are those companies controlled, directly or indirectly, by Roche Holding Ltd, where control is defined as the power to govern the financial and operating policies of an enterprise so as to obtain benefits from its activities. This control is normally evidenced when Roche Holding Ltd owns, either directly or indirectly, more than 50% of the voting rights or currently exercisable potential voting rights of a company’s share capital. Special Purpose Entities are consolidated where the substance of the relationship is that the Special Purpose Entity is controlled by the Group. Companies acquired during the year are consolidated from the date on which control is transferred to the Group, and subsidiaries to be divested are included up to the date on which control passes from the Group. Inter-company balances, transactions and resulting unrealised income are eliminated in full. Changes in ownership interests in subsidiaries are accounted for as equity transactions if they occur after control has already been obtained and if they do not result in a loss of control.

Page 223
35 Investments in associates are accounted for using the equity method. These are companies over which the Group exercises, or has the power to exercise, significant influence, but which it does not control. This is normally evidenced when the Group owns 20% or more of the voting rights or currently exercisable potential voting rights of the company. Balances and transactions with associates that result in unrealised income are eliminated to the extent of the Group’s interest in the associate. Interests in joint ventures are reported using the line-by-line proportionate consolidation method. Segment reporting The determination of the Group’s operating segments is based on the organisation units for which information is reported to the Group’s management. The Group has two divisions, Pharmaceuticals and Diagnostics. Revenues are primarily generated from the sale of prescription pharmaceutical products and diagnostic instruments, reagents and consumables, respectively. Both divisions also derive revenue from the sale or licensing of products or technology to third parties. Within the Pharmaceuticals Division there are three sub-divisions, Roche Pharmaceuticals, Genentech and Chugai. The three sub-divisions have separate management and reporting structures within the Pharmaceuticals Division and are considered separately reportable operating segments. Certain headquarter activities are reported as ‘Corporate’. These consist of corporate headquarters, including the Corporate Executive Committee, corporate communications, corporate human resources, corporate finance, including treasury, taxes and pension fund management, corporate legal and corporate safety and environmental services. Transfer prices between operating segments are set on an arm’s length basis. Operating assets and liabilities consist of property, plant and equipment, goodwill and intangible assets, trade receivables/payables, inventories and other assets and liabilities, such as provisions, which can be reasonably attributed to the reported operating segments. Non-operating assets and liabilities mainly include current and deferred income tax balances, post-employment benefit assets/liabilities and financial assets/liabilities such as cash, marketable securities, investments and debt. Foreign currency translation Most Group companies use their local currency as their functional currency. Certain Group companies use other currencies (such as US dollars, Swiss francs or euros) as their functional currency where this is the currency of the primary economic environment in which the entity operates. Local transactions in other currencies are initially reported using the exchange rate at the date of the transaction. Gains and losses from the settlement of such transactions and gains and losses on translation of monetary assets and liabilities denominated in other currencies are included in income, except when they are qualifying cash flow hedges or arise on monetary items that, in substance, form part of the Group’s net investment in a foreign entity. In such cases the gains and losses are deferred into equity. Upon consolidation, assets and liabilities of Group companies using functional currencies other than Swiss francs (foreign entities) are translated into Swiss francs using year-end rates of exchange. Sales, costs, expenses, net income and cash flows are translated at the average rates of exchange for the year. Translation differences due to the changes in exchange rates between the beginning and the end of the year and the difference between net income translated at the average and year-end exchange rates are taken directly to equity. On disposal of a foreign entity, the identified cumulative currency translation differences within equity relating to that foreign entity are recognised in income as part of the gain or loss on divestment. Revenues Sales represent amounts received and receivable for goods supplied to customers after deducting trade discounts, cash discounts and volume rebates, and exclude value added taxes and other taxes directly linked to sales. Revenues from the sale of products are recognised upon transfer to the customer of significant risks and rewards. Trade discounts, cash discounts and volume rebates are recorded on an accrual basis consistent with the recognition of the related sales. Estimates of expected sales returns, charge-backs and other rebates, including Medicaid in the United States and similar rebates in other countries, are also deducted from sales and recorded as accrued liabilities or provisions or as a deduction from accounts receivable. Such estimates are based on analyses of existing contractual or legislatively mandated obligations, historical trends and the Group’s experience. Other revenues are recorded as earned or as the services are
Page 224
36
performed. Where necessary, single transactions are split into separately identifiable components to reflect the substance of the transaction. Conversely, two or more transactions may be considered together for revenue recognition purposes, where the commercial effect cannot be understood without reference to the series of transactions as a whole. Cost of sales Cost of sales includes the corresponding direct production costs and related production overheads of goods sold and services rendered. Royalties, alliance and collaboration expenses, including all collaboration profit-sharing arrangements are also reported as part of cost of sales. Start-up costs between validation and the achievement of normal production capacity are expensed as incurred. Research and development In addition to its internal research and development activities, the Group is also party to in-licensing and similar arrangements with its alliance partners. The Group may also acquire in-process research and development assets, either through business combinations or through purchases of specific assets. Internal research costs are charged against income as incurred. Internal development costs are capitalised as intangible assets only when there is an identifiable asset that can be completed and that will generate probable future economic benefits and when the cost of such an asset can be measured reliably. The Group does not currently have any such internal development costs that qualify for capitalisation as intangible assets. Internal development costs are therefore charged against income as incurred since the criteria for their recognition as an asset are not met. In-process research and development assets acquired either through in-licensing arrangements, business combinations or separate purchases are capitalised as intangible assets as described below. Once available for use, such intangible assets are amortised on a straight-line basis over the period of the expected benefit and are reviewed for impairment at each reporting date. Licensing, milestone and other upfront receipts and payments Royalty income is recognised on an accrual basis in accordance with the substance of the respective licensing agreements. If the collectability of a royalty amount is not reasonably assured, those royalties are recognised as revenue when the cash is received. Certain Group companies receive from third parties upfront, milestone and other similar payments relating to the sale or licensing of products or technology. Revenue associated with performance milestones is recognised based on achievement of the deliverables as defined in the respective agreements. Upfront payments and licence fees for which there are subsequent deliverables are initially reported as deferred income and are recognised in income as earned over the period of the development collaboration or the manufacturing obligation. Payments made by Group companies to third parties and associates for such items are capitalised as intangible assets. Accounting and reporting of transactions between Roche, Genentech and Chugai Within the Group’s consolidated financial statements, transactions and balances between consolidated subsidiaries, such as between Genentech, Chugai and other Roche Group subsidiaries, are eliminated on consolidation. Genentech and Chugai are considered separately reportable operating segments for the purposes of the Group’s operating segment disclosures in Note 2. Additional information relating to Genentech and Chugai results is given in Notes 3 and 4, respectively. Profits on product sales between the Roche Pharmaceuticals, Genentech and Chugai operating segments are recorded as part of the segment results of the operating segment making the sale. Unrealised internal profits on inventories that have been sold by one operating segment to another but which have not yet been sold on to external customers as at the balance sheet date are eliminated as a consolidation entry at a Pharmaceuticals Division level.
Page 225
37
Additionally the results of each operating segment may include income received from another operating segment in respect of: • Royalties. • Licensing, milestone and other upfront payments. • Transfers in respect of research collaborations. These are recognised as income in the segment results of the operating segment receiving the income consistently with the accounting policies applied to third-party transactions and set out in these financial statements. Corresponding expenses are recorded in the other operating segment so that these eliminate at a Pharmaceuticals Division level. Employee benefits Wages, salaries, social security contributions, paid annual leave and sick leave, bonuses, and non-monetary benefits are accrued in the year in which the associated services are rendered by employees of the Group. Where the Group provides long-term employee benefits, the cost is accrued to match the rendering of the services by the employees concerned. Liabilities for long-term employee benefits are discounted to take into account the time value of money, where material. Pensions and other post-employment benefits Most employees are covered by defined benefit and defined contribution post-employment plans sponsored by Group companies. The Group’s contributions to defined contribution plans are charged to the appropriate income statement heading within the operating results in the year to which they relate. The accounting and reporting of defined benefit plans are based on recent actuarial valuations. The defined benefit obligations and service costs are calculated using the projected unit credit method. This reflects service rendered by employees to the dates of valuation and incorporates actuarial assumptions primarily regarding discount rates used in determining the present value of benefits, projected rates of remuneration growth and long-term expected rates of return for plan assets. Discount rates are based on the market yields of high-quality corporate bonds in the country concerned. Past service costs are allocated over the average period until the benefits become vested. Current and past service costs are charged to the appropriate income statement heading within the operating results. Pension plan administration and funding is overseen at a corporate level and any settlement gains and losses resulting from changes in funding arrangements are reported as general and administration expenses within the ‘Corporate’ segment. The expected returns on plan assets and interest costs are charged to financial income and financing costs, respectively. Actuarial gains and losses, which consist of differences between assumptions and actual experiences and the effects of changes in actuarial assumptions, are recorded directly in equity. Pension assets and liabilities in different defined benefit plans are not offset unless the Group has a legally enforceable right to use the surplus in one plan to settle obligations in the other plan. The recognition of pension assets is limited to the total of the present value of any future refunds from the plans or reductions in future contributions to the plans and any cumulative unrecognised past service costs. Adjustments arising from the limit on the recognition of assets for defined benefit plans are recorded directly in equity. Equity compensation plans Certain employees of the Group participate in equity compensation plans, including separate plans at Genentech and Chugai. The fair value of all equity compensation awards granted to employees is estimated at the grant date and recorded as an expense over the vesting period. The expense is charged to the appropriate income statement heading within the operating results. For equity-settled plans, an increase in equity is recorded for this expense and any subsequent cash flows from exercises of vested awards are recorded as changes in equity. For cash-settled plans, a liability is recorded, which is measured at fair value at each balance sheet date with any movements in fair value being recorded to the appropriate income statement heading within the operating results. Any subsequent cash flows from exercise of vested awards are recorded as a reduction of the liability.

Page 226
38
Property, plant and equipment Property, plant and equipment are initially recorded at cost of purchase or construction, and include all costs directly attributable to bringing the asset to the location and condition necessary for it to be capable of operating in the manner intended by management. These include items such as costs of site preparation, installation and assembly costs and professional fees. The net costs of testing whether the asset is functioning properly, including validation costs, are also included in the initially recorded cost of construction. Interest and other borrowing costs incurred with respect to qualifying assets are capitalised and included in the carrying value of the assets. Property, plant and equipment are depreciated on a straight-line basis, except for land, which is not depreciated. Estimated useful lives of major classes of depreciable assets are as follows: Land improvements 40 years Buildings 10-50 years Machinery and equipment 5-15 years Diagnostic instruments 3-5 years Office equipment 3 years Motor vehicles 5 years Where parts of an item of property, plant and equipment have different useful lives, they are accounted for as separate components. The estimated useful life of the assets is regularly reviewed and, if necessary, the future depreciation charge is accelerated. Repairs and maintenance costs are expensed as incurred. Leases Where the Group is the lessee, leases of property, plant and equipment where the Group has substantially all of the risks and rewards of ownership are classified as finance leases. Finance leases are capitalised at the start of the lease at fair value, or the present value of the minimum lease payments, if lower. The rental obligation, net of finance charges, is reported within debt. Assets acquired under finance leases are depreciated in accordance with the Group’s policy on property, plant and equipment. If there is no reasonable certainty that the Group will obtain ownership by the end of the lease term, the asset is depreciated over the shorter of the lease term and its useful life. The interest element of the lease payment is charged against income over the lease term based on the effective interest rate method. Leases where substantially all of the risks and rewards of ownership are not transferred to the Group are classified as operating leases. Payments made under operating leases are charged against income on a straight-line basis over the period of the lease. Where the Group is the lessor, which primarily occurs in the Diagnostics Division, assets subject to finance leases are initially reported as receivables at an amount equal to the net investment in the lease. Assets subject to operating leases are reported within property, plant and equipment. Lease income from finance leases is subsequently recognised as earned income over the term of the lease based on the effective interest rate method. Lease income from operating leases is recognised over the lease term on a straight-line basis. Business combinations and goodwill Business combinations are accounted for using the purchase method of accounting. The cost of acquisition is the consideration given in exchange for control over the identifiable assets, liabilities and contingent liabilities of the acquired company. This consideration includes the cash paid plus the fair value at the date of exchange of assets given, liabilities incurred or assumed and equity instruments issued by the Group. Contingent consideration arrangements are included in cost of acquisition at fair value. Directly attributable transaction costs are expensed in the current period and reported within general and administration expenses. The acquired net assets, being the identifiable assets, liabilities and contingent liabilities, are initially recognised at fair value. Where the Group does not acquire 100% ownership of the acquired company non-controlling interests are recorded as the proportion of the fair value of the acquired net assets attributable to the non-controlling interest. Goodwill is recorded as the surplus of the cost of acquisition over the Group’s interest in the fair value of the acquired net assets. Any goodwill and fair value adjustments are recorded as assets and liabilities of the acquired company in the functional currency of that company. Goodwill is not amortised, but is assessed for possible impairment at each balance sheet date and is additionally tested annually for impairment.

Page 227
39
Goodwill may also arise upon investments in associates, being the surplus of the cost of investment over the Group’s share of the fair value of the net identifiable assets. Such goodwill is recorded within investments in associates. Changes in ownership interests in subsidiaries are accounted for as equity transactions if they occur after control has already been obtained and if they do not result in a loss of control. Intangible assets Purchased patents, licences, trademarks and other intangible assets are initially recorded at cost. Where these assets have been acquired through a business combination, this will be the fair value allocated in the acquisition accounting. Intangible assets are amortised over their useful lives on a straight-line basis beginning from the point when they are available for use. Estimated useful life is the lower of the legal duration and the economic useful life. The estimated useful life of intangible assets is regularly reviewed. Impairment of property, plant and equipment and intangible assets An impairment assessment is carried out when there is evidence that an asset may be impaired. In addition intangible assets that are not yet available for use are tested for impairment annually. When the recoverable amount of an asset, being the higher of its fair value less costs to sell and its value in use, is less than its carrying value, then the carrying value is reduced to its recoverable amount. This reduction is reported in the income statement as an impairment loss. Value in use is calculated using estimated cash flows, generally over a five-year period, with extrapolating projections for subsequent years. These are discounted using an appropriate long-term pre-tax interest rate. When an impairment loss arises, the useful life of the asset in question is reviewed and, if necessary, the future depreciation/amortisation charge is accelerated. The impairment of financial assets is discussed below in the ‘Financial assets’ policy. Impairment of goodwill Goodwill is assessed for possible impairment at each balance sheet date and is additionally tested annually for impairment. Goodwill is allocated to cash-generating units as described in Note 13. When the recoverable amount of the cash-generating unit, being the higher of its fair value less costs to sell or its value in use, is less than its carrying value, then the carrying value of the goodwill is reduced to its recoverable amount. This reduction is reported in the income statement as an impairment loss. The methodology used in the impairment testing is further described in Note 13. Inventories Inventories are stated at the lower of cost and net realisable value. The cost of finished goods and work in process includes raw materials, direct labour and other directly attributable costs and overheads based upon the normal capacity of production facilities. Cost is determined using the weighted average method. Net realisable value is the estimated selling price less cost to completion and selling expenses. Accounts receivable Accounts receivable are carried at the original invoice amount less allowances made for doubtful accounts, trade discounts, cash discounts, volume rebates and similar allowances. An allowance for doubtful accounts is recorded for the difference between the carrying value and the recoverable amount where there is objective evidence that the Group will not be able to collect all amounts due. Trade discounts, cash discounts, volume rebates and similar allowances are recorded on an accrual basis consistent with the recognition of the related sales, using estimates based on existing contractual obligations, historical trends and the Group’s experience. Long-term accounts receivable are discounted to take into account the time value of money, where material. Cash and cash equivalents Cash and cash equivalents include cash on hand and time, call and current balances with banks and similar institutions. Such balances are only reported as cash if they are readily convertible to known amounts of cash, are subject to insignificant risk of changes in value and have a maturity of three months or less from the date of acquisition. This definition is also used for the cash flow statement.

Page 228
40
Provisions Provisions are recognised where a legal or constructive obligation has been incurred which will probably lead to an outflow of resources that can be reasonably estimated. In particular, restructuring provisions are recognised when the Group has a detailed formal plan that has either commenced implementation or been announced. Provisions are recorded for the estimated ultimate liability that is expected to arise, taking into account foreign currency effects arising from their translation from their functional currency into Swiss francs and the time value of money, where material. A contingent liability is disclosed where the existence of the obligation will only be confirmed by future events or where the amount of the obligation cannot be measured with reasonable reliability. Contingent assets are not recognised, but are disclosed where an inflow of economic benefits is probable. Fair values Fair value is the amount for which a financial asset, liability or instrument could be exchanged between knowledgeable and willing parties in an arm’s length transaction. It is determined by reference to quoted market prices or by the use of established valuation techniques such as option pricing models and the discounted cash flow method if quoted prices in an active market are not available. Valuation techniques are typically used for derivative financial instruments. The fair values of financial assets and liabilities at the balance sheet date are not materially different from their reported carrying values unless specifically mentioned in the Notes to the Consolidated Financial Statements. Financial assets Financial assets, principally investments, including marketable securities, are classified as either ‘Fair-value-through-profit-or-loss’, ‘Available-for-sale’, ‘Held-to-maturity’ or ‘Loans and receivables’. Fair-value-through-profit-or-loss financial assets are either classified as held-for-trading or designated upon initial recognition. Held-for-trading financial assets are acquired principally to generate profit from short-term fluctuations in price. Financial assets are designated as fair-value-through-profit-or-loss if doing so results in more relevant information by eliminating a measurement or recognition inconsistency. Held-to-maturity financial assets are securities with a fixed maturity that the Group has the intent and ability to hold until maturity. Loans and receivables are financial assets created by the Group or acquired from the issuer in a primary market. They are non-derivative financial assets with fixed or determinable payments that are not quoted in an active market. All other financial assets are considered to be available-for-sale. All financial assets are initially recorded at fair value, including transaction costs, except for assets at fair-value-through-profit-or-loss, which exclude transaction costs. All purchases and sales are recognised on the settlement date. Fair-value-through-profit-or-loss financial assets are subsequently carried at fair value, with all changes in fair value recorded as financial income in the period in which they arise. Held-to-maturity financial assets are subsequently carried at amortised cost using the effective interest rate method. Available-for-sale financial assets are subsequently carried at fair value, with all unrealised changes in fair value recorded in equity except for interest calculated using the effective interest rate method and foreign exchange components. When the available-for-sale financial assets are sold, impaired or otherwise disposed of, the cumulative gains and losses previously recognised in equity are included in financial income for the current period. Loans and receivables are subsequently carried at amortised cost using the effective interest rate method. Financial assets are individually assessed for possible impairment at each balance sheet date. An impairment charge is recorded where there is objective evidence of impairment, such as where the issuer is in bankruptcy, default or other significant financial difficulty. In addition any available-for-sale equity securities that have a market value of more than 25% below their original cost, net of any previous impairment, will be considered as impaired. Any available-for-sale equity securities that have a market value below their original cost, net of any previous impairment, for a sustained six-month period will also be considered as impaired. Any decreases in the market price of less than 25% of original cost, net of any previous impairment, which are also for less than a sustained six-month period are not by themselves considered as objective evidence of impairment. Such movements in fair value are recorded in equity until there is objective evidence of impairment or until the asset is sold or otherwise disposed of. For financial assets carried at amortised cost, any impairment charge is the difference between the carrying value and the recoverable amount, calculated
Page 229
41
using estimated future cash flows discounted using the original effective interest rate. For available-for-sale financial assets, any impairment charge is the amount currently carried in equity for the difference between the original cost, net of any previous impairment, and the fair value. An impairment loss is reversed if the reversal can be related objectively to an event occurring after the impairment loss was recognised. For debt securities measured at amortised cost or available-for-sale, the reversal is recognised in income. For equity securities held available-for-sale, the reversal is recognised directly in equity. A financial asset is derecognised when the contractual cash flows from the asset expire or when the Group transfers the rights to receive the contractual cash flows from the financial assets in a transaction in which substantially all the risks and rewards of ownership of the financial asset are transferred. Any interest in transferred financial assets that is created or retained by the Group is recognised as a separate asset or liability. Derivatives Derivative financial instruments are initially recorded and subsequently carried at fair value. Apart from those derivatives designated as qualifying cash flow hedging instruments as discussed in the ‘Hedging’ policy below, all changes in fair value are recorded as financial income in the period in which they arise. Embedded derivatives are recognised separately if not closely related to the host contract and where the host contract is carried at amortised cost. Hedging For the purposes of hedge accounting, hedging relationships may be of three types. Fair value hedges are hedges of particular risks that may change the fair value of a recognised asset or liability. Cash flow hedges are hedges of particular risks that may change the amount or timing of future cash flows. Hedges of net investment in a foreign entity are hedges of particular risks that may change the carrying value of the net assets of a foreign entity. To qualify for hedge accounting the hedging relationship must meet several strict conditions on documentation, probability of occurrence (for cash flow hedges), hedge effectiveness and reliability of measurement. If these conditions are not met, then the relationship does not qualify for hedge accounting. In this case the hedging instrument and the hedged item are reported independently as if there were no hedging relationship. In particular any derivatives are reported at fair value, with changes in fair value included in financial income. For qualifying fair value hedges, the hedging instrument is recorded at fair value and the hedged item is recorded at its previous carrying value, adjusted for any changes in fair value that are attributable to the hedged risk. Any changes in the fair values are reported in financial income. For qualifying cash flow hedges, the hedging instrument is recorded at fair value. The portion of any change in fair value that is an effective hedge is included in equity, and any remaining ineffective portion is reported in financial income. If the hedging relationship is the hedge of the foreign currency risk of a firm commitment or highly probable forecasted transaction that results in the recognition of a non-financial asset or liability, the cumulative changes in the fair value of the hedging instrument that have been recorded in equity are included in the initial carrying value of the asset or liability at the date of recognition. For all other qualifying cash flow hedges, the cumulative changes in the fair value of the hedging instrument that have been recorded in equity are included in financial income when the forecasted transaction affects net income. For qualifying hedges of net investment in a foreign entity, the hedging instrument is recorded at fair value. The portion of any change in fair value that is an effective hedge is included in equity. Any remaining ineffective portion is recorded in financial income where the hedging instrument is a derivative and in equity in other cases. If the entity is disposed of, then the cumulative changes of fair value of the hedging instrument that have been recorded in equity are reclassified to income.

Page 230
42
Debt instruments Debt instruments are initially recorded at cost, which is the proceeds received, net of transaction costs. Subsequently they are reported at amortised cost. Any discount between the net proceeds received and the principal value due on redemption is amortised over the duration of the debt instrument and is recognised as part of financing costs using the effective interest rate method. Certain debt instruments may be designated as ‘fair-value-through-profit-or-loss’ where doing so results in more relevant information as it eliminates or significantly reduces measurement or recognition inconsistencies. Such debt instruments are reported at fair value, based on quoted prices in an active market, with movements in fair value reported within financial income. Those debt instruments that are designated as fair-value-through-profit-or-loss are disclosed in Note 27. The Group derecognises a financial liability when its contractual obligations are discharged, cancelled or expired. Taxation Income taxes include all taxes based upon the taxable profits of the Group, including withholding taxes payable on the distribution of retained earnings within the Group. Other taxes not based on income, such as property and capital taxes, are included within general and administration expenses. Liabilities for income taxes, mainly withholding taxes, which could arise on the remittance of retained earnings, principally relating to subsidiaries, are only recognised where it is probable that such earnings will be remitted in the foreseeable future. Deferred income tax assets and liabilities are recognised on temporary differences between the tax bases of assets and liabilities and their carrying values in the financial statements. Deferred income tax assets relating to the carry-forward of unused tax losses are recognised to the extent that it is probable that future taxable profit will be available against which the unused tax losses can be utilised. Current and deferred income tax assets and liabilities are offset when the income taxes are levied by the same taxation authority and when there is a legally enforceable right to offset them. Deferred income taxes are determined based on the currently enacted tax rates applicable in each tax jurisdiction where the Group operates. Discontinued businesses and non-current assets held for sale A discontinued business is a component of the Group’s business that represents a separate major line of business or geographical area of operations or is a subsidiary acquired exclusively with a view to resale. Reclassification as a discontinued business occurs upon disposal or when the operation meets the criteria to be classified as held for sale, if earlier. A disposal group is a group of assets that are to be disposed of as a group in a single transaction, together with the liabilities directly associated with those assets that will be transferred in the transaction. The assets and liabilities in a disposal group are reclassified as held for sale if their value will be recovered principally through a sale rather than through continuing use. The disposal group must be available for sale in its current condition and the sale must be highly probable. Immediately before classification as held for sale, the measurement of all assets and liabilities in a disposal group is updated in accordance with applicable accounting policies. Then, on initial classification as held for sale, disposal groups are recognised at the lower of carrying value and fair value less costs to sell. Impairment losses on initial classification as held for sale are included in the income statement. Own equity instruments The Group’s holdings in its own equity instruments are recorded as a deduction from equity. The original purchase cost, consideration received for subsequent resale of these equity instruments and other movements are reported as changes in equity. These instruments have been acquired primarily to meet the potential obligations to employees that may arise in respect of certain of the Group’s equity compensation plans.
Page 231
43
Management judgements made in applying accounting policies The application of the Group’s accounting policies may require management to make judgements, apart from those involving estimates, that can have a significant effect on the amounts recognised in the consolidated financial statements. Management judgement is particularly required when assessing the substance of transactions that have a complicated structure or legal form. These include, but are not limited to, the following areas: Revenue recognition: The nature of the Group’s business is such that many sales transactions do not have a simple structure. Sales agreements may consist of multiple components occurring at different times. The Group is also party to various out-licensing agreements, which can involve upfront and milestone payments that may occur over several years. These agreements may also involve certain future obligations. Revenue is only recognised when, in management’s judgement, the significant risks and rewards of ownership have been transferred and when the Group does not retain continuing managerial involvement or effective control over the goods sold or when the obligation has been fulfilled. For some transactions this can result in cash receipts being initially recognised as deferred income and then released to income over subsequent periods on the basis of the performance of the conditions specified in the agreement. Consolidation of subsidiaries and associates: The Group periodically undertakes transactions that may involve obtaining the right to control or significantly influence the operations of other companies. These transactions include the acquisition of all or part of the equity of other companies, the purchase of certain assets and assumption of certain liabilities and contingent liabilities of other companies, and entering into alliance agreements with other companies. Also included are transactions involving Special Purpose Entities and similar vehicles. In all such cases management makes an assessment as to whether the Group has the right to control or significantly influence the other company’s operations, and based on this assessment the other company is consolidated as a subsidiary or associated company. In making this assessment management considers the underlying economic substance of the transaction and not only the contractual terms. Business combinations: Where the Group acquires control of another business, the cost of the acquisition has to be allocated to the assets, liabilities and contingent liabilities of the acquired business, with any residual recorded as goodwill. This process involves management making an assessment of the fair value of these items. Management judgement is particularly involved in the recognition and measurement of the following items: • Intellectual property. This may include patents, licences, trademarks and similar rights for currently marketed
products, and also the rights and scientific knowledge associated with projects that are currently in research or development phases.
• Contingencies such as legal and environmental matters. • Contingent consideration arrangements. • The recoverability of any accumulated tax losses previously incurred by the acquired company. In all cases management makes an assessment based on the underlying economic substance of the items concerned, and not only on the contractual terms, in order to fairly present these items. Leases: The Group is party to leasing arrangements, both as a lessee and as a lessor. The treatment of leasing transactions in the financial statements is mainly determined by whether the lease is considered to be an operating lease or a finance lease. In making this assessment, management looks at the substance of the lease, as well as the legal form, and makes a judgement about whether substantially all of the risks and rewards of ownership are transferred. Arrangements which do not take the legal form of a lease but that nevertheless convey the right to use an asset are also covered by such assessments. Key assumptions and sources of estimation uncertainty The preparation of the consolidated financial statements in conformity with IFRS requires management to make estimates and assumptions that affect the application of policies and reported amounts of assets, liabilities, income, expenses and related disclosures. The estimates and underlying assumptions are based on historical experience and various other factors that are believed to be reasonable under the circumstances, the results of which form the basis for making the judgements about carrying values of assets and liabilities that are not readily apparent from other sources. Actual results may differ from these estimates.

Page 232
44
The estimates and underlying assumptions are reviewed on an ongoing basis. Changes in accounting estimates may be necessary if there are changes in the circumstances on which the estimate was based, or as a result of new information or more experience. Such changes are recognised in the period in which the estimate is revised. The key assumptions about the future and key sources of estimation uncertainty that have a significant risk of causing a material adjustment to the carrying value of assets and liabilities within the next twelve months are described below. Sales allowances: The Group has provisions and accruals for expected sales returns, charge-backs and other rebates, including Medicaid in the United States and similar rebates in other countries, which at 31 December 2008 total 913 million Swiss francs. Such estimates are based on analyses of existing contractual or legislatively-mandated obligations, historical trends and the Group’s experience. Management believes that the total provisions and accruals for these items are adequate, based upon currently available information. As these deductions are based on management estimates, they may be subject to change as better information becomes available. Such changes that arise could impact the provisions and accruals recognised in the balance sheet in future periods and consequently the level of sales recognised in the income statement in future periods. Property, plant and equipment and intangible assets, including goodwill: The Group has property, plant and equipment with a carrying value of 18,190 million Swiss francs as disclosed in Note 12. Goodwill has a carrying value of 8,353 million Swiss francs (see Note 13) and intangible assets have a carrying value of 7,121 million Swiss francs (see Note 14). All of these assets are reviewed annually for impairment as described above. To assess whether any impairment exists, estimates are made of the future cash flows expected to result from the use of the asset and its eventual disposal. Actual outcomes could vary significantly from such estimates of discounted future cash flows. Factors such as changes in the planned use of buildings, machinery or equipment, or closure of facilities, the presence or absence of competition, technical obsolescence or lower than anticipated sales of products with capitalised rights could result in shortened useful lives or impairment. Changes in the discount rates used could also lead to impairments. Pensions and other post-employment benefits: Many of the Group’s employees participate in post-employment defined benefit plans. The calculations of the recognised assets and liabilities from such plans are based upon statistical and actuarial calculations. In particular the present value of the defined benefit obligation is impacted by assumptions on discount rates used to arrive at the present value of future pension liabilities, and assumptions on future increases in salaries and benefits. Furthermore, the Group’s independent actuaries use statistically based assumptions covering areas such as future withdrawals of participants from the plan and estimates of life expectancy. At 31 December 2008 the present value of the Group’s defined benefit obligation is 10,504 million Swiss francs for funded plans and 3,078 million Swiss francs for unfunded plans (see Note 10). The actuarial assumptions used may differ materially from actual results due to changes in market and economic conditions, higher or lower withdrawal rates, longer or shorter life spans of participants, and other changes in the factors being assessed. These differences could impact the assets or liabilities recognised in the balance sheet in future periods. Legal provisions: Group companies are party to various legal proceedings, including claims arising from trade, and the most significant matters are described in Note 25. Legal provisions at 31 December 2008 total 223 million Swiss francs. Additional claims could be made which might not be covered by existing provisions or by insurance. There can be no assurance that there will not be an increase in the scope of these matters or that any future lawsuits, claims, proceedings or investigations will not be material. Such changes that arise could impact the provisions recognised in the balance sheet in future periods. Environmental provisions: The Group has provisions for environmental remediation costs, which at 31 December 2008 total 161 million Swiss francs, as disclosed in Note 25. The material components of the environmental provisions consist of costs to fully clean and refurbish contaminated sites and to treat and contain contamination at certain other sites. Future remediation expenses are affected by a number of uncertainties that include, but are not limited to, the detection of previously unknown contaminated sites,

Page 233
45
the method and extent of remediation, the percentage of waste material attributable to the Group at the remediation sites relative to that attributable to other parties, and the financial capabilities of the other potentially responsible parties. Management believes that the total provisions for environmental matters are adequate based upon currently available information. However, given the inherent difficulties in estimating liabilities in this area, it cannot be guaranteed that additional costs will not be incurred beyond the amounts accrued. The effect of the resolution of environmental matters on the results of operations cannot be predicted due to uncertainty concerning both the amount and the timing of future expenditures. Such changes that arise could impact the provisions recognised in the balance sheet in future periods. Income taxes: At 31 December 2008, the net liability for current income taxes is 1,925 million Swiss francs and the net asset for deferred income taxes is 420 million Swiss francs, as disclosed in Note 6. Significant estimates are required to determine the current and deferred assets and liabilities for income taxes. Some of these estimates are based on interpretations of existing tax laws or regulations. Management believes that the estimates are reasonable and that the recognised liabilities for income tax-related uncertainties are adequate. Various internal and external factors may have favourable or unfavourable effects on the income tax assets and liabilities. These factors include, but are not limited to, changes in tax laws, regulations and/or rates, changing interpretations of existing tax laws or regulations, future levels of research and development spending and changes in overall levels of pre-tax earnings. Such changes that arise could impact the assets and liabilities recognised in the balance sheet in future periods. Changes in accounting policies In 2007 the Group early adopted IFRS 8 ‘Operating Segments’ and IAS 23 (revised) ‘Borrowing Costs’ which are required to be implemented from 1 January 2009 at the latest. In 2008 the Group early adopted the revised versions of IFRS 3 ‘Business Combinations’ and IAS 27 ‘Consolidated and Separate Financial Statements’ that were published in early 2008 and which are required to be implemented from 1 January 2010 at the latest. The Group has implemented the amendments to IAS 39 ‘Financial Instruments: Recognition and Measurement’ and IFRS 7 ‘Financial Instruments: ‘Disclosures’ published in October 2008 relating to the reclassification of Financial Assets. The Group has also adopted IFRIC interpretation 14 which relates to IAS 19 ‘Employee benefits’. The Group is currently assessing the potential impacts of the other new and revised standards and interpretations that will be effective from 1 January 2009 and beyond, and which the Group has not early adopted. These include further revisions to IAS 1 ‘Presentation of Financial Statements’ and revisions to IFRS 2 ‘Share based Payment’. The Group does not anticipate that these will have a material impact on the Group’s overall results and financial position. IFRS 3 (revised) ’Business combinations’. Amongst other matters, the revised standard requires that directly attributable transaction costs are expensed in the current period, rather than being included in the cost of acquisition as previously. The revised standard also requires that contingent consideration arrangements should be included in acquisition accounting at fair value and expands the disclosure requirements for business combinations. The Group has applied the revised standard prospectively for all business combinations since 1 January 2008 and directly attributable transaction costs totalling 47 million Swiss francs have been expensed in 2008 that would have been included in the cost of acquisition under the previous accounting policy. Business combinations in 2007 and prior periods have not been restated. Had the new accounting policy been applied in 2007, the Group would have expensed an additional 15 million Swiss francs of directly attributable transaction costs in that year and goodwill would have been reduced by this amount. This change has a negative impact of 0.06 Swiss francs on earnings per share and non-voting equity security (basic and diluted) in 2008, and would have had a negative impact of 0.02 Swiss francs in 2007 if the revised standard had been applied retrospectively. IAS 27 (revised) ’Consolidated and separate financial statements’. Amongst other matters, the revised standard requires that changes in ownership interests in subsidiaries are accounted for as equity transactions if they occur after control has already been obtained and if they do not result in a loss of control. Additionally the revised standard renames “minority interests” as “non-controlling interests”. The Group has applied the revised standard retrospectively. There were no transactions in 2007 that required restatement.

Page 234
46
IAS 39 ‘Financial Instruments: Recognition and Measurement’ and IFRS 7 ‘Financial Instruments: Disclosures’. These amendments relate to the reclassification of financial assets and have been applied prospectively by the Group from 1 July 2008. The application of these amendments had no significant impact on the Group’s results. IFRIC interpretation 14 to IAS 19 ’Employee benefits’. The interpretation adds to the existing requirements of IAS 19 regarding the interaction between the limits on recognition of assets from defined benefit post-employment plans and any minimum funding requirement of such plans. Some of the Group’s plans do have a minimum funding requirement and the application of this interpretation results in an increase in the assets recorded on the Group’s balance sheet and a corresponding increase in the Group’s equity. The Group has applied the revised standard retrospectively which results in an impact of 297 million Swiss francs on equity as at 1 January 2007. The impacts on the previously published 31 December 2007 balance sheet and the statement of recognised income and expense for the year then ended are shown in the tables below. The application of the interpretation has no impact on net income and earnings per share.
Restated balance sheet (selected items) at 31 December 2007 in millions of CHF
As originally
published Application of IFRIC 14
Group restated
Post-employment benefit assets 1,150 182 1,332 Deferred tax liabilities (1,481) (46) (1,527) 136 Capital and reserves attributable to Roche shareholders 45,347 136 45,483
Restated statement of recognised income and expense for the year ended 31 December 2007 in millions of CHF
As originally
published Application of IFRIC 14
Group Restated
Available-for-sale investments - Valuation gains (losses) taken to equity (198) - (198) - Transferred to income statement on sale or impairment (128) - (128) Cash flow hedges - Gains (losses) taken to equity (45) - (45) - Transferred to income statement (3) - (3) - Transferred to the initial balance sheet carrying value of hedged items - - - Exchange differences on translation of foreign operations (1,906) - (1,906) Defined benefit post-employment plans - Actuarial gains (losses) 1,178 - 1,178 - Limit on asset recognition (422) (214) (636) Income taxes on items taken directly to or transferred from equity (267) 53 (214) Net income recognised directly in equity (1,791) (161) (1,952) Net income recognised in income statement 11,437 - 11,437 Total recognised income and expense 9,646 (161) 9,485 Attributable to - Roche shareholders 8,502 (161) 8,341 - Non-controlling interests 1,144 - 1,144 Total 9,646 (161) 9,485

Page 235
47 2. OPERATING SEGMENT INFORMATION
Divisional information in millions of CHF Pharmaceuticals Division Diagnostics Division Corporate Group 2008 2007 2008 2007 2008 2007 2008 2007
Revenues from external customers Sales 35,961 36,783 9,656 9,350 - - 45,617 46,133 Royalties and other operating income 2,148 2,057 139 186 - - 2,287 2,243 Total 38,109 38,840 9,795 9,536 - - 47,904 48,376 Revenues from other operating segments Sales 8 8 9 5 - - 17 13 Royalties and other operating income - - - - - - - - Elimination of inter-divisional revenue (17) (13) Total 8 8 9 5 - - - - Segment results Operating profit before exceptional items 12,974 13,042 1,187 1,648 (265) (222) 13,896 14,468 Major legal cases 271 - - - - - 271 - Changes in Group organisation (243) - - - - - (243) - Operating profit 13,002 13,042 1,187 1,648 (265) (222) 13,924 14,468 Capital expenditure Business combinations 631 1,165 3,266 1,186 - - 3,897 2,351 Additions to property, plant and equipment 1,940 2,588 1,245 1,058 2 2 3,187 3,648 Additions to intangible assets 410 791 8 258 - - 418 1,049 Total capital expenditure 2,981 4,544 4,519 2,502 2 2 7,502 7,048 Research and development Research and development costs 7,904 7,598 941 787 - - 8,845 8,385 Other segment information Depreciation of property, plant and equipment 1,022 957 649 599 5 4 1,676 1,560 Amortisation of intangible assets 511 645 458 331 - - 969 976 Impairment of property, plant and equipment 20 4 8 2 - - 28 6 Impairment of goodwill - - - - - - - - Impairment of intangible assets 99 58 5 - - - 104 58 Equity compensation plan expenses 469 568 31 26 13 14 513 608

Page 236
48
Pharmaceutical sub-divisional information in millions of CHF
Roche
Pharmaceuticals Genentech Chugai Pharmaceuticals
Division 2008 2007 2008 2007 2008 2007 2008 2007
Revenues from external customers Sales 22,164 22,970 10,461 10,414 3,336 3,399 35,961 36,783 Royalties and other operating income 898 900 1,196 1,078 54 79 2,148 2,057 Total 23,062 23,870 11,657 11,492 3,390 3,478 38,109 38,840 Revenues from other operating segments Sales 747 562 940 922 51 - 1,738 1,484 Royalties and other operating income 42 10 1,753 1,510 68 57 1,863 1,577 Elimination of revenue within division (3,593) (3,053) Total 789 572 2,693 2,432 119 57 8 8 Segment results Operating profit before exceptional items 6,795 7,225 5,821 5,298 591 610 13,207 13,133 Elimination of profit within division (233) (91) Sub-total 6,795 7,225 5,821 5,298 591 610 12,974 13,042 Major legal cases - - 271 - - - 271 - Changes in Group organisation (149) - (94) - - - (243) - Operating profit 6,646 7,225 5,998 5,298 591 610 13,002 13,042 Capital expenditure Business combinations 631 94 - 1,071 - - 631 1,165 Additions to property, plant and equipment 811 1,045 851 1,327 278 216 1,940 2,588 Additions to intangible assets 169 501 241 282 - 8 410 791 Total capital expenditure 1,611 1,640 1,092 2,680 278 224 2,981 4,544 Research and development Research and development costs 4,673 4,415 2,723 2,678 634 621 8,030 7,714 Elimination of costs within division (126) (116) Total 4,673 4,415 2,723 2,678 634 621 7,904 7,598 Other segment information Depreciation of property, plant and equipment 594 530 336 337 92 90 1,022 957 Amortisation of intangible assets 252 398 190 179 69 68 511 645 Impairment of property, plant and equipment 11 2 - - 9 2 20 4 Impairment of goodwill - - - - - - - - Impairment of intangible assets 99 16 - 42 - - 99 58 Equity compensation plan expenses 98 100 369 465 2 3 469 568

Page 237
49
Net operating assets in millions of CHF
2008 Assets
2007 2008 Liabilities
2007 2008 Net assets
2007 Roche Pharmaceuticals 16,112 16,384 (3,615) (3,288) 12,497 13,096 Genentech 12,404 12,993 (2,731) (4,049) 9,673 8,944 Chugai 4,715 3,663 (867) (561) 3,848 3,102 Elimination within division (748) (450) - - (748) (450) Pharmaceuticals Division 32,483 32,590 (7,213) (7,898) 25,270 24,692 Diagnostics Division 18,750 16,323 (2,141) (2,263) 16,609 14,060 Corporate 156 232 (248) (271) (92) (39) Total operating 51,389 49,145 (9,602) (10,432) 41,787 38,713 Non-operating 24,700 29,220 (12,665) (14,490) 12,035 14,730 Group 76,089 78,365 (22,267) (24,922) 53,822 53,443 Information by geographical area in millions of CHF
Revenues from external customers Non-current assets
Sales Royalties and other
operating income Property, plant and
equipment Goodwill and
intangible assets 2008 Switzerland 509 493 2,625 2,366 European Union 15,601 272 4,732 2,381 - of which Germany 3,200 252 3,321 2,334 Rest of Europe 1,521 16 43 3 Europe 17,631 781 7,400 4,750 United States 16,362 1,449 8,095 10,032 Rest of North America 932 1 117 90 North America 17,294 1,450 8,212 10,122 Latin America 2,975 2 397 22 Japan 3,532 54 1,807 579 Rest of Asia 2,920 - 287 - Asia 6,452 54 2,094 579 Africa, Australia and Oceania 1,265 - 87 1 Total 45,617 2,287 18,190 15,474

Page 238
50
Revenues from external customers
Non-current assets Non-current assets
Sales Royalties and other
operating income Property, plant and
equipment Goodwill and
intangible assets 2007 Switzerland 489 430 2,404 2,354 European Union 15,465 127 5,096 2,755 - of which Germany 3,277 117 3,437 2,699 Rest of Europe 1,620 - 53 4 Europe 17,574 557 7,553 5,113 United States 17,069 1,598 7,949 7,446 Rest of North America 1,004 3 126 19 North America 18,073 1,601 8,075 7,465 Latin America 2,784 - 454 42 Japan 3,562 85 1,382 559 Rest of Asia 2,681 - 254 - Asia 6,243 85 1,636 559 Africa, Australia and Oceania 1,459 - 114 2 Total 46,133 2,243 17,832 13,181 Sales are allocated to geographical areas by destination according to the location of the customer. Royalties and other operating income are allocated according to the location of the Group company that receives the revenue. European Union information is based on members of the EU as at 31 December 2008. Major customers The US national wholesale distributor, AmerisourceBergen Corp., represented approximately 6 billion Swiss francs (2007: 6 billion Swiss francs) of the Group’s revenues. Over 85% of these revenues were in the Genentech operating segment, with the residual in the Roche Pharmaceuticals and Diagnostics segments. The Group also reported substantial revenues from the US national wholesale distributors, Cardinal Health Inc. and McKesson Corp., and in total these three customers represented approximately a quarter of the Group’s revenues, the majority of this being at Genentech. 3. GENENTECH
Effective 7 September 1990 the Roche Group acquired a majority interest of approximately 60% of Genentech, Inc., a biotechnology company in the United States. On 13 June 1999 the Group exercised its option to acquire the remaining shares of Genentech on 30 June 1999, at which point Genentech became a 100% owned subsidiary of the Group. On 23 July 1999, 26 October 1999 and 29 March 2000 the Group completed public offerings of Genentech’s common stock, which reduced the Group’s majority interest to 60%. During 2004 the Group’s ownership of Genentech decreased by 2.45% due to the conversion and redemption of the ‘LYONs IV’ US dollar exchangeable notes. At 31 December 2008 the Group’s interest in Genentech was 55.8% (2007: 55.8%). The common stock of Genentech is publicly traded and is listed on the New York Stock Exchange, under the symbol ‘DNA’. Genentech prepares financial statements in conformity with accounting principles generally accepted in the United States (US GAAP). These are filed on a quarterly basis with the US Securities and Exchange Commission (SEC).

Page 239
51
Roche’s proposal to fully purchase Genentech On 21 July 2008 the Group announced a proposal to purchase all of the outstanding shares of Genentech common stock not owned by Roche at a price of USD 89.00 in cash per share, equivalent to a total cash payment of approximately 43.7 billion US dollars (the ‘Roche Proposal’). On 24 July 2008 Genentech announced that a special committee of its Board of Directors composed of its independent directors (the ‘Special Committee’) had been formed to review, evaluate, and, in the Special Committee’s discretion, negotiate and recommend or not recommend the acceptance of the Roche Proposal. On 13 August 2008 Genentech announced that the Special Committee did not support the proposal. The impacts of the Roche Proposal on the 2008 results are described in Note 8. Roche’s relationship with Genentech Genentech has entered into certain agreements with Roche, which are discussed below: Affiliation Arrangements: As a result of the June 1999 redemption of Genentech’s Special Common Stock and subsequent public offerings, Genentech amended their certificate of incorporation and bylaws and entered into or amended certain affiliation arrangements with Roche. Amongst other matters these cover the following areas: • Roche’s rights as a shareholder. • Roche’s rights to nominate members of Genentech’s Board of Directors. • Certain limitations on Roche’s ability to buy or sell Genentech’s common stock. • The process under which Roche may effect a merger of Genentech with Roche. • The approval of the directors designated by Roche should Genentech seek to make significant business acquisitions
or divestments. • The approval of the directors designated by Roche should Genentech seek to issue, repurchase or redeem its capital
stock. Genentech issues additional shares of common stock in connection with its equity compensation plans, and may issue additional shares for other purposes, which affects Roche’s percentage ownership interest. The affiliation agreement between Roche and Genentech provides, amongst other matters, that Genentech establishes a stock repurchase programme to maintain Roche’s percentage ownership interest in Genentech. Licensing Agreements: In July 1999 Roche and Genentech agreed an amended and restated licensing and marketing agreement granting Roche an option to license, use and sell Genentech’s products in non-US markets. This licensing and marketing agreement was subsequently amended to delete or add certain Genentech products under Roche’s commercialisation and marketing rights for Canada. In addition, Roche and Genentech have a July 1998 licensing and marketing agreement relating to anti-HER2 antibodies (Herceptin and pertuzumab), providing Roche with exclusive marketing rights outside of the US. Depending on the specific circumstances and the terms of the agreement, this may result in payments on an arm’s-length basis from Roche to Genentech, for any or all of the following matters: • Fees to extend Roche’s option to license a product. • Partial reimbursement of Genentech’s previously incurred development costs where Roche exercises an option to
license a product. • Milestones and similar payments, dependent upon the achievement of agreed objectives or performance targets. • Royalties on Roche’s aggregate sales of that product. Manufacturing Agreements: Genentech has agreed, in general, to manufacture for and supply to Roche its clinical requirements at cost and its commercial requirements on a cost plus basis. Roche has the right to manufacture Genentech’s products under certain circumstances. In July 2006, Roche and Genentech signed two new product supply agreements. The Umbrella Manufacturing Supply Agreement (or “Umbrella Agreement”) supersedes any existing product supply agreements. Under this agreement, Roche has agreed to purchase specified amounts of Herceptin and Avastin through 2012 and, on a perpetual basis, either party may order other collaboration products from the other, including Herceptin and Avastin after 2012.

Page 240
52
The Short-Term Supply Agreement (or “Short-Term Agreement”) supplements the terms of the Umbrella Agreement. Under this agreement, Roche has agreed to purchase specified amounts of Herceptin, Avastin and MabThera/Rituxan through 2008. Research Collaboration Agreement: In April 2004, Roche and Genentech entered into a research collaboration agreement that outlines the process by which the parties may agree to conduct and share in the costs of joint research on certain molecules. The agreement further outlines how development and commercialisation efforts will be coordinated with respect to select molecules, including the financial provisions for a number of different development and commercialisation scenarios undertaken by either or both parties. Tax Sharing Agreement: Roche and Genentech have a tax sharing agreement that relates to the US state and local tax returns in which they are consolidated or combined. Genentech calculates its tax liability or refund with the Group for these state and local jurisdictions as if Genentech were a stand-alone entity. Differences between IFRS and US GAAP Due to certain consolidation entries and differences in the requirements of International Financial Reporting Standards (IFRS) and US GAAP, there are differences between Genentech’s stand-alone financial results on a US GAAP basis and the financial results of Genentech as consolidated by the Roche Group in accordance with IFRS. Reconciliation of Genentech results
USD
millions
2008 CHF
millions USD
millions
2007 CHF
millions Operating income (US GAAP basis) 5,329 4,229 - Redemption and Tanox costs 172 126 - Equity compensation plan expenses (US GAAP basis) 399 403 - Tanox acquisition accounting (US GAAP basis) - (44) - Special litigation items and Roche proposal costs (246) 54 Operating income (non-US GAAP basis) 5,654 4,768 Add (deduct) differences and consolidation entries - Add back redemption and Tanox costs (172) (126) - Equity compensation plan expenses (IFRS basis) (341) (387) - Capitalised in-process research and development 179 204 - Changes in Group organisation reclassification 87 - - Other differences and consolidation entries (30) (45) Operating profit before exceptional items (IFRS basis) 5,377 5,821 4,414 5,298 Add (deduct) exceptional items - Major legal cases 250 271 - - - Changes in Group organisation (87) (94) - - Segment result / operating profit (IFRS basis) 5,540 5,998 4,414 5,298 Add (deduct) non-operating items (IFRS basis) - Financial income, financing costs and consolidation entries 98 172 - Income taxes (2,331) (2,189) Net income (IFRS basis) 3,765 3,281 Non-controlling interest calculation Non-controlling interest percentage (average during year) 44.1% 44.2% Income applicable to non-controlling interest (IFRS basis) 1,659 1,451
Translated at 1 USD = 1.08 CHF (2007: 1 USD = 1.20 CHF).

Page 241
53
Effective 1 January 2005 the Group implemented IFRS 2 ‘Share-based Payment’ in its IFRS financial statements. Amongst other matters, the standard required that the fair value of all equity compensation plans awarded to employees be estimated at grant date and recorded as an expense over the vesting period. The expense is charged against the appropriate income statement heading. The standard also required retrospective application, within certain transitional requirements. In 2008 a pre-tax expense of 341 million US dollars or 369 million Swiss francs relating to plans at Genentech has been recorded (2007: 387 million US dollars or 465 million Swiss francs). Effective 1 January 2006 Genentech implemented US Statement of Financial Accounting Standards No. 123R – ‘Share-Based Payment’ (FAS 123R) in its US GAAP financial statements. Amongst other matters, this required that companies reporting under US GAAP recognise compensation expenses for such plans. Due to the different dates of first application, measurement requirements and transitional arrangements of FAS 123R and IFRS 2, the expenses recorded by Genentech in its US GAAP financial statements for equity compensation plans are not the same as the expenses recorded in the Roche Group IFRS financial statements for these same plans. In 2005 the Group implemented IAS 38 (revised) ‘Intangible Assets’ in its IFRS financial statements. Amongst other matters, the revised standard typically results in more intangible assets being recognised from in-licensing arrangements and similar research and development alliances. In Genentech’s US GAAP financial statements such expenditure would usually be recorded as research and development expenses. There are other differences between IFRS and US GAAP, but these have a relatively minor impact. Genentech share repurchases On 15 April 2008 Genentech’s Board of Directors approved an extension of the existing stock repurchase programme authorising Genentech to repurchase up to 150 million shares of Genentech’s common stock for a total of 10 billion US dollars through 30 June 2009. Since the programme’s inception, Genentech has repurchased approximately 89 million shares for a total of approximately 6.5 billion US dollars. During 2008 the net cash outflow from repurchases of Genentech common stock was 780 million US dollars or 844 million Swiss francs (2007: 1,344 million US dollars or 1,613 million Swiss francs, which includes 300 million US dollars from the prepaid share repurchase program). Manufacturing agreements with Lonza Effective 8 December 2006 Genentech sold its wholly-owned subsidiary Genentech España, including the manufacturing facility in Porriño, Spain, to Lonza Group Ltd. (‘Lonza’) for 150 million US dollars. As part of this agreement Genentech has entered into a short-term supply contract with Lonza for the production of Avastin using a portion of the production capacity of the Porriño facility. At the same time Genentech has entered into a supply agreement for the manufacture of certain Genentech products at Lonza’s facility under construction in Singapore which is currently expected to receive US Food and Drug Administration (‘FDA’) licensure in 2010. Genentech is committed to fund the pre-commissioning production qualification costs at this facility and, upon FDA licensure, Genentech is committed to purchase 100% of products successfully manufactured at the facility for a period of three years after commissioning of the facility. The estimated total cost of these pre- and post-commissioning commitments is approximately 440 million US dollars. Genentech has also received an exclusive option to purchase the Lonza Singapore facility during the period from 2007 up to one year after FDA licensure for a purchase price of 290 million US dollars. Regardless of whether the purchase option is exercised, Genentech will be obliged to make a milestone payment of 70 million US dollars if certain performance milestones are met at the facility being constructed. For accounting purposes, due to the nature of the supply agreement and Genentech’s involvement in the construction of the buildings, Genentech is considered to be the owner of the assets during the construction period even though the funds to construct the building shell and some infrastructure costs are paid by Lonza.
Page 242
54
Genentech has also entered into a loan agreement with Lonza to advance up to 299 million US dollars to Lonza for the construction of the Singapore facility. As at 31 December 2008 a total of 225 million US dollars has been advanced (2007: 25 million US dollars). If Genentech exercises its option to purchase the facility then any outstanding advances may be offset against the purchase price. If Genentech does not exercise its purchase option then the advances may be offset against supply purchases. As at 31 December 2008, construction in progress totalling 284 million Swiss francs (2007: 182 million Swiss francs) has been capitalised and a net financing obligation totalling 46 million Swiss francs (2007: 155 million Swiss francs) has been recorded. Leasing arrangements In December 2004 Genentech entered into a Master Lease Agreement with Slough SSF LLC, which was subsequently acquired by Health Care Properties (‘HCP’) for the development of property adjacent to Genentech’s South San Francisco site. The development includes a total of eight buildings, which are subject to separate agreements as contemplated by the Master Lease Agreement. HCP as the developer will construct the building shell for each building and Genentech will finish the interior of each building as laboratory or office space, as applicable. The construction of the first buildings was completed in 2006, at which point the lease term for those buildings was deemed to begin. Construction of the final buildings was completed during 2008. The lease term expires twelve years from the occupation of the final building. Genentech has two five-year renewal options for each building and has an option to purchase the various buildings at different dates between 2016 and 2020. Genentech also has a right of first refusal with respect to each building or the entire development should HCP consider selling part or all of the development. As at 31 December 2008, based on the status of the development to date, the total carrying value of property, plant and equipment from this agreement was 239 million Swiss francs (2007: 261 million Swiss francs) and the carrying value of the leasing obligation was 291 million Swiss francs (2007: 305 million Swiss francs). Estimates of the total future minimum lease payments anticipated by the entire Master Lease Agreement are shown below. Estimated total future minimum lease payments under HCP leases in millions of CHF
Principal Ground lease Interest Total minimum
lease payment Within one year 12 7 19 38 Between one and five years 67 32 67 166 More than five years 208 55 53 316 Total 287 94 139 520 Other matters Details of other Genentech matters are given in the following Notes: • Acquisition of Tanox in 2007: Note 7. • Changes in Group organisation: Note 8. • Genentech’s equity compensation plans: Note 11. • Genentech legal cases: Note 25. • Genentech’s Senior Notes and Commercial Paper Program: Note 27. 4. CHUGAI
Effective 1 October 2002 the Roche Group and Chugai completed an alliance to create a leading research-driven Japanese pharmaceutical company, which was formed by the merger of Chugai and Roche’s Japanese pharmaceuticals subsidiary, Nippon Roche. The merged company, known as Chugai, is a fully consolidated subsidiary of the Group. At 31 December 2008 the Group’s interest in Chugai was 61.5% (2007: 51.5%).

Page 243
55
The common stock of Chugai is publicly traded and is listed on the Tokyo Stock Exchange under the stock code ‘TSE:4519’. Chugai prepares financial statements in conformity with accounting principles generally accepted in Japan (JGAAP). These are filed on a quarterly basis with the Tokyo Stock Exchange. Roche’s relationship with Chugai Chugai has entered into certain agreements with Roche, which are discussed below: Basic Alliance Agreement: As part of the Basic Alliance Agreement signed in December 2001, Roche and Chugai entered into certain arrangements covering the future operation and governance of Chugai. Amongst other matters these cover the following areas: • The structuring of the alliance. • Roche’s rights as a shareholder. • Roche’s rights to nominate members of Chugai’s Board of Directors. • Certain limitations to Roche’s ability to buy or sell Chugai’s common stock. Chugai issues additional shares of common stock in connection with its convertible debt and equity compensation plans, and may issue additional shares for other purposes, which affects Roche’s percentage ownership interest. The Basic Alliance Agreement provides, amongst other matters, that Chugai will guarantee Roche’s right to maintain its shareholding percentage in Chugai at not less than 50.1%. Licensing Agreements: Under the Japan Umbrella Rights Agreement signed in December 2001, Chugai has exclusive rights to market Roche’s pharmaceutical products in Japan. Chugai also has first right of refusal on the development and marketing in Japan of all development compounds advanced by Roche. Under the Rest of the World Umbrella Rights Agreement signed in May 2002, Roche has the right of first refusal on the development and marketing of Chugai’s development compounds in markets outside Japan, excluding South Korea, if Chugai decides that it requires a partner for such activities. Further to these agreements, Roche and Chugai have signed a series of separate agreements for certain specific products. Depending on the specific circumstances and the terms of the agreement, this may result in payments on an arm’s-length basis between Roche and Chugai, for any or all of the following matters: • Upfront payments, if a right of first refusal to license a product is exercised. • Milestone payments, dependent upon the achievement of agreed performance targets. • Royalties on future product sales. These specific product agreements may also cover the manufacture and supply of the respective products to meet the other party’s clinical and/or commercial requirements on an arm’s-length basis. Research Collaboration Agreements: Roche and Chugai have entered into research collaboration agreements in the areas of small molecule synthetic drug research and biotechnology based drug discovery. Differences between IFRS and JGAAP Due to certain consolidation entries and differences in the requirements of International Financial Reporting Standards (IFRS) and JGAAP, there are differences between Chugai’s stand-alone financial results on a JGAAP basis and the financial results of Chugai as consolidated by the Roche Group in accordance with IFRS. The acquisition by Roche of a 50.1% interest in Chugai was treated as a business combination for IFRS. For JGAAP the alliance was treated as a merger between Chugai and Nippon Roche. Therefore the JGAAP results of Chugai do not include the goodwill and fair value adjustments that are recorded in Roche’s results, and which are quantified in the table below. Moreover the acquisition accounting only includes Roche’s 50.1% of these fair value adjustments, based on applicable IFRS at that time, and therefore the impact of these on net income needs to be added back in the non-controlling interest calculations in Roche’s IFRS results.
Page 244
56
In Roche’s IFRS results, depreciation on property, plant and equipment is calculated using the straight-line method. In Chugai’s JGAAP results the reducing balance method is used. Additionally certain income and expenses, notably some restructuring costs, are required by JGAAP to be reported as extraordinary items. In Chugai’s JGAAP results extraordinary items are reported below the operating profit line. In Roche’s IFRS results such items are normally included as part of operating profit and are not treated as extraordinary or exceptional items. There are other differences between IFRS and JGAAP, but these have a relatively minor impact. Reconciliation of Chugai results
JPY
billions
2008 CHF
millions JPY
billions
2007 CHF
millions Operating profit (JGAAP basis) 51.6 66.7 - Depreciation basis difference 10.5 5.1 - Classification of extraordinary items 5.9 (1.3) - Other differences and consolidation entries (4.8) (4.0) Operating profit before acquisition accounting impacts (IFRS basis) 63.2 661 66.5 678 - Depreciation of property, plant and equipment (0.7) (7) (0.7) (7) - Amortisation of intangible assets arising from business combinations (6.0) (63) (6.0) (61) Operating profit (IFRS basis) 56.5 591 59.8 610 Add (deduct) Corporate and non-operating items (IFRS basis) - Financial income and financing costs 72 23 - Income taxes (241) (242) Net income (IFRS basis) 422 391 Non-controlling interest calculation Add back acquisition accounting impact on net income 42 41 Net income excluding acquisition accounting 464 432 Non-controlling interest percentage (average during year) 43.1% 48.7% Income applicable to non-controlling interest (IFRS basis) 200 211
Translated at 100 JPY = 1.05 CHF (2007: 1.02 CHF). Dividends The dividends distributed to third parties holding Chugai shares during 2008 totalled 74 million Swiss francs (2007: 91 million Swiss francs) and have been recorded against non-controlling interests (see Note 30). Dividends paid by Chugai to Roche are eliminated on consolidation as inter-company items. Tender offer for Chugai shares On 22 May 2008, the Group announced a tender offer to acquire additional common shares of Chugai to increase the Group’s ownership of Chugai’s issued shares from 50.1% to 59.9%. The tender offer was fully subscribed at the offer price of 1,730 Japanese yen per share and on 24 June 2008 the Group acquired 54.9 million common shares of Chugai for a cash consideration of 95.0 billion Japanese yen (912 million Swiss francs). Taking into account the shares that had previously been repurchased by Chugai but not retired, the Group’s ownership in Chugai’s outstanding shares increased to 61.5%. The total cash outflow of 934 million Swiss francs, including directly attributable costs of 22 million Swiss francs, has been recorded to equity as a change in ownership interest in subsidiaries.

Page 245
57
Chugai share repurchases There were no share repurchases in 2008. During 2007 Chugai repurchased 9.5 million of its common shares for a total consideration of 27.6 billion Japanese yen (282 million Swiss francs). As a result the Group’s ownership in Chugai increased to 51.5%. Other matters Details of Chugai’s equity compensation plans are given in Note 11. Details of the ‘Series 6 Chugai Pharmaceutical
Unsecured Convertible Bonds’ are given in Note 27. 5. FINANCIAL INCOME AND FINANCING COSTS
Financial income in millions of CHF Year ended 31 December 2008 2007
Gains on sale of equity securities 231 350 (Losses) on sale of equity securities (1) (8) Dividend income 5 8 Gains (losses) on equity security derivatives, net 13 (2) Write-downs and impairments of equity securities (115) (35) Net income from equity securities 133 313 Interest income 698 1,072 Gains on sale of debt securities 23 160 (Losses) on sale of debt securities (168) (185) Gains (losses) on debt security derivatives, net (44) - Net gains (losses) on financial assets at fair-value-through-profit-or-loss (64) 22 Write-downs and impairments of debt securities (53) (68) Net interest income and income from debt securities 392 1,001 Expected return on plan assets of defined benefit plans 10 688 670 Foreign exchange gains (losses), net (393) 110 Gains (losses) on foreign currency derivatives, net 328 (263) Net foreign exchange gains (losses) (65) (153) Net other financial income (expense) (25) (26) Total financial income 1,123 1,805 Financing costs in millions of CHF
Year ended 31 December 2008 2007
Interest expense (214) (281) Amortisation of discount on debt instruments (1) (8) Gains (losses) on debt derivatives, net (4) (2) Net gains (losses) on financial liabilities at fair-value-through-profit-or-loss 5 1 Time cost of provisions 25 (21) (69) Interest cost of defined benefit plans 10 (652) (612) Total financing costs (887) (971)
Page 246
58
Net financial income in millions of CHF Year ended 31 December 2008 2007
Financial income 1,123 1,805 Financing costs (887) (971) Net financial income 236 834 Financial result from Treasury management 200 776 Financial result from Pension management 36 58 Net financial income 236 834 Net gains (losses) on financial liabilities at fair-value-through-profit-or-loss includes the change in the fair value that is attributable to changes in the liabilities’ credit risk component. This is calculated by comparing the difference between the present value of the future cash flows on the bonds, discounted by using a swap yield curve based on LIBOR, and the market prices of the bonds. Due to a widening of the credit spread during 2008 relative to the swap yield curve, the change in fair value that is attributable to changes in the liabilities’ credit risk component was a gain of 6 million Swiss francs (2007: gain of 4 million Swiss francs). The cumulative change in fair value that is attributable to the change in credit risk since the issuance of the instruments was a gain of 27 million Swiss francs (2007: gain of 21 million Swiss francs). Interest expense on liabilities at fair-value-through-profit-or-loss was 76 million Swiss francs (2007: 106 million Swiss francs). Interest income includes interest on financial assets held at fair-value-through-profit-and-loss amount of 44 million Swiss francs (2007: 46 million Swiss francs). 6. INCOME TAXES
Income tax expenses in millions of CHF 2008 2007
Current income taxes (3,617) (4,976) Adjustments recognised for current tax of prior periods 35 83 Deferred income taxes 265 1,026 Total income (expense) (3,317) (3,867) Since the Group operates internationally, it is subject to income taxes in many different tax jurisdictions. The Group calculates its average expected tax rate as a weighted average of the tax rates in the tax jurisdictions in which the Group operates. This rate changes from year to year due to changes in the mix of the Group’s taxable income and changes in local tax rates. The average expected rate decreased in 2008 compared to 2007 due to lower taxable profits in certain high tax jurisdictions and certain one-time effects, notably a favourable change in tax rates in Basel that was effective in 2008. The Group’s effective tax rate can be reconciled to the Group’s average expected tax rate as follows: Reconciliation of the Group’s effective tax rate
2008 2007 Average expected tax rate 23.0% 23.7% Tax effect of - Utilisation of previously unrecognised tax losses -0.2% -0.0% - Non-taxable income/non-deductible expenses +1.2% +0.2% - Genentech equity compensation plans +0.5% +0.9% - Other differences -1.1% +0.5% Group’s effective tax rate before exceptional items 23.4% 25.3%

Page 247
59
2008 2007
Profit before tax
(mCHF)
Income taxes
(mCHF) Tax rate
(%)
Profit before tax
(mCHF)
Income taxes
(mCHF) Tax rate
(%) Roche (excluding Genentech and Chugai) 7,551 (802) 10.6 9,201 (1,436) 15.6 Genentech 5,919 (2,262) 38.2 5,470 (2,189) 40.0 Chugai 663 (241) 36.3 633 (242) 38.2 Group’s effective tax rate before exceptional items 14,133 (3,305) 23.4 15,304 (3,867) 25.3 Major legal cases 25 271 (105) 38.7 - - - Changes in Group organisation 8 (243) 93 38.3 - - - Group’s effective tax rate 14,161 (3,317) 23.4 15,304 (3,867) 25.3 Income tax assets (liabilities) in millions of CHF
2008 2007 Current income taxes - Assets 268 263 - Liabilities (2,193) (2,215) Net current income tax assets (liabilities) (1,925) (1,952) Deferred income taxes - Assets 1,829 1,317 - Liabilities (1,409) (1,527) Net deferred income tax assets (liabilities) 420 (210)
As disclosed in Note 1, post-employment benefit assets, deferred tax liabilities and equity have been restated in the 31 December 2007 balance sheet following the adoption of IFRIC interpretation 14 in 2008. A reconciliation to the previously published balance sheet is provided in Note 1.
Deferred income tax assets are recognised for tax loss carry forwards only to the extent that realisation of the related tax benefit is probable. The Group has unrecognised tax losses, including valuation allowances, as follows: Unrecognised tax losses: expiry in millions of CHF
Amount
2008 Applicable
tax rate Amount
2007 Applicable
tax rate Within one year - - 42 35% Between one and five years 68 22% 96 25% More than five years 223 31% 176 32% Total unrecognised tax losses 291 29% 314 30% Deferred income tax liabilities have not been established for the withholding tax and other taxes that would be payable on the unremitted earnings of certain foreign subsidiaries, as such amounts are currently regarded as permanently reinvested. These unremitted earnings totalled 41.7 billion Swiss francs at 31 December 2008 (2007: 38.8 billion Swiss francs). The deferred income tax assets and liabilities and the deferred income tax charges (credits) are attributable to the following items:

Page 248
60
Deferred income taxes: movements in recognised net assets (liabilities) in millions of CHF
Property, plant and equipment, and intangible
assets
Other temporary
differences Total Year ended 31 December 2007 Net deferred income tax asset (liability) at 1 January 2007 – restated 1 (2,717) 2,243 (474) BioVeris acquisition 7 (41) 41 - Tanox acquisition 7 (282) 41 (241) Other business combinations 7 (98) 54 (44) (Charged) credited to the income statement 309 717 1,026 (Charged) credited to equity from other recognised gains and losses 28 - (214) (214) (Charged) credited to equity from equity compensation plans and other transactions with shareholders - (209) (209) Currency translation effects and other 90 (144) (54) Net deferred income tax asset (liability) at 31 December 2007 (2,739) 2,529 (210) Year ended 31 December 2008 Net deferred income tax asset (liability) at 1 January 2008 (2,739) 2,529 (210) Ventana acquisition 7 (545) 123 (422) Other business combinations 7 (121) 2 (119) (Charged) credited to the income statement 157 108 265 (Charged) credited to equity from other recognised gains and losses 28 - 738 738 (Charged) credited to equity from equity compensation plans and other transactions with shareholders - 113 113 Currency translation effects and other 208 (153) 55 Net deferred income tax asset (liability) at 31 December 2008 (3,040) 3,460 420 7. BUSINESS COMBINATIONS
Acquisitions – 2008 Ventana: Ventana Medical Systems, Inc. (‘Ventana’), a publicly owned US company based in Tucson, Arizona that had been listed on the NASDAQ under the symbol ‘VMSI’. Prior to 8 February 2008, the Group owned shares in Ventana representing 0.4% of the outstanding shares of Ventana. Effective 8 February 2008 the Group acquired a further 70.5% of the outstanding shares of Ventana and obtained control of Ventana. Ventana develops, manufactures and markets instrument/reagent systems that automate slide preparation and staining in clinical histology and drug discovery laboratories. Ventana’s clinical systems are used in the diagnosis and treatment of cancer and infectious diseases and their drug discovery systems are used by pharmaceutical and biotechnology companies to accelerate the discovery of new drug targets and to evaluate the safety of new drug compounds. Ventana is now reported as part of the Diagnostics operating segment. The acquisition of Ventana, a leader in the fast-growing histopathology (tissue-based diagnostics) business segment, will allow the Group to broaden its diagnostic offerings and complement its world leadership in both in-vitro diagnostic systems and oncology therapies.

Page 249
61
The purchase consideration was 2,532 million Swiss francs in cash. This has been allocated as follows: Ventana acquisition: net assets acquired in millions of CHF
Carrying value
prior to acquisition Fair value
adjustments Carrying value
upon acquisition Property, plant and equipment 87 8 95 Goodwill 16 (16) - Intangible assets - Product intangibles: in use 17 802 819 - Product intangibles: not available for use - 570 570 Inventories 26 34 60 Deferred income taxes 120 (542) (422) Cash 45 - 45 Other net assets (liabilities) (47) (17) (64) Net identifiable assets 264 839 1,103 Non-controlling interests (321) Goodwill 1,750 Purchase consideration 2,532 Goodwill represents the strategic value to the Group of entering the tissue diagnostics business area. It also represents the premium paid over the traded market price to obtain control of the business. None of the goodwill recognised is expected to be deductible for income tax purposes. The non-controlling interests in Ventana were measured at their proportionate share (29.1%) of Ventana’s identifiable net assets. The fair value of other net assets (liabilities) includes receivables with a fair value of 117 million Swiss francs. Included within this fair value is an allowance for doubtful trade accounts receivable of 2 million Swiss francs. Finance lease receivables totalling 9 million Swiss francs are also included in this total and the gross amount due under these contracts is 9 million Swiss francs. The Group recognised a gain of 5 million Swiss francs as a result of measuring at fair value its 0.4% equity interest in Ventana held prior to the acquisition date. This gain is included in financial income for 2008. Directly attributable acquisition-related costs of 41 million Swiss francs were incurred in the transaction. These are reported within general and administration expenses in the current period as part of the operating result of the Diagnostics operating segment. Subsequent to the effective date of the acquisition on 8 February 2008, the Group purchased the remaining shares in Ventana held by third parties to give the Group a 100% interest in Ventana. The cash consideration was 1,285 million Swiss francs, which has been recorded to equity as a change in ownership interest in subsidiaries. Other acquisitions: Effective 23 May 2008 the Group acquired a 100% controlling interest in Piramed Ltd. ('Piramed'), a privately owned biotechnology company based in the UK. Piramed discovers and develops new medicines primarily for the treatment of cancer and immune inflammatory disorders such as arthritis and asthma. Piramed is a leading company in the discovery of highly selective drugs that inhibit different isoforms of PI3-K enzymes that are increasingly recognised as key players in a wide variety of disease processes. Piramed is reported as part of the Roche Pharmaceuticals operating segment. The acquisition will further strengthen the Group’s research and development pipeline in oncology and inflammatory disease. The purchase consideration was 183 million Swiss francs. This consisted of 176 million Swiss francs paid in cash and 7 million Swiss francs from a contingent consideration arrangement. The contingent consideration arrangement consists of a potential milestone payment of 15 million US dollars which is due upon the commencement of phase II clinical trials for Piramed’s oncology programme. A liability of 7 million US dollars (7 million Swiss francs) was recognised at the acquisition date, based on management’s best estimate of the probability–adjusted expected cash outflow from the arrangement. As at 31 December 2008 the amount recognised for this arrangement was unchanged, based on the most recent management estimates.
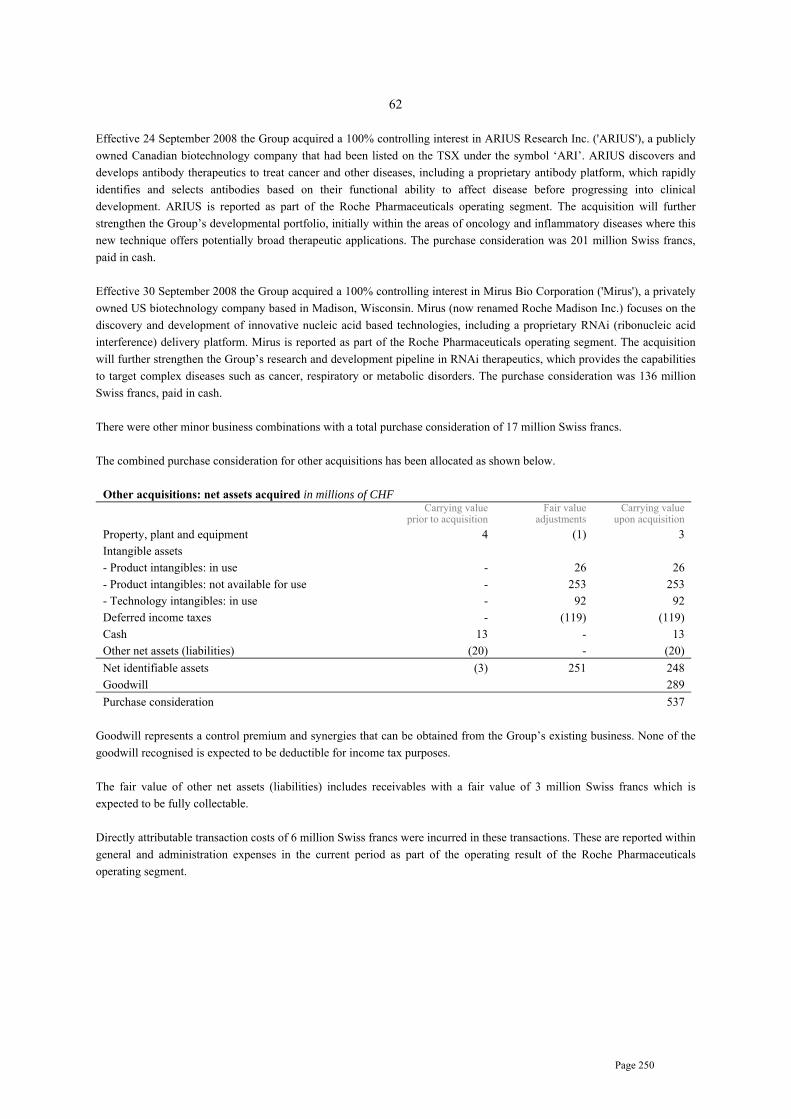
Page 250
62
Effective 24 September 2008 the Group acquired a 100% controlling interest in ARIUS Research Inc. ('ARIUS'), a publicly owned Canadian biotechnology company that had been listed on the TSX under the symbol ‘ARI’. ARIUS discovers and develops antibody therapeutics to treat cancer and other diseases, including a proprietary antibody platform, which rapidly identifies and selects antibodies based on their functional ability to affect disease before progressing into clinical development. ARIUS is reported as part of the Roche Pharmaceuticals operating segment. The acquisition will further strengthen the Group’s developmental portfolio, initially within the areas of oncology and inflammatory diseases where this new technique offers potentially broad therapeutic applications. The purchase consideration was 201 million Swiss francs, paid in cash. Effective 30 September 2008 the Group acquired a 100% controlling interest in Mirus Bio Corporation ('Mirus'), a privately owned US biotechnology company based in Madison, Wisconsin. Mirus (now renamed Roche Madison Inc.) focuses on the discovery and development of innovative nucleic acid based technologies, including a proprietary RNAi (ribonucleic acid interference) delivery platform. Mirus is reported as part of the Roche Pharmaceuticals operating segment. The acquisition will further strengthen the Group’s research and development pipeline in RNAi therapeutics, which provides the capabilities to target complex diseases such as cancer, respiratory or metabolic disorders. The purchase consideration was 136 million Swiss francs, paid in cash. There were other minor business combinations with a total purchase consideration of 17 million Swiss francs. The combined purchase consideration for other acquisitions has been allocated as shown below.
Other acquisitions: net assets acquired in millions of CHF
Carrying value
prior to acquisition Fair value
adjustments Carrying value
upon acquisition Property, plant and equipment 4 (1) 3 Intangible assets - Product intangibles: in use - 26 26 - Product intangibles: not available for use - 253 253 - Technology intangibles: in use - 92 92 Deferred income taxes - (119) (119) Cash 13 - 13 Other net assets (liabilities) (20) - (20) Net identifiable assets (3) 251 248 Goodwill 289 Purchase consideration 537
Goodwill represents a control premium and synergies that can be obtained from the Group’s existing business. None of the goodwill recognised is expected to be deductible for income tax purposes. The fair value of other net assets (liabilities) includes receivables with a fair value of 3 million Swiss francs which is expected to be fully collectable. Directly attributable transaction costs of 6 million Swiss francs were incurred in these transactions. These are reported within general and administration expenses in the current period as part of the operating result of the Roche Pharmaceuticals operating segment.

Page 251
63
Acquisitions – 2008: impact on results in millions of CHF
Revenues from external
customers
Inventory fair value
adjustment
Amortisation of intangible
assets Operating
profit Net income Impact on reported results Piramed - - - (10) (7) ARIUS - - - (6) (4) Mirus - - (2) (4) (2) Pharmaceuticals Division - - (2) (20) (13) Ventana 380 (33) (74) (59) (38) Minor business combinations - - - - - Diagnostics Division 380 (33) (74) (59) (38) Group 380 (33) (76) (79) (51) Estimated impact on results if acquisition assumed effective 1 January 2008 Piramed - - - (15) (11) ARIUS - - - (17) (11) Mirus - - (9) (13) (7) Pharmaceuticals Division - - (9) (45) (29) Ventana a) 405 - (80) (16) (10) Minor business combinations 8 - (5) (4) (3) Diagnostics Division 413 - (85) (20) (13) Group 413 - (94) (65) (42)
The above figures exclude directly attributable transaction costs of 6 million Swiss francs related to acquisitions by the Pharmaceuticals Division and 41 million Swiss francs related to acquisitions by the Diagnostics Division. Corresponding tax impacts are also excluded.
a) The figures exclude inventory fair value adjustments of 33 million Swiss francs and integration costs of 15 million Swiss francs related to Ventana. Corresponding tax impacts are also excluded.
Acquisitions – 2008 net cash outflow in millions of CHF
Cash consideration
paid Cash in
acquired company Net cash outflow
Ventana (2,532) 45 (2,487) Other acquisitions (530) 13 (517) Total (3,062) 58 (3,004) The above cash consideration paid for Ventana does not include the subsequent payment of 1,285 million Swiss francs to purchase the remaining shares in Ventana held by third parties to give the Group a 100% interest in Ventana. This is reported as financing cash flow in the cash flow statement within the heading ‘Change in ownership interest in subsidiaries’.

Page 252
64
Future acquisitions: The Group has announced a number of minor business combinations which are expected to be completed in the first half of 2009, subject to shareholder approval and regulatory clearance as appropriate. The total purchase consideration, excluding transaction costs, is estimated at approximately 77 million Swiss francs in cash. Funds will be provided from Group’s cash on hand at the time of closing. Acquisitions – 2007 BioVeris: Effective 26 June 2007 the Group acquired a 100% controlling interest in BioVeris Corporation (‘BioVeris’), a publicly owned US company that had been listed on the NASDAQ under the symbol ‘BIOV’. BioVeris is a healthcare and biosecurity company based in Gaithersburg, Maryland, that specialises in developing proprietary technologies in diagnostics. BioVeris is now reported as part of the Diagnostics operating segment. The purchase consideration was 745 million Swiss francs, which consisted of 741 million Swiss francs of cash and 4 million Swiss francs of directly attributable costs. This has been allocated as follows: BioVeris acquisition: net assets acquired in millions of CHF
Carrying value
prior to acquisition Fair value
adjustments Carrying value
upon acquisition Property, plant and equipment 5 - 5 Intangible assets - Product intangibles: in use 16 101 117 Deferred income taxes 8 (8) - Cash 6 - 6 Other net assets (liabilities) 77 - 77 Net identifiable assets 112 93 205 Goodwill 540 Purchase consideration 745 Goodwill represents assets that cannot be recognised separately and measured reliably and synergies that can be obtained from the Group’s existing electrochemiluminescence (ECL) immunochemistry business. It also represents the premium paid over the traded market price to obtain control of the business. Following the acquisition, restructuring expenses of 29 million Swiss francs were incurred. These were reported within general and administration expenses as part of the operating result for 2007 of the Diagnostics operating segment. Tanox: Effective 2 August 2007, Genentech acquired a 100% controlling interest in Tanox, Inc. (‘Tanox’), a publicly owned US company that had been listed on the NASDAQ under the symbol ‘TNOX’. Tanox is a biotechnology company based in Houston, Texas, that specialises in the discovery and development of biotherapeutics based on monoclonal antibody technology. Genentech and Tanox have been working together in collaboration with Novartis since 1996 to develop and commercialise Xolair. The purchase consideration was 1,124 million Swiss francs, which consisted of 1,114 million Swiss francs of cash and 10 million Swiss francs of directly attributable costs. This has been allocated as follows:

Page 253
65
Tanox acquisition: net assets acquired in millions of CHF
Carrying value
prior to acquisition Fair value
adjustments Carrying value
upon acquisition Property, plant and equipment 13 - 13 Intangible assets - Product intangibles: in use - 613 613 - Product intangibles: not available for use - 93 93 Deferred income taxes 9 (250) (241) Cash 120 - 120 Marketable securities 123 - 123 Other net assets (liabilities) 19 32 51 Net identifiable assets 284 488 772 Goodwill 352 Purchase consideration 1,124 Goodwill represents assets that cannot be recognised separately and measured reliably, such as early-stage research projects. It also represents the premium paid over the traded market price to obtain control of the business. Other acquisitions: Effective 28 March 2007 the Group acquired a 100% controlling interest in Therapeutic Human Polyclonals, Inc. ('THP'), a privately owned US biotechnology company based in California and Germany. THP is reported as part of the Roche Pharmaceuticals operating segment. The purchase consideration paid was 69 million Swiss francs in cash. Effective 25 May 2007 the Group acquired a 100% controlling interest in 454 Life Sciences, a majority-owned US subsidiary of CuraGen Corporation. 454 Life Sciences develops and commercialises novel instrumentation for high-throughput DNA sequencing and is based in Branford, Connecticut. 454 Life Sciences is reported as part of the Diagnostics operating segment. The purchase consideration paid was 189 million Swiss francs in cash, which consisted of 188 million Swiss francs of cash and 1 million Swiss francs of directly attributable costs. Effective 8 August 2007 the Group acquired a 100% controlling interest in NimbleGen Systems, Inc. (‘NimbleGen’), a privately owned US company. NimbleGen develops and commercialises high density DNA microarrays and is based in Madison, Wisconsin. NimbleGen is reported as part of the Diagnostics operating segment. The purchase consideration was 316 million Swiss francs in cash. There were other minor business combinations with a total purchase consideration of 18 million Swiss francs. The combined purchase consideration for other acquisitions has been allocated as shown below. Other acquisitions: net assets acquired in millions of CHF
Carrying value
prior to acquisition Fair value
adjustments Carrying value
upon acquisition Property, plant and equipment 16 (1) 15 Intangible assets - Product intangibles: in use 19 204 223 - Product intangibles: not available for use - 10 10 - Technology intangibles: in use - 34 34 Deferred income taxes - (44) (44) Cash 25 - 25 Other net assets (liabilities) (9) 2 (7) Net identifiable assets 51 205 256 Goodwill 336 Purchase consideration 592

Page 254
66
Goodwill represents assets that cannot be recognised separately and measured reliably, such as early-stage research projects, a control premium and synergies that can be obtained from the Group’s existing business. Acquisitions – 2007: net cash outflow in millions of CHF
Cash consideration
paid Cash in
acquired company Net cash outflow
BioVeris (745) 6 (739) Tanox (1,124) 120 (1,004) Other acquisitions (592) 25 (567) Total (2,461) 151 (2,310) 8. CHANGES IN GROUP ORGANISATION
As described in Note 3, on 21 July 2008 the Group announced an offer to purchase all outstanding shares of Genentech. Following the closing of a transaction, Genentech’s South San Francisco site would become the headquarters of the Group’s combined pharmaceuticals operations in the United States. On 21 July 2008 the Group also announced that the Roche Pharmaceuticals business in the US would close manufacturing operations at its site in Nutley, New Jersey, and commercial operations would be moved to Genentech. The research site at Palo Alto, California, would be closed with the research activities being transferred to Nutley and to Genentech. The current status of the offer is described in Note 3. During 2008 significant costs were incurred in connection with the proposed Genentech transaction and the US reorganisation, as described below. These are disclosed separately in the income statement due to the materiality of the amounts and in order to fairly present the Group’s results. Costs of other restructuring programmes that are less material and do not fundamentally change the Group’s organisation are expensed in the current period and reported within general and administration expenses. Changes in Group organisation in millions of CHF
2008 Roche Pharmaceuticals operating segment - US reorganisation costs 149 Total Roche Pharmaceuticals operating segment 149 Genentech operating segment - Genentech Employee Retention Program expenses 94 Total Genentech operating segment 94 Total Pharmaceuticals Division 243 The total income tax benefit recorded in respect of changes in Group organisation was 93 million Swiss francs (see Note 6). Roche Pharmaceuticals US reorganisation: During 2008 costs were incurred as shown in the table below which are independent of the completion of the proposed Genentech transaction. These mainly relate to the closure of the Palo Alto site and the closure of manufacturing at the Nutley site, but also include costs associated with the reorganisation including the transfer of the research operations from Palo Alto and other activities.

Page 255
67
Roche Pharmaceuticals US reorganisation costs in millions of CHF 2008
Employee-related costs - Termination costs 99 - Pensions and other post-employment benefits (12) - Retention plans and other employee benefits 15 - Other employee-related costs 6 Total employee-related costs 108 Site closure costs - Impairment of property, plant and equipment 10 - Accelerated depreciation of property, plant and equipment 26 - Other site closure costs 5 Total site closure costs 41 Other reorganisation expenses - Total US reorganisation costs 149 Genentech Employee Retention Program: On 18 August 2008 Genentech announced a broad-based employee retention program, consisting of two retention plans that together cover substantially all employees of the company. The program is estimated to cost approximately 375 million US dollars payable in cash and is being implemented in lieu of Genentech’s 2008 annual stock option grant. The timing of the payments related to this program will depend on the outcome of the Roche Proposal. If a merger of Genentech with Roche or an affiliate of Roche has not occurred on or before 30 June 2009, Genentech will pay the retention bonus at that time in accordance with the terms of the program. The costs of the retention program are currently recognised on a straight-line basis over the period from 18 August 2008 to 30 June 2009. If a merger of Genentech with Roche or an affiliate of Roche has occurred on or before 30 June 2009, then the timing of the payments and the recognition of the expense will depend on the terms of the merger. During 2008, total costs for the retention program were 175 million Swiss francs, of which 146 million Swiss francs were expensed and 29 million Swiss francs were capitalised into inventory, which will be recognised as cost of sales as products manufactured after the initiation of the retention program are sold. If Genentech had granted an annual stock option award, as in previous years, with the same total value as the retention program then the costs would have been expensed over the four year vesting period and the amount expensed in 2008 would have been approximately 52 million Swiss francs. Accordingly the additional incremental costs incurred in 2008 for the retention plan are reported as part of changes in Group organisation, since these are directly attributable to the announcement of the Roche Proposal. Genentech Employee Retention Program expenses in millions of CHF
2008 Marketing and distribution 14 Research and development 26 General and administration 12 Total included in operating profit before exceptional items 52 Changes in Group organisation 94 Total Genentech Employee Retention Program expenses 146

Page 256
68
9. EMPLOYEE BENEFITS
Employee remuneration in millions of CHF 2008 2007
Wages and salaries 8,363 8,180 Social security costs 948 943 Defined contribution post-employment plans 253 259 Operating expenses for defined benefit post-employment plans 10 317 370 Equity compensation plans 11 513 608 Genentech Employee Retention Program 8 146 - Termination costs – Roche Pharmaceuticals US reorganisation 8 99 - Other employee benefits 526 465 Employee remuneration included in operating results 11,165 10,825 Expected return on plan assets for defined benefit post-employment plans 10 (688) (670) Interest cost for defined benefit post-employment plans 10 652 612 Total employee remuneration 11,129 10,767 Other employee benefits consist mainly of life insurance schemes and certain other insurance schemes providing medical coverage and other long-term and short-term disability benefits. The charges for employee benefits in the operating results are included in the relevant expenditure line by function. The expected return on plan assets and interest cost from defined benefit plans are included as part of financial income and financing costs, respectively (see Note 5). 10. PENSIONS AND OTHER POST-EMPLOYMENT BENEFITS
The Group’s objective is to provide attractive and competitive post-employment benefits to employees, while at the same time ensuring that the various plans are appropriately financed and managing any potential impacts on the Group's long-term financial position. Most employees are covered by pension plans sponsored by Group companies. The nature of such plans varies according to legal regulations, fiscal requirements and market practice in the countries in which the employees are employed. Other post-employment benefits consist mostly of post-retirement healthcare and life insurance schemes, principally in the United States. Post-employment benefit plans are classified for IFRS as ‘defined contribution plans’ if the Group pays fixed contributions into a separate fund or to a third-party financial institution and will have no further legal or constructive obligation to pay further contributions. All other plans are classified as ‘defined benefit plans’, even if the Group’s potential obligation is relatively minor or has a relatively remote possibility of arising. Consequently most of the Group’s post-employment benefit plans are classified as ‘defined benefit plans’ for the purpose of these financial statements. Defined contribution plans Defined contribution plans typically consist of payments by employees and by the Group to funds administered by third parties. Payments by the Group were 253 million Swiss francs (2007: 259 million Swiss francs). No assets or liabilities are recognised in the Group’s balance sheet in respect of such plans, apart from regular prepayments and accruals of the contributions withheld from employees’ wages and salaries and of the Group’s contributions.

Page 257
69
Defined benefit plans The Group’s major defined benefit plans are located in Switzerland, the United States, Germany, the United Kingdom and Japan. Plans are usually established as trusts independent of the Group and are funded by payments from the Group and by employees. In some cases, notably for the major defined benefit plans in Germany, the plan is unfunded and the Group pays pensions to retired employees directly from its own financial resources. Current and past service costs are charged to the appropriate income statement heading within the operating results. Pension plan administration and funding is overseen at a corporate level, and any settlement gains and losses resulting from changes in funding arrangements are reported as general and administration expenses within the Corporate segment. The expected returns on plan assets and interest costs are charged to financial income and financing costs, respectively. Actuarial gains and losses are recorded directly in equity. The recognition of pension assets is limited to the total of the present value of any future refunds from the plans or reductions in future contributions to the plans and any cumulative unrecognised past service costs. Adjustments arising from the limit on the recognition of assets for defined benefit plans are recorded directly in equity. Defined benefit plans: expenses in millions of CHF
2008 2007
Pension
plans
Other post-employment benefit plans Total
Pension plans
Other post-employment benefit plans Total
Current service cost 320 17 337 361 22 383 Past service cost (3) 8 5 (2) - (2) (Gain) loss on curtailment (22) (3) (25) (11) - (11) (Gain) loss on settlement - - - - - - Total operating expenses 295 22 317 348 22 370 Expected return on plan assets (647) (41) (688) (630) (40) (670) Interest cost 593 59 652 556 56 612 Total financial (income) expense (54) 18 (36) (74) 16 (58) Total expense recognised in income statement 241 40 281 274 38 312 The funding of the Group’s various defined benefit plans is overseen at a corporate level. Qualified independent actuaries carry out valuations on a regular basis and for major plans annually as at the balance sheet date. For funded plans, which are usually trusts independent of the Group’s finances, the net asset/liability recognised on the Group’s balance sheet corresponds to the over/under funding of the plan, adjusted for unrecognised past service costs. For unfunded plans, where the Group meets the pension obligations directly from its own financial resources, a liability for the defined benefit obligation is recorded in the Group’s balance sheet. Pension assets and liabilities in different defined benefit plans are not offset unless the Group has a legally enforceable right to use the surplus in one plan to settle obligations in the other plan. Amounts recognised in the balance sheet for post-employment benefits are predominantly non-current and are reported in non-current assets and liabilities.

Page 258
70 Defined benefit plans: funding status at 31 December in millions of CHF
2008 2007
Funded
plans Unfunded
plans Total Funded
plans Unfunded
plans Total Fair value of plan assets 9,438 - 9,438 12,170 - 12,170 Defined benefit obligation (10,504) (3,078) (13,582) (10,646) (3,344) (13,990) Over (under) funding (1,066) (3,078) (4,144) 1,524 (3,344) (1,820) Unrecognised past service costs (21) (1) (22) (23) (1) (24) Limit on asset recognition - - - (636) - (636) Reimbursement rights 76 13 89 99 17 116 Net recognised asset (liability) (1,011) (3,066) (4,077) 964 (3,328) (2,364) Reported as - Defined benefit plans 503 - 503 1,216 - 1,216 - Reimbursement rights 76 13 89 99 17 116 Post-employment benefit assets 579 13 592 1,315 17 1,332 Post-employment benefit liabilities (1,590) (3,079) (4,669) (351) (3,345) (3,696) Net recognised asset (liability) (1,011) (3,066) (4,077) 964 (3,328) (2,364)
As disclosed in Note 1, post-employment benefit assets, deferred tax liabilities and equity have been restated in the 31 December 2007 balance sheet following the adoption of IFRIC interpretation 14 in 2008. A reconciliation to the previously published balance sheet is provided in Note 1.
Further detailed information on plan assets and the defined benefit obligation is given below. Defined benefit plans: fair value of plan assets and reimbursement rights in millions of CHF
2008 2007
Fair value of plan assets
Reim-bursement
rights Total
Fair value of plan assets
Reim-bursement
rights Total At 1 January 12,170 116 12,286 11,632 116 11,748 Expected return on plan assets 680 8 688 663 7 670 Actuarial gains (losses) (2,787) (22) (2,809) 491 4 495 Currency translation effects and other (463) (7) (470) (373) (10) (383) Employer contributions 217 (6) 211 207 (1) 206 Employee contributions 61 - 61 45 - 45 Benefits paid - funded plans (440) - (440) (494) - (494) Past service cost - - - - - - Business combinations - - - - - - Divestment of subsidiaries - - - - - - Curtailments - - - - - - Settlements - - - (1) - (1) At 31 December 9,438 89 9,527 12,170 116 12,286
2008 2007 Invested as - Shares and other equity instruments 4,033 6,055 - Bonds, debentures and other debt instruments 4,106 4,343 - Property 242 337 - Other assets 1,146 1,551 Total 9,527 12,286
Included within the fair value of plan assets are 337 thousand of the Group’s non-voting equity securities with a fair value of 55 million Swiss francs (2007: 340 thousand non-voting equity securities with a total fair value of 66 million Swiss francs).

Page 259
71
Defined benefit plans: defined benefit obligation in millions of CHF 2008 2007
Pension
plans
Other post-employment benefit plans Total
Pension plans
Other post-employment benefit plans Total
At 1 January 12,988 1,002 13,990 13,572 1,026 14,598 Current service cost 320 17 337 361 22 383 Interest cost 593 59 652 556 56 612 Employee contributions 61 - 61 45 - 45 Actuarial (gains) losses 64 (53) 11 (718) 35 (683) Currency translation effects and other (794) (65) (859) (235) (79) (314) Benefits paid – funded plans (399) (41) (440) (448) (46) (494) Benefits paid – unfunded plans (131) (11) (142) (134) (12) (146) Past service cost - 8 8 1 - 1 Business combinations - - - - - - Divestment of subsidiaries (11) - (11) - - - Curtailments (22) (3) (25) (11) - (11) Settlements - - - (1) - (1) At 31 December 12,669 913 13,582 12,988 1,002 13,990 Of which - Funded plans 9,807 697 10,504 9,904 742 10,646 - Unfunded plans 2,862 216 3,078 3,084 260 3,344 Actuarial assumptions Actuarial assumptions are unbiased and mutually compatible estimates of variables that determine the ultimate cost of providing post-employment benefits. They are set on an annual basis by local management and actuaries and are subject to approval by corporate management and the Group’s actuaries. Actuarial assumptions consist of demographic assumptions on matters such as mortality and employee turnover, and financial assumptions on matters such as salary and benefit levels, interest rates, return on investments and costs of medical benefits. The Group operates defined benefit plans in many countries and the actuarial assumptions vary based upon local economic and social conditions. Demographic assumptions: The most significant demographic assumptions relate to mortality rates. The Group’s actuaries use mortality tables which take into account historic patterns and expected changes, such as further increases in longevity. The mortality tables used for the major schemes are: • Germany: Heubeck tables 2005G. • Japan: National Census (No. 19 Life Table). • Switzerland: BVG 2005. • United Kingdom: non-pensioners - PA92C25 rated down one year. • United Kingdom: pensioners - PA92C10 rated down one year. • United States: RP2000 projected to 2010. Rates of employee turnover, disability and early retirement are based on historical behaviour within Group companies. Financial assumptions: These are based on market expectations for the period over which the obligations are to be settled. The ranges of assumptions used in the actuarial valuations of the most significant plans, which are in countries with stable currencies and interest rates, are shown below.
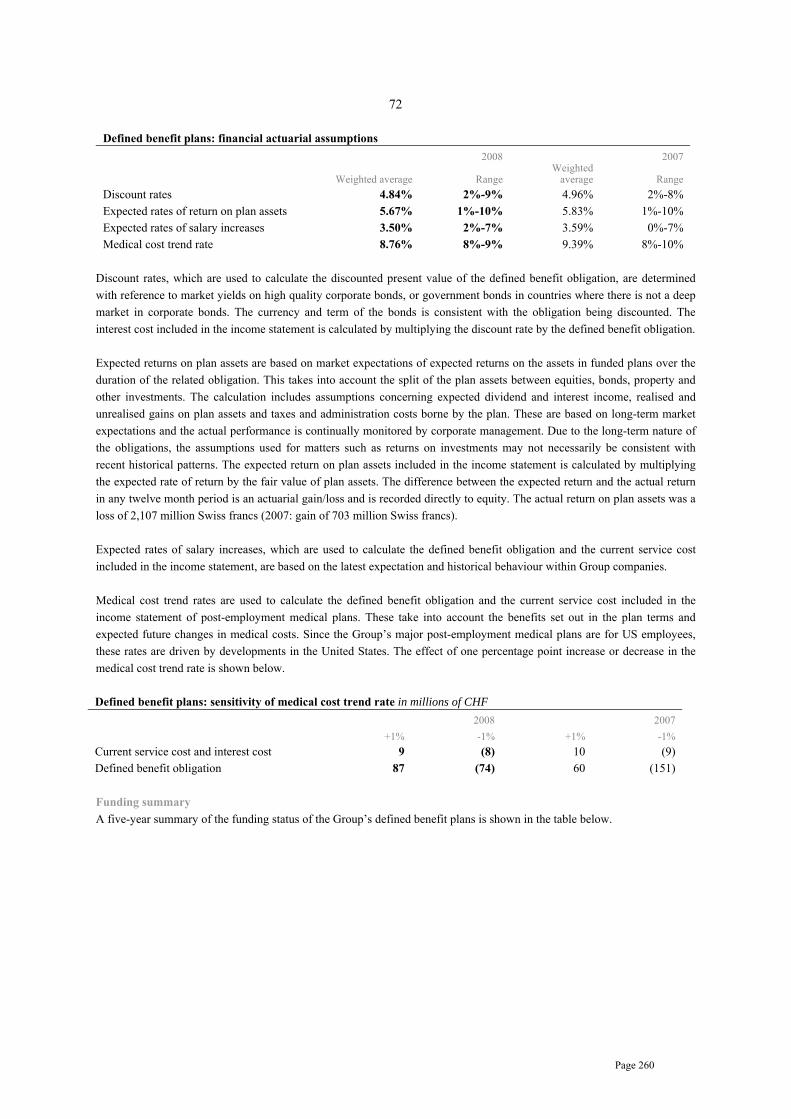
Page 260
72
Defined benefit plans: financial actuarial assumptions 2008 2007
Weighted average Range Weighted
average Range Discount rates 4.84% 2%-9% 4.96% 2%-8% Expected rates of return on plan assets 5.67% 1%-10% 5.83% 1%-10% Expected rates of salary increases 3.50% 2%-7% 3.59% 0%-7% Medical cost trend rate 8.76% 8%-9% 9.39% 8%-10%
Discount rates, which are used to calculate the discounted present value of the defined benefit obligation, are determined with reference to market yields on high quality corporate bonds, or government bonds in countries where there is not a deep market in corporate bonds. The currency and term of the bonds is consistent with the obligation being discounted. The interest cost included in the income statement is calculated by multiplying the discount rate by the defined benefit obligation. Expected returns on plan assets are based on market expectations of expected returns on the assets in funded plans over the duration of the related obligation. This takes into account the split of the plan assets between equities, bonds, property and other investments. The calculation includes assumptions concerning expected dividend and interest income, realised and unrealised gains on plan assets and taxes and administration costs borne by the plan. These are based on long-term market expectations and the actual performance is continually monitored by corporate management. Due to the long-term nature of the obligations, the assumptions used for matters such as returns on investments may not necessarily be consistent with recent historical patterns. The expected return on plan assets included in the income statement is calculated by multiplying the expected rate of return by the fair value of plan assets. The difference between the expected return and the actual return in any twelve month period is an actuarial gain/loss and is recorded directly to equity. The actual return on plan assets was a loss of 2,107 million Swiss francs (2007: gain of 703 million Swiss francs). Expected rates of salary increases, which are used to calculate the defined benefit obligation and the current service cost included in the income statement, are based on the latest expectation and historical behaviour within Group companies. Medical cost trend rates are used to calculate the defined benefit obligation and the current service cost included in the income statement of post-employment medical plans. These take into account the benefits set out in the plan terms and expected future changes in medical costs. Since the Group’s major post-employment medical plans are for US employees, these rates are driven by developments in the United States. The effect of one percentage point increase or decrease in the medical cost trend rate is shown below. Defined benefit plans: sensitivity of medical cost trend rate in millions of CHF
2008 2007 +1% -1% +1% -1%
Current service cost and interest cost 9 (8) 10 (9) Defined benefit obligation 87 (74) 60 (151) Funding summary A five-year summary of the funding status of the Group’s defined benefit plans is shown in the table below.

Page 261
73
Defined benefit plans: summary of funding status in millions of CHF 2008 2007 2006 2005 2004
Funded plans - Fair value of plan assets 9,438 12,170 11,632 10,858 9,922 - Defined benefit obligation (10,504) (10,646) (11,002) (10,976) (10,233) - Over (under) funding (1,066) 1,524 630 (118) (311) Unfunded plans - Defined benefit obligation (3,078) (3,344) (3,596) (3,630) (2,731) Increase (decrease) in funding status arising from experience adjustments - Fair value of plan assets (2,787) 40 626 547 13 - Defined benefit obligation (126) (235) (249) 49 77 Increase (decrease) in funding status arising from changes in actuarial assumptions - Fair value of plan assets - - - - - - Defined benefit obligation 115 1,295 384 (1,148) (636) Cash flows The Group incurred cash flows from its defined benefit plans as shown in the table below. Defined benefit plans: cash flows in millions of CHF
2008 2007
Employer contributions – funded plans (211) (206) Benefits paid – unfunded plans (142) (146) Total cash inflow (outflow) (353) (352) Based on the most recent actuarial valuations, the Group expects that employer contributions for funded plans in 2009 will be approximately 494 million Swiss francs, which include an estimated 317 million Swiss francs of additional contributions. Benefits paid for unfunded plans are estimated to be approximately 130 million Swiss francs. Amounts recorded in equity The actuarial gains and losses recognised in the statement of recognised income and expense were losses of 2,820 million Swiss francs (2007: gains of 1,178 million Swiss francs). The total amount at 31 December 2008 was an accumulated loss of 1,433 million Swiss francs (2007: accumulated gain of 1,387 million Swiss francs). In addition the recognition of pension assets is limited to the total of the present value of any future refunds from the plans or reductions in future contributions to the plans and the cumulative unrecognised past service costs. Adjustments arising from this limit on asset recognition are recorded directly in equity. In 2008 this adjustment was an increase of 636 million Swiss francs (2007: decrease of 636 million Swiss francs).
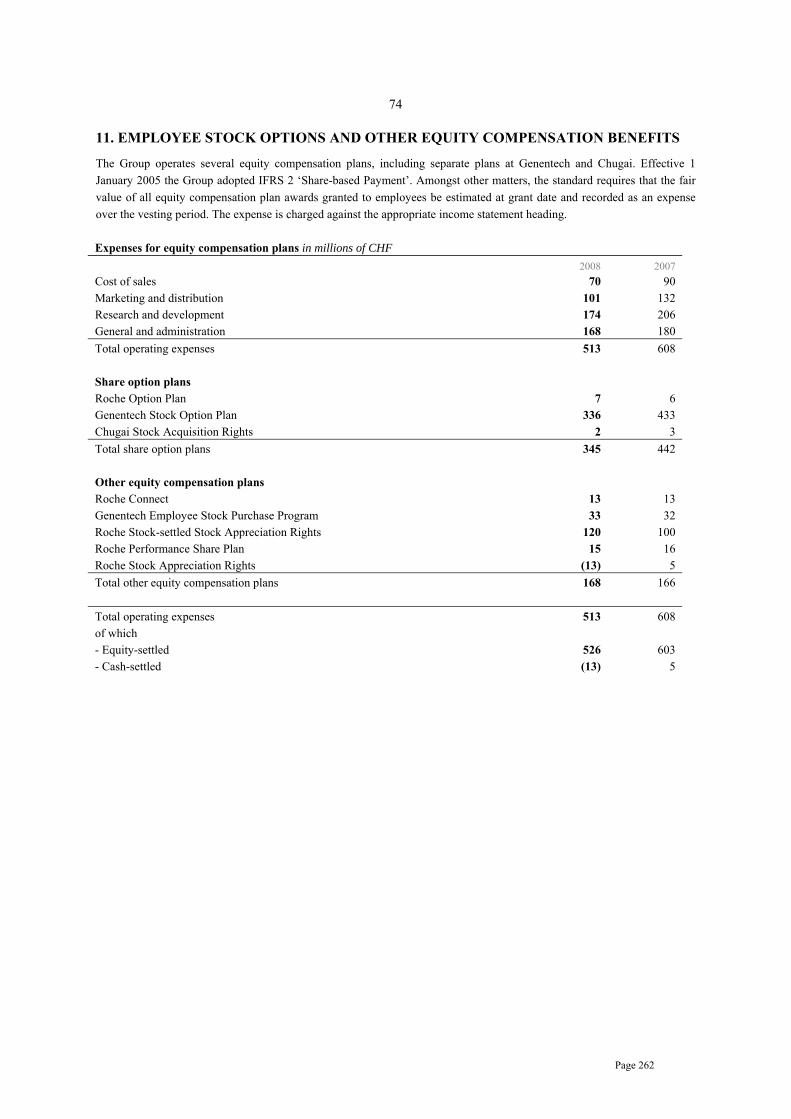
Page 262
74
11. EMPLOYEE STOCK OPTIONS AND OTHER EQUITY COMPENSATION BENEFITS
The Group operates several equity compensation plans, including separate plans at Genentech and Chugai. Effective 1 January 2005 the Group adopted IFRS 2 ‘Share-based Payment’. Amongst other matters, the standard requires that the fair value of all equity compensation plan awards granted to employees be estimated at grant date and recorded as an expense over the vesting period. The expense is charged against the appropriate income statement heading. Expenses for equity compensation plans in millions of CHF
2008 2007 Cost of sales 70 90 Marketing and distribution 101 132 Research and development 174 206 General and administration 168 180 Total operating expenses 513 608 Share option plans Roche Option Plan 7 6 Genentech Stock Option Plan 336 433 Chugai Stock Acquisition Rights 2 3 Total share option plans 345 442 Other equity compensation plans Roche Connect 13 13 Genentech Employee Stock Purchase Program 33 32 Roche Stock-settled Stock Appreciation Rights 120 100 Roche Performance Share Plan 15 16 Roche Stock Appreciation Rights (13) 5 Total other equity compensation plans 168 166 Total operating expenses 513 608 of which - Equity-settled 526 603 - Cash-settled (13) 5

Page 263
75
Cash inflow (outflow) from equity compensation plans in millions of CHF 2008 2007
Share option plans Roche Option Plan (18) (19) Genentech Stock Option Plan 620 408 Chugai Stock Acquisition Rights - 1 Total share option plans 602 390 Other equity compensation plans Roche Connect (13) (13) Genentech Employee Stock Purchase Program 115 134 Roche Stock-settled Stock Appreciation Rights (106) (61) Roche Performance Share Plan - - Roche Stock Appreciation Rights (35) (97) Total other equity compensation plans (39) (37) Total cash inflow (outflow) 563 353 of which - Equity-settled 598 450 - Cash-settled (35) (97) Roche Long-Term: During 2005 the Group implemented a new global long-term incentive programme which is available to certain directors, management and employees selected at the discretion of the Group. The programme consists of Stock-settled Stock Appreciation Rights (S-SARs), with the Group having the alternative of granting awards under the existing Roche Option Plan. Share option plans Roche Option Plan: Awards under this plan give employees the right to purchase non-voting equity securities at an exercise price specified at the grant date. The options, which are non-tradable equity-settled awards, have a seven-year duration and vest on a phased basis over three years, subject to continued employment. The Group covers such obligations by purchasing non-voting equity securities or derivatives thereon (see Note 28). With the introduction of Roche Long-Term in 2005, the number of options granted under the Roche Option Plan was significantly reduced, as most eligible employees now receive Roche Stock-settled Stock Appreciation Rights instead. Roche Option Plan - movement in number of options outstanding
2008 2007
Number of options
(thousands)
Weighted average exercise price
(CHF) Number of options
(thousands)
Weighted average exercise price
(CHF) Outstanding at 1 January 1,203 139.50 1,416 117.83 Granted 362 194.64 194 229.68 Forfeited (40) 199.24 (10) 163.98 Exercised (131) 111.80 (397) 105.64 Expired - - - - Outstanding at 31 December 1,394 154.71 1,203 139.50 - of which exercisable 890 127.45 875 115.71

Page 264
76
Roche Option Plan - terms of options outstanding as at 31 December 2008 Options outstanding Options exercisable
Year of grant
Number outstanding (thousands)
Weighted average years remaining contractual life
Weighted average exercise price
(CHF)
Number exercisable (thousands)
Weighted average exercise price
(CHF) 2002 53 0.20 115.09 53 115.09 2003 222 1.17 78.48 222 78.48 2004 362 2.17 129.50 362 129.50 2005 116 3.17 123.16 116 123.16 2006 112 4.17 195.18 74 195.18 2007 177 5.18 229.68 60 229.68 2008 352 6.11 194.61 3 195.80 Total 1,394 3.56 154.71 890 127.45 Genentech Stock Option Plan: The Genentech Stock Option Plan was adopted in 1999 and amended thereafter. In April 2004 Genentech’s shareholders approved an equity incentive plan. The plans allow for the granting of various stock options, incentive stock options and stock purchase rights to employees, directors and consultants of Genentech. No incentive stock options and stock purchase rights have been granted under this plan to date. The options granted, which are non-tradable equity-settled awards, have a ten-year duration and vest on a phased basis over four years, subject to continued employment. Genentech Stock Option Plan - movement in number of options outstanding
2008 2007
Number of options
(millions)
Weighted average exercise price
(USD) Number of options
(millions)
Weighted average exercise price
(USD) Outstanding at 1 January 92 60.94 88 54.53 Granted 1 79.23 18 79.40 Forfeited (3) 80.52 (4) 76.45 Exercised (13) 44.83 (10) 32.76 Expired - - - - Outstanding at 31 December 77 63.06 92 60.94 - of which exercisable 56 56.51 54 48.46 Genentech Stock Option Plan – terms of options outstanding at 31 December 2008
Options outstanding Options exercisable
Range of exercise prices (USD)
Number outstanding
(millions)
Weighted average years remaining contractual life
Weighted average exercise price
(USD)
Number exercisable
(millions)
Weighted average exercise price
(USD) 6.27 – 8.89 0.2 6.39 6.81 0.2 6.81 10.00 – 14.35 6.2 2.85 13.68 6.2 13.68 15.04 – 22.39 4.5 2.35 20.89 4.5 20.89 22.88 – 33.00 0.1 2.52 26.08 0.1 26.08 35.63 – 53.23 20.3 4.76 47.11 20.3 47.11 53.95 – 75.90 2.0 7.85 68.03 0.9 63.31 75.99 – 98.80 44.1 7.75 81.77 23.8 82.70 Total 77.4 6.25 63.06 56.0 56.51 Chugai Stock Acquisition Rights: During 2003 Chugai adopted a Stock Acquisition Rights programme. The programme allows for the granting of rights to employees and directors of Chugai. Each right entitles the holder to purchase 100 Chugai shares at a specified exercise price. The options, which are non-tradable equity-settled awards, have a ten-year duration and vest after two years.

Page 265
77
Chugai Stock Acquisition Rights - movement in number of rights outstanding 2008 2007
Number of options
Weighted average exercise price
(JPY) Number of options
Weighted average exercise price
(JPY) Outstanding at 1 January 13,002 217,089 9,886 182,925 Granted - - 3,550 303,900 Forfeited - - - - Exercised (36) 145,400 (434) 148,965 Expired - - - - Outstanding at 31 December 12,966 217,288 13,002 217,089 - of which exercisable 9,416 184,633 6,012 161,587 Chugai Stock Acquisition Rights – terms of rights outstanding at 31 December 2008
Rights outstanding Rights exercisable
Year of grant Number
outstanding
Weighted average years remaining contractual life
Weighted average exercise price
(JPY) Number
exercisable
Weighted average exercise price
(JPY) 2003 1,276 4.50 145,400 1,276 145,400 2004 2,180 5.25 167,500 2,180 167,500 2005 2,520 6.25 164,900 2,520 164,900 2006 3,440 7.25 224,500 3,440 224,500 2007 3,550 8.25 303,900 - - Total 12,966 6.72 217,288 9,416 184,633 Issues of share options in 2008: Issues of share options in 2008, including the methodology used to calculate fair value and the main inputs to the valuation models, are described below. Issues of share option plans in 2008
Roche
Option Plan Genentech Stock
Option Plan Number of options granted 362 thousand 1 million Underlying equity Roche non-voting equity
securities Genentech common stock
Currency Swiss francs US dollars Vesting period Progressively
over 3 years Progressively over 4 years
Contractual life 7 years 10 years Weighted average fair value of options issued 22.24 22.39 Option pricing model used Binomial Binomial Inputs to option pricing model - Share price at grant date 194.64 79.23 - Exercise price 194.64 79.23 - Expected volatility 24.6% 24.1% - Expected dividend yield 7.65% 0% - Early exercise factor 1.649 1.484 - Expected exit rate 8.2% 8.6% Volatility for Roche options was determined primarily by reference to historically observed prices of the underlying equity. Volatility for Genentech options was determined primarily by reference to the implied volatility of Genentech’s traded options. Risk-free interest rates are derived from zero coupon swap rates at the grant date taken from Datastream. The early exercise factor describes the ratio between the expected market price at the exercise date and the exercise price at which early exercises can be expected, based on historically observed behaviour.

Page 266
78
Other equity compensation plans Roche Connect: This programme enables all employees worldwide, except for those in the United States and certain other countries, to make regular deductions from their salaries to purchase non-voting equity securities. It is administered by independent third parties. The Group contributes to the programme, which allows the employees to purchase non-voting equity securities at a discount (usually 20%). The administrator purchases the necessary non-voting equity securities directly from the market. At 31 December 2008 the administrator held 1.4 million non-voting equity securities (2007: 1.1 million). The programme has been operational since 1 October 2002. During the year the cost of the plan was 13 million Swiss francs (2007: 13 million Swiss francs), which was reported within the relevant expenditure line by function. Genentech Employee Stock Purchase Program (ESPP): Genentech has an employee stock purchase programme that allows employees to purchase Genentech’s common stock at 85% of the lower of market value at the grant date or purchase date. In 2008 a total of 1.8 million shares of Genentech common stock were purchased (2007: 1.7 million shares) resulting in a cash inflow of 115 million Swiss francs (2007: 134 million Swiss francs). During the year the cost of the plan was 33 million Swiss francs (2007: 32 million Swiss francs), which was reported within the relevant expenditure line by function. Roche Stock-settled Stock Appreciation Rights: With the introduction of Roche Long-Term in 2005, the Group offers Stock-settled Stock Appreciation Rights (S-SARs) to certain directors, management and employees selected at the discretion of the Group. The S-SARs give employees the right to receive non-voting equity securities reflecting the value of any appreciation in the market price of the non-voting equity securities between the grant date and the exercise date. The options, which are non-tradable equity-settled awards, have a seven-year duration and vest on a phased basis over three years, subject to continued employment. The Group covers such obligations by purchasing non-voting equity securities, or derivatives thereon (see Note 28). Roche S-SARs - movement in number of rights outstanding
2008 2007
Number of rights
(thousands)
Weighted average exercise price
(CHF) Number of rights
(thousands)
Weighted average exercise price
(CHF) Outstanding at 1 January 7,782 185.60 5,883 156.07 Granted 6,397 194.25 3,025 229.37 Forfeited (477) 206.55 (189) 180.91 Exercised (639) 131.40 (937) 142.36 Expired - - - - Outstanding at 31 December 13,063 191.72 7,782 185.60 - of which exercisable 4,221 170.86 2,101 149.17 Roche S-SARs – terms of rights outstanding at 31 December 2008
Rights outstanding Rights exercisable
Year of grant
Number outstanding (thousands)
Weighted average years remaining contractual life
Weighted average exercise price
(CHF)
Number exercisable (thousands)
Weighted average exercise price
(CHF) 2005 1,878 3.17 123.39 1,878 123.39 2006 2,157 4.17 195.17 1,388 195.17 2007 2,802 5.17 229.36 941 229.36 2008 6,226 6.11 194.21 14 195.80 Total 13,063 5.17 191.72 4,221 170.86 The weighted average fair value of the options granted in 2008 was calculated using a binomial model. The inputs to the model were consistent with those used for the Roche Option Plan 2008 awards given previously. The resulting weighted average fair value per right is CHF 22.09, giving a total fair value of 141 million Swiss francs which is charged over the vesting period of three years.

Page 267
79
Roche Performance Share Plan: The Group offers future non-voting equity security awards (or, at the discretion of the Board of Directors, their cash equivalent) to certain directors and key senior managers. The programme was established at the beginning of 2002 and was in effect for three years. During 2004 the Board of Directors approved a new three-year cycle of the Roche Performance Share Plan (PSP) to operate during 2005-2007. Additional cycles of the PSP with similar conditions were approved to operate during 2006-2008, 2007-2009 and 2008-2010. The terms of these awards are set out in the table below. The amount of non-voting equity securities allocated will depend upon the individual’s salary level, the achievement of performance targets linked to the Group’s Total Shareholder Return (shares and non-voting equity securities combined) relative to the Group’s peers during the three-year period from the date of the grant, and the discretion of the Board of Directors. These are non-tradable equity-settled awards. Each award will result in between zero and two non-voting equity securities, depending upon the achievement of the performance targets. Roche Performance Share Plan – terms of outstanding awards at 31 December 2008
2006-2008 2007-2009 2008-2010 Number of awards outstanding (thousands) 50 74 89 Vesting period 3 years 3 years 3 years Allocated to recipients in Feb. 2009 Feb. 2010 Feb. 2011 Fair value per unit at grant (CHF) 210.06 239.49 201.22 Total fair value at grant (CHF millions) 12 19 18 The weighted average fair value of the awards granted in 2008 was calculated using a Monte Carlo simulation. The input parameters to the model were the covariance matrix between Roche and the other individual companies of the peer group based on a three-year history and a risk-free rate of 2.97%. The valuation also takes into account the defined rank and performance structure which determines the payout of the PSP. Roche Stock Appreciation Rights: Some employees of certain North American subsidiaries of the Group receive Stock Appreciation Rights (SARs) as part of their compensation. The SARs, which are non-tradable cash-settled awards, may be exercised after a vesting period of between one and three years for a cash payment, based upon the amount by which the market price of the Group’s American Depositary Receipts (ADRs) at the point of exercise exceeds the strike price (grant price at issuance). Following the implementation of Roche Long-Term (see above), the Group does not plan to award any further cash-settled SARs and no awards have been made since 2004. On 9 January 2009 the ratio of ADRs to non-voting equity securities (Genussscheine) was changed from 2:1 to 4:1. The information below has been restated for this change. Roche Stock Appreciation Rights in millions of CHF
2008 2007 Liability at 31 December 43 97 Intrinsic value of vested rights at 31 December 43 97 Roche Stock Appreciation Rights- terms of rights outstanding at 31 December 2008
Rights outstanding and exercisable
Year of grant
Number outstanding and exercisable
(thousands) Expiry Weighted average
price (USD) 2003 824 Feb. 2010 14.41 2004 1,744 Feb. 2011 26.04 Total 2,568 22.31 The fair value at 31 December 2008 was calculated using a binomial model. The inputs to the model were the ADR price at 31 December 2008 (USD 76.55, before change in exchange ratio on 9 January 2009); the exercise prices given in the above table, and other inputs consistent with those used for the Roche Option Plan 2008 awards given previously.

Page 268
80
12. PROPERTY, PLANT AND EQUIPMENT
Property, plant and equipment: movements in carrying value of assets in millions of CHF
Land
Buildings and land
improvements Machinery
and equipment Construction
in progress Total At 1 January 2007 Cost 1,126 9,419 13,581 3,273 27,399 Accumulated depreciation and impairment - (3,030) (7,952) - (10,982) Net book value 1,126 6,389 5,629 3,273 16,417 Year ended 31 December 2007 At 1 January 2007 1,126 6,389 5,629 3,273 16,417 Additions 22 209 983 2,434 3,648 Disposals (11) (17) (113) (21) (162) BioVeris acquisition 7 - 1 4 - 5 Tanox acquisition 7 - - - 13 13 Other business combinations 7 - - 12 3 15 Transfers - 1,033 1,115 (2,148) - Depreciation charge - (332) (1,228) - (1,560) Impairment charge - (1) (5) - (6) Currency translation effects (45) (247) (116) (130) (538) At 31 December 2007 1,092 7,035 6,281 3,424 17,832 Cost 1,092 10,207 14,681 3,424 29,404 Accumulated depreciation and impairment - (3,172) (8,400) - (11,572) Net book value 1,092 7,035 6,281 3,424 17,832 Year ended 31 December 2008 At 1 January 2008 1,092 7,035 6,281 3,424 17,832 Additions 11 144 877 2,155 3,187 Disposals (13) (11) (61) (12) (97) Ventana acquisition 7 15 25 25 30 95 Other business combinations 7 - - 3 - 3 Divestments of subsidiaries 34 (4) (46) (51) (6) (107) Transfers - 1,692 1,262 (2,954) - Depreciation charge - (479) (1,197) - (1,676) Impairment charge - (17) (11) - (28) Currency translation effects (28) (406) (401) (184) (1,019) At 31 December 2008 1,073 7,937 6,727 2,453 18,190 Cost 1,073 11,410 15,203 2,453 30,139 Accumulated depreciation and impairment - (3,473) (8,476) - (11,949) Net book value 1,073 7,937 6,727 2,453 18,190
Impairment charges arise from changes in the estimates of the future cash flows expected to result from the use of the asset and its eventual disposal. Factors such as changes in the planned use of buildings, machinery or equipment, or closure of facilities, the presence or absence of competition and technical obsolescence could result in shortened useful lives or impairment. Impairment charges of 18 million Swiss francs (2007: 5 million Swiss francs) are reported as part of ‘Cost of sales’ and impairment charges of 10 million Swiss francs (2007: zero) are reported as part of ‘Changes in Group organisation’ (see Note 8).

Page 269
81
Borrowing costs totalling 42 million Swiss francs using a rate of 4.79% (2007: 48 million Swiss francs using a rate of 4.79%) were capitalised as property, plant and equipment. Leasing arrangements where the Group is the lessee Finance leases: As at 31 December 2008 the capitalised cost of property, plant and equipment under finance leases was 174 million Swiss francs (2007: 188 million Swiss francs) and the net book value of these assets was 53 million Swiss francs (2007: 66 million Swiss francs). Finance leases: future minimum lease payments under non-cancellable leases in millions of CHF
Future minimum lease
payments Present value of future
minimum lease payments 2008 2007 2008 2007
Within one year 3 6 3 6 Between one and five years 2 3 1 3 More than five years - - - - Total 5 9 4 9 Future finance charges - - 1 - Total future minimum lease payments (undiscounted) 5 9 5 9 In addition to the above, Genentech leasing arrangements are disclosed in Note 3. Operating leases: Group companies are party to a number of operating leases, mainly for plant and machinery, including motor vehicles, and for certain short-term property rentals. The arrangements do not impose any significant restrictions on the Group. Total operating lease rental expense was 411 million Swiss francs (2007: 402 million Swiss francs). Operating leases: future minimum lease payments under non-cancellable leases in millions of CHF
2008 2007 Within one year 220 224 Between one and five years 412 404 More than five years 173 196 Total minimum payments 805 824 Leasing arrangements where the Group is the lessor Finance leases: Certain assets, mainly diagnostics instruments, are leased to third parties through finance lease arrangements. Such assets are reported as receivables at an amount equal to the net investment in the lease. Lease income from finance leases is recognised over the term of the lease based on the effective interest rate method.

Page 270
82
Finance leases: future minimum lease payments under non-cancellable leases in millions of CHF
Gross investment in lease Present value of future
minimum lease payments 2008 2007 2008 2007
Within one year 25 27 23 23 Between one and five years 41 44 38 37 More than five years 2 2 2 2 Total 68 73 63 62 Unearned finance income (3) (6) n/a n/a Unguaranteed residual value n/a n/a 2 5 Net investment in lease 65 67 65 67 The accumulated allowance for uncollectible minimum lease payments was 1 million Swiss francs (2007: 1 million Swiss francs). There were no contingent rents recognised in income. Operating leases: Certain assets, mainly some diagnostics instruments, are leased to third parties through operating lease arrangements. Such assets are reported within property, plant and equipment. Lease income from operating leases is recognised over the lease term on a straight line basis. Operating leases: future minimum lease payments under non-cancellable leases in millions of CHF
2008 2007 Within one year 94 72 Between one and five years 212 150 More than five years - - Total minimum payments 306 222
At 31 December 2008, machinery and equipment with an original cost of 2,356 million Swiss francs (2007: 2,422 million Swiss francs) and a net book value of 997 million Swiss francs (2007: 973 million Swiss francs) was being leased to third parties. There was no contingent rent recognised as income. Capital commitments The Group has non-cancellable capital commitments for the purchase or construction of property, plant and equipment totalling 2.0 billion Swiss francs (2007: 2.3 billion Swiss francs). In addition, Genentech’s capital commitments in respect of its manufacturing agreements with Lonza and its leasing arrangements are described in Note 3.

Page 271
83 13. GOODWILL
Goodwill: movements in carrying value of assets in millions of CHF 2008 2007
At 1 January 6,835 5,914 BioVeris acquisition 7 - 540 Tanox acquisition 7 - 352 Ventana acquisition 7 1,750 - Other business combinations 7 289 336 Impairment charge - - Currency translation effects (521) (307) At 31 December 8,353 6,835 Allocated to the following cash-generating units Pharmaceuticals Division - Roche Pharmaceuticals 374 128 - Genentech 1,765 1,880 - Chugai 129 110 Total Pharmaceuticals Division 2,268 2,118 Diagnostics Division - Diabetes Care 770 770 - Professional Diagnostics 1,752 1,879 - Molecular Diagnostics - - - Applied Science 247 263 - Tissue Diagnostics 799 - - Strategic goodwill (held at divisional level and not allocated to business areas) 2,517 1,805 Total Diagnostics Division 6,085 4,717 Total Group 8,353 6,835 There are no accumulated impairment losses in goodwill. The goodwill arising from investments in associates is classified as part of the investments in associates (see Note 15). Goodwill impairment testing Pharmaceuticals Division: The division’s reportable operating segments are the cash-generating units used for the testing of goodwill. For Genentech and Chugai, the recoverable amount is based on fair value less costs to sell, determined with reference to the publicly quoted share prices of Genentech and Chugai shares. The goodwill in Roche Pharmaceuticals is not significant in comparison with the Group’s total carrying value of goodwill. Diagnostics Division: The division’s business areas are the cash-generating units used for the testing of goodwill. The goodwill arising from the Corange/Boehringer Mannheim acquisition and part of the goodwill from the Ventana acquisition is recorded and monitored at a divisional level as it relates to the strategic development of the whole division and cannot be meaningfully allocated to the division’s business areas. Therefore the cash-generating unit for this goodwill is the entire division. The recoverable amount used in the impairment testing is based on value in use. The cash flow projections used are based on the most recent business plans approved by management. These assume no significant changes in the organisation of the division and include management’s latest estimates on sales volume and pricing, and production and other operating costs. These reflect past experience and are projected over five years. The estimates for the Tissue Diagnostics business area are projected over ten years, which management believes reflects the long-term nature of this business. The cash flow projections used do not extend beyond management’s most recent business plans. The discount rate used is based on a rate of 8.4%, which is derived from a capital asset pricing model using data from Swiss capital markets, including Swiss Federal Government ten-year bonds and the Swiss Market Index. A weighted average tax rate of 19.7% is used in the calculations. Management believes that any reasonably possible change in any of the key assumptions would not cause the carrying value of goodwill to exceed the recoverable amount.
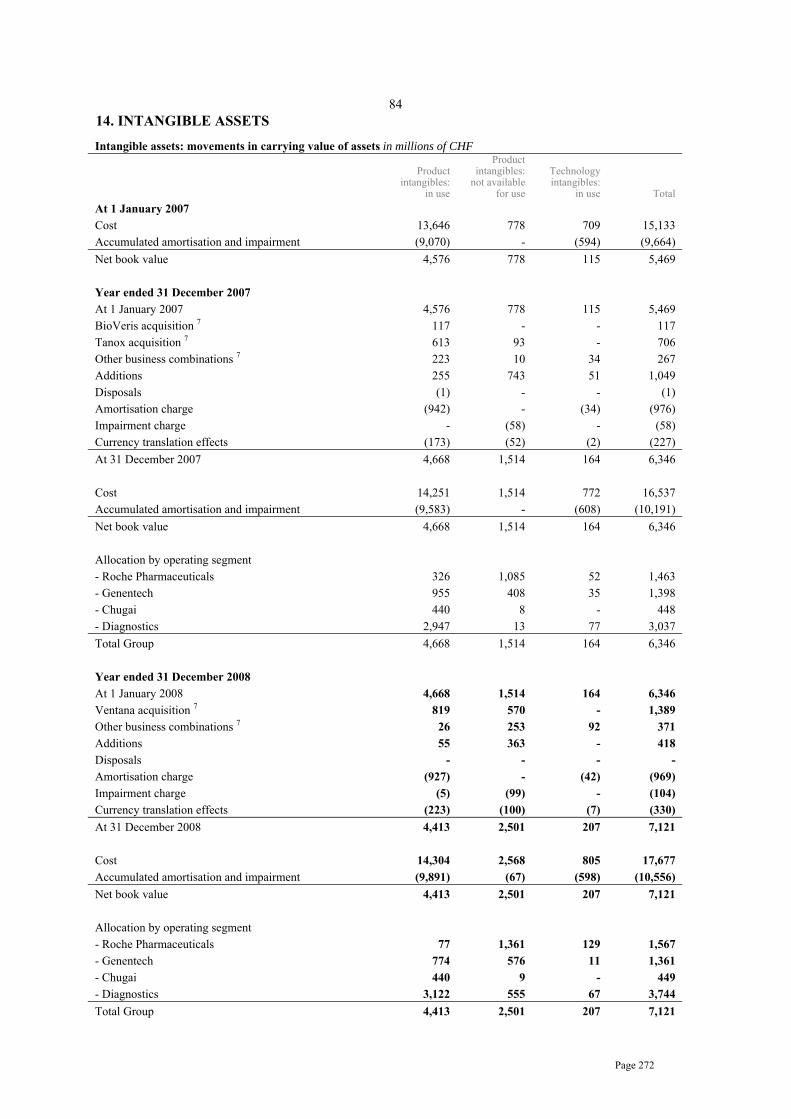
Page 272
84 14. INTANGIBLE ASSETS
Intangible assets: movements in carrying value of assets in millions of CHF
Product intangibles:
in use
Product intangibles:
not available for use
Technology intangibles:
in use Total At 1 January 2007 Cost 13,646 778 709 15,133 Accumulated amortisation and impairment (9,070) - (594) (9,664) Net book value 4,576 778 115 5,469 Year ended 31 December 2007 At 1 January 2007 4,576 778 115 5,469 BioVeris acquisition 7 117 - - 117 Tanox acquisition 7 613 93 - 706 Other business combinations 7 223 10 34 267 Additions 255 743 51 1,049 Disposals (1) - - (1) Amortisation charge (942) - (34) (976) Impairment charge - (58) - (58) Currency translation effects (173) (52) (2) (227) At 31 December 2007 4,668 1,514 164 6,346 Cost 14,251 1,514 772 16,537 Accumulated amortisation and impairment (9,583) - (608) (10,191) Net book value 4,668 1,514 164 6,346 Allocation by operating segment - Roche Pharmaceuticals 326 1,085 52 1,463 - Genentech 955 408 35 1,398 - Chugai 440 8 - 448 - Diagnostics 2,947 13 77 3,037 Total Group 4,668 1,514 164 6,346 Year ended 31 December 2008 At 1 January 2008 4,668 1,514 164 6,346 Ventana acquisition 7 819 570 - 1,389 Other business combinations 7 26 253 92 371 Additions 55 363 - 418 Disposals - - - - Amortisation charge (927) - (42) (969) Impairment charge (5) (99) - (104) Currency translation effects (223) (100) (7) (330) At 31 December 2008 4,413 2,501 207 7,121 Cost 14,304 2,568 805 17,677 Accumulated amortisation and impairment (9,891) (67) (598) (10,556) Net book value 4,413 2,501 207 7,121 Allocation by operating segment - Roche Pharmaceuticals 77 1,361 129 1,567 - Genentech 774 576 11 1,361 - Chugai 440 9 - 449 - Diagnostics 3,122 555 67 3,744 Total Group 4,413 2,501 207 7,121

Page 273
85
Significant intangible assets as at 31 December 2008 in millions of CHF
Operating
segment Net book
value Remaining
amortisation period Product intangibles in use Tanox acquisition Genentech 475 11 years Chugai acquisition Chugai 440 4-12 years Corange/Boehringer Mannheim acquisition Diagnostics 1,299 9 years Igen acquisition Diagnostics 389 8 years Ventana acquisition Diagnostics 713 9 years Product intangibles not available for use Alnylam alliance Roche
Pharmaceuticals 324 n/a
Ventana acquisition Diagnostics 546 n/a Classification of amortisation and impairment expenses in millions of CHF
2008 2007 Amortisation Impairment Amortisation Impairment
Cost of sales - Pharmaceuticals 477 - 614 - - Diagnostics 450 5 328 - Research and development - Pharmaceuticals 34 99 31 58 - Diagnostics 8 - 3 - Total 969 104 976 58 Internally generated intangible assets The Group currently has no internally generated intangible assets from development as the criteria for the recognition as an asset are not met. Intangible assets with indefinite useful lives The Group currently has no intangible assets with indefinite useful lives. Impairment of intangible assets Impairment charges arise from changes in the estimates of the future cash flows expected to result from the use of the asset and its eventual disposal. Factors such as the presence or absence of competition, technical obsolescence or lower than anticipated sales for products with capitalised rights could result in shortened useful lives or impairment. 2008: In the Roche Pharmaceuticals operating segment an impairment charge of 30 million Swiss francs was recorded in the first half of 2008 and a further 69 million Swiss francs were recorded in the second half of 2008. These relate to product intangibles not available for use and follow from decisions to terminate development of three compounds with alliance partners. The assets concerned, which were not yet being amortised, were fully written-down by these charges. In the Diagnostics operating segment an impairment charge of 5 million Swiss francs was recorded in the second half of 2008 relating to product intangible assets in use. These followed the regular updating of the division’s business plans and technology assessments in the second half of 2008. The assets were written down to their recoverable amount of 13 million Swiss francs, based on a value in use calculation using a discount rate of 8.4%. 2007: In the Genentech operating segment an impairment charge of 42 million Swiss francs was recorded in the second half of 2007, which relates to a decision to terminate development of compounds with two alliance partners. In the Roche Pharmaceuticals operating segment an impairment charge of 16 million Swiss francs was recorded in the first half of 2007, which relates to a decision to terminate development of one compound with an alliance partner. The assets concerned, which were not yet being amortised, were fully written-down by these charges.

Page 274
86
Intangible assets that are not yet available for use mostly represent in-process research and development assets acquired either through in-licensing arrangements, business combinations or separate purchases. As at 31 December 2008 the carrying value of such assets in the Pharmaceuticals Division is 1,946 million Swiss francs. Of this amount approximately 40% represents projects that have potential decision points within the next twelve months which in certain circumstances could lead to impairment. Due to the inherent uncertainties in the research and development process, such assets are particularly at risk of impairment if the project in question does not result in a commercialised product. Potential commitments from alliance collaborations The Group is party to in-licensing and similar arrangements with its alliance partners. These arrangements may require the Group to make certain milestone or other similar payments dependent upon the achievement of agreed objectives or performance targets as defined in the collaboration agreements. The Group’s current estimate of future third-party commitments for such payments is set out in the table below. These figures are not risk adjusted, meaning that they include all such potential payments that can arise assuming all projects currently in development are successful. The timing is based on the Group’s current best estimate. These figures do not include any potential commitments within the Group, such as may arise between the Roche Pharmaceuticals, Genentech and Chugai businesses.
Potential future third-party collaboration payments as at 31 December 2008 in millions of CHF Pharmaceuticals Diagnostics Group
Within one year 113 24 137 Between one and two years 152 10 162 Between two and three years 135 10 145 Total 400 44 444
15. ASSOCIATES
The Group’s investments in associates are accounted for using the equity method. The goodwill arising from investments in associates is classified as part of the investments in associates.
Investments in associates in millions of CHF Share of net income Balance sheet value 2008 2007 2008 2007
Total investments in associates 1 2 9 9 The Group has no significant investments in associates and there were no material transactions between the Group and its associates. Additional information about associates is given in Note 34.

Page 275
87
16. FINANCIAL AND OTHER LONG-TERM ASSETS
Financial and other long-term assets in millions of CHF 2008 2007
Available-for-sale investments 588 836 Held-to-maturity investments 16 19 Loans receivable 16 19 Long-term trade receivables 73 190 Restricted cash 205 226 Other 42 43 Total financial long-term assets 940 1,333 Long-term employee benefits 230 273 Other 221 254 Total other long-term assets 451 527 Financial long-term assets are held for strategic purposes and are classified as non-current. The available-for-sale investments are mainly equity investments. Unquoted equity investments classified as available-for-sale are generally measured at cost, as their fair value cannot be measured reliably. These are primarily investments in private biotechnology companies, which are kept as part of the Group’s strategic alliance efforts. The carrying value of equity investments held at cost is 25 million Swiss francs (2007: 26 million Swiss francs). The average effective interest rate of held-to-maturity investments is 2.5% (2007: 4.4%). Loans receivable comprise all loans to third parties with a term of over one year. 17. INVENTORIES
Inventories in millions of CHF 2008 2007
Raw materials and supplies 702 603 Work in process 1,003 1,168 Finished goods and intermediates 4,466 4,590 Less: provision for slow-moving and obsolete inventory (341) (248) Total inventories 5,830 6,113 In 2008 expenses relating to inventories expensed through cost of sales totalled 8,419 million Swiss francs (2007: 8,737 million Swiss francs). 18. ACCOUNTS RECEIVABLE
Accounts receivable in millions of CHF 2008 2007
Trade accounts receivable 9,804 9,834 Notes receivable 181 190 Less: allowances (230) (220) Total accounts receivable 9,755 9,804

Page 276
88
At 31 December 2008 accounts receivable include amounts denominated in US dollars equivalent to 2.8 billion Swiss francs (2007: 3.8 billion Swiss francs) and amounts denominated in euros equivalent to 3.9 billion Swiss francs (2007: 3.8 billion Swiss francs). Net bad debt expense was 43 million Swiss francs (2007: 26 million Swiss francs). Significant concentrations within trade receivables of counterparty credit risk are described in Note 32. 19. OTHER CURRENT ASSETS
Other current assets in millions of CHF 2008 2007
Accrued interest income 145 37 Derivative financial instruments 24 262 70 Restricted cash - 889 Other 624 593 Total financial current assets 1,031 1,589 Prepaid expenses 452 355 Other 497 508 Total non-financial current assets 949 863 Total other current assets 1,980 2,452 Restricted cash in 2007 includes 889 million Swiss francs of the surety bond posted by Genentech in connection with the City of Hope litigation (see Note 25). Following the settlement of this litigation the entirety of the pledged amount became unrestricted cash and available for use in Genentech’s operations during the third quarter of 2008. 20. MARKETABLE SECURITIES
Marketable securities in millions of CHF 2008 2007
Financial assets at fair-value-through-profit-or-loss Held-for-trading investments - Bonds and debentures 1,027 1,129 Designated as fair-value-through-profit-or-loss - Bonds and debentures - 78 - Money market instruments and time accounts over three months - 167 - other investments - 178 Total financial assets at fair-value-through-profit-or-loss 1,027 1,552 Available-for-sale financial assets - Shares 51 292 - Bonds and debentures 6,814 7,624 - Money market instruments and time accounts over three months 7,961 10,965 - Other investments 3 14 Total available-for-sale financial assets 14,829 18,895 Total marketable securities 15,856 20,447

Page 277
89
Marketable securities are held for fund management purposes and are classified as current. They are primarily denominated in US dollars and euros. Other investments held for strategic purposes are classified as non-current (see Note 16). Shares: These consist primarily of readily saleable equity securities. Bonds and debentures: The carrying values, contract maturity and average effective interest rate of debt securities is shown below. Bonds and debentures in millions of CHF
2008 2007
Contracted maturity Amount Average effective
interest rate Amount Average effective
interest rate Within one year 2,612 5.81% 2,367 5.05% Between one and five years 4,178 5.81% 5,690 4.89% More than five years 1,051 5.35% 774 5.40% Total bonds and debentures 7,841 5.75% 8,831 4.98% Money market instruments: These generally have fixed interest rates ranging from 0.05% to 5.50% (2007: 0.72% to 6.13%) depending upon the currency in which they are denominated. They are contracted to mature within one year of 31 December 2008. 21. CASH AND CASH EQUIVALENTS
Cash and cash equivalents in millions of CHF 2008 2007
Cash - Cash in hand and in current or call accounts 1,999 2,792 Cash equivalents - Time accounts with a maturity of three months or less 2,916 963 Total cash and cash equivalents 4,915 3,755
22. ACCOUNTS PAYABLE
Accounts payable in millions of CHF 2008 2007
Trade accounts payable 1,053 1,188 Other taxes payable 437 406 Dividends payable 15 - Other accounts payable 512 267 Total accounts payable 2,017 1,861

Page 278
90
23. ACCRUED AND OTHER CURRENT LIABILITIES
Accrued liabilities and other current liabilities in millions of CHF 2008 2007
Deferred income 262 231 Accrued payroll and related items 1,838 1,566 Interest payable 95 104 Derivative financial instruments 24 194 80 Other accrued liabilities 3,584 3,848 Total accrued and other current liabilities 5,973 5,829
24. DERIVATIVE FINANCIAL INSTRUMENTS
The Group uses derivative financial instruments as part of its risk management and trading strategies. This is discussed in Note 32. Derivative financial instruments are carried at fair value. The methods used for determining fair value are described in Note 1. Derivative financial instruments in millions of CHF
Assets Liabilities 2008 2007 2008 2007
Foreign currency derivatives - Forward exchange contracts and swaps 155 29 (151) (71) - Other 21 4 - (4) Interest rate derivatives - Swaps 20 7 (1) - - Other 23 - - (1) Other derivatives 43 30 (42) (4) Total derivative financial instruments 19, 23 262 70 (194) (80)
Hedge accounting
The Group’s accounting policy on hedge accounting, which is described in Note 1, requires that to qualify for hedge accounting the hedging relationship must meet several strict conditions on documentation, probability of occurrence, hedge effectiveness and reliability of measurement. As described in Note 32, the Group has financial risk management policies for foreign exchange risk, interest rate risk, market risk, credit risk and liquidity risk. When deemed appropriate, certain of the above risks are managed through the use of derivatives. While many of these transactions can be considered as hedges in economic terms, if the required conditions are not met, then the relationship does not qualify for hedge accounting. In this case the hedging instrument and the hedged item are reported independently as if there were no hedging relationship, which means that any derivatives are reported at fair value, with changes in fair value included in financial income. The Group generally limits the use of hedge accounting to certain significant transactions. Consequently as at 31 December 2008 the Group has no fair value hedges, cash flow hedges or hedges of net investment in a foreign entity that meet the strict requirements to qualify for hedge accounting, apart from those described below. The Group has hedged some of its fixed-term debt instruments with interest rate swaps. As at 31 December 2008 such instruments, which have been designated and qualify as fair value hedges, are recorded in the balance sheet as an asset with a fair value of 20 million Swiss francs (2007: asset of 7 million Swiss francs). During 2008 a gain of 14 million Swiss francs was recorded on these interest rate swaps (2007: gain of 20 million Swiss francs). As the fair value hedge has been highly effective since inception, the result of the interest rate swaps is largely offset by changes in the fair value of the hedged debt instruments.
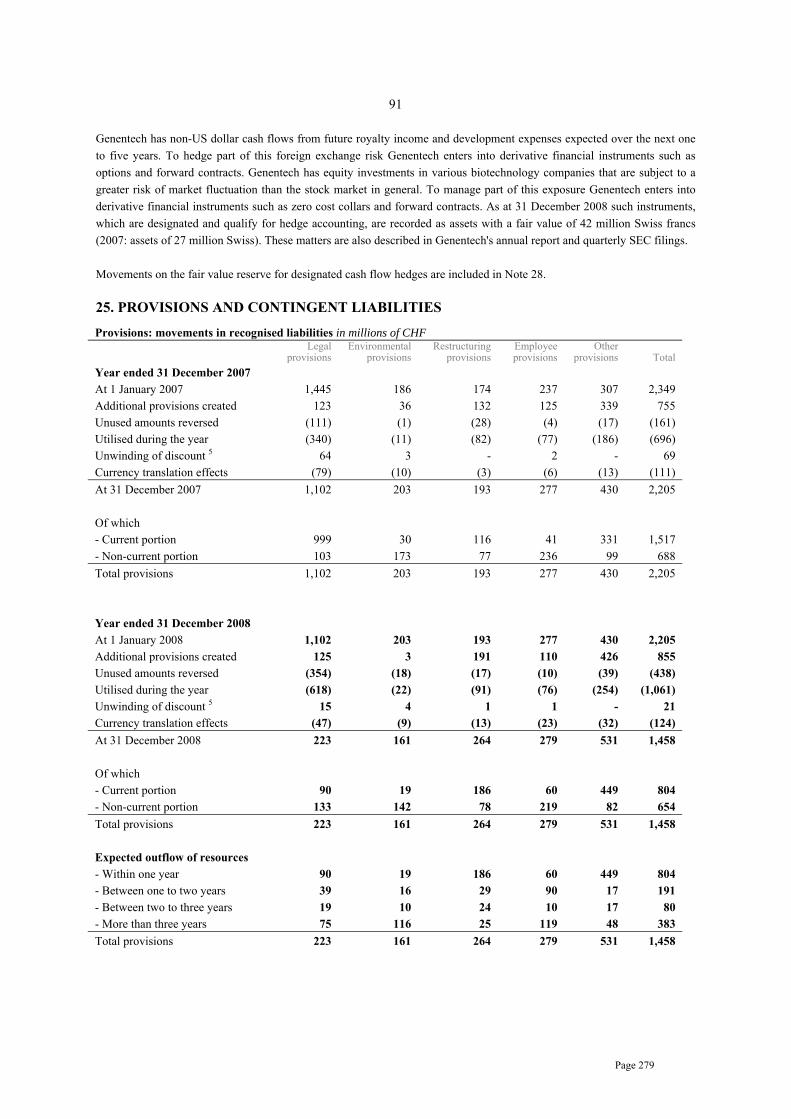
Page 279
91
Genentech has non-US dollar cash flows from future royalty income and development expenses expected over the next one to five years. To hedge part of this foreign exchange risk Genentech enters into derivative financial instruments such as options and forward contracts. Genentech has equity investments in various biotechnology companies that are subject to a greater risk of market fluctuation than the stock market in general. To manage part of this exposure Genentech enters into derivative financial instruments such as zero cost collars and forward contracts. As at 31 December 2008 such instruments, which are designated and qualify for hedge accounting, are recorded as assets with a fair value of 42 million Swiss francs (2007: assets of 27 million Swiss). These matters are also described in Genentech's annual report and quarterly SEC filings. Movements on the fair value reserve for designated cash flow hedges are included in Note 28. 25. PROVISIONS AND CONTINGENT LIABILITIES
Provisions: movements in recognised liabilities in millions of CHF
Legal
provisions Environmental
provisions Restructuring
provisions Employee provisions
Other provisions Total
Year ended 31 December 2007 At 1 January 2007 1,445 186 174 237 307 2,349 Additional provisions created 123 36 132 125 339 755 Unused amounts reversed (111) (1) (28) (4) (17) (161) Utilised during the year (340) (11) (82) (77) (186) (696) Unwinding of discount 5 64 3 - 2 - 69 Currency translation effects (79) (10) (3) (6) (13) (111) At 31 December 2007 1,102 203 193 277 430 2,205 Of which - Current portion 999 30 116 41 331 1,517 - Non-current portion 103 173 77 236 99 688 Total provisions 1,102 203 193 277 430 2,205 Year ended 31 December 2008 At 1 January 2008 1,102 203 193 277 430 2,205 Additional provisions created 125 3 191 110 426 855 Unused amounts reversed (354) (18) (17) (10) (39) (438) Utilised during the year (618) (22) (91) (76) (254) (1,061) Unwinding of discount 5 15 4 1 1 - 21 Currency translation effects (47) (9) (13) (23) (32) (124) At 31 December 2008 223 161 264 279 531 1,458 Of which - Current portion 90 19 186 60 449 804 - Non-current portion 133 142 78 219 82 654 Total provisions 223 161 264 279 531 1,458 Expected outflow of resources - Within one year 90 19 186 60 449 804 - Between one to two years 39 16 29 90 17 191 - Between two to three years 19 10 24 10 17 80 - More than three years 75 116 25 119 48 383 Total provisions 223 161 264 279 531 1,458

Page 280
92
Major legal cases Income (expense) from major legal cases is disclosed separately in the income statement due to the materiality of the amounts and in order to fairly present the Group’s results. Income of 271 million Swiss francs was recorded in 2008 following the 24 April 2008 California Supreme Court decision in the City of Hope litigation (see below). This consists of the 310 million US dollars released to income as a favourable litigation settlement, net of amounts recorded in respect of final settlement negotiations with the City of Hope National Medical Center. Costs of other litigation matters that are less material are expensed in the current period and reported within general and administration expenses. The total income tax expense recorded in respect of major legal cases was 105 million Swiss francs (see Note 6). Legal provisions Legal provisions consist of a number of separate legal matters, including claims arising from trade, in various Group companies. The majority of any cash outflows for these other matters are expected to occur within the next one to three years, although these are dependent on the development of the various litigations. Significant provisions are discounted by between 4% and 5% where the time value of money is material. Environmental provisions Provisions for environmental matters include various separate environmental issues in a number of countries. By their nature the amounts and timing of any outflows are difficult to predict. The estimated timings of these cash outflows are shown in the table above. Significant provisions are discounted by between 7% and 8% where the time value of money is material. Restructuring provisions These arise from planned programmes that materially change the scope of business undertaken by the Group or the manner in which business is conducted. Such provisions include only the costs necessarily entailed by the restructuring which are not associated with the recurring activities of the Group. The timings of these cash outflows are reasonably certain on a global basis and are shown in the table above. Significant provisions are discounted by 4% where the time value of money is material. Employee provisions These mostly relate to certain employee benefit obligations, such as sabbatical leave and long-service benefits. The timings of these cash outflows can be reasonably estimated based on past performance and are shown in the table above. Significant provisions are discounted by 6% where the time value of money is material. Other provisions Other provisions mostly relate to sales returns and various other provisions from Group companies that do not fit into the above categories. The timings of cash outflows are by their nature uncertain and the best estimates are shown in the table above. These provisions are not discounted as the time value of money is not material in these matters. Contingent liabilities The operations and earnings of the Group continue, from time to time and in varying degrees, to be affected by political, legislative, fiscal and regulatory developments, including those relating to environmental protection, in the countries in which it operates. The industries in which the Group operates are also subject to other risks of various kinds. The nature and frequency of these developments and events, not all of which are covered by insurance, as well as their effect on future operations and earnings, are not predictable. The Group has entered into strategic alliances with various companies in order to gain access to potential new products or to utilise other companies to help develop the Group’s own potential new products. Potential future payments may become due to certain collaboration partners achieving certain milestones as defined in the collaboration agreements. The Group’s best estimates of future commitments for such payments are given in Note 14.

Page 281
93
Roche Pharmaceuticals legal cases Hoffmann-La Roche Inc. (‘HLR’) and various other Roche affiliates have been named as defendants in numerous legal actions in the United States and elsewhere relating to the acne medication Accutane. The litigation alleges that Accutane caused certain serious conditions, including, but not limited to, inflammatory bowel disease (‘IBD’), birth defects and psychiatric disorders. As of 31 December 2008 HLR is defending approximately 560 actions brought in various federal and state courts throughout the United States for personal injuries allegedly resulting from their use of Accutane. Most of the actions allege IBD as a result of Accutane use. All of the actions pending in federal court alleging IBD were consolidated for pre-trial proceedings in a Multi-District Litigation in the United States District Court for the Middle District of Florida, Tampa Division. In July 2007 the District Court granted summary judgment in favour of HLR in the lead federal IBD cases. The plaintiffs appealed and in August 2008 these rulings were affirmed by the United States Court of Appeals for the Eleventh Circuit. All of the actions pending in state court in New Jersey alleging IBD were consolidated for pre-trial proceedings in the Superior Court of New Jersey, Law Division, Atlantic County. As of 31 December 2008 juries in the Superior Court have ruled in favour of the plaintiff in five cases, assessing total compensatory damages totalling 26 million US dollars. HLR has appealed in one case to the Superior Court of New Jersey, Appellate Division and is reviewing its post-trial option in the other cases. In October 2007 a jury in the Circuit Court of Escambia County, Florida, returned a verdict in favour of the plaintiff, assessing total compensatory damages of 7 million US dollars, subsequently reduced to 6.8 million US dollars by the court, against the Company. HLR has appealed to the District Court of Appeal, State of Florida. As of 31 December 2008 the Group has recorded provisions totalling 96 million US dollars (102 million Swiss francs) in respect of these matters. Additional trials are scheduled for 2009. Individual trial results depend on a variety of factors, including many that are unique to the particular case and therefore the trial results to date may not be predictive of future trial results. The Group continues to defend vigorously the remaining personal injury cases and claims. Genentech legal cases On 10 June 2002 Genentech announced that a Los Angeles County Superior Court jury voted to award the City of Hope National Medical Center (‘City of Hope’) approximately 300 million US dollars in compensatory damages based on a finding of a breach of a 1976 agreement between Genentech and the City of Hope. On 24 June 2002 the jury voted to award the City of Hope 200 million US dollars in punitive damages in the same case. On 13 September 2002 Genentech filed a notice of appeal of the jury verdict and damages awards with the California Court of Appeal. On 21 October 2004 the Court of Appeal affirmed the verdict and damages awards in all respects. Also, on 21 October 2004 Genentech announced that it would seek review by the California Supreme Court, which has discretion over which cases it will review. On 24 November 2004 Genentech filed its petition for review by the California Supreme Court and on 2 February 2005 the California Supreme Court granted this petition. The appeal to the California Supreme Court was heard on 5 February 2008 and on 24 April 2008 overturned the award of 200 million US dollars in punitive damages to the City of Hope, but upheld the award of 300 million US dollars in compensatory damages. On 9 May 2008 Genentech paid 476 million US dollars to the City of Hope, reflecting the amount of compensatory damages awarded, plus interest thereon from the date of the original decision on 10 June 2002. During the appeals process interest had accrued on the total amount of the damages at a simple annual rate of 10%. During 2008 interest of 11 million Swiss francs (2007: 60 million Swiss francs) was recorded as the time cost of provisions within financing costs.

Page 282
94
A full provision, totalling 776 million US dollars as at 31 December 2007, had been recorded for these awards. As a result of the 24 April 2008 California Supreme Court decision, provisions totalling 310 million US dollars were released to income as a favourable litigation settlement, of which 200 million US dollars relates to the original award recorded in 2002 as an exceptional major legal case expense and 110 million US dollars relates to interest accrued as a charge to financing costs in the intervening periods. On 3 October 2002 Genentech entered into an arrangement with third-party insurance companies to post a surety bond in connection with this judgment. As part of this arrangement Genentech had pledged 788 million US dollars in cash and investments to secure this bond. This amount, which was equivalent to 889 million Swiss francs at 31 December 2007, was recorded as restricted cash within other current assets in the Annual Financial Statements. During the third quarter of 2008 the court completed certain administrative procedures to dismiss the case. As a result the restrictions were lifted from the restricted cash and investments and the funds became available for use in Genentech’s operations. Genentech and City of Hope are in discussions but have not yet reached agreement regarding additional royalties and other amounts that Genentech owes to City of Hope under the 1976 agreement for third-party product sales and settlement of a third-party patent litigation that occurred after the 2002 judgement. Additional accruals have been made representing management’s best estimate of the final obligation. On 4 October 2004 Genentech received a subpoena from the United States Department of Justice, requesting documents related to the promotion of Rituxan. Genentech is co-operating with the associated investigation. Through counsel Genentech are having discussions with government representatives about the status of their investigation and Genentech’s views on this matter, including potential resolution. Previously the investigation had been both civil and criminal in nature. Genentech was informed in August 2008 by the criminal prosecutor who handled this matter that the government has declined to prosecute Genentech criminally in connection with this investigation. The civil matter is still ongoing. The outcome of this matter cannot be determined at this time. On 11 April 2003 MedImmune, Inc. (‘MedImmune’) filed a lawsuit against Genentech, the City of Hope National Medical Center, and Celltech R&D Ltd., in the US District Court for the Central District of California, Los Angeles. The lawsuit relates to US Patent No. 6,331,415 (‘the Cabilly patent’) that is co-owned by Genentech and the City of Hope National Medical Center and under which MedImmune and other companies have been licensed and are paying royalties. The lawsuit included claims for violation of antitrust, patent and unfair competition laws. On 11 June 2008 Genentech announced that it had settled its patent litigation with MedImmune. Under the terms of the settlement agreement the litigation which was pending before the US District Court for the Central District of California has now been fully resolved and dismissed. On 13 May 2005 a request was filed by a third party for re-examination of the Cabilly patent. On 7 July 2005 the US Patent and Trademark Office ordered a re-examination of this patent. On 13 September 2005 the Patent Office issued an initial non-final Office action rejecting the claims of the patent. Genentech filed a response on 25 November 2005. A second re-examination request for this same patent was filed on 23 December 2005 by another third party and on 23 January 2006 the Patent Office granted that re-examination request. On 6 June 2006 the two re-examinations were combined by the Patent Office into a single re-examination. On 16 August 2006 the Patent Office issued a non-final Office action in the merged proceeding, rejecting the claims of the Cabilly patent based on the issues raised in the two re-examination requests. Genentech filed its response on 30 October 2006. On 16 February 2007 the Patent Office mailed a final Office action rejecting all thirty six claims of the Cabilly patent. On 21 May 2007 Genentech responded to the final Office action and petitioned for continued re-examination. On 31 May 2007 the Patent Office granted Genentech’s petition, withdrew the finality of the February 2007 Office action and agreed to treat Genentech’s 21 May 2007 filing as a response to a first Office action. On 25 February 2008 the Patent Office mailed a final Patent Office action rejecting all the claims of the Cabilly patent. Genentech filed a response to that final Patent Office action on 6 June 2008. On 19 July 2008 the Patent Office mailed an advisory action replying to Genentech’s response and confirming the rejection of all claims of the Cabilly patent. Genentech filed a notice of appeal challenging the rejection on 22 August 2008. Genentech’s opening appeal brief was on 9 December 2008. The Cabilly patent, which expires in 2018, relates to methods used by Genentech and

Page 283
95
others to make certain antibodies or antibody fragments, as well as cells and DNA used in these methods. Genentech has licensed the Cabilly patent to other companies and derives significant royalties from these licences. The claims of the Cabilly patent remain valid and enforceable throughout the re-examination and appeals processes. No provisions have been recorded in respect of this litigation as the outcome of this matter cannot be determined at this time. During the fourth quarter of 2008 the process of recognising revenue from the Cabilly patents was changed from an estimated accruals basis to a cash basis. As a result of this change, net royalties decreased by approximately 66 million US dollars, equivalent to 71 million Swiss francs, in the fourth quarter of 2008 compared to the third quarter. The Cabilly patent licences contributed operating profit of 156 million US dollars in 2008, equivalent to 169 million Swiss francs (2007: 133 million US dollars, equivalent to 160 million Swiss francs). On 30 May 2008 Centocor, Inc. filed a patent lawsuit against Genentech and City of Hope in the US District Court for the Central District of California. The lawsuit relates to the Cabilly patent and seeks a declaratory judgment of patent invalidity and unenforceability with regard to the Cabilly patent and of patent non-infringement with regard to certain of Centocor’s products. Centocor filed an amended complaint on 3 September 2008. Genentech answered the complaint on 19 September 2008 and also filed counterclaims against Centocor alleging that four Centocor products infringe certain Genentech patents. Genentech filed an amendment to those counterclaims on 10 October 2008 and Centocor answered these counterclaims on 26 November 2008. A status conference has been set in the case for 9 February 2009. The outcome of this matter cannot be determined at this time. In 2006 Genentech made development decisions involving its humanised anti-CD20 programme, and its collaborator, Biogen Idec Inc., disagreed with certain of Genentech’s development decisions related to humanised anti-CD20 products. Under Genentech’s 2003 collaboration agreement with Biogen Idec, Genentech believe that it is permitted to proceed with further trials of certain humanised anti-CD20 antibodies, but Biogen Idec disagreed with Genentech’s position. The disputed issues have been submitted to arbitration. In the arbitration, Biogen Idec filed motions for a preliminary injunction and summary judgment seeking to stop Genentech from proceeding with certain development activities, including planned clinical trials. On 20 April 2007, the arbitration panel denied Biogen Idec’s motion for a preliminary injunction and Biogen Idec’s motion for summary judgment. Resolution of the arbitration could require that both parties agree to certain development decisions before moving forward with humanised anti-CD20 antibody clinical trials (and possibly clinical trials of other collaboration products, including Rituxan), in which case Genentech may have to alter or cancel planned clinical trials in order to obtain Biogen Idec’s approval. Each party is also seeking monetary damages from the other. The arbitrators held hearings on this matter over several days in September 2008 and closing arguments on 9 December 2008. The hearings formally closed on 8 January 2009. A final decision from the arbitrators is expected by no later than July 2009. The outcome of this matter cannot be determined at this time. On 28 June 2003 Mr Ubaldo Bao Martinez filed a lawsuit against Porriño Town Council and Genentech España S.L. in the Contentious Administrative Court Number One of Pontevedra, Spain. The lawsuit challenges the Town Council’s decision to grant licenses to Genentech España S.L. for the construction and operation of a warehouse and biopharmaceutical manufacturing facility in Porriño, Spain. On 21 January 2008 the Administrative Court ruled in favour of Mr Bao on one of the claims in the lawsuit and ordered the closing and demolition of the facility, subject to certain further legal proceedings. On 12 February 2008, Genentech and the Town Council filed appeals of the Administrative Court decision at the High Court in Galicia, Spain. In addition, Genentech are evaluating with legal counsel in Spain whether there may be other administrative remedies available to overcome the Administrative Court’s ruling. Genentech sold the assets of Genentech España S.L., including the Porriño facility, to Lonza Group Ltd. (‘Lonza’) in December 2006, and Lonza has operated the facility since that time. Under the terms of that sale, Genentech retained control of the defence of this lawsuit and agreed to indemnify Lonza against certain contractually defined liabilities up to a specified limit, which is currently estimated to be approximately 100 million US dollars. No provisions have been recorded in respect of this litigation as the outcome of this matter and Genentech’s indemnification obligation to Lonza, if any, cannot be determined at this time.

Page 284
96
On 8 May, 11 June, 8 August, and 29 September of 2008, Genentech was named as a defendant, along with InterMune, Inc. and its former chief executive officer, W. Scott Harkonen, in four separate class-action complaints filed in the US District Court for the Northern District of California on behalf of plaintiffs who allegedly paid part or all of the purchase price for a product that was licensed by Genentech to Connectics Corporation and was subsequently assigned to InterMune. The complaints are related in part to royalties that Genentech received. The 8 May, 11 June, 8 August complaints have been consolidated into a single amended complaint that claims and seeks damages for violations of federal racketeering laws, unfair competition laws, and consumer protection laws, and for unjust enrichment. The 29 September complaint includes six claims, but only names Genentech as a defendant in one claim for damages for unjust enrichment. This matter was formally related to the consolidated complaint on 10 December 2008. Genentech’s motion to dismiss these matters is currently scheduled for hearing on 2 February 2009. The outcome of these matters cannot be determined at this time. Subsequent to the Roche Proposal, more than thirty shareholder lawsuits have been filed against Genentech and/or the members of its Board of Directors, and various Roche entities including Roche Holdings, Inc. (RHI) and Roche Holding Ltd. (Roche Holding AG). The lawsuits are currently pending in various state courts, including the Delaware Court of Chancery and San Mateo County Superior Court, as well as in the United States District Court for the Northern District of California. The lawsuits generally assert class-action claims for breach of fiduciary duty and aiding and abetting breaches of fiduciary duty based in part on allegations that, in connection with Roche’s offer to purchase the remaining shares, some or all of the defendants have failed to properly value Genentech, have failed to solicit other potential acquirers and are engaged in improper self-dealing. Several of the suits also seek the invalidation, in whole or in part, of the July 1999 Affiliation Agreement between Genentech and RHI (Affiliation Agreement), and an order deeming Articles 8 and 9 of Genentech’s Amended and Restated Certificate of Incorporation inapplicable or invalid to a potential transaction with Roche. The outcome of these matters cannot be determined at this time. On 27 October 2008 Genentech and Biogen Idec Inc. filed a complaint against Sanofi-Aventis Deutschland GmbH (‘Sanofi’), Sanofi-Aventis US LLC and Sanofi-Aventis US Inc. in the Northern District of California seeking a declaratory judgement that certain Genentech products, including Rituxan, do not infringe Sanofi’s US Patents 5,849,522 (‘the ‘522 patent’) and 6,218,140 (‘the ‘140 patent’) and a declaratory judgement that the ‘522 and ‘140 patents are invalid. On 2 December 2008 Sanofi filed a motion to dismiss this complaint for lack of jurisdiction. A discovery hearing relating to this motion is currently set for 13 February 2009. Also on 27 October 2008 Sanofi filed suit against Genentech and Biogen Idec in the Eastern District of Texas, Lufkin Division, claiming that Rituxan and at least eight other Genentech products infringe the ‘522 and ‘140 patents. On 22 January 2009 Genentech filed a motion to transfer this matter to the Northern District of California. Sanofi is seeking preliminary and permanent injunctions, compensatory and exemplary damages, and other relief. In addition on 24 October 2008 Hoechst GmbH filed with the ICC International Court of Arbitration (Paris) a request for arbitration with Genentech, relating to a terminated agreement between Hoechst’s predecessors and Genentech that pertained to the above patents and related patents outside the United States. Genentech’s answer to the arbitration request was filed on 19 January 2009. Hoechst is seeking payments on royalties on sales of Genentech products, damages for breach of contract, and other relief. Genentech intends to vigorously defend itself. The outcome of these matters cannot be determined at this time. Genentech's annual report and quarterly SEC filings contain the detailed disclosures of litigation matters that are required by US GAAP. These include further details on the above matters as well as including information on other litigation that is not currently as significant as the matters referred to above.

Page 285
97
26. OTHER NON-CURRENT LIABILITIES
Other non-current liabilities in millions of CHF 2008 2007
Deferred income 174 243 Other long-term liabilities 285 480 Total other non-current liabilities 459 723 27. DEBT
Debt: recognised liabilities in millions of CHF 2008 2007
Debt instruments 3,564 6,294 Amounts due to banks and other financial institutions 77 130 Genentech leasing obligations 3 337 305 Finance lease obligations 12 4 9 Other borrowings 107 128 Total debt 4,089 6,866 Reported as - Long-term debt 2,972 3,834 - Short-term debt 1,117 3,032 Total debt 4,089 6,866 Debt: repayment terms in millions of CHF
2008 2007 Within one year 1,117 3,032 Between one and two years 565 584 Between two and three years 6 576 Between three and four years 4 25 Between four and five years 3 3 More than five years 2,394 2,646 Total debt 4,089 6,866 The fair value of the debt instruments is 3.5 billion Swiss francs (2007: 6.2 billion Swiss francs) and the fair value of total debt is 4.0 billion Swiss francs (2007: 6.8 billion Swiss francs). This is calculated based on the observable market prices of the debt instruments or the present value of the future cash flows on the instrument, discounted at a market rate of interest for instruments with similar credit status, cash flows and maturity periods. There are no pledges on the Group’s assets in connection with debt. Amounts due to banks and other financial institutions These amounts are denominated in various currencies, notably in Chinese renminbi, and the average interest rate was 4.5%. The average interest rate in 2007 was 5.8%, when the balance was primarily denominated in euros. Repayment dates are up to five years and 61 million Swiss francs (2007: 105 million Swiss francs) are due within one year.

Page 286
98 Debt instruments Recognised liabilities and effective interest rates of debt instruments in millions of CHF
Effective
interest rate 2008 2007 European Medium Term Note programme 4% bonds due 9 October 2008, principal 750 million euros 4.16% - 1,240 5.375% bonds due 29 August 2023, principal 250 million pounds sterling 5.46% 377 553 Swiss franc bonds ‘Rodeo’ 1.75% due 20 March 2008, principal 1 billion Swiss francs 3.00% - 998 US dollar bonds ‘Chameleon’ 6.75% due 6 July 2009, principal 487 million US dollars 6.77% 522 568 Genentech Senior Notes 4.40% Senior Notes due 15 July 2010, principal 500 million US dollars 4.53% 549 569 4.75% Senior Notes due 15 July 2015, principal 1 billion US dollars 4.87% 1,058 1,127 5.25% Senior Notes due 15 July 2035, principal 500 million US dollars 5.39% 529 564 Genentech commercial paper Notes due at various dates until 23 January 2009, principal 500 million US dollars (2007: principal 600 million US dollars due until 22 January 2008)
0.80% (2007: 4.46%) 529 675
Japanese yen convertible bonds issued by Chugai ‘Series 6 Chugai Pharmaceutical Unsecured Convertible Bonds’ 1.05% due 30 September 2008 (2007: outstanding principal amount 42 million Japanese yen) 1.05% - - Total debt instruments 3,564 6,294 Unamortised discount included in carrying value of debt instruments in millions of CHF
2008 2007 Sterling bonds 5 8 Total unamortised discount 5 8 Fair Value Option In 2005 the Group applied the Fair Value Option on three of its outstanding debt instruments on which the Group had been applying fair value hedge accounting in the past. These debt instruments are the ‘European Medium Term Note programme’ Euro bonds, the ‘Chameleon’ US dollar bonds and the ‘Rodeo’ Swiss franc bonds. The Fair Value Option treatment is based on the elimination of an accounting mismatch which had been recognised between the hedging swaps (reported at fair value) and the hedged bonds (reported at amortised cost). The difference between the carrying value and the principal amount for these debt instruments totals 6 million Swiss francs (2007: 12 million Swiss francs). Issuance of new debt instruments - 2007 Genentech commercial paper program: In October 2007 Genentech established a commercial paper program under which it can issue up to 1 billion US dollars of unsecured commercial paper notes. Maturities under the program generally vary from overnight to five weeks and cannot exceed 397 days. As at 31 December 2008 unsecured commercial paper notes with a principal amount of 500 million US dollars (2007: 600 million US dollars) and an average interest rate of 0.80% (2007: 4.46%) were outstanding. Genentech intends to use the proceeds for general corporate purposes.

Page 287
99
Repayments, redemptions and conversions of debt instruments - 2008 Redemption of ‘Rodeo’ Swiss franc bonds: On the due date of 20 March 2008 the Group redeemed these bonds at the original issue amount plus accrued original issue discount (‘OID’). The effective interest rate of these bonds was 3.00%. The cash outflow was 1,000 million Swiss francs and there was no gain or loss recorded on the redemption. Redemption of European Medium Term Note programme Euro bonds: On the due date of 9 October 2008 the Group redeemed at the original issue amount plus accrued original issue discount (‘OID'). The effective interest rate of these bonds was 4.16%. The cash outflow was 1,188 million Swiss francs and there was no gain or loss recorded on the redemption. Conversion and redemption of ‘Series 6 Chugai Pharmaceutical Unsecured Convertible Bonds’: During 2008 the remaining outstanding bonds with a face value of 42 million Japanese yen (0.4 million Swiss francs) were either converted to shares of Chugai or redeemed at the issue price on the due date of 30 September 2008. The Group’s percentage ownership of Chugai was unaffected by this conversion, as the Group had bonds convertible into Chugai shares that mirrored those that Chugai had outstanding with third parties. There was no gain or loss recorded in the income statement upon the conversion and redemption. The cash outflow was less than 1 million Swiss francs. Repayments, redemptions and conversions of debt instruments - 2007 Conversion and redemption of ‘LYONs V’ US dollar exchangeable notes: On 22 June 2007 the Group announced that it would exercise its option to call these notes for redemption on 25 July 2007 at the original issue amount plus accrued original issue discount (‘OID’). In the period to 24 July 2007 notes with a principal amount of 848 million US dollars were converted into 4.5 million non-voting equity securities and the remaining notes were redeemed for cash on 25 July 2007. A total of 324 million Swiss francs were recorded to equity, which consists of the 1,008 million Swiss francs of cash used to purchase the non-voting equity securities used in the conversion and redemption, less the 622 million Swiss francs carrying value of the converted bonds and the related tax effects of 62 million Swiss francs. There was no gain or loss recorded in the income statement upon the conversion and redemption. Redemption of European Medium Term Note programme US dollar bonds: On the due date of 2 October 2007 the Group redeemed these bonds with a principal value of 750 million US dollars at the original issue amount plus accrued original issue discount (‘OID'). The cash outflow was 900 million Swiss francs. There was no gain or loss recorded in the income statement upon the redemption. Partial conversion of ‘Series 6 Chugai Pharmaceutical Unsecured Convertible Bonds’: During 2007 bonds with a face value of 0.1 billion Japanese yen (1 million Swiss francs) were converted to shares of Chugai. The Group’s percentage ownership of Chugai was unaffected by this conversion, as the Group has bonds convertible into Chugai shares that mirror those that Chugai has outstanding with third parties. There was no gain or loss recorded in the income statement upon the partial conversion. Cash outflows from repayments, redemptions and conversions of debt instruments in millions of CHF
2008 2007 ‘LYONs V’ US dollar exchangeable notes - (1,008) European Medium Term Note programme US dollar bonds - (900) ‘Rodeo’ Swiss franc bonds (1,000) - European Medium Term Note programme Euro bonds (1,188) - Genentech commercial paper (net repayment) (107) Japanese yen convertible bonds issued by Chugai - - Total cash outflows from repayments and redemptions during the year (2,295) (1,908)

Page 288
100
28. EQUITY ATTRIBUTABLE TO ROCHE SHAREHOLDERS
Changes in equity attributable to Roche shareholders in millions of CHF
Year ended 31 December 2007 Share
capital Own equity instruments
Retained earnings
Fair value reserve
Hedging reserve
Translation reserve Total
At 1 January 2007 – restated 1 160 (2,102) 44,548 459 15 (3,339) 39,741 Available-for-sale investments - Valuation gains (losses) taken to equity - - - (198) - - (198) - Transferred to income statement on sale or impairment - - - (128) - - (128) Cash flow hedges - Gains (losses) taken to equity - - - - (45) - (45) - Transferred to income statement a) - - - - (3) - (3) - Transferred to the initial balance sheet carrying value of hedged items - - - - - - - Exchange differences on translation of foreign operations - - - (10) 1 (1,897) (1,906) Defined benefit plans - Actuarial gains (losses) 10 - - 1,178 - - - 1,178 - Limit on asset recognition 10 - - (636) - - - (636) Income taxes on items taken directly to or transferred from equity - - (242) 9 19 - (214) Non-controlling interests - - (3) (7) 13 529 532 Net income recognised directly in equity - - 297 (334) (15) (1,368) (1,420) Net income recognised in income statement - - 9,761 - - - 9,761 Total recognised income and expense - - 10,058 (334) (15) (1,368) 8,341 Dividends paid - - (2,930) - - - (2,930) Transactions in own equity instruments - 1,085 - - - - 1,085 Equity compensation plans - - 559 - - - 559 Genentech and Chugai share repurchases 3, 4 - - (1,044) - - - (1,044) Convertible debt instruments 27 - - (324) - - - (324) Changes in non-controlling interests - - 55 - - - 55 At 31 December 2007 160 (1,017) 50,922 125 - (4,707) 45,483
a) Of amounts transferred to income statement, losses of 10 million Swiss francs were reported as ‘Royalties and other operating income’ and gains of 7 million Swiss francs as ‘Financial income’.
As disclosed in Note 1, post-employment benefit assets, deferred tax liabilities and equity have been restated in the 31 December 2007 balance sheet following the adoption of IFRIC interpretation 14 in 2008. A reconciliation to the previously published balance sheet is provided in Note 1.

Page 289
101
Year ended 31 December 2008 Share
capital Own equity instruments
Retained earnings
Fair value reserve
Hedging reserve
Translation reserve Total
At 1 January 2008 160 (1,017) 50,922 125 - (4,707) 45,483 Available-for-sale investments - Valuation gains (losses) taken to equity - - - (671) - - (671) - Transferred to income statement on sale or impairment - - - 163 - - 163 Cash flow hedges - Gains (losses) taken to equity - - - - (55) - (55) - Transferred to income statement a) - - - - 83 - 83 - Transferred to the initial balance sheet carrying value of hedged items - - - - - - - Currency translation of foreign operations - Exchange differences - - - 16 - (2,998) (2,982) - Accumulated differences transferred to income statement on divestment 34 - - - - - (16) (16) Defined benefit plans - Actuarial gains (losses) 10 - - (2,820) - - - (2,820) - Limit on asset recognition 10 - - 636 - - - 636 Income taxes on items taken directly to or transferred from equity - - 662 88 (12) - 738 Non-controlling interests - - 18 48 (7) 181 240 Net income recognised directly in equity - - (1,504) (356) 9 (2,833) (4,684) Net income recognised in income statement - - 8,969 - - - 8,969 Total recognised income and expense - - 7,465 (356) 9 (2,833) 4,285 Dividends paid - - (3,969) - - - (3,969) Transactions in own equity instruments - (98) - - - - (98) Equity compensation plans - - 789 - - - 789 Genentech and Chugai share repurchases 3, 4 - - (472) - - - (472) Changes in ownership interests in subsidiaries - Chugai 4 - - (530) - - - (530) - Ventana 7 - - (964) - - - (964) Changes in non-controlling interests - - (45) - - - (45) At 31 December 2008 160 (1,115) 53,196 (231) 9 (7,540) 44,479
a) Of amounts transferred to income statement, losses of 86 million Swiss francs were reported as ‘Royalties and other operating income’ and gains of 3 million Swiss francs as ‘Financial income’.

Page 290
102
Share capital As of 31 December 2008, the authorised and issued share capital of Roche Holding Ltd, which is the Group’s parent company, consisted of 160,000,000 shares with a nominal value of 1.00 Swiss franc each, as in the preceding year. The shares are bearer shares and the Group does not maintain a register of shareholders. Based on information supplied to the Group, a shareholder group with pooled voting rights owns 50.0125% (2007: 50.0125%) of the issued shares. This is further described in Note 33. Based on information supplied to the Group, Novartis Ltd, Basel, and its affiliates owns 33.3330% (participation below 33 1/3 %) of the issued shares (2007: 33.3330%). Non-voting equity securities (Genussscheine) As of 31 December 2008, 702,562,700 non-voting equity securities have been authorised and were in issue as in the preceding year. Under Swiss company law these non-voting equity securities have no nominal value, are not part of the share capital and cannot be issued against a contribution which would be shown as an asset in the balance sheet of Roche Holding Ltd. Each non-voting equity security confers the same rights as any of the shares to participate in the net profit and any remaining proceeds from liquidation following repayment of the nominal value of the shares and, if any, participation certificates. In accordance with the law and the Articles of Incorporation of Roche Holding Ltd, the Company is entitled at all times to exchange all or some of the non-voting equity securities into shares or participation certificates. Dividends On 4 March 2008 the shareholders approved the distribution of a dividend of 4.60 Swiss francs per share and non-voting equity securities (2007: 3.40 Swiss francs) in respect of the 2007 business year. The distribution to holders of outstanding shares and non-voting equity securities totalled 3,969 million Swiss francs (2007: 2,930 million Swiss francs) and has been recorded against retained earnings in 2008. The Board of Directors has proposed dividends for the 2008 business year of 5.00 Swiss francs per share and non-voting equity security. This is subject to approval at the Annual General Meeting on 10 March 2009. Own equity instruments Holdings of own equity instruments in equivalent number of non-voting equity securities
31 December 2008
(millions) 31 December 2007
(millions) Non-voting equity securities 3.0 0.4 Low Exercise Price Options - 1.9 Derivative instruments 8.5 9.3 Total own equity instruments 11.5 11.6 Own equity instruments are recorded within equity at original purchase cost. Details of own equity instruments held at 31 December 2008 are shown in the table below. Fair values are disclosed for information purposes. Own equity instruments at 31 December 2008: supplementary information
Equivalent number of non-voting
equity securities (millions) Maturity
Strike price (CHF)
Market value (CHF millions)
Non-voting equity securities 3.0 n/a n/a 481 Low Exercise Price Options - - - - Derivative instruments
8.5 2 Feb. 2010 –
8 Feb. 2014 123.00 –
229.60 310 Total 11.5 791

Page 291
103
Non-voting equity securities and derivative instruments are held for the Group’s potential conversion obligations that may arise from the Roche Option Plan and Roche Stock-settled Stock Appreciation Rights (see Note 11). These mainly consist of call options that are exercisable at any time up to their maturity. The net cash outflow from transactions in own equity instruments was 98 million Swiss francs (2007: net cash inflow of 1,085 million Swiss francs). The large cash inflow in 2007 mainly arose from a reduction in own equity instrument holdings following the conversion and redemption of the ‘LYONs V’ notes. The Group holds none of its own shares. Reserves Fair value reserve: The fair value reserve represents the cumulative net change in the fair value of available-for-sale financial assets until the asset is sold, impaired or otherwise disposed of. Hedging reserve: The hedging reserve represents the effective portion of the cumulative net change in the fair value of cash flow hedging instruments related to hedged transactions that have not yet occurred. Translation reserve: The translation reserve represents the cumulative currency translation differences relating to the consolidation of Group companies that use functional currencies other than Swiss francs. 29. EARNINGS PER SHARE AND NON-VOTING EQUITY SECURITY
Basic earnings per share and non-voting equity security For the calculation of basic earnings per share and non-voting equity security, the number of shares and non-voting equity securities is reduced by the weighted average number of its own non-voting equity securities held by the Group during the period. Basic earnings per share and non-voting equity security
Group 2008 2007
Net income attributable to Roche shareholders (CHF millions) 8,969 9,761 Number of shares (millions) 28 160 160 Number of non-voting equity securities (millions) 28 703 703 Weighted average number of own non-voting equity securities held (millions) (3) (4) Weighted average number of shares and non-voting equity securities in issue (millions) 860 859 Basic earnings per share and non-voting equity security (CHF) 10.43 11.36 Diluted earnings per share and non-voting equity security For the calculation of diluted earnings per share and non-voting equity security, the net income and weighted average number of shares and non-voting equity securities outstanding are adjusted for the effects of all dilutive potential shares and non-voting equity securities.

Page 292
104
Potential dilutive effects arise from the convertible debt instruments and the employee stock option plans. If the outstanding convertible debt instruments were to be converted then this would lead to a reduction in interest expense and an increase in the number of shares which may have a net dilutive effect on the earnings per share. The exercise of outstanding vested employee stock options would have a dilutive effect. The exercise of the outstanding vested Genentech employee stock options would have a dilutive effect if the net income of Genentech is positive. The diluted earnings per share and non-voting equity security reflects the potential impacts of these dilutive effects on the earnings per share figures. Diluted earnings per share and non-voting equity security
Group 2008 2007
Net income attributable to Roche shareholders (CHF millions) 8,969 9,761 Elimination of interest expense, net of tax, of convertible debt instruments, where dilutive (CHF millions) - 4 Increase in non-controlling share of Group net income, net of tax, assuming all outstanding Genentech and Chugai stock options exercised (CHF millions) (159) (141) Net income used to calculate diluted earnings per share (CHF millions) 8,810 9,624 Weighted average number of shares and non-voting equity securities in issue (millions) 860 859 Adjustment for assumed conversion of convertible debt instruments, where dilutive (millions) - 1 Adjustment for assumed exercise of equity compensation plans, where dilutive (millions) 1 2 Weighted average number of shares and non-voting equity securities in issue used to calculate diluted earnings per share (millions) 861 862 Diluted earnings per share and non-voting equity security (CHF) 10.23 11.16

Page 293
105
30. NON-CONTROLLING INTERESTS
Changes in equity attributable to non-controlling interests in millions of CHF 2008 2007
At 1 January 7,960 7,370 Net income recognised directly in equity (240) (532) Net income recognised in income statement - Genentech 3 1,659 1,451 - Chugai 4 200 211 - Other non-controlling interests 16 14 Total net income recognised in income statement 1,875 1,676 Total recognised income and expense 1,635 1,144 Ventana acquisition 7 321 - Dividends paid to non-controlling shareholders - Chugai 4 (74) (91) - Other non-controlling interests (21) (6) Equity compensation plans 574 449 Genentech and Chugai share repurchases 3, 4 (372) (851) Changes in ownership interests in subsidiaries - Chugai 4 (404) - - Ventana 7 (321) - Changes in non-controlling interests 45 (55) At 31 December 9,343 7,960 Of which - Genentech 3 7,397 5,933 - Chugai 4 1,901 1,987 - Other non-controlling interests 45 40 Total non-controlling interests 9,343 7,960 31. CASH FLOW STATEMENT
Cash flows from operating activities Cash flows from operating activities arise from the Group’s primary activities in the Pharmaceuticals and Diagnostics businesses. These are calculated by the indirect method by adjusting the Group’s operating profit for any operating income and expenses that are not cash flows (for example depreciation, amortisation and impairment) in order to derive the cash generated from operations. This and other operating cash flows are shown in the cash flow statement. Operating cash flows also include income taxes paid on all activities.

Page 294
106
Cash generated from operations in millions of CHF 2008 2007
Net income 10,844 11,437 Add back non-operating (income) expense - Associates 15 (1) (2) - Financial income 5 (1,123) (1,805) - Financing costs 5 887 971 - Income taxes 6 3,317 3,867 - Major legal cases 25 (271) - - Changes in Group organisation 8 243 - Operating profit before exceptional items 13,896 14,468 Depreciation of property, plant and equipment 12 1,676 1,560 Amortisation of intangible assets 14 969 976 Impairment of intangible assets 14 104 58 Impairment of property, plant and equipment 12 28 6 Operating expenses for defined benefit post-employment plans 10 317 370 Operating expenses for equity-settled equity compensation plans 11 526 603 Other adjustments 110 439 Cash generated from operations 17,626 18,480 Cash flows from investing activities Cash flows from investing activities are principally those arising from the Group’s investments in property, plant and equipment and intangible assets, and from the acquisition and divestment of subsidiaries, associates and businesses. Cash flows connected with the Group’s portfolio of marketable securities and other investments are also included, as are any interest and dividend payments received in respect of these securities and investments. These cash flows indicate the Group’s net reinvestment in its operating assets and the cash flow effects of business combinations and divestments, as well as the cash generated by the Group’s other investments.
Interest and dividends received in millions of CHF 2008 2007
Interest received 606 1,071 Dividends received 5 8 Total 611 1,079
Cash flows from financing activities Cash flows from financing activities are primarily the proceeds from the issue and repayment of the Group’s equity and debt instruments. They also include interest payments and dividend payments on these instruments. Cash flows from short-term financing, including finance leases, are also included. These cash flows indicate the Group’s transactions with the providers of its equity and debt financing. Cash flows from short-term borrowings are shown as a net movement, as these consist of a large number of transactions with short maturity.
Interest and dividends paid in millions of CHF 2008 2007
Interest paid (216) (297) Dividends paid 28, 30 (4,051) (3,027) Total (4,267) (3,324)

Page 295
107
Significant non-cash transactions An increase in property, plant and equipment of 102 million Swiss francs (2007: 205 million Swiss francs) was recorded from Genentech leasing arrangements (see Note 3) and there was a corresponding increase in long-term debt. 32. RISK MANAGEMENT
Group risk management Risk management is a fundamental element of the Group’s business practice on all levels and encompasses different types of risks. At a group level risk management is an integral part of the business planning and controlling processes. Material risks are monitored and regularly discussed with the Corporate Executive Committee and the Audit Committee of the Board of Directors. This overall Group risk management process includes the performance of a risk assessment that is described in more detail in the Business Report on page 89. Financial risk management specifically is described in further detail below. Financial risk management The Group is exposed to various financial risks arising from its underlying operations and corporate finance activities. The Group’s financial risk exposures are predominantly related to changes in foreign exchange rates, interest rates and equity prices as well as the creditworthiness and the solvency of the Group's counterparties. Financial risk management within the Group is governed by policies reviewed by the boards of directors of Roche, Genentech or Chugai as appropriate to their areas of statutory responsibility. These policies cover credit risk, liquidity risk and market risk. The policies provide guidance on risk limits, type of authorised financial instruments and monitoring procedures. As a general principle, the policies prohibit the use of derivative financial instruments for speculative trading purposes. Policy implementation and day-to-day risk management are carried out by the relevant treasury functions and regular reporting on these risks is performed by the relevant accounting and controlling functions within Roche, Genentech and Chugai. Carrying value and fair value of financial assets in millions of CHF
Carrying value by asset class
By line items in notes Available-
for-sale FVtPLa) -
Designated
FVtPLa)- held for trading
Held to maturity
Loans and receivables Total
Fair value
Year ended 31 December 2008 Accounts receivable - - - - 9,755 9,755 9,755 Accrued interest income - - - - 145 145 145 Marketable securities: - Money market instruments and time accounts over 3 months 7,961 - - - - 7,961 7,961 - Bonds and debentures 6,814 - 1,027 - - 7,841 7,841 - Shares 51 - - - - 51 51 - Other investments 3 - - - - 3 3 Cash and cash equivalents - - - - 4,915 4,915 4,915 Derivative financial instruments - - 262 - - 262 262 Available-for-sale investments 588 - - - - 588 588 Held-to-maturity investments - - - 16 - 16 16 Loans receivable - - - - 16 16 16 Long-term trade receivables - - - - 73 73 73 Other financial current assets - - - - 624 624 624 Restricted cash - - - - 205 205 205 Other long-term assets - - - - 42 42 42 Total 15,417 - 1,289 16 15,775 32,497 32,497

Page 296
108
Carrying value by asset class
By line items in notes Available-
for-sale FVtPLa) -
Designated
FVtPLa)- held for trading
Held to maturity
Loans and receivables Total
Fair value
Year ended 31 December 2007 Accounts receivable - - - - 9,804 9,804 9,804 Accrued interest income - - - - 37 37 37 Marketable securities: - Money market instruments and time accounts over 3 months 10,965 167 - - - 11,132 11,132 - Bonds and debentures 7,624 78 1,129 - - 8,831 8,831 - Shares 292 - - - - 292 292 - Other investments 14 178 - - - 192 192 Cash and cash equivalents - - - - 3,755 3,755 3,755 Derivative financial instruments - - 70 - - 70 70 Available-for-sale investments 836 - - - - 836 836 Held-to-maturity investments - - - 19 - 19 19 Loans receivable - - - - 19 19 19 Long-term trade receivables - - - - 190 190 190 Other financial current assets - - - - 593 593 593 Restricted cash - - - - 1,115 1,115 1,115 Other long-term assets - - - - 43 43 43 Total 19,731 423 1,199 19 15,556 36,928 36,928
a) Fair-value-through-profit-or-loss. Credit risk Credit risk arises from the possibility that counterparties to transactions may default on their obligations, causing financial losses for the Group. The objective of managing counterparty credit risk is to prevent losses of liquid funds deposited with or invested in such counterparties. The maximum exposure to credit risk resulting from financial activities, without considering netting agreements and without taking account of any collateral held or other credit enhancements, is equal to the carrying value of the Group’s financial assets. Trade receivables: These are subject to a policy of active credit risk management which focuses on the assessment of country risk, credit availability, ongoing credit evaluation and account monitoring procedures. The objective of the management of trade receivables is to sustain the growth and profitability of the Group by optimising asset utilisation whilst maintaining risks at an acceptable level. Except as noted below, there is no significant concentration of counterparty credit risk due to the Group’s large number of customers and their wide geographical spread. Risk limits and exposures are continuously monitored by country and by the nature of counterparties. Additionally, the Group obtains credit insurance and similar enhancements when appropriate to protect the collection of trade receivables. As at 31 December 2008 no collateral was held for loans and receivables (2007: none). At 31 December 2008 the Group’s combined trade accounts receivable balance with three US national wholesale distributors, AmerisourceBergen Corp., Cardinal Health Inc. and McKesson Corp., was equivalent to 1.4 billion Swiss francs representing 15% of the Group’s consolidated trade accounts receivable (2007: 1.5 billion Swiss francs representing 16%).

Page 297
109
Nature and geographical location of trade receivables (not overdue) counterparties in millions of CHF 2008 2007
Regions Total Public
Whole-salers/
distributors Private Total Public
Whole-salers/
distributors Private Switzerland 130 51 10 69 175 47 12 116 European Union 2,053 953 643 457 2,106 991 546 569 Rest of Europe 479 11 405 63 661 58 539 64 North America 2,011 154 1,622 235 2,333 308 1,737 288 Latin America 474 142 192 140 461 115 187 159 Japan 1,439 - 1,402 37 1,162 - 1,136 26 Rest of Asia 685 97 255 333 605 83 227 295 Africa, Australia and Oceania 154 30 58 66 187 51 58 78 Total 7,425 1,438 4,587 1,400 7,690 1,653 4,442 1,595 Cash and marketable securities: These are subject to a policy of restricting exposures to high-quality counterparties and setting defined limits for individual counterparties. These limits and counterparty credit ratings are reviewed regularly. Investments in marketable securities are entered into on the basis of guidelines with regard to liquidity, quality and maximum amount. As a general rule, the Group invests only in high quality securities with adequate liquidity. Cash and short-term time deposits are subject to rules which limit the Group’s exposure to individual financial institutions. The Group signs netting agreements under an ISDA (International Swaps and Derivatives Association) master agreement with the respective counterparties in order to control exposures on derivative positions. Rating analysis of cash and fixed income marketable securities (market values)
2008
(mCHF) 2008
(% of total) 2007
(mCHF) 2007
(% of total) AAA-range 9,884 48 5,857 25 AA-range 5,390 26 9,598 40 A-range 4,525 22 7,615 32 BBB-range 912 4 773 3 Below BBB-range 9 0 67 0 Total 20,720 100 23,910 100 Overdue assets: Financial assets which are past due but not impaired total 2.7 billion Swiss francs (2007: 2.4 billion Swiss francs). Analysis of overdue but not impaired financial assets by class in millions of CHF
Total amount overdue
0-1 month
1-3 months
4-6 months
6-12 months
more than 1 year
Year ended 31 December 2008 Loans and receivables 2,656 560 681 543 438 434 Year ended 31 December 2007 Loans and receivables 2,423 720 538 483 427 255 As at 31 December 2008 there are no financial assets whose terms have been renegotiated (2007: none).

Page 298
110
Liquidity risk Liquidity risk arises through a surplus of financial obligations over available financial assets due at any point in time. The Group’s approach to liquidity risk is to maintain sufficient readily available reserves in order to meet its liquidity requirements at any point in time. Group liquidity is reported to senior management on a monthly basis. Roche, Genentech and Chugai enjoy strong credit quality and are rated by at least one major credit rating agency. The ratings will permit efficient access to the international capital markets in the event of major financing requirements. In addition, the Group has unused committed credit lines with various financial institutions totalling 5.2 billion Swiss francs (2007: 5.7 billion Swiss francs). The decline is due to changes in foreign currency translation rates. Contractual maturity analysis of financial liabilities in millions of CHF
Total
0-3
months 4-6
months 7-12
months 1-2
years 2-3
years 3-4
years 4-5
years Over 5 Years
Year ended 31 December 2008 Total debt a) 5,617 702 46 623 685 135 135 136 3,155 Trade payables 1,053 1,038 14 - 1 - - - - Accruals 5,379 3,727 429 1,162 61 - - - - Derivative financial instruments 194 194 - - - - - - - Other liabilities: current & non-current 1,343 788 66 132 136 9 170 27 15 Total financial liabilities 13,586 6,449 555 1,917 883 144 305 163 3,170 Year ended 31 December 2007 Total debt a) 8,953 1,954 30 1,418 762 738 151 152 3,748 Trade payables 1,188 1,177 10 1 - - - - - Accruals 5,319 3,945 431 881 62 - - - - Derivative financial instruments 80 80 - - - - - - - Other liabilities: current & non-current 1,253 513 51 127 284 10 186 10 72 Total financial liabilities 16,793 7,669 522 2,427 1,108 748 337 162 3,820
a) Total debt in the above table shows undiscounted cash flows, whereas the carrying value in the consolidated balance sheet reflects discounted cash flows. Market risk Market risk arises from changing market prices of the Group’s financial assets or financial liabilities. Market risk may affect the Group financial result and the value of Group equity. The Group uses Value-at-Risk (VaR) to measure the impact of market risk on its financial instruments. Roche has defined VaR limits to manage market risk. VaR data are reported on a monthly basis and indicate the value range within which a given financial instrument will fluctuate with a pre-set probability as a result of movements in market prices. VaR is a statistical measure which implicitly assumes that value changes of the recent past are indicative of value changes in the future. VaR figures do not represent actual or expected losses, or possible worst-case losses over the stated period.

Page 299
111
VaR figures are calculated using a historical simulation approach. For each scenario, all financial instruments are fully valued and the total change in value and earnings is determined. All VaR calculations are based on a 95% confidence level and a holding period of 20 trading days over the past ten years. This holding period reflects the time required to change the corresponding risk exposure, should this be deemed appropriate. Longer holding periods increase the probability of higher value changes and lead to increased VaR figures. Actual future gains and losses associated with our treasury activities may differ materially from the VaR analyses performed due to the inherent limitations associated with predicting the timing and amount of changes to interest rates, foreign currency exchanges rates and equity investment prices, particularly in periods of high market volatilities. Furthermore, the VaR numbers below do not include the effect of changes in credit spreads. Market risk of financial instruments in millions of CHF
31 December 2008 31 December 2007 VaR - Foreign exchange component 96 75 VaR - Interest rate component 27 40 VaR - Other price component 62 93 Diversification (52) (65) VaR - total market risk 133 143 At 31 December 2008, the total VaR of the financial assets and liabilities was 133 million Swiss francs (2007: 143 million Swiss francs). The foreign exchange VaR increased and arises mainly from hedging of non-US dollar cash flows from future royalty income over the next five years at Genentech. The lower contribution from the interest rate component was caused by the ageing of fixed-term liabilities. Other price risk arises mainly from movements in the prices of equity securities and this decreased due to significantly reduced equity security holdings. At 31 December 2008 the Group held equity securities with a market value of 0.6 billion Swiss Francs (2007: 1.1 billion Swiss francs). This number includes holdings in biotechnology companies, which were acquired in the context of licensing transactions or scientific collaborations. The lower holdings in equity securities resulted in a lower VaR for other price risk. Foreign exchange risk The Group operates across the world and is exposed to movements in foreign currencies affecting the Group financial result and the value of Group’s equity. Foreign exchange risk arises because the amount of local currency paid or received for transactions denominated in foreign currencies may vary due to changes in exchange rates (‘transaction exposures’) and because the foreign currency denominated financial statements of the Group’s foreign subsidiaries may vary upon consolidation into the Swiss franc denominated Group Financial Statements (‘translation exposures’). The objective of the Group’s foreign exchange risk management activities is to preserve the economic value of its current and future assets and to minimise the volatility of the Group’s financial result. The primary focus of the Group’s foreign exchange risk management activities is on hedging transaction exposures arising through foreign currency flows or monetary positions held in foreign currencies. The Group does not currently hedge translation exposures using financial instruments. The Group monitors transaction exposures on a daily basis. The net foreign exchange result and the corresponding VaR parameters are reported on a monthly basis. The Group uses forward contracts, foreign exchange options and cross-currency swaps to hedge transaction exposures. Application of these instruments intends to continuously lock in favourable developments of foreign exchange rates, thereby reducing the exposure to potential future movements in such rates.

Page 300
112
Interest rate risk Interest rate risk arises from movements in interest rates which could affect the Group financial result or the value of Group equity. Changes in interest rates may cause variations in interest income and expense. In addition, they may affect the market value of certain financial assets, liabilities and hedging instruments. The primary objective of the Group’s interest rate management is to protect the net interest result. Interest rate exposures and the corresponding VaR parameters are reported on a monthly basis. The Group uses forward contracts, options and swaps to hedge its interest rate exposures. Depending on the interest rate environment of major currencies, the Group will use these instruments to generate the appropriate mix of fixed and floating rate exposures. Other price risk Other price risk arises mainly from movements in the prices of equity securities held by Roche, Genentech or Chugai. At 31 December 2008, the Group held equity securities with a market value of 0.6 billion Swiss francs (2007: 1.1 billion Swiss francs). This amount includes holdings in biotechnology companies, which were acquired in the context of licensing transactions or scientific collaborations. Due to the nature of their business, biotechnology companies are exposed to greater equity volatilities than general stock market fluctuations. The Group manages the price risk through placing limits on individual and total equity investments. These limits are defined both as a percentage of total liquid funds and as an absolute number for individual equity investments. Equity price risk is reported as a VaR figure on a monthly basis to senior management. Impairment of financial assets During 2008 impairments of shares were triggered by a significant or prolonged price decline below cost value. Impairments of debt securities were recorded due to significant financial difficulties of the issuers. Impairment losses by asset classes in millions of CHF
2008 2007 Loans and receivables (43) (26) Available-for-sale financial assets - Shares (75) (35) - Investments (40) - - Debt securities (53) (68) Total impairment losses (211) (129) Capital The Group defines the capital that it manages as the Group’s total equity, including non-controlling interests. The Group’s objectives when managing capital are: • To safeguard the Group’s ability to continue as a going concern, so that it can continue to provide benefits for
patients and returns to investors. • To provide an adequate return to investors based on the level of risk undertaken. • To have available the necessary financial resources to allow the Group to invest in areas that may deliver future
benefits for patients and returns to investors. • To maintain sufficient financial resources to mitigate against risks and unforeseen events.

Page 301
113
Capital is monitored on the basis of the equity ratio, which is calculated as being equity (including non-controlling interests) as a percentage of total assets. This is reported to senior management as part of the Group’s regular internal management reporting. The Group’s capital and equity ratio are shown in the table below. Capital in millions of CHF
2008 2007 Capital and reserves attributable to Roche shareholders 28 44,479 45,483 Equity attributable to non-controlling interests 30 9,343 7,960 Total equity 53,822 53,443 Total assets 76,089 78,365 Equity ratio 70.7% 68.2% The Group is not subject to regulatory capital adequacy requirements as known in the financial services industry. The Group has majority shareholdings in Genentech (see Note 3) and Chugai (see Note 4). Genentech and Chugai are both public companies and their objectives, policies and processes for managing their own capital are determined by local management. 33. RELATED PARTIES
Controlling shareholders The share capital of Roche Holding Ltd, which is the Group’s parent company, consists of 160,000,000 bearer shares. Based on information supplied by a shareholder group with pooled voting rights, comprising Ms Vera Michalski-Hoffmann, Ms Maja Hoffmann, Mr André Hoffmann, Dr Andreas Oeri, Ms Sabine Duschmalé-Oeri, Ms Catherine Oeri, Ms Beatrice Oeri and Ms Maja Oeri, that group holds 80,020,000 shares as in the preceding year, which represents 50.0125% of the issued shares. This figure does not include any shares without pooled voting rights that are held outside this group by individual members of the group. On 28 January 2009 the pool members announced that, effective 1 April 2009, Ms Beatrice Oeri would leave the pool and that Mr Jörg Duschmalé and Mr Lukas Duschmalé would join the pool. The group would continue to hold a total 80,020,000 shares with pooled voting rights as previously. Mr André Hoffmann and Dr Andreas Oeri are members of the Board of Directors of Roche Holding Ltd. Mr Hoffmann received remuneration totalling 400,000 Swiss francs (2007: 400,000 Swiss francs) and Dr Oeri received remuneration totalling 360,000 Swiss francs (2007: 360,000 Swiss francs). There were no other transactions between the Group and the individual members of the above shareholder group. Subsidiaries and associates A listing of the major Group subsidiaries and associates is included in Note 34. Transactions between the parent company and its subsidiaries and between subsidiaries are eliminated on consolidation. There were no significant transactions between the Group and its associates.

Page 302
114
Key management personnel Members of the Board of Directors of Roche Holding Ltd receive an annual remuneration and payment for their time and expenses related to their membership of Board committees. Total remuneration of the Board of Directors, excluding the Chairman, in 2008 totalled 4 million Swiss francs (2007: 4 million Swiss francs). The Chairman of the Board of Directors and members of the Corporate Executive Committee of Roche Holding Ltd receive remuneration, which consists of an annual salary, bonus and an expense allowance. The Group pays social insurance contributions in respect of the above remuneration and pays contributions to pension and other post-employment benefit plans for the Chairman of the Board of Directors and members of the Corporate Executive Committee. The Chairman of the Board of Directors and members of the Corporate Executive Committee also participate in certain equity compensation plans as described below. The terms, vesting conditions and fair value of these awards are disclosed in Note 11. Remuneration of the Chairman of the Board of Directors and members of the Corporate Executive Committee in millions of CHF
2008 2007 Salaries, including bonuses and expenses 32 23 Social security costs 3 2 Pensions and other post-employment benefits 5 6 Equity compensation plans 14 22 Other employee benefits 1 - Total 55 53 Roche Long-Term: During 2008 members of the Corporate Executive Committee were granted 494,097 Stock-settled Stock Appreciation Rights (S-SARs) and no Roche Option Plan (ROP) awards (2007: 223,797 S-SARs and no ROP awards). Roche Connect: During 2008 contributions paid by the Group with respect to the Chairman of the Board of Directors and members of the Corporate Executive Committee totalled 0.3 million Swiss francs (2007: 0.2 million Swiss francs). Roche Performance Share Plan: During 2008 members of the Corporate Executive Committee were targeted with 14,805 awards of the 2008-2010 cycle (2007: 19,921 awards from the 2007-2009 cycle). Each award will result in between zero and two non-voting equity securities, depending upon the achievement of the performance targets. Transactions with former members of the Corporate Executive Committee: Pensions totalling 2 million Swiss francs (2007: 2 million Swiss francs) were paid by the Group to two former Corporate Executive Committee members. The detailed disclosures regarding executive remuneration that are required by Swiss law are included in the financial statements of Roche Holding Ltd, Basel on pages 137-141. Post-employment benefit plans Transactions between the Group and the various post-employment defined benefit plans for the employees of the Group are described in Note 10.

Page 303
115
34. SUBSIDIARIES AND ASSOCIATES
Divestments of subsidiaries Effective 3 October 2008 the Group sold its wholly-owned subsidiary Cenexi SAS (‘Cenexi’), including the manufacturing facility in Fontenay-sous-Bois, France, for 56 million Swiss francs in cash. Loss on divestment of Cenexi in millions of CHF
2008 Consideration 56 Net assets disposed - Property, plant and equipment 12 (107) - Cash (16) - Other net assets 5 - Accumulated currency translation adjustments 28 16 Gain (loss) on divestment (46) The total loss on divestment has been reported within general and administration expenses in the current period as part of the segment result of the Roche Pharmaceuticals operating segment. The net cash inflow from the divestment was 40 million Swiss francs.

Page 304
116

Page 305
117

Page 306
118

Page 307
119
REPORT OF ROCHE MANAGEMENT
REPORT OF ROCHE MANAGEMENT ON INTERNAL CONTROL OVER FINANCIAL REPORTING
The Board of Directors and management of Roche Holding Ltd are responsible for establishing and maintaining adequate control over financial reporting. The internal control system was designed to provide reasonable assurance over the reliability of financial reporting and the preparation and fair presentation of consolidated financial statements in accordance with International Financial Reporting Standards. All internal control systems, no matter how well designed, have inherent limitations. Therefore, even those systems determined to be effective may not prevent or detect misstatements and can provide only reasonable assurance with respect to financial statement preparation and presentation. Also, projections of any evaluation of effectiveness to future periods are subject to the risk that controls may become inadequate because of changes in conditions or that the degree of compliance with the policies or procedures may deteriorate. Management assessed the effectiveness of its system of internal control over financial reporting as of 31 December 2008 based on the criteria for effective internal control over financial reporting described in Internal Control - Integrated Framework issued by the Committee of Sponsoring Organizations of the Treadway Commission (COSO). Based on this assessment, management has concluded that the system of internal control over financial reporting was effective as of 31 December 2008. The Statutory Auditor KPMG Klynveld Peat Marwick Goerdeler SA, have audited the consolidated financial statements of Roche Holding Ltd for the year ended 31 December 2008, in accordance with Swiss Auditing Standards and with the International Standards on Auditing (ISA). They have also issued a report on the effectiveness of the Group’s system of internal control over financial reporting. This report is set out on pages 122-123. Franz B. Humer Erich Hunziker Chairman of the Board of Directors Chief Financial Officer and Deputy Head of the Corporate Executive Committee Basel, 29 January 2009

Page 308
120 REPORT OF THE STATUTORY AUDITOR
REPORT OF THE STATUTORY AUDITOR ON THE CONSOLIDATED FINANCIAL STATEMENTS TO THE ANNUAL GENERAL MEETING OF ROCHE HOLDING LTD, BASEL
As statutory auditor, we have audited the consolidated financial statements (income statement, balance sheet, cash flow statement, statement of recognised income and expense, statement of changes in equity and notes on pages 28 to 118) of Roche Holding Ltd for the year ended 31 December 2008. Board of Directors’ Responsibility The Board of Directors is responsible for the preparation and fair presentation of the consolidated financial statements in accordance with International Financial Reporting Standards (IFRS) and the requirements of Swiss law. This responsibility includes designing, implementing and maintaining an internal control system relevant to the preparation and fair presentation of consolidated financial statements that are free from material misstatement, whether due to fraud or error. The Board of Directors is further responsible for selecting and applying appropriate accounting policies and making accounting estimates that are reasonable in the circumstances. Auditor’s Responsibility Our responsibility is to express an opinion on these consolidated financial statements based on our audit. We conducted our audit in accordance with Swiss law, Swiss Auditing Standards and International Standards on Auditing. Those standards require that we plan and perform the audit to obtain reasonable assurance whether the consolidated financial statements are free from material misstatement. An audit involves performing procedures to obtain audit evidence about the amounts and disclosures in the consolidated financial statements. The procedures selected depend on the auditor’s judgment, including the assessment of the risks of material misstatement of the consolidated financial statements, whether due to fraud or error. In making those risk assessments, the auditor considers the internal control system relevant to the entity’s preparation and fair presentation of the consolidated financial statements in order to design audit procedures that are appropriate in the circumstances. An audit also includes evaluating the appropriateness of the accounting policies used and the reasonableness of accounting estimates made, as well as evaluating the overall presentation of the consolidated financial statements. We believe that the audit evidence we have obtained is sufficient and appropriate to provide a basis for our audit opinion. Opinion In our opinion, the consolidated financial statements for the year ended 31 December 2008 give a true and fair view of the financial position, the results of operations and the cash flows in accordance with International Financial Reporting Standards (IFRS) and comply with Swiss law.

Page 309
121
Report on Other Legal Requirements
We confirm that we meet the legal requirements on licensing according to the Auditor Oversight Act (AOA) and independence (article 728 CO and article 11 AOA) and that there are no circumstances incompatible with our independence. In accordance with article 728a paragraph 1 item 3 CO and Swiss Auditing Standard 890, we confirm that an internal control system exists, which has been designed for the preparation of consolidated financial statements according to the instructions of the Board of Directors. We recommend that the consolidated financial statements submitted to you be approved. KPMG Klynveld Peat Marwick Goerdeler SA John A. Morris François Rouiller Licensed Audit Expert Licensed Audit Expert Auditor in Charge Basel, 29 January 2009

Page 310
122
REPORT OF THE INDEPENDENT AUDITOR ON INTERNAL CONTROL OVER FINANCIAL REPORTING
REPORT OF THE INDEPENDENT AUDITOR ON INTERNAL CONTROL OVER FINANCIAL REPORTING TO THE ANNUAL GENERAL MEETING OF ROCHE HOLDING LTD, BASEL
We have examined the Roche Group’s system of internal control over financial reporting as of 31 December 2008, based on criteria established in Internal Control – Integrated Framework issued by the Committee of Sponsoring Organizations of the Treadway Commission (COSO). The Board of Directors and management of Roche Holding Ltd are responsible for maintaining effective internal control over financial reporting and for its assessment of the effectiveness of internal control over financial reporting as included in the accompanying Report of Roche Management on Internal Control over Financial Reporting. Our responsibility is to express an opinion on the company’s internal control over financial reporting based on our examination. An entity’s internal control over financial reporting is a process effected by the entity’s board of directors, management, and other personnel, designed to provide reasonable assurance regarding the reliability of financial statements prepared in accordance with International Financial Reporting Standards (IFRS) and includes those policies and procedures that (1) pertain to the maintenance of records that, in reasonable detail, accurately and fairly reflect the transactions and dispositions of the assets of the entity; (2) provide reasonable assurance that transactions are recorded as necessary to permit the preparation of financial statements in accordance with the applicable financial reporting framework; and (3) provide reasonable assurance regarding the prevention or timely detection of the unauthorised acquisition, use, or disposition of the entity's assets that could have a material effect on the entity’s financial statements. We conducted our examination in accordance with the International Standard on Assurance Engagements 3000 (ISAE 3000). This standard requires that we plan and perform our examination to obtain reasonable assurance about whether effective internal control over financial reporting was maintained in all material respects. Our examination included obtaining an understanding of internal control over financial reporting, testing and evaluating the design and operating effectiveness of internal control, and performing such other procedures as we considered necessary in the circumstances. We believe that our examination provides a reasonable basis for our opinion. Because of the inherent limitations of internal control over financial reporting, including the possibility of management override of controls, misstatements due to error or fraud may occur and not be detected. Also, projections of any evaluation of internal control over financial reporting to future periods are subject to the risk that internal control may become inadequate because of changes in conditions or because the degree of compliance with the policies or procedures may deteriorate.

Page 311
123 In our opinion, the Roche Group maintained, in all material respects, effective internal control, over financial reporting as of 31 December 2008, based on criteria established in Internal Control – Integrated Framework issued by the Committee of Sponsoring Organizations of the Treadway Commission (COSO). We also have audited, in accordance with Swiss Auditing Standards and International Standards on Auditing, the consolidated financial statements of Roche Holding Ltd for the year ended 31 December 2008 and our report dated 29 January 2009 expressed an unqualified opinion on those consolidated financial statements. KPMG Klynveld Peat Marwick Goerdeler SA John A. Morris François Rouiller Basel, 29 January 2009

Page 312
AUDITED ACCOUNTS OF ROCHE HOLDING LTD, BASEL FOR THE YEAR ENDED 31 DECEMBER 2008*
* Please note that the page numbers at the top of the pages in this section are the page numbers from the
original Annual Report 2008, Part 2 Finance Report commencing on page 133 and ending on page 144 (comprising in total 12 pages).

Page 313
133
Roche Holding Ltd, Basel FINANCIAL STATEMENTS
Income statement in millions of CHF 2008 2007
Income Income from participations 3,390 4,121 Interest income from loans to Group companies 227 121 Interest and investment income 23 72 Other income 19 18 Total income 3,659 4,332 Expenses Financial expenses (88) (24) Administration expenses (33) (31) Other expenses (21) (22) Total expenses (142) (77) Profit for the year before taxes 3,517 4,255 Taxes (18) (17) Net profit for the year 3,499 4,238

Page 314
134
Balance sheet at 31 December in millions of CHF 2008 2007
Non-current assets Participations 4,580 4,558 Long-term loans to Group companies 4,509 4,571 Total non-current assets 9,089 9,129 Current assets Short-term loans to Group companies 3,000 - Accounts receivable from Group companies 67 11 Other accounts receivable 1 1 Marketable securities 91 3,609 Liquid funds - - Total current assets 3,159 3,621 Total assets 12,248 12,750 Equity Share capital 160 160 Non-voting equity securities (Genussscheine) p.m. p.m. General legal reserve 300 300 Free reserve 5,519 5,251 Special reserve 2,152 2,152 Available earnings: - Balance brought forward from previous year 2 - - Net profit for the year 3,499 4,238 Total equity 11,632 12,101 Non-current liabilities Provisions 35 35 Total non-current liabilities 35 35 Current liabilities Accounts payable to Group companies 559 588 Unrealised foreign currency gains - 4 Other liabilities 22 22 Total current liabilities 581 614 Total liabilities 616 649 Total equity and liabilities 12,248 12,750
p.m. = pro memoria. Non-voting equity securities have no nominal value.

Page 315
135
NOTES TO THE FINANCIAL STATEMENTS
1. SUMMARY OF SIGNIFICANT ACCOUNTING POLICIES
Basis of preparation of the financial statements The financial statements of Roche Holding Ltd, Basel, are prepared in accordance with the provisions of Swiss law. Participations The major participations of the company are listed in Note 34 to the Roche Group Consolidated Financial Statements. Valuation methods and translation of foreign currencies Marketable securities are reported at the lower of cost or market value. All other assets, including participations, are reported at cost less appropriate write-downs. Assets and liabilities denominated in foreign currencies are translated into Swiss francs using year-end rates of exchange, except participations which are translated at historical rates. Transactions during the year which are denominated in foreign currencies are translated at the exchange rates effective at the relevant transaction dates. Resulting exchange gains and losses are recognised in the income statement with the exception of unrealised gains which are deferred. Taxes The tax charge includes corporate income and capital taxes. 2. EQUITY
Share capital As in the previous year, share capital amounts to 160 million Swiss francs. The share capital consists of 160,000,000 bearer shares with a nominal value of 1 Swiss franc each. Included in equity are 702,562,700 non-voting equity securities (Genussscheine). They are not part of the share capital and confer no voting rights. However each non-voting equity security (Genussschein) confers the same rights as any of the shares to participate in the available earnings and in any remaining proceeds from liquidation following repayment of the nominal value of the share capital and, if any, participation certificates.

Page 316
136
Movement in recognised amounts in millions of CHF
Share
capital General legal
reserve Free
reserve Special reserve
Available earnings
Total equity
As at 1 January 2006 160 300 4,414 2,152 2,394 9,420 - Net income - - - - 3,533 3,533 - Dividends paid - - - - (2,157) (2,157) - Transfer to free reserve - - 233 - (233) - As at 31 December 2006 160 300 4,647 2,152 3,537 10,796 - Net income - - - - 4,238 4,238 - Dividends paid - - - - (2,933) (2,933) - Transfer to free reserve - - 604 - (604) - As at 31 December 2007 160 300 5,251 2,152 4,238 12,101 - Net income - - - - 3,499 3,499 - Dividends paid - - - - (3,968) (3,968) - Transfer to free reserve - - 268 - (268) - As at 31 December 2008 160 300 5,519 2,152 3,501 11,632 3. CONTINGENT LIABILITIES
Guarantees Within the framework of the European Medium Term Note (EMTN) programme the company has issued guarantees in favour of Group companies amounting to 420 million Swiss francs (2007: 1,987 million Swiss francs). 4. SIGNIFICANT SHAREHOLDERS
All shares in the Company are bearer shares, and for this reason the Company does not keep a register of shareholders. The following figures are based on information from shareholders, the shareholder validation check at the Annual General Meeting of 4 March 2008 and on other information available to the Company. 80,020,000 (2007: 80,020,000) shares: Shareholder group with pooled voting rights, comprising Ms Vera Michalski-Hoffmann, Ms Maja Hoffmann, Mr André Hoffmann, Dr Andreas Oeri, Ms Sabine Duschmalé-Oeri, Ms Catherine Oeri, Ms Beatrice Oeri and Ms Maja Oeri. a), b) 53,332,863 (2007: 53,332,863) shares (participation below 33 1/3%): Novartis Ltd, Basel including affiliates thereof. c)
a) Information supplied by the shareholders. This figure of 80,020,000 shares does not include shares without pooled voting rights held outside this group by individual members of the group.
b) On 28 January 2009 the pool members announced that, effective 1 April 2009, Ms Beatrice Oeri would leave the pool and that Mr Jörg Duschmalé and Mr Lukas Duschmalé would join the pool. The group would continue to hold a total 80,020,000 shares with pooled voting rights as previously.
c) Figures as of 31 December 2008 supplied by Novartis Ltd, Basel.
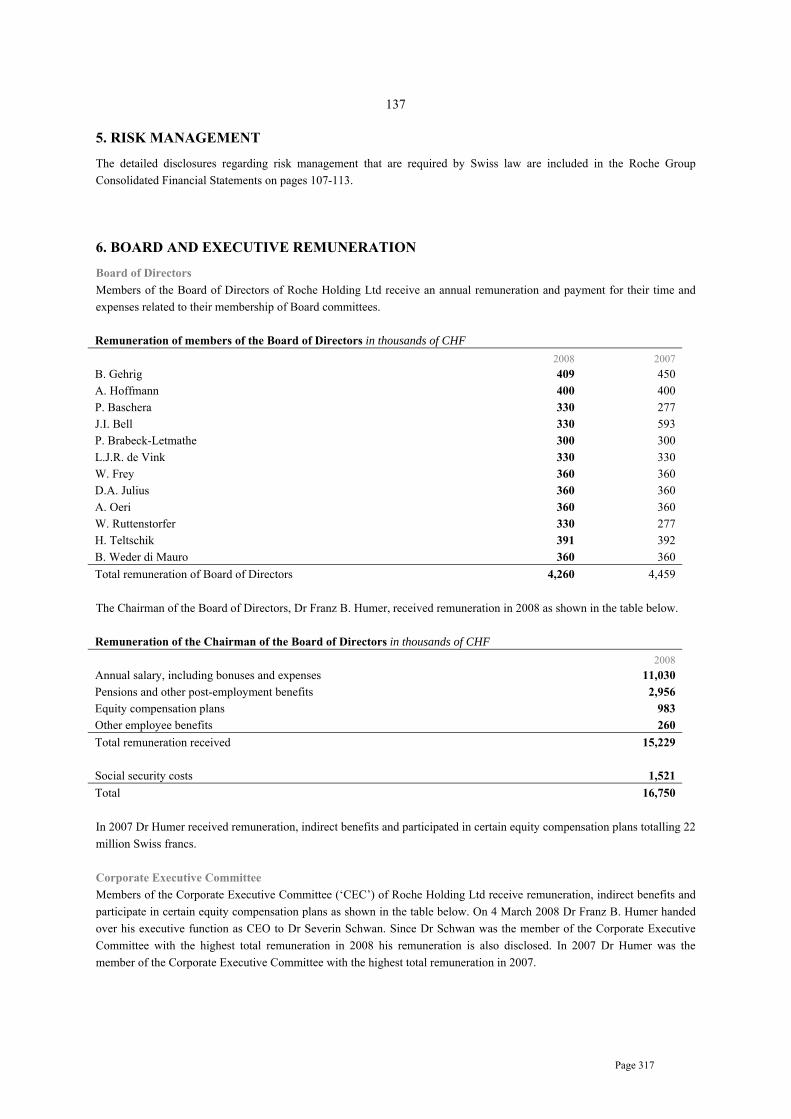
Page 317
137
5. RISK MANAGEMENT
The detailed disclosures regarding risk management that are required by Swiss law are included in the Roche Group Consolidated Financial Statements on pages 107-113. 6. BOARD AND EXECUTIVE REMUNERATION
Board of Directors Members of the Board of Directors of Roche Holding Ltd receive an annual remuneration and payment for their time and expenses related to their membership of Board committees. Remuneration of members of the Board of Directors in thousands of CHF
2008 2007 B. Gehrig 409 450 A. Hoffmann 400 400 P. Baschera 330 277 J.I. Bell 330 593 P. Brabeck-Letmathe 300 300 L.J.R. de Vink 330 330 W. Frey 360 360 D.A. Julius 360 360 A. Oeri 360 360 W. Ruttenstorfer 330 277 H. Teltschik 391 392 B. Weder di Mauro 360 360 Total remuneration of Board of Directors 4,260 4,459 The Chairman of the Board of Directors, Dr Franz B. Humer, received remuneration in 2008 as shown in the table below. Remuneration of the Chairman of the Board of Directors in thousands of CHF
2008 Annual salary, including bonuses and expenses 11,030 Pensions and other post-employment benefits 2,956 Equity compensation plans 983 Other employee benefits 260 Total remuneration received 15,229 Social security costs 1,521 Total 16,750 In 2007 Dr Humer received remuneration, indirect benefits and participated in certain equity compensation plans totalling 22 million Swiss francs. Corporate Executive Committee Members of the Corporate Executive Committee (‘CEC’) of Roche Holding Ltd receive remuneration, indirect benefits and participate in certain equity compensation plans as shown in the table below. On 4 March 2008 Dr Franz B. Humer handed over his executive function as CEO to Dr Severin Schwan. Since Dr Schwan was the member of the Corporate Executive Committee with the highest total remuneration in 2008 his remuneration is also disclosed. In 2007 Dr Humer was the member of the Corporate Executive Committee with the highest total remuneration in 2007.

Page 318
138
Remuneration of the members of the Corporate Executive Committee in 2008 in thousands of CHF
Total CEC a) - of which S. Schwan
Annual salary, including bonuses and expenses 21,384 5,313 Pensions and other post-employment benefits 2,422 202 Equity compensation plans 12,557 2,493 Other employee benefits 145 11 Total remuneration received 36,508 8,019 Social security costs 1,777 287 Total 38,285 8,306
a) Amounts for the total CEC for 2008 do not include Dr Humer. In 2007 the total remuneration of the Corporate Executive Committee was 53 million Swiss francs. Dr Humer was the member of the Corporate Executive Committee with the highest total remuneration in 2007, with a total remuneration of 22 million Swiss francs. Employer contribution to social security schemes and pension plans: The Group pays social insurance contributions in respect of the above remuneration and pays contributions to pension and other post-employment benefit plans for the Chairman of the Board of Directors and members of the Corporate Executive Committee. Equity Compensation Plans: The Chairman of the Board of Directors and members of the Corporate Executive Committee also participate in certain equity compensation plans as described below. The terms and vesting conditions of these awards are disclosed in Note 11 to the Consolidated Financial Statements. The fair values used in the Consolidated Financial Statements represent the cost to the company at grant date and reflect amongst other matters the observed exercise behaviour and exit rate for the whole population that receive them and initial simulations of any performance conditions. For the purposes of these remuneration disclosures the fair values are calculated based on the fair value that the employee receives taking into account the preliminary assessment of any completed performance conditions. The Chairman of the Board of Directors and members of the Corporate Executive Committee are eligible to participate in Roche Connect, a programme that enables employees to make regular deductions from their salaries to purchase non-voting equity securities. The Group contributes to the programme, which allows the employees to purchase non-voting equity securities at a discount (usually 20%). During 2008 members of the Corporate Executive Committee were granted 494,097 Stock-settled Stock Appreciation Rights (S-SARs). The individual awards relating to 2008 are shown in the table below. The fair value of these awards for the employee is 21.08 Swiss francs, which is calculated using the Black-Scholes formula, assuming holding until maturity, and deducting 11% for the average 2 year vesting period. The Chairman of the Board of Directors was not granted S-SARs during 2008. Members of the Corporate Executive Committee and other members of senior management participate in the Roche Performance Share Plan (PSP). The Group has three overlapping three-year PSPs. The target awards for the three-year cycle are defined at the beginning of the cycle and the awards are considered to form part of the employee’s remuneration in three equal annual amounts over the three-year cycle. Each award will result in between zero and two non-voting equity securities (Genussscheine), depending upon the achievement of the performance targets, and the discretion of the Board of Directors. The individual awards relating to 2008 are shown in the table below. The number of the awards is calculated as follows: • PSP 2006-2008: A preliminary allocation based on the actual performance for the period 2006 to 2008, which shows
0.75 non-voting equity security (Genussschein) per award. • PSP 2007-2009: One non-voting equity security (Genussschein) per award. • PSP 2008-2010: One non-voting equity security (Genussschein) per award.

Page 319
139
The resulting allocations are multiplied by the non-voting equity security (Genussscheine) price at 31 December 2008 of 162.50 Swiss francs to give the fair value for the remuneration received by the employee. The Chairman of the Board of Directors was not granted PSPs for the 2008-2010 cycle. Remuneration from equity compensation plans in 2008 in thousands of CHF
Roche Connect S-SAR awards PSP awards
Employer
contributions
S-SAR ‘08
(number)
S-SAR ‘08
fair value
PSP ’06-‘08
(number)
PSP ’07-‘09
(number)
PSP ’08-‘10
(number) PSP
fair value Total
fair value Total CEC a) 191 494,097 10,416 8,739 12,459 14,805 1,950 12,557 - of which S. Schwan 49 105,576 2,226 838 1,218 1,965 218 2,493
a) Amounts for the total CEC for 2008 do not include Dr Humer. In 2007 the total remuneration of the Corporate Executive Committee from equity compensation plans was 22 million Swiss francs, of which 9 million Swiss was attributable to Dr Humer, the member of the Corporate Executive Committee with the highest total remuneration. Other employee benefits: This includes tax advisory costs, and remuneration of Dr Hunziker, Mr Burns and Prof. Knowles for serving on the Chugai Board of Directors. Transactions with former members of the Corporate Executive Committee: Pensions totalling 2 million Swiss francs were paid by the Group in 2008 to two other former Corporate Executive Committee members (2007: 2 million Swiss francs). In 2007 Mr Heino von Prondzynski, a former member of the Corporate Executive Committee, received a bonus of 0.4 million Swiss francs in respect of services rendered in 2006 and additionally received a total of 12,212 non-voting equity securities based on pro-rated Roche Performance Share Plan awards. 7. BOARD AND EXECUTIVE SHAREHOLDINGS
Board of Directors Directors Mr André Hoffmann and Dr Andreas Oeri and other members of the founder’s families who are closely associated with them belong to a shareholder group with pooled voting rights. At the end of 2008 this group held 80,020,000 shares (50.01% of issued shares). Detailed information about this group is given in Note 4. In addition, as of 31 December 2008 the members of the Board of Directors and persons closely associated with them held shares and non-voting equity securities (Genussscheine) as shown in the table below.
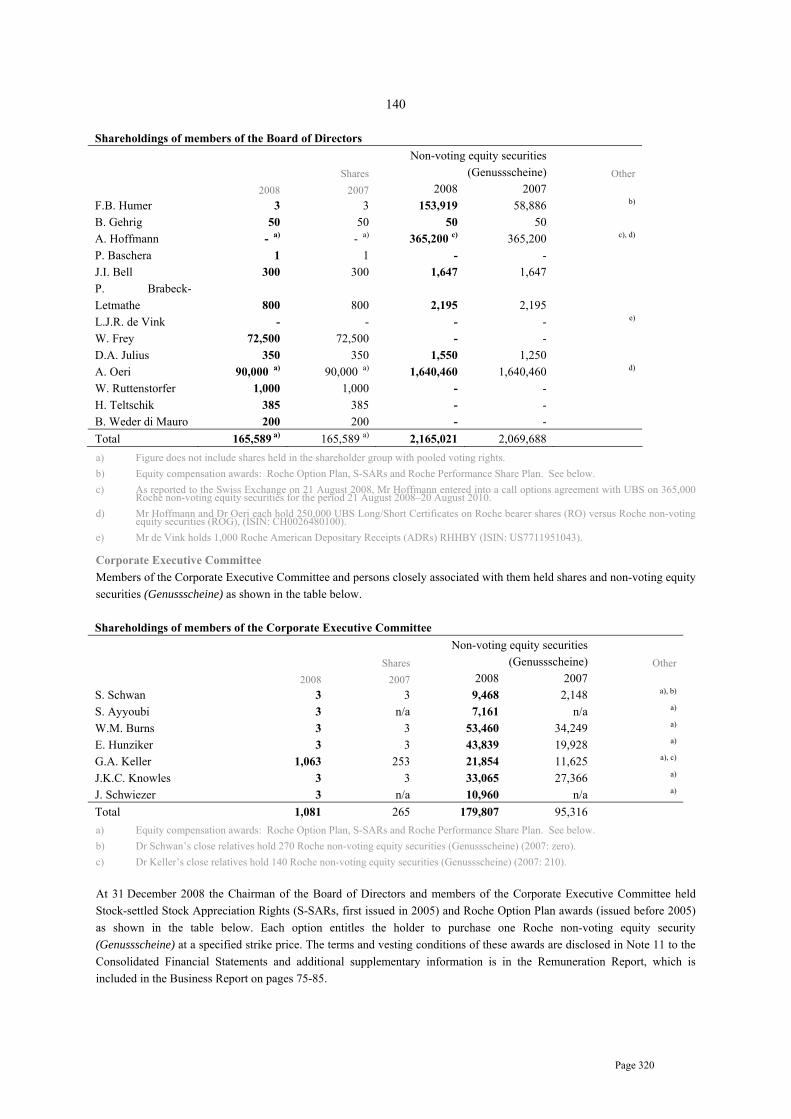
Page 320
140
Shareholdings of members of the Board of Directors
Shares
Non-voting equity securities (Genussscheine) Other
2008 2007 2008 2007 F.B. Humer 3 3 153,919 58,886 b)
B. Gehrig 50 50 50 50 A. Hoffmann - a) - a) 365,200 c) 365,200 c), d)
P. Baschera 1 1 - - J.I. Bell 300 300 1,647 1,647 P. Brabeck-Letmathe 800 800 2,195 2,195 L.J.R. de Vink - - - - e)
W. Frey 72,500 72,500 - - D.A. Julius 350 350 1,550 1,250 A. Oeri 90,000 a) 90,000 a) 1,640,460 1,640,460 d)
W. Ruttenstorfer 1,000 1,000 - - H. Teltschik 385 385 - - B. Weder di Mauro 200 200 - - Total 165,589 a) 165,589 a) 2,165,021 2,069,688 a) Figure does not include shares held in the shareholder group with pooled voting rights. b) Equity compensation awards: Roche Option Plan, S-SARs and Roche Performance Share Plan. See below. c) As reported to the Swiss Exchange on 21 August 2008, Mr Hoffmann entered into a call options agreement with UBS on 365,000
Roche non-voting equity securities for the period 21 August 2008–20 August 2010. d) Mr Hoffmann and Dr Oeri each hold 250,000 UBS Long/Short Certificates on Roche bearer shares (RO) versus Roche non-voting
equity securities (ROG), (ISIN: CH0026480100). e) Mr de Vink holds 1,000 Roche American Depositary Receipts (ADRs) RHHBY (ISIN: US7711951043). Corporate Executive Committee Members of the Corporate Executive Committee and persons closely associated with them held shares and non-voting equity securities (Genussscheine) as shown in the table below. Shareholdings of members of the Corporate Executive Committee
Shares
Non-voting equity securities (Genussscheine) Other
2008 2007 2008 2007 S. Schwan 3 3 9,468 2,148 a), b)
S. Ayyoubi 3 n/a 7,161 n/a a) W.M. Burns 3 3 53,460 34,249 a)
E. Hunziker 3 3 43,839 19,928 a) G.A. Keller 1,063 253 21,854 11,625 a), c) J.K.C. Knowles 3 3 33,065 27,366 a) J. Schwiezer 3 n/a 10,960 n/a a)
Total 1,081 265 179,807 95,316 a) Equity compensation awards: Roche Option Plan, S-SARs and Roche Performance Share Plan. See below. b) Dr Schwan’s close relatives hold 270 Roche non-voting equity securities (Genussscheine) (2007: zero). c) Dr Keller’s close relatives hold 140 Roche non-voting equity securities (Genussscheine) (2007: 210). At 31 December 2008 the Chairman of the Board of Directors and members of the Corporate Executive Committee held Stock-settled Stock Appreciation Rights (S-SARs, first issued in 2005) and Roche Option Plan awards (issued before 2005) as shown in the table below. Each option entitles the holder to purchase one Roche non-voting equity security (Genussscheine) at a specified strike price. The terms and vesting conditions of these awards are disclosed in Note 11 to the Consolidated Financial Statements and additional supplementary information is in the Remuneration Report, which is included in the Business Report on pages 75-85.

Page 321
141
Roche Option Plan and S-SARs awards held at 31 December 2008 Year of issue 2008 2007 2006 2005 2004 2003 2002 Total
S. Schwan 105,576 29,190 15,696 4,983 1,864 1,635 - 158,944 S. Ayyoubi 21,117 3,243 2,517 3,957 2,360 2,324 1,900 37,418 W.M. Burns 105,576 48,651 26,160 34,074 14,874 17,353 - 246,688 E. Hunziker 92,907 48,651 26,160 34,074 20,915 - - 222,707 G.A. Keller 63,345 24,327 15,696 3,150 4,000 - - 110,518 J.K.C. Knowles 63,345 24,327 15,696 - - - - 103,368 J. Schwiezer 42,231 9,819 5,565 8,871 5,610 3,065 - 75,161 Total CEC 494,097 188,208 107,490 89,109 49,623 24,377 1,900 954,804 F.B. Humer - 48,651 52,317 85,179 55,775 - - 241,922 Total 494,097 236,859 159,807 174,288 105,398 24,377 1,900 1,196,726 Strike price (CHF) 195.80 229.60 195.00 123.00 129.50 77.80 115.50 Expiry date
Jan. 2015 Feb. 2014
Feb. 2013
Feb. 2012
Feb. 2011
Feb. 2010
Feb. 2009
At 31 December 2008 the Chairman of the Board of Directors and members of the Corporate Executive Committee held PSP awards from the three PSP performance cycles 2006-2008, 2007-2009 and 2008-2010 as shown in the table below. The terms and vesting conditions of these awards are disclosed in Note 11 to the Consolidated Financial Statements and additional supplementary information is in the Remuneration Report on pages 75-85 of the Business Report. Each award will result in between zero and two non-voting equity securities (Genussscheine), depending upon the achievement of the performance targets and the discretion of the Board of Directors. The preliminary allocation ratio for the plan 2006-2008 and the total target number of awards for all cycles as at 31 December 2008 are shown in the table below. Roche Performance Share Plan awards held at 31 December 2008
PSP 2006-2008 PSP 2007-2009 PSP 2008-2010 S. Schwan 1,117 1,218 1,965 S. Ayyoubi 550 507 638 W.M. Burns 2,578 3,046 3,276 E. Hunziker 2,750 3,046 3,276 G.A. Keller 1,203 1,370 1,474 J.K.C. Knowles 2,148 2,056 2,211 J. Schwiezer 1,304 1,216 1,965 Total CEC 11,650 12,459 14,805 F.B. Humer 10,365 9,185 - Total awards granted 22,015 21,644 14,805 Allocation date Feb. 2009 Feb. 2010 Feb 2011 Estimated allocation at 31 December 2008 0.75:1 Total estimated awards at 31 December 2008 16,513 At 31 December 2007 the Chairman of the Board of Directors and members of the Corporate Executive Committee at that time held a total of 684,061 Stock-settled Stock Appreciation Rights and Roche Option Plan awards, and had outstanding a total of 125,224 awards granted under the Roche Performance Share Plan.

Page 322
142
APPROPRIATION OF AVAILABLE EARNINGS
Proposals to the Annual General Meeting in CHF 2008 2007
Available earnings Balance brought forward from previous year 1,832,184 520,281 Net profit for the year 3,498,521,585 4,237,700,323 Transfer from free reserve 813,050,000 - Total available earnings 4,313,403,769 4,238,220,604 Appropriation of available earnings Distribution of an ordinary dividend of CHF 5.00 gross per share and non-voting equity security (Genussschein) as against CHF 4.60 last year (4,312,813,500)
(3,967,788,420)
Transfer to free reserve - (268,600,000) Total appropriation of available earnings (4,312,813,500) (4,236,388,420) To be carried forward on this account 590,269 1,832,184

Page 323
143
REPORT OF THE STATUTORY AUDITOR
Report of the Statutory Auditor on the Financial Statements to the Annual General Meeting of Roche Holding Ltd, Basel As statutory auditor, we have audited the financial statements (income statement, balance sheet and notes on pages 133 to 142) of Roche Holding Ltd for the year ended 31 December 2008. Board of Directors’ Responsibility The Board of Directors is responsible for the preparation of the financial statements in accordance with the requirements of Swiss law and the company’s articles of incorporation. This responsibility includes designing, implementing and maintaining an internal control system relevant to the preparation of financial statements that are free from material misstatement, whether due to fraud or error. The board of directors is further responsible for selecting and applying appropriate accounting policies and making accounting estimates that are reasonable in the circumstances. Auditor’s Responsibility Our responsibility is to express an opinion on these financial statements based on our audit. We conducted our audit in accordance with Swiss law and Swiss Auditing Standards. Those standards require that we plan and perform the audit to obtain reasonable assurance whether the financial statements are free from material misstatement. An audit involves performing procedures to obtain audit evidence about the amounts and disclosures in the financial statements. The procedures selected depend on the auditor’s judgment, including the assessment of the risks of material misstatement of the financial statements, whether due to fraud or error. In making those risk assessments, the auditor considers the internal control system relevant to the entity’s preparation of the financial statements in order to design audit procedures that are appropriate in the circumstances, but not for the purpose of expressing an opinion on the effectiveness of the entity’s internal control system. An audit also includes evaluating the appropriateness of the accounting policies used and the reasonableness of accounting estimates made, as well as evaluating the overall presentation of the financial statements. We believe that the audit evidence we have obtained is sufficient and appropriate to provide a basis for our audit opinion. Opinion In our opinion, the financial statements for the year ended 31 December 2008 comply with Swiss law and the company’s articles of incorporation.

Page 324
144
Report on Other Legal Requirements We confirm that we meet the legal requirements on licensing according to the Auditor Oversight Act (AOA) and independence (article 728 CO and article 11 AOA) and that there are no circumstances incompatible with our independence. In accordance with article 728a paragraph 1 item 3 CO and Swiss Auditing Standard 890, we confirm that an internal control system exists, which has been designed for the preparation of financial statements according to the instructions of the Board of Directors. We further confirm that the proposed appropriation of available earnings complies with Swiss law and the company’s articles of incorporation. We recommend that the financial statements submitted to you be approved. KPMG Klynveld Peat Marwick Goerdeler SA John A. Morris François Rouiller Licensed Audit Expert Licensed Audit Expert Auditor in Charge Basel, 29 January 2009

Page 325
AUDITED CONSOLIDATED FINANCIALS STATEMENTS OF THE ROCHE GROUP AS AT AND FOR THE YEAR ENDED 31 DECEMBER 2007*
* Please note that the page numbers at the top of the pages in this section are the page numbers from the
original 2007 Annual Report, Part 2 Finance Report commencing on page 24 and ending on page 107 (comprising in total 84 pages).
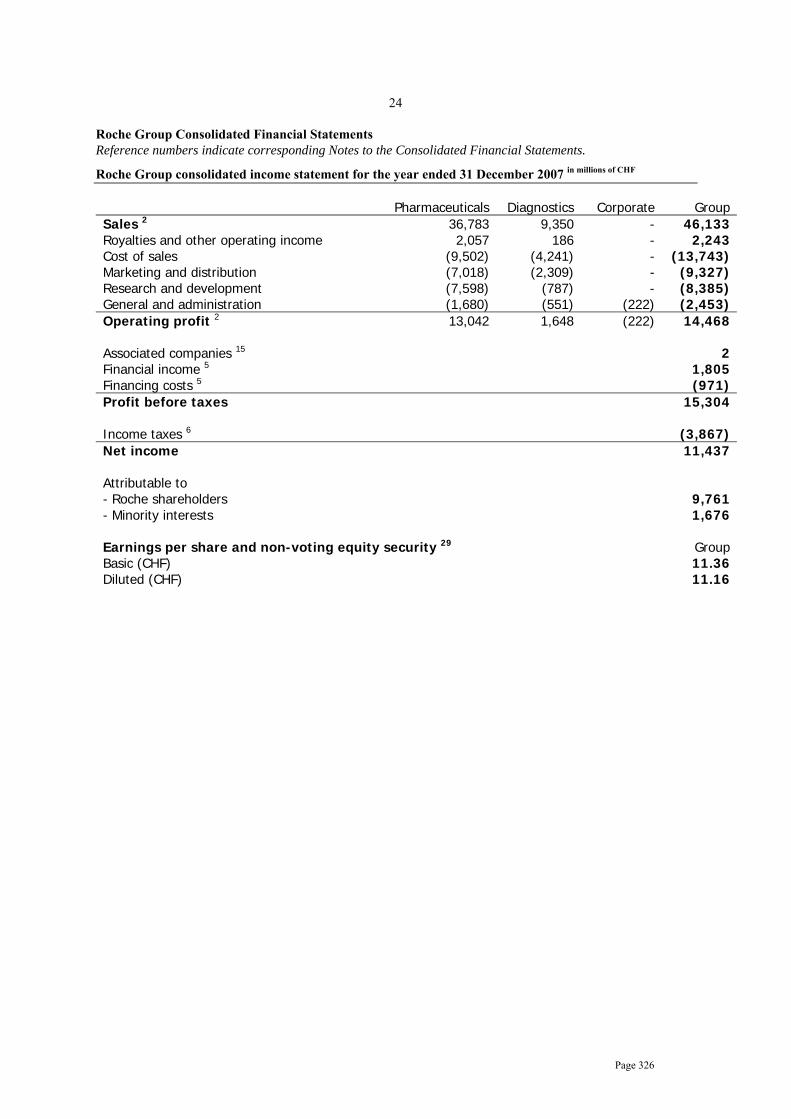
Page 326
24
Roche Group Consolidated Financial Statements Reference numbers indicate corresponding Notes to the Consolidated Financial Statements.
Roche Group consolidated income statement for the year ended 31 December 2007 in millions of CHF
Pharmaceuticals Diagnostics Corporate GroupSales 2 36,783 9,350 - 46,133Royalties and other operating income 2,057 186 - 2,243Cost of sales (9,502) (4,241) - (13,743)Marketing and distribution (7,018) (2,309) - (9,327)Research and development (7,598) (787) - (8,385)General and administration (1,680) (551) (222) (2,453)Operating profit 2 13,042 1,648 (222) 14,468 Associated companies 15 2Financial income 5 1,805Financing costs 5 (971)Profit before taxes 15,304 Income taxes 6 (3,867)Net income 11,437 Attributable to - Roche shareholders 9,761- Minority interests 1,676 Earnings per share and non-voting equity security 29 GroupBasic (CHF) 11.36Diluted (CHF) 11.16

Page 327
25
Roche Group consolidated income statement for the year ended 31 December 2006 in millions of CHF
Pharmaceuticals Diagnostics Corporate GroupSales 2 33,294 8,747 - 42,041Royalties and other operating income 1,209 182 - 1,391Cost of sales (9,032) (4,253) - (13,285)Marketing and distribution (6,859) (2,095) - (8,954)Research and development (6,590) (775) - (7,365)General and administration (1,477) (384) (237) (2,098)Operating profit 2 10,545 1,422 (237) 11,730 Associated companies 15 2Financial income 5 1,829Financing costs 5 (974)Profit before taxes 12,587 Income taxes 6 (3,436)Profit from continuing businesses 9,151 Profit from discontinued businesses 8 20Net income 9,171 Attributable to - Roche shareholders 7,880- Minority interests 1,291 Earnings per share and non-voting equity security 29 Continuing
businesses GroupBasic (CHF) 9.22 9.24Diluted (CHF) 9.03 9.05
As disclosed in Note 1, the operating results in the income statement for 2006 have been restated following the presentational changes adopted in 2007. A reconciliation to the previously published income statement is provided in Note 1. Total operating profit is unchanged, and the presentational changes have no effect on the non-operating results, net income and earnings per share.

Page 328
26
Roche Group consolidated balance sheet in millions of CHF
31 December 31 December 2007 2006 Non-current assets Property, plant and equipment 12 17,832 16,417 Goodwill 13 6,835 5,914 Intangible assets 14 6,346 5,469 Associated companies 15 9 7 Financial long-term assets 16 1,333 2,203 Other long-term assets 16 527 627 Deferred income tax assets 6 1,317 1,935 Post-employment benefit assets 10 1,150 947 Total non-current assets 35,349 33,519 Current assets Inventories 17 6,113 5,592 Accounts receivable 18 9,804 8,960 Current income tax assets 6 263 258 Other current assets 19 2,452 1,754 Marketable securities 20 20,447 21,121 Cash and cash equivalents 21 3,755 3,210 Total current assets 42,834 40,895 Total assets 78,183 74,414 Non-current liabilities Long-term debt 27 (3,834) (6,199) Deferred income tax liabilities 6 (1,481) (2,310) Post-employment benefit liabilities 10 (3,696) (4,221) Provisions 25 (688) (1,593) Other non-current liabilities 26 (723) (585) Total non-current liabilities (10,422) (14,908) Current liabilities Short-term debt 27 (3,032) (2,044)
Current income tax liabilities 6 (2,215) (2,034) Provisions 25 (1,517) (756) Accounts payable 22 (1,861) (2,213) Accrued and other current liabilities 23 (5,829) (5,645) Total current liabilities (14,454) (12,692) Total liabilities (24,876) (27,600) Total net assets 53,307 46,814 Equity Capital and reserves attributable to Roche shareholders 28 45,347 39,444 Equity attributable to minority interests 30 7,960 7,370 Total equity 53,307 46,814
As disclosed in Note 1, the split of non-current assets in the 2006 balance sheet has been restated following the presentational changes adopted in 2007. A reconciliation to the previously published balance sheet is provided in Note 1. Total non-current assets are unchanged.

Page 329
27
Roche Group consolidated cash flow statement in millions of CHF
Year ended 31 December 2007 2006 Cash flows from operating activities Cash generated from operations 31 18,480 15,975 (Increase) decrease in working capital (1,207) (1,897) Payments made for defined benefit post-employment plans 10 (352) (323) Utilisation of legal and environmental provisions 25 (299) (44) Utilisation of restructuring and other provisions 25 (397) (429) Other operating cash flows (3) (156) Cash flows from operating activities, before income taxes paid 16,222 13,126 Income taxes paid (4,494) (2,797) Total cash flows from operating activities 11,728 10,329 Cash flows from investing activities Purchase of property, plant and equipment (3,519) (3,561) Purchase of intangible assets (946) (593) Disposal of property, plant and equipment 116 330 Disposal of intangible assets - 1 Disposal of products 247 15 Business combinations 7 (2,310) - Divestments of discontinued businesses 8 - (5) Other divestments of subsidiaries - 14 Interest and dividends received 31 1,079 846 Sales of marketable securities 13,165 5,236 Purchases of marketable securities (13,377) (9,689) Other investing cash flows (243) (44) Total cash flows from investing activities (5,788) (7,450) Cash flows from financing activities Proceeds from issue of long-term debt instruments 27 719 - Repayment and redemption of long-term debt instruments 27 (1,908) (1,264) Increase (decrease) in other long-term debt 4 (638) Transactions in own equity instruments 28 1,085 1,367 Increase (decrease) in short-term borrowings (389) 200 Interest and dividends paid 31 (3,324) (2,600) Exercises of equity-settled equity compensation plans 11 450 480 Genentech and Chugai share repurchases 3, 4 (1,895) (1,248) Other financing cash flows (12) (12) Total cash flows from financing activities (5,270) (3,715) Net effect of currency translation on cash and cash equivalents (125) (182) Increase (decrease) in cash and cash equivalents 545 (1,018) Cash and cash equivalents at 1 January
3,210
4,228
Cash and cash equivalents at 31 December 21 3,755 3,210 .

Page 330
28
Roche Group consolidated statement of recognised income and expense in millions of CHF
Year ended 31 December 2007 2006 Available-for-sale investments - Valuation gains (losses) taken to equity 28 (198) 292 - Transferred to income statement on sale or impairment 28 (128) (184) Cash flow hedges - Gains (losses) taken to equity 28 (45) (71) - Transferred to income statement 28 (3) - - Transferred to the initial balance sheet carrying value of hedged items 28 - - Exchange differences on translation of foreign operations 28 (1,906) (1,487) Defined benefit post-employment plans - Actuarial gains (losses) 28 1,178 761 - Limit on asset recognition 28 (422) (396) Income taxes on items taken directly to or transferred from equity 28 (267) (135) Net income recognised directly in equity (1,791) (1,220) Net income recognised in income statement 11,437 9,171 Total recognised income and expense 9,646 7,951 Attributable to - Roche shareholders 28 8,502 7,198 - Minority interests 30 1,144 753 Total 9,646 7,951 Effect of changes in accounting policy attributable to - Roche shareholders 1 - - - Minority interests 1 - - Total - -

Page 331
29
Roche Group consolidated statement of changes in equity in millions of CHF
Roche shareholders
Minority interests
Total
Year ended 31 December 2006 At 1 January 2006 33,334 6,824 40,158 Net income recognised directly in equity (682) (538) (1,220)Net income recognised in income statement 7,880 1,291 9,171Total recognised income and expense 7,198 753 7,951 Dividends paid 28, 30 (2,152) (105) (2,257)Transactions in own equity instruments 28 1,383 - 1,383Equity compensation plans 28, 30 726 450 1,176Genentech and Chugai share repurchases 28, 30 (696) (552) (1,248)Convertible debt instruments 28, 30 (354) 5 (349)Changes in minority interests 28, 30 5 (5) -At 31 December 2006 39,444 7,370 46,814 Year ended 31 December 2007 At 1 January 2007 39,444 7,370 46,814 Net income recognised directly in equity (1,259) (532) (1,791)Net income recognised in income statement 9,761 1,676 11,437Total recognised income and expense 8,502 1,144 9,646 Dividends paid 28, 30 (2,930) (97) (3,027)Transactions in own equity instruments 28 1,085 - 1,085Equity compensation plans 28, 30 559 449 1,008Genentech and Chugai share repurchases 28, 30 (1,044) (851) (1,895)Convertible debt instruments 28, 30 (324) - (324)Changes in minority interests 28, 30 55 (55) -At 31 December 2007 45,347 7,960 53,307
Page 332
30
Notes to the Roche Group Consolidated Financial Statements Reference numbers indicate corresponding Notes to the Consolidated Financial Statements.
1. Summary of significant accounting policies Basis of preparation of the consolidated financial statements The consolidated financial statements of the Roche Group have been prepared in accordance with International Financial Reporting Standards (IFRS) and comply with Swiss law. They have been prepared using the historical cost convention except that, as disclosed in the accounting policies below, certain items, including derivatives and available-for-sale investments, are shown at fair value. They were approved for issue by the Board of Directors on 24 January 2008 and are subject to approval by the Annual General Meeting of shareholders on 4 March 2008. The preparation of the consolidated financial statements requires management to make estimates and assumptions that affect the reported amounts of revenues, expenses, assets and liabilities, and the disclosure of contingent liabilities at the date of the financial statements. If in the future such estimates and assumptions, which are based on management’s best judgement at the date of the financial statements, deviate from the actual circumstances, the original estimates and assumptions will be modified as appropriate in the year in which the circumstances change. Changes in accounting policies that arise from the application of new or revised standards and interpretations are applied retrospectively, unless otherwise specified in the transitional requirements of the particular standard or interpretation. Retrospective application requires that the results of the comparative period and the opening balances of that period are restated as if the new accounting policy had always been applied. In some cases the transitional requirements of the particular standard or interpretation specify that the changes are to be applied prospectively. Prospective application requires that the new accounting policy only be applied to the results of the current period and the comparative period is not restated. In addition comparatives have been reclassified or extended from the previously reported results to take into account any presentational changes. Consolidation policy These financial statements are the consolidated financial statements of Roche Holding Ltd, a company registered in Switzerland, and its subsidiaries (‘the Group’). The subsidiaries are those companies controlled, directly or indirectly, by Roche Holding Ltd, where control is defined as the power to govern the financial and operating policies of an enterprise so as to obtain benefits from its activities. This control is normally evidenced when Roche Holding Ltd owns, either directly or indirectly, more than 50% of the voting rights or currently exercisable potential voting rights of a company’s share capital. Special Purpose Entities are consolidated where the substance of the relationship is that the Special Purpose Entity is controlled by the Group. Companies acquired during the year are consolidated from the date on which control is transferred to the Group, and subsidiaries to be divested are included up to the date on which control passes from the Group. Inter-company balances, transactions and resulting unrealised income are eliminated in full. Investments in associated companies are accounted for by the equity method. These are companies over which the Group exercises, or has the power to exercise, significant influence, but which it does not control. This is normally evidenced when the Group owns 20% or more of the voting rights or currently exercisable potential voting rights of the company. Balances and transactions with associated companies that result in unrealised income are eliminated to the extent of the Group’s interest in the associated company. Interests in joint ventures are reported using the line-by-line proportionate consolidation method.

Page 333
31
Segment reporting The determination of the Group’s operating segments is based on the organisation units for which information is reported to the Group’s management. The Group has two divisions, Pharmaceuticals and Diagnostics. Revenues are primarily generated from the sale of prescription pharmaceutical products and diagnostic instruments, reagents and consumables, respectively. Both divisions also derive revenue from the sale or licensing of products or technology to third parties. Within the Pharmaceuticals Division there are three sub-divisions, Roche Pharmaceuticals, Genentech and Chugai. The three sub-divisions have separate management and reporting structures within the Pharmaceuticals Division and are considered separately reportable operating segments. Certain headquarter activities are reported as ‘Corporate’. These consist of corporate headquarters, including the Corporate Executive Committee, corporate communications, corporate human resources, corporate finance, including treasury, taxes and pension fund management, corporate legal and corporate safety and environmental services. Effective from 1 January 2007 the Group’s management has concluded that the remaining residual balances from the divested Vitamins and Fine Chemicals business and the Consumer Health (OTC) business should be considered as part of the Group’s continuing businesses and should be reported in the ‘Corporate’ segment. Prior to this these have been presented as discontinued businesses (see Note 8). Transfer prices between operating segments are set on an arm’s length basis. Operating assets and liabilities consist of property, plant and equipment, goodwill and intangible assets, trade receivables/payables, inventories and other assets and liabilities, such as provisions, which can be reasonably attributed to the reported operating segments. Non-operating assets and liabilities mainly include current and deferred income tax balances, post-employment benefit assets/liabilities and financial assets/liabilities such as cash, marketable securities, investments and debt. Foreign currency translation Most Group companies use their local currency as their functional currency. Certain Group companies use other currencies (namely US dollars, Swiss francs or euros) as their functional currency where this is the currency of the primary economic environment in which the entity operates. Local transactions in other currencies are initially reported using the exchange rate at the date of the transaction. Gains and losses from the settlement of such transactions and gains and losses on translation of monetary assets and liabilities denominated in other currencies are included in income, except when they are qualifying cash flow hedges or arise on monetary items that, in substance, form part of the Group’s net investment in a foreign entity. In such cases the gains and losses are deferred into equity. Upon consolidation, assets and liabilities of Group companies using functional currencies other than Swiss francs (foreign entities) are translated into Swiss francs using year-end rates of exchange. Sales, costs, expenses, net income and cash flows are translated at the average rates of exchange for the year. Translation differences due to the changes in exchange rates between the beginning and the end of the year and the difference between net income translated at the average and year-end exchange rates are taken directly to equity. On disposal of a foreign entity, the identified cumulative currency translation differences within equity relating to that foreign entity are recognised in income as part of the gain or loss on divestment. Revenues Sales represent amounts received and receivable for goods supplied to customers after deducting trade discounts, cash discounts and volume rebates, and exclude value added taxes and other taxes directly linked to sales. Revenues from the sale of products are recognised upon transfer to the customer of significant risks and rewards. Trade discounts, cash discounts and volume rebates are recorded on an accrual basis consistent with the recognition of the related sales. Estimates of expected sales returns, charge-backs and other rebates, including Medicaid in the United States and similar rebates in other countries, are also deducted from sales and recorded as accrued liabilities or provisions or as a deduction from accounts receivable. Such estimates are based on analyses of existing contractual or legislatively mandated obligations, historical trends and the Group’s experience. Other revenues are recorded as earned or as the services are performed. Where necessary, single transactions are split into separately identifiable components to reflect the substance of the transaction. Conversely, two or more transactions may be considered together for revenue recognition purposes, where the commercial effect cannot be understood without reference to the series of transactions as a whole.

Page 334
32
Cost of sales Cost of sales includes the corresponding direct production costs and related production overheads of goods sold and services rendered. Royalties, alliance and collaboration expenses, including all collaboration profit-sharing arrangements are also reported as part of cost of sales. Start-up costs between validation and the achievement of normal production capacity are expensed as incurred. Research and development In addition to its internal research and development activities, the Group is also party to in-licensing and similar arrangements with its alliance partners. The Group may also acquire in-process research and development assets, either through business combinations or through purchases of specific assets. Internal research costs are charged against income as incurred. Internal development costs are capitalised as intangible assets only when there is an identifiable asset that can be completed and that will generate probable future economic benefits and when the cost of such an asset can be measured reliably. The Group does not currently have any such internal development costs that qualify for capitalisation as intangible assets. Internal development costs are therefore charged against income as incurred since the criteria for their recognition as an asset are not met. In-process research and development assets acquired either through in-licensing arrangements, business combinations or separate purchases are capitalised as intangible assets as described below. Once available for use, such intangible assets are amortised on a straight-line basis over the period of the expected benefit and are reviewed for impairment at each reporting date. Licensing, milestone and other upfront receipts and payments Royalty income is recognised on an accruals basis in accordance with the substance of the respective licensing agreements. Certain Group companies receive from third parties upfront, milestone and other similar payments relating to the sale or licensing of products or technology. Revenue associated with performance milestones is recognised based on achievement of the deliverables as defined in the respective agreements. Upfront payments and licence fees for which there are subsequent deliverables are initially reported as deferred income and are recognised in income as earned over the period of the development collaboration or the manufacturing obligation. Payments made by Group companies to third parties and associated companies for such items are capitalised as intangible assets. Accounting and reporting of transactions between Roche, Genentech and Chugai Within the Group’s consolidated financial statements, transactions and balances between consolidated subsidiaries, such as between Genentech, Chugai and other Roche Group subsidiaries, are eliminated on consolidation. Genentech and Chugai are considered separately reportable operating segments for the purposes of the Group’s operating segment disclosures in Note 2. Additional information relating to Genentech and Chugai results is given in Notes 3 and 4, respectively. Profits on product sales between the Roche Pharmaceuticals, Genentech and Chugai operating segments are recorded as part of the segment results of the operating segment making the sale. Unrealised internal profits on inventories that have been sold by one operating segment to another but which have not yet been sold on to external customers as at the balance sheet date are eliminated as a consolidation entry at a Pharmaceuticals Division level. Additionally the results of each operating segment may include income received from another operating segment in respect of:
• Royalties. • Licensing, milestone and other upfront payments. • Transfers in respect of research collaborations.
Page 335
33
These are recognised as income in the segment results of the operating segment receiving the income consistently with the accounting policies applied to third-party transactions and set out in these financial statements. Corresponding expenses are recorded in the other operating segment so that these eliminate at a Pharmaceuticals Division level. Employee benefits Wages, salaries, social security contributions, paid annual leave and sick leave, bonuses, and non-monetary benefits are accrued in the year in which the associated services are rendered by employees of the Group. Where the Group provides long-term employee benefits, the cost is accrued to match the rendering of the services by the employees concerned. Liabilities for long-term employee benefits are discounted to take into account the time value of money, where material. Pensions and other post-employment benefits Most employees are covered by defined benefit and defined contribution post-employment plans sponsored by Group companies. The Group’s contributions to defined contribution plans are charged to the appropriate income statement heading within the operating results in the year to which they relate. The accounting and reporting of defined benefit plans are based on recent actuarial valuations. The defined benefit obligations and service costs are calculated using the projected unit credit method. This reflects service rendered by employees to the dates of valuation and incorporates actuarial assumptions primarily regarding discount rates used in determining the present value of benefits, projected rates of remuneration growth and long-term expected rates of return for plan assets. Discount rates are based on the market yields of high-quality corporate bonds in the country concerned. Past service costs are allocated over the average period until the benefits become vested. Current and past service costs are charged to the appropriate income statement heading within the operating results. Pension plan administration and funding is overseen at a corporate level and any settlement gains and losses resulting from changes in funding arrangements are reported as general and administration expenses within the Corporate segment. The expected returns on plan assets and interest costs are charged to financial income and financing costs, respectively. Actuarial gains and losses, which consist of differences between assumptions and actual experiences and the effects of changes in actuarial assumptions, are recorded directly in equity. Pension assets and liabilities in different defined benefit plans are not offset unless the Group has a legally enforceable right to use the surplus in one plan to settle obligations in the other plan. The recognition of pension assets is limited to the total of the present value of any future refunds from the plans or reductions in future contributions to the plans and any cumulative unrecognised past service costs. Adjustments arising from the limit on the recognition of assets for defined benefit plans are recorded directly in equity. Equity compensation plans Certain employees of the Group participate in equity compensation plans, including separate plans at Genentech and Chugai. The fair value of all equity compensation awards granted to employees is estimated at the grant date and recorded as an expense over the vesting period. The expense is charged to the appropriate income statement heading within the operating results. For equity-settled plans, an increase in equity is recorded and any subsequent cash flows from exercises of vested awards are recorded as an increase in equity. For cash-settled plans, a liability is recorded, which is measured at fair value at each balance sheet date with any movements in fair value being recorded to the appropriate income statement heading within the operating results. Any subsequent cash flows from exercise of vested awards are recorded as a reduction of the liability. Property, plant and equipment Property, plant and equipment are initially recorded at cost of purchase or construction, and include all costs directly attributable to bringing the asset to the location and condition necessary for it to be capable of operating in the manner intended by management. These include items such as costs of site preparation, installation and assembly costs and professional fees. The net costs of testing whether the asset is functioning properly, including validation costs, are also included in the initially recorded cost of construction. Interest and other borrowing costs incurred with respect to qualifying assets are capitalised and included in the carrying value of the assets.

Page 336
34
Property, plant and equipment are depreciated on a straight-line basis, except for land, which is not depreciated. Estimated useful lives of major classes of depreciable assets are as follows: Land improvements 40 years Buildings 10-50 years Machinery and equipment 5-15 years Diagnostic instruments 3-5 years Office equipment 3 years Motor vehicles 5 years Where parts of an item of property, plant and equipment have different useful lives, they are accounted for as separate components. The estimated useful life of the assets is regularly reviewed and, if necessary, the future depreciation charge is accelerated. Repairs and maintenance costs are expensed as incurred. Leases Where the Group is the lessee, leases of property, plant and equipment where the Group has substantially all of the risks and rewards of ownership are classified as finance leases. Finance leases are capitalised at the start of the lease at fair value, or the present value of the minimum lease payments, if lower. The rental obligation, net of finance charges, is reported within debt. Assets acquired under finance leases are depreciated in accordance with the Group’s policy on property, plant and equipment. If there is no reasonable certainty that the Group will obtain ownership by the end of the lease term, the asset is depreciated over the shorter of the lease term and its useful life. The interest element of the lease payment is charged against income over the lease term based on the effective interest rate method. Leases where substantially all of the risks and rewards of ownership are not transferred to the Group are classified as operating leases. Payments made under operating leases are charged against income on a straight-line basis over the period of the lease. Where the Group is the lessor, which primarily occurs in the Diagnostics Division, assets subject to finance leases are initially reported as receivables at an amount equal to the net investment in the lease. Assets subject to operating leases are reported within property, plant and equipment. Lease income from finance leases is subsequently recognised as earned income over the term of the lease based on the effective interest rate method. Lease income from operating leases is recognised over the lease term on a straight-line basis. Business combinations and goodwill Business combinations are accounted for using the purchase method of accounting. The cost of acquisition is the consideration given in exchange for control over the identifiable assets, liabilities and contingent liabilities of the acquired company. This consideration includes the cash paid plus the fair value at the date of exchange of assets given, liabilities incurred or assumed and equity instruments issued by the Group. The cost of acquisition also includes directly attributable costs. The acquired net assets, being the identifiable assets, liabilities and contingent liabilities, are initially recognised at fair value. Where the Group does not acquire 100% ownership of the acquired company, minority interest is recorded as the minority’s proportion of the fair value of the acquired net assets. Goodwill is recorded as the surplus of the cost of acquisition over the Group’s interest in the fair value of the acquired net assets. Any goodwill and fair value adjustments are recorded as assets and liabilities of the acquired company in the functional currency of that company. Goodwill is not amortised, but is assessed for possible impairment at each balance sheet date and is additionally tested annually for impairment. Goodwill may also arise upon investments in associated companies, being the surplus of the cost of investment over the Group’s share of the fair value of the net identifiable assets. Such goodwill is recorded within investments in associated companies. Intangible assets Purchased patents, licences, trademarks and other intangible assets are initially recorded at cost. Where these assets have been acquired through a business combination, this will be the fair value allocated in the acquisition accounting. Intangible assets are amortised over their useful lives on a straight-line basis beginning from the point when they are available for use. Estimated useful life is the lower of the legal duration and the economic useful life. The estimated useful life of intangible assets is regularly reviewed.

Page 337
35
Impairment of property, plant and equipment and intangible assets An impairment assessment is carried out when there is evidence that an asset may be impaired. In addition intangible assets that are not yet available for use are tested for impairment annually. When the recoverable amount of an asset, being the higher of its fair value less costs to sell and its value in use, is less than its carrying amount, then the carrying amount is reduced to its recoverable amount. This reduction is reported in the income statement as an impairment loss. Value in use is calculated using estimated cash flows, generally over a five-year period, with extrapolating projections for subsequent years. These are discounted using an appropriate long-term pre-tax interest rate. When an impairment loss arises, the useful life of the asset in question is reviewed and, if necessary, the future depreciation/amortisation charge is accelerated. The impairment of financial assets is discussed below in the ‘Financial assets’ policy. Impairment of goodwill Goodwill is assessed for possible impairment at each balance sheet date and is additionally tested annually for impairment. Goodwill is allocated to cash-generating units as described in Note 13. When the recoverable amount of the cash-generating unit, being the higher of its fair value less costs to sell or its value in use, is less than its carrying amount, then an impairment in the carrying amount is recorded. The methodology used in the impairment testing is further described in Note 13. Inventories Inventories are stated at the lower of cost and net realisable value. The cost of finished goods and work in process includes raw materials, direct labour and other directly attributable costs and overheads based upon the normal capacity of production facilities. Cost is determined using the weighted average method. Net realisable value is the estimated selling price less cost to completion and selling expenses. Accounts receivable Accounts receivable are carried at the original invoice amount less allowances made for doubtful accounts, trade discounts, cash discounts, volume rebates and similar allowances. An allowance for doubtful accounts is recorded for the difference between the carrying amount and the recoverable amount where there is objective evidence that the Group will not be able to collect all amounts due. Trade discounts, cash discounts, volume rebates and similar allowances are recorded on an accrual basis consistent with the recognition of the related sales, using estimates based on existing contractual obligations, historical trends and the Group’s experience. Long-term accounts receivable are discounted to take into account the time value of money, where material. Cash and cash equivalents Cash and cash equivalents include cash on hand and time, call and current balances with banks and similar institutions. Such balances are only reported as cash if they are readily convertible to known amounts of cash, are subject to insignificant risk of changes in value and have a maturity of three months or less from the date of acquisition. This definition is also used for the cash flow statement. Provisions Provisions are recognised where a legal or constructive obligation has been incurred which will probably lead to an outflow of resources that can be reasonably estimated. In particular, restructuring provisions are recognised when the Group has a detailed formal plan that has either commenced implementation or been announced. Provisions are recorded for the estimated ultimate liability that is expected to arise, taking into account foreign currency effects arising from their translation from their functional currency into Swiss francs and the time value of money, where material. A contingent liability is disclosed where the existence of the obligation will only be confirmed by future events or where the amount of the obligation cannot be measured with reasonable reliability. Contingent assets are not recognised, but are disclosed where an inflow of economic benefits is probable. Fair values
Fair value is the amount for which a financial asset, liability or instrument could be exchanged between knowledgeable and willing parties in an arm’s length transaction. It is determined by reference to quoted market prices or by the use of established estimation techniques such as option pricing models and estimated discounted values of cash flows. The fair values of financial assets and liabilities at the balance sheet date are not materially different from their reported carrying values unless specifically mentioned in the Notes to the Consolidated Financial Statements.

Page 338
36
Financial assets Financial assets, principally investments, including marketable securities, are classified as either ‘Fair-value-through-profit-or-loss’, ‘Available-for-sale’, ‘Held-to-maturity’ or ‘Loans and receivables’. Fair-value-through-profit-or-loss financial assets are either classified as held-for-trading or designated upon initial recognition. Held-for-trading financial assets are acquired principally to generate profit from short-term fluctuations in price. Financial assets are designated as fair-value-through-profit-or-loss if doing so results in more relevant information by eliminating a measurement or recognition inconsistency. Held-to-maturity financial assets are securities with a fixed maturity that the Group has the intent and ability to hold until maturity. Loans and receivables are loans and other long-term financial assets created by the Group or acquired from the issuer in a primary market. They are non-derivative financial assets with fixed or determinable payments that are not quoted in an active market. All other financial assets are considered to be available-for-sale. All financial assets are initially recorded at fair value, including transaction costs, except for assets designated as fair-value-through-profit-or-loss, which exclude transaction costs. All purchases and sales are recognised on the settlement date. Fair-value-through-profit-or-loss financial assets are subsequently carried at fair value, with all changes in fair value recorded as financial income in the period in which they arise. Held-to-maturity financial assets are subsequently carried at amortised cost using the effective interest rate method. Available-for-sale financial assets are subsequently carried at fair value, with all unrealised changes in fair value recorded in equity except for interest calculated using the effective interest rate method and foreign exchange components. When the available-for-sale financial assets are sold, impaired or otherwise disposed of, the cumulative gains and losses previously recognised in equity are included in financial income for the current period. Loans and receivables are subsequently carried at amortised cost. Financial assets are assessed for possible impairment at each balance sheet date. An impairment charge is recorded where there is objective evidence of impairment, such as where the issuer is in bankruptcy, default or other significant financial difficulty. In addition any available-for-sale equity securities that have a market value of more than 25% below their original cost, net of any previous impairment, will be considered as impaired. Any available-for-sale equity securities that have a market value below their original cost, net of any previous impairment, for a sustained six-month period will also be considered as impaired. Any decreases in the market price of less than 25% of original cost, net of any previous impairment, which are also for less than a sustained six-month period are not by themselves considered as objective evidence of impairment. Such movements in fair value are recorded in equity until there is objective evidence of impairment or until the asset is sold or otherwise disposed of. For financial assets carried at amortised cost, any impairment charge is the difference between the carrying value and the recoverable amount, calculated using estimated future cash flows discounted using the original effective interest rate. For available-for-sale financial assets, any impairment charge is the amount currently carried in equity for the difference between the original cost, net of any previous impairment, and the fair value. Financial assets are derecognised when the contractual rights to the cash flows of the assets expire or when the Group sells or otherwise disposes of the contractual rights to the cash flows, including situations where the Group retains the contractual rights but assumes a contractual obligation to pay the cash flows to a third party. Derivatives
Derivative financial instruments are initially recorded and subsequently carried at fair value. Apart from those derivatives designated as qualifying cash flow hedging instruments as discussed in the ‘Hedging’ policy below, all changes in fair value are recorded as financial income in the period in which they arise. Embedded derivatives are recognised separately if not closely related to the host contract and where the host contract is carried at amortised cost.
Hedging
For the purposes of hedge accounting, hedging relationships may be of three types. Fair value hedges are hedges of particular risks that may change the fair value of a recognised asset or liability. Cash flow hedges are hedges of particular risks that may change the amount or timing of future cash flows. Hedges of net investment in a foreign entity are hedges of particular risks that may change the carrying value of the net assets of a foreign entity.

Page 339
37
To qualify for hedge accounting the hedging relationship must meet several strict conditions on documentation, probability of occurrence, hedge effectiveness and reliability of measurement. If these conditions are not met, then the relationship does not qualify for hedge accounting. In this case the hedging instrument and the hedged item are reported independently as if there were no hedging relationship. In particular any derivatives are reported at fair value, with changes in fair value included in financial income. For qualifying fair value hedges, the hedging instrument is recorded at fair value and the hedged item is recorded at its previous carrying value, adjusted for any changes in fair value that are attributable to the hedged risk. Any changes in the fair values are reported in financial income. For qualifying cash flow hedges, the hedging instrument is recorded at fair value. The portion of any change in fair value that is an effective hedge is included in equity, and any remaining ineffective portion is reported in financial income. If the hedging relationship is the hedge of the foreign currency risk of a firm commitment or highly probable forecasted transaction that results in the recognition of a non-financial asset or liability, the cumulative changes in the fair value of the hedging instrument that have been recorded in equity are included in the initial carrying value of the asset or liability at the date of recognition. For all other qualifying cash flow hedges, the cumulative changes in the fair value of the hedging instrument that have been recorded in equity are included in financial income when the forecasted transaction affects net income. For qualifying hedges of net investment in a foreign entity, the hedging instrument is recorded at fair value. The portion of any change in fair value that is an effective hedge is included in equity. Any remaining ineffective portion is recorded in financial income where the hedging instrument is a derivative and in equity in other cases. If the entity is disposed of, then the cumulative changes of fair value of the hedging instrument that have been recorded in equity are reclassified to income. Debt instruments Debt instruments are initially recorded at cost, which is the proceeds received, net of transaction costs. Subsequently they are reported at amortised cost using the effective interest method. Any discount between the net proceeds received and the principal value due on redemption is amortised over the duration of the debt instrument and is recognised as part of financing costs using the effective interest rate method. Certain debt instruments may be designated as ‘fair-value-through-profit-or-loss’ where doing so results in more relevant information as it eliminates or significantly reduces measurement or recognition inconsistencies. Such debt instruments are reported at fair value, based on quoted prices in an active market, with movements in fair value reported within financial income. Those debt instruments that are designated as fair-value-through-profit-or-loss are disclosed in Note 27. A bifurcation is carried out upon the issue of convertible debt instruments. The initial carrying value of the liability element is calculated using the market interest rate for an equivalent non-convertible instrument. The remainder of the net proceeds is allocated to the equity conversion option, which is reported in equity, and to deferred income tax liabilities. The liability element is subsequently reported at amortised cost or fair-value-through-profit-or-loss, if so designated. Taxation Income taxes include all taxes based upon the taxable profits of the Group, including withholding taxes payable on the distribution of retained earnings within the Group. Other taxes not based on income, such as property and capital taxes, are included within general and administration expenses. Liabilities for income taxes, mainly withholding taxes, which could arise on the remittance of retained earnings, principally relating to subsidiaries, are only recognised where it is probable that such earnings will be remitted in the foreseeable future. Deferred income tax assets and liabilities are recognised on temporary differences between the tax bases of assets and liabilities and their carrying amounts in the financial statements. Deferred income tax assets relating to the carry-forward of unused tax losses are recognised to the extent that it is probable that future taxable profit will be available against which the unused tax losses can be utilised.
Page 340
38
Current and deferred income tax assets and liabilities are offset when the income taxes are levied by the same taxation authority and when there is a legally enforceable right to offset them. Deferred income taxes are determined based on the currently enacted tax rates applicable in each tax jurisdiction where the Group operates. Discontinued businesses and non-current assets held for sale A discontinued business is a component of the Group’s business that represents a separate major line of business or geographical area of operations or is a subsidiary acquired exclusively with a view to resale. Reclassification as a discontinued business occurs upon disposal or when the operation meets the criteria to be classified as held for sale, if earlier. A disposal group is a group of assets that are to be disposed of as a group in a single transaction, together with the liabilities directly associated with those assets that will be transferred in the transaction. The assets and liabilities in a disposal group are reclassified as held for sale if their value will be recovered principally through a sale rather than through continuing use. The disposal group must be available for sale in its current condition and the sale must be highly probable. Immediately before classification as held for sale, the measurement of all assets and liabilities in a disposal group is updated in accordance with applicable accounting policies. Then, on initial classification as held for sale, disposal groups are recognised at the lower of carrying amount and fair value less costs to sell. Impairment losses on initial classification as held for sale are included in the income statement. Own equity instruments The Group’s holdings in its own equity instruments are recorded as a deduction from equity. The original purchase cost, consideration received for subsequent resale of these equity instruments and other movements are reported as changes in equity. These instruments have been acquired primarily to meet the potential obligations to employees that may arise in respect of certain of the Group’s equity compensation plans. Management judgements made in applying accounting policies The application of the Group’s accounting policies may require management to make judgements, apart from those involving estimates, that can have a significant effect on the amounts recognised in the consolidated financial statements. Management judgement is particularly required when assessing the substance of transactions that have a complicated structure or legal form. These include, but are not limited to, the following areas: Revenue recognition: The nature of the Group’s business is such that many sales transactions do not have a simple structure. Sales agreements may consist of multiple components occurring at different times. The Group is also party to various out-licensing agreements, which can involve upfront and milestone payments that may occur over several years. These agreements may also involve certain future obligations. Revenue is only recognised when, in management’s judgement, the significant risks and rewards of ownership have been transferred and when the Group does not retain continuing managerial involvement or effective control over the goods sold or when the obligation has been fulfilled. For some transactions this can result in cash receipts being initially recognised as deferred income and then released to income over subsequent periods on the basis of the performance of the conditions specified in the agreement. Consolidation of subsidiaries and associated companies: The Group periodically undertakes transactions that may involve obtaining the right to control or significantly influence the operations of other companies. These transactions include the acquisition of all or part of the equity of other companies, the purchase of certain assets and assumption of certain liabilities and contingent liabilities of other companies, and entering into alliance agreements with other companies. Also included are transactions involving Special Purpose Entities and similar vehicles. In all such cases management makes an assessment as to whether the Group has the right to control or significantly influence the other company’s operations, and based on this assessment the other company is consolidated as a subsidiary or associated company. In making this assessment management considers the underlying economic substance of the transaction and not only the contractual terms.

Page 341
39
Business combinations: Where the Group acquires control of another business, the cost of the acquisition has to be allocated to the assets, liabilities and contingent liabilities of the acquired business, with any residual recorded as goodwill. This process involves management making an assessment of the fair value of these items. Management judgement is particularly involved in the recognition and measurement of the following areas:
• Intellectual property. This may include patents, licences, trademarks and similar rights for currently marketed products, and also the rights and scientific knowledge associated with projects that are currently in research or development phases.
• Contingencies such as legal and environmental matters. • The recoverability of any accumulated tax losses in the acquired company.
In all cases management makes an assessment based on the underlying economic substance of the items concerned, and not only on the contractual terms, in order to fairly present these items at the amount for which they could be exchanged or settled between knowledgeable willing parties in an arm’s length transaction. Leases: The Group is party to leasing arrangements, both as a lessee and as a lessor. The treatment of leasing transactions in the financial statements is mainly determined by whether the lease is considered to be an operating lease or a finance lease. In making this assessment, management looks at the substance of the lease, as well as the legal form, and makes a judgement about whether substantially all of the risks and rewards of ownership are transferred. Arrangements which do not take the legal form of a lease but that nevertheless convey the right to use an asset are also covered by such assessments. Key assumptions and sources of estimation uncertainty The preparation of the consolidated financial statements in conformity with IFRS requires management to make estimates and assumptions that affect the application of policies and reported amounts of assets, liabilities, income, expenses and related disclosures. The estimates and underlying assumptions are based on historical experience and various other factors that are believed to be reasonable under the circumstances, the results of which form the basis for making the judgements about carrying values of assets and liabilities that are not readily apparent from other sources. Actual results may differ from these estimates. The estimates and underlying assumptions are reviewed on an ongoing basis. Changes in accounting estimates may be necessary if there are changes in the circumstances on which the estimate was based, or as a result of new information or more experience. Such changes are recognised in the period in which the estimate is revised. The key assumptions about the future and key sources of estimation uncertainty that have a significant risk of causing a material adjustment to the carrying value of assets and liabilities within the next twelve months are described below. Sales allowances: The Group has provisions and accruals for expected sales returns, charge-backs and other rebates, including Medicaid in the United States and similar rebates in other countries, which at 31 December 2007 total 812 million Swiss francs. Such estimates are based on analyses of existing contractual or legislatively-mandated obligations, historical trends and the Group’s experience. Management believes that the total provisions and accruals for these items are adequate, based upon currently available information. As these deductions are based on management estimates, they may be subject to change as better information becomes available. Such changes that arise could impact the provisions and accruals recognised in the balance sheet in future periods and consequently the level of sales recognised in the income statement in future periods. Property, plant and equipment and intangible assets, including goodwill: The Group has property, plant and equipment with a carrying value of 17,832 million Swiss francs as disclosed in Note 12. Goodwill has a carrying value of 6,835 million Swiss francs (see Note 13) and intangible assets have a carrying value of 6,346 million Swiss francs (see Note 14). All of these assets are reviewed annually for impairment as described above. To assess whether any impairment exists, estimates are made of the future cash flows expected to result from the use of the asset and its eventual disposal. Actual outcomes could vary significantly from such estimates of discounted future cash flows. Factors such as changes in the planned use of buildings, machinery or equipment, or closure of facilities, the presence or absence of competition, technical obsolescence or lower than anticipated sales for products with capitalised rights could result in shortened useful lives or impairment.

Page 342
40
Pensions and other post-employment benefits: Many of the Group’s employees participate in post-employment defined benefit plans. The calculations of the recognised assets and liabilities from such plans are based upon statistical and actuarial calculations. In particular the present value of the defined benefit obligation is impacted by assumptions on discount rates used to arrive at the present value of future pension liabilities, and assumptions on future increases in salaries and benefits. Furthermore, the Group’s independent actuaries use statistically based assumptions covering areas such as future withdrawals of participants from the plan and estimates of life expectancy. At 31 December 2007 the present value of the Group’s defined benefit obligation is 10,646 million Swiss francs for funded plans and 3,344 million Swiss francs for unfunded plans (see Note 10). The actuarial assumptions used may differ materially from actual results due to changes in market and economic conditions, higher or lower withdrawal rates, longer or shorter life spans of participants, and other changes in the factors being assessed. These differences could impact the assets or liabilities recognised in the balance sheet in future periods. Legal provisions: Group companies are party to various legal proceedings and the most significant matters are described in Note 25. Legal provisions at 31 December 2007 total 985 million Swiss francs. Additional claims could be made which might not be covered by existing provisions or by insurance. There can be no assurance that there will not be an increase in the scope of these matters or that any future lawsuits, claims, proceedings or investigations will not be material. Such changes that arise could impact the provisions recognised in the balance sheet in future periods. Environmental provisions: The Group has provisions for environmental remediation costs, which at 31 December 2007 total 203 million Swiss francs, as disclosed in Note 25. The material components of the environmental provisions consist of costs to fully clean and refurbish contaminated sites and to treat and contain contamination at certain other sites. Future remediation expenses are affected by a number of uncertainties that include, but are not limited to, the detection of previously unknown contaminated sites, the method and extent of remediation, the percentage of waste material attributable to the Group at the remediation sites relative to that attributable to other parties, and the financial capabilities of the other potentially responsible parties. Manage-ment believes that the total provisions for environmental matters are adequate based upon currently available information. However, given the inherent difficulties in estimating liabilities in this area, it cannot be guaranteed that additional costs will not be incurred beyond the amounts accrued. The effect of the resolution of environ-mental matters on the results of operations cannot be predicted due to uncertainty concerning both the amount and the timing of future expenditures. Such changes that arise could impact the provisions recognised in the balance sheet in future periods. Income taxes: At 31 December 2007, the net liability for current income taxes is 1,952 million Swiss francs and the net liability for deferred income taxes is 164 million Swiss francs, as disclosed in Note 6. Significant estimates are required to determine the current and deferred assets and liabilities for income taxes. Some of these estimates are based on interpretations of existing tax laws or regulations. Management believes that the estimates are reasonable and that the recognised liabilities for income tax-related uncertainties are adequate. Various internal and external factors may have favourable or unfavourable effects on the income tax assets and liabilities. These factors include, but are not limited to, changes in tax laws, regulations and/or rates, changing interpretations of existing tax laws or regulations, future levels of research and development spending and changes in overall levels of pre-tax earnings. Such changes that arise could impact the assets and liabilities recognised in the balance sheet in future periods. Changes in accounting policies The Group adopted certain new and revised International Financial Reporting Standards and interpretations effective 1 January 2007. A description of those changes that are material to the Group and their effect on the consolidated financial statements is given below. IFRS 7: ‘Financial Instruments: Disclosures’. The new standard, which replaces the disclosure requirements previously contained in IAS 32 ‘Financial Instruments: Presentation’, requires additional disclosure concerning the significance of the Group’s financial instruments, the nature and extent of risks arising from these instruments, and the manner in which these risks are managed. The presentation requirements required by IAS 32 remain unchanged. The disclosure requirements in IFRS 7 include qualitative and quantitative information about risk exposure arising from financial instruments, in particular credit risk, liquidity risk and market risk. The standard also requires qualitative disclosure about management’s objectives, policies and processes for managing these risks, hence providing an overview of the Group’s use of and exposure to financial instruments. These are given in Note 32.

Page 343
41
As a result of the implementation of IFRS 7, the classification of two non-current asset balances has been changed and the balance sheet at 31 December 2006 has been restated. Total non-current assets are unchanged. Pension reimbursement rights are now classified as post-employment benefit assets and finance lease receivables are now classified as financial long-term assets.
Restated non-current assets in the balance sheet at 31 December 2006 in millions of CHF As originally
published Pension
reimbursement rights
Finance lease
receivables
Grouprestated
Financial long-term assets 2,152 - 51 2,203Other long-term assets 794 (116) (51) 627Post-employment benefit assets 831 116 - 947
IFRS 8: ‘Operating Segments’. The new standard, which replaces IAS 14 ‘Segment Reporting’, requires some changes to the methodology and format of segment reporting. The Group has determined that its reportable operating segments under the new standard are the same as the primary business segments under the old standard. The new standard requires additional disclosure for operating segments given in Note 2. Unrealised internal profits on inventories that have been sold from one operating segment to another but which have not yet been sold on to external customers at the balance sheet date are eliminated as a consolidation entry. Previously this elimination was allocated to the originating operating segment. The segment results for 2006 have been restated following this presentational change.
Restated Pharmaceuticals Divisional information for year ended 31 December 2006 in millions of CHF Roche
Pharma. Genentech Chugai Pharma.
Division As originally published Operating profit 6,025 3,951 569 10,545 - including unrealised profits on inventories (114) (51) - (165) Restated Operating profit 6,139 4,002 569 10,710 Elimination of profit within division (165)Total 10,545 IAS 1 (revised): ‘Presentation of Financial Statements: Capital Disclosures’. The revisions to IAS 1 require additional disclosure concerning the Group’s objectives, policies and processes for managing capital. These are given in Note 32. IAS 23 (revised): ‘Borrowing Costs’. The revised standard requires that interest and other borrowing costs incurred with respect to qualifying assets are capitalised and included in the carrying value of the assets. Under the Group’s previous accounting policy such costs were expensed as interest costs. The Group has applied the new standard prospectively from 1 January 2007 and borrowing costs totalling 48 million Swiss francs using a rate of 4.79% were capitalised as property, plant and equipment in 2007 which would have been expensed under the previous accounting policy. The comparative results for 2006 have not been restated. Had the new accounting policy been applied in 2006, the Group would have capitalised an additional 32 million Swiss francs as property, plant and equipment and financing costs would have been lower by this amount. This had a positive impact of 0.02 CHF on earnings per share and non-voting equity security (basic and diluted) in 2007, and would have had a similar positive impact in 2006 if the revised standard had been applied retrospectively. Presentation of operating results in the income statement: The income statement for the year ended 31 December 2006 has been restated following the presentational changes adopted in 2007. The Group has made these presentational changes to more accurately reflect the underlying business, to further improve comparability of its results to those of other healthcare companies and to allow readers to make a more accurate assessment of the sustainable earnings capacity of the Group. Total operating profit is unchanged, and the presentational changes have no effect on the non-operating results, net income and earnings per share. These changes, which have been applied retrospectively, are listed below.

Page 344
42
• Intangible assets: Amortisation and impairment of intangible assets are no longer reported as a separate line, but are now reported as part of ‘Cost of sales’ (for intangibles relating to marketed products) or as part of ‘Research and Development’ (for intangibles relating to technology and development, and including any impairment on intangibles that are not yet available for use).
• Alliance and royalty expenses: All royalties, alliance and collaboration expenses, including all colla-boration profit-sharing arrangements are now reported as part of ‘Cost of sales’. Previously some of these were included in ‘Marketing and distribution’ or ‘General and administration’ depending upon the terms of the particular agreement. Additionally, royalty expenses payable on royalty income are now reported as part of ‘Royalties and other operating’ income to more accurately reflect the substance of the underlying transactions. Previously these expenses were included in ‘General and administration’.
• Phase IV and similar costs: All such costs, which only arise in the Pharmaceuticals Division, are now reported as part of ‘Research and development’. Previously some of these costs were included in ‘Marketing and distribution’ and ‘General and administration’ depending on their nature.
Restated income statement for the year ended 31 December 2006 in millions of CHF
As originally published
Intangible assets
Alliances /royalties
Phase IV
Restated
Group Sales 42,041 - - - 42,041 Royalties and other operating income 1,466 - (75) - 1,391 Cost of sales (10,616) (1,059) (1,610) - (13,285) Marketing and distribution (10,856) - 1,260 642 (8,954) Research and development (6,589) (115) - (661) (7,365) General and administration (2,542) - 425 19 (2,098) Amortisation and impairment of intangible assets
(1,174)
1,174
-
-
-
Operating profit 11,730 - - - 11,730 Pharmaceuticals Division Sales 33,294 - - - 33,294 Royalties and other operating income 1,277 - (68) - 1,209 Cost of sales (6,868) (619) (1,545) - (9,032) Marketing and distribution (8,761) - 1,260 642 (6,859) Research and development (5,889) (40) - (661) (6,590) General and administration (1,849) - 353 19 (1,477) Amortisation and impairment of intangible assets
(659)
659
-
-
-
Operating profit 10,545 - - - 10,545 Diagnostics Division Sales 8,747 - - - 8,747 Royalties and other operating income 189 - (7) - 182 Cost of sales (3,748) (440) (65) - (4,253) Marketing and distribution (2,095) - - - (2,095) Research and development (700) (75) - - (775) General and administration (456) - 72 - (384) Amortisation and impairment of intangible assets
(515)
515
-
-
-
Operating profit 1,422 - - - 1,422 Future changes in IFRS: The Group has early adopted IFRS 8 ‘Operating Segments’ and IAS 23 (revised) ‘Borrowing Costs’ which are required to be implemented from 1 January 2009 at the latest. The Group does not expect that the new interpretations that will be effective from 1 January 2008 will have a significant effect on the Group’s results and financial position. The Group is currently assessing the potential impacts of the new and revised standards that will be effective from 1 January 2009 and beyond, which include further revisions to IAS 1: ‘Presentation of Financial Statements’ and revisions to IFRS 3 ‘Business Combinations’, IAS 27 ‘Consolidated and Separate Financial Statements’ and IFRS 2 ‘Share based Payment’.

Page 345
43
2. Operating segment information Divisional information in millions of CHF
Pharma-ceuticals Division
Diagnostics Division
Corporate Group
2007 2006 2007 2006 2007 2006 2007 2006 Revenues from external customers Sales 36,78
3 33,29
4 9,350 8,747 - - 46,13
3 42,04
1 Royalties and other operating income 2,057 1,209 186 182 - - 2,243 1,391 Total 38,84
0 34,50
3 9,536 8,929 - - 48,37
6 43,43
2 Revenues from other operating segments
Sales 8 23 5 6 - - 13 29 Royalties and other operating income - - - - - - - - Elimination of inter-divisional revenue (13) (29) Total 8 23 5 6 - - - - Segment results Operating profit 13,04
2 10,54
5 1,648 1,422 (222) (237) 14,46
8 11,73
0 Elimination of inter-divisional profit - - Total 14,46
8 11,73
0
Capital expenditure Business combinations 1,165 - 1,186 - - - 2,351 - Additions to property, plant and equipment
2,588 3,030 1,058 846 2 2 3,648 3,878
Additions to intangible assets 791 584 258 9 - - 1,049 593 Total capital expenditure 4,544 3,614 2,502 855 2 2 7,048 4,471 Other segment information Depreciation of property, plant and equipment
957 924 599 532 4 5 1,560 1,461
Amortisation of intangible assets 645 646 331 331 - - 976 977 Impairment of property, plant and equipment
4 40 2 31 - - 6 71
Impairment of goodwill - - - - - - - - Impairment of intangible assets 58 13 - 184 - - 58 197 Equity compensation plan expenses 568 632 26 44 14 14 608 690
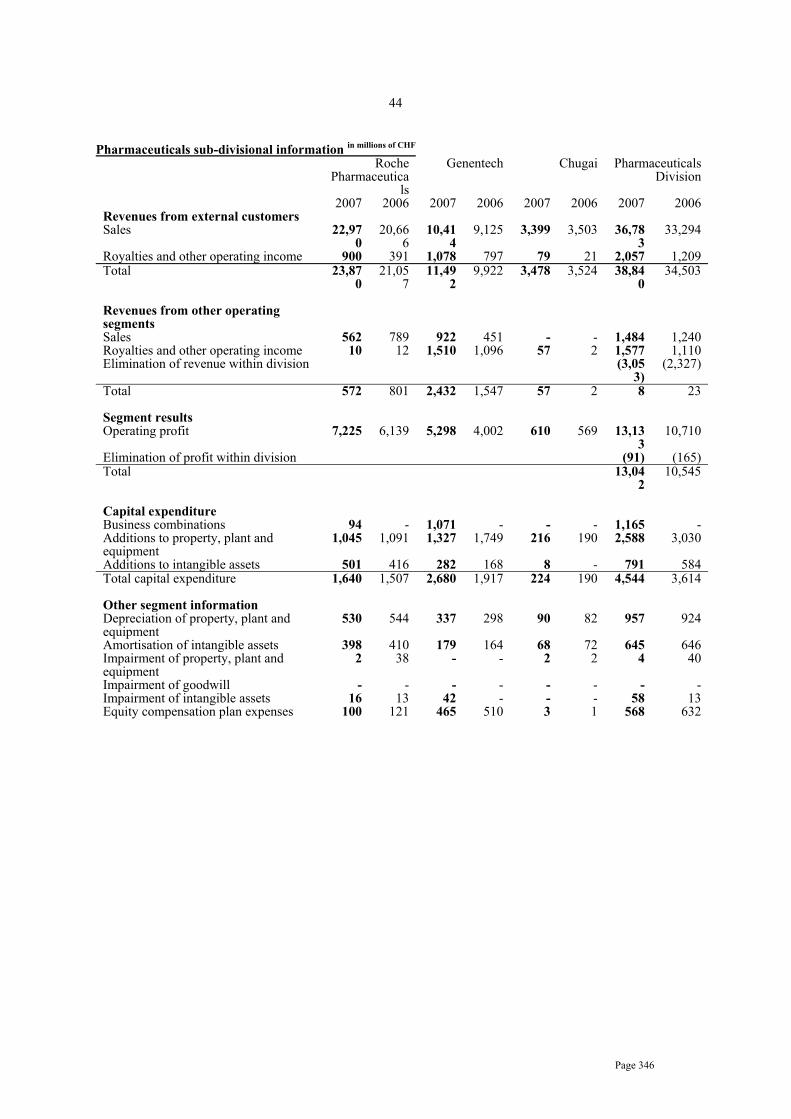
Page 346
44
Pharmaceuticals sub-divisional information in millions of CHF
Roche Pharmaceutica
ls
Genentech Chugai Pharmaceuticals Division
2007 2006 2007 2006 2007 2006 2007 2006 Revenues from external customers Sales 22,97
0 20,66
6 10,41
4 9,125 3,399 3,503 36,78
3 33,294
Royalties and other operating income 900 391 1,078 797 79 21 2,057 1,209 Total 23,87
0 21,05
7 11,49
2 9,922 3,478 3,524 38,84
0 34,503
Revenues from other operating segments
Sales 562 789 922 451 - - 1,484 1,240 Royalties and other operating income 10 12 1,510 1,096 57 2 1,577 1,110 Elimination of revenue within division (3,05
3) (2,327)
Total 572 801 2,432 1,547 57 2 8 23
Segment results Operating profit 7,225 6,139 5,298 4,002 610 569 13,13
3 10,710
Elimination of profit within division (91) (165) Total 13,04
2 10,545
Capital expenditure Business combinations 94 - 1,071 - - - 1,165 - Additions to property, plant and equipment
1,045 1,091 1,327 1,749 216 190 2,588 3,030
Additions to intangible assets 501 416 282 168 8 - 791 584 Total capital expenditure 1,640 1,507 2,680 1,917 224 190 4,544 3,614 Other segment information Depreciation of property, plant and equipment
530 544 337 298 90 82 957 924
Amortisation of intangible assets 398 410 179 164 68 72 645 646 Impairment of property, plant and equipment
2 38 - - 2 2 4 40
Impairment of goodwill - - - - - - - - Impairment of intangible assets 16 13 42 - - - 58 13 Equity compensation plan expenses 100 121 465 510 3 1 568 632

Page 347
45
Net operating assets in millions of CHF
Assets Liabilities Net assets 2007 2006 2007 2006 2007 2006 Roche Pharmaceuticals 16,384 15,365 (3,288) (3,789) 13,096 11,576 Genentech 12,993 11,358 (4,049) (3,583) 8,944 7,775 Chugai 3,663 3,773 (561) (636) 3,102 3,137 Elimination within division (450) (364) - - (450) (364) Pharmaceuticals Division 32,590 30,132 (7,898) (8,008) 24,692 22,124 Diagnostics Division 16,323 14,547 (2,263) (2,134) 14,060 12,413 Corporate 232 192 (271) (139) (39) 53 Total operating 49,145 44,871 (10,432) (10,281) 38,713 34,590 Non-operating 29,038 29,543 (14,444) (17,319) 14,594 12,224 Group 78,183 74,414 (24,876) (27,600) 53,307 46,814
Information by geographical area in millions of CHF
2007 Revenues from external customers
Non-current assets
Sales Royalties and other operating
income
Property, plant and
equipment
Goodwill and intangible assets
Switzerland 489 430 2,404 2,354 European Union 15,465 127 5,096 2,755 - of which Germany 3,277 117 3,437 2,699 Rest of Europe 1,620 - 53 4 Europe 17,574 557 7,553 5,113 United States 17,069 1,598 7,949 7,446 Rest of North America 1,004 3 126 19 North America 18,073 1,601 8,075 7,465 Latin America 2,784 - 454 42 Japan 3,562 85 1,382 559 Rest of Asia 2,681 - 254 - Asia 6,243 85 1,636 559 Africa, Australia and Oceania 1,459 - 114 2 Total 46,133 2,243 17,832 13,181

Page 348
46 2006 Switzerland 471 142 2,042 1,926 European Union 13,823 99 4,571 2,872 - of which Germany 2,993 98 3,002 2,818 Rest of Europe 1,307 1 200 4 Europe 15,601 242 6,813 4,802 United States 15,685 1,115 7,485 5,858 Rest of North America 985 6 100 33 North America 16,670 1,121 7,585 5,891 Latin America 2,539 7 391 55 Japan 3,713 21 1,299 633 Rest of Asia 2,384 - 217 - Asia 6,097 21 1,516 633 Africa, Australia and Oceania 1,134 - 112 2 Total 42,041 1,391 16,417 11,383
Sales are allocated to geographical areas by destination according to the location of the customer. Royalties and other operating income are allocated according to the location of the Group company that receives the revenue. European Union information is based on members of the EU as at 31 December 2007. The comparative information in 2006 has been restated to include Bulgaria and Romania within the ‘European Union’ segment. Major customers The US national wholesale distributor, AmerisourceBergen Corp., represented approximately 6 billion Swiss francs (2006: 5 billion Swiss francs) of the Group’s revenues. Over 85% of these revenues were in the Genentech operating segment, with the residual in the Roche Pharmaceuticals and Diagnostics segments. The Group also reported substantial revenues from the US national wholesale distributors, Cardinal Health Inc. and McKesson Corp., and in total these three customers represented approximately a quarter of the Group’s revenues, the majority of this being at Genentech. 3. Genentech
Effective 7 September 1990 the Roche Group acquired a majority interest of approximately 60% of Genentech, Inc., a biotechnology company in the United States. On 13 June 1999 the Group exercised its option to acquire the remaining shares of Genentech on 30 June 1999, at which point Genentech became a 100% owned subsidiary of the Group. On 23 July 1999, 26 October 1999 and 29 March 2000 the Group completed public offerings of Genentech’s common stock, which reduced the Group’s majority interest to 60%. During 2004 the Group’s ownership of Genentech decreased by 2.45% due to the conversion and redemption of the ‘LYONs IV’ US dollar exchangeable notes. At 31 December 2007 the Group’s interest in Genentech was 55.8% (2006: 55.8%). The common stock of Genentech is publicly traded and is listed on the New York Stock Exchange, under the symbol ‘DNA’. Genentech prepares financial statements in conformity with accounting principles generally accepted in the United States (US GAAP). These are filed on a quarterly basis with the US Securities and Exchange Commission (SEC). Roche’s relationship with Genentech Genentech has entered into certain agreements with Roche, which are discussed below: Affiliation Arrangements: As a result of the June 1999 redemption of Genentech’s Special Common Stock and subsequent public offerings, Genentech amended their certificate of incorporation and bylaws and entered into or amended certain affiliation arrangements with Roche. Amongst other matters these cover the following areas:

Page 349
47
• Roche’s rights as a shareholder. • Roche’s rights to nominate members of Genentech’s Board of Directors. • Certain limitations on Roche’s ability to buy or sell Genentech’s common stock. • The process under which Roche may effect a merger of Genentech with Roche. • The approval of the directors designated by Roche should Genentech seek to make significant business
acquisitions or divestments. • The approval of the directors designated by Roche should Genentech seek to issue, repurchase or
redeem its capital stock. Genentech issues additional shares of common stock in connection with its equity compensation plans, and may issue additional shares for other purposes, which affects Roche’s percentage ownership interest. The affiliation agreement between Roche and Genentech provides, amongst other matters, that Genentech establish a stock repurchase programme to maintain Roche’s percentage ownership interest in Genentech. Licensing Agreements: In July 1999 Roche and Genentech agreed an amended and restated licensing and marketing agreement granting Roche an option to license, use and sell Genentech’s products in non-US markets. This licensing and marketing agreement was subsequently amended to delete or add certain Genentech products under Roche’s commercialisation and marketing rights for Canada. In addition, Roche and Genentech have a July 1998 licensing and marketing agreement relating to anti-HER2 antibodies (Herceptin and Pertuzumab), providing Roche with exclusive marketing rights outside of the US. Depending on the specific circumstances and the terms of the agreement, this may result in payments on an arm’s-length basis from Roche to Genentech, for any or all of the following matters:
• Fees to extend Roche’s option to license a product. • Partial reimbursement of Genentech’s previously incurred development costs where Roche exercises
an option to license a product. • Milestones and similar payments, dependent upon the achievement of agreed objectives or
performance targets. • Royalties on Roche’s aggregate sales of that product.
Manufacturing Agreements: Genentech has agreed, in general, to manufacture for and supply to Roche its clinical requirements at cost and its commercial requirements on a cost plus basis. Roche has the right to manufacture Genentech’s products under certain circumstances. In July 2006, Roche and Genentech signed two new product supply agreements. The Umbrella Manufacturing Supply Agreement (or “Umbrella Agreement”) supersedes any existing product supply agreements. Under this agreement, Roche has agreed to purchase specified amounts of Herceptin and Avastin through 2012 and, on a perpetual basis, either party may order other collaboration products from the other, including Herceptin and Avastin after 2012. The Short-Term Supply Agreement (or “Short-Term Agreement”) supplements the terms of the Umbrella Agreement. Under this agreement, Roche has agreed to purchase specified amounts of Herceptin, Avastin and MabThera/Rituxan through 2008. Research Collaboration Agreement: In April 2004, Roche and Genentech entered into a research collaboration agreement that outlines the process by which the parties may agree to conduct and share in the costs of joint research on certain molecules. The agreement further outlines how development and commercialisation efforts will be coordinated with respect to select molecules, including the financial provisions for a number of different development and commercialisation scenarios undertaken by either or both parties. Tax Sharing Agreement: Roche and Genentech have a tax sharing agreement that relates to the US state and local tax returns in which they are consolidated or combined. Genentech calculates its tax liability or refund with the Group for these state and local jurisdictions as if Genentech were a stand-alone entity. Differences between IFRS and US GAAP Due to certain consolidation entries and differences in the requirements of International Financial Reporting Standards (IFRS) and US GAAP, there are differences between Genentech’s stand-alone financial results on a US GAAP basis and the financial results of Genentech as consolidated by the Roche Group in accordance with IFRS.

Page 350
48
Reconciliation of Genentech results
2007 2006 USD
millions CHF
millions USD
millions CHF
millions Operating income (US GAAP basis) 4,229 3,152 - recurring redemption and Tanox costs 126 105 - equity compensation plan expenses (US GAAP basis) 403 309 - Tanox acquisition accounting (US GAAP basis) (44) - - special litigation items 54 54 Operating income (non-US GAAP basis) 4,768 3,620 Add (deduct) differences and consolidation entries - add back redemption costs (126) (105) - equity compensation plan expenses (IFRS basis) (387) (407) - capitalised in-process research and development 204 104 - other differences and consolidation entries (45) (19) Operating profit (IFRS basis) 4,414 5,298 3,193 4,002 Add (deduct) non-operating items (IFRS basis) - financial income, financing costs and consolidation entries 172 161 - income taxes (2,189) (1,730) Net income (IFRS basis) 3,281 2,433 Minority interest percentage (average during year) 44.2% 44.3% Income applicable to minority interest (IFRS basis) 1,451 1,077
Translated at 1 USD = 1.20 CHF (2006: 1 USD = 1.25 CHF).
Effective 1 January 2005 the Group implemented IFRS 2 ‘Share-based Payment’ in its IFRS financial statements. Amongst other matters, the standard requires that the fair value of all equity compensation plans awarded to employees be estimated at grant date and recorded as an expense over the vesting period. The expense is charged against the appropriate income statement heading. The standard also requires retrospective application, within certain transitional requirements. In 2007 a pre-tax expense of 387 million US dollars or 465 million Swiss francs relating to plans at Genentech has been recorded (2006: 407 million US dollars or 510 million Swiss francs). Effective 1 January 2006 Genentech implemented US Statement of Financial Accounting Standards No. 123R – ‘Share-Based Payment’ (FAS 123R) in its US GAAP financial statements. Amongst other matters, this requires that companies reporting under US GAAP recognise compensation expenses for such plans. Due to the different dates of first application, measurement requirements and transitional arrangements of FAS 123R and IFRS 2, the expenses recorded by Genentech in its US GAAP financial statements for equity compensation plans are not the same as the expenses recorded in the Roche Group IFRS financial statements for these same plans. In 2005 the Group implemented IAS 38 (revised) ‘Intangible Assets’ in its IFRS financial statements. Amongst other matters, the revised standard typically results in more intangible assets being recognised from in-licensing arrangements and similar research and development alliances. In Genentech’s US GAAP financial statements such expenditure would usually be recorded as research and development expenses. There are other differences between IFRS and US GAAP, but these have a relatively minor impact. Genentech share repurchases On 20 April 2007 Genentech’s Board of Directors approved an extension of the existing stock repurchase programme authorising Genentech to repurchase up to 100 million shares of Genentech’s common stock for a total of 8 billion US dollars through 30 June 2008. Since the programme’s inception, Genentech have repurchased approximately 75 million shares for a total of approximately 5.4 billion US dollars. During 2007 Genentech repurchased common stock worth 1,044 million US dollars or 1,254 million Swiss francs (2006: 996 million US dollars or 1,248 million Swiss francs).

Page 351
49
Genentech prepaid share repurchase program: On 15 November 2007 Genentech entered into a prepaid share repurchase arrangement with a financial institution for 300 million US dollars under which Genentech’s shares will be purchased in the open market by the financial institution from 1 January 2008 through 26 March 2008. The prepaid amount has been recorded against equity as at 31 December 2007. For the purposes of the Group’s consolidation, minority interests are calculated assuming that an equivalent number of shares have been repurchased based on the amount of the prepayment and the Genentech share price at each month end. Accordingly the Roche Group’s ownership at 31 December 2007 is estimated at 56.1% for the purposes of the consolidation of the financial statements. Manufacturing agreements with Lonza Effective 8 December 2006 Genentech sold its wholly-owned subsidiary Genentech España, including the manufacturing facility in Porriño, Spain, to Lonza Group Ltd. (‘Lonza’) for 150 million US dollars. In 2006 11 million US dollars were received in cash and the remaining balance will be received from Lonza in a series of payments over the following three years. As part of this agreement Genentech has entered into a short-term supply contract with Lonza for the production of Avastin using a portion of the production capacity of the Porriño facility. Loss on divestment of Genentech España in millions of CHF 2006Consideration - cash 14 - present value of unsecured receivables from Lonza 169Total consideration 183 Net assets disposed - property, plant and equipment 12 (192) - other net assets (7)Loss on divestment (16)
At the same time Genentech has entered into a supply agreement for the manufacture of certain Genentech products at Lonza’s facility under construction in Singapore which is currently expected to receive US Food and Drug Administration (‘FDA’) licensure in 2010. Genentech is committed to fund the pre-commissioning production qualification costs at this facility and, upon FDA licensure, Genentech is committed to purchase 100% of products successfully manufactured at the facility for a period of three years after commissioning of the facility. The estimated total cost of these pre- and post-commissioning commitments is approximately 440 million US dollars. Genentech has also received an exclusive option to purchase the Lonza Singapore facility during the period from 2007 up to one year after FDA licensure for a purchase price of 290 million US dollars. Regardless of whether the purchase option is exercised, Genentech will be obliged to make a milestone payment of 70 million US dollars if certain performance milestones are met at the facility being constructed. For accounting purposes, due to the nature of the supply agreement and Genentech’s involvement in the construction of the buildings, Genentech is considered to be the owner of the assets during the construction period even though the funds to construct the building shell and some infrastructure costs are paid by Lonza. Genentech has also entered into a loan agreement with Lonza to advance up to 299 million US dollars to Lonza for the construction of the Singapore facility, the majority of which is not expected to be advanced until 2008. The majority of these funds will not be advanced to Lonza unless and until Lonza’s securitisation obligations for such are mutually agreed upon by the parties. If Genentech exercises its option to purchase the facility then any outstanding advances may be offset against the purchase price. If Genentech does not exercise its purchase option then the advances may be offset against supply purchases. As at 31 December 2007, construction in progress totalling 182 million Swiss francs (2006: 24 million Swiss francs) has been capitalised and a corresponding net financing obligation totalling 155 million Swiss francs (2006: 24 million Swiss francs) has been recorded in ‘other non-current liabilities’.

Page 352
50
Leasing arrangements In December 2004 Genentech entered into a Master Lease Agreement with Slough SSF LLC (‘Slough’) for the development of property adjacent to Genentech’s South San Francisco site. The development includes a total of eight buildings, which are subject to separate agreements as contemplated by the Master Lease Agreement. Slough as the developer will construct the building shell for each building and Genentech will finish the interior of each building as laboratory or office space, as applicable. The construction of the first buildings was completed in 2006, at which point the lease term for those buildings was deemed to begin. Construction of the final buildings is expected to be completed during 2008. The lease term expires twelve years from the occupation of the final building. Genentech has two five-year renewal options for each building and has an option to purchase the various buildings at different dates between 2016 and 2020. Genentech also has a right of first refusal with respect to each building or the entire development should Slough consider selling part or all of the development. As at 31 December 2007, based on the status of the development to date, the total carrying value of property, plant and equipment from this agreement, including tenant improvements, was 275 million Swiss francs (2006: 228 million Swiss francs) and the carrying value of the leasing obligation was 305 million Swiss francs (2006: 219 million Swiss francs). Estimates of the total future minimum lease payments anticipated by the entire Master Lease Agreement are shown below. Estimated total future minimum lease payments under Slough leases in millions of CHF
Principal Ground lease
Interest Total minimum lease payments
Within one year 11 7 17 35 Between one and five years 74 33 63 170 More than five years 267 68 53 388 Total 352 108 133 593
Other matters Details of other Genentech matters are given in the following Notes:
• Acquisition of Tanox: Note 7 • Genentech legal cases: Note 25. • Genentech’s equity compensation plans: Note 11. • Genentech’s Senior Notes and Commercial Paper Program: Note 27.
4. Chugai Effective 1 October 2002 the Roche Group and Chugai completed an alliance to create a leading research-driven Japanese pharmaceutical company, which was formed by the merger of Chugai and Roche’s Japanese pharmaceuticals subsidiary, Nippon Roche. The merged company, known as Chugai, is a fully consolidated subsidiary of the Group. At 31 December 2007 the Group’s interest in Chugai was 51.5% (2006: 50.6%). The common stock of Chugai is publicly traded and is listed on the Tokyo Stock Exchange under the stock code ‘TSE:4519’. Chugai prepares financial statements in conformity with accounting principles generally accepted in Japan (JGAAP). These are filed on a quarterly basis with the Tokyo Stock Exchange. Relationship with Chugai Chugai has entered into certain agreements with Roche, which are discussed below: Basic Alliance Agreement: As part of the Basic Alliance Agreement signed in December 2001, Roche and Chugai entered into certain arrangements covering the future operation and governance of Chugai. Amongst other matters these cover the following areas:
• The structuring of the alliance. • Roche’s rights as a shareholder. • Roche’s rights to nominate members of Chugai’s Board of Directors. • Certain limitations to Roche’s ability to buy or sell Chugai’s common stock.

Page 353
51
Chugai issues additional shares of common stock in connection with its convertible debt and equity compensation plans, and may issue additional shares for other purposes, which affects Roche’s percentage ownership interest. The Basic Alliance Agreement provides, amongst other matters, that Chugai will guarantee Roche’s right to maintain its shareholding percentage in Chugai at not less than 50.1%. Licensing Agreements: Under the Japan Umbrella Rights Agreement signed in December 2001, Chugai has exclusive rights to market Roche’s pharmaceutical products in Japan. Chugai also has first right of refusal on the development and marketing in Japan of all development compounds advanced by Roche. Under the Rest of the World Umbrella Rights Agreement signed in May 2002, Roche has the right of first refusal on the development and marketing of Chugai’s development compounds in markets outside Japan, excluding South Korea, if Chugai decides that it requires a partner for such activities. Further to these agreements, Roche and Chugai have signed a series of separate agreements for certain specific products. Depending on the specific circumstances and the terms of the agreement, this may result in payments on an arm’s-length basis between Roche and Chugai, for any or all of the following matters:
• Upfront payments, if a right of first refusal to license a product is exercised. • Milestone payments, dependent upon the achievement of agreed performance targets. • Royalties on future product sales.
These specific product agreements may also cover the manufacture and supply of the respective products to meet the other party’s clinical and/or commercial requirements on an arm’s-length basis. Research Collaboration Agreements: Roche and Chugai have entered into research collaboration agreements in the areas of small molecule synthetic drug research and biotechnology based drug discovery. Differences between IFRS and JGAAP Due to certain consolidation entries and differences in the requirements of International Financial Reporting Standards (IFRS) and JGAAP, there are differences between Chugai’s stand-alone financial results on a JGAAP basis and the financial results of Chugai as consolidated by the Roche Group in accordance with IFRS. The acquisition by Roche of a 50.1% interest in Chugai is treated as a business combination for IFRS. For JGAAP the alliance is treated as a merger between Chugai and Nippon Roche. Therefore the JGAAP results of Chugai do not include the goodwill and fair value adjustments that are recorded in Roche’s results, and which are quantified in the table below. Moreover the acquisition accounting only includes Roche’s 50.1% of these fair value adjustments and therefore the impact of these on net income needs to be added back in the minority interest calculations in Roche’s IFRS results. In Roche’s IFRS results, depreciation on property, plant and equipment is calculated using the straight-line method. In Chugai’s JGAAP results the reducing balance method is used. Additionally certain income and expenses, notably some restructuring costs, are required by JGAAP to be reported as extraordinary items. In Chugai’s JGAAP results extraordinary items are reported below the operating profit line. In Roche’s IFRS results such items are normally included as part of operating profit and are not treated as extraordinary or exceptional items. Restructuring costs were 12 million Swiss francs (2006: 4 million Swiss francs). There are other differences between IFRS and JGAAP, but these have a relatively minor impact.
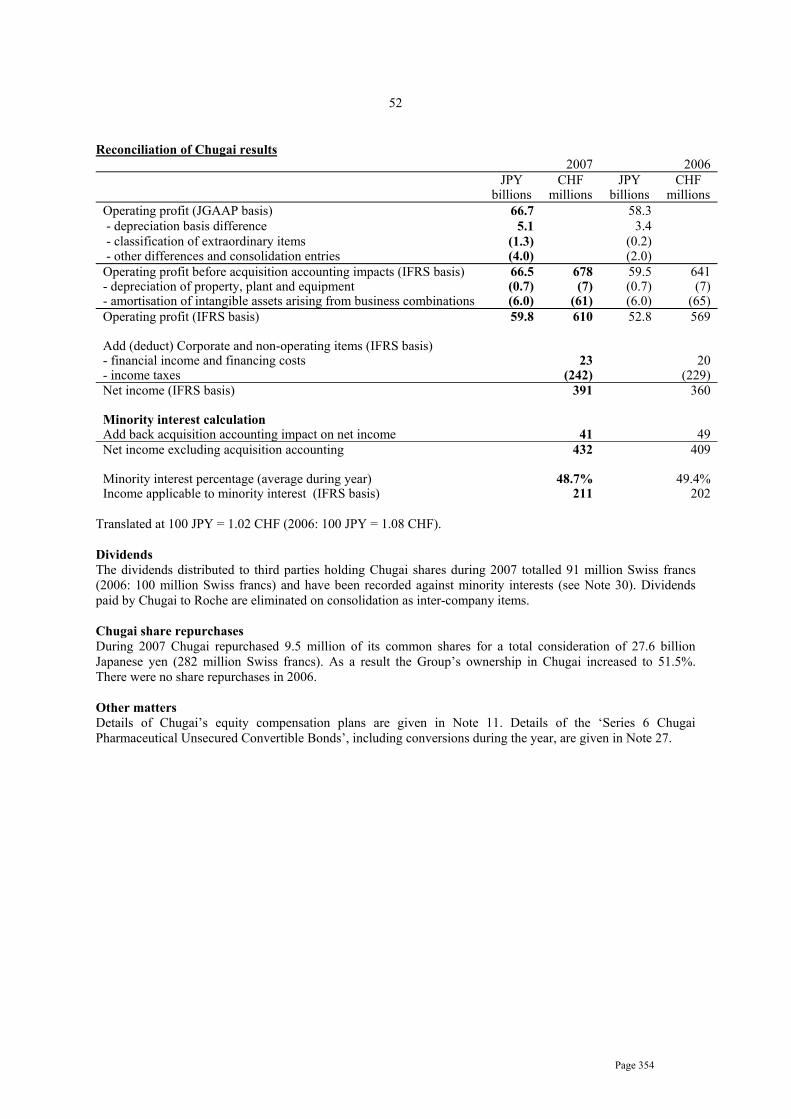
Page 354
52
Reconciliation of Chugai results
2007 2006 JPY
billions CHF
millions JPY
billions CHF
millions Operating profit (JGAAP basis) 66.7 58.3 - depreciation basis difference 5.1 3.4 - classification of extraordinary items (1.3) (0.2) - other differences and consolidation entries (4.0) (2.0) Operating profit before acquisition accounting impacts (IFRS basis) 66.5 678 59.5 641 - depreciation of property, plant and equipment (0.7) (7) (0.7) (7) - amortisation of intangible assets arising from business combinations (6.0) (61) (6.0) (65) Operating profit (IFRS basis) 59.8 610 52.8 569 Add (deduct) Corporate and non-operating items (IFRS basis) - financial income and financing costs 23 20 - income taxes (242) (229) Net income (IFRS basis) 391 360 Minority interest calculation Add back acquisition accounting impact on net income 41 49 Net income excluding acquisition accounting 432 409 Minority interest percentage (average during year) 48.7% 49.4% Income applicable to minority interest (IFRS basis) 211 202
Translated at 100 JPY = 1.02 CHF (2006: 100 JPY = 1.08 CHF). Dividends The dividends distributed to third parties holding Chugai shares during 2007 totalled 91 million Swiss francs (2006: 100 million Swiss francs) and have been recorded against minority interests (see Note 30). Dividends paid by Chugai to Roche are eliminated on consolidation as inter-company items. Chugai share repurchases During 2007 Chugai repurchased 9.5 million of its common shares for a total consideration of 27.6 billion Japanese yen (282 million Swiss francs). As a result the Group’s ownership in Chugai increased to 51.5%. There were no share repurchases in 2006. Other matters Details of Chugai’s equity compensation plans are given in Note 11. Details of the ‘Series 6 Chugai Pharmaceutical Unsecured Convertible Bonds’, including conversions during the year, are given in Note 27.
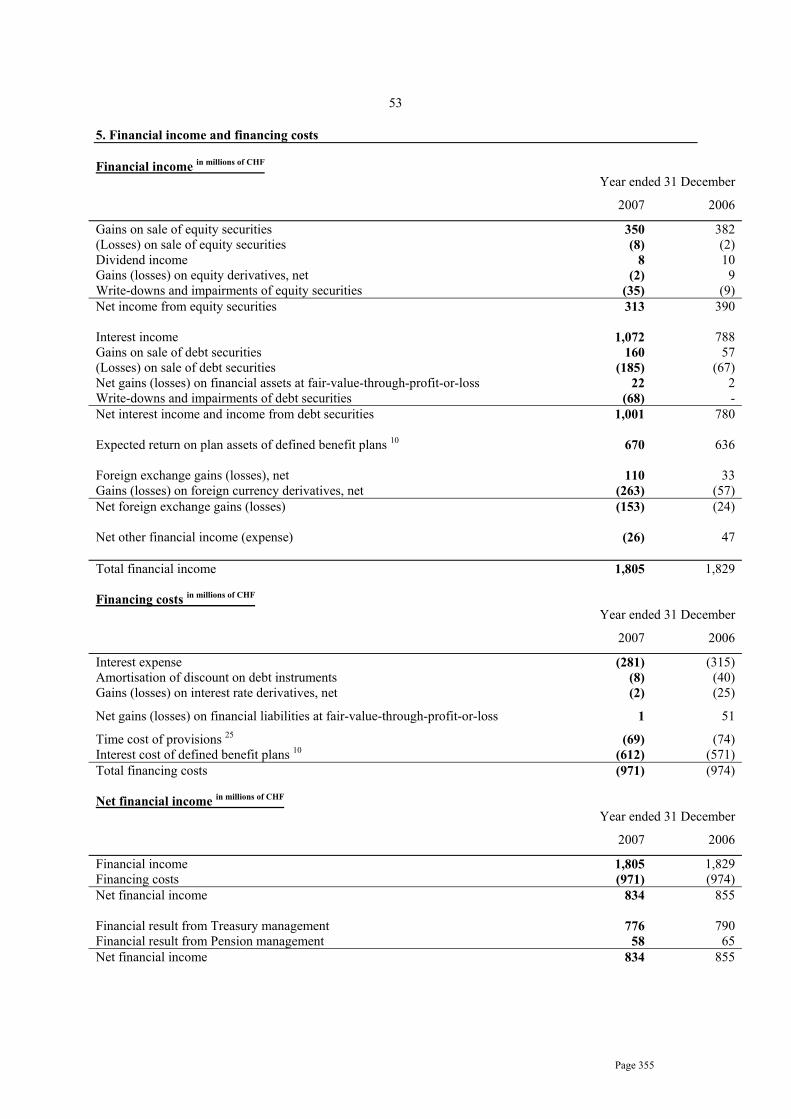
Page 355
53
5. Financial income and financing costs Financial income in millions of CHF
Year ended 31 December
2007 2006
Gains on sale of equity securities 350 382 (Losses) on sale of equity securities (8) (2) Dividend income 8 10 Gains (losses) on equity derivatives, net (2) 9 Write-downs and impairments of equity securities (35) (9) Net income from equity securities 313 390 Interest income 1,072 788 Gains on sale of debt securities 160 57 (Losses) on sale of debt securities (185) (67) Net gains (losses) on financial assets at fair-value-through-profit-or-loss 22 2 Write-downs and impairments of debt securities (68) - Net interest income and income from debt securities 1,001 780 Expected return on plan assets of defined benefit plans 10 670 636 Foreign exchange gains (losses), net 110 33 Gains (losses) on foreign currency derivatives, net (263) (57) Net foreign exchange gains (losses) (153) (24) Net other financial income (expense) (26) 47 Total financial income 1,805 1,829 Financing costs in millions of CHF
Year ended 31 December
2007 2006
Interest expense (281) (315) Amortisation of discount on debt instruments (8) (40) Gains (losses) on interest rate derivatives, net (2) (25)
Net gains (losses) on financial liabilities at fair-value-through-profit-or-loss 1 51
Time cost of provisions 25 (69) (74) Interest cost of defined benefit plans 10 (612) (571) Total financing costs (971) (974) Net financial income in millions of CHF
Year ended 31 December
2007 2006
Financial income 1,805 1,829 Financing costs (971) (974) Net financial income 834 855 Financial result from Treasury management 776 790 Financial result from Pension management 58 65 Net financial income 834 855

Page 356
54
Net gains (losses) on financial liabilities at fair-value-through-profit-or-loss includes the change in the fair value that is attributable to changes in the liabilities’ credit risk component. This is calculated by comparing the difference between the present value of the future cash flows on the bonds, discounted by using a swap yield curve based on LIBOR, and the market prices of the bonds. Due to a widening of the credit spread during 2007 relative to the swap yield curve, the change in fair value that is attributable to changes in the liabilities’ credit risk component was a gain of 4 million Swiss francs (2006: zero). The cumulative change in fair value that is attributable to the change in credit risk since the issuance of the instruments was a gain of 21 million Swiss francs (2006: gain of 17 million Swiss francs). Interest expense on liabilities at fair-value-through-profit-or-loss was 106 million Swiss francs (2006: 106 million Swiss francs).
6. Income taxes Income tax expenses in millions of CHF
2007 2006 Current income taxes 4,976 3,436 Adjustments recognised for current tax of prior periods (83) (24) Deferred income taxes (1,026) 24 Total charge for income taxes 3,867 3,436
Since the Group operates internationally, it is subject to income taxes in many different tax jurisdictions. The Group calculates its average expected tax rate as a weighted average of the tax rates in the tax jurisdictions in which the Group operates. This rate changes from year to year due to changes in the mix of the Group’s taxable income and changes in local tax rates. In 2007 the rate reduced by 2.7 percentage points compared to 2006. This reduction is mainly the result of a relatively lower proportion of the Group’s pre-tax income arising in tax jurisdictions with higher tax rates, together with the Group’s ongoing efforts to optimise its tax structure. The Group’s effective tax rate can be reconciled to the Group’s average expected tax rate as follows: Reconciliation of the Group’s effective tax rate
2007 2006 Average expected tax rate 23.7% 26.4% Tax effect of - Utilisation of previously unrecognised tax losses -0.0% -0.2% - Non-taxable income/non-deductible expenses +0.2% -0.1% - Genentech equity compensation plans +0.9% +0.7% - Other differences +0.5% +0.5% Group’s effective tax rate 25.3% 27.3%
Income tax assets (liabilities) in millions of CHF
2007 2006 Current income taxes - Assets 263 258 - Liabilities (2,215) (2,034) Net current income tax assets (liabilities) (1,952) (1,776) Deferred income taxes - Assets 1,317 1,935 - Liabilities (1,481) (2,310) Net deferred income tax assets (liabilities) (164) (375)
Deferred income tax assets are recognised for tax loss carry forwards only to the extent that realisation of the related tax benefit is probable. The Group has unrecognised tax losses, including valuation allowances, as follows:

Page 357
55 Unrecognised tax losses: expiry in millions of CHF
2007 2006 Amount Applicable tax
rate Amount Applicable tax
rate Within one year 42 35% 1 25% Between one and five years 96 25% 91 30% More than five years 176 32% 89 30% Total unrecognised tax losses 314 30% 181 30%
Deferred income tax liabilities have not been established for the withholding tax and other taxes that would be payable on the unremitted earnings of certain foreign subsidiaries, as such amounts are currently regarded as permanently reinvested. These unremitted earnings totalled 38.8 billion Swiss francs at 31 December 2007 (2006: 33.6 billion Swiss francs). The deferred income tax assets and liabilities and the deferred income tax charges (credits) are attributable to the following items: Deferred income taxes: movements in recognised net assets (liabilities) in millions of CHF
Property, plant and equipment, and intangible
assets
Other temporary
differences
Total
Year ended 31 December 2006 Net deferred income tax asset (liability) at 1 January 2006
(3,028)
2,117 (911)
(Charged) credited to the income statement 231 (252) (21) (Charged) credited to equity from other recognised gains and losses 28
-
(135) (135)
(Charged) credited to equity from equity compensation plans and other transactions with shareholders
-
(11) (11)
Currency translation effects and other 80 623 703 Net deferred income tax asset (liability) at 31 December 2006
(2,717)
2,342 (375)
Year ended 31 December 2007 Net deferred income tax asset (liability) at 1 January 2007
(2,717)
2,342 (375)
BioVeris acquisition 7 (41) 41 - Tanox acquisition 7 (282) 41 (241) Other business combinations 7 (98) 54 (44) (Charged) credited to the income statement 309 717 1,026 (Charged) credited to equity from other recognised gains and losses 28
-
(267) (267)
(Charged) credited to equity from equity compensation plans and other transactions with shareholders
-
(209) (209)
Currency translation effects and other 90 (144) (54) Net deferred income tax asset (liability) at 31 December 2007
(2,739)
2,575 (164)
7. Business combinations Acquisitions – 2007 BioVeris: Effective 26 June 2007 the Group acquired a 100% controlling interest in BioVeris Corporation (‘BioVeris’), a publicly owned US company that had been listed on the NASDAQ under the symbol ‘BIOV’. BioVeris is a healthcare and biosecurity company based in Gaithersburg, Maryland, that specialises in developing proprietary technologies in diagnostics. BioVeris is now reported as part of the Diagnostics operating segment. The purchase consideration was 745 million Swiss francs, which consisted of 741 million Swiss francs of cash and 4 million Swiss francs of directly attributable costs. This has been allocated as follows:

Page 358
56
BioVeris acquisition: net assets acquired in millions of CHF Carrying value
prior to acquisition Fair value
adjustments Carrying value
upon acquisition Property, plant and equipment 5 - 5 Intangible assets - Product intangibles: in use 16 101 117 Deferred income taxes 8 (8) - Cash 6 - 6 Other net assets (liabilities) 77 - 77 Net identifiable assets (liabilities) 112 93 205 Goodwill 540 Purchase consideration 745 Goodwill represents assets that cannot be recognised separately and measured reliably and synergies that can be obtained from the Group’s existing electrochemiluminescence (ECL) immunochemistry business. It also represents the premium paid over the traded market price to obtain control of the business. Following the acquisition, restructuring expenses of 29 million Swiss francs were incurred. These are reported within the operating result of the Diagnostics Division. Tanox: Effective 2 August 2007, Genentech acquired a 100% controlling interest in Tanox, Inc. (‘Tanox’), a publicly owned US company that had been listed on the NASDAQ under the symbol ‘TNOX’. Tanox is a biotechnology company based in Houston, Texas, that specialises in the discovery and development of biotherapeutics based on monoclonal antibody technology. Genentech and Tanox have been working together in collaboration with Novartis since 1996 to develop and commercialise Xolair. The purchase consideration was 1,124 million Swiss francs, which consisted of 1,114 million Swiss francs of cash and 10 million Swiss francs of directly attributable costs. This has been allocated as follows: Tanox acquisition: net assets acquired in millions of CHF Carrying value
prior to acquisition Fair value
adjustments Carrying value
upon acquisition Property, plant and equipment 13 - 13 Intangible assets - Product intangibles: in use - 613 613 - Product intangibles: not available for use - 93 93 Deferred income taxes 9 (250) (241) Cash 120 - 120 Marketable securities 123 - 123 Other net assets (liabilities) 19 32 51 Net identifiable assets (liabilities) 284 488 772 Goodwill 352 Purchase consideration 1,124 Goodwill represents assets that cannot be recognised separately and measured reliably, such as early-stage research projects. It also represents the premium paid over the traded market price to obtain control of the business. Other acquisitions: Effective 28 March 2007 the Group acquired a 100% controlling interest in Therapeutic Human Polyclonals, Inc. ('THP'), a privately owned US biotechnology company based in California and Germany. THP is reported as part of the Roche Pharmaceuticals operating segment. The purchase consideration paid was 69 million Swiss francs in cash.
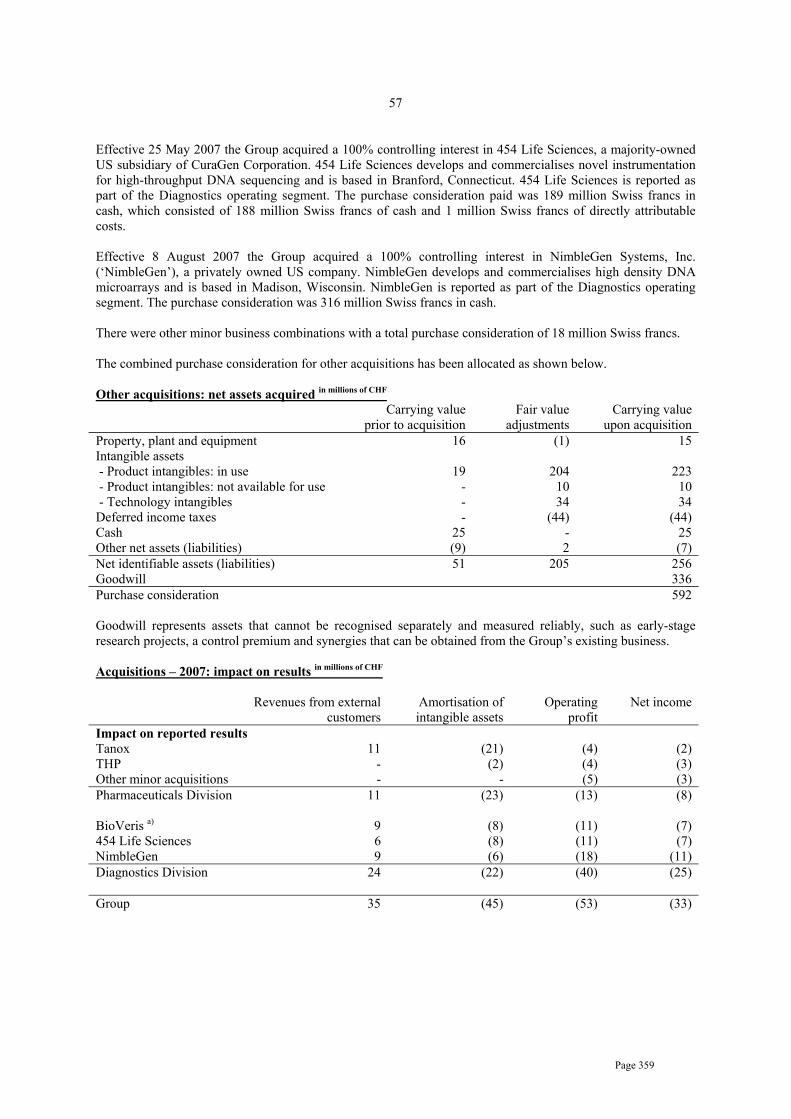
Page 359
57
Effective 25 May 2007 the Group acquired a 100% controlling interest in 454 Life Sciences, a majority-owned US subsidiary of CuraGen Corporation. 454 Life Sciences develops and commercialises novel instrumentation for high-throughput DNA sequencing and is based in Branford, Connecticut. 454 Life Sciences is reported as part of the Diagnostics operating segment. The purchase consideration paid was 189 million Swiss francs in cash, which consisted of 188 million Swiss francs of cash and 1 million Swiss francs of directly attributable costs. Effective 8 August 2007 the Group acquired a 100% controlling interest in NimbleGen Systems, Inc. (‘NimbleGen’), a privately owned US company. NimbleGen develops and commercialises high density DNA microarrays and is based in Madison, Wisconsin. NimbleGen is reported as part of the Diagnostics operating segment. The purchase consideration was 316 million Swiss francs in cash. There were other minor business combinations with a total purchase consideration of 18 million Swiss francs. The combined purchase consideration for other acquisitions has been allocated as shown below. Other acquisitions: net assets acquired in millions of CHF Carrying value
prior to acquisition Fair value
adjustments Carrying value
upon acquisition Property, plant and equipment 16 (1) 15 Intangible assets - Product intangibles: in use 19 204 223 - Product intangibles: not available for use - 10 10 - Technology intangibles - 34 34 Deferred income taxes - (44) (44) Cash 25 - 25 Other net assets (liabilities) (9) 2 (7) Net identifiable assets (liabilities) 51 205 256 Goodwill 336 Purchase consideration 592 Goodwill represents assets that cannot be recognised separately and measured reliably, such as early-stage research projects, a control premium and synergies that can be obtained from the Group’s existing business. Acquisitions – 2007: impact on results in millions of CHF
Revenues from external
customers Amortisation of intangible assets
Operating profit
Net income
Impact on reported results Tanox 11 (21) (4) (2) THP - (2) (4) (3) Other minor acquisitions - - (5) (3) Pharmaceuticals Division 11 (23) (13) (8) BioVeris a) 9 (8) (11) (7) 454 Life Sciences 6 (8) (11) (7) NimbleGen 9 (6) (18) (11) Diagnostics Division 24 (22) (40) (25) Group 35 (45) (53) (33)
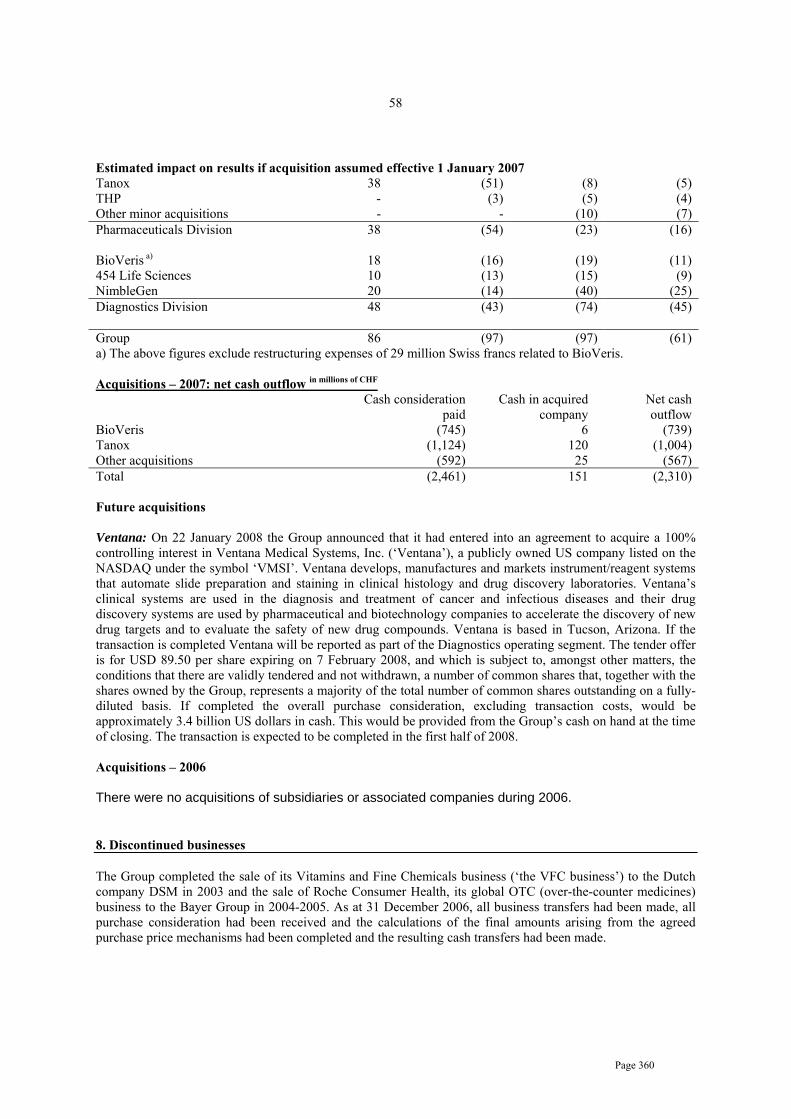
Page 360
58
Estimated impact on results if acquisition assumed effective 1 January 2007 Tanox 38 (51) (8) (5) THP - (3) (5) (4) Other minor acquisitions - - (10) (7) Pharmaceuticals Division 38 (54) (23) (16) BioVeris a) 18 (16) (19) (11) 454 Life Sciences 10 (13) (15) (9) NimbleGen 20 (14) (40) (25) Diagnostics Division 48 (43) (74) (45) Group 86 (97) (97) (61) a) The above figures exclude restructuring expenses of 29 million Swiss francs related to BioVeris. Acquisitions – 2007: net cash outflow in millions of CHF Cash consideration
paid Cash in acquired
company Net cash outflow
BioVeris (745) 6 (739) Tanox (1,124) 120 (1,004) Other acquisitions (592) 25 (567) Total (2,461) 151 (2,310) Future acquisitions Ventana: On 22 January 2008 the Group announced that it had entered into an agreement to acquire a 100% controlling interest in Ventana Medical Systems, Inc. (‘Ventana’), a publicly owned US company listed on the NASDAQ under the symbol ‘VMSI’. Ventana develops, manufactures and markets instrument/reagent systems that automate slide preparation and staining in clinical histology and drug discovery laboratories. Ventana’s clinical systems are used in the diagnosis and treatment of cancer and infectious diseases and their drug discovery systems are used by pharmaceutical and biotechnology companies to accelerate the discovery of new drug targets and to evaluate the safety of new drug compounds. Ventana is based in Tucson, Arizona. If the transaction is completed Ventana will be reported as part of the Diagnostics operating segment. The tender offer is for USD 89.50 per share expiring on 7 February 2008, and which is subject to, amongst other matters, the conditions that there are validly tendered and not withdrawn, a number of common shares that, together with the shares owned by the Group, represents a majority of the total number of common shares outstanding on a fully-diluted basis. If completed the overall purchase consideration, excluding transaction costs, would be approximately 3.4 billion US dollars in cash. This would be provided from the Group’s cash on hand at the time of closing. The transaction is expected to be completed in the first half of 2008. Acquisitions – 2006 There were no acquisitions of subsidiaries or associated companies during 2006.
8. Discontinued businesses
The Group completed the sale of its Vitamins and Fine Chemicals business (‘the VFC business’) to the Dutch company DSM in 2003 and the sale of Roche Consumer Health, its global OTC (over-the-counter medicines) business to the Bayer Group in 2004-2005. As at 31 December 2006, all business transfers had been made, all purchase consideration had been received and the calculations of the final amounts arising from the agreed purchase price mechanisms had been completed and the resulting cash transfers had been made.

Page 361
59
Accordingly, effective from 1 January 2007, the Group’s management has concluded that the remaining residual balances from both transactions should be considered as part of the Group’s continuing businesses and should be reported in the ‘Corporate’ segment. As at 1 January 2007 these balances consisted of provisions and other non-current liabilities totalling 183 million Swiss francs, which primarily relate to indemnities and guarantees in respect of litigation and environmental matters. The impact on the result of the ‘Corporate’ segment in 2007 was an income of 14 million Swiss francs relating to the release of certain accruals that were no longer required. The 2006 results include 20 million Swiss francs of profit from discontinued businesses. This consisted of income of 28 million Swiss francs relating to the release of certain accruals and provisions that were no longer required less 5 million Swiss francs of expenses for the unwinding of the discounted provisions and 3 million Swiss francs of income tax expenses. This had an impact of 0.02 CHF on earnings per share and non-voting equity security (basic and diluted).
9. Employee benefits Employee remuneration in millions of CHF
2007 2006 Wages and salaries 8,180 7,632 Social security costs 943 891 Defined contribution post-employment plans 259 214 Operating expenses for defined benefit post-employment plans 10 370 348 Equity compensation plans 11 608 690 Other employee benefits 465 406 Employees’ remuneration included in operating results 10,825 10,181 Expected return on plan assets for defined benefit post-employment plans 10 (670) (636) Interest cost for defined benefit post-employment plans 10 612 571 Total employees’ remuneration 10,767 10,116
Other employee benefits consist mainly of life insurance schemes and certain other insurance schemes providing medical coverage and other long-term and short-term disability benefits. The charges for employee benefits in the operating results are included in the relevant expenditure line by function. The expected return on plan assets and interest costs from defined benefit plans are included as part of financial income and financing costs, respectively (see Note 5).
10. Pensions and other post-employment benefits The Group’s objective is to provide attractive and competitive post-employment benefits to employees, while at the same time ensuring that the various plans are appropriately financed and managing any potential impacts on the Group's long-term financial position. Most employees are covered by pension plans sponsored by Group companies. The nature of such plans varies according to legal regulations, fiscal requirements and economic conditions of the countries in which the employees are employed. Other post-employment benefits consist mostly of post-retirement healthcare and life insurance schemes, principally in the United States. Post-employment benefit plans are classified for IFRS as ‘defined contribution plans’ if the Group pays fixed contributions into a separate fund or to a third-party financial institution and will have no further legal or constructive obligation to pay further contributions. All other plans are classified as ‘defined benefit plans’, even if the Group’s potential obligation is relatively minor or has a relatively remote possibility of arising. Consequently most of the Group’s post-employment benefit plans are classified as ‘defined benefit plans’ for the purpose of these financial statements.

Page 362
60
Defined contribution plans Defined contribution plans typically consist of payments by employees and by the Group to funds administered by third parties. Payments by the Group were 259 million Swiss francs (2006: 214 million Swiss francs). No assets or liabilities are recognised in the Group’s balance sheet in respect of such plans, apart from regular prepayments and accruals of the contributions withheld from employees’ wages and salaries and of the Group’s contributions. Defined benefit plans The Group’s major defined benefit plans are located in Switzerland, the United States, Germany, the United Kingdom and Japan. Plans are usually established as trusts independent of the Group and are funded by payments from the Group and by employees. In some cases, notably for the major defined benefit plans in Germany, the plan is unfunded and the Group pays pensions to retired employees directly from its own financial resources. Current and past service costs are charged to the appropriate income statement heading within the operating results. Pension plan administration and funding is overseen at a corporate level, and any settlement gains and losses resulting from changes in funding arrangements are reported as general and administration expenses within the Corporate segment. The expected returns on plan assets and interest costs are charged to financial income and financing costs, respectively. Actuarial gains and losses are recorded directly in equity. The recognition of pension assets is limited to the total of the present value of any future refunds from the plans or reductions in future contributions to the plans and any cumulative unrecognised past service costs. Adjustments arising from the limit on the recognition of assets for defined benefit plans are recorded directly in equity. Defined benefit plans: expenses in millions of CHF
2007 2006 Pension
plans Other post-
employment benefit plans
Total Pension plans
Other post- employment benefit plans
Total
Current service cost 361 22 383 334 18 352Past service cost (2) - (2) (3) - (3)(Gain) loss on curtailment (11) - (11) - - -(Gain) loss on settlement - - - (1) - (1)Total operating expenses 348 22 370 330 18 348 Expected return on plan assets (630) (40) (670) (606) (30) (636)Interest cost 556 56 612 522 49 571Total financial (income) expense (74) 16 (58) (84) 19 (65) Total expense recognised in income statement 274 38 312
246 37 283
The funding of the Group’s various defined benefit plans is overseen at a corporate level. Qualified independent actuaries carry out valuations on a regular basis and for major plans annually as at the balance sheet date. For funded plans, which are usually trusts independent of the Group’s finances, the net asset/liability recognised on the Group’s balance sheet corresponds to the over/under funding of the plan, adjusted for unrecognised past service costs. For unfunded plans, where the Group meets the pension obligations directly from its own financial resources, a liability for the defined benefit obligation is recorded in the Group’s balance sheet. Pension assets and liabilities in different defined benefit plans are not offset unless the Group has a legally enforceable right to use the surplus in one plan to settle obligations in the other plan. Amounts recognised in the balance sheet for post-employment benefits are predominantly non-current and are reported in non-current assets and liabilities.

Page 363
61
Defined benefit plans: funding status at 31 December in millions of CHF
2007 2006 Funded
plans Unfunded
plans Total Funded
plans Unfunded
plans Total
Fair value of plan assets 12,170 - 12,170 11,632 - 11,632 Defined benefit obligation (10,646) (3,344) (13,990) (11,002) (3,596) (14,598) Over (under) funding 1,524 (3,344) (1,820) 630 (3,596) (2,966) Unrecognised past service costs (23) (1) (24) (28) - (28) Limit on asset recognition (818) - (818) (396) - (396) Reimbursement rights 99 17 116 95 21 116 Net recognised asset (liability) 782 (3,328) (2,546) 301 (3,575) (3,274) Reported as - Defined benefit plans 1,034 - 1,034 831 - 831 - Reimbursement rights 99 17 116 95 21 116 Post-employment benefit assets 1,133 17 1,150 926 21 947 Post-employment benefit liabilities (351) (3,345) (3,696) (625) (3,596) (4,221) Net recognised asset (liability) 782 (3,328) (2,546) 301 (3,575) (3,274)
Further detailed information on plan assets and the defined benefit obligation is given below. Defined benefit plans: fair value of plan assets and reimbursement rights in millions of CHF
2007 2006 Fair
value of plan
assets
Reimbursement
rights
Total Fair value of
plan assets
Reimbursement
rights
Total
At 1 January 11,632 116 11,748 10,858 122 10,980 Expected return on plan assets 663 7 670 631 5 636 Actuarial gains (losses) 491 4 495 626 - 626 Currency translation effects and other (373) (10) (383) (246) (8) (254) Employer contributions 207 (1) 206 215 (3) 212 Employee contributions 45 - 45 42 - 42 Benefits paid - funded plans (494) - (494) (480) - (480) Past service cost - - - - - - Business combinations - - - - - - Curtailments - - - - - - Settlements (1) - (1) (14) - (14) At 31 December 12,170 116 12,286 11,632 116 11,748 2007 2006 Invested as - Shares and other equity instruments 6,055 5,819 - Bonds, debentures and other debt instruments 4,343 4,405 - Property 337 478 - Other assets 1,551 1,046 Total 12,286 11,748
Included within the fair value of plan assets are 340 thousand of the Group’s non-voting equity securities with a fair value of 66 million Swiss francs (2006: 311 thousand non-voting equity securities with a total fair value of 68 million Swiss francs).

Page 364
62
Defined benefit plans: defined benefit obligation in millions of CHF
2007 2006 Pension
plans Other post-
employment benefit plans
Total Pension plans
Other post- employment benefit plans
Total
At 1 January 13,572 1,026 14,598
13,540 1,066 14,606
Current service cost 361 22 383 334 18 352 Interest cost 556 56 612 522 49 571 Employee contributions 45 - 45 42 - 42 Actuarial (gains) losses (718) 35 (683) (159) 24 (135) Currency translation effects and other (235) (79) (314) (158) (76) (234) Benefits paid – funded plans (448) (46) (494) (427) (53) (480) Benefits paid – unfunded plans (134) (12) (146) (109) (2) (111) Past service cost 1 - 1 2 - 2 Business combinations - - - - - - Curtailments (11) - (11) - - - Settlements (1) - (1) (15) - (15) At 31 December 12,988 1,002 13,99
0 13,572 1,026 14,598
Of which - Funded plans 9,904 742 10,64
6 10,258 744 11,002
- Unfunded plans 3,084 260 3,344 3,314 282 3,596 Actuarial assumptions Actuarial assumptions are unbiased and mutually compatible estimates of variables that determine the ultimate cost of providing post-employment benefits. They are set on an annual basis by local management and actuaries and are subject to approval by corporate management and the Group’s actuaries. Actuarial assumptions consist of demographic assumptions on matters such as mortality and employee turnover, and financial assumptions on matters such as salary and benefit levels, interest rates, return on investments and costs of medical benefits. The Group operates defined benefit plans in many countries and the actuarial assumptions vary based upon local economic and social conditions. Demographic assumptions: The most significant demographic assumptions relate to mortality rates. The Group’s actuaries use mortality tables which take into account historic patterns and expected changes, such as further increases in longevity. The mortality tables used for the major schemes are:
• Germany: Heubeck tables 2005G. • Japan: National Census (No. 19 Life Table). • Switzerland: BVG 2005. • United Kingdom: non-pensioners - PA92C25 rated down one year. • United Kingdom: pensioners - PA92C10 rated down one year. • United States: RP2000 projected to 2010.
Rates of employee turnover, disability and early retirement are based on historical behaviour within Group companies. Financial assumptions: These are based on market expectations for the period over which the obligations are to be settled. The ranges of assumptions used in the actuarial valuations of the most significant plans, which are in countries with stable currencies and interest rates, are shown below.

Page 365
63
Defined benefit plans: financial actuarial assumptions
2007 2006 Weighted
average
Range Weighted
average
Range Discount rates 4.96% 2%-8% 4.30% 2%-9% Expected rates of return on plan assets 5.83% 1%-10% 5.82% 1%-9% Expected rates of salary increases 3.59% 0%-7% 3.60% 2%-6% Medical cost trend rate 9.39% 8%-10% 8.16% 7%-9%
Discount rates, which are used to calculate the discounted present value of the defined benefit obligation, are determined with reference to market yields on high quality corporate bonds, or government bonds in countries where there is not a deep market in corporate bonds. The currency and term of the bonds is consistent with the obligation being discounted. The interest cost included in the income statement is calculated by multiplying the discount rate by the defined benefit obligation. Expected returns on plan assets are based on market expectations of expected returns on the assets in funded plans over the duration of the related obligation. This takes into account the split of the plan assets between equities, bonds, property and other investments. The calculation includes assumptions concerning expected dividend and interest income, realised and unrealised gains on plan assets and taxes and administration costs borne by the plan. These are based on long-term market expectations and the actual performance is continually monitored by corporate management. Due to the long-term nature of the obligations, the assumptions used for matters such as returns on investments may not necessarily be consistent with recent historical patterns. The expected return on plan assets included in the income statement is calculated by multiplying the expected rate of return by the fair value of plan assets. The difference between the expected return and the actual return in any twelve month period is an actuarial gain/loss and is recorded directly to equity. The actual return on plan assets was 703 million Swiss francs (2006: 1,262 million Swiss francs). Expected rates of salary increases, which are used to calculate the defined benefit obligation and the current service cost included in the income statement, are based on the latest expectation and historical behaviour within Group companies. Medical cost trend rates are used to calculate the defined benefit obligation and the current service cost included in the income statement of post-employment medical plans. These take into account the benefits set out in the plan terms and expected future changes in medical costs. Since the Group’s major post-employment medical plans are for US employees, these rates are driven by developments in the United States. The effect of one percentage point increase or decrease in the medical cost trend rate is shown below. Defined benefit plans: sensitivity of medical cost trend rate in millions of CHF
2007 2006 +1% -1% +1% -1% Current service cost and interest cost 10 (9) 10 (7) Defined benefit obligation 60 (151) 125 (99)
Funding summary A five-year summary of the funding status of the Group’s defined benefit plans is shown in the table below.

Page 366
64
Defined benefit plans: summary of funding status in millions of CHF
2007 2006 2005 2004 2003 Funded plans - Fair value of plan assets 12,170 11,632 10,858 9,922 9,490 - Defined benefit obligation (10,646) (11,002) (10,976) (10,233) (9,785) - Over (under) funding 1,524 630 (118) (311) (295) Unfunded plans - Defined benefit obligation (3,344) (3,596) (3,630) (2,731) (2,626) Increase (decrease) in funding status arising from experience adjustments
- Fair value of plan assets 40 626 547 13 472 - Defined benefit obligation (235) (249) 49 77 (46) Increase (decrease) in funding status arising from changes in actuarial assumptions
- Fair value of plan assets - - - - - - Defined benefit obligation 1,295 384 (1,148) (636) (603)
Cash flows The Group incurred cash flows from its defined benefit plans as shown in the table below. Defined benefit plans: cash flows in millions of CHF
2007 2006 Employer contributions – funded plans (206) (212) Benefits paid – unfunded plans (146) (111) Total cash inflow (outflow) (352) (323)
Based on the most recent actuarial valuations, the Group expects that employer contributions for funded plans in 2008 will be approximately 190 million Swiss francs and benefits paid for unfunded plans will be approximately 142 million Swiss francs. Amounts recorded in equity The actuarial gains and losses recognised in the statement of recognised income and expense were gains of 1,178 million Swiss francs (2006: gains of 761 million Swiss francs). The total amount at 31 December 2007 was accumulated gains of 1,387 million Swiss francs (2006: gains of 209 million Swiss francs). In addition the recognition of pension assets is limited to the total of the present value of any future refunds from the plans or reductions in future contributions to the plans and the cumulative unrecognised past service costs. Adjustments arising from this limit on asset recognition are recorded directly in equity. In 2007 this adjustment was 422 million Swiss francs (2006: 396 million Swiss francs).
11. Employee stock options and other equity compensation benefits The Group operates several equity compensation plans, including separate plans at Genentech and Chugai. Effective 1 January 2005 the Group adopted IFRS 2: ‘Share-based Payment’. Amongst other matters, the standard requires that the fair value of all equity compensation plan awards granted to employees be estimated at grant date and recorded as an expense over the vesting period. The expense is charged against the appropriate income statement heading.
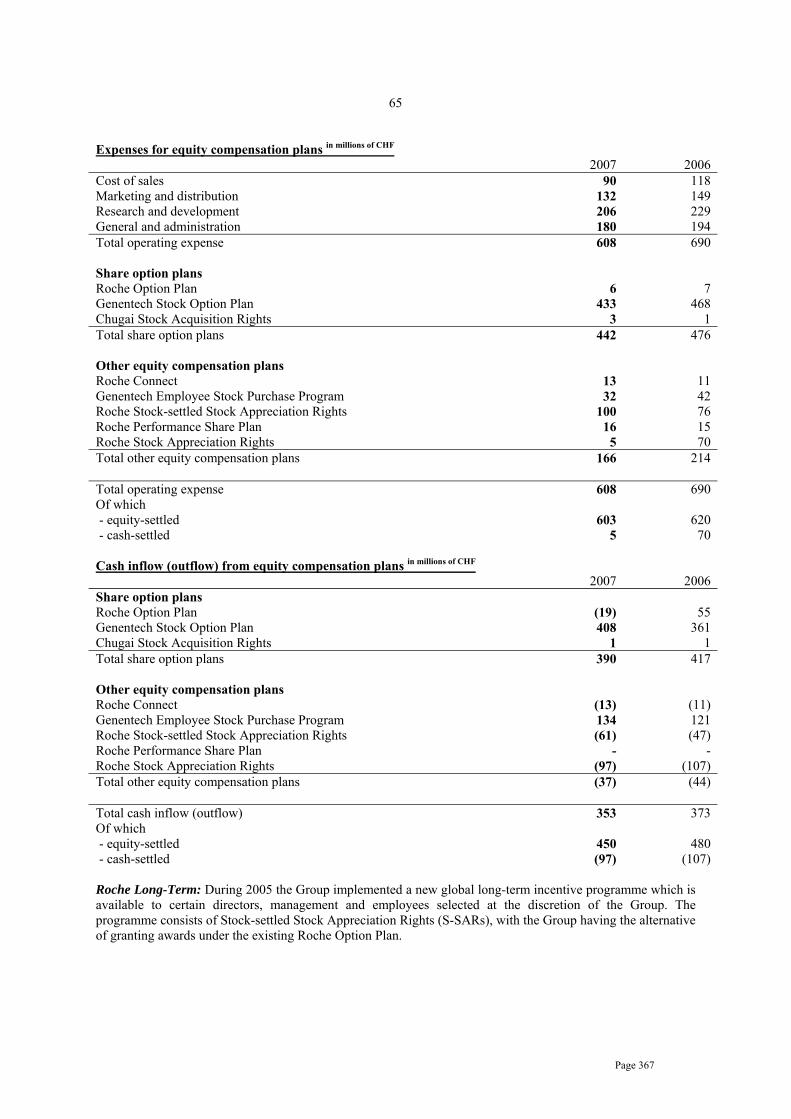
Page 367
65
Expenses for equity compensation plans in millions of CHF 2007 2006 Cost of sales 90 118 Marketing and distribution 132 149 Research and development 206 229 General and administration 180 194 Total operating expense 608 690 Share option plans Roche Option Plan 6 7 Genentech Stock Option Plan 433 468 Chugai Stock Acquisition Rights 3 1 Total share option plans 442 476 Other equity compensation plans Roche Connect 13 11 Genentech Employee Stock Purchase Program 32 42 Roche Stock-settled Stock Appreciation Rights 100 76 Roche Performance Share Plan 16 15 Roche Stock Appreciation Rights 5 70 Total other equity compensation plans 166 214 Total operating expense 608 690 Of which - equity-settled 603 620 - cash-settled 5 70 Cash inflow (outflow) from equity compensation plans in millions of CHF 2007 2006 Share option plans Roche Option Plan (19) 55 Genentech Stock Option Plan 408 361 Chugai Stock Acquisition Rights 1 1 Total share option plans 390 417 Other equity compensation plans Roche Connect (13) (11) Genentech Employee Stock Purchase Program 134 121 Roche Stock-settled Stock Appreciation Rights (61) (47) Roche Performance Share Plan - - Roche Stock Appreciation Rights (97) (107) Total other equity compensation plans (37) (44) Total cash inflow (outflow) 353 373 Of which - equity-settled 450 480 - cash-settled (97) (107) Roche Long-Term: During 2005 the Group implemented a new global long-term incentive programme which is available to certain directors, management and employees selected at the discretion of the Group. The programme consists of Stock-settled Stock Appreciation Rights (S-SARs), with the Group having the alternative of granting awards under the existing Roche Option Plan.

Page 368
66
Share option plans Roche Option Plan: Awards under this plan give employees the right to purchase non-voting equity securities at an exercise price specified at the grant date. The options, which are non-tradable equity-settled awards, have a seven-year duration and vest on a phased basis over three years, subject to continued employment. The Group covers such obligations by purchasing non-voting equity securities or derivatives thereon (see Note 28). With the introduction of Roche Long-Term in 2005, the number of options granted under the Roche Option Plan was significantly reduced, as most eligible employees now receive Roche Stock-settled Stock Appreciation Rights instead. Roche Option Plan - movement in number of options outstanding
2007 2006 Number of
options (thousands)
Weighted average exercise price
(CHF)
Number of options
(thousands)
Weighted average exercise price
(CHF) Outstanding at 1 January 1,416 117.83 1,854 105.85 Granted 194 229.68 141 195.14 Forfeited (10) 163.98 (15) 123.52 Exercised (397) 105.64 (564) 97.73 Expired - - - - Outstanding at 31 December 1,203 139.50 1,416 117.83 - of which exercisable 875 115.71 894 103.00
Roche Option Plan - terms of options outstanding as at 31 December 2007
Options outstanding Options exercisable Year of grant
Number
outstanding (thousands)
Weighted average
years remaining contractual life
Weighted average exercise
price (CHF)
Number
exercisable (thousands)
Weighted average exercise
price (CHF) 2002 75 1.19 115.19 75 115.19 2003 261 2.17 78.44 261 78.44 2004 416 3.17 129.49 416 129.49 2005 136 4.17 123.13 81 123.00 2006 124 5.17 195.17 39 195.17 2007 191 6.18 229.68 3 229.60 Total 1,203 2.64 139.50 875 115.71
Genentech Stock Option Plan: The Genentech Stock Option Plan was adopted in 1999 and amended thereafter. In April 2004 Genentech’s shareholders approved an equity incentive plan. The plans allow for the granting of various stock options, incentive stock options and stock purchase rights to employees, directors and consultants of Genentech. No incentive stock options and stock purchase rights have been granted under this plan to date. The options granted, which are non-tradable equity-settled awards, have a ten-year duration and vest on a phased basis over four years, subject to continued employment. Genentech Stock Option Plan - movement in number of options outstanding
2007 2006 Number of
options (millions)
Weighted average exercise price
(USD)
Number of options
(millions)
Weighted average exercise price
(USD) Outstanding at 1 January 88 54.53 83 46.64 Granted 18 79.40 17 79.85 Forfeited (4) 76.45 (3) 62.09 Exercised (10) 32.76 (9) 30.42 Expired - - - - Outstanding at 31 December 92 60.94 88 54.53 - of which exercisable 54 48.46 47 38.48

Page 369
67
Genentech Stock Option Plan – terms of options outstanding at 31 December 2007
Options outstanding Options exercisable Range of exercise prices (USD)
Number
outstanding (millions)
Weighted average
years remaining contractual life
Weighted average exercise
price (USD)
Number
exercisable (millions)
Weighted average exercise
price (USD) 6.27 – 8.89 0.3 4.64 7.41 0.3 7.41 10.00 – 14.35 8.2 3.86 13.68 8.2 13.68 15.04 – 22.39 6.1 3.33 20.87 6.1 20.87 22.88 – 33.00 0.2 3.46 26.33 0.2 26.33 35.63 – 53.23 26.6 5.73 47.05 23.6 46.31 53.95 – 75.90 1.7 7.90 64.79 0.8 59.09 78.99 – 98.80 49.0 8.66 81.78 14.5 83.79 Total 92.1 6.99 60.94 53.7 48.46
Chugai Stock Acquisition Rights: During 2003 Chugai adopted a Stock Acquisition Rights programme. The programme allows for the granting of rights to employees and directors of Chugai. Each right entitles the holder to purchase 100 Chugai shares at a specified exercise price. The options, which are non-tradable equity-settled awards, have a ten-year duration and vest after two years. Chugai Stock Acquisition Rights - movement in number of rights outstanding
2007 2006 Number of
options Weighted average
exercise price (JPY) Number of
options Weighted average
exercise price (JPY) Outstanding at 1 January 9,886 182,925 6,800 160,166 Granted 3,550 303,900 3,440 224,500 Forfeited - - - - Exercised (434) 148,965 (354) 149,770 Expired - - - - Outstanding at 31 December 13,002 217,089 9,886 182,925 - of which exercisable 6,012 161,587 3,926 158,066
Chugai Stock Acquisition Rights – terms of rights outstanding at 31 December 2007
Rights outstanding Rights exercisable Year of grant
Number outstanding
Weighted average
years remaining contractual life
Weighted average exercise
price (JPY)
Number exercisable
Weighted average exercise
price (JPY) 2003 1,312 5.50 145,400 1,312 145,400 2004 2,180 6.25 167,500 2,180 167,500 2005 2,520 7.25 164,900 2,520 164,900 2006 3,440 8.25 224,500 - 224,500 2007 3,550 9.25 303,900 - 303,900 Total 13,002 7.72 217,089 6,012 161,587
Issues of share options in 2007: Issues for share options in 2007, including the methodology used to calculate fair value and the main inputs to the valuation models, are described below.
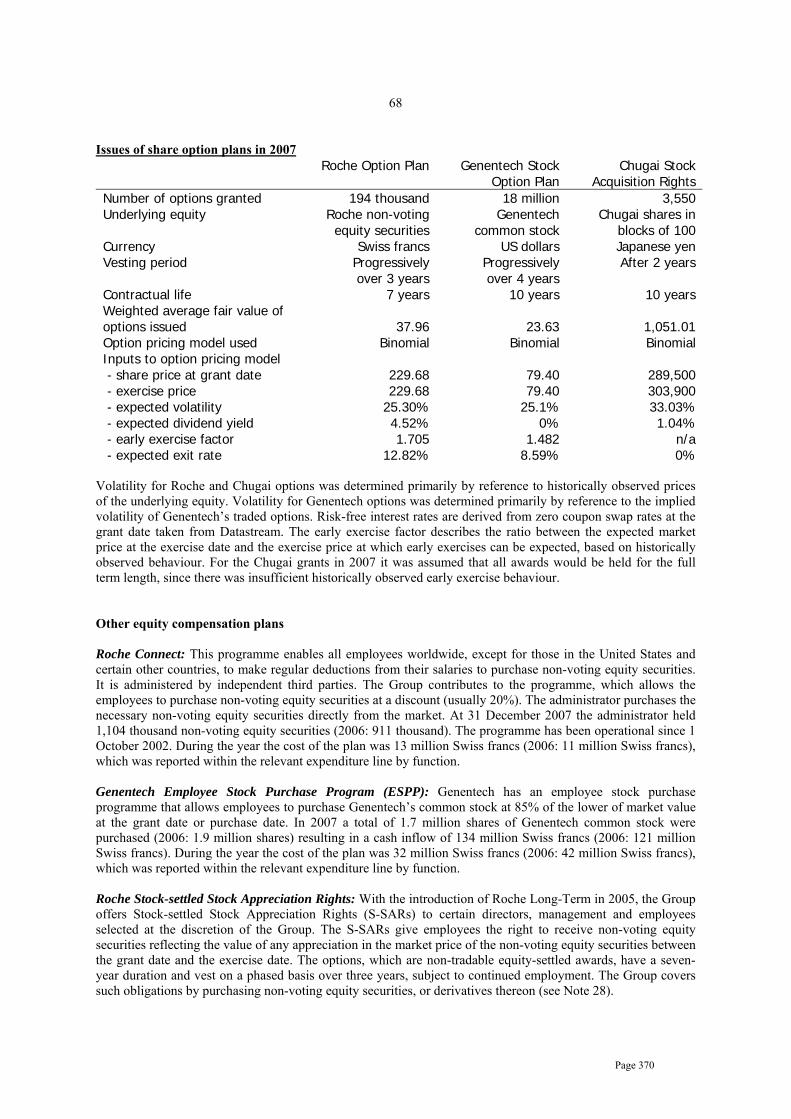
Page 370
68
Issues of share option plans in 2007 Roche Option Plan Genentech Stock
Option Plan Chugai Stock
Acquisition Rights Number of options granted 194 thousand 18 million 3,550 Underlying equity Roche non-voting
equity securitiesGenentech
common stock Chugai shares in
blocks of 100Currency Swiss francs US dollars Japanese yenVesting period Progressively
over 3 yearsProgressively over 4 years
After 2 years
Contractual life 7 years 10 years 10 years Weighted average fair value of options issued 37.96
23.63 1,051.01
Option pricing model used Binomial Binomial Binomial Inputs to option pricing model - share price at grant date 229.68 79.40 289,500 - exercise price 229.68 79.40 303,900 - expected volatility 25.30% 25.1% 33.03% - expected dividend yield 4.52% 0% 1.04% - early exercise factor 1.705 1.482 n/a - expected exit rate 12.82% 8.59% 0%
Volatility for Roche and Chugai options was determined primarily by reference to historically observed prices of the underlying equity. Volatility for Genentech options was determined primarily by reference to the implied volatility of Genentech’s traded options. Risk-free interest rates are derived from zero coupon swap rates at the grant date taken from Datastream. The early exercise factor describes the ratio between the expected market price at the exercise date and the exercise price at which early exercises can be expected, based on historically observed behaviour. For the Chugai grants in 2007 it was assumed that all awards would be held for the full term length, since there was insufficient historically observed early exercise behaviour. Other equity compensation plans Roche Connect: This programme enables all employees worldwide, except for those in the United States and certain other countries, to make regular deductions from their salaries to purchase non-voting equity securities. It is administered by independent third parties. The Group contributes to the programme, which allows the employees to purchase non-voting equity securities at a discount (usually 20%). The administrator purchases the necessary non-voting equity securities directly from the market. At 31 December 2007 the administrator held 1,104 thousand non-voting equity securities (2006: 911 thousand). The programme has been operational since 1 October 2002. During the year the cost of the plan was 13 million Swiss francs (2006: 11 million Swiss francs), which was reported within the relevant expenditure line by function. Genentech Employee Stock Purchase Program (ESPP): Genentech has an employee stock purchase programme that allows employees to purchase Genentech’s common stock at 85% of the lower of market value at the grant date or purchase date. In 2007 a total of 1.7 million shares of Genentech common stock were purchased (2006: 1.9 million shares) resulting in a cash inflow of 134 million Swiss francs (2006: 121 million Swiss francs). During the year the cost of the plan was 32 million Swiss francs (2006: 42 million Swiss francs), which was reported within the relevant expenditure line by function. Roche Stock-settled Stock Appreciation Rights: With the introduction of Roche Long-Term in 2005, the Group offers Stock-settled Stock Appreciation Rights (S-SARs) to certain directors, management and employees selected at the discretion of the Group. The S-SARs give employees the right to receive non-voting equity securities reflecting the value of any appreciation in the market price of the non-voting equity securities between the grant date and the exercise date. The options, which are non-tradable equity-settled awards, have a seven-year duration and vest on a phased basis over three years, subject to continued employment. The Group covers such obligations by purchasing non-voting equity securities, or derivatives thereon (see Note 28).

Page 371
69
Roche S-SARs - movement in number of rights outstanding
2007 2006 Number of
rights (thousands)
Weighted average exercise price
(CHF)
Number of rights
(thousands)
Weighted average exercise price
(CHF) Outstanding at 1 January 5,883 156.07 3,868 123.34 Granted 3,025 229.37 2,762 195.13 Forfeited (189) 180.91 (151) 149.44 Exercised (937) 142.36 (596) 126.35 Expired - - - - Outstanding at 31 December 7,782 185.60 5,883 156.07 - of which exercisable 2,101 149.17 900 126.49
Roche S-SARs – terms of rights outstanding at 31 December 2007
Rights outstanding Rights exercisable Year of grant
Number
outstanding (thousands)
Weighted average
years remaining contractual life
Weighted average exercise
price (CHF)
Number
exercisable (thousands)
Weighted average exercise
price (CHF) 2005 2,452 4.17 123.33 1,361 123.37 2006 2,356 5.17 195.16 709 195.17 2007 2,974 6.17 229.37 31 229.60 Total 7,782 5.24 185.60 2,101 149.17
The weighted average fair value of the options granted in 2007 was calculated using a binomial model. The inputs to the model were consistent with those used for the Roche Option Plan 2007 awards given previously. The resulting weighted average fair value per right is CHF 37.97, giving a total fair value of 115 million Swiss francs which is charged over the vesting period of three years. Roche Performance Share Plan: The Group offers future non-voting equity security awards (or, at the discretion of the Board of Directors, their cash equivalent) to certain directors and key senior managers. The programme was established at the beginning of 2002 and was in effect for three years. During 2004 the Board of Directors approved a new three-year cycle of the Roche Performance Share Plan (PSP) to operate during 2005-2007. The amount of non-voting equity securities allocated will depend upon the individual’s salary level, the achievement of performance targets linked to the Group’s Total Shareholder Return (shares and non-voting equity securities combined) relative to the Group’s peers during the three-year period from the date of the grant, and the discretion of the Board of Directors. These are non-tradable equity-settled awards. Each award will result in between zero and two non-voting equity securities, depending upon the achievement of the performance targets. Additional cycles of the PSP with similar conditions were approved to operate during 2006-2008 and 2007-2009. The terms of these awards are set out in the table below. Roche Performance Share Plan – terms of awards
2005-2007 2006-2008 2007-2009 Number of awards (thousands) 240 55 78 Vesting period 3 years 3 years 3 years Allocated to recipients in Feb. 2008 Feb. 2009 Feb. 2010 Fair value per unit (CHF) 145.39 210.06 239.49 Total fair value (CHF millions) 35 12 19
The weighted average fair value of the awards granted in 2007 was calculated using a Monte Carlo simulation. The input parameters to the model were the covariance matrix between Roche and the other individual companies of the peer group based on a three-year history and a risk-free rate of 2.671%. The valuation also takes into account the defined rank and performance structure which determines the payout of the PSP.

Page 372
70
Roche Stock Appreciation Rights: Some employees of certain North American subsidiaries of the Group receive Stock Appreciation Rights (SARs) as part of their compensation. The SARs, which are non-tradable cash-settled awards, may be exercised after a vesting period of between one and three years for a cash payment, based upon the amount by which the market price of the Group’s American Depositary Receipts (ADRs) at the point of exercise exceeds the strike price (grant price at issuance). Following the implementation of Roche Long-Term (see above), the Group does not plan to award any further cash-settled SARs and no awards have been made since 2004. . Roche Stock Appreciation Rights in millions of CHF
2007 2006 Liability at 31 December 97 199 Intrinsic value of vested rights at 31 December 97 198
Roche Stock Appreciation Rights- terms of rights outstanding at 31 December 2007
Rights outstanding and exercisable Year of grant Number outstanding
and exercisable (thousands)
Expiry
Weighted average exercise
price (USD) 2001 70 Jul. 2008 36.30 2002 282 Dec. 2008 34.68 2003 560 Feb. 2010 28.83 2004 1,092 Feb. 2011 52.08 Total 2,004 42.58
The fair value at 31 December 2007 was calculated using a binomial model. The inputs to the model were the ADR price at 31 December 2007 (USD 85.40), the exercise prices given in the above table, and other inputs consistent with those used for the Roche Option Plan 2007 awards given previously.
12. Property, plant and equipment Property, plant and equipment: movements in carrying value of assets in millions of CHF
Land
Buildings and land
improvements
Machinery and
equipment
Construction
in progress
Total At 1 January 2006 Cost 1,142 9,048 12,654 2,895 25,739 Accumulated depreciation and impairment - (3,096)
(7,546) - (10,642)
Net book value 1,142 5,952 5,108 2,895 15,097 Year ended 31 December 2006 At 1 January 2006 1,142 5,952 5,108 2,895 15,097 Additions 46 97 910 2,825 3,878 Disposals (14) (95) (120) (110) (339) Divestment of Genentech España 3 (4) (71) (113) (4) (192) Transfers - 1,057 1,163 (2,220) - Depreciation charge - (272) (1,189) - (1,461) Impairment charge - (59) (12) - (71) Currency translation effects (44) (220) (118) (113) (495) At 31 December 2006 1,126 6,389 5,629 3,273 16,417 Cost 1,126 9,419 13,581 3,273 27,399 Accumulated depreciation and impairment - (3,030) (7,952) - (10,982) Net book value 1,126 6,389 5,629 3,273 16,417

Page 373
71
Year ended 31 December 2007 At 1 January 2007 1,126 6,389 5,629 3,273 16,417 Additions 22 209 983 2,434 3,648 Disposals (11) (17) (113) (21) (162) BioVeris acquisition 7 - 1 4 - 5 Tanox acquisition 7 - - - 13 13 Other business combinations 7 - - 12 3 15 Transfers - 1,033 1,115 (2,148) - Depreciation charge - (332) (1,228) - (1,560) Impairment charge - (1) (5) - (6) Currency translation effects (45) (247) (116) (130) (538) At 31 December 2007 1,092 7,035 6,281 3,424 17,832 Cost 1,092 10,207 14,681 3,424 29,404 Accumulated depreciation and impairment - (3,172) (8,400) - (11,572) Net book value 1,092 7,035 6,281 3,424 17,832
Impairment charges arise from changes in the estimates of the future cash flows expected to result from the use of the asset and its eventual disposal. Factors such as changes in the planned use of buildings, machinery or equipment, or closure of facilities, the presence or absence of competition and technical obsolescence could result in shortened useful lives or impairment. Impairment charges of 5 million Swiss francs (2006: 71 million Swiss francs) are reported as part of ‘Cost of sales’. Leasing arrangements where the Group is the lessee Finance leases: As at 31 December 2007 the capitalised cost of property, plant and equipment under finance leases was 188 million Swiss francs (2006: 182 million Swiss francs) and the net book value of these assets was 66 million Swiss francs (2006: 79 million Swiss francs). Finance leases: future minimum lease payments under non-cancellable leases in millions of CHF
Future minimum lease payments Present value of future minimum lease payments
2007 2006 2007 2006 Within one year 6 12 6 11 Between one and five years 3 8 3 8 More than five years - - - - Total 9 20 9 19 Future finance charges - - - 1 Total future minimum lease payments (undiscounted)
9
20
9
20
In addition to the above, Genentech leasing arrangements are disclosed in Note 3. Operating leases: Group companies are party to a number of operating leases, mainly for plant and machinery, including motor vehicles, and for certain short-term property rentals. The arrangements do not impose any significant restrictions on the Group. Total operating lease rental expense was 402 million Swiss francs (2006: 371 million Swiss francs).

Page 374
72
Operating leases: future minimum lease payments under non-cancellable leases in millions of CHF
2007 2006 Within one year 224 190 Between one and five years 404 310 More than five years 196 227 Total minimum payments 824 727
Leasing arrangements where the Group is the lessor Finance leases: Certain assets, mainly diagnostics instruments, are leased to third parties through finance lease arrangements. Such assets are reported as receivables at an amount equal to the net investment in the lease. Lease income from finance leases is recognised over the term of the lease based on the effective interest rate method. Finance leases: future minimum lease payments under non-cancellable leases in millions of CHF
Gross investment in lease Present value of future minimum lease payments
2007 2006 2007 2006 Within one year 27 39 23 32 Between one and five years 44 53 37 45 More than five years 2 1 2 1 Total 73 93 62 78 Unearned finance income (6) (7) n/a n/a Unguaranteed residual value n/a n/a 5 8 Net investment in lease 67 86 67 86
The accumulated allowance for uncollectible minimum lease payments was 1.0 million Swiss francs (2006: 0.4 million Swiss francs). There were no contingent rents recognised in income. Operating leases: Certain assets, mainly some diagnostics instruments, are leased to third parties through operating lease arrangements. Such assets are reported within property, plant and equipment. Lease income from operating leases is recognised over the lease term on a straight line basis. Operating leases: future minimum lease payments under non-cancellable leases in millions of CHF
2007 2006 Within one year 72 59 Between one and five years 150 123 More than five years - - Total minimum payments 222 182
At 31 December 2007, machinery and equipment with an original cost of 2,422 million Swiss francs (2006: 2,192 million Swiss francs) and a net book value of 973 million Swiss francs (2006: 832 million Swiss francs) was being leased to third parties. There was no contingent rent recognised as income. Capital commitments
The Group has non-cancellable capital commitments for the purchase or construction of property, plant and equipment totalling 2.3 billion Swiss francs (2006: 0.6 billion Swiss francs). In addition, Genentech’s capital
commitments in respect of its manufacturing agreements with Lonza and its leasing arrangements are described in Note 3.

Page 375
73
13. Goodwill Goodwill: movements in carrying value of assets in millions of CHF
2007 2006 At 1 January 5,914 6,132 BioVeris acquisition 7 540 - Tanox acquisition 7 352 - Other business combinations 7 336 - Impairment charge - - Currency translation effects (307) (218) At 31 December 6,835 5,914 Allocated to the following cash-generating units Pharmaceuticals Division - Roche Pharmaceuticals 128 75 - Genentech 1,880 1,681 - Chugai 110 113 Total Pharmaceuticals Division 2,118 1,869 Diagnostics Division - Diabetes Care 770 768 - Professional Diagnostics 1,879 1,478 - Molecular Diagnostics - - - Applied Science 263 - - Corange/Boehringer Mannheim (held at divisional level and not allocated to business areas)
1,805
1,799
Total Diagnostics Division 4,717 4,045 Total Group 6,835 5,914
There are no accumulated impairment losses in goodwill. The goodwill arising from investments in associated companies is classified as part of the investments in associated companies (see Note 15). Goodwill impairment testing Pharmaceuticals Division: The division’s reportable operating segments are the cash-generating units used for the testing of goodwill. For Genentech and Chugai, the recoverable amount is based on fair value less costs to sell, determined with reference to the publicly quoted share prices of Genentech and Chugai shares. The goodwill in Roche Pharmaceuticals is not significant in comparison with the Group’s total carrying amount of goodwill. Diagnostics Division: The division’s business areas are the cash-generating units used for the testing of goodwill. The goodwill arising from the Corange/Boehringer Mannheim acquisition is recorded and monitored at a divisional level as it cannot be meaningfully allocated to the division’s business areas. Therefore the cash-generating unit for this goodwill is the entire division. The recoverable amount used in the impairment testing is based on value in use. The cash flow projections used are based on the most recent business plans approved by management. These assume no significant changes in the organisation of the division and include management’s latest estimates on sales volume and pricing, and production and other operating costs. These reflect past experience and are projected over five years. The discount rate used is based on a rate of 8.9%, which is derived from a capital asset pricing model using data from Swiss capital markets, including Swiss Federal Government ten-year bonds and the Swiss Market Index. This is then adjusted to a pre-tax rate of 13.6%. Management believes that any reasonably possible change in any of the key assumptions would not cause the carrying value of goodwill to exceed the recoverable amount.

Page 376
74
14. Intangible assets Intangible assets: movements in carrying value of assets in millions of CHF
Product intangibles
In use
Product intangibles
Not
available for use
Technology intangibles
Total
At 1 January 2006 Cost 14,877 294 761 15,932 Accumulated amortisation and impairment (9,145) - (531) (9,676) Net book value 5,732 294 230 6,256 Year ended 31 December 2006 At 1 January 2006 5,732 294 230 6,256 Additions 53 540 - 593 Disposals (1) - - (1) Amortisation charge (941) - (36) (977) Impairment charge (118) (13) (66) (197) Currency translation effects (149) (43) (13) (205) At 31 December 2006 4,576 778 115 5,469 Cost 13,646 778 709 15,133 Accumulated amortisation and impairment (9,070) - (594) (9,664) Net book value 4,576 778 115 5,469 Year ended 31 December 2007 At 1 January 2007 4,576 778 115 5,469 BioVeris acquisition 7 117 - - 117 Tanox acquisition 7 613 93 - 706 Other business combinations 7 223 10 34 267 Additions 255 743 51 1,049 Disposals (1) - - (1) Amortisation charge (942) - (34) (976) Impairment charge - (58) - (58) Currency translation effects (173) (52) (2) (227) At 31 December 2007 4,668 1,514 164 6,346 Cost 14,251 1,514 772 16,537 Accumulated amortisation and impairment (9,583) - (608) (10,191) Net book value 4,668 1,514 164 6,346 Allocation by operating segment - Roche Pharmaceuticals 326 1,085 52 1,463 - Genentech 955 408 35 1,398 - Chugai 440 8 - 448 - Diagnostics 2,947 13 77 3,037 Total Group 4,668 1,514 164 6,346

Page 377
75
Significant intangible assets as at 31 December 2007 in millions of CHF
Operating segment
Net book value
Remaining amortisation period
Product intangibles in use Tanox acquisition Genentech 553 12 years Chugai acquisition Chugai 436 5-13 years Corange/Boehringer Mannheim acquisition Diagnostics 1,590 10 years Igen acquisition Diagnostics 469 9 years Product intangibles not available for use Alnylam alliance Roche
Pharmaceuticals 324 n/a
Classification of amortisation and impairment expenses in millions of CHF 2007 2006 Amortisation Impairment Amortisation Impairment Cost of sales - Pharmaceuticals 614 - 619 - - Diagnostics 328 - 322 118 Research and development - Pharmaceuticals 31 58 27 13 - Diagnostics 3 - 9 66 Total 976 58 977 197 Internally generated intangible assets The Group currently has no internally generated intangible assets from development as the criteria for the recognition as an asset are not met. Impairment of intangible assets Impairment charges arise from changes in the estimates of the future cash flows expected to result from the use of the asset and its eventual disposal. Factors such as the presence or absence of competition, technical obsolescence or lower than anticipated sales for products with capitalised rights could result in shortened useful lives or impairment. 2007: In the Genentech operating segment an impairment charge of 42 million Swiss francs was recorded in the second half of 2007, which relates to a decision to terminate development of compounds with two alliance partners. In the Roche Pharmaceuticals operating segment an impairment charge of 16 million Swiss francs was recorded in the first half of 2007, which relates to a decision to terminate development of one compound with an alliance partner. The assets concerned, which were not yet being amortised, were fully written-down by these charges. 2006: In the second half of 2006 the Group recorded impairment charges of 184 million Swiss francs relating to intangible assets in the Diagnostics Division. These followed the regular updating of the division’s business plans and technology assessments in the second half of 2006, which indicated anticipated recoverable amounts that were below the current carrying values for certain assets. These mainly concern certain of the intangible assets recorded following the Disetronic acquisition in 2003. These assets were written down to their recoverable amount, based on a value in use calculation using a discount rate of 10.0%. Additionally the remaining useful life of these assets was reassessed and has been reduced from 6.3 years to 3 years, effective 31 December 2006. Consequent to these matters, the 2007 amortisation charge for intangible assets in the Diagnostics Division was approximately 20 million Swiss francs lower than it would otherwise have been. In the Roche Pharmaceuticals operating segment an impairment charge of 13 million Swiss francs was recorded in the second half of 2006, which relates to a decision to terminate development of one compound with an alliance partner. The asset concerned, which was not yet being amortised, was fully written-down by this charge. Intangible assets that are not yet available for use mostly represent in-process research and development assets in the Pharmaceuticals Division acquired either through in-licensing arrangements, business combinations or separate purchases. As at 31 December 2007 the carrying value of such assets in the Pharmaceuticals Division is 1,501 million Swiss francs. Of this amount approximately 40% represents projects that have potential decision

Page 378
76
points within the next twelve months which in certain circumstances could lead to impairment. Due to the inherent uncertainties in the research and development process, such assets are particularly at risk of impairment if the project in question does not result in a commercialised product. Potential commitments from alliance collaborations The Group is party to in-licensing and similar arrangements with its alliance partners. These arrangements may require the Group to make certain milestone or other similar payments dependent upon the achievement of agreed objectives or performance targets as defined in the collaboration agreements. The Group’s current estimate of future third-party commitments for such payments is set out in the table below. These figures are not risk adjusted, meaning that they include all such potential payments that can arise assuming all projects currently in development are successful. The timing is based on the Group’s current best estimate. These figures do not include any potential commitments within the Group, such as may arise between the Roche Pharmaceuticals, Genentech and Chugai businesses. Potential future third-party collaboration payments in millions of CHF
Pharmaceuticals Diagnostics Group Within one year 234 14 248 Between one and two years 112 16 128 Between two and three years 214 14 228 Total 560 44 604
15. Associated companies The Group’s investments in associated companies are accounted for using the equity method. The goodwill arising from investments in associated companies is classified as part of the investments in associated companies. Investments in associated companies in millions of CHF
Share of net income Balance sheet value 2007 2006 2007 2006 Total investments in associated companies 2 2 9 7
The Group has no significant investments in associated companies and there were no material transactions between the Group and its associated companies. Additional information about associated companies is given in Note 35.
16. Financial and other long-term assets Financial and other long-term assets in millions of CHF
2007 2006 Available-for-sale investments 836 803 Held-to-maturity investments 19 25 Loans receivable 19 25 Long-term trade receivables 190 108 Restricted cash 226 1,191 Other 43 51 Total financial long-term assets 1,333 2,203 Prepaid employee benefits 183 197 Other 344 430 Total other long-term assets 527 627
Financial long-term assets are held for strategic purposes and are classified as non-current. The available-for-sale investments are mainly equity investments. Unquoted equity investments classified as available-for-sale are generally measured at cost, as their fair value cannot be measured reliably. These are primarily investments

Page 379
77
in private biotechnology companies, which are kept as part of the Group’s strategic alliance efforts. The carrying value of equity investments held at cost is 26 million Swiss francs (2006: 27 million Swiss francs). The average effective interest rate of held-to-maturity investments is 4.4% (2006: 4.7%). Loans receivable comprise all loans to third parties with a term of over one year. Restricted cash in 2006 includes 963 million Swiss francs of the surety bond posted by Genentech in connection with the City of Hope litigation (see Note 25). The equivalent amount in 2007 was classified as other current assets (see Note 19).
17. Inventories Inventories in millions of CHF
2007 2006 Raw materials and supplies 603 551 Work in process 1,168 1,056 Finished goods and intermediates 4,590 4,141 Less: provision for slow-moving and obsolete inventory (248) (156) Total inventories 6,113 5,592
In 2007 expenses relating to inventories expensed through cost of sales totalled 8,737 million Swiss francs (2006: 8,318 million Swiss francs).
18. Accounts receivable Accounts receivable in millions of CHF
2007 2006 Trade accounts receivable 9,834 8,993 Notes receivable 190 157 Less: allowances (220) (190) Total accounts receivable 9,804 8,960
At 31 December 2007 accounts receivable include amounts denominated in US dollars equivalent to 3.8 billion Swiss francs (2006: 2.8 billion Swiss francs) and amounts denominated in euros equivalent to 3.8 billion Swiss francs (2006: 3.5 billion Swiss francs). Net bad debt expense in 2007 was 26 million Swiss francs. Following the recovery of previously provided amounts, the Group recorded net income from bad debts of 3 million Swiss francs in 2006. Significant concentrations within trade receivables of counterparty credit risk are described in Note 32.
19. Other current assets Other current assets in millions of CHF
2007 2006 Accrued interest income 37 36 Derivative financial instruments 24 70 80 Restricted cash 889 - Other 593 665 Total financial current assets 1,589 781 Prepaid expenses 355 343 Other 508 630 Total non-financial current assets 863 973 Total other current assets 2,452 1,754
Restricted cash in 2007 includes 889 million Swiss francs of the surety bond posted by Genentech in connection with the City of Hope litigation (see Note 25). The equivalent amount in 2006 was classified within financial long-term assets (see Note 16).

Page 380
78
20. Marketable securities Marketable securities in millions of CHF
2007 2006 Financial assets at fair-value-through-profit-or-loss Held-for-trading investments - bonds and debentures 1,129 783 Designated as fair-value-through-profit-or-loss - bonds and debentures 78 82 - money market instruments and time accounts over three months 167 161 - other investments 178 62 Total financial assets at fair-value-through-profit-or-loss 1,552 1,088 Available-for-sale financial assets - shares 292 876 - bonds and debentures 7,624 6,533 - money market instruments and time accounts over three months 10,965 12,624 - other investments 14 - Total available-for-sale financial assets 18,895 20,033 Total marketable securities 20,447 21,121
Marketable securities are held for fund management purposes and are classified as current. They are primarily denominated in Swiss francs, euros and US dollars. Other investments held for strategic purposes are classified as non-current (see Note 16). Shares: These consist primarily of readily saleable equity securities. Bonds and debentures: The carrying amounts, contract maturity and average effective interest rate of debt securities is shown below. Bonds and debentures in millions of CHF
2007 2006
Contracted maturity Amount Average effective interest rate
Amount Average effective interest rate
Within one year 2,367 5.05% 2,087 4.32% Between one and five years 5,690 4.89% 4,552 4.55% More than five years 774 5.40% 759 4.33% Total bonds and debentures 8,831 4.98% 7,398 4.46%
Money market instruments: These generally have fixed interest rates ranging from 0.72% to 6.13% (2006: 0.34% to 5.56%) depending upon the currency in which they are denominated. They are contracted to mature within one year of 31 December 2007.
21. Cash and cash equivalents Cash and cash equivalents in millions of CHF
2007 2006 Cash - cash in hand and in current or call accounts 2,792 1,662 Cash equivalents - time accounts with a maturity of three months or less 963 1,548 Total cash and cash equivalents 3,755 3,210
Restricted cash is included within financial and other long-term assets (see Note 16) or other current assets (see Note 19).
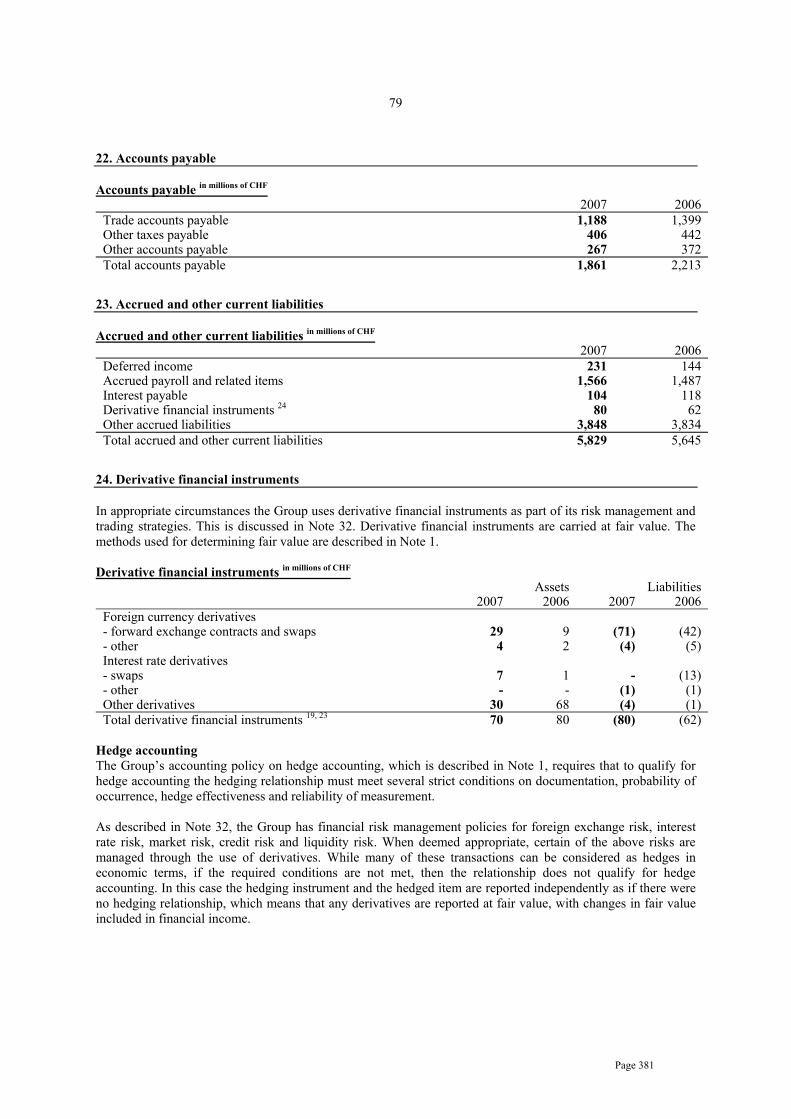
Page 381
79
22. Accounts payable Accounts payable in millions of CHF
2007 2006 Trade accounts payable 1,188 1,399 Other taxes payable 406 442 Other accounts payable 267 372 Total accounts payable 1,861 2,213
23. Accrued and other current liabilities Accrued and other current liabilities in millions of CHF
2007 2006 Deferred income 231 144 Accrued payroll and related items 1,566 1,487 Interest payable 104 118 Derivative financial instruments 24 80 62 Other accrued liabilities 3,848 3,834 Total accrued and other current liabilities 5,829 5,645
24. Derivative financial instruments In appropriate circumstances the Group uses derivative financial instruments as part of its risk management and trading strategies. This is discussed in Note 32. Derivative financial instruments are carried at fair value. The methods used for determining fair value are described in Note 1. Derivative financial instruments in millions of CHF
Assets Liabilities 2007 2006 2007 2006 Foreign currency derivatives - forward exchange contracts and swaps 29 9 (71) (42) - other 4 2 (4) (5) Interest rate derivatives - swaps 7 1 - (13) - other - - (1) (1) Other derivatives 30 68 (4) (1) Total derivative financial instruments 19, 23 70 80 (80) (62)
Hedge accounting The Group’s accounting policy on hedge accounting, which is described in Note 1, requires that to qualify for hedge accounting the hedging relationship must meet several strict conditions on documentation, probability of occurrence, hedge effectiveness and reliability of measurement. As described in Note 32, the Group has financial risk management policies for foreign exchange risk, interest rate risk, market risk, credit risk and liquidity risk. When deemed appropriate, certain of the above risks are managed through the use of derivatives. While many of these transactions can be considered as hedges in economic terms, if the required conditions are not met, then the relationship does not qualify for hedge accounting. In this case the hedging instrument and the hedged item are reported independently as if there were no hedging relationship, which means that any derivatives are reported at fair value, with changes in fair value included in financial income.

Page 382
80 The Group generally limits the use of hedge accounting to certain significant transactions. Consequently as at 31 December 2007 the Group has no fair value hedges, cash flow hedges or hedges of net investment in a foreign entity that meet the strict requirements to qualify for hedge accounting, apart from those described below. Genentech has hedged some of its fixed-term debt instruments with interest rate swaps. As at 31 December 2007 such instruments, which have been designated and qualify as fair value hedges, are recorded in the balance sheet as an asset with a fair value of 7 million Swiss francs (2006: liability of 13 million Swiss francs). Genentech has non-US dollar cash flows from future royalty income and development expenses expected over the next one to five years. To hedge part of this foreign exchange risk Genentech enters into derivative financial instruments such as options and forward contracts. Genentech has equity investments in various biotechnology companies that are subject to a greater risk of market fluctuation than the stock market in general. To manage part of this exposure Genentech enters into derivative financial instruments such as zero cost collars and forward contracts. As at 31 December 2007 such instruments, which are designated and qualify for hedge accounting, are recorded as assets with a fair value of 27 million Swiss francs (2006: assets of 64 million Swiss francs and liabilities of 4 million Swiss francs). These matters are also described in Genentech's annual report and quarterly SEC filings. Movements on the fair value reserve for designated cash flow hedges are included in Note 28. 25. Provisions and contingent liabilities Provisions: movements in recognised liabilities in millions of CHF
Legal provisions
Environmental provisions
Restructuring provisions
Other provisions
Total
Year ended 31 December 2006 At 1 January 2006 1,366 212 278 524 2,380 Additional provisions created 24 11 54 588 677 Unused amounts reversed (4) (25) (62) (95) (186) Utilised during the year (35) (9) (98) (331) (473) Unwinding of discount 5 62 4 2 6 74 Currency translation effects (93) (7) - (23) (123) At 31 December 2006 1,320 186 174 669 2,349 Of which - current portion 377 11 79 289 756 - non-current portion 943 175 95 380 1,593 Total provisions 1,320 186 174 669 2,349 Year ended 31 December 2007 At 1 January 2007 1,320 186 174 669 2,349 Additional provisions created 57 36 132 530 755 Unused amounts reversed (92) (1) (28) (40) (161) Utilised during the year (288) (11) (82) (315) (696) Unwinding of discount 5 60 3 - 6 69 Currency translation effects (72) (10) (3) (26) (111) At 31 December 2007 985 203 193 824 2,205 Of which - current portion 962 30 116 409 1,517 - non-current portion 23 173 77 415 688 Total provisions 985 203 193 824 2,205 Expected outflow of resources - within one year 962 30 116 409 1,517 - between one to two years 5 20 27 132 184 - between two to three years 2 15 18 38 73 - more than three years 16 138 32 245 431 Total provisions 985 203 193 824 2,205

Page 383
81
Legal provisions Legal provisions relate mainly to a number of major legal cases that are described below. The amounts, timing and uncertainties of any outflows are discussed below, as are the discount rates used. The remaining legal provisions, which account for less than 15% of the balance, consist of a number of other separate legal matters in various Group companies. The majority of any cash outflows for these other matters are expected to occur within the next one to three years, although these are dependent on the development of the various litigations. These provisions are not discounted as the time value of money is not material in these matters.
Environmental provisions Provisions for environmental matters include various separate environmental issues in a number of countries. By their nature the amounts and timing of any outflows are difficult to predict. The estimated timings of these cash outflows are shown in the table above. Significant provisions are discounted by between 6% and 7% where the time value of money is material. Restructuring provisions These arise from planned programmes that materially change the scope of business undertaken by the Group or the manner in which business is conducted. Such provisions include only the costs necessarily entailed by the restructuring which are not associated with the recurring activities of the Group. The timings of these cash outflows are reasonably certain on a global basis and are shown in the table above. Significant provisions are discounted by 3% where the time value of money is material. Other provisions Other provisions consist mostly of claims arising from trade, sales returns, certain employee benefit obligations and various other provisions from Group companies that do not fit into the above categories. The timings of cash outflows are by their nature uncertain and the best estimates are shown in the table above. Significant provisions are discounted by between 4% and 6% where the time value of money is material. Contingent liabilities The operations and earnings of the Group continue, from time to time and in varying degrees, to be affected by political, legislative, fiscal and regulatory developments, including those relating to environmental protection, in the countries in which it operates. The industries in which the Group operates are also subject to other risks of various kinds. The nature and frequency of these developments and events, not all of which are covered by insurance, as well as their effect on future operations and earnings, are not predictable. The Group has entered into strategic alliances with various companies in order to gain access to potential new products or to utilise other companies to help develop the Group’s own potential new products. Potential future payments may become due to certain collaboration partners achieving certain milestones as defined in the collaboration agreements. The Group’s best estimates of future commitments for such payments are given in Note 14.

Page 384
82
Roche Pharmaceuticals legal cases Roche Diagnostics GmbH ('RDG') and SmithKline Beecham (Cork) Ltd ('SB') were party to arbitration concerning RDG's termination in 1998 of the Carvedilol License Agreement of 1987, as amended in 1995, relating to the licensing and co-marketing of carvedilol. RDG had submitted two claims for damages to two Arbitration Tribunals in Zurich and SB had submitted a counterclaim asserting the invalidity of RDG's termination and claiming damages. Based on the development of the arbitration and settlement negotiations at the time, the Group increased its existing provisions by 210 million Swiss francs in 2005. On 20 February 2007 the Group announced that a settlement agreement had been reached with GlaxoSmithKline (‘GSK’) to settle all arbitration procedures between the two companies relating to the licensing and co-marketing of carvedilol. As part of this agreement the Group made a payment to GSK. The settlement had no impact on the Group’s net income as the payment was covered by previously recorded provisions and there were no surplus provisions released as income. Genentech legal cases
On 10 June 2002 Genentech announced that a Los Angeles County Superior Court jury voted to award City of Hope Medical Center (‘City of Hope’) approximately 300 million US dollars in compensatory damages based on a finding of a breach of a 1976 agreement between Genentech and the City of Hope. On 24 June 2002 the jury voted to award City of Hope 200 million US dollars in punitive damages in the same case. On 13 September 2002 Genentech filed a notice of appeal of the jury verdict and damages awards with the California Court of Appeal. On 21 October 2004 the Court of Appeal affirmed the verdict and damages awards in all respects. Also, on 21 October 2004 Genentech announced that it would seek review by the California Supreme Court, which has discretion over which cases it will review. On 24 November 2004 Genentech filed its petition for review by the California Supreme Court and on 2 February 2005 the California Supreme Court granted this petition. The appeal to the California Supreme Court has been fully briefed and the hearing has been set for 5 February 2008. The amount of cash paid, if any, or the timing of such payment will depend on the decision of the California Supreme Court, which is expected to be issued within ninety days of the hearing. A full provision, totalling 875 million Swiss francs, has been recorded for these awards, which is reported as a current liability as resolution is expected within one year. During the appeals process interest accrues on the total amount of the damages at a simple annual rate of 10%. During 2007 interest of 60 million Swiss francs (2006: 63 million Swiss francs) was recorded as the time cost of provisions within interest expenses. On 3 October 2002 Genentech entered into an arrangement with third-party insurance companies to post a surety bond in connection with this judgment. As part of this arrangement Genentech has pledged 788 million US dollars in cash and investments to secure this bond. This amount, which is equivalent to 889 million Swiss francs at 31 December 2007, is recorded as restricted cash within other current assets (see Note 19). On 4 October 2004 Genentech received a subpoena from the United States Department of Justice, requesting documents related to the promotion of Rituxan. Genentech is co-operating with the associated investigation, which, Genentech has been advised, is both civil and criminal in nature. The government has called, and may continue to call, former and current Genentech employees to appear before a grand jury in connection with this investigation. The outcome of this matter cannot be determined at this time. On 11 April 2003 MedImmune, Inc. (‘MedImmune’) filed a lawsuit against Genentech, the City of Hope National Medical Center, and Celltech R&D Ltd., in the US District Court for the Central District of California, Los Angeles. The lawsuit relates to US Patent No. 6,331,415 (‘the Cabilly patent’) that is co-owned by Genentech and the City of Hope National Medical Center and under which MedImmune and other companies have been licensed and are paying royalties. The lawsuit includes claims for violation of antitrust, patent and unfair competition laws. On 14 January 2004 the US District Court granted summary judgement against all of MedImmune’s antitrust and unfair competition claims. On 23 April 2004 the District Court granted a motion to dismiss all remaining claims in this case. On 18 October 2005 the US Court of Appeals for the Federal Circuit affirmed the judgement of the District Court in all respects. On 9 January 2007 the US Supreme Court issued a decision reversing the Federal Circuit’s decision and remanding the case to the lower courts for further proceedings in connection with the patent and contract claims. On 16 August 2007 the US District Court entered a Claim Construction Order defining several terms used in the Cabilly patent. Discovery and motion practice are ongoing and the trial of this matter has been scheduled for 23 June 2008. No provisions have been recorded in respect of this litigation as the outcome of this matter cannot be determined at this time.

Page 385
83
On 13 May 2005 a request was filed by a third party for re-examination of the Cabilly patent. On 7 July 2005 the US Patent and Trademark Office ordered a re-examination of this patent. On 13 September 2005 the Patent Office issued an initial non-final Office action rejecting the claims of the patent. Genentech filed a response on 25 November 2005. A second re-examination request for this same patent was filed on 23 December 2005 by another third party and on 23 January 2006 the Patent Office granted that re-examination request. On 6 June 2006 the two re-examinations were combined by the Patent Office into a single re-examination. On 16 August 2006 the Patent Office issued a non-final Office action in the merged proceeding, rejecting the claims of the Cabilly patent based on the issues raised in the two re-examination requests. Genentech filed its response on 30 October 2006. On 16 February 2007 the Patent Office mailed a final Office action rejecting all thirty six claims of the Cabilly patent. On 21 May 2007 Genentech responded to the final Office action and petitioned for continued re-examination. On 31 May 2007 the Patent Office granted Genentech’s petition, withdrew the finality of the February 2007 Office action and agreed to treat Genentech’s 21 May 2007 filing as a response to a first Office action. The Cabilly patent, which expires in 2018, relates to methods used by Genentech and others to make certain antibodies or antibody fragments, as well as cells and DNA used in these methods. Genentech has licensed the Cabilly patent to other companies and derives significant royalties from these licences. The claims of the Cabilly patent remain valid and enforceable throughout the re-examination process. No provisions have been recorded in respect of this litigation as the outcome of this matter cannot be determined at this time. On 29 July 2005 a former Genentech employee, whose employment ended in April 2005, filed a non-public (Qui Tam) complaint under seal in the United States District Court for the District of Maine against Genentech and Biogen Idec, alleging violations of the False Claims Act and retaliatory discharge of employment. On 20 December 2005 the United States filed notice of its election to decline intervention in the lawsuit. The complaint was subsequently unsealed and Genentech was served on 5 January 2006. Genentech filed a motion to dismiss the complaint and on 14 December 2006 the Magistrate Judge issued a Recommended Decision on this motion, which is subject to review by the District Court Judge. The Magistrate Judge recommended that the False Claims Act portion of the complaint be dismissed, leaving as the only remaining claim against Genentech the plaintiff’s retaliatory discharge claim. The plaintiff, Genentech and Biogen Idec each subsequently filed objections with the District Court Judge concerning certain aspects of the Magistrate Judge's Recommended Decision. On 24 July 2007 the District Court Judge affirmed the dismissal of both claims related to the False Claims Act but denied Genentech’s motion to dismiss the plaintiff’s federal retaliatory discharge claim and granted the plaintiff’s motion for leave to file a Second Amended Complaint asserting an additional state law employment claim. No provisions have been recorded in respect of this litigation as the outcome of this matter cannot be determined at this time. On 24 March 2004 Mr Kourosh Dastgheib filed a lawsuit against Genentech in the U.S. District Court for the Eastern District of Pennsylvania. The lawsuit relates to Dastgheib’s claim that, based on a relationship with Genentech in the mid-1990s, he is entitled to profits or proceeds from Genentech’s Lucentis product. On 8 November 2006 a unanimous jury ruled against Dastgheib and in favour of Genentech on all claims and final judgement was entered in Genentech’s favour. On 30 January 2007 Dastgheib’s motion for a new trial was denied in its entirety. Dastgheib did not appeal the judgement to the Court of Appeals and accordingly the case is closed. Genentech's annual report and quarterly SEC filings contain the detailed disclosures of litigation matters that are required by US GAAP. These include further details on the above matters as well as including information on other litigation that is not currently as significant as the matters referred to above.
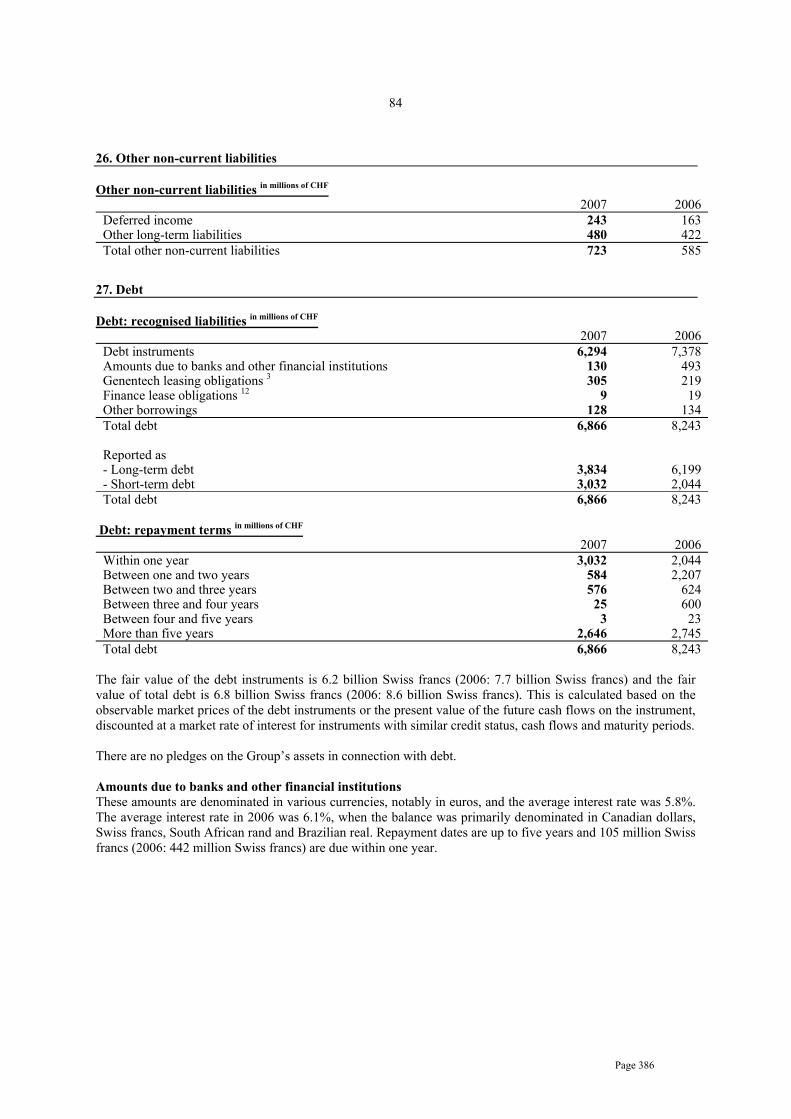
Page 386
84
26. Other non-current liabilities Other non-current liabilities in millions of CHF
2007 2006 Deferred income 243 163 Other long-term liabilities 480 422 Total other non-current liabilities 723 585
27. Debt Debt: recognised liabilities in millions of CHF
2007 2006 Debt instruments 6,294 7,378 Amounts due to banks and other financial institutions 130 493 Genentech leasing obligations 3 305 219 Finance lease obligations 12 9 19 Other borrowings 128 134 Total debt 6,866 8,243 Reported as - Long-term debt 3,834 6,199 - Short-term debt 3,032 2,044 Total debt 6,866 8,243
Debt: repayment terms in millions of CHF
2007 2006 Within one year 3,032 2,044 Between one and two years 584 2,207 Between two and three years 576 624 Between three and four years 25 600 Between four and five years 3 23 More than five years 2,646 2,745 Total debt 6,866 8,243
The fair value of the debt instruments is 6.2 billion Swiss francs (2006: 7.7 billion Swiss francs) and the fair value of total debt is 6.8 billion Swiss francs (2006: 8.6 billion Swiss francs). This is calculated based on the observable market prices of the debt instruments or the present value of the future cash flows on the instrument, discounted at a market rate of interest for instruments with similar credit status, cash flows and maturity periods. There are no pledges on the Group’s assets in connection with debt. Amounts due to banks and other financial institutions These amounts are denominated in various currencies, notably in euros, and the average interest rate was 5.8%. The average interest rate in 2006 was 6.1%, when the balance was primarily denominated in Canadian dollars, Swiss francs, South African rand and Brazilian real. Repayment dates are up to five years and 105 million Swiss francs (2006: 442 million Swiss francs) are due within one year.
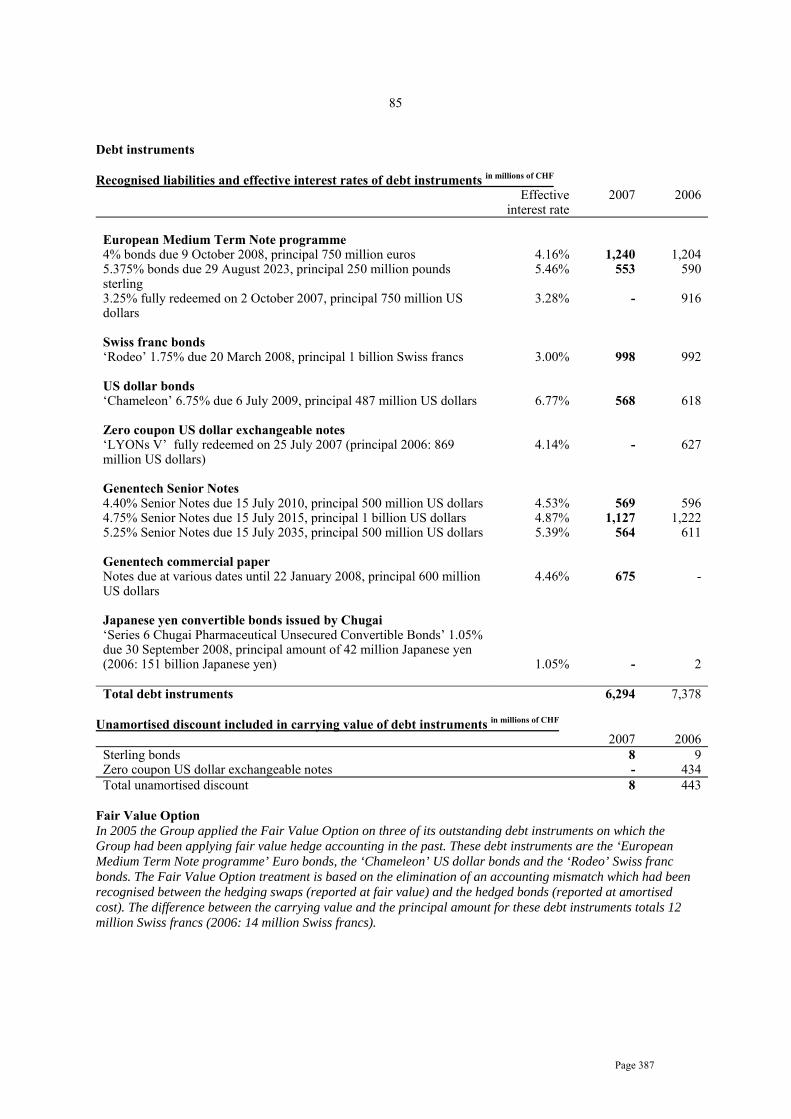
Page 387
85
Debt instruments Recognised liabilities and effective interest rates of debt instruments in millions of CHF
Effective interest rate
2007 2006
European Medium Term Note programme
4% bonds due 9 October 2008, principal 750 million euros 4.16% 1,240 1,204 5.375% bonds due 29 August 2023, principal 250 million pounds sterling
5.46% 553 590
3.25% fully redeemed on 2 October 2007, principal 750 million US dollars
3.28% - 916
Swiss franc bonds
‘Rodeo’ 1.75% due 20 March 2008, principal 1 billion Swiss francs 3.00% 998 992 US dollar bonds
‘Chameleon’ 6.75% due 6 July 2009, principal 487 million US dollars 6.77% 568 618 Zero coupon US dollar exchangeable notes
‘LYONs V’ fully redeemed on 25 July 2007 (principal 2006: 869 million US dollars)
4.14% - 627
Genentech Senior Notes 4.40% Senior Notes due 15 July 2010, principal 500 million US dollars 4.53% 569 596 4.75% Senior Notes due 15 July 2015, principal 1 billion US dollars 4.87% 1,127 1,222 5.25% Senior Notes due 15 July 2035, principal 500 million US dollars 5.39% 564 611 Genentech commercial paper Notes due at various dates until 22 January 2008, principal 600 million US dollars
4.46% 675 -
Japanese yen convertible bonds issued by Chugai ‘Series 6 Chugai Pharmaceutical Unsecured Convertible Bonds’ 1.05% due 30 September 2008, principal amount of 42 million Japanese yen (2006: 151 billion Japanese yen)
1.05%
-
2 Total debt instruments 6,294 7,378
Unamortised discount included in carrying value of debt instruments in millions of CHF
2007 2006 Sterling bonds 8 9 Zero coupon US dollar exchangeable notes - 434 Total unamortised discount 8 443
Fair Value Option In 2005 the Group applied the Fair Value Option on three of its outstanding debt instruments on which the Group had been applying fair value hedge accounting in the past. These debt instruments are the ‘European Medium Term Note programme’ Euro bonds, the ‘Chameleon’ US dollar bonds and the ‘Rodeo’ Swiss franc bonds. The Fair Value Option treatment is based on the elimination of an accounting mismatch which had been recognised between the hedging swaps (reported at fair value) and the hedged bonds (reported at amortised cost). The difference between the carrying value and the principal amount for these debt instruments totals 12 million Swiss francs (2006: 14 million Swiss francs).

Page 388
86
Issuance of new debt instruments - 2007 Genentech commercial paper program: In October 2007 Genentech established a commercial paper program under which it can issue up to 1 billion US dollars of unsecured commercial paper notes. Maturities under the program generally vary from overnight to five weeks and cannot exceed 397 days. As at 31 December 2007 unsecured commercial paper notes with a principal amount of 600 million US dollars and an interest rate of 4.46% were outstanding. The cash proceeds on issue were equivalent to 719 million Swiss francs. Genentech intends to use the proceeds for general corporate purposes. Repayments, redemptions and conversions of debt instruments - 2007
Conversion and redemption of ‘LYONs V’ US dollar exchangeable notes: On 22 June 2007 the Group announced that it would exercise its option to call these notes for redemption on 25 July 2007 at the original issue amount plus accrued original issue discount (‘OID’). In the period to 24 July 2007 notes with a principal amount of 848 million US dollars were converted into 4.5 million non-voting equity securities and the remaining notes were redeemed for cash on 25 July 2007. A total of 324 million Swiss francs were recorded to equity, which consists of the 1,008 million Swiss francs of cash used to purchase the non-voting equity securities used in the conversion and redemption, less the 622 million Swiss francs carrying value of the converted bonds and the related tax effects of 62 million Swiss francs. There was no gain or loss recorded in the income statement upon the conversion and redemption.
Redemption of European Medium Term Note programme US dollar bonds: On the due date of 2 October 2007 the Group redeemed these bonds with a principal value of 750 million US dollars at the original issue amount plus accrued original issue discount (‘OID'). The cash outflow was 900 million Swiss francs. There was no gain or loss recorded in the income statement upon the redemption. Partial conversion of ‘Series 6 Chugai Pharmaceutical Unsecured Convertible Bonds’: During 2007 bonds with a face value of 0.1 billion Japanese yen (1 million Swiss francs) were converted to shares of Chugai. The Group’s percentage ownership of Chugai was unaffected by this conversion, as the Group has bonds convertible into Chugai shares that mirror those that Chugai has outstanding with third parties. There was no gain or loss recorded in the income statement upon the partial conversion. Repayments, redemptions and conversions of debt instruments - 2006 Partial conversion of ‘LYONs V’ US dollar exchangeable notes: During 2006 notes with a carrying value of 680 million US dollars (853 million Swiss francs) were converted into 6.3 million non-voting equity securities. The notes called for conversion during 2006 represented 58% of the number of notes outstanding at the start of the year. A total of 354 million Swiss francs were recorded to equity, which consisted of the 1,264 million Swiss francs of cash used to purchase the non-voting equity securities used in the conversion, less the 853 million Swiss francs carrying value of the converted bonds and the related tax effects of 57 million Swiss francs. There was no gain or loss recorded in the income statement upon the partial conversion. Partial conversion of ‘Series 6 Chugai Pharmaceutical Unsecured Convertible Bonds’: During 2006 bonds with a face value of 0.3 billion Japanese yen (3 million Swiss francs) were converted to shares of Chugai. The Group’s percentage ownership of Chugai was unaffected by this conversion, as the Group has bonds convertible into Chugai shares that mirror those that Chugai has outstanding with third parties. There was no gain or loss recorded in the income statement upon the partial conversion. Cash outflows from repayments, redemptions and conversions of debt instruments in millions of CHF
2007 2006 ‘LYONs V’ US dollar exchangeable notes (1,008) (1,264) European Medium Term Note programme US dollar bonds (900) - Total cash outflows from repayments and redemptions during the year (1,908) (1,264)

Page 389
87
Terms of outstanding convertible debt instruments ‘Series 6 Chugai Pharmaceutical Unsecured Convertible Bonds’: Each bond of JPY 1,000,000 par value is convertible into 1,311 shares of Chugai. Conversion is at the option of the bondholder and may be made at any time up to 29 September 2008. The bonds will be redeemable at maturity on 30 September 2008 at the issue price. If the bonds outstanding at 31 December 2007 were all converted it would require 55 thousand Chugai shares to meet the obligation. The Group’s percentage ownership in Chugai would not be affected by any conversion, as the Group has bonds convertible into Chugai shares that mirror those that Chugai has outstanding with third parties.
28. Equity attributable to Roche shareholders Changes in equity attributable to Roche shareholders in millions of CHF
Year ended 31 December 2006 Share capit
al
Own equity
instruments
Retained earnings
Fair value
reserve
Hedging
reserve
Translation reserve
Total
At 1 January 2006 160 (3,485) 38,624 375 40 (2,380) 33,334 Available-for-sale investments - Valuation gains (losses) taken to equity
-
-
-
292
-
-
292
- Transferred to income statement on sale or impairment
-
-
-
(184)
-
-
(184)
Cash flow hedges - Gains (losses) taken to equity - - - - (71) - (71) - Transferred to income statement - - - - - - - - Transferred to the initial balance sheet carrying value of hedged items
- - - - - - -
Exchange differences on translation of foreign operations
-
-
-
(17)
(1)
(1,469)
(1,487)
Defined benefit plans - Actuarial gains (losses) 10 - - 761 - - - 761 - Limit on asset recognition 10 - - (396) - - - (396) Income taxes on items taken directly to or transferred from equity
-
-
(149)
(15)
29
-
(135)
Minority interests - - 2 8 18 510 538 Net income recognised directly in equity
- - 218 84 (25) (959) (682)
Net income recognised in income statement
-
-
7,880
-
-
-
7,880
Total recognised income and expense
- - 8,098 84 (25) (959) 7,198
Dividends paid - - (2,152) - - - (2,152) Transactions in own equity instruments
- 1,383 - - - - 1,383
Equity compensation plans - - 726 - - - 726 Genentech and Chugai share repurchases 3, 4
-
-
(696)
-
-
-
(696)
Convertible debt instruments 27 - - (354) - - - (354) Changes in minority interests - - 5 - - - 5 At 31 December 2006 160 (2,102) 44,251 459 15 (3,339) 39,444

Page 390
88
Year ended 31 December 2007 Share capit
al
Own equity
instruments
Retained earnings
Fair value
reserve
Hedging
reserve
Translation reserve
Total
At 1 January 2007 160 (2,102) 44,251 459 15 (3,339) 39,444 Available-for-sale investments - Valuation gains (losses) taken to equity
-
-
-
(198)
-
-
(198)
- Transferred to income statement on sale or impairment
-
-
-
(128)
-
-
(128)
Cash flow hedges - Gains (losses) taken to equity - - - - (45) - (45) - Transferred to income statement a)
- - - - (3) - (3)
- Transferred to the initial balance sheet carrying value of hedged items
-
-
-
-
-
-
-
Exchange differences on translation of foreign operations
-
-
-
(10)
1
(1,897)
(1,906)
Defined benefit plans - Actuarial gains (losses) 10 - - 1,178 - - - 1,178 - Limit on asset recognition 10 - - (422) - - - (422) Income taxes on items taken directly to or transferred from equity
-
-
(295)
9
19
-
(267)
Minority interests - - (3) (7) 13 529 532 Net income recognised directly in equity
- - 458 (334) (15) (1,368) (1,259)
Net income recognised in income statement
-
-
9,761
-
-
-
9,761
Total recognised income and expense
- - 10,219 (334) (15) (1,368) 8,502
Dividends paid - - (2,930) - - - (2,930) Transactions in own equity instruments
- 1,085 - - - - 1,085
Equity compensation plans - - 559 - - - 559 Genentech and Chugai share repurchases 3, 4
-
-
(1,044)
-
-
-
(1,044)
Convertible debt instruments 27 - - (324) - - - (324) Changes in minority interests - - 55 - - - 55 At 31 December 2007 160 (1,017) 50,786 125 - (4,707) 45,347
a) Of amounts transferred to income statement, losses of 10 million Swiss francs were reported as ‘Royalties and other operating income’ and gains of 7 million Swiss francs as ‘Financial income’. Share capital As of 31 December 2007, the authorised and issued share capital of Roche Holding Ltd, which is the Group’s parent company, consisted of 160,000,000 shares with a nominal value of 1.00 Swiss franc each, as in the preceding year. The shares are bearer shares and the Group does not maintain a register of shareholders. Based on information supplied to the Group, a shareholder group with pooled voting rights owns 50.0125% (2006: 50.0125%) of the issued shares. This is further described in Note 33. Based on information supplied to the Group, Novartis International Ltd, Basel, and its affiliates 33.3330% (participation below 33 1/3 %) of the issued shares (2006: 33.3330%).

Page 391
89 Non-voting equity securities (Genussscheine) As of 31 December 2007, 702,562,700 non-voting equity securities have been authorised and were in issue as in the preceding year. Under Swiss company law these non-voting equity securities have no nominal value, are not part of the share capital and cannot be issued against a contribution which would be shown as an asset in the balance sheet of Roche Holding Ltd. Each non-voting equity security confers the same rights as any of the shares to participate in the net profit and any remaining proceeds from liquidation following repayment of the nominal value of the shares and, if any, participation certificates. In accordance with the law and the Articles of Incorporation of Roche Holding Ltd, the Company is entitled at all times to exchange all or some of the non-voting equity securities into shares or participation certificates. Dividends On 5 March 2007 the shareholders approved the distribution of a dividend of CHF 3.40 per share and non-voting equity security (2006: CHF 2.50) in respect of the 2006 business year. The distribution to holders of outstanding shares and non-voting equity securities totalled 2,930 million Swiss francs (2006: 2,152 million Swiss francs) and has been recorded against retained earnings in 2007. The Board of Directors has proposed dividends for the 2007 business year of 4.60 Swiss francs per share and non-voting equity security. This is subject to approval at the Annual General Meeting on 4 March 2008. Own equity instruments
Holdings of own equity instruments in equivalent number of non-voting equity securities 31 December 2007
(millions) 31 December 2006
(millions) Non-voting equity securities 0.4 0.2 Low Exercise Price Options 1.9 6.8 Derivative instruments 9.3 8.2 Total own equity instruments 11.6 15.2 Own equity instruments are recorded within equity at original purchase cost. Details of own equity instruments held at 31 December 2007 are shown in the table below. Fair values are disclosed for information purposes. Own equity instruments at 31 December 2007: supplementary information
Equivalent number of non-voting equity securities
(millions)
Maturity Strike price
(CHF)
Market value
(millions of CHF) Non-voting equity securities 0.4 n/a n/a 70Low Exercise Price Options 1.9 1 Sep.
200810.00 349
Derivative instruments 9.3 2 Feb. 2010 –8 Feb. 2014
123.00 – 229.60
412
Total 11.6 831 Non-voting equity securities and Low Exercise Price Options have been mainly held for the potential conversion obligations that may arise from the Group’s convertible debt instruments. Following from the conversion and redemption of the ‘LYONs V’ US dollar exchangeable notes in 2007 (see Note 27), the Group reduced its holdings in own equity instruments during the year. The Group’s potential obligations to employees for the Roche Option Plan and Roche Stock-settled Stock Appreciation Rights (see Note 11) are covered by the remaining own equity instruments, which mainly consist of call options that are exercisable at any time up to their maturity. The net cash inflow from transactions in own equity instruments was 1,085 million Swiss francs (2006: net cash inflow of 1,367 million Swiss francs). These mainly arose from a reduction in own equity instrument holdings following the conversion and redemption of the ‘LYONs V’ notes. The Group holds none of its own shares.
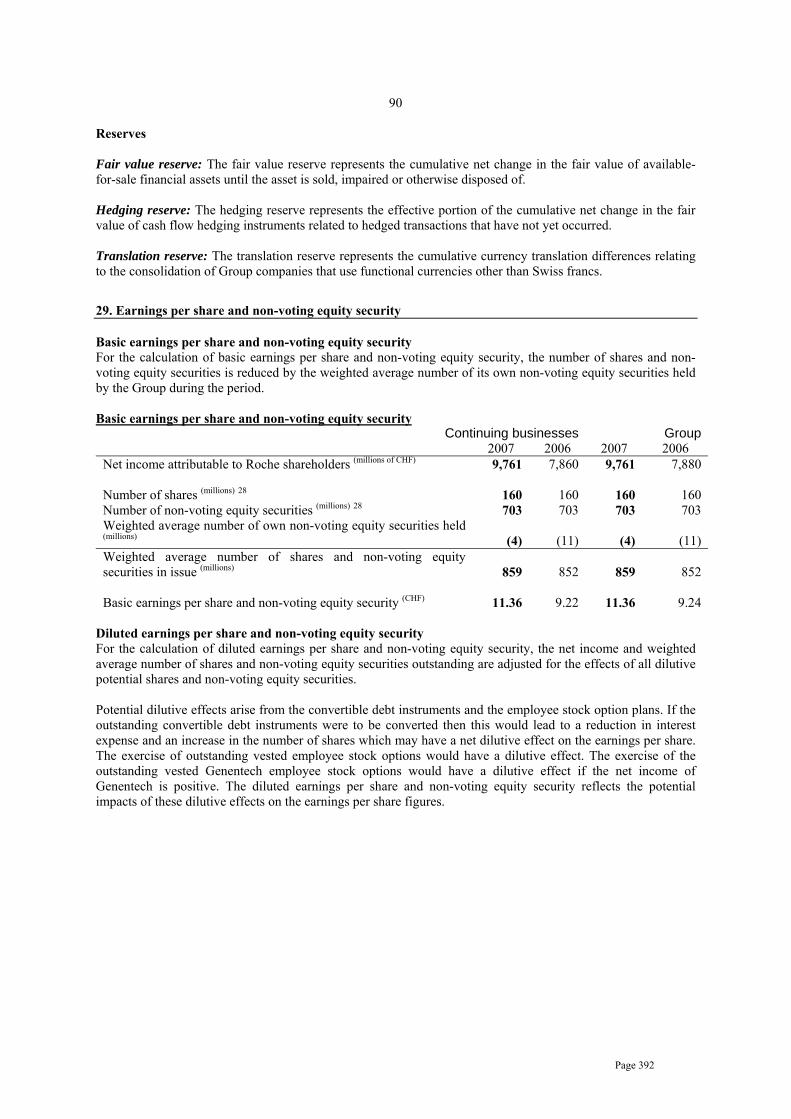
Page 392
90 Reserves Fair value reserve: The fair value reserve represents the cumulative net change in the fair value of available-for-sale financial assets until the asset is sold, impaired or otherwise disposed of. Hedging reserve: The hedging reserve represents the effective portion of the cumulative net change in the fair value of cash flow hedging instruments related to hedged transactions that have not yet occurred. Translation reserve: The translation reserve represents the cumulative currency translation differences relating to the consolidation of Group companies that use functional currencies other than Swiss francs.
29. Earnings per share and non-voting equity security Basic earnings per share and non-voting equity security For the calculation of basic earnings per share and non-voting equity security, the number of shares and non-voting equity securities is reduced by the weighted average number of its own non-voting equity securities held by the Group during the period. Basic earnings per share and non-voting equity security Continuing businesses Group 2007 2006 2007 2006 Net income attributable to Roche shareholders (millions of CHF) 9,761 7,860 9,761 7,880 Number of shares (millions) 28 160 160 160 160 Number of non-voting equity securities (millions) 28 703 703 703 703 Weighted average number of own non-voting equity securities held (millions)
(4)
(11)
(4)
(11)
Weighted average number of shares and non-voting equity securities in issue (millions)
859
852
859
852
Basic earnings per share and non-voting equity security (CHF) 11.36 9.22 11.36 9.24
Diluted earnings per share and non-voting equity security For the calculation of diluted earnings per share and non-voting equity security, the net income and weighted average number of shares and non-voting equity securities outstanding are adjusted for the effects of all dilutive potential shares and non-voting equity securities. Potential dilutive effects arise from the convertible debt instruments and the employee stock option plans. If the outstanding convertible debt instruments were to be converted then this would lead to a reduction in interest expense and an increase in the number of shares which may have a net dilutive effect on the earnings per share. The exercise of outstanding vested employee stock options would have a dilutive effect. The exercise of the outstanding vested Genentech employee stock options would have a dilutive effect if the net income of Genentech is positive. The diluted earnings per share and non-voting equity security reflects the potential impacts of these dilutive effects on the earnings per share figures.
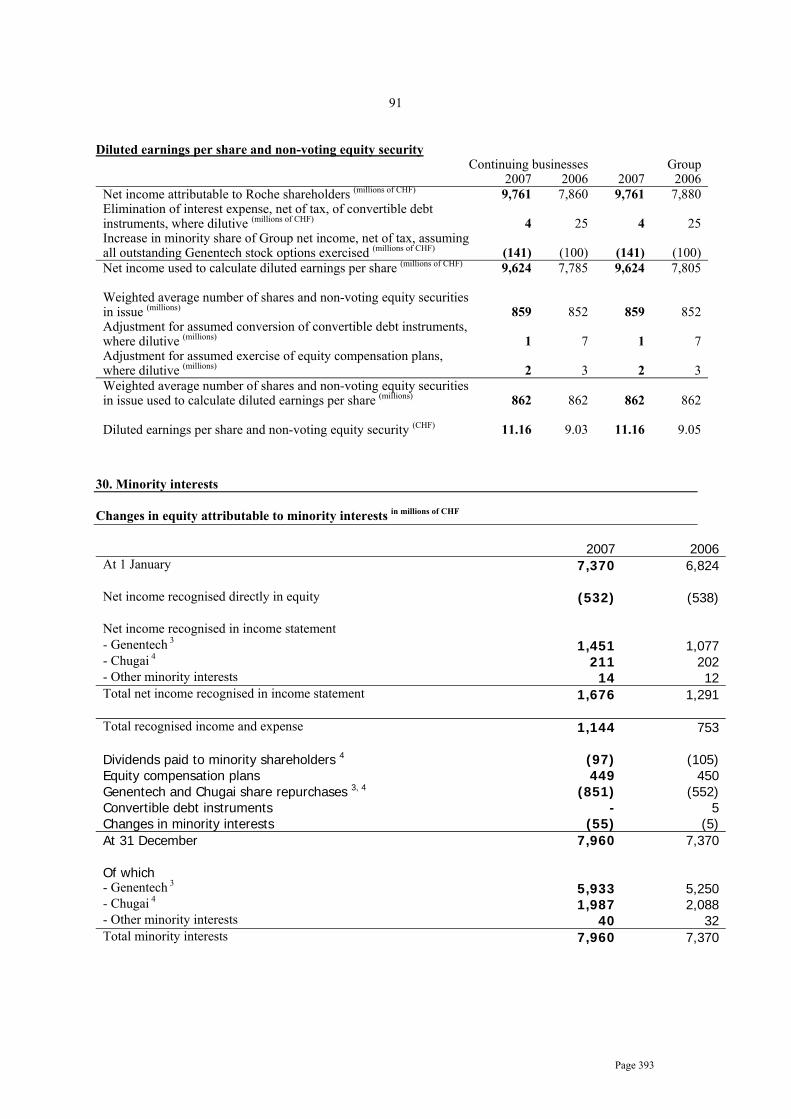
Page 393
91
Diluted earnings per share and non-voting equity security
Continuing businesses Group 2007 2006 2007 2006 Net income attributable to Roche shareholders (millions of CHF) 9,761 7,860 9,761 7,880 Elimination of interest expense, net of tax, of convertible debt instruments, where dilutive (millions of CHF)
4
25
4
25
Increase in minority share of Group net income, net of tax, assuming all outstanding Genentech stock options exercised (millions of CHF)
(141)
(100)
(141)
(100)
Net income used to calculate diluted earnings per share (millions of CHF) 9,624 7,785 9,624 7,805 Weighted average number of shares and non-voting equity securities in issue (millions)
859
852
859
852
Adjustment for assumed conversion of convertible debt instruments, where dilutive (millions)
1
7
1
7
Adjustment for assumed exercise of equity compensation plans, where dilutive (millions)
2
3
2
3
Weighted average number of shares and non-voting equity securities in issue used to calculate diluted earnings per share (millions)
862
862
862
862
Diluted earnings per share and non-voting equity security (CHF) 11.16 9.03 11.16 9.05
30. Minority interests Changes in equity attributable to minority interests in millions of CHF
2007 2006At 1 January 7,370 6,824 Net income recognised directly in equity (532) (538) Net income recognised in income statement - Genentech 3 1,451 1,077 - Chugai 4 211 202- Other minority interests 14 12Total net income recognised in income statement 1,676 1,291 Total recognised income and expense 1,144 753 Dividends paid to minority shareholders 4 (97) (105)Equity compensation plans 449 450Genentech and Chugai share repurchases 3, 4 (851) (552)Convertible debt instruments - 5Changes in minority interests (55) (5)At 31 December 7,960 7,370 Of which - Genentech 3 5,933 5,250 - Chugai 4 1,987 2,088 - Other minority interests 40 32Total minority interests 7,960 7,370

Page 394
92
31. Cash flow statement Cash flows from operating activities Cash flows from operating activities arise from the Group’s primary activities in the Pharmaceuticals and Diagnostics businesses. These are calculated by the indirect method by adjusting the Group’s operating profit for any operating income and expenses that are not cash flows (for example depreciation, amortisation and impairment) in order to derive the cash generated from operations. This and other operating cash flows are shown in the cash flow statement. Operating cash flows also include income taxes paid on all activities, including, for example, the taxes paid on the income from bond conversion and redemption. Cash generated from operations in millions of CHF
2007 2006 Net income 11,437 9,171 Add back non-operating (income) expense - Associated companies 15 (2) (2) - Financial income 5 (1,805) (1,829) - Financing costs 5 971 974 - Income taxes 6 3,867 3,436 - Discontinued businesses 8 - (20) Operating profit 14,468 11,730 Depreciation of property, plant and equipment 12 1,560 1,461 Amortisation of intangible assets 14 976 977 Impairment of intangible assets 14 58 197 Impairment of property, plant and equipment 12 6 71 Operating expenses for defined benefit post-employment plans 10 370 348 Operating expenses for equity-settled equity compensation plans 11 603 620 Other adjustments 439 571 Cash generated from operations 18,480 15,975
Cash flows from investing activities Cash flows from investing activities are principally those arising from the Group’s investments in property, plant and equipment and intangible assets, and from the acquisition and divestment of subsidiaries, associated companies and businesses. Cash flows connected with the Group’s portfolio of marketable securities and other investments are also included, as are any interest and dividend payments received in respect of these securities and investments. These cash flows indicate the Group’s net reinvestment in its operating assets and the cash flow effects of business combinations and divestments, as well as the cash generated by the Group’s other investments. Interest and dividends received in millions of CHF
2007 2006 Interest received 1,071 836 Dividends received 8 10 Total 1,079 846
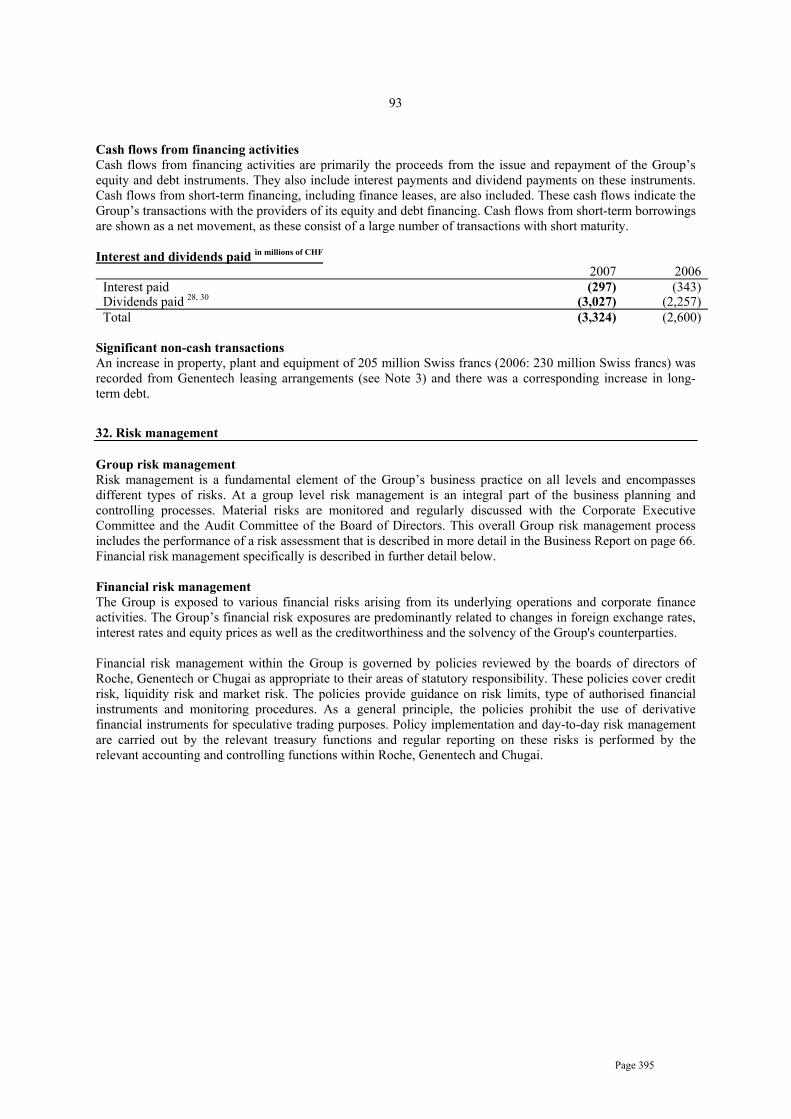
Page 395
93
Cash flows from financing activities Cash flows from financing activities are primarily the proceeds from the issue and repayment of the Group’s equity and debt instruments. They also include interest payments and dividend payments on these instruments. Cash flows from short-term financing, including finance leases, are also included. These cash flows indicate the Group’s transactions with the providers of its equity and debt financing. Cash flows from short-term borrowings are shown as a net movement, as these consist of a large number of transactions with short maturity. Interest and dividends paid in millions of CHF
2007 2006 Interest paid (297) (343) Dividends paid 28, 30 (3,027) (2,257) Total (3,324) (2,600)
Significant non-cash transactions An increase in property, plant and equipment of 205 million Swiss francs (2006: 230 million Swiss francs) was recorded from Genentech leasing arrangements (see Note 3) and there was a corresponding increase in long-term debt.
32. Risk management Group risk management Risk management is a fundamental element of the Group’s business practice on all levels and encompasses different types of risks. At a group level risk management is an integral part of the business planning and controlling processes. Material risks are monitored and regularly discussed with the Corporate Executive Committee and the Audit Committee of the Board of Directors. This overall Group risk management process includes the performance of a risk assessment that is described in more detail in the Business Report on page 66. Financial risk management specifically is described in further detail below. Financial risk management The Group is exposed to various financial risks arising from its underlying operations and corporate finance activities. The Group’s financial risk exposures are predominantly related to changes in foreign exchange rates, interest rates and equity prices as well as the creditworthiness and the solvency of the Group's counterparties. Financial risk management within the Group is governed by policies reviewed by the boards of directors of Roche, Genentech or Chugai as appropriate to their areas of statutory responsibility. These policies cover credit risk, liquidity risk and market risk. The policies provide guidance on risk limits, type of authorised financial instruments and monitoring procedures. As a general principle, the policies prohibit the use of derivative financial instruments for speculative trading purposes. Policy implementation and day-to-day risk management are carried out by the relevant treasury functions and regular reporting on these risks is performed by the relevant accounting and controlling functions within Roche, Genentech and Chugai.

Page 396
94
The carrying amount and fair value of financial assets by asset class in millions of CHF
Carrying value by asset classes
By line Items in notes
Available-for-
sale
Cash FVtPLa) -
designated
FVtPLa)- held for trading
Held to maturity
Loans and
receivables
Total
Fair value
Year ended 31 December 2007
Accounts receivable
- - - - - 9,804 9,804 9,804
Accrued interest income
- - - - - 37 37 37
Marketable securities: -Money market instruments and time accounts over 3 months -Bonds and debentures -Shares -Other investments
10,965
7,624
292 14
-
-
- -
167
78
- 178
-
1,129
- -
-
-
- -
-
-
- -
11,132
8,831
292 192
11,132
8,831
292 192
Cash and cash equivalents
- 3,755 - - - - 3,755 3,755
Derivative financial instruments
- - - 70 - - 70 70
Available-for-sale investments
836 - - - - - 836 836
Held-to-maturity investments
- - - - 19 - 19 19
Loans receivable - - - - - 19 19 19 Long-term trade receivables
- - - - - 190 190 190
Other financial current assets
- - - - - 593 593 593
Restricted cash - - - - - 1,115 1,115 1,115 Other long-term assets
- - - - - 43 43 43
Total 19,731 3,755 423 1,199 19 11,801 36,928 36,928 a) Fair-value-through-profit-or-loss
.
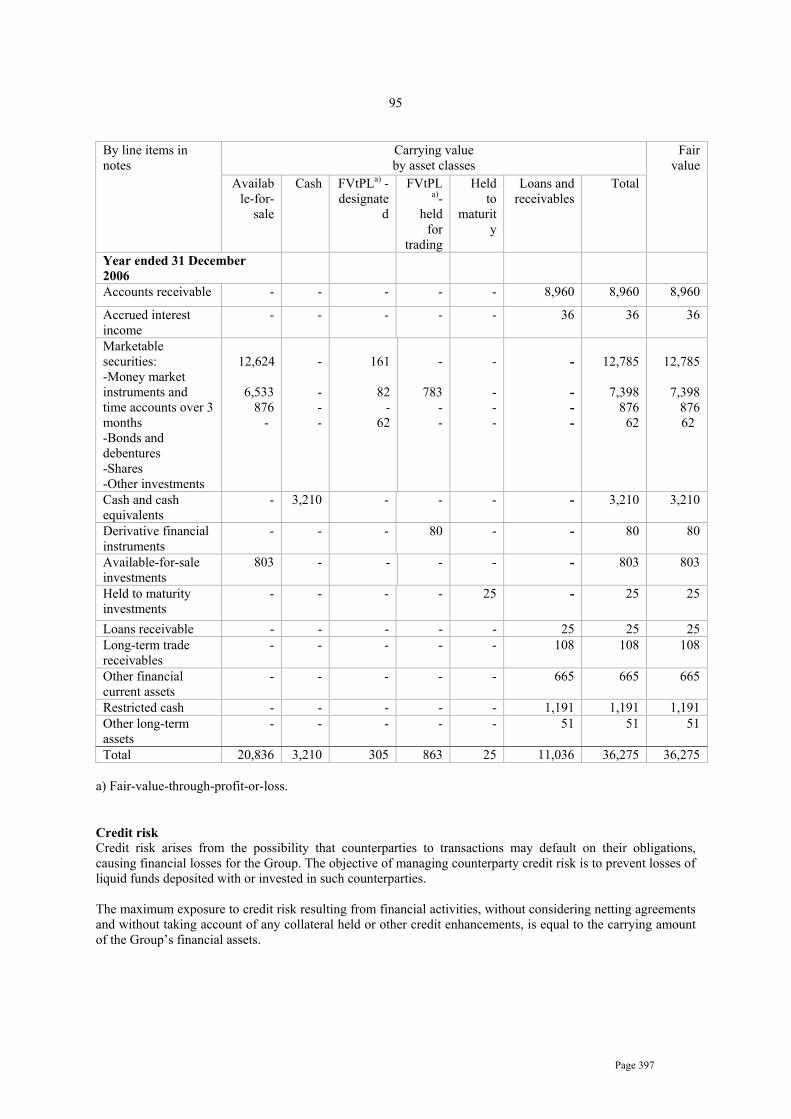
Page 397
95
Carrying value by asset classes
By line items in notes Availab
le-for-sale
Cash FVtPLa) - designate
d
FVtPLa)-
held for
trading
Held to
maturity
Loans and receivables
Total
Fair value
Year ended 31 December 2006
Accounts receivable - - - - - 8,960 8,960 8,960
Accrued interest income
- - - - - 36 36 36
Marketable securities: -Money market instruments and time accounts over 3 months -Bonds and debentures -Shares -Other investments
12,624
6,533
876 -
-
- - -
161
82
- 62
-
783 - -
-
- - -
-
- - -
12,785
7,398
876 62
12,785
7,398
876 62
Cash and cash equivalents
- 3,210 - - - - 3,210 3,210
Derivative financial instruments
- - - 80 - - 80 80
Available-for-sale investments
803 - - - - - 803 803
Held to maturity investments
- - - - 25 - 25 25
Loans receivable - - - - - 25 25 25 Long-term trade receivables
- - - - - 108 108 108
Other financial current assets
- - - - - 665 665 665
Restricted cash - - - - - 1,191 1,191 1,191 Other long-term assets
- - - - - 51 51 51
Total 20,836 3,210 305 863 25 11,036 36,275 36,275 a) Fair-value-through-profit-or-loss.
Credit risk Credit risk arises from the possibility that counterparties to transactions may default on their obligations, causing financial losses for the Group. The objective of managing counterparty credit risk is to prevent losses of liquid funds deposited with or invested in such counterparties. The maximum exposure to credit risk resulting from financial activities, without considering netting agreements and without taking account of any collateral held or other credit enhancements, is equal to the carrying amount of the Group’s financial assets.
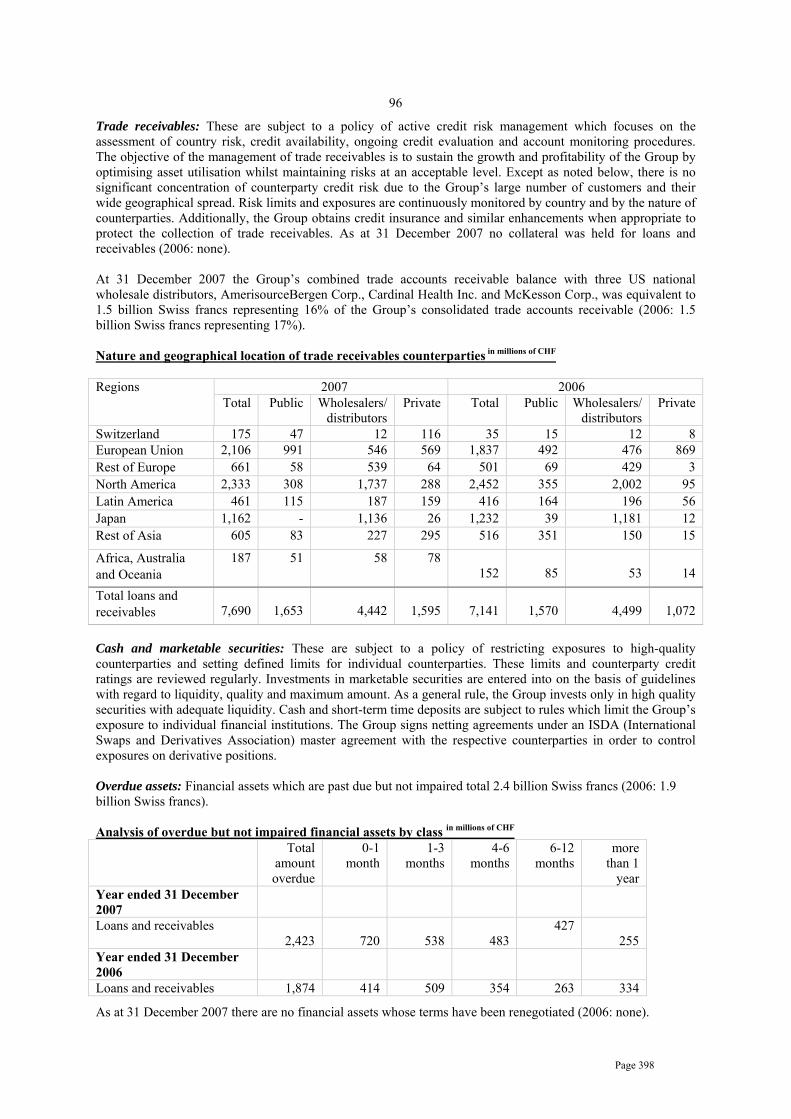
Page 398
96
Trade receivables: These are subject to a policy of active credit risk management which focuses on the assessment of country risk, credit availability, ongoing credit evaluation and account monitoring procedures. The objective of the management of trade receivables is to sustain the growth and profitability of the Group by optimising asset utilisation whilst maintaining risks at an acceptable level. Except as noted below, there is no significant concentration of counterparty credit risk due to the Group’s large number of customers and their wide geographical spread. Risk limits and exposures are continuously monitored by country and by the nature of counterparties. Additionally, the Group obtains credit insurance and similar enhancements when appropriate to protect the collection of trade receivables. As at 31 December 2007 no collateral was held for loans and receivables (2006: none). At 31 December 2007 the Group’s combined trade accounts receivable balance with three US national wholesale distributors, AmerisourceBergen Corp., Cardinal Health Inc. and McKesson Corp., was equivalent to 1.5 billion Swiss francs representing 16% of the Group’s consolidated trade accounts receivable (2006: 1.5 billion Swiss francs representing 17%). Nature and geographical location of trade receivables counterparties in millions of CHF
2007 2006 Regions Total Public Wholesalers/
distributors Private Total Public Wholesalers/
distributors Private
Switzerland 175 47 12 116 35 15 12 8 European Union 2,106 991 546 569 1,837 492 476 869 Rest of Europe 661 58 539 64 501 69 429 3 North America 2,333 308 1,737 288 2,452 355 2,002 95 Latin America 461 115 187 159 416 164 196 56 Japan 1,162 - 1,136 26 1,232 39 1,181 12 Rest of Asia 605 83 227 295 516 351 150 15
Africa, Australia and Oceania
187 51 58 78 152
85
53
14
Total loans and receivables
7,690
1,653
4,442
1,595
7,141
1,570
4,499
1,072
Cash and marketable securities: These are subject to a policy of restricting exposures to high-quality counterparties and setting defined limits for individual counterparties. These limits and counterparty credit ratings are reviewed regularly. Investments in marketable securities are entered into on the basis of guidelines with regard to liquidity, quality and maximum amount. As a general rule, the Group invests only in high quality securities with adequate liquidity. Cash and short-term time deposits are subject to rules which limit the Group’s exposure to individual financial institutions. The Group signs netting agreements under an ISDA (International Swaps and Derivatives Association) master agreement with the respective counterparties in order to control exposures on derivative positions. Overdue assets: Financial assets which are past due but not impaired total 2.4 billion Swiss francs (2006: 1.9 billion Swiss francs). Analysis of overdue but not impaired financial assets by class in millions of CHF Total
amount overdue
0-1 month
1-3 months
4-6 months
6-12 months
more than 1
year Year ended 31 December 2007
Loans and receivables 2,423
720
538
483
427 255
Year ended 31 December 2006
Loans and receivables 1,874 414 509 354 263 334
As at 31 December 2007 there are no financial assets whose terms have been renegotiated (2006: none).

Page 399
97
Liquidity risk
Liquidity risk arises through a surplus of financial obligations over available financial assets due at any point in time. The Group’s approach to liquidity risk is to maintain sufficient readily available reserves in order to meet its liquidity requirements at any point in time. Group liquidity is reported to senior management on a monthly basis. All members of the Group enjoy strong credit quality and are rated by at least one major credit rating agency. The ratings will permit Roche, Genentech and Chugai efficient access to the international capital markets in the event of major financing requirements. In addition, the Group has unused committed credit lines with various financial institutions totalling 5.7 billion Swiss francs (2006: unused committed credit lines of 4.3 billion Swiss francs). Contractual maturity analysis of financial liabilities in millions of CHF
a) Total debt in the above table shows undiscounted cash flows, whereas the carrying value in the consolidated balance sheet reflects discounted cash flows. Market risk
Market risk arises from changing market prices of the Group’s financial assets or financial liabilities. Market risk may affect the Group financial result and the value of Group equity. The Group uses Value-at-Risk (VaR) to measure the impact of market risk on its financial instruments. Roche has defined VaR limits to manage market risk. VaR data are reported on a monthly basis and indicate the value range within which a given financial instrument will fluctuate with a pre-set probability as a result of movements in market prices. VaR is a statistical measure which implicitly assumes that value changes of the recent past are indicative of value changes in the future. VaR figures do not represent actual or expected losses, or possible worst-case losses over the stated period. Also, VaR does not consider any effects of favourable market movements. VaR figures are calculated using a historical simulation approach. For each scenario, all financial instruments are fully valued and the total change in value and earnings is determined. All VaR calculations are based on a 95% confidence level and a holding period of 20 trading days over the past 10 years. This holding period reflects the time required to change the corresponding risk exposure, should this be deemed appropriate. Longer holding periods increase the probability of higher value changes and lead to increased VaR figures.
Total
0-3 months
4-6 months
7-12 months
1-2 years
2-3 years
3-4 years
4-5 years
Over 5
years Year ended 31 December 2007 Total debt a) 8,953 1,954 30 1,418 762 738 151 152 3,748 Trade payables 1,188 1,177 10 1 - - - - - Accruals 5,319 3,945 431 881 62 - - - - Derivative financial instruments
80 80 - - - - - - -
Other liabilities: current & non-current
1,253 513 51 127 284 10 186 10 72
Total financial liabilities 16,793 7,669 522 2,427 1,108 748 337 162 3,820
Year ended 31 December 2006 Total debt a) 10,892 454 173 1,776 2,497 824 799 162 4,207 Trade payables 1,399 1,379 15 2 3 - - - - Accruals 5,126 3,596 233 1,202 95 - - - - Derivative financial instruments
62 62 - - - - - - -
Other liabilities: current & non-current
1,347 792 47 84 160 10 182 9 63
Total financial liabilities 18,826 6,283 468 3,064 2,755 834 981 171 4,270
Page 400
98
Market risk of financial instruments in millions of CHF 31 December 2007 31 December 2006 VaR - foreign exchange component 75 35 VaR - interest rate component 40 69 VaR - other price component 93 101 Diversification (65) (44) VaR - total market risk 143 161 At the end of 2007, the total VaR of the financial assets and liabilities was 143 million Swiss francs (2006: 161 million Swiss francs). The foreign exchange VaR increased mainly due to higher hedging levels of non-US dollar cash flows from future royalty income over the next five years at Genentech. The lower contribution from the interest rate component was caused by the ageing of fixed-term liabilities. Other price risk arises mainly from movements in the prices of equity securities. In 2007, the Group held equity securities with a market value of 1.1 billion Swiss Francs (2006: 1.7 billion Swiss francs). This number includes holdings in biotechnology companies, which were acquired in the context of licensing transactions or scientific collaborations. The lower holdings in equity securities resulted in a lower VaR for other price risk.
Foreign exchange risk
The Group operates across the world and is exposed to movements in foreign currencies affecting the Group financial result and the value of Group’s equity. Foreign exchange risk arises because the amount of local currency paid or received for transactions denominated in foreign currencies may vary due to changes in exchange rates (‘transaction exposures’) and because the foreign currency denominated financial statements of the Group’s foreign subsidiaries may vary upon consolidation into the Swiss franc denominated Group Financial Statements (‘translation exposures’). The objective of the Group’s foreign exchange risk management activities is to preserve the economic value of its current and future assets and to minimise the volatility of the Group’s financial result. The primary focus of the Group’s foreign exchange risk management activities is on hedging transaction exposures arising through foreign currency flows or monetary positions held in foreign currencies. The Group does not currently hedge translation exposures using financial instruments. The Group monitors transaction exposures on a daily basis. The net foreign exchange result and the corresponding VaR parameters are reported on a monthly basis. The Group uses forward contracts, foreign exchange options and cross-currency swaps to hedge transaction exposures. Application of these instruments intends to continuously lock in favourable developments of foreign exchange rates, thereby reducing the exposure to potential future movements in such rates.
Interest rate risk
Interest rate risk arises from movements in interest rates which could affect the Group financial result or the value of Group equity. Changes in interest rates may cause variations in interest income and expense. In addition, they may affect the market value of certain financial assets, liabilities and hedging instruments. The primary objective of the Group’s interest rate management is to protect the net interest result. Interest rate exposures and the corresponding VaR parameters are reported on a monthly basis. The Group uses forward contracts, options and swaps to hedge its interest rate exposures. Depending on the interest rate environment of major currencies, the Group will use these instruments to generate the appropriate mix of fixed and floating rate exposures.
Page 401
99
Other price risk Other price risk arises mainly from movements in the prices of equity securities held by Roche, Genentech or Chugai. In 2007, the Group held equity securities with a market value of 1.1 billion Swiss francs (2006: 1.7 billion Swiss francs). This amount includes holdings in biotechnology companies, which were acquired in the context of licensing transactions or scientific collaborations. Due to the nature of their business, biotechnology companies are exposed to greater equity volatilities than general stock market fluctuations. The Group manages the price risk through placing limits on individual and total equity investments. These limits are defined both as a percentage of total liquid funds and as an absolute number for individual equity investments. Equity price risk is reported as a VaR figure on a monthly basis to senior management. Impairment of financial assets During 2007 impairments of shares were triggered by a significant or prolonged price decline below cost value. Impairments of debt securities were recorded due to significant financial difficulties of the issuers. Impairment losses by asset classes in millions of CHF 2007 2006Loans and receivables (26) 3Available-for-sale financial assets - shares (35) - - investments - (9) - debt securities (68) -Total impairment losses (129) (6) Capital The Group defines the capital that it manages as the Group’s total equity, including minority interests. The Group’s objectives when managing capital are:
• To safeguard the Group’s ability to continue as a going concern, so that it can continue to provide benefits for patients and returns to investors.
• To provide an adequate return to investors based on the level of risk undertaken. • To have available the necessary financial resources to allow the Group to invest in areas that may
deliver future benefits for patients and returns to investors. • To maintain sufficient financial resources to mitigate against risks and unforeseen events.
Capital is monitored on the basis of the equity ratio, which is calculated as being equity (including minority interests) as a percentage of total assets. This is reported to senior management as part of the Group’s regular internal management reporting. The Group’s capital and equity ratio are shown in the table below. Capital in millions of CHF
2007 2006 Capital and reserves attributable to Roche shareholders 28 45,347 39,444 Equity attributable to minority interests 30 7,960 7,370 Total equity 53,307 46,814 Total assets 78,183 74,414 Equity ratio 68.2% 62.9%
The Group is not subject to regulatory capital adequacy requirements as known in the financial services industry. The Group has majority shareholdings in Genentech (see Note 3) and Chugai (see Note 4). Genentech and Chugai are both public companies and their objectives, policies and processes for managing their own capital are determined by local management.
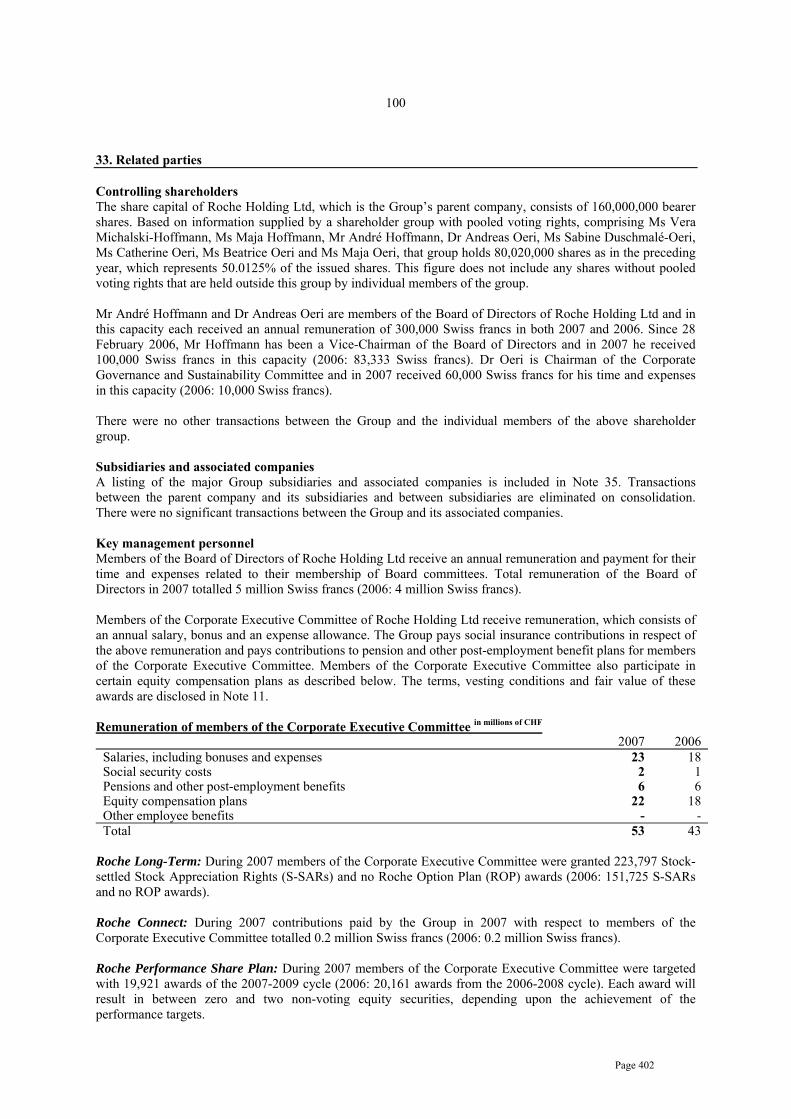
Page 402
100
33. Related parties Controlling shareholders The share capital of Roche Holding Ltd, which is the Group’s parent company, consists of 160,000,000 bearer shares. Based on information supplied by a shareholder group with pooled voting rights, comprising Ms Vera Michalski-Hoffmann, Ms Maja Hoffmann, Mr André Hoffmann, Dr Andreas Oeri, Ms Sabine Duschmalé-Oeri, Ms Catherine Oeri, Ms Beatrice Oeri and Ms Maja Oeri, that group holds 80,020,000 shares as in the preceding year, which represents 50.0125% of the issued shares. This figure does not include any shares without pooled voting rights that are held outside this group by individual members of the group. Mr André Hoffmann and Dr Andreas Oeri are members of the Board of Directors of Roche Holding Ltd and in this capacity each received an annual remuneration of 300,000 Swiss francs in both 2007 and 2006. Since 28 February 2006, Mr Hoffmann has been a Vice-Chairman of the Board of Directors and in 2007 he received 100,000 Swiss francs in this capacity (2006: 83,333 Swiss francs). Dr Oeri is Chairman of the Corporate Governance and Sustainability Committee and in 2007 received 60,000 Swiss francs for his time and expenses in this capacity (2006: 10,000 Swiss francs). There were no other transactions between the Group and the individual members of the above shareholder group. Subsidiaries and associated companies A listing of the major Group subsidiaries and associated companies is included in Note 35. Transactions between the parent company and its subsidiaries and between subsidiaries are eliminated on consolidation. There were no significant transactions between the Group and its associated companies. Key management personnel Members of the Board of Directors of Roche Holding Ltd receive an annual remuneration and payment for their time and expenses related to their membership of Board committees. Total remuneration of the Board of Directors in 2007 totalled 5 million Swiss francs (2006: 4 million Swiss francs). Members of the Corporate Executive Committee of Roche Holding Ltd receive remuneration, which consists of an annual salary, bonus and an expense allowance. The Group pays social insurance contributions in respect of the above remuneration and pays contributions to pension and other post-employment benefit plans for members of the Corporate Executive Committee. Members of the Corporate Executive Committee also participate in certain equity compensation plans as described below. The terms, vesting conditions and fair value of these awards are disclosed in Note 11. Remuneration of members of the Corporate Executive Committee in millions of CHF
2007 2006 Salaries, including bonuses and expenses 23 18 Social security costs 2 1 Pensions and other post-employment benefits 6 6 Equity compensation plans 22 18 Other employee benefits - - Total 53 43
Roche Long-Term: During 2007 members of the Corporate Executive Committee were granted 223,797 Stock-settled Stock Appreciation Rights (S-SARs) and no Roche Option Plan (ROP) awards (2006: 151,725 S-SARs and no ROP awards). Roche Connect: During 2007 contributions paid by the Group in 2007 with respect to members of the Corporate Executive Committee totalled 0.2 million Swiss francs (2006: 0.2 million Swiss francs). Roche Performance Share Plan: During 2007 members of the Corporate Executive Committee were targeted with 19,921 awards of the 2007-2009 cycle (2006: 20,161 awards from the 2006-2008 cycle). Each award will result in between zero and two non-voting equity securities, depending upon the achievement of the performance targets.

Page 403
101
Transactions with former members of the Corporate Executive Committee: Mr Heino von Prondzynski stepped down from the Corporate Executive Committee on 31 December 2005. During 2006 he assisted with the transition to his successor and he resigned from Roche effective 31 December 2006. In 2007 he received a bonus of 0.4 million Swiss francs in respect of services rendered in 2006 and additionally received a total of 12,212 non-voting equity securities based on pro-rated Roche Performance Share Plan awards. His total remuneration in 2006 was 3 million Swiss francs. Pensions totalling 2 million Swiss francs (2006: 2 million Swiss francs) were paid by the Group to two other former Corporate Executive Committee members. The detailed disclosures regarding executive remuneration that are required by Swiss law are included in the financial statements of Roche Holding Ltd, Basel on pages 118-121. Post-employment benefit plans Transactions between the Group and the various post-employment defined benefit plans for the employees of the Group are described in Note 10.
34. Subsequent events On 22 January 2008 the Group announced that it had signed an agreement to acquire a 100% controlling interest in Ventana Medical Systems, Inc. (‘Ventana’). Further details are given in Note 7. There were no other significant events after the balance sheet date.
35.Subsidiaries and associated companies
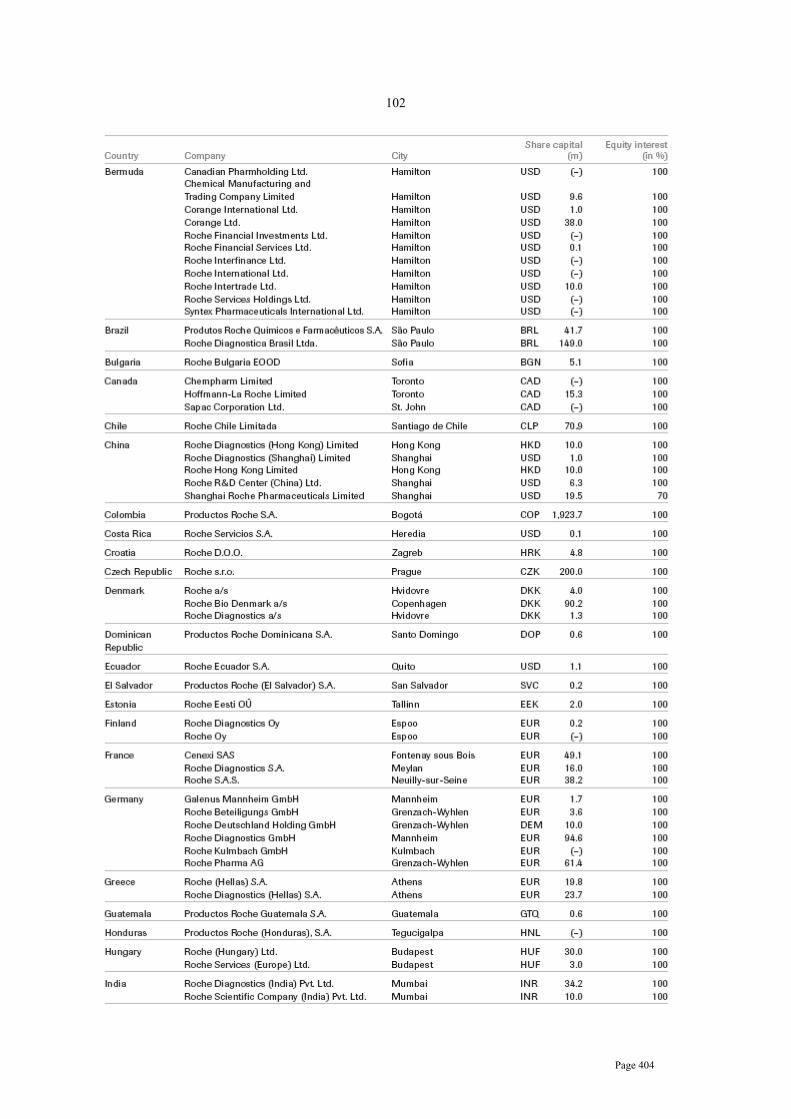
Page 404
102

Page 405
103

Page 406
104

Page 407
105
Report of Roche Management Report of Roche Management on Internal Control over Financial Reporting The Board of Directors and management of Roche Holding Ltd are responsible for establishing and maintaining adequate control over financial reporting. The internal control system was designed to provide reasonable assurance over the reliability of financial reporting and the preparation and fair presentation of consolidated financial statements in accordance with International Financial Reporting Standards. All internal control systems, no matter how well designed, have inherent limitations. Therefore, even those systems determined to be effective may not prevent or detect misstatements and can provide only reasonable assurance with respect to financial statement preparation and presentation. Also, projections of any evaluation of effectiveness to future periods are subject to the risk that controls may become inadequate because of changes in conditions or that the degree of compliance with the policies or procedures may deteriorate. Management assessed the effectiveness of its system of internal control over financial reporting as of 31 December 2007 based on the criteria for effective internal control over financial reporting described in Internal Control - Integrated Framework issued by the Committee of Sponsoring Organisations of the Treadway Commission (COSO). Based on this assessment, management has concluded that the system of internal control over financial reporting was effective as of 31 December 2007.
The Group Auditors KPMG Klynveld Peat Marwick Goerdeler SA, have audited the consolidated financial statements of Roche Holding Ltd for the year ended 31 December 2007, in accordance with Swiss auditing standards and with the International Standards on Auditing (ISA). They have also issued a report on the effectiveness of the Group’s system of internal control over financial reporting. This report is set out on page 107.
Franz B. Humer Erich Hunziker Chairman of the Board of Directors Chief Financial Officer and Deputy Head of and Chief Executive Officer the Corporate Executive Committee Basel, 24 January 2008
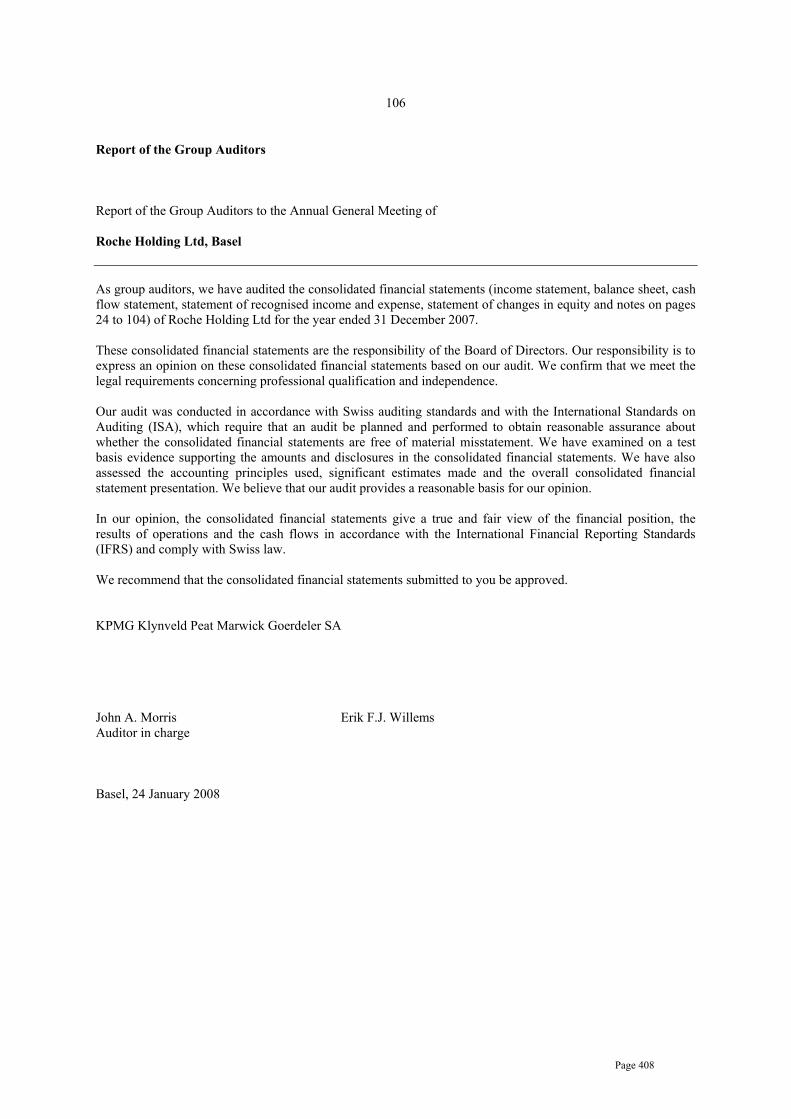
Page 408
106
Report of the Group Auditors Report of the Group Auditors to the Annual General Meeting of Roche Holding Ltd, Basel As group auditors, we have audited the consolidated financial statements (income statement, balance sheet, cash flow statement, statement of recognised income and expense, statement of changes in equity and notes on pages 24 to 104) of Roche Holding Ltd for the year ended 31 December 2007. These consolidated financial statements are the responsibility of the Board of Directors. Our responsibility is to express an opinion on these consolidated financial statements based on our audit. We confirm that we meet the legal requirements concerning professional qualification and independence. Our audit was conducted in accordance with Swiss auditing standards and with the International Standards on Auditing (ISA), which require that an audit be planned and performed to obtain reasonable assurance about whether the consolidated financial statements are free of material misstatement. We have examined on a test basis evidence supporting the amounts and disclosures in the consolidated financial statements. We have also assessed the accounting principles used, significant estimates made and the overall consolidated financial statement presentation. We believe that our audit provides a reasonable basis for our opinion. In our opinion, the consolidated financial statements give a true and fair view of the financial position, the results of operations and the cash flows in accordance with the International Financial Reporting Standards (IFRS) and comply with Swiss law. We recommend that the consolidated financial statements submitted to you be approved. KPMG Klynveld Peat Marwick Goerdeler SA John A. Morris Erik F.J. Willems Auditor in charge Basel, 24 January 2008

Page 409
107
Report of the Group Auditors on Internal Control over Financial Reporting Report of the Group Auditors to the Annual General Meeting of Roche Holding Ltd, Basel We have examined the Roche Group’s system of internal control over financial reporting as of 31 December 2007, based on criteria established in Internal Control – Integrated Framework issued by the Committee of Sponsoring Organisations of the Treadway Commission (COSO). The Board of Directors and management of Roche Holding Ltd are responsible for maintaining effective internal control over financial reporting and for its assessment of the effectiveness of internal control over financial reporting as included in the accompanying consolidated financial statements. Our responsibility is to express an opinion on the company’s internal control over financial reporting based on our examination. An entity’s internal control over financial reporting is a process effected by the entity’s board of directors, management, and other personnel, designed to provide reasonable assurance regarding the reliability of financial statements prepared in accordance with International Financial Reporting Standards (IFRS) and includes those policies and procedures that (1) pertain to the maintenance of records that, in reasonable detail, accurately and fairly reflect the transactions and dispositions of the assets of the entity; (2) provide reasonable assurance that transactions are recorded as necessary to permit the preparation of financial statements in accordance with the applicable financial reporting framework; and (3) provide reasonable assurance regarding the prevention or timely detection of the unauthorised acquisition, use, or disposition of the entity's assets that could have a material effect on the entity’s financial statements. We conducted our examination in accordance with the International Standard on Assurance Engagements 3000 (ISAE 3000). This standard requires that we plan and perform our examination to obtain reasonable assurance about whether effective internal control over financial reporting was maintained in all material aspects. Our examination included obtaining an understanding of internal control over financial reporting, testing and evaluating the design and operating effectiveness of internal control, and performing such other procedures as we considered necessary in the circumstances. We believe that our examination provides a reasonable basis for our opinion. Because of the inherent limitations of internal control over financial reporting, including the possibility of management override of controls, misstatements due to error or fraud may occur and not be detected. Also, projections of any evaluation of internal control over financial reporting to future periods are subject to the risk that internal control may become inadequate because of changes in conditions or because the degree of compliance with the policies or procedures may deteriorate. In our opinion, the Roche Group maintained, in all material respects, effective internal control, over financial reporting as of 31 December 2007, based on criteria established in Internal Control – Integrated Framework issued by the Committee of Sponsoring Organisations of the Treadway Commission (COSO). We also have audited, in accordance with Swiss auditing standards and International Standards on Auditing (ISA), the consolidated financial statements of Roche Holding Ltd for the year ended 31 December 2007 and our report dated 24 January 2008 expressed an unqualified opinion. KPMG Klynveld Peat Marwick Goerdeler SA John A. Morris Erik F.J. Willems Auditor in charge Basel, 24 January 2008

Page 410
AUDITED CONSOLIDATED FINANCIALS STATEMENTS OF THE ROCHE GROUP AS AT AND FOR THE YEAR ENDED 31 DECEMBER 2006*
* Please note that the page numbers at the top of the pages in this section are the page numbers from the
original 2006 Annual Report, Part 2 Finance Report commencing on page 22 and ending on page 97 (comprising in total 76 pages).

Page 411
22
Roche Group Consolidated Financial Statements
Reference numbers indicate corresponding Notes to the Consolidated Financial Statements.
Consolidated income statement for the year ended 31 December 2006 in millions of CHF
Pharmaceuticals Diagnostics Corporate Group
Sales3 33,294 8,747 - 42,041
Royalties and other operating income6 1,277 189 - 1,466
Cost of sales (6,868) (3,748) - (10,616)
Marketing and distribution (8,761) (2,095) - (10,856)
Research and development3 (5,889) (700) - (6,589)
General and administration (1,849) (456) (237) (2,542)
Amortisation and impairment of intangible assets3 (659) (515) - (1,174)
Operating profit before exceptional items3 10,545 1,422 (237) 11,730
Major legal cases7 - - - -
Operating profit3 10,545 1,422 (237) 11,730
Associated companies18 2
Financial income8 1,829
Financing costs8 (974)
Profit before taxes 12,587
Income taxes9 (3,436)
Profit from continuing businesses 9,151
Profit from discontinued businesses11 20
Net income 9,171
Attributable to
- Roche shareholders 7,880
- Minority interests 1,291
Earnings per share and non-voting equity security32
Continuing businesses Group
Basic (CHF) 9.22 9.24
Diluted (CHF) 9.03 9.05

Page 412
23
Consolidated income statement for the year ended 31 December 2005 in millions of CHF
Pharmaceuticals Diagnostics Corporate Group
Sales3 27,268 8,243 - 35,511
Royalties and other operating income6 1,176 271 - 1,447
Cost of sales (6,016) (3,254) - (9,270)
Marketing and distribution (7,458) (2,049) - (9,507)
Research and development3 (4,970) (702) - (5,672)
General and administration (1,785) (403) (121) (2,309)
Amortisation and impairment of intangible assets3 (676) (335) - (1,011)
Operating profit before exceptional items3 7,539 1,771 (121) 9,189
Major legal cases7 (210) (146) - (356)
Operating Profit3 7,329 1,625 (121) 8,833
Associated companies18 1
Financial income8 1,313
Financing costs8 (985)
Profit before taxes 9,162
Income taxes9 (2,284)
Profit from continuing businesses 6,878
Profit from discontinued businesses11 (12)
Net income 6,866
Attributable to
- Roche shareholders 5,923
- Minority interests 943
Earnings per share and non-voting equity security32
Continuing businesses Group
Basic (CHF) 7.02 7.01
Diluted (CHF) 6.89 6.87
As disclosed in Note 1, the income statement for 2005 has been restated following the changes in IFRS that were adopted effective in 1 January 2006. A reconciliation to the previously published income statement is provided in Note 1.

Page 413
24
Consolidated balance sheet in millions of CHF 31 December 2006 31 December 2005 Non-current assets Property, plant and equipment15 16,417 15,097 Goodwill16 5,914 6,132 Intangible assets17 5,469 6,256 Associated companies18 7 58 Financial long-term assets19 2,152 2,190 Other long-term assets19 794 660 Deferred income tax assets9 1,935 2,551 Post-employment benefit assets13 831 625 Total non-current assets 33,519 33,569 Current assets Inventories20 5,592 5,041 Accounts receivable21 8,960 7,698 Current income tax assets9 258 299 Other current assets22 1,754 1,703 Marketable securities23 21,121 16,657 Cash and cash equivalents24 3,210 4,228 Total current assets 40,895 35,626 Total assets 74,414 69,195 Non-current liabilities Long-term debt30 (6,199) (9,322) Deferred income tax liabilities9 (2,310) (3,462) Post-employment benefit liabilities13 (4,221) (4,408) Provisions28 (1,593) (1,547) Other non-current liabilities29 (585) (806) Total non-current liabilities (14,908) (19,545) Current liabilities Short-term debt30 (2,044) (348) Current income tax liabilities9 (2,034) (811) Provisions28 (756) (833) Accounts payable25 (2,213) (2,373) Accrued and other current liabilities26 (5,645) (5,127) Total current liabilities (12,692) (9,492) Total liabilities (27,600) (29,037) Total net assets 46,814 40,158 Equity Capital and reserves attributable to Roche shareholders31 39,444 33,334 Equity attributable to minority interests33 7,370 6,824 Total equity 46,814 40,158
As disclosed in Note 1, the balance sheet for 2005 has been restated following the changes in IFRS that were adopted effective 1 January 2006. A reconciliation to the previously published balance sheet is provided in Note 1.

Page 414
25
Consolidated cash flow statement in millions of CHF Year ended 31 December
2006 2005 Cash flows from operating activities Cash generated from operations35 15,975 12,521 (Increase) decrease in working capital (1,897) 488 Major legal cases7 (31) (180) Payments made for defined benefit post-employment plans13 (323) (303) Utilisation of restructuring provisions28 (98) (119) Utilisation of other provisions28 (344) (310) Other operating cash flows (156) (125) Cash flows from operating activities, before income taxes paid 13,126 11,972 Income taxes paid (2,797) (1,997) Total cash flows from operating activities 10,329 9,975 Cash flows from investing activities Purchase of property, plant and equipment (3,561) (3,319) Purchase of intangible assets (593) (349) Disposal of property, plant and equipment 330 353 Disposal of intangible assets 1 2 Disposal of products6 15 56 Business combinations10 - (233) Divestments of discontinued businesses11 (5) 2,902 Other divestments of subsidiaries4 14 - Interest and dividends received35 846 383 Sales of marketable securities 5,236 9,859 Purchases of marketable securities (9,689) (15,190) Other investing cash flows (44) (150) Total cash flows from investing activities (7,450) (5,686) Cash flows from financing activities Proceeds from issue of long-term debt instruments30 - 2,565 Repayment and redemption of long-term debt instruments30 (1,264) (1,178) Increase (decrease) in other long-term debt instruments (638) (1,083) Transactions in own equity instruments31 1,367 779 Increase (decrease) in short-term borrowings 200 (422) Interest and dividends paid35 (2,600) (1,983) Exercises of equity-settled equity compensation plans14 480 1,090 Genentech share repurchases4 (1,248) (2,511) Other financing cash flows (12) (38) Total cash flows from financing activities (3,715) (2,781) Net effect of currency translation on cash and cash equivalents (182) 115 Increase (decrease) in cash and cash equivalents (1,018) 1,623 Cash and cash equivalents at 1 January 4,228 2,605 Cash and cash equivalents at 31 December24 3,210 4,228

Page 415
26
Consolidated statement of recognised income and expense in millions of CHF
Year ended 2006
31 December 2005
Available-for-sale investments
- Valuation gains (losses) taken to equity31 292 (77)
- Transferred to income statement on sale or impairment31 (184) (73)
Cash flow hedges
- Gains (losses) taken to equity31 (71) 178
- Transferred to income statement31 - -
- Transferred to the initial balance sheet carrying value of hedged items31 - -
Exchange differences on translation of foreign operations31 (1,487) 2,376
Defined benefit post-employment plans
- Actuarial gains (losses)31 761 (552)
- Limit on asset recognition31 (396) -
Income taxes on items taken directly to or transferred from equity31 (135) 231
Net income recognised directly in equity (1,220) 2,083
Net income recognised in income statement 9,171 6,866
Total recognised income and expense 7,951 8,949
Attributable to
- Roche shareholders31 7,198 7,406
- Minority interests33 753 1,543
Total 7,951 (8,949)
Effect of changes in accounting policy attributable to
- Roche shareholders1 - (1,257)
- Minority interests1 - (5)
Total - (1,262)
As disclosed in Note 1, the statement of recognised income and expense for 2005 has been restated following the changes in IFRS that were adopted effective 1 January 2006. A reconciliation to the previously published statement of recognised income and expense is provided in Note 1.
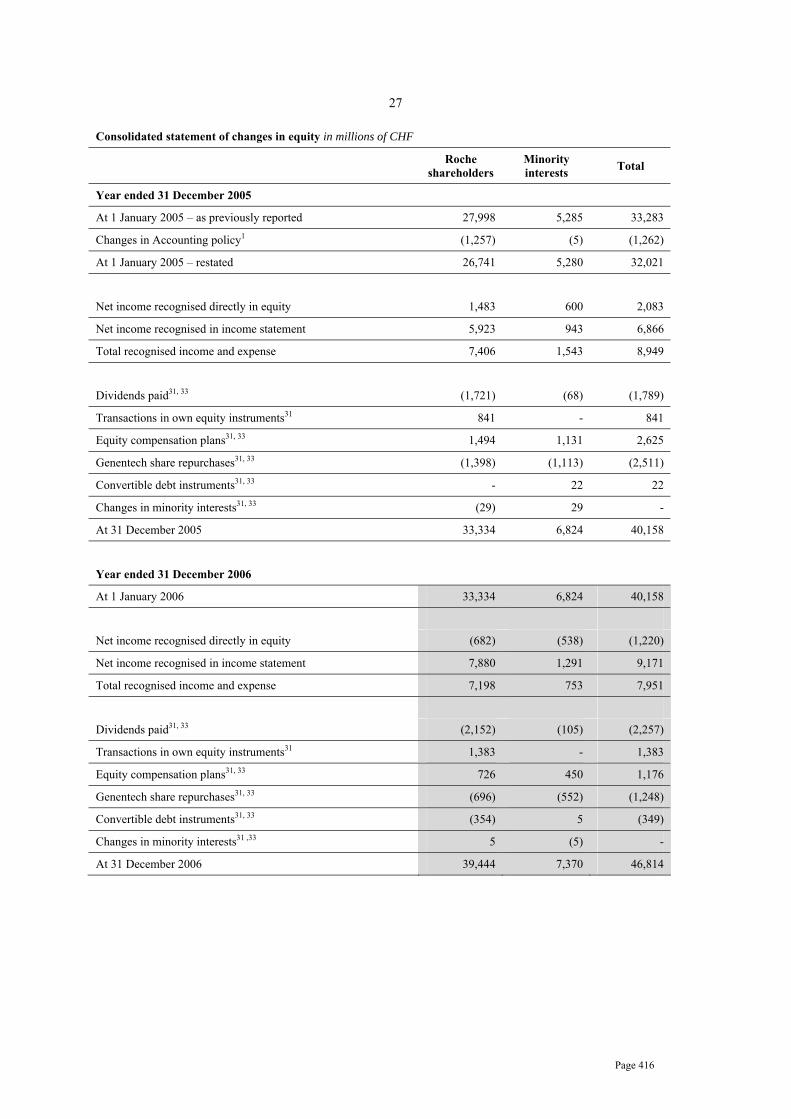
Page 416
27
Consolidated statement of changes in equity in millions of CHF
Roche shareholders
Minority interests Total
Year ended 31 December 2005
At 1 January 2005 – as previously reported 27,998 5,285 33,283
Changes in Accounting policy1 (1,257) (5) (1,262)
At 1 January 2005 – restated 26,741 5,280 32,021
Net income recognised directly in equity 1,483 600 2,083
Net income recognised in income statement 5,923 943 6,866
Total recognised income and expense 7,406 1,543 8,949
Dividends paid31, 33 (1,721) (68) (1,789)
Transactions in own equity instruments31 841 - 841
Equity compensation plans31, 33 1,494 1,131 2,625
Genentech share repurchases31, 33 (1,398) (1,113) (2,511)
Convertible debt instruments31, 33 - 22 22
Changes in minority interests31, 33 (29) 29 -
At 31 December 2005 33,334 6,824 40,158
Year ended 31 December 2006
At 1 January 2006 33,334 6,824 40,158
Net income recognised directly in equity (682) (538) (1,220)
Net income recognised in income statement 7,880 1,291 9,171
Total recognised income and expense 7,198 753 7,951
Dividends paid31, 33 (2,152) (105) (2,257)
Transactions in own equity instruments31 1,383 - 1,383
Equity compensation plans31, 33 726 450 1,176
Genentech share repurchases31, 33 (696) (552) (1,248)
Convertible debt instruments31, 33 (354) 5 (349)
Changes in minority interests31 ,33 5 (5) -
At 31 December 2006 39,444 7,370 46,814

Page 417
28
Notes to the Roche Group Consolidated Financial Statements
Reference numbers indicate corresponding Notes to the Consolidated Financial Statements.
1. Summary of significant accounting policies
Basis of preparation of the consolidated financial statements
The consolidated financial statements of the Roche Group have been prepared in accordance with International Financial Reporting Standards (IFRS) and comply with Swiss law. They have been prepared using the historical cost convention except that, as disclosed in the accounting policies below, certain items, including derivatives and available-for-sale investments, are shown at fair value. They were approved for issue by the Board of Directors on 1 February 2007 and are subject to approval by the Annual General Meeting of shareholders on 5 March 2007.
The preparation of the consolidated financial statements requires management to make estimates and assumptions that affect the reported amounts of revenues, expenses, assets and liabilities, and the disclosure of contingent liabilities at the date of the financial statements. If in the future such estimates and assumptions, which are based on management’s best judgement at the date of the financial statements, deviate from the actual circumstances, the original estimates and assumptions will be modified as appropriate in the year in which the circumstances change.
Changes in accounting policies that arise from the application of new or revised standards and interpretations are applied retrospectively, unless otherwise specified in the transitional requirements of the particular standard or interpretation. Retrospective application requires that the results of the comparative period and the opening balances of that period are restated as if the new accounting policy had always been applied. In some cases the transitional requirements of the particular standard or interpretation specify that the changes are to be applied prospectively. Prospective application requires that the new accounting policy only be applied to the results of the current period and the comparative period is not restated. In addition comparatives have been reclassified or extended from the previously reported results to take into account any presentational changes.
Consolidation policy
These financial statements are the consolidated financial statements of Roche Holding Ltd, a company registered in Switzerland, and its subsidiaries (‘the Group’).
The subsidiaries are those companies controlled, directly or indirectly, by Roche Holding Ltd, where control is defined as the power to govern the financial and operating policies of an enterprise so as to obtain benefits from its activities. This control is normally evidenced when Roche Holding Ltd owns, either directly or indirectly, more than 50% of the voting rights or potential voting rights of a company’s share capital. Special Purpose Entities are consolidated where the substance of the relationship is that the Special Purpose Entity is controlled by the Group. Companies acquired during the year are consolidated from the date on which control is transferred to the Group, and subsidiaries to be divested are included up to the date on which control passes from the Group. Inter-company balances, transactions and resulting unrealised income are eliminated in full.
Investments in associated companies are accounted for by the equity method. These are companies over which the Group exercises, or has the power to exercise, significant influence, but which it does not control. This is normally evidenced when the Group owns 20% or more of the voting rights or potential voting rights of the company. Balances and transactions with associated companies that result in unrealised income are eliminated to the extent of the Group’s interest in the associated company. Interests in joint ventures are reported using the line-by-line proportionate consolidation method.
Segment reporting
The Group’s primary format for segment reporting is business segments and the secondary format is geographical segments. The risks and returns of the Group’s operations are primarily determined by the different products that the Group produces rather than the geographical location of the Group’s operations. This is reflected by the Group’s management and organisational structure and internal financial reporting systems.
Page 418
29
The determination of the Group’s business and geographical segments is based on the organisation units for which information is reported to the Group’s management. The Group has two divisions, Pharmaceuticals and Diagnostics. Within the Pharmaceuticals Division there are three sub-divisions, Roche Pharmaceuticals, Genentech and Chugai. The three sub-divisions have separate management and reporting structures within the Pharmaceuticals Division and are considered separately reportable business segments. The Vitamins and Fine Chemicals business and the Consumer Health (OTC) business were previously separately reportable business segments. These have been divested and are presented as discontinued businesses. Certain headquarter activities are reported as ‘Corporate’. These consist of corporate headquarters, including the corporate executive committee, corporate communications, corporate human resources, corporate finance, including treasury, taxes and pension fund management, corporate legal and corporate safety and environmental services. The Group’s geographical segments are determined by geographical location and similarity of economic environments.
Transfer prices between business segments are set on an arm’s length basis. Divisional assets and liabilities consist of property, plant and equipment, goodwill and intangible assets, trade receivables/payables and inventories. Other segment liabilities consist of other liabilities, such as provisions, which can be reasonably attributed to the reported business segments. Non-segment assets and liabilities mainly include current and deferred income tax balances, post-employment benefit assets/liabilities and financial assets/liabilities. These are principally cash, marketable securities, other investments and debt. Capital expenditure comprises additions to goodwill, intangible assets and property, plant and equipment, including those arising from business combinations.
Foreign currency translation
Most Group companies use their local currency as their functional currency. Certain Group companies use other currencies (namely US dollars, Swiss francs or euros) as their functional currency where this is the currency of the primary economic environment in which the entity operates. Local transactions in other currencies are initially reported using the exchange rate at the date of the transaction. Gains and losses from the settlement of such transactions and gains and losses on translation of monetary assets and liabilities denominated in other currencies are included in income, except when they are qualifying cash flow hedges or arise on monetary items that, in substance, form part of the Group’s net investment in a foreign entity, which are deferred into equity.
Upon consolidation, assets and liabilities of Group companies using functional currencies other than Swiss francs (foreign entities) are translated into Swiss francs using year-end rates of exchange. Sales, costs, expenses, net income and cash flows are translated at the average rates of exchange for the year. Translation differences due to the changes in exchange rates between the beginning and the end of the year and the difference between net income translated at the average and year-end exchange rates are taken directly to equity. On disposal of a foreign entity, the identified cumulative currency translation differences within equity relating to that foreign entity are recognised in income as part of the gain or loss on divestment.
Revenues and cost of sales
Sales represent amounts received and receivable for goods supplied to customers after deducting trade discounts, cash discounts and volume rebates, and exclude sales and value added taxes. Revenues from the sale of products are recognised upon transfer to the customer of significant risks and rewards. Trade discounts, cash discounts and volume rebates are recorded on an accrual basis consistent with the recognition of the related sales. Estimates of expected sales returns, charge-backs and other rebates, including Medicaid in the United States and similar rebates in other countries, are also deducted from sales and recorded as a deduction from accounts receivable or as accrued liabilities or provisions. Such estimates are based on analyses of existing contractual or legislatively-mandated obligations, historical trends and the Group’s experience. Other revenues are recorded as earned or as the services are performed. Where necessary, single transactions are split into separately identifiable components to reflect the substance of the transaction. Conversely, two or more transactions may be considered together for revenue recognition purposes, where the commercial effect cannot be understood without reference to the series of transactions as a whole. Cost of sales includes the corresponding direct production costs and related production overheads of goods sold and services rendered. Start-up costs between validation and the achievement of normal production capacity are expensed as incurred.

Page 419
30
Royalty income and expenses
Royalty income and expenses are recognised on an accrual basis. Royalty expenses directly linked to goods sold are included in ‘Cost of Sales’. Other royalty expenses are included in ‘General and Administration’.
Research and development
In addition to its internal research and development activities, the Group is also party to in-licensing and similar arrangements with its alliance partners. Furthermore the Group may acquire in-process research and development assets, either through business combinations or through purchases of specific assets.
Internal research costs are charged against income as incurred. Internal development costs are capitalised as intangible assets only when there is an identifiable asset that can be completed and that will generate probable future economic benefits and when the cost of such an asset can be measured reliably. The Group does not currently have any such internal development costs that qualify for capitalisation as intangible assets. Other internal development costs are charged against income as incurred since the criteria for their recognition as an asset are not met.
In-process research and development assets acquired either through in-licensing arrangements, business combinations or separate purchases are capitalised as intangible assets as described below. Once available for use, such intangible assets are amortised on a straight-line basis over the period of the expected benefit and are reviewed for impairment at each balance sheet date.
Licensing, milestone and other upfront receipts and payments
Certain Group companies receive from third parties upfront, milestone and other similar payments relating to the sale or licensing of products or technology. Revenue associated with performance milestones is recognised based on achievement of the deliverables as defined in the respective agreements. Upfront payments and licence fees for which there are subsequent deliverables are initially reported as deferred income and are recognised as revenue in income as earned over the period of the development collaboration or the manufacturing obligation.
Payments made by Group companies to third parties and associated companies for such items are capitalised as intangible assets.
Receipts and payments between consolidated subsidiaries, such as between Genentech, Chugai and other Roche Group subsidiaries, are eliminated on consolidation.
Taxation
Income taxes include all taxes based upon the taxable profits of the Group, including withholding taxes payable on the distribution of retained earnings within the Group. Other taxes not based on income, such as property and capital taxes, are included within general and administration expenses.
Liabilities for income taxes, mainly withholding taxes, which could arise on the remittance of retained earnings, principally relating to subsidiaries, are only recognised where it is probable that such earnings will be remitted in the foreseeable future. Deferred income tax assets and liabilities are recognised on temporary differences between the tax bases of assets and liabilities and their carrying amounts in the financial statements. Deferred income tax assets relating to the carry-forward of unused tax losses are recognised to the extent that it is probable that future taxable profit will be available against which the unused tax losses can be utilised.
Current and deferred income tax assets and liabilities are offset when the income taxes are levied by the same taxation authority and when there is a legally enforceable right to offset them. Deferred income taxes are determined based on the currently enacted tax rates applicable in each tax jurisdiction where the Group operates.
Page 420
31
Discontinued businesses and non-current assets held for sale
A discontinued business is a component of the Group’s business that represents a separate major line of business or geographical area of operations or is a subsidiary acquired exclusively with a view to resale. Reclassification as a discontinued business occurs upon disposal or when the operation meets the criteria to be classified as held for sale, if earlier.
A disposal group is a group of assets that are to be disposed of as a group in a single transaction, together with the liabilities directly associated with those assets that will be transferred in the transaction. The assets and liabilities in a disposal group are reclassified as held for sale if their value will be recovered principally through a sale rather than through continuing use. The disposal group must be available for sale in its current condition and the sale must be highly probable.
Immediately before classification as held for sale, the measurement of all assets and liabilities in a disposal group is updated in accordance with applicable accounting policies. Then, on initial reclassification as held for sale, disposal groups are recognised at the lower of carrying amount and fair value less costs to sell. Impairment losses on initial classification as held for sale are included in the income statement.
Employee benefits
Wages, salaries, social security contributions, paid annual leave and sick leave, bonuses, and non-monetary benefits are accrued in the year in which the associated services are rendered by employees of the Group. Where the Group provides long-term employee benefits, the cost is accrued to match the rendering of the services by the employees concerned. Liabilities for long-term employee benefits are discounted to take into account the time value of money, where material.
Pensions and other post-employment benefits
Most employees are covered by defined benefit and defined contribution post-employment plans sponsored by Group companies. The Group’s contributions to defined contribution plans are charged to the appropriate income statement heading within the operating results in the year to which they relate. The accounting and reporting of defined benefit plans are based on recent actuarial valuations. The defined benefit obligations and service costs are calculated using the projected unit credit method. This reflects service rendered by employees to the dates of valuation and incorporates actuarial assumptions primarily regarding discount rates used in determining the present value of benefits, projected rates of remuneration growth and long-term expected rates of return for plan assets. Discount rates are based on the market yields of high-quality corporate bonds in the country concerned. Past service costs are allocated over the average period until the benefits become vested. Current and past service costs are charged to the appropriate income statement heading within the operating results. Pension plan administration and funding is overseen at a corporate level and any settlement gains and losses resulting from changes in funding arrangements are reported as general and administration expenses within the Corporate business segment. The expected returns on plan assets and interest costs are charged to financial income and financing costs, respectively. Actuarial gains and losses, which consist of differences between assumptions and actual experiences and the effects of changes in actuarial assumptions, are recorded directly in equity. Pension assets and liabilities in different defined benefit plans are not offset unless the Group has a legally enforceable right to use the surplus in one plan to settle obligations in the other plan. The recognition of pension assets is limited to the total of the present value of any future refunds from the plans or reductions in future contributions to the plans and any cumulative unrecognised past service costs. Adjustments arising from the limit on the recognition of assets for defined benefit plans are recorded directly in equity.
Equity compensation plans
Certain employees of the Group participate in equity compensation plans, including separate plans at Genentech and Chugai. The fair value of all equity compensation awards granted to employees is estimated at the grant date and recorded as an expense over the vesting period. The expense is charged to the appropriate income statement heading within the operating results. For equity-settled plans, an increase in equity is recorded and any subsequent cash flows from exercises of vested awards are recorded as an increase in equity. For cash-settled plans, a liability is recorded, which is measured at fair value at each balance sheet date with any movements in fair value being recorded to the appropriate income statement heading within the operating results. Any subsequent cash flows from exercises of vested awards are recorded as a reduction of the liability.

Page 421
32
Property, plant and equipment
Property, plant and equipment are initially recorded at cost of purchase or construction, and include all costs directly attributable to bringing the asset to the location and condition necessary for it to be capable of operating in the manner intended by management. These include items such as costs of site preparation, installation and assembly costs and professional fees. The net costs of testing whether the asset is functioning properly, including validation costs, are also included in the initially recorded cost of construction.
Property, plant and equipment are depreciated on a straight-line basis, except for land, which is not depreciated. Estimated useful lives of major classes of depreciable assets are as follows:
Land improvements 40 years Buildings 10-50 years Machinery and equipment 5-15 years Diagnostic instruments 3-5 years Office equipment 3 years Motor vehicles 5 years
Where parts of an item of property, plant and equipment have different useful lives, they are accounted for as separate items. The estimated useful life of the assets is regularly reviewed and, if necessary, the future depreciation charge is accelerated. Repairs and maintenance costs are expensed as incurred. Borrowing costs are not capitalised.
Leases
Where the Group is the lessee, leases of property, plant and equipment where the Group has substantially all of the risks and rewards of ownership are classified as finance leases. Finance leases are capitalised at the start of the lease at fair value, or the present value of the minimum lease payments, if lower. The rental obligation, net of finance charges, is reported within debt. Assets acquired under finance leases are depreciated in accordance with the Group’s policy on property, plant and equipment. If there is no reasonable certainty that the Group will obtain ownership by the end of the lease term, the asset is depreciated over the shorter of the lease term and its useful life. The interest element of the lease payment is charged against income over the lease term based on the effective interest rate method. Leases where substantially all of the risks and rewards of ownership are not transferred to the Group are classified as operating leases. Payments made under operating leases are charged against income on a straight-line basis over the period of the lease.
Where the Group is the lessor, assets subject to finance leases are reported as receivables at an amount equal to the net investment in the lease. Assets subject to operating leases are reported within property, plant and equipment. Lease income from finance leases is recognised over the term of the lease based on the effective interest rate method. Lease income from operating leases is recognised over the lease term on a straight-line basis.
Business combinations and goodwill
Business combinations are accounted for using the purchase method of accounting. The cost of acquisition is the consideration given in exchange for control over the identifiable assets, liabilities and contingent liabilities of the acquired company. This consideration includes the cash paid plus the fair value at the date of exchange of assets given, liabilities incurred or assumed and equity instruments issued by the Group. The cost of acquisition also includes directly attributable costs. The acquired net assets, being the identifiable assets, liabilities and contingent liabilities, are initially recognised at fair value. Where the Group does not acquire 100% ownership of the acquired company, minority interest is recorded as the minority’s proportion of the fair value of the acquired net assets. Goodwill is recorded as the surplus of the cost of acquisition over the Group’s interest in the fair value of the acquired net assets. Any goodwill and fair value adjustments are recorded as assets and liabilities of the acquired company and are recorded in the functional currency of that company. Goodwill is not amortised, but is assessed for possible impairment at each balance sheet date and is additionally tested annually for impairment. Goodwill may also arise upon investments in associated companies, being the surplus of the cost of investment over the Group s share of the fair value of the net identifiable assets. Such goodwill is recorded within investments in associated companies.

Page 422
33
Intangible assets
Purchased patents, licences, trademarks and other intangible assets are initially recorded at cost. Where these assets have been acquired through a business combination, this will be the fair value allocated in the acquisition accounting. Intangible assets are amortised over their useful lives on a straight-line basis beginning from the point when they are available for use. Estimated useful life is the lower of the legal duration and the economic useful life. The estimated useful life of intangible assets is regularly reviewed. Amortisation and impairment of intangible assets; is presented separately in the income statement due to the materiality of the amounts and in order to fairly present the Group’s results.
Impairment of property, plant and equipment and intangible assets
When there is evidence that an asset may be impaired, the recoverable amount of the asset is calculated and an impairment assessment is carried out. In addition intangible assets that are not yet available for use are tested for impairment annually. When the recoverable amount of an asset, being the higher of its fair value less costs to sell and its value in use, is less than its carrying amount, then the carrying amount is reduced to its recoverable amount. This reduction is reported in the income statement as an impairment loss. Value in use is calculated using estimated cash flows, generally over a five-year period, with extrapolating projections for subsequent years. These are discounted using an appropriate long-term pre-tax interest rate. When an impairment loss arises, the useful life of the asset in question is reviewed and, if necessary, the future depreciation/amortisation charge is accelerated. The impairment of financial assets is discussed below in the ‘financial assets’ policy.
Impairment of goodwill
An impairment assessment of goodwill is carried out annually. Goodwill is allocated to cash-generating units as described in Note 16. When the recoverable amount of the cash-generating unit, being the higher of its fair value less costs to sell or its value in use, is less than its carrying amount, then an impairment in the carrying amount is recorded. The methodology used in the impairment testing is further described in Note 16.
Inventories
Inventories are stated at the lower of cost and net realisable value. The cost of finished goods and work in process includes raw materials, direct labour and other directly attributable costs and overheads based upon the normal capacity of production facilities. Borrowing costs are not included. Cost is determined using the weighted average method. Net realisable value is the estimated selling price less cost to completion and selling expenses.
Accounts receivable
Accounts receivable are carried at the original invoice amount less allowances made for doubtful accounts, trade discounts, cash discounts, volume rebates and similar allowances. An allowance for doubtful accounts is recorded for the difference between the carrying amount and the recoverable amount where there is objective evidence that the Group will not be able to collect all amounts due. Trade discounts, cash discounts, volume rebates and similar allowances are recorded on an accrual basis consistent with the recognition of the related sales, using estimates based on existing contractual obligations, historical trends and the Group’s experience. Long-term accounts receivable are discounted to take into account the time value of money, where material. Provisions for sales returns and sales charge-backs are reported as provisions and accrued liabilities, respectively.
Cash and cash equivalents
Cash and cash equivalents include cash on hand and time, call and current balances with banks and similar institutions. Such balances are only reported as cash if they are readily convertible to known amounts of cash, are subject to insignificant risk of changes in value, and have a maturity of three months or less from the date of acquisition. This definition is also used for the cash flow statement.

Page 423
34
Provisions
Provisions are recognised where a legal or constructive obligation has been incurred which will probably lead to an outflow of resources that can be reasonably estimated. In particular, restructuring provisions are recognised when the Group has a detailed formal plan that has either commenced implementation or been announced. Provisions are recorded for the estimated ultimate liability that is expected to arise, taking into account foreign currency effects arising from their translation from their functional currency into Swiss francs and the time value of money, where material. A contingent liability is disclosed where the existence of the obligation will only be confirmed by future events, or where the amount of the obligation cannot be measured with reasonable reliability. Contingent assets are not recognised, but are disclosed where an inflow of economic benefits is probable.
Fair values
Fair value is the amount for which a financial asset, liability or instrument could be exchanged between knowledgeable and willing parties in an arm’s length transaction. It is determined by reference to quoted market prices or by the use of established estimation techniques such as option pricing models and estimated discounted values of cash flows. The fair values of financial assets and liabilities at the balance sheet date are approximately in line with their reported carrying values unless specifically mentioned in the Notes to the Consolidated Financial Statements.
Financial assets
Financial assets, principally investments, including marketable securities, are classified as either ‘Fair-value-through-profit-or-loss’, ‘Available-for-sale’, ‘Held-to-maturity’ or ‘Loans and receivables’. Fair-value-through-profit-or-loss financial assets are either classified as held-for-trading, or designated upon initial recognition. Held-for-trading financial assets are acquired principally to generate profit from short-term fluctuations in price. Financial assets are designated as fair-value-through-profit-or-loss if doing so results in more relevant information by eliminating a measurement or recognition inconsistency. Held-to-maturity financial assets are securities with a fixed maturity that the Group has the intent and ability to hold until maturity. Loans and receivables are loans and other long-term financial assets created by the Group or acquired from the issuer in a primary market. They are non-derivative financial assets with fixed or determinable payments that are not quoted in an active market. All other financial assets are considered to be available-for-sale.
All financial assets are initially recorded at fair value, including transaction costs, except for assets designated as fair-value-through-profit-or-loss, which exclude transaction costs. All purchases and sales are recognised on the settlement date. Fair-value-through-profit-or-loss financial assets are subsequently carried at fair value, with all changes in fair value recorded as financial income in the period in which they arise. Held-to-maturity financial assets are subsequently carried at amortised cost using the effective interest rate method. Available-for-sale financial assets are subsequently carried at fair value, with all unrealised changes in fair value recorded in equity except for interest calculated using the effective interest rate method and foreign exchange components. When the available-for-sale financial assets are sold, impaired or otherwise disposed of, the cumulative gains and losses previously recognised in equity are included in financial income for the current period. Loans and receivables are subsequently carried at amortised cost.
Financial assets are assessed for possible impairment at each balance sheet date. An impairment charge is recorded where there is objective evidence of impairment, such as where the issuer is in bankruptcy, default or other significant financial difficulty. Any available-for-sale financial assets that have a market value of more than 25% below their original cost, net of any previous impairment, will be considered as impaired. Any available-for-sale financial assets that have a market value below their original cost, net of any previous impairment, for a sustained six-month period will be considered as impaired. Any decreases in the market price of less than 25% of original cost, net of any previous impairment, which are also for less than a sustained six-month period are not by themselves considered as objective evidence of impairment. Such movements in fair value are recorded in equity until there is objective evidence of impairment or until the asset is sold or otherwise disposed of. For financial assets carried at amortised cost, any impairment charge is the difference between the carrying value and the recoverable amount, calculated using estimated future cash flows discounted using the original effective interest rate. For available-for-sale financial assets, any impairment charge is the amount currently carried in equity for the difference between the original cost, net of any previous impairment, and the fair value.

Page 424
35
Financial assets are derecognised when the contractual rights to the cash flows of the assets expire or when the Group sells or otherwise disposes of the contractual rights to the cash flows, including situations where the Group retains the contractual rights but assumes a contractual obligation to pay the cash flows to a third party.
Derivatives
Derivative financial instruments are initially recorded and subsequently carried at fair value. Apart from those derivatives designated as qualifying cash flow hedging instruments (see below), all changes in fair value are recorded as financial income in the period in which they arise. Embedded derivatives are recognised separately if not closely related to the host contract and where the host contract is carried at amortised cost.
Hedging
For the purposes of hedge accounting, hedging relationships may be of three types. Fair value hedges are hedges of particular risks that may change the fair value of a recognised asset or liability. Cash flow hedges are hedges of particular risks that may change the amount or timing of future cash flows. Hedges of net investment in a foreign entity are hedges of particular risks that may change the carrying value of the net assets of a foreign entity.
To qualify for hedge accounting the hedging relationship must meet several strict conditions on documentation, probability of occurrence, hedge effectiveness and reliability of measurement. If these conditions are not met, then the relationship does not qualify for hedge accounting. In this case the hedging instrument and the hedged item are reported independently as if there were no hedging relationship. In particular any derivatives are reported at fair value, with changes in fair value included in financial income.
For qualifying fair value hedges, the hedging instrument is recorded at fair value and the hedged item is recorded at its previous carrying value, adjusted for any changes in fair value that are attributable to the hedged risk. Any changes in the fair values are reported in financial income.
For qualifying cash flow hedges, the hedging instrument is recorded at fair value. The portion of any change in fair value that is an effective hedge is included in equity, and any remaining ineffective portion is reported in financial income. If the hedging relationship is the hedge of a firm commitment or highly probable forecasted transaction that results in the recognition of a non-financial asset or liability, the cumulative changes of fair value of the hedging instrument that have been recorded in equity are included in the initial carrying value of the asset or liability at the date of recognition. For all other qualifying cash flow hedges, the cumulative changes of fair value of the hedging instrument that have been recorded in equity are included in financial income when the forecasted transaction affects net income.
For qualifying hedges of net investment in a foreign entity, the hedging instrument is recorded at fair value. The portion of any change in fair value that is an effective hedge is included in equity. Any remaining ineffective portion is recorded in financial income where the hedging instrument is a derivative and in equity in other cases. If the entity is disposed of, then the cumulative changes of fair value of the hedging instrument that have been recorded in equity are reclassified to income.
Debt instruments
Debt instruments are initially recorded at cost, which is the proceeds received, net of transaction costs. Subsequently they are reported at amortised cost using the effective interest method. Any discount between the net proceeds received and the principal value due on redemption is amortised over the duration of the debt instrument and is recognised as part of financing costs using the effective interest rate method. Certain debt instruments may be designated as ‘fair-value-through-profit-or-loss’ where doing so results in more relevant information as it eliminates or significantly reduces measurement or recognition inconsistencies. Such debt instruments are reported at fair value, based on quoted prices in an active market, with movements in fair value reported within financial income. Those debt instruments that are designated as fair-value-through-profit-or-loss are disclosed in Note 30.

Page 425
36
A bifurcation is carried out upon the issue of convertible debt instruments. The initial carrying value of the liability element is calculated using the market interest rate for an equivalent non-convertible instrument. The remainder of the net proceeds is allocated to the equity conversion option, which is reported in equity, and to deferred income tax liabilities. The liability element is subsequently reported at amortised cost, or fair-value-through-profit-and-loss if so designated.
Own equity instruments
The Group’s holdings in its own equity instruments are recorded as a deduction from equity. The original purchase cost, consideration received for subsequent resale of these equity instruments and other movements are reported as changes in equity. These instruments have been acquired primarily to meet the obligations that may arise in respect of certain of the Group’s debt instruments.
Management judgements made in applying accounting policies
The application of the Group’s accounting policies may require management to make judgements, apart from those involving estimates, that can have a significant effect on the amounts recognised in the consolidated financial statements. Management judgement is particularly required when assessing the substance of transactions that have a complicated structure or legal form. These include, but are not limited to, the following areas:
Revenue recognition: The nature of the Group’s business is such that many sales transactions do not have a simple structure. Sales agreements may consist of multiple components occurring at different times. The Group is also party to various out-licensing agreements, which can involve upfront and milestone payments that may occur over several years. These agreements may also involve certain future obligations. Revenue is only recognised when, in management’s judgement, the significant risks and rewards of ownership have been transferred and when the Group does not retain continuing managerial involvement or effective control over the goods sold or when the obligation has been fulfilled. For some transactions this can result in cash receipts being initially recognised as deferred income and then released to income over subsequent periods on the basis of the performance of the conditions specified in the agreement.
Leases: The Group is party to leasing arrangements, both as a lessee and as a lessor. The treatment of leasing transactions in the financial statements is mainly determined by whether the lease is considered to be an operating lease or a finance lease. In making this assessment, management looks at the substance of the lease, as well as the legal form, and makes a judgement about whether substantially all of the risks and rewards of ownership are transferred.
Key assumptions and sources of estimation uncertainty: The preparation of the consolidated financial statements in conformity with IFRS requires management to make estimates and assumptions that affect the application of policies and reported amounts of assets, liabilities, income, expenses and related disclosures. The estimates and underlying assumptions are based on historical experience and various other factors that are believed to be reasonable under the circumstances, the results of which form the basis for making the judgements about carrying values of assets and liabilities that are not readily apparent from other sources. Actual results may differ from these estimates.
The estimates and underlying assumptions are reviewed on an ongoing basis. Changes in accounting estimates may be necessary if there are changes in the circumstances on which the estimate was based, or as a result of new information or more experience. Such changes are recognised in the period in which the estimate is revised.
The key assumptions about the future and key sources of estimation uncertainty that have a significant risk of causing a material adjustment to the carrying value of assets and liabilities within the next twelve months are described below.

Page 426
37
Sales allowances: The Group has accruals and provisions for expected sales returns, charge-backs and other rebates, including Medicaid in the United States and similar rebates in other countries, which at 31 December 2006 total 762 million Swiss francs. Such estimates are based on analyses of existing contractual or legislatively-mandated obligations, historical trends and the Group’s experience. Management believes that the total accruals and provisions for these items are adequate, based upon currently available information. As these deductions are based on management estimates, they may be subject to change as better information becomes available. Such changes that arise could impact the accruals and provisions recognised in the balance sheet in future periods and consequently the level of sales recognised in the income statement in future periods.
Property, plant and equipment and intangible assets, including goodwill: The Group has property, plant and equipment with a carrying value of 16,417 million Swiss francs as disclosed in Note 15. Goodwill has a carrying value of 5,914 million Swiss francs (see Note 16) and intangible assets have a carrying value of 5,469 million Swiss francs (see Note 17). All of these assets are reviewed annually for impairment as described above. To assess whether any impairment exists, estimates are made of the future cash flows expected to result from the use of the asset and its eventual disposal. Actual outcomes could vary significantly from such estimates of discounted future cash flows. Factors such as changes in the planned use of buildings, machinery or equipment, or closure of facilities, the presence or absence of competition, technical obsolescence or lower than anticipated sales for products with capitalised rights could result in shortened useful lives or impairment.
Pensions and other post-employment benefits: Many of the Group’s employees participate in post-employment defined benefit plans. The calculations of the recognised assets and liabilities from such plans are based upon statistical and actuarial calculations. In particular the present value of the defined benefit obligation is impacted by assumptions on discount rates used to arrive at the present value of future pension liabilities, and assumptions on future increases in salaries and benefits. Furthermore, the Group’s independent actuaries use statistically based assumptions covering areas such as future withdrawals of participants from the plan and estimates on life expectancy. At 31 December 2006 the present value of the Group’s defined benefit obligation is 11,002 million Swiss francs for funded plans and 3,596 million Swiss francs for unfunded plans (see Note 13). The actuarial assumptions used may differ materially from actual results due to changes in market and economic conditions, higher or lower withdrawal rates, longer or shorter life spans of participants, and other changes in the factors being assessed. These differences could impact the assets or liabilities recognised in the balance sheet in future periods.
Legal provisions: Group companies are party to various legal proceedings and the most significant matters are described in Notes 7 and 28. Legal provisions at 31 December 2006 total 1,320 million Swiss francs, as disclosed in Note 28. Additional claims could be made which might not be covered by existing provisions or by insurance. There can be no assurance that there will not be an increase in the scope of these matters or that any future lawsuits, claims, proceedings or investigations will not be material. Such changes that arise could impact the provisions recognised in the balance sheet in future periods.
Environmental provisions: The Group has provisions for environmental remediation costs, which at 31 December 2006 total 186 million Swiss francs, as disclosed in Note 28. The material components of the environmental provisions consist of costs to fully clean and refurbish contaminated sites and to treat and contain contamination at certain other sites. Future remediation expenses are affected by a number of uncertainties that include, but are not limited to, the detection of previously unknown contaminated sites, the method and extent of remediation, the percentage of waste material attributable to the Group at the remediation sites relative to that attributable to other parties, and the financial capabilities of the other potentially responsible parties. Management believes that the total provisions for environmental matters are adequate based upon currently available information. However, given the inherent difficulties in estimating liabilities in this area, it cannot be guaranteed that additional costs will not be incurred beyond the amounts accrued. The effect of the resolution of environmental matters on the results of operations cannot be predicted due to uncertainty concerning both the amount and the timing of future expenditures. Such changes that arise could impact the provisions recognised in the balance sheet in future periods.

Page 427
38
Income taxes: At 31 December 2006, the net liability for current income taxes is 1,776 million Swiss francs and the net liability for deferred income taxes is 375 million Swiss francs, as disclosed in Note 9. Significant estimates are required to determine the current and deferred assets and liabilities for income taxes. Some of these estimates are based on interpretations of existing tax laws or regulations. Management believes that the estimates are reasonable and that the recognised liabilities for income tax-related uncertainties are adequate. Various internal and external factors may have favourable or unfavourable effects on the income tax assets and liabilities. These factors include, but are not limited to, changes in tax laws, regulations and/or rates, changing interpretations of existing tax laws or regulations, future levels of research and development spending, and changes in overall levels of pre-tax earnings. Such changes that arise could impact the assets and liabilities recognised in the balance sheet in future periods.
Changes in accounting policies: The Group adopted certain new and revised International Financial Reporting Standards and interpretations effective 1 January 2006. A description of those changes that are material to the Group and their effect on the consolidated financial statements is given below.
IAS 19 (revised) – ‘Employee Benefits’: Amongst other matters, the revised standard allows actuarial gains and losses from defined benefit plans to be recorded directly to equity. In this case adjustments arising from the limits on the recognition of assets for defined benefit plans are also to be recorded directly to equity. The revised standard requires retrospective application. In addition the Group now reports the expected return on plan assets and interest costs from defined benefit plans as part of financial income and financing costs, respectively, and the corresponding post-employment benefit assets and liabilities are included in non-segment assets and liabilities in the segment reporting. This change in presentation aligns the reporting of the Group’s results more closely with its internal management and organisation structure.
Further information on the Group’s pension and other post-employment benefits is given in Note 13.
Presentation of income statement: The income statement for the year ended 31 December 2005 has been restated following the changes in IFRS that were adopted effective 1 January 2006. In addition the Group has made certain presentational changes to further improve comparability of its results to those of other healthcare companies and to allow readers to make a more accurate assessment of the sustainable earnings capacity of the Group. These changes, which have been applied retrospectively, are listed below.
● Support costs for leased diagnostics instruments are now reported as part of ‘Cost of Sales’ instead of ‘Marketing and Distribution’. In 2006 these were 114 million Swiss francs (2005: 76 million Swiss francs).
Restated income statement for the year ended 31 December 2005 in millions of CHF
As
originally published
IAS 19 (revised)
Group restated
Sales 35,511 - 35,511 Other operating items (26,842) 164 (26,678) Operating profit 8,669 164 8,833 Financial and non-operating items 297 32 329 Profit before taxes 8,966 196 9,162 Income taxes (2,224) (60) (2,284) Profit from continuing businesses 6,742 136 6,878 Profit from discontinued businesses (12) - (12) Net income 6,730 136 6,866 Attributable to - Roche shareholders 5,787 136 5,923 - Minority interests 943 943 Earnings per share and non-voting equity security Basic - Group (CHF) 6.85 0.16 7.01 Diluted - Group (CHF) 6.71 0.16 6.87

Page 428
39
Presentation of the balance sheet: The balance sheet at 31 December 2005 has been restated as a result of the changes in IFRS that were adopted effective 1 January 2006. As a result of the implementation of IAS 19 (revised) post-employment benefit assets were 997 million Swiss francs lower, deferred income tax assets were 827 million Swiss francs higher, post-employment benefit liabilities were 1,471 million Swiss francs higher and deferred income tax liabilities were 56 million Swiss francs lower.
Restated balance sheet at 31 December 2005 in millions of CHF
As originally published
IAS 19 (revised)
Group restated
Non-current assets 33,739 (170) 33,569 Current assets 35,626 - 35,626 Total assets 69,365 (170) 69,195 Non-current liabilities (18,130) (1,415) (19,545) Current liabilities (9,492) - (9,492) Total liabilities (27,622) (1,415) (29,037) Total net assets 41,743 (1,585) 40,158 Minority interests 6,821 3 6,824 equity 34,922 (1,588) 33,334
Presentation of recognised income and expense and changes in equity: The new and revised standards that were adopted effective 1 January 2006 result in significant changes to the format and content of changes in equity. IAS 19 [revised] requires retrospective implementation. Accordingly opening equity for 2005 and the statement of recognised income and expense for 2005 have been restated.
Restated Equity for 1 January 2005 in millions of CHF
As originally published
IAS 19 (revised)
Group restated
Share capital 160 - 160 Own equity instruments (4,326) - (4,326) Retained earnings 35,960 (1,257) 34,703 Fair value reserve 344 - 344 Hedging reserve (18) - (18) Translation reserve (4,122) - (4,122) Equity attributable to Roche shareholders 27,998 (1,257) 26,741 Minority interests 5,285 (5) 5,280 Total equity 33,283 (1,262) 32,021
Restated recognised income and expense for the year ended 31 December 2005 in millions of CHF
As originally published
IAS 19 (revised)
Group restated
Net income recognised directly in equity 2,542 (459) 2,083 Net income recognised in income statement 6,730 136 6,866 Total recognised net income 9,272 (323) 8,949 Attributable to 7,737 (331) 7,406 - Roche shareholders - Minority interests 1,535 8 1,543 Total 9,272 (323) 8,949

Page 429
40
Future changes in IFRS: The Group is currently assessing the potential impacts of the new and revised standards that will be effective from 1 January 2007. The Group does not expect that the new and revised standards and interpretations will have a significant effect on the Group’s results and financial position, although they will expand financial statement disclosure in certain areas, notably IFRS 7 ‘Financial Instruments: Disclosures’ which the Group will implement in 2007. The Group is also in the process of evaluating IFRS 8 ‘Operating Segments’ which will be effective from 1 January 2009.
2. Financial risk management
The Group is exposed to various financial risks arising from its underlying operations and corporate finance activities. The Group’s financial risk exposures are predominantly related to changes in foreign exchange rates, interest rates and equity prices as well as the creditworthiness and solvency of the Group’s counterparties.
The Group’s subsidiaries Genentech and Chugai have their own treasury operations. These have operational independence, whilst working within a financial risk management framework that is consistent with the rest of the Group. More information on their financial risks is available in the annual reports of Genentech and Chugai.
Financial risk management within the Group is governed by policies and guidelines approved by senior management. These policies and guidelines cover foreign exchange risk, interest rate risk, market risk, credit risk and liquidity risk. Group policies and guidelines also cover areas such as cash management, investment of excess funds and the raising of short- and long-term debt. Compliance with the policies and guidelines is managed by segregated functions within the Group.
The objective of financial risk management is to contain, where deemed appropriate, exposures in the various types of financial risks mentioned above in order to limit any negative impact on the Group’s results and financial position.
The Group actively measures, monitors and manages its financial risk exposures by various functions pursuant to segregation-of-duties principles.
In accordance with its financial risk policies, the Group manages its market risk exposures through the use of financial instruments such as derivatives, when deemed appropriate. It is the Group’s policy and practice not to enter into derivative transactions for trading or speculative purposes, nor for purposes unrelated to the underlying business.
Foreign exchange risk
The Group operates across the world and is exposed to movements in foreign currencies affecting its net income and financial position, as expressed in Swiss francs. The Group actively monitors its currency exposures and, when appropriate, enters into transactions with the aim of preserving the value of assets, commitments and anticipated transactions. The Group uses forward contracts, foreign exchange options and cross-currency swaps to hedge certain committed and anticipated foreign exchange flows and financing transactions.
Transaction exposure arises because the amount of local currency paid or received for transactions denominated in foreign currencies may vary due to changes in exchange rates. Similarly, transaction exposure arises on net balances of monetary assets held in foreign currencies. For many Group companies revenues and operating expenses are primarily in the local currency. At local level, the Group companies manage this exposure, if necessary, by means of financial instruments such as options and forward contracts. In addition, Group Treasury monitors total worldwide exposure on a monthly basis.
Translation exposure arises from the consolidation of the foreign currency denominated financial statements of the Group’s foreign subsidiaries. The effect on the Group’s consolidated equity is shown as a currency translation movement. The Group partially hedges net investments in foreign currencies by taking out foreign currency loans or issuing foreign currency denominated debt instruments. Major translation exposures are monitored regularly.

Page 430
41
A significant part of the Group’s cash outflows for research, development, production and administration is denominated in Swiss francs, while a much smaller proportion of the Group’s cash inflows are Swiss franc denominated. As a result, an increase in the value of the Swiss franc relative to other currencies has an adverse impact on consolidated net income. Similarly, a relative decrease in the value of the Swiss franc has a favourable effect on results when reported in Swiss francs.
Interest rate risk
Interest rate risk arises from movements in interest rates which could have effects on the Group’s net income or financial position. Changes in interest rates may cause variations in interest income and expenses resulting from interest-bearing assets and liabilities. In addition, they can affect the market value of certain financial assets, liabilities and instruments as described in the following section on market risk of financial assets. The interest rates on the Group’s major debt instruments are fixed, as described in Note 30. The Group uses interest rate derivatives to manage its interest rate risk.
Market risk of financial assets
Changes in the market value of certain financial assets and derivative instruments can affect the net income or financial position of the Group. Financial long-term assets are held for strategic purposes and marketable securities are held for fund management purposes. The risk of loss in value is managed by reviews prior to investing and continuous monitoring of the performance of investments and changes in their risk profile. Investments in equities, bonds, debentures and other fixed income instruments are entered into on the basis of guidelines with regard to liquidity and credit rating.
Credit risk
Credit risk arises from the possibility that the counterparty to a transaction may be unable or unwilling to meet their obligations causing a financial loss to the Group. Trade receivables are subject to a policy of active risk management which focuses on the assessment of country risk, credit availability, ongoing credit evaluation and account monitoring procedures. Except as noted below, there are no significant concentrations within trade receivables of counterparty credit risk due to the Group’s large number of customers and their wide geographical spread. For some credit exposures in critical countries, the Group has obtained credit insurance. Country risk exposures are continuously monitored. The exposure of other financial assets to credit risk is controlled by setting a policy for limiting credit exposure to high-quality counterparties, regular reviews of credit ratings, and setting defined limits for each counterparty. Where appropriate to reduce exposure, netting agreements under an ISDA (International Swaps and Derivatives Association) master agreement are signed with the respective counterparties. The maximum exposure to credit risk resulting from financial activities, without considering netting agreements, is equal to the carrying amount of financial assets plus the positive fair value of derivative instruments. The credit exposure is diversified amongst different counterparties.
At 31 December 2006 the Group’s combined trade accounts receivable balance with three US national wholesale distributors, AmerisourceBergen Corp., Cardinal Health, Inc. and McKesson Corp., was equivalent to 1.5 billion Swiss francs representing 17% of the Group’s consolidated trade accounts receivable (2005: 1.1 billion Swiss francs representing 14%).
Liquidity risk
Group companies require sufficient availability of cash to meet their obligations. Individual companies are generally responsible for their own cash management, including the short-term investment of cash surpluses and the raising of loans to cover cash deficits, subject to guidance by the Group and, in certain cases, to approval at Group level. The Group maintains sufficient reserves of cash and readily realisable marketable securities to meet its liquidity requirements at all times. In addition, the strong international creditworthiness of the Group provides the ability to efficiently use international capital markets for financing purposes. The Group has unused committed credit lines with various financial institutions totalling 4.3 billion Swiss francs. This includes a syndicated credit facility of 2.5 billion euros and bank commitment lines of 30 billion Japanese yen at Chugai.
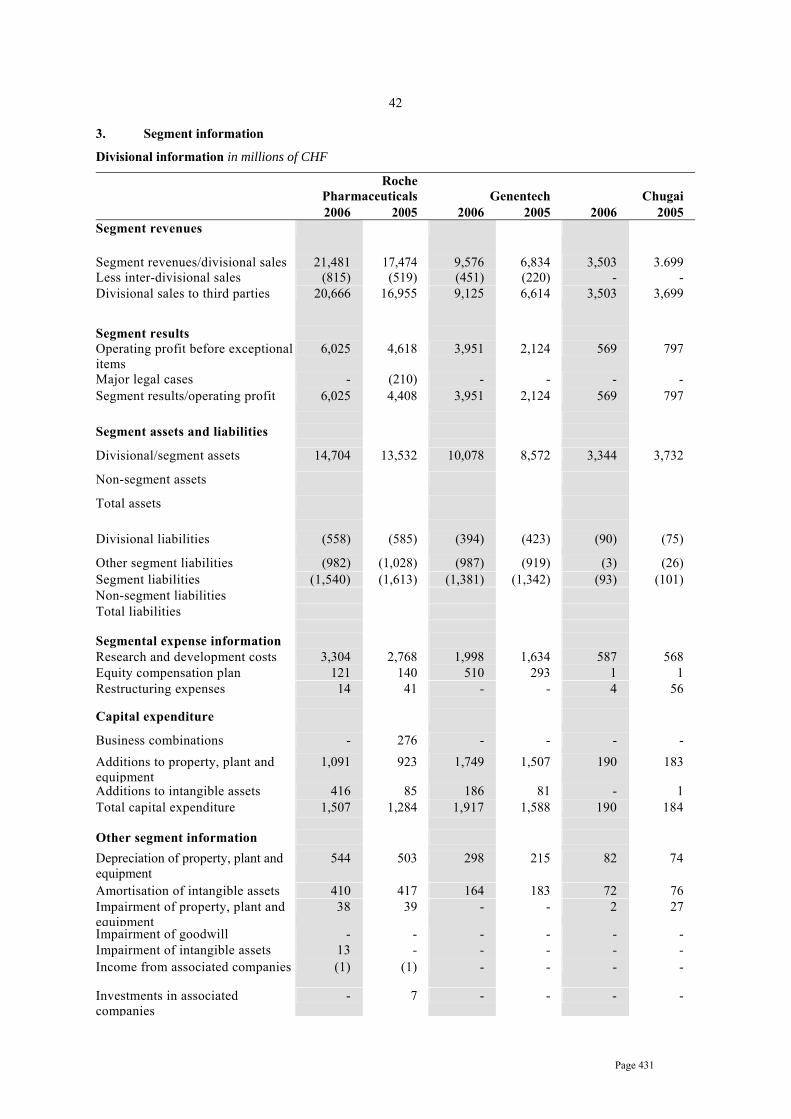
Page 431
42
3. Segment information
Divisional information in millions of CHF
Roche Pharmaceuticals
Genentech
Chugai
2006 2005 2006 2005 2006 2005 Segment revenues
Segment revenues/divisional sales 21,481 17,474 9,576 6,834 3,503 3.699 Less inter-divisional sales (815) (519) (451) (220) - - Divisional sales to third parties 20,666 16,955 9,125 6,614 3,503 3,699
Segment results Operating profit before exceptional items
6,025 4,618 3,951 2,124 569 797
Major legal cases - (210) - - - - Segment results/operating profit 6,025 4,408 3,951 2,124 569 797
Segment assets and liabilities
Divisional/segment assets 14,704 13,532 10,078 8,572 3,344 3,732
Non-segment assets
Total assets
Divisional liabilities (558) (585) (394) (423) (90) (75)
Other segment liabilities (982) (1,028) (987) (919) (3) (26) Segment liabilities (1,540) (1,613) (1,381) (1,342) (93) (101) Non-segment liabilities Total liabilities Segmental expense information Research and development costs 3,304 2,768 1,998 1,634 587 568 Equity compensation plan 121 140 510 293 1 1 Restructuring expenses 14 41 - - 4 56
Capital expenditure
Business combinations - 276 - - - - Additions to property, plant and equipment
1,091 923 1,749 1,507 190 183
Additions to intangible assets 416 85 186 81 - 1 Total capital expenditure 1,507 1,284 1,917 1,588 190 184 Other segment information Depreciation of property, plant and equipment
544 503 298 215 82 74
Amortisation of intangible assets 410 417 164 183 72 76 Impairment of property, plant and equipment
38 39 - - 2 27
Impairment of goodwill - - - - - - Impairment of intangible assets 13 - - - - - Income from associated companies (1) (1) - - - -
Investments in associated companies
- 7 - - - -

Page 432
43
Pharmaceuticals Division
Diagnostics Division
Corporate
Group
2006 2005 2006 2005 2006 2005 2006 2005
34,560 28,007 8,753 8,249 - - 43,313 36,256 (1,266) (739) (6) (6) - - (1,272) (745) 33,294 27,268 8,747 8,243 - - 42,041 35,511
10,545 7,539 1,422 1,771 (237) (121) 11,730 9,189 - (210) - (146) - - - (356)
10,545 7,329 1,422 1,625 (237) (121) 11,730 8,833
28,126 25,836 14,262 14,550 123 125 42,511 40,511
31,903 28,684
74,414 69,195
(1,042) (1,083) (338) (287) (19) (1) (1,399) (1,371)
(1,972) (1,973) (187) (137) (33) (74) (2,192) (2,184) (3,014) (3,056) (525) (424) (52) (75) (3,591) (3,555)
(24,009) (25,482)
5,889 4,970 700 702 - - 6,589 5,672 632 434 44 58 14 12 690 504 18 97 17 2 - - 35 99
- 276 - 2 - - - 278
3,030 2,613 846 813 2 2 3,878 3,428 584 167 9 95 - - 593 262
3,614 3,056 855 910 2 2 4,471 3,968
924 792 532 505 5 5 1,461 1,302
646 676 331 335 - - 977 1,011 40 66 31 - - - 71 66
- - - - - - - - 13 - 184 - - - 197 - (1) (1) 3 1 - 1 2 1
- 7 7 4 - 47 7 58
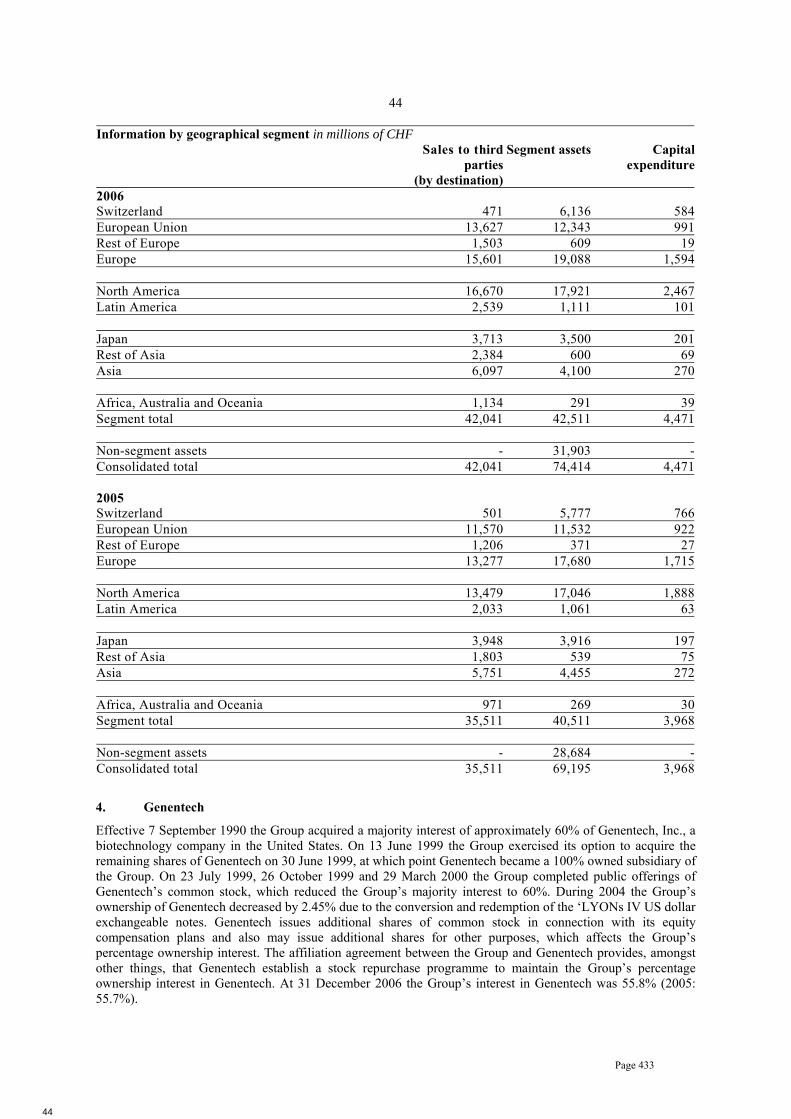
Page 433
44
Information by geographical segment in millions of CHF Sales to third
parties(by destination)
Segment assets Capital expenditure
2006 Switzerland 471 6,136 584European Union 13,627 12,343 991Rest of Europe 1,503 609 19Europe 15,601 19,088 1,594 North America 16,670 17,921 2,467Latin America 2,539 1,111 101 Japan 3,713 3,500 201Rest of Asia 2,384 600 69Asia 6,097 4,100 270 Africa, Australia and Oceania 1,134 291 39Segment total 42,041 42,511 4,471 Non-segment assets - 31,903 -Consolidated total 42,041 74,414 4,471 2005 Switzerland 501 5,777 766European Union 11,570 11,532 922Rest of Europe 1,206 371 27Europe 13,277 17,680 1,715 North America 13,479 17,046 1,888Latin America 2,033 1,061 63 Japan 3,948 3,916 197Rest of Asia 1,803 539 75Asia 5,751 4,455 272 Africa, Australia and Oceania 971 269 30Segment total 35,511 40,511 3,968 Non-segment assets - 28,684 -Consolidated total 35,511 69,195 3,968
4. Genentech
Effective 7 September 1990 the Group acquired a majority interest of approximately 60% of Genentech, Inc., a biotechnology company in the United States. On 13 June 1999 the Group exercised its option to acquire the remaining shares of Genentech on 30 June 1999, at which point Genentech became a 100% owned subsidiary of the Group. On 23 July 1999, 26 October 1999 and 29 March 2000 the Group completed public offerings of Genentech’s common stock, which reduced the Group’s majority interest to 60%. During 2004 the Group’s ownership of Genentech decreased by 2.45% due to the conversion and redemption of the ‘LYONs IV US dollar exchangeable notes. Genentech issues additional shares of common stock in connection with its equity compensation plans and also may issue additional shares for other purposes, which affects the Group’s percentage ownership interest. The affiliation agreement between the Group and Genentech provides, amongst other things, that Genentech establish a stock repurchase programme to maintain the Group’s percentage ownership interest in Genentech. At 31 December 2006 the Group’s interest in Genentech was 55.8% (2005: 55.7%).
44

Page 434
45
The common stock of Genentech is publicly traded and is listed on the New York Stock Exchange, under the symbol ‘DNA’. Genentech prepares financial statements in conformity with accounting principles generally accepted in the United States (US GAAP). These are filed on a quarterly basis with the US Securities and Exchange Commission (SEC).
Differences between IFRS and US GAAP
Due to certain consolidation entries and differences in the requirements of International Financial Reporting Standards (IFRS) and US GAAP, there are differences between Genentech’s stand-alone financial results on a US GAAP basis and the financial results of Genentech as consolidated by the Roche Group in accordance with IFRS.
Reconciliation of Genentech Results
USDmillions
2006CHF
millionsUSD
millions
2005CHF
millions
Operating income (US GAAP basis) 3,152 1,922- redemption costs 105 122- equity compensation plan expenses (US GAAP basis) 309- special litigation items 54 58Operating income (non-US GAAP basis) 3,620 2,102Add (deduct) differences and consolidation entries - Add back redemption costs (105) (122)- Equity compensation plan expenses (IFRS basis) (407) (235)- Capitalised in-process research and eevelopment 104 15- Other differences and consolidation entries (60) (54)Operating profit before exceptional items (IFRS basis) 3,152 3,951 1,706 2,124 Add (deduct) exceptional items - Major legal cases - -Segment result/operating profit (IFRS basis) 3,951 2,124 Add (deduct) non-operating Items (IFRS basis) - Financial income and financing costs 212 42- Income taxes (1,730) (777)Net income (IFRS basis) 2,433 1,389 Minority interest percentage (average during year) 44.3% 44.3%Income applicable to minority interest (IFRS basis) 1,077 616 Translated at 1 USD = 1.25 CHF (2005: 1 USD = 1.25 CHF)
Effective 1 January 2005 the Group implemented IFRS 2 ‘Share-based Payment’ in its IFRS financial statements. Amongst other matters, the standard requires that the fair value of all equity compensation plans awarded to employees be estimated at grant date and recorded as an expense over the vesting period. The expense is charged against the appropriate income statement heading. The standard also requires retrospective application, within certain transitional requirements. In 2006 a pre-tax expense of 407 million US dollars or 510 million Swiss francs relating to plans at Genentech has been recorded (2005: 235 million US dollars or 293 million Swiss francs). Due to the impact of the transitional requirements these amounts are not indicative of the future expenses for such plans. Effective 1 January 2006 Genentech implemented US Statement of Financial Accounting Standards No. 123R -’Share-Based Payment’ (FAS 123R) in its US GAAP financial statements. Amongst other matters, this requires that companies reporting under US GAAP recognise compensation expenses for such plans. Due to the different dates of first application, measurement requirements and transitional arrangements of FAS 123R and IFRS 2, the expenses recorded by Genentech in its US GAAP financial statements for equity compensation plans are not the same as the expenses recorded in the Roche Group IFRS financial statements for these same plans.

Page 435
46
In 2005 the Group implemented IAS 38 (revised) ‘Intangible Assets’ in its IFRS financial statements. Amongst other matters, the revised standard typically results in more intangible assets being recognised from in-licensing arrangements and similar research and development alliances. In Genentech’s US GAAP financial statements such expenditure would usually be recorded as research and development expenses.
There are other differences between IFRS and US GAAP, but these have a relatively minor impact.
Genentech share repurchases
On 20 April 2006 Genentech’s Board of Directors approved an extension of the existing stock repurchase programme authorising Genentech to repurchase up to 100 million shares of Genentech’s common stock for a total of 6 billion US dollars through 30 June 2007. Since the programme’s inception, Genentech has repurchased approximately 62 million shares for a total of approximately 4.4 billion US dollars. During 2006 Genentech repurchased common stock worth 996 million US dollars or 1,248 million Swiss francs (2005: 2,016 million US dollars or 2,511 million Swiss francs).
Manufacturing agreements with Lonza
Effective 8 December 2006 Genentech sold its wholly-owned subsidiary Genentech España, including the manufacturing facility in Porriño, Spain, to Lonza Group Ltd. (‘Lonza’) for 150 million US dollars. In 2006 11 million US dollars were received in cash and the remaining balance will be received from Lonza in a series of payments over the next three years. As part of this agreement Genentech has entered into a short-term supply contract with Lonza for the production of Avastin using a portion of the production capacity of the Porriño facility.
Loss on divestment of Genentech España in millions of CHF
2006 Consideration - Cash 14 - Present value of unsecured receivables from Lonza 169 Total consideration 183 Net assets disposed - Property, plant and equipment15 (192) - Other net assets (7) Loss on divestment (16)
At the same time Genentech has entered into a supply agreement for the manufacture of certain Genentech products at Lonza’s facility under construction in Singapore which is currently expected to receive US Food and Drug Administration (‘FDA’) licensure in 2010. Genentech is committed to fund the pre-commissioning production qualification costs at this facility and, upon FDA licensure, Genentech is committed to purchase 100% of products successfully manufactured at the facility for a period of three years after commissioning of the facility. The estimated total cost of these pre- and post-commissioning commitments is approximately 440 million US dollars. Genentech has also received an exclusive option to purchase the Lonza Singapore facility during the period from 2007 up to one year after FDA licensure for a purchase price of 290 million US dollars. Regardless of whether the purchase option is exercised, Genentech will be obliged to make a milestone payment of 70 million US dollars if certain performance milestones are met at the facility being constructed.
Genentech has also entered into a loan agreement with Lonza to advance up to 299 million US dollars to Lonza for the construction of the Singapore facility, the majority of which is not expected to be advanced until 2008. The majority of these funds will not be advanced to Lonza unless and until Lonza’s securitisation obligations for such are mutually agreed upon by the parties. If Genentech exercises its option to purchase the facility then any outstanding advances may be offset against the purchase price. If Genentech does not exercise its purchase option then the advances may be offset against supply purchases.

Page 436
47
Oceanside biologies manufacturing facility
On 23 June 2005 Genentech completed the purchase of the Oceanside biologies manufacturing facility in San Diego, California, from Biogen Idec. The purchase cost, including closing costs, was 531 million Swiss francs.
Acquisition of Tanox
On 9 November 2006 Genentech announced plans to acquire a 100% controlling interest in Tanox, Inc. (‘Tanox’), a publicly owned company listed on the NASDAQ under the symbol ‘TNOX’. Tanox is a biotechnology company based in Houston, Texas, that specialises in the discovery and development of biotherapeutics based on monoclonal antibody technology. Genentech and Tanox have been working together in collaboration with Novartis since 1996 to develop and commercialise Xolair. The expected purchase consideration, excluding transaction costs, is 919 million US dollars in cash. Funds will be provided from Genentech’s cash on hand at the time of closing. On 15 January 2007 the transaction was approved by Tanox’s shareholders. The transaction, which is subject to regulatory clearance, is expected to be completed in the first half of 2007.
Leasing arrangements
During the third quarter of 2005 Genentech paid 585 million US dollars to buy out the lease obligations in respect of its manufacturing facility at Vacaville, California and certain buildings on its South San Francisco site.
In December 2004 Genentech entered into a Master Lease Agreement with Slough SSF LLC (‘Slough’) for the development of property adjacent to Genentech’s South San Francisco site. The development includes a total of eight buildings, which are subject to separate agreements as contemplated by the Master Lease Agreement. Slough as the developer will construct the building shell for each building and Genentech will finish the interior of each building as laboratory or office space, as applicable. The construction of the first buildings was completed in 2006, at which point the lease term for those buildings was deemed to begin. Construction of the final buildings is expected to be completed during 2008. The lease term expires twelve years from the occupation of the final building. Genentech has two five-year renewal options for each building and has an option to purchase the various buildings at different dates between 2016 and 2020. Genentech also has a right of first refusal with respect to each building or the entire development should Slough consider selling part or all of the development.
As at 31 December 2006, based on the status of the development to date, the total carrying value of property, plant and equipment from this agreement, including tenant improvements, was 228 million Swiss francs and the carrying value of the leasing obligation was 219 million Swiss francs. Estimates of the total future minimum lease payments anticipated by the entire Master Lease Agreement are shown below.
Estimated total future minimum lease payments under slough leases in millions of CHF
Principal Ground lease InterestTotal minimumlease payments
Within one year 6 5 12 23Between one and five years 63 34 78 175More than five years 293 83 87 463Total 362 122 177 661
Other matters
Details of Genentech legal cases are given in Note 7. Details of Genentech’s equity compensation plans are given in Note 14. Details of Genentech’s Senior Notes are given in Note 30.
5. Chugai
Effective 1 October 2002 the Roche Group and Chugai completed an alliance to create a leading research-driven Japanese pharmaceutical company, which was formed by the merger of Chugai and Roche’s Japanese pharmaceuticals subsidiary, Nippon Roche. The merged company, known as Chugai, is a fully consolidated subsidiary of the Group. At 31 December 2006 the Group’s interest in Chugai was 50.6% (2005: 50.6%).

Page 437
48
The common stock of Chugai is publicly traded and is listed on the Tokyo Stock Exchange under the stock code TSE:4519’. Chugai prepares financial statements in conformity with accounting principles generally accepted in Japan (JGAAP). These are filed on a quarterly basis with the Tokyo Stock Exchange.
Differences between IFRS and JGAAP
Due to certain consolidation entries and differences in the requirements of International Financial Reporting Standards (IFRS) and JGAAP, there are differences between Chugai’s stand-alone financial results on a JGAAP basis and the financial results of Chugai as consolidated by the Roche Group in accordance with IFRS.
The acquisition by Roche of a 50.1% interest in Chugai is treated as a business combination for IFRS. For JGAAP the alliance is treated as a merger between Chugai and Nippon Roche. Therefore the JGAAP results of Chugai do not include the goodwill and fair value adjustments that are recorded in Roche’s results, and which are quantified in the table below. Moreover the acquisition accounting only includes Roche’s 50.1% of these fair value adjustments and therefore the impact of these on net income needs to be added back in the minority interest calculations in Roche’s IFRS results.
In Roche’s IFRS results, depreciation on property, plant and equipment is calculated using the straight-line method. In Chugai’s JGAAP results the reducing balance method is used. Additionally certain income and expenses, notably some restructuring costs, are required by JGAAP to be reported as extraordinary items. In Chugai’s JGAAP results extraordinary items are reported below the operating profit line. In Roche’s IFRS results such items are normally included as part of operating profit and are not treated as extraordinary or exceptional items. Restructuring costs were 4 million Swiss francs (2005: 56 million Swiss francs). There are other differences between IFRS and JGAAP, but these have a relatively minor impact.
Reconciliation of Chugai Results
JPY
billions
2006 CHF
millions JPY
billions
2005 CHF
millions Operating profit (JGAAP Basis) 58.3 79.2 - depreciation basis difference 3.4 4.5 - classification of extraordinary items (0.2) (3.3) - other differences and consolidation entries (2.0) (3.2) Chugai operating profit before exceptional items and before acquisition accounting impacts (IFRS Basis) 59.5 641 77.2 873 - depreciation of property, plant and equipment (0.7) (7) (0.7) (8) - amortisation of intangible assets arising from business combinations (6.0) (65) (6.0) (68) Chugai operating profit before exceptional items (IFRS Basis) 52.8 569 70.5 797 Add (deduct) exceptional items - major legal cases - - Chugai segment result/operating profit (IFRS basis) 569 797 Add (deduct) corporate and non-operating items (IFRS Basis) - gain on settlement of defined benefit plans - 127 - financial income and financing costs 20 11 - Income taxes (229) (343) Net income (IFRS basis) 360 592 Minority interest calculation Add back acquisition impact on net income 49 52 Net income excluding acquisition accounting 409 644 Minority interest percentage (average during year) 49.4% 49.4% Income applicable to minority interest (IFRS basis) 202 318
Translated at 100 JPY = 1.08 CHF (2005: 100 JPY = 1.13 CHF).
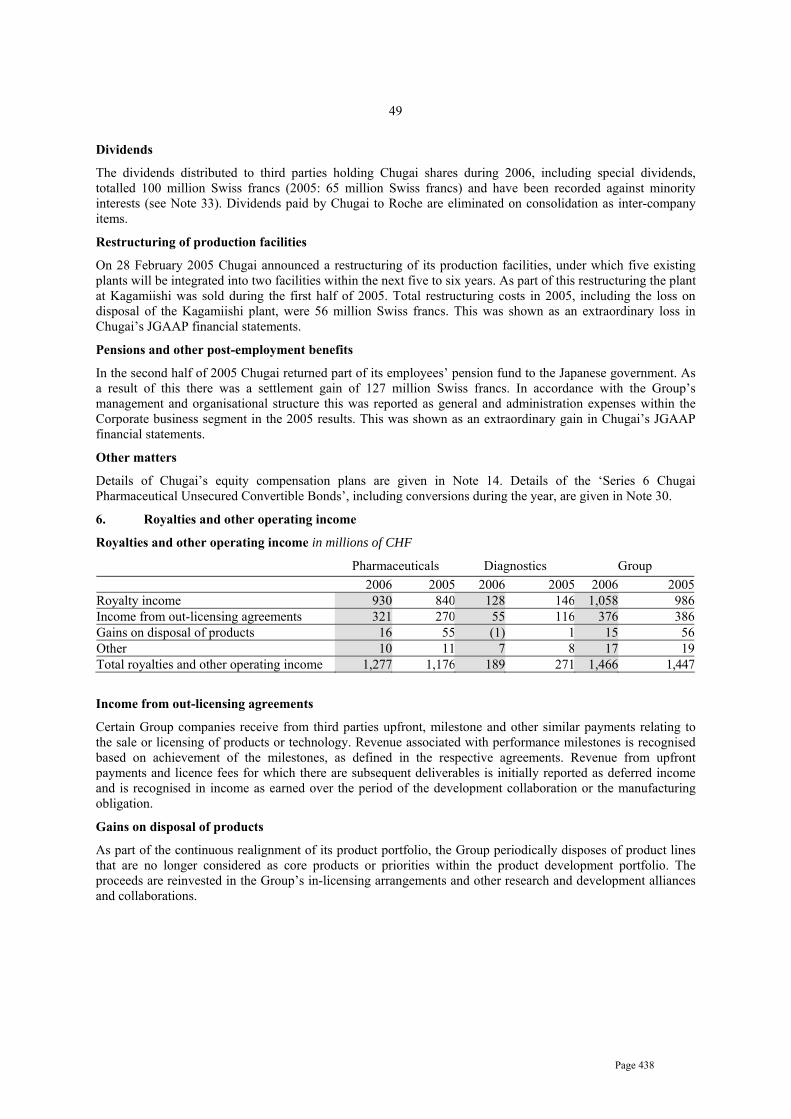
Page 438
49
Dividends
The dividends distributed to third parties holding Chugai shares during 2006, including special dividends, totalled 100 million Swiss francs (2005: 65 million Swiss francs) and have been recorded against minority interests (see Note 33). Dividends paid by Chugai to Roche are eliminated on consolidation as inter-company items.
Restructuring of production facilities
On 28 February 2005 Chugai announced a restructuring of its production facilities, under which five existing plants will be integrated into two facilities within the next five to six years. As part of this restructuring the plant at Kagamiishi was sold during the first half of 2005. Total restructuring costs in 2005, including the loss on disposal of the Kagamiishi plant, were 56 million Swiss francs. This was shown as an extraordinary loss in Chugai’s JGAAP financial statements.
Pensions and other post-employment benefits
In the second half of 2005 Chugai returned part of its employees’ pension fund to the Japanese government. As a result of this there was a settlement gain of 127 million Swiss francs. In accordance with the Group’s management and organisational structure this was reported as general and administration expenses within the Corporate business segment in the 2005 results. This was shown as an extraordinary gain in Chugai’s JGAAP financial statements.
Other matters
Details of Chugai’s equity compensation plans are given in Note 14. Details of the ‘Series 6 Chugai Pharmaceutical Unsecured Convertible Bonds’, including conversions during the year, are given in Note 30.
6. Royalties and other operating income
Royalties and other operating income in millions of CHF
Pharmaceuticals Diagnostics Group 2006 2005 2006 2005 2006 2005Royalty income 930 840 128 146 1,058 986Income from out-licensing agreements 321 270 55 116 376 386Gains on disposal of products 16 55 (1) 1 15 56Other 10 11 7 8 17 19Total royalties and other operating income 1,277 1,176 189 271 1,466 1,447
Income from out-licensing agreements
Certain Group companies receive from third parties upfront, milestone and other similar payments relating to the sale or licensing of products or technology. Revenue associated with performance milestones is recognised based on achievement of the milestones, as defined in the respective agreements. Revenue from upfront payments and licence fees for which there are subsequent deliverables is initially reported as deferred income and is recognised in income as earned over the period of the development collaboration or the manufacturing obligation.
Gains on disposal of products
As part of the continuous realignment of its product portfolio, the Group periodically disposes of product lines that are no longer considered as core products or priorities within the product development portfolio. The proceeds are reinvested in the Group’s in-licensing arrangements and other research and development alliances and collaborations.

Page 439
50
7. Major legal cases
Income (expenses) from major legal cases in millions of CHF
2006 2005 Roche Pharmaceuticals legal cases - (210) Genentech legal cases - - Diagnostics legal cases - (146) Total income (expenses) from major legal cases – continuing businesses
- (356)
- Discontinued businesses – vitamin case - - Group total - (356)
Income (expenses) from major legal cases (continuing businesses) is disclosed separately in the income statement due to the materiality of the amounts and in order to fairly present the Group’s results. The total net cash outflow from major legal cases during the year was 31 million Swiss francs (2005: 180 million Swiss francs).
Roche Pharmaceuticals legal cases
Roche Diagnostics GmbH (‘RDG’) and SmithKline Beecham (Cork) Ltd (‘SB’) are party to arbitration concerning RDG’s termination in 1998 of the Carvedilol License Agreement of 1987, as amended in 1995, relating to the licensing and co-marketing of carvedilol. RDG has submitted two claims for damages to two Arbitration Tribunals in Zurich and SB has submitted a counterclaim asserting the invalidity of RDG’s termination and claiming damages. Based on the development of the current arbitration and settlement negotiations, the Group increased its existing provisions by 210 million Swiss francs in 2005. There have been no developments in 2006 that would require any further changes to the provisions already recorded by the Group. The total amount of provisions recorded by RDG is not disclosed as this may seriously prejudice RDG’s position in this matter.
Genentech legal cases
On 10 June 2002 Genentech announced that a Los Angeles County Superior Court jury voted to award City of Hope Medical Center (‘City of Hope’) approximately 300 million US dollars in compensatory damages based on a finding of a breach of a 1976 agreement between Genentech and the City of Hope. On 24 June 2002 the jury voted to award City of Hope 200 million US dollars in punitive damages in the same case. On 13 September 2002 Genentech filed a notice of appeal of the jury verdict and damages awards with the California Court of Appeal. On 21 October 2004 the Court of Appeal affirmed the verdict and damages awards in all respects. Also, on 21 October 2004 Genentech announced that it would seek review by the California Supreme Court, which has discretion over which cases it will review. On 24 November 2004 Genentech filed its petition for review by the California Supreme Court and on 2 February 2005 the California Supreme Court granted this petition. The appeal to the California Supreme Court has been fully briefed and Genentech is waiting to be assigned an oral argument date. A full provision, which is classified as long-term, has been recorded for the damages awards. During the appeals process interest accrues on the total amount of the damages at a simple annual rate of 10%. Following the judgement, interest of 63 million Swiss francs (2005: 62 million Swiss francs) was recorded as the time cost of provisions, within financing costs. On 3 October 2002 Genentech entered into an arrangement with third-party insurance companies to post a surety bond in connection with this judgement. As part of this arrangement Genentech had pledged 735 million US dollars in cash and investments to secure this bond as at 31 December 2005. This was increased in 2006 by 53 million US dollars to 788 million US dollars. This amount, which is equivalent to 963 million Swiss francs at 31 December 2006, is reported as restricted cash within financial long-term assets (see Note 19).
On 4 October 2004 Genentech received a subpoena from the United States Department of Justice, requesting documents related to the promotion of Rituxan, a prescription product approved for the treatment of relapsed or refractory, low-grade or follicular, CD20-positive, B-cell non-Hodgkin’s lymphoma. Genentech is co-operating with the associated investigation, which, as Genentech has been advised, is both civil and criminal in nature. The government has called and is expected to call former and current Genentech employees to appear before the grand jury in connection with this investigation. No provisions have been recorded in respect of this litigation as the outcome of this matter cannot be determined at this time.
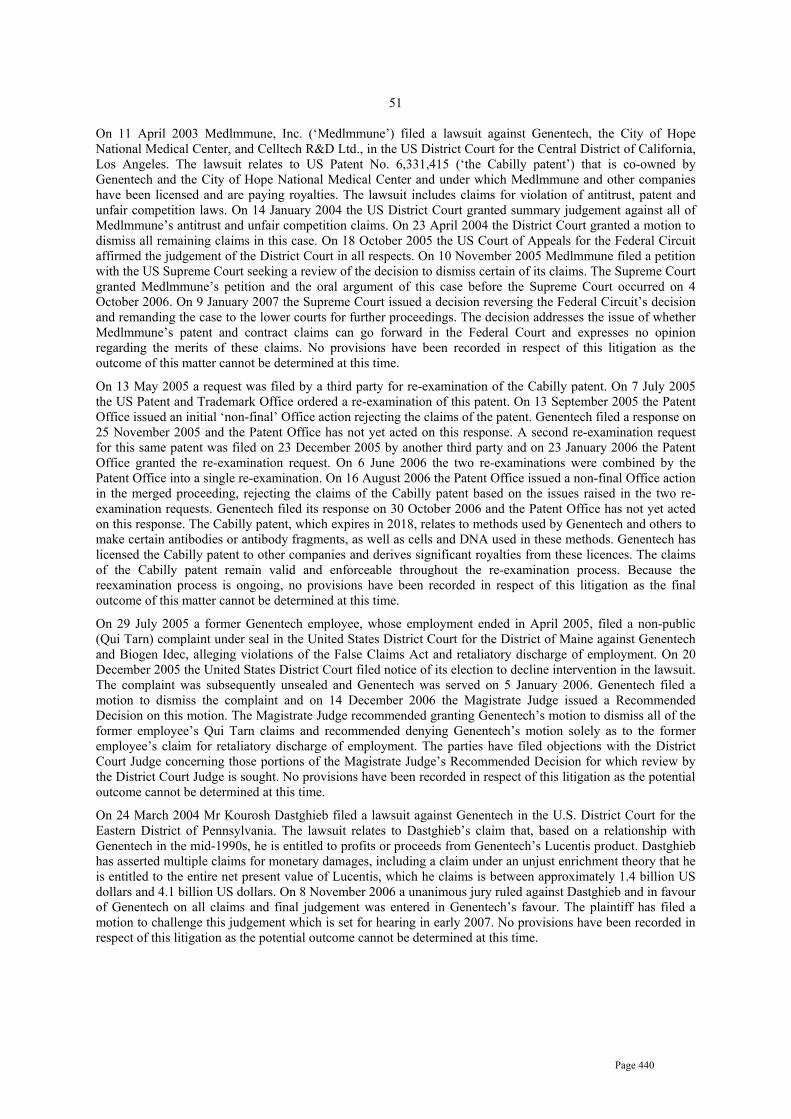
Page 440
51
On 11 April 2003 Medlmmune, Inc. (‘Medlmmune’) filed a lawsuit against Genentech, the City of Hope National Medical Center, and Celltech R&D Ltd., in the US District Court for the Central District of California, Los Angeles. The lawsuit relates to US Patent No. 6,331,415 (‘the Cabilly patent’) that is co-owned by Genentech and the City of Hope National Medical Center and under which Medlmmune and other companies have been licensed and are paying royalties. The lawsuit includes claims for violation of antitrust, patent and unfair competition laws. On 14 January 2004 the US District Court granted summary judgement against all of Medlmmune’s antitrust and unfair competition claims. On 23 April 2004 the District Court granted a motion to dismiss all remaining claims in this case. On 18 October 2005 the US Court of Appeals for the Federal Circuit affirmed the judgement of the District Court in all respects. On 10 November 2005 Medlmmune filed a petition with the US Supreme Court seeking a review of the decision to dismiss certain of its claims. The Supreme Court granted Medlmmune’s petition and the oral argument of this case before the Supreme Court occurred on 4 October 2006. On 9 January 2007 the Supreme Court issued a decision reversing the Federal Circuit’s decision and remanding the case to the lower courts for further proceedings. The decision addresses the issue of whether Medlmmune’s patent and contract claims can go forward in the Federal Court and expresses no opinion regarding the merits of these claims. No provisions have been recorded in respect of this litigation as the outcome of this matter cannot be determined at this time.
On 13 May 2005 a request was filed by a third party for re-examination of the Cabilly patent. On 7 July 2005 the US Patent and Trademark Office ordered a re-examination of this patent. On 13 September 2005 the Patent Office issued an initial ‘non-final’ Office action rejecting the claims of the patent. Genentech filed a response on 25 November 2005 and the Patent Office has not yet acted on this response. A second re-examination request for this same patent was filed on 23 December 2005 by another third party and on 23 January 2006 the Patent Office granted the re-examination request. On 6 June 2006 the two re-examinations were combined by the Patent Office into a single re-examination. On 16 August 2006 the Patent Office issued a non-final Office action in the merged proceeding, rejecting the claims of the Cabilly patent based on the issues raised in the two re-examination requests. Genentech filed its response on 30 October 2006 and the Patent Office has not yet acted on this response. The Cabilly patent, which expires in 2018, relates to methods used by Genentech and others to make certain antibodies or antibody fragments, as well as cells and DNA used in these methods. Genentech has licensed the Cabilly patent to other companies and derives significant royalties from these licences. The claims of the Cabilly patent remain valid and enforceable throughout the re-examination process. Because the reexamination process is ongoing, no provisions have been recorded in respect of this litigation as the final outcome of this matter cannot be determined at this time.
On 29 July 2005 a former Genentech employee, whose employment ended in April 2005, filed a non-public (Qui Tarn) complaint under seal in the United States District Court for the District of Maine against Genentech and Biogen Idec, alleging violations of the False Claims Act and retaliatory discharge of employment. On 20 December 2005 the United States District Court filed notice of its election to decline intervention in the lawsuit. The complaint was subsequently unsealed and Genentech was served on 5 January 2006. Genentech filed a motion to dismiss the complaint and on 14 December 2006 the Magistrate Judge issued a Recommended Decision on this motion. The Magistrate Judge recommended granting Genentech’s motion to dismiss all of the former employee’s Qui Tarn claims and recommended denying Genentech’s motion solely as to the former employee’s claim for retaliatory discharge of employment. The parties have filed objections with the District Court Judge concerning those portions of the Magistrate Judge’s Recommended Decision for which review by the District Court Judge is sought. No provisions have been recorded in respect of this litigation as the potential outcome cannot be determined at this time.
On 24 March 2004 Mr Kourosh Dastghieb filed a lawsuit against Genentech in the U.S. District Court for the Eastern District of Pennsylvania. The lawsuit relates to Dastghieb’s claim that, based on a relationship with Genentech in the mid-1990s, he is entitled to profits or proceeds from Genentech’s Lucentis product. Dastghieb has asserted multiple claims for monetary damages, including a claim under an unjust enrichment theory that he is entitled to the entire net present value of Lucentis, which he claims is between approximately 1.4 billion US dollars and 4.1 billion US dollars. On 8 November 2006 a unanimous jury ruled against Dastghieb and in favour of Genentech on all claims and final judgement was entered in Genentech’s favour. The plaintiff has filed a motion to challenge this judgement which is set for hearing in early 2007. No provisions have been recorded in respect of this litigation as the potential outcome cannot be determined at this time.

Page 441
52
Genentech’s annual report and quarterly SEC filings contain the detailed disclosures of litigation matters that are required by US GAAP. These include further details on the above matters as well as including information on other litigation that is not currently as significant as the matters referred to above.
Diagnostics legal cases
During 2005 provisions for certain litigation and arbitration matters in the Diagnostics Division were increased by 146 million Swiss francs. There have been no developments in 2006 that would require any further changes to the provisions already recorded by the Group.
On 9 October 2003 Applera Corporation (‘Applera’) filed suit against the Group in the Superior Court of California and filed a Notice of Arbitration with the American Arbitration Association. Both the Superior Court lawsuit and the arbitration demand made claims concerning the interpretation and enforcement of contracts between the Group and Applera for the commercialisation of the polymerase chain reaction (PCR) technology. The claims sought termination of certain contracts, declarations regarding rights and obligations under those contracts, and monetary damages and other relief in an unspecified amount for alleged breaches of various agreements between the parties. On 15 December 2003 the Group filed its response in the arbitration proceeding. On the same day, the Group also responded to Applera’s complaint in the Superior Court proceeding by petitioning the Court to compel arbitration of the claims alleged by Applera and to stay the lawsuit pending completion of the arbitration. On 22 October 2004 the Court of Appeal of the State of California ruled that the petition to compel arbitration should be granted and remanded the case to the Superior Court, with directions to grant the petition. On 9 May 2005 the Group announced that a settlement agreement had been reached with Applera with regard to the outstanding litigation and arbitration related to contractual relationships involving rights to and commercialisation of polymerase chain reaction (PCR) technology.
In 1992 the Group filed a suit against the Promega Corporation (‘Promega’) alleging patent infringement and breach of a licence agreement relating to the polymerase chain reaction (PCR) technology. In May 2004 the US District Court of the Northern District of California decided that one of the patents concerned was unenforceable and rejected the breach of licence claim. On 12 November 2003 the Group was notified that Promega had filed a non-public (Qui Tarn) action against the Group with the US District Court of the Eastern District of West Virginia in March 2000. This complaint, filed under the False Claims Act, alleged that the US Federal Government was overcharged in its purchase of PCR enzyme products. In July 2003 the US Federal Government notified the Court of its decision not to intervene in Promega’s complaint and on 12 November 2003 the Court ordered the complaint of 2000 to be unsealed. The Group filed a motion to dismiss this complaint and on 20 August 2004 the Court dismissed the complaint with prejudice. On 12 September 2005 the Group announced that a settlement agreement had been reached with Promega with regard to all outstanding litigation related to polymerase chain reaction (PCR) technology.
Vitamin case
Following the settlement agreement with the US Department of Justice on 20 May 1999 regarding pricing practices in the vitamin market and the overall settlement agreement to a class action suit brought by the US buyers of bulk vitamins, the Group recorded provisions in respect of the vitamin case in 1999. These provisions were the Group’s best estimate at that time of the total liability that may arise, taking into account currency movements and the time value of money. Provisions for legal fees were recorded separately. The Group recorded additional provisions in 2001 and 2002, based on the development of the litigation and settlement negotiations in the US, Europe and elsewhere.
On 17 January 2003 the District of Columbia Circuit Court of Appeals ruled in a class action litigation brought on behalf of non-US purchasers of bulk vitamins from the Group and other manufacturers that non-US plaintiffs may bring claims in US courts under US anti-trust laws for alleged damages suffered from transactions outside the United States. On 14 June 2004 the Supreme Court of the United States nullified the decision of the District of Columbia Circuit Court of Appeals. The Supreme Court remanded the case to the lower court to review alternative arguments which might permit such claims to proceed in the United States. On remand, on 28 June 2005 a panel of the District of Columbia Circuit Court of Appeals ruled unanimously that US courts do not have jurisdiction over the plaintiffs’ claims and affirmed the initial dismissal of the complaint. On 26 October 2005 the plaintiffs petitioned the US Supreme Court for further discretionary review. On 9 January 2006 the US Supreme Court

Page 442
53
issued an order denying the plaintiffs’ petition. On 1 March 2006 the plaintiffs filed a motion in the trial court seeking relief from the final judgement so that plaintiffs could advance European Union law claims in the trial court. The trial court has denied that motion, and the plaintiffs’ time to appeal the trial court’s ruling has expired. The Group considers this matter closed.
The Group is seeking to resolve the remaining outstanding issues; however the timing and the final amounts involved are uncertain. The remaining provisions are all considered as short-term as cash outflows are expected to arise during 2007. They are not discounted as the time value of money is not considered material in this case. As the litigation and negotiations progress, it is possible that the ultimate liability may be different from the amount of provisions currently recorded.
8. Financial income and financing costs
Year ended 31 DecemberFinancial income in millions of CHF 2006 2005
Gains on sale of equity securities 382 251(Losses) on sale of equity securities (2) (26)Dividend income 10 10Gains (losses) on equity derivatives, net 9 41Write-downs and impairments of equity securities (9) (18)Net income from equity securities 390 258 Interest income 788 423Gains on sale of debt securities 57 79(Losses) on sale of debt securities (67) (86)Net gains (losses) on financial assets at fair-value-through-profit-or-loss 2 -Write-downs and impairments of long-term loans - -Net interest income and income from debt securities 780 416 Expected return on plan assets of defined benefit plans13 636 635 Foreign exchange gains (losses), net 33 139Gains (losses) on foreign currency derivatives, net (57) (173)Net foreign exchange gains (losses) (24) (34) Net other financial income (expense) 47 38 Total financial income 1,829 1,313 Financing costs in millions of CHF Year ended 31 December
2006 2005Interest expense (315) (264)Amortisation of discount on debt instruments (40) (62)Gains (losses) on interest rate derivatives, net (25) (19)Net gains (losses) on financial liabilities at fair-value-through-profit-or-loss
51 41
Time cost of provisions28 (74) (78)Interest cost of defined benefit plans13 (571) (603)Total financing costs (974) (985)

Page 443
54
Net financial income in millions of CHF Year ended 31 December
2006 2005Financial income 1,829 1,313Financing costs (974) (985)Net financial income 855 328Financial result from Treasury management 790 296Financial result from Pension management 65 32Net financial income 855 328 Net gains (losses) on financial liabilities at fair-value-through-profit-or-loss includes the change in the fair value that is attributable to changes in the liabilities’ credit risk component. This is calculated by comparing the difference between the present value of the future cash flows on the bonds, discounted by using a swap (LIBOR) yield curve, and the market prices of the bonds. Due to there being no major credit spread movement relative to the swap yield curve during 2006, the change in fair value that is attributable to changes in the liabilities’ credit risk component was zero (2005: loss of 10 million Swiss francs). The cumulative change in fair value that is attributable to the change in credit risk since the issuance of the instruments was a gain of 17 million Swiss francs (2005: gain of 17 million Swiss francs). Interest expense on liabilities at fair-value-through-profit-or-loss was 106 million Swiss francs (2005: 105 million Swiss francs). 9. Income taxes Income tax expenses in millions of CHF
2006 2005 Current income taxes 3,436 2,409 Adjustments recognised for current tax of prior periods (24) 37 Deferred income taxes 24 (162) Total charge for income taxes 3,436 2,284 Since the Group operates internationally, it is subject to income taxes in many different tax jurisdictions. The Group calculates its average expected tax rate as a weighted average of the tax rates in the tax jurisdictions in which the Group operates. The Group’s effective tax rate can be reconciled to the Group’s average expected tax rate as follows: Reconciliation of the Group’s effective tax rate in millions of CHF 2006 2005 Average expected tax rate 26.4% 25.2% Tax effect of - Utilisation of previously unrecognised tax losses -0.2% -0.2% - Non-taxable income/non-deductible expenses -0.1% +0.1% - Genentech equity compensation plans +0.7% 0.0% - Other differences +0.5% +0.3% Continuing businesses before exceptional items effective tax rate 27.3% 25.4%
Profit before
tax Income
taxes 2006
Tax rate
Profit before
tax Income
taxes
2005 Tax rate
Roche (excluding Genentech and Chugai) 7,835 (1,477) 18.9% 6,417 (1,299) 20.2% Genentech4 4,163 (1,730) 41.6% 2,166 (777) 35.9% Chugai5
589 (229) 38.9% 935 (343) 36.7% Continuing businesses before exceptional items effective tax rate 12,587 (3,436) 27.3% 9,518 (2,419) 25.4% Major legal cases7
- - (356) 135 Group’s effective tax rate 12,587 (3,436) 27.3% 9,162 (2,284) 24.9%
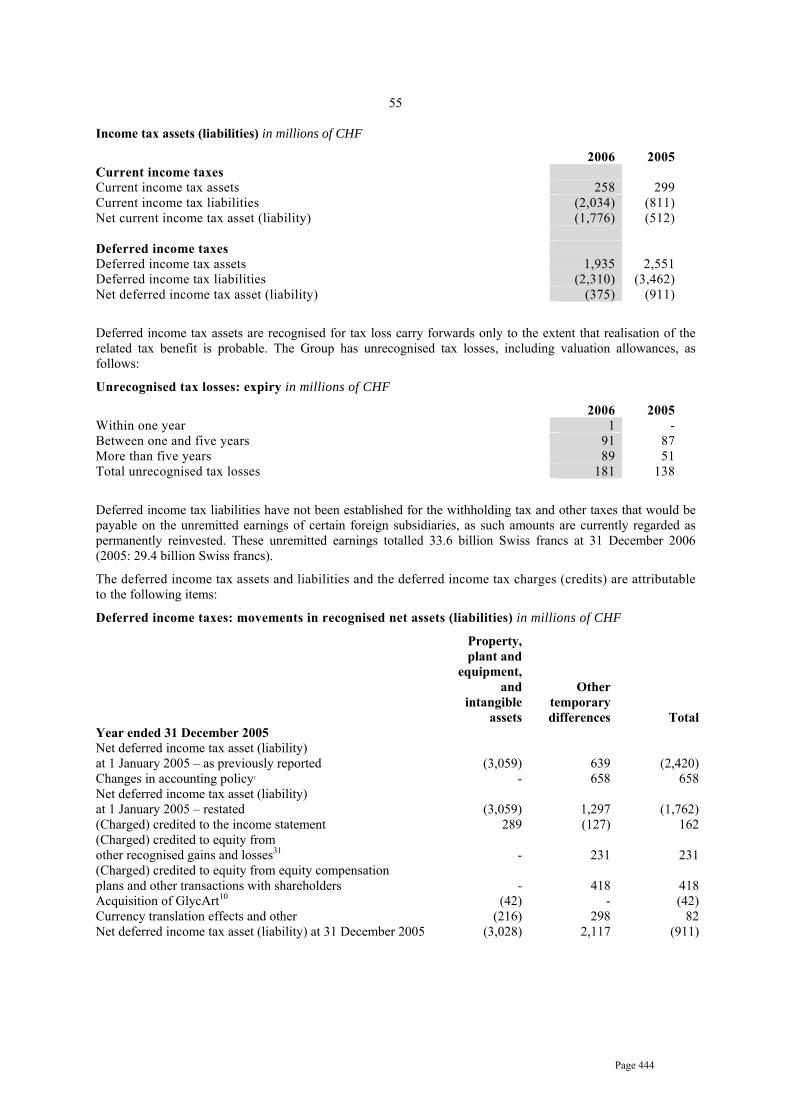
Page 444
55
Income tax assets (liabilities) in millions of CHF
2006 2005 Current income taxes Current income tax assets 258 299 Current income tax liabilities (2,034) (811) Net current income tax asset (liability) (1,776) (512) Deferred income taxes Deferred income tax assets 1,935 2,551 Deferred income tax liabilities (2,310) (3,462) Net deferred income tax asset (liability) (375) (911)
Deferred income tax assets are recognised for tax loss carry forwards only to the extent that realisation of the related tax benefit is probable. The Group has unrecognised tax losses, including valuation allowances, as follows:
Unrecognised tax losses: expiry in millions of CHF
2006 2005 Within one year 1 - Between one and five years 91 87 More than five years 89 51 Total unrecognised tax losses 181 138
Deferred income tax liabilities have not been established for the withholding tax and other taxes that would be payable on the unremitted earnings of certain foreign subsidiaries, as such amounts are currently regarded as permanently reinvested. These unremitted earnings totalled 33.6 billion Swiss francs at 31 December 2006 (2005: 29.4 billion Swiss francs).
The deferred income tax assets and liabilities and the deferred income tax charges (credits) are attributable to the following items:
Deferred income taxes: movements in recognised net assets (liabilities) in millions of CHF
Property, plant and
equipment, and
intangible assets
Other temporary differences Total
Year ended 31 December 2005 Net deferred income tax asset (liability) at 1 January 2005 – as previously reported (3,059) 639 (2,420) Changes in accounting policy1 - 658 658 Net deferred income tax asset (liability) at 1 January 2005 – restated (3,059) 1,297 (1,762) (Charged) credited to the income statement 289 (127) 162 (Charged) credited to equity from other recognised gains and losses31 - 231 231 (Charged) credited to equity from equity compensation plans and other transactions with shareholders - 418 418 Acquisition of GlycArt10 (42) - (42) Currency translation effects and other (216) 298 82 Net deferred income tax asset (liability) at 31 December 2005 (3,028) 2,117 (911)

Page 445
56
Property, plant and equipment,
and intangible assets
Other temporary differences Total
Year ended 31 December 2006 Net deferred income tax asset (liability) at 1 January 2006 (3,028) 2,117 (911) (Charged) credited to the income statement 231 (252) (21) (Charged) credited to equity from other recognised gains and losses31 - (135) (135) (Charged) credited to equity from equity compensation plans and other transactions with shareholders - (11) (11) Currency translation effects and other 80 623 703 Net deferred income tax asset (liability) at 31 December 2006 (2,717) 2.342 (375) 10. Business combinations
Net cash outflows from acquisitions of subsidiaries and associated companies in millions of CHF
2006 2005 GlycArt - (231) Other acquisitions - (2) Total net cash outflows from acquisitions - (233) These amounts are net of any cash balances in the acquired company.
Acquisitions - 2006
There were no acquisitions in 2006. On 9 November 2006, Genentech announced plans to acquire a 100% controlling interest in Tanox, Inc., a US biotechnology company. This transaction, which is expected to close in the first half of 2007 subject to regulatory approval, is described in Note 4.
Acquisitions - 2005
GlycArt: Effective 25 July 2005 the Group acquired a 100% controlling interest in GlycArt Biotechnology Ltd. (‘GlycArt’), a privately-owned biotechnology research company based in Schlieren, Zurich, in Switzerland. GlycArt is reported as part of the Roche Pharmaceuticals business segment. The purchase consideration paid was 235 million Swiss francs, which has been allocated as follows:
GlycArt acquisition: net assets acquired in millions of CHF
Carrying Value prior to
Acquisition
Carrying Value upon Acquisition
Goodwill - 75 Intangible assets: in-process research and development - 178 Intangible assets: core technology - 20 Property, plant and equipment 3 3 Deferred income taxes - (42) Cash 4 4 Other net assets (liabilities) (3) (3) Total 4 235 Goodwill was recognised resulting from the premium paid for the acquisition. This represents synergies that can be obtained from the Group’s existing business utilising the acquired core technology. Intangible assets for core technology are amortised on a straight-line basis over 14 years, beginning 1 August 2005. Intangible assets for in-process research and development will be amortised over their useful lives on a straight-line basis beginning from the point when they are available for use. Subsequent to the acquisition GlycArt contributed a net expense of 9 million Swiss francs to the Roche Pharmaceuticals business result in 2005. If GlycArt had been acquired on 1 January 2005, the revenues of the Group in 2005 would have been unchanged and the Group’s net income in 2005 would have been lower by a further 7 million Swiss francs compared to the reported results.
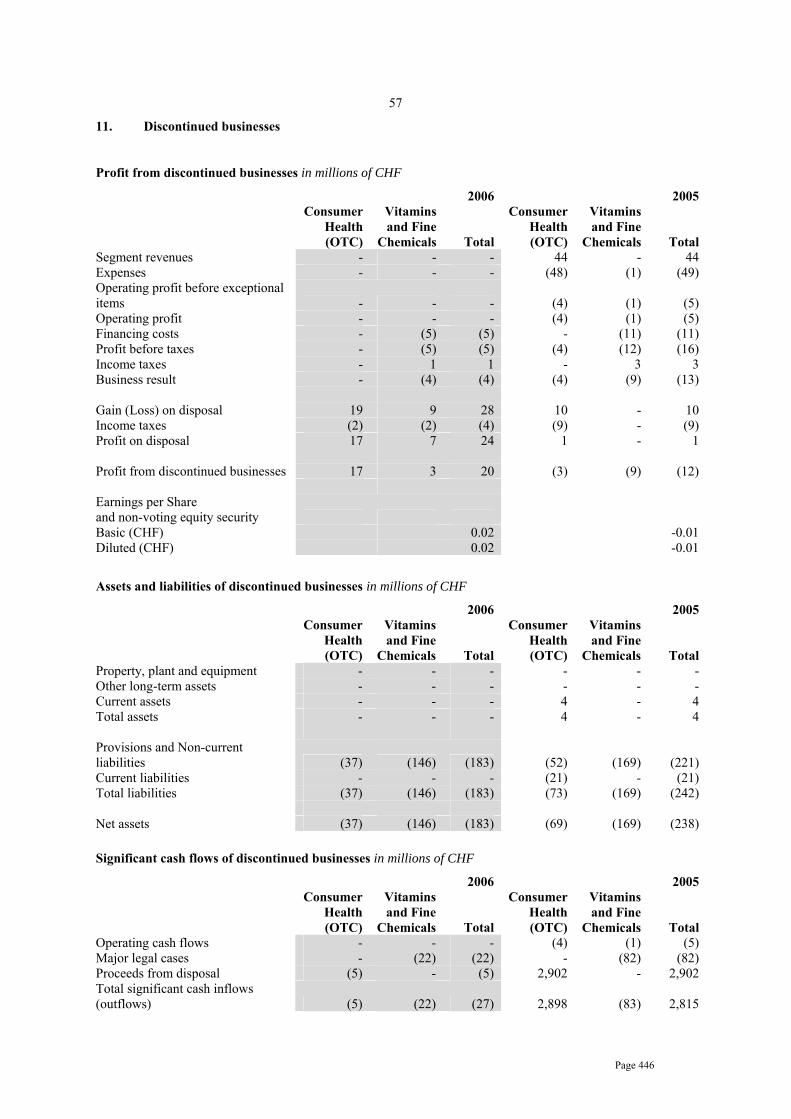
Page 446
57
11. Discontinued businesses
Profit from discontinued businesses in millions of CHF
2006 2005
Consumer Health (OTC)
Vitamins and Fine
Chemicals Total
Consumer Health (OTC)
Vitamins and Fine
Chemicals Total Segment revenues - - - 44 - 44 Expenses - - - (48) (1) (49) Operating profit before exceptional items - - - (4) (1) (5) Operating profit - - - (4) (1) (5) Financing costs - (5) (5) - (11) (11) Profit before taxes - (5) (5) (4) (12) (16) Income taxes - 1 1 - 3 3 Business result - (4) (4) (4) (9) (13) Gain (Loss) on disposal 19 9 28 10 - 10 Income taxes (2) (2) (4) (9) - (9) Profit on disposal 17 7 24 1 - 1 Profit from discontinued businesses 17 3 20 (3) (9) (12) Earnings per Share and non-voting equity security Basic (CHF) 0.02 -0.01 Diluted (CHF) 0.02 -0.01
Assets and liabilities of discontinued businesses in millions of CHF
2006 2005
Consumer Health (OTC)
Vitamins and Fine
Chemicals Total
Consumer Health (OTC)
Vitamins and Fine
Chemicals Total Property, plant and equipment - - - - - - Other long-term assets - - - - - - Current assets - - - 4 - 4 Total assets - - - 4 - 4 Provisions and Non-current liabilities (37) (146) (183) (52) (169) (221) Current liabilities - - - (21) - (21) Total liabilities (37) (146) (183) (73) (169) (242) Net assets (37) (146) (183) (69) (169) (238) Significant cash flows of discontinued businesses in millions of CHF
2006 2005
Consumer Health (OTC)
Vitamins and Fine
Chemicals Total
Consumer Health (OTC)
Vitamins and Fine
Chemicals Total Operating cash flows - - - (4) (1) (5) Major legal cases - (22) (22) - (82) (82) Proceeds from disposal (5) - (5) 2,902 - 2,902 Total significant cash inflows (outflows) (5) (22) (27) 2,898 (83) 2,815

Page 447
58
Divestment of Consumer Health (OTC) business
On 19 July 2004 the Group announced the sale of Roche Consumer Health, its global OTC (over-the-counter medicines) business, to the Bayer Group. Under the agreement with Bayer the majority of local businesses were transferred to Bayer at the end of 2004. The divestment of the remaining 2%, measured in terms of Roche Consumer Health sales to third parties, was completed in 2005. Under the terms of the agreement the majority of cash proceeds, totalling 2,886 million Swiss francs, were transferred to the Group on 1 January 2005. In addition the Group received a further 16 million Swiss francs during the first half of 2005 for the remaining part of the divestment that was completed in 2005. The calculations of the final amounts arising from the agreed purchase price adjustment mechanisms have been completed and as a result 5 million Swiss francs were transferred to Bayer in 2006. There was no effect on net income from this transfer as the amounts concerned were covered by accruals made in the initial calculation of the gain on disposal. The profit from disposal for 2006 consists of a release of 19 million Swiss francs in respect of certain accruals and provisions that are no longer required. The business results for 2005 include the remaining part of Roche Consumer Health that was transferred to Bayer in 2005. There were no significant cash flows other than the receipt of the divestment proceeds received from Bayer that are described above.
Divestment of Vitamins and Fine Chemicals business
Effective 30 September 2003 the Group completed the sale of its global Vitamins and Fine Chemicals business (‘the VFC business’) to the Dutch company DSM. Following the sale of the VFC business, certain assets and liabilities of the Vitamins and Fine Chemicals Division, mainly associated with the vitamin case, remain with the Group. The Group and DSM have signed an Indemnity and Co-operation Agreement under which the Group may provide DSM with certain indemnities and guarantees in connection with the vitamin case. In addition the Group has given DSM certain indemnities in respect of any remedial actions at the sites of the VFC business that may be required by environmental laws. Further arrangements were put in place regarding the utilisation of certain assets and certain purchasing contracts, as well as adopting DSM as a preferred supplier for pharmaceutical ingredients. Under one of these arrangements, the Group has guaranteed to purchase for a period of four years beginning 1 January 2004 products with a sales value totalling 100 million euros. The Group will reimburse DSM for 75% of any unutilised amounts. The other arrangements consist of certain residual obligations, which have been fully accrued for. The profit from disposal for 2006 consists of a release of 5 million Swiss francs in respect of certain accruals and provisions that are no longer required. The business results for 2006 include costs of 4 million Swiss francs (2005: 9 million Swiss francs), due mostly to the after-tax amortisation of discounted liabilities.
12. Employee benefits
Employee remuneration in millions of CHF
2006 2005 Wages and salaries 7.632 6,739 Social security costs 891 827 Defined contribution post-employment plans 214 174 Operating expenses for defined benefit post-employment plans13 348 149 Equity compensation plans14 690 504 Other employee benefits 406 365 Employees’ remuneration included in operating results 10,181 8,758 Expected return on plan assets for defined benefit post-employment plans13 (636) (635) Interest cost for defined benefit post-employment plans13 571 603 Total employees’ remuneration 10,116 8,726
Page 448
59
Other employee benefits consist mainly of life insurance schemes and certain other insurance schemes providing medical coverage and other long-term and short-term disability benefits. The charges for employee benefits in the operating results are included in the relevant expenditure line by function. The expected return on plan assets and interest costs from defined benefit plans are included as part of financial income and financing costs, respectively (see Note 8).
13. Pensions and other post-employment benefits
The Group’s objective is to provide attractive and competitive post-employment benefits to employees, while at the same time ensuring that the various plans are appropriately financed and managing any potential impacts on the Group’s long-term financial position. Most employees are covered by pension plans sponsored by Group companies. The nature of such plans varies according to legal regulations, fiscal requirements and economic conditions of the countries in which the employees are employed. Other post-employment benefits consist mostly of post-retirement healthcare and life insurance schemes, principally in the United States. Post-employment benefit plans are classified for IFRS as ‘defined contribution plans’ if the Group pays fixed contributions into a separate fund or to a third-party financial institution and will have no further legal or constructive obligation to pay further contributions. All other plans are classified as ‘defined benefit plans’, even if the Group’s potential obligation is relatively minor or has a relatively remote possibility of arising. Consequently most of the Group’s post-employment benefit plans are classified as ‘defined benefit plans’ for the purpose of these financial statements.
Defined contribution plans
Defined contribution plans typically consist of payments by employees and by the Group to funds administered by third parties. Payments by the Group were 214 million Swiss francs (2005: 174 million Swiss francs). No assets or liabilities are recognised in the Group’s balance sheet in respect of such plans, apart from regular prepayments and accruals of the contributions withheld from employees’ wages and salaries and of the Group’s contributions.
Defined benefit plans
The Group’s major defined benefit plans are located in Switzerland, the United States, Germany, the United Kingdom and Japan. Plans are usually established as trusts independent of the Group and are funded by payments from the Group and by employees. In some cases, notably for the major defined benefit plans in Germany, the plan is unfunded and the Group pays pensions to retired employees directly from its own financial resources.
Current and past service costs are charged to the appropriate income statement heading within the operating results. Pension plan administration and funding is overseen at a corporate level, and any settlement gains and losses resulting from changes in funding arrangements are reported as general and administration expenses within the Corporate business segment. The expected returns on plan assets and interest costs are charged to financial income and financing costs, respectively. Actuarial gains and losses are recorded directly in equity. The recognition of pension assets is limited to the total of the present value of any future refunds from the plans or reductions in future contributions to the plans and any cumulative unrecognised past service costs. Adjustments arising from the limit on the recognition of assets for defined benefit plans are recorded directly in equity.
Page 449
60
Defined benefit plans: expenses in millions of CHF
Pension plans
Other post employment
benefit plans
2006
Total
Pension plans
Other post- employment benefit plans
2005
Total Current service cost 334 18 352 291 15 306 Past service cost (3) - (3) (15) - (15) (Gain) loss on curtailment
- - - (15) - (15)
(Gain) loss on settlement (1) - (1) (127) - (127) Total operating expenses 330 18 348 134 15 149 Expected return on plan assets
(606) (30) (636) (605) (30) (635)
Interest cost 522 49 571 556 47 603 Total financial (income) expense
(84) 19 (65) (49) 17 (32)
Total expense recognisedin income statement
246 37 283 85 32 117
The funding of the Group’s various defined benefit plans is overseen at a corporate level. Qualified independent actuaries carry out valuations on a regular basis and for major plans annually as at the balance sheet date. For funded plans, which are usually trusts independent of the Group’s finances, the net asset/liability recognised on the Group’s balance sheet corresponds to the over/under funding of the plan, adjusted for unrecognised past service costs. For unfunded plans, where the Group meets the pension obligations directly from its own financial resources, a liability for the defined benefit obligation is recorded in the Group’s balance sheet. Pension assets and liabilities in different defined benefit plans are not offset unless the Group has a legally enforceable right to use the surplus in one plan to settle obligations in the other plan. The recognition of pension assets is limited to the present value of any future refunds from the plans or reductions in future contributions to the plans and any cumulative unrecognised past service costs. Amounts recognised in the balance sheet for post-employment benefits are predominantly non-current and are reported in non-current assets and liabilities.
Defined benefit plans: funding status at 31 December in millions of CHF 2006 2005 Funded
plans Unfunded
plans Total Funded
plans Unfunded
plans Total Fair value of plan assets 11,632 - 11,632 10,858 - 10,858 Defined benefit obligation (11,002) (3,596) (14,598) (10,976) (3,630) (14,606) Over (under) funding 630 (3,596) (2,966) (118) (3,630) (3,748) Unrecognised past service costs
(28) (28) (35) (35)
Limit on asset recognition (396) - (396) - - Reimbursement rights 95 21 116 100 22 122 Net recognised asset (liability) 301 (3,575) (3,274) (53) (3,608) (3,661) Reported as - Post-employment benefit assets
831 - 831 625 - 625
- Post-employment benefit liabilities
(625) (3,596) (4,221) (778) (3,630) (4,408)
- Reimbursement rights 95 21 116 100 22 122 Net recognised asset (liability) 301 (3,575) (3,274) (53) (3,608) (3,661)
Further detailed information on plan assets and the defined benefit obligation is given below.
60
Page 450
61
Defined benefit plans: fair value of plan assets in millions of CHF 2006 2005 At 1 January 10,858 9,922 Expected return on plan assets 636 635 Actuarial gains (losses) 626 547 Currency translation effects and other (248) 502 Employer contributions 212 182 Employee contributions 42 40 Benefits paid - funded plans (480) (511) Past service cost - - Business combinations - - Curtailments - - Settlements (14) (459) At 31 December 11,632 10,858 Invested as - Shares and other equity instruments 5,819 4,768 - Bonds, debentures and other debt instruments 4,405 4,920 - Property 478 559 - Other assets 930 611 Total 11,632 10,858
Included within the fair value of plan assets are 311 thousand of the Group's non-voting equity securities with a fair value of 68 million Swiss francs (2005: 200 thousand non-voting equity securities and written call options with a total fair value of 36 million Swiss francs).
Defined benefit plans: defined benefit obligation in millions of CHF
2005 2006
Pension plans
Other post-
employ-ment
benefit plans
Total
Pension plans
Other post-
Employ-ment
Benefit plans
Total At 1 January 13,540 1,066 14,606 12,180 784 12,964 Current service cost 334 18 352 291 15 306 Interest cost 522 49 571 556 47 603 Employee contributions 42 - 42 40 - 40 Actuarial (gains) losses (159) 24 (135) 1,091 8 1,099 Currency translation effects and other
(158) (76) (234) 570 251 821
Benefits paid - funded plans
(427) (53) (480) (483) (28) (511)
Benefits paid - unfunded plans
(109) (2) (111) (110) (11) (121)
Past service cost 2 - 2 4 - 4 Business combinations - - - - - - Curtailments - - - (15) - (15) Settlements (15) - (15) (584) - (584) At 31 December 13,572 1,026 14,598 13,540 1,066 14,606 Of which - Funded plans 10,258 744 11,002 10,172 804 10,976 - Unfunded plans 3,314 282 3,596 3,368 262 3,630
Part of the cost of certain of the Group's other post-employment plans are reimbursed through government programmes. The reimbursement rights are reported in other long-term assets (see Note 19) and totalled 116 million Swiss francs at 31 December 2006 (2005: 122 million Swiss francs). Movements in the reimbursement rights primarily consist of currency translation effects of 8 million Swiss francs.

Page 451
62
Actuarial assumptions
Actuarial assumptions are unbiased and mutually compatible estimates of variables that determine the ultimate cost of providing post-employment benefits. They are set on an annual basis by local management and actuaries and are subject to approval by corporate management and the Group's actuaries. Actuarial assumptions consist of demographic assumptions on matters such as mortality and employee turnover, and financial assumptions on matters such as salary and benefit levels, interest rates, return on investments and costs of medical benefits. The Group operates defined benefit plans in many countries and the actuarial assumptions vary based upon local economic and social conditions.
Demographic assumptions: The most significant demographic assumptions relate to mortality rates. The Group's actuaries use mortality tables which take into account historic patterns and expected changes, such as further increases in longevity. The mortality tables used for the major schemes are
• Germany: Heubeck tables 2005G
• Japan: National Census (No. 19 Life Table)
• Switzerland: Swiss BVG 2005
• United Kingdom: non-pensioners - PA92C25 rated down one year
• United Kingdom: pensioners - PA92C10 rated down one year
• United States: RP2000 projected to 2010
Rates of employee turnover, disability and early retirement are based on historical behaviour within Group companies.
Financial assumptions: These are based on market expectations for the period over which the obligations are to be settled. The ranges of assumptions used in the actuarial valuations of the most significant plans, which are in countries with stable currencies and interest rates, are shown below.
Defined benefit plans: financial actuarial assumptions
Weighted average
2006 Range
Weighted average
2005 Range
Discount rates 4.30% 2%-9% 3.74% 2%-9% Expected rates of return on plan assets 5.82% 1%-9% 6.10% 2%-10% Expected rates of salary increases 3.60% 2%-6% 2.94% 2%-9% Medical cost trend rate 8.16% 7%-9% 7.20% 7%-10%
Discount rates, which are used to calculate the discounted present value of the defined benefit obligation, are determined with reference to market yields on high quality corporate bonds, or government bonds in countries where there is not a deep market in corporate bonds. The currency and term of the bonds is consistent with the obligation being discounted. The interest cost included in the income statement is calculated by multiplying the discount rate by the defined benefit obligation.
Expected returns on plan assets are based on market expectations of expected returns on the assets in funded plans over the duration of the related obligation. This takes into account the split of the plan assets between equities, bonds, property and other investments. The calculation includes assumptions concerning expected dividend and interest income, realised and unrealised gains on plan assets and taxes and administration costs borne by the plan. These are based on long-term market expectations and the actual performance is continually monitored by corporate management. Due to the long-term nature of the obligations, the assumptions used for matters such as returns on investments may not necessarily be consistent with recent historical patterns. The expected return on plan assets included in the income statement is calculated by multiplying the expected rate of return by the fair value of plan assets. The difference between the expected return and the actual return in any twelve month period is an actuarial gain/loss and is recorded directly to equity. The actual return on plan assets was 1,262 million Swiss francs (2005: 1,181 million Swiss francs).
Expected rates of salary increases, which are used to calculate the defined benefit obligation and the current service cost included in the income statement, are based on the latest expectation and historical behaviour within Group companies.
Page 452
63
Medical cost trend rates are used to calculate the defined benefit obligation and the current service cost included in the income statement of post-employment medical plans. These take into account the benefits set out in the plan terms and expected future changes in medical costs. Since the Group's major post-employment medical plans are for US employees, these rates are driven by developments in the United States. The effect of one percentage point increase or decrease in the medical cost trend rate is shown below.
Defined benefit plans: sensitivity of medical cost trend rate in millions of CHF
+1%
2006 -1%
+1%
2005 -1%
Current service cost and interest cost 10 (7) 9 (8) Expected rates of return on plan assets 125 (99) 132 (106)
Defined benefit plans: summary of funding status in millions of CHF
2006 2005 2004 2003 2002 Funded plans - Fair value of plan assets 11,632 10,858 9,922 9,490 8,751 - Defined benefit obligation (11,002) (10,976) (10,233) (9,785) (9,337) - Over (under) funding 630 (118) (311) (295) (586) Unfunded plans - Defined benefit obligation (3,596) (3,630) (2,731) (2,626) (2,420) Increase (decrease) in funding status arising from experience adjustments - Fair value of plan assets 626 547 13 472 (1,717) - Defined benefit obligation (249) 49 77 (46) (37) Increase (decrease) in funding status arising from changes in actuarial assumptions - Fair value of plan assets - - - - - Defined benefit obligation 384 (1,148) (636) (603) 304
Cash flows
The Group incurred cash flows from its defined benefit plans as shown in the table below.
Defined benefit plans: cash flows in millions of CHF 2006 2005 Employer contributions - funded plans (212) (182) Benefits paid - unfunded plans (111) (121) Total cash inflow (outflow) (323) (303)
Based on the most recent actuarial valuations, the Group expects that employer contributions for funded plans in 2007 will be approximately 210 million Swiss francs.
Amounts recorded in equity
The actuarial gains and losses recognised in the statement of recognised income and expense were gains of 761 million Swiss francs (2005: losses of 552 million Swiss francs). The cumulative amount at 31 December 2006 was gains of 209 million Swiss francs. (2005: losses of 552 million Swiss francs).
In addition the recognition of pension assets is limited to the total of the present value of any future refunds from the plans or reductions in future contributions to the plans and the cumulative unrecognised past service costs. Adjustments arising from this limit on asset recognition are recorded directly in equity. In 2006 this adjustment was 396 million Swiss francs (2005: zero).

Page 453
64
14. Employee stock options and other equity compensation benefits
The Group operates several equity compensation plans, including separate plans at Genentech and Chugai. Effective 1 January 2005 the Group adopted IFRS 2: 'Share-based Payment'. Amongst other matters, the standard requires that the fair value of all equity compensation plan awards granted to employees be estimated at grant date and recorded as an expense over the vesting period. The expense is charged against the appropriate income statement heading.
Expenses for equity compensation plans in millions o f CHF 2006 2005 Cost of sales 118 39 Marketing and distribution 149 113 Research and development 229 196 General and administration 194 156 Total operating expense 690 504 Share option plans Roche Option Plan 7 7 Genentech Stock Option Plan 468 266 Chugai Stock Acquisition Rights 1 1 Total share option plans 476 274 Other equity compensation plans Roche Connect 11 9 Genentech Employee Stock Purchase Progam 42 27 Roche Stock-settled Stock Appreciation Rights 76 43 Roche Performance Share Plan 15 11 Roche Stock Appreciation Rights 70 140 Total other equity compensation plans 214 230 Total operating expense 690 504 Of which - equity-settled 620 364 - cash-settled 70 140
Cash inflow (outflow) from equity compensation plans in millions of CHF 2006 2005 Share option plans Roche Option Plan 55 76 Genentech Stock Option Plan 361 929 Chugai Stock Acquisition Rights 1 1 Total share option plans 417 1,006 Other equity compensation plans Roche Connect (11) (9) Genentech Employee Stock Purchase Program 121 93 Roche Stock-settled Stock Appreciation Rights (47) - Roche Performance Share Plan - - Roche Stock Appreciation Rights (107) (91) Total other equity compensation plans (44) (7) Total cash inflow (outflow) 373 999 Of which - equity-settled 480 1,090 - cash-settled (107) (91)
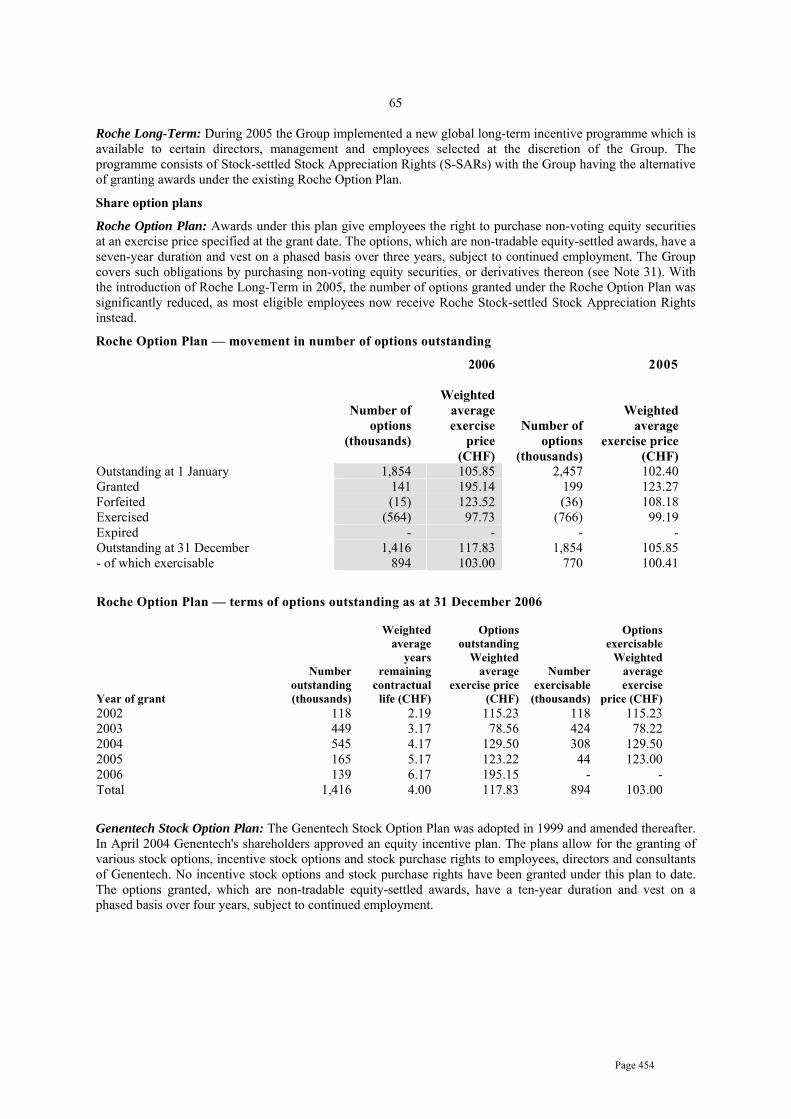
Page 454
65
Roche Long-Term: During 2005 the Group implemented a new global long-term incentive programme which is available to certain directors, management and employees selected at the discretion of the Group. The programme consists of Stock-settled Stock Appreciation Rights (S-SARs) with the Group having the alternative of granting awards under the existing Roche Option Plan.
Share option plans
Roche Option Plan: Awards under this plan give employees the right to purchase non-voting equity securities at an exercise price specified at the grant date. The options, which are non-tradable equity-settled awards, have a seven-year duration and vest on a phased basis over three years, subject to continued employment. The Group covers such obligations by purchasing non-voting equity securities, or derivatives thereon (see Note 31). With the introduction of Roche Long-Term in 2005, the number of options granted under the Roche Option Plan was significantly reduced, as most eligible employees now receive Roche Stock-settled Stock Appreciation Rights instead.
Roche Option Plan — movement in number of options outstanding
2006 2005
Number of
options (thousands)
Weighted
average exercise
price (CHF)
Number of options
(thousands)
Weighted average
exercise price (CHF)
Outstanding at 1 January 1,854 105.85 2,457 102.40 Granted 141 195.14 199 123.27 Forfeited (15) 123.52 (36) 108.18 Exercised (564) 97.73 (766) 99.19 Expired - - - - Outstanding at 31 December 1,416 117.83 1,854 105.85 - of which exercisable 894 103.00 770 100.41
Roche Option Plan — terms of options outstanding as at 31 December 2006 Year of grant
Number outstanding (thousands)
Weighted
average years
remaining contractual
life (CHF)
Options
outstanding Weighted
average exercise price
(CHF)
Number exercisable
(thousands)
Options
exercisable Weighted
average exercise
price (CHF) 2002 118 2.19 115.23 118 115.23 2003 449 3.17 78.56 424 78.22 2004 545 4.17 129.50 308 129.50 2005 165 5.17 123.22 44 123.00 2006 139 6.17 195.15 - - Total 1,416 4.00 117.83 894 103.00
Genentech Stock Option Plan: The Genentech Stock Option Plan was adopted in 1999 and amended thereafter. In April 2004 Genentech's shareholders approved an equity incentive plan. The plans allow for the granting of various stock options, incentive stock options and stock purchase rights to employees, directors and consultants of Genentech. No incentive stock options and stock purchase rights have been granted under this plan to date. The options granted, which are non-tradable equity-settled awards, have a ten-year duration and vest on a phased basis over four years, subject to continued employment.
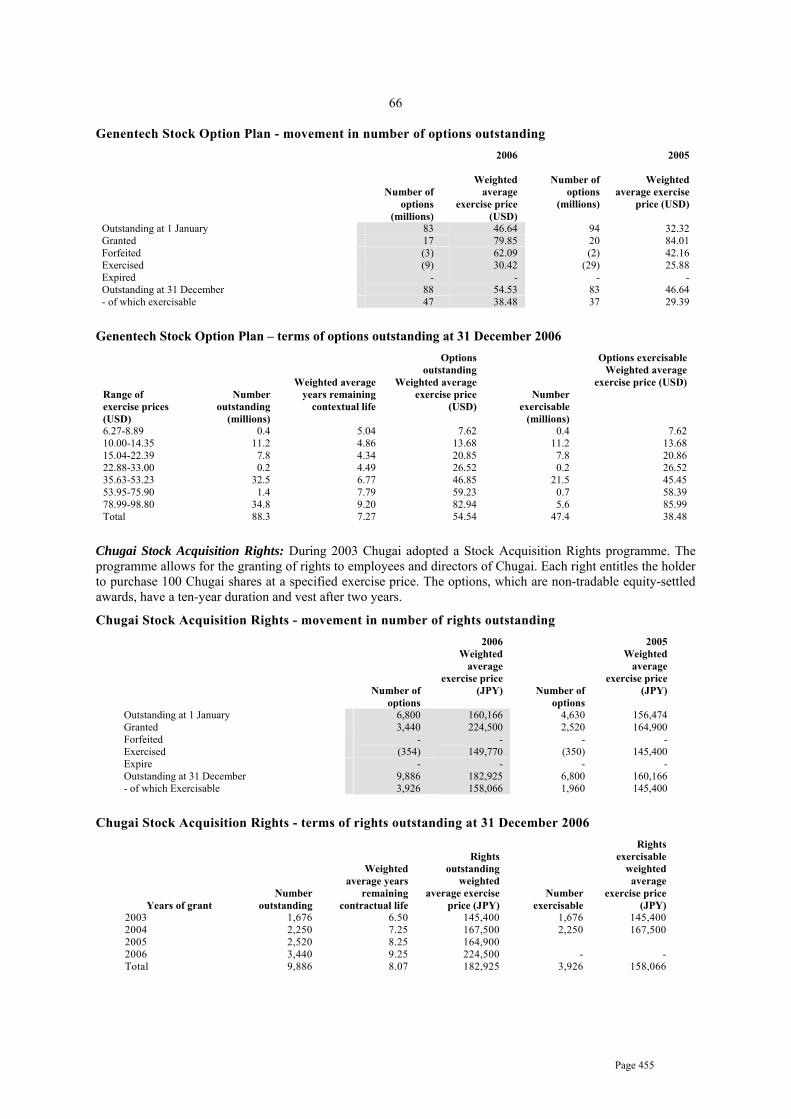
Page 455
66
Genentech Stock Option Plan - movement in number of options outstanding
Number of options
(millions)
2006
Weighted average
exercise price (USD)
Number of options
(millions)
2005
Weighted average exercise
price (USD)
Outstanding at 1 January 83 46.64 94 32.32 Granted 17 79.85 20 84.01 Forfeited (3) 62.09 (2) 42.16 Exercised (9) 30.42 (29) 25.88 Expired - - - - Outstanding at 31 December 88 54.53 83 46.64 - of which exercisable 47 38.48 37 29.39
Genentech Stock Option Plan – terms of options outstanding at 31 December 2006 Range of exercise prices (USD)
Number outstanding
(millions)
Weighted average years remaining
contextual life
Options outstanding
Weighted average exercise price
(USD)
Number exercisable
(millions)
Options exercisable Weighted average
exercise price (USD)
6.27-8.89 0.4 5.04 7.62 0.4 7.62 10.00-14.35 11.2 4.86 13.68 11.2 13.68 15.04-22.39 7.8 4.34 20.85 7.8 20.86 22.88-33.00 0.2 4.49 26.52 0.2 26.52 35.63-53.23 32.5 6.77 46.85 21.5 45.45 53.95-75.90 1.4 7.79 59.23 0.7 58.39 78.99-98.80 34.8 9.20 82.94 5.6 85.99 Total 88.3 7.27 54.54 47.4 38.48
Chugai Stock Acquisition Rights: During 2003 Chugai adopted a Stock Acquisition Rights programme. The programme allows for the granting of rights to employees and directors of Chugai. Each right entitles the holder to purchase 100 Chugai shares at a specified exercise price. The options, which are non-tradable equity-settled awards, have a ten-year duration and vest after two years.
Chugai Stock Acquisition Rights - movement in number of rights outstanding
Number of options
2006 Weighted
average exercise price
(JPY)
Number of options
2005 Weighted
average exercise price
(JPY)
Outstanding at 1 January 6,800 160,166 4,630 156,474 Granted 3,440 224,500 2,520 164,900 Forfeited Exercised
- (354)
- 149,770
- (350)
- 145,400
Expire Outstanding at 31 December
- 9,886
- 182,925
- 6,800
- 160,166
- of which Exercisable 3,926 158,066 1,960 145,400
Chugai Stock Acquisition Rights - terms of rights outstanding at 31 December 2006
Years of grant Number
outstanding
Weighted average years
remaining contractual life
Rights outstanding
weighted average exercise
price (JPY) Number
exercisable
Rights exercisable
weighted average
exercise price (JPY)
2003 1,676 6.50 145,400 1,676 145,400 2004 2,250 7.25 167,500 2,250 167,500 2005 2,520 8.25 164,900 2006 3,440 9.25 224,500 - - Total 9,886 8.07 182,925 3,926 158,066

Page 456
67
Issues of share options in 2006: Issues for share options in 2006, including the methodology used to calculate fair value and the main inputs to the valuation models are described below.
Issues of share option plans in 2006
Roche Option Plan Genentech Stock
Option Plan Chugai Stock
Acquisition Rights Number of options granted 141 thousand 17 million 3,440 Underlying equity Roche non-voting
equity securities Genentech common
stock Chugai shares in
blocks of 100 Currency Swiss francs US dollars Japanese yen Vesting period Progressively Progressively After 2 years over 3 years over 4 years Contractual life 7 years 10 years 10 years Weighted average fair value of options issued
36.47 24.16 691.36
Option pricing model used Binomial Binomial Binomial Inputs to option pricing model - share price at grant date 195.13 79.85 215,500 - exercise price 195.13 79.85 224,500 - expected volatility 25.60% 27.0% 28.5% - expected dividend yield 3.17% 0% 1.1% - early exercise factor 1.483 1.438 n/a - expected exit rate 10.66% 8.39% 0%
Volatility was determined by reference to historically observed prices of the underlying equity. Risk-free interest rates are derived from zero coupon swap rates at the grant date taken from Datastream. The early exercise factor describes the ratio between the expected market price at the exercise date and the exercise price at which early exercises can be expected, based on historically observed behaviour. For the Chugai grants in 2006 it was assumed that all awards would be held for the full term length, since there was insufficient historically observed early exercise behaviour.
Other equity compensation plans
Roche Connect: This programme enables all employees worldwide, except for those in the United States and certain other countries, to make regular deductions from their salaries to purchase non-voting equity securities. It is administered by independent third parties. The Group contributes to the programme, which allows the employees to purchase non-voting equity securities at a discount (usually 20%). The administrator purchases the necessary Genussscheine directly from the market. At 31 December 2006 the administrator held 911 thousand non-voting equity securities (2005: 713 thousand). The programme has been operational since 1 October 2002. During the year the cost of the plan was 11 million Swiss francs (2005: 9 million Swiss francs), which was reported within the relevant expenditure line by function.
Genentech Employee Stock Purchase Program (ESPP): Genentech has an employee stock purchase programme that allows employees to purchase Genentech's common stock at 85% of the lower of market value at the grant date or purchase date. In 2006 a total of 1.9 million shares of Genentech common stock were purchased (2005: 1.9 million shares) resulting in a cash inflow of 121 million Swiss francs (2005: 93 million Swiss francs). During the year the cost of the plan was 42 million Swiss francs (2005: 27 million Swiss francs), which was reported within the relevant expenditure line by function.

Page 457
68
Roche Stock-settled Stock Appreciation Rights: With the introduction of Roche Long-Term in 2005, the Group offers Stock-settled Stock Appreciation Rights (S-SARs) to certain directors, management and employees selected at the discretion of the Group. The S-SARs give employees the right to receive non-voting equity securities reflecting the value of any appreciation in the market price of the non-voting equity securities between the grant date and the exercise date. The options, which are non-tradable equity-settled awards, have a seven-year duration and vest on a phased basis over three years, subject to continued employment. The Group covers such obligations by purchasing non-voting equity securities, or derivatives thereon (see Note 31).
Roche S-SARs – movement in number of rights outstanding
2006 2005
Number of rights
(thousands)
Weighted average
exercise price (CHF)
Number of rights
(thousands)
Weighted average
exercise price (CHF)
Outstanding at 1 January 3,868 123.34 - - Granted 2,762 195.13 3,988 123.33 Forfeited (151) 149.44 (109) 123.00 Exercised (596) 126.35 (11) 123.00 Expired - - - - Outstanding at 31 December 5,883 156.07 3,868 123.34 - of which exercisable 900 126.49 20 123.00
Roche S-SARs – terms of rights outstanding at 31 December 2006
Year of grant
Number outstanding (thousands)
Weighted average years
remaining contractual
life
Rights outstanding
Weighted average
exercise price (CHF)
Number exercisable
(thousands)
Rights exercisable
Weighted average
exercise price (CHF)
2005 3,201 5.17 123.34 861 123.35 2006 2,682 6.17 195.14 39 195.00 Total 5,883 5.63 156.07 900 126.49
The weighted average fair value of the options granted in 2006 was calculated using a binomial model. The inputs to the model were consistent with those used for the Roche Option Plan 2006 awards given previously. The resulting weighted average fair value per right is CHF 36.45, giving a total fair value of 101 million Swiss francs which is charged over the vesting period of three years.
Roche Performance Share Plan: The Group offers future non-voting equity security awards (or at the Board's discretion, their cash equivalent) to certain directors and key senior managers. The programme was established at the beginning of 2002 and was in effect for three years.
During 2004 the Board approved a new three-year cycle of the Roche Performance Share Plan (PSP) to operate during 2005-2007. The amount of non-voting equity securities allocated will depend upon the individual's salary level, the achievement of performance targets linked to the Group's Total Shareholder Return (shares and nonvoting equity securities combined) relative to the Group's peers during the three-year period from the date of the grant, and the discretion of the Board of Directors. For the 2005-2007 cycle a total of 231 thousand awards have been made. These are non-tradable equity-settled awards. Each award will result in between zero and two nonvoting equity securities, depending upon the achievement of the performance targets, being allocated to the recipients in February 2008. The fair value per one unit of PSP from the 2005-2007 cycle is CHF 145.39, giving a total fair value of 34 million Swiss francs which is charged over the vesting period of three years.

Page 458
69
During 2005 the Board approved a further three-year cycle of the Roche Performance Share Plan (PSP) to operate during 2006-2008. The terms and conditions are similar to the 2005-2007 cycle. For the 2006-2008 cycle a total of 54 thousand awards have been made. These are non-tradable equity-settled awards. Each award will result in between zero and two non-voting equity securities, depending upon the achievement of the performance targets, being allocated to the recipients in February 2009. The weighted average fair value of the awards granted in 2006 was calculated using a Monte Carlo simulation. The input parameters to the model were the covariance matrix between Roche and the other individual companies of the peer group based on a three-year history and a risk-free rate of 1.93%. The valuation also takes into account the defined rank and performance structure which determines the payout of the PSP. The resulting value per one unit of PSP from the 2006-2008 cycle is CHF 210.06, giving a total fair value of 11 million Swiss francs which is charged over the vesting period of three years.
Roche Stock Appreciation Rights: Some employees of certain North American subsidiaries of the Group receive Stock Appreciation Rights (SARs) as part of their compensation. The SARs, which are non-tradable cash-settled awards, may be exercised after a vesting period of between one and three years for a cash payment, based upon the amount by which the market price of the Group's American Depositary Receipts (ADRs) at the point of exercise exceeds the strike price (grant price at issuance). Following the implementation of Roche Long-Term (see above}, the Group does not plan to award any further cash-settled SARs and no awards were made in 2005 or 2006.
Roche Stock Appreciation Rights in millions of CHF
2006 2005 Liability at 31 December 199 253 Intrinsic value of vested rights at 31 December 198 243
Roche Stock Appreciation Rights — terms of rights outstanding at 31 December 2006
Year of grant
Number gutstanding (thousands) Expiry
Rights outstanding weighted average
exercise price (USD)
Number exercisable (thousands)
Rights exercisable weighted average
exercise price (USD)
2001 264 2007 72.60 264 72.60 2002 411 2008 69.35 411 69.35 2003 879 2010 57.65 879 57.65 2004 1,997 2011 104.15 941 104.15 Total 3,551 86.27 2,495 78.70
The fair value at 31 December 2006 was calculated using a binomial model. The inputs to the model were the ADR price at 31 December 2006 (USD 89.45), the exercise prices given in the above table, and other inputs consistent with those used for the Roche Option Plan 2006 awards given previously.

Page 459
70
15. Property, Plant and Equipment
Property, Plant and Equipment: movements in carrying value of assets in millions of CHF
Land
Buildings and land improve-
ments
Machinery and
equipment
Construction in progress
Total
At 1 January 2005 Cost 992 7,548 10,943 1,436 20,919 Accumulated depreciation and impairment
- (2,425) (6,086) - (8,511)
Net book value 992 5,123 4,857 1,436 12,408 Year ended 31 December 2005 At 1 January 2005 992 5,123 4,857 1,436 12,408 GlycArt acquisition10 - - 3 - 3 Disposal of Consumer Health (OTC) business11
- (7) (18) (1) (26)
Additions 64 519 736 2,109 3,428 Disposals (18) (59) (223) (3) (303) Transfers 29 244 538 (811) - Depreciation charge - (242) (1,060) - (1,302) Impairment charge (4) (50) (12) - (66) Currency translation effects 79 424 287 165 955 At 31 December 2005 1,142 5,952 5,108 2,895 15,097 Cost 1,142 9,048 12,654 2,895 25,739 Accumulated depreciation and impairment
- (3,096) (7,546) - (10,642)
Net book value 1,142 5,952 5,108 2,895 15,097 Year ended 31 December 2006 At 1 January 2006 1,142 5,952 5,108 2,895 15,097 Additions 46 97 910 2,825 3,878 Disposals (14) (95) (120) (110) (339) Divestment of Genentech España (4) (71) (113) (4) (192) Transfers - 1,057 1,163 (2,220) - Depreciation charge - (272) (1,189) - (1,461) Impairment charge - (59) (12) - (71) Currency translation effects (44) (220) (118) (113) (495) At 31 December 2006 1,126 6,389 5,629 3,273 16,417 Cost 1,126 9,419 13,581 3,273 27,399 Accumulated depreciation and impairment
- (3,030) (7,952) - (10,982)
Net book value 1,126 6,389 5,629 3,273 16,417
Impairment charges arise from changes in the estimates of the future cash flows expected to result from the use of the asset and its eventual disposal. Factors such as changes in the planned use of buildings, machinery or equipment, or closure of facilities, the presence or absence of competition and technical obsolescence could result in shortened useful lives or impairment.
Leasing arrangements where the Group is the lessee
Finance leases: As at 31 December 2006 the capitalised cost of property, plant and equipment under finance leases was 182 million Swiss francs (2005: 199 million Swiss francs) and the net book value of these assets was 79 million Swiss francs (2005: 106 million Swiss francs).

Page 460
71
Finance leases: future minimum lease payments under non-cancellable leases in millions of CHF Future minimum lease
paymentsPresent value of future
minimum leae payments 2006 2005 2006 2005Within one year 12 13 11 12Between one and five years 8 19 8 19More than five years - - - -Total 20 32 19 31Future finance charges - - 1 1Total future minimum lease payments (undiscounted)
20 32 20 32
In addition to the above, Genentech leasing arrangements are disclosed in Note 4.
Operating leases: Group companies are party to a number of operating leases, mainly for plant and machinery, including motor vehicles, and for certain short-term property rentals. The arrangements do not impose any significant restrictions on the Group. Total operating lease rental expense was 371 million Swiss francs (2005: 337 million Swiss francs).
Operating leases: Future minimum lease payments under non-cancellable leases in millions of CHF
2006, 2005Within one year 190 148Between one and five years 310 223More than five years 227 118Total minimum payments 727 489
Leasing arrangements where the Group is the lessor
Finance Leases: Certain assets, mainly diagnostics instruments, are leased to third parties through finance lease arrangements. Such assets are reported as receivables at an amount equal to the net investment in the lease. Lease income from finance leases is recognised over the term of the lease based on the effective interest rate method.
Finance leases: future minimum lease payments under non-cancellable leases in millions of CHF
Gross investment in lease Present value of future minimum lease payments
2006 2005 2006 2005Within one year 39 42 32 41Between one and five years 53 76 45 57More than five years 1 3 1 2Total 93 121 78 100 Unearned finance income (7) (9) n/a n/aUnguaranteed residual value n/a n/a 8 12Net investment in lease 86 112 86 112
The accumulated allowance for uncollectible minimum lease payments was 0.4 million Swiss francs (2005: 3 million Swiss francs). There were no contingent rents recognised in income.
Operating leases: Certain assets, mainly some diagnostics instruments, are leased to third parties through operating lease arrangements. Such assets are reported within property, plant and equipment. Lease income from operating leases is recognised over the lease term on a straight line basis.

Page 461
72
Operating leases: future minimum lease payments under non-cancellable leases in millions of CHF
2006 2005Within one year 59 44Between one and five years 123 86More than five years 1Total minimum payments 182 131
At 31 December 2006, machinery and equipment with an original cost of 2,192 million Swiss francs (2005: 1,503 million Swiss francs) and a net book value of 832 million Swiss francs (2005: 601 million Swiss francs) was being leased to third parties. There was no contingent rent recognised as income.
Capital commitments
The Group has capital commitments for the purchase or construction of property, plant and equipment totalling 0.6 billion Swiss francs (2005: 0.7 billion Swiss francs). In addition, Genentech's capital commitments in respect of its manufacturing agreements with Lonza and its leasing arrangements are described in Note 4.
16 Goodwill
Goodwill: movements in carrying value of assets in millions of CHF 2006 2005
At 1 January 6,132 5,532GlycArt acquisition10 - 75Other acquisitions - 2Impairment charge - -Currency translation effects (218) 523At 31 December 5,914 6,132 Allocated to the following cash-generating units Pharmaceuticals Division - Roche Pharmaceuticals 75 75- Genentech 1,681 1,807- Chugai 113 123Total Pharmaceuticals Division 1,869 2,005 Diagnostics Division - Diabetes Care 768 769- Centralized Diagnostics 1,216 1,305- Molecular Diagnostics - -- Near Patient Testing 262 258- Applied Science - -- Corange/Boehringer Mannheim (held at divisional level and not allocated to business areas) 1,799 1,795Total Diagnostics Division 4,045 4,127 Total Group 5,914 6,132
There are no accumulated impairment losses in goodwill. The goodwill arising from investments in associated companies is classified as part of the investments in associated companies (see Note 18).
72

Page 462
73
Goodwill impairment testing
Pharmaceuticals Division: The division's reportable business segments are the cash-generating units used for the testing of goodwill. For Genentech and Chugai, the recoverable amount is based on fair value less costs to sell, determined with reference to the publicly quoted share prices of Genentech and Chugai shares. The goodwill in the Roche Pharmaceuticals business is not significant in comparison with the Group's total carrying amount of goodwill.
Diagnostics Division: The division's business areas are the cash-generating units used for the testing of goodwill. The goodwill arising from the Corange/Boehringer Mannheim acquisition is recorded and monitored at a divisional level as it cannot be meaningfully allocated to the division's business areas. Therefore the cash-generating unit for this goodwill is the entire division. The recoverable amount used in the impairment testing is based on value in use. The cash flow projections used are based on the most recent business plans approved by management. These assume no significant changes in the organisation of the division and include management's latest estimates on sales volume and pricing, and production and other operating costs. These reflect past experience and are projected over five years. The discount rate used is based on a rate of 7.5°/o, which is derived from a capital asset pricing model using data from Swiss capital markets, including Swiss Federal Government 10-year bonds and the SMI index. This is then adjusted to a pre-tax rate of 11.4%. Management believes that any reasonably possible change in any of the key assumptions would not cause the carrying value of goodwill to exceed the recoverable amount.
17. Intangible assets
Intangible assets: movements in carrying value of assets in millions of CHF Patents, licences, trademarks and other
intangible assets arising from: business
combinationsOther Total
At 1 January 2005 Cost 11,627 2,685 14,312Accumulated amortisation and impairment (6,721) (1,251) (7,972)Net book value 4,906 1,434 6,340Year ended 31 December 2005 At 1 January 2005 4,906 1,434 6,340GlycArt acquisition10 198 - 198Additions - 262 262Disposals - (2) (2)Amortisation charge (679) (332) (1,011)Impairment charge - - -Currency translation effects 350 119 469At 31 December 2005 4,775 1,481 6,256Cost 12,820 3,112 15,932Accumulated amortisation and impairment (8,045) (1,631) (9,676)Net book value 4,775 1,481 6,256

Page 463
74
Patents, licences, trademarks and other
intangible assets arising from Year ended 31 December 2006 business
combinationsOther Total
At 1 January 2006 4,775 1,481 6,256Additions - 593 593Disposals (1) - (1)Amortisation charge (642) (335) (977)Impairment charge (173) (24) (197)Currency translation effects (144) (61) (205)At 31 December 2006 3,815 1,654 5,469 Cost 11,708 3,425 15,133Accumulated amortisation and impairment (7,893) (1,771) (9,664)Net book value 3,815 1,654 5,469
2006 2005Allocated to the following business segments - Roche Pharmaceuticals 1,379 1,428- Genentech 738 789- Chugai 519 637- Diagnostics 2,833 3,402Total Group 5,469 6,256
Included in the Roche Pharmaceuticals business segment are intangible assets with a carrying value of 393 million Swiss francs and a remaining amortisation period of 1-2 years that relate to the purchase by the Group of the global rights to Kytril (granisetron). The Diagnostics business segment includes intangible assets with a carrying value of 1,744 million Swiss francs and a remaining amortisation period of 11 years that relate to the acquisition of Corange/Boehringer Mannheim and intangible assets with a carrying value of 567 million Swiss francs and a remaining amortisation period of 10 years that relate to the acquisition of Igen. Intangible assets that are not yet available for use, which mostly arise from the Group's in-licensing arrangements, total 778 million Swiss francs. Of this total, 632 million Swiss francs relate to the Roche Pharmaceuticals business segment. The Group currently has no internally generated intangible assets from development as the criteria for the recognition as an asset are not met. Impairment charges arise from changes in the estimates of the future cash flows expected to result from the use of the asset and its eventual disposal. Factors such as the presence or absence of competition, technical obsolescence or lower than anticipated sales for products with capitalised rights could result in shortened useful lives or impairment.
In the second half of 2006 the Group recorded impairment charges of 184 million Swiss francs relating to intangible assets in the Diagnostics Division. These followed the regular updating of the division's business plans and technology assessments in the second half of 2006, which indicated anticipated recoverable amounts that were below the current carrying values for certain assets. These mainly concern certain of the intangible assets recorded following the Disetronic acquisition in 2003. These assets were written down to their recoverable amount, based on a value in use calculation using a discount rate of 10.0%. Additionally the remaining useful life of these assets was reassessed and has been reduced from 6.3 years to 3 years, effective 31 December 2006. Consequent to these matters, the Group expects that the 2007 amortisation charge for intangible assets in the Diagnostics Division will be approximately 20 million Swiss francs lower than it would otherwise have been.
In the Roche Pharmaceuticals business segment an impairment charge of 13 million Swiss francs was recorded in the second half of 2006, which relates to a decision to terminate development of one compound with an alliance partner. The asset concerned, which was not yet being amortised, was fully written-down by this charge.
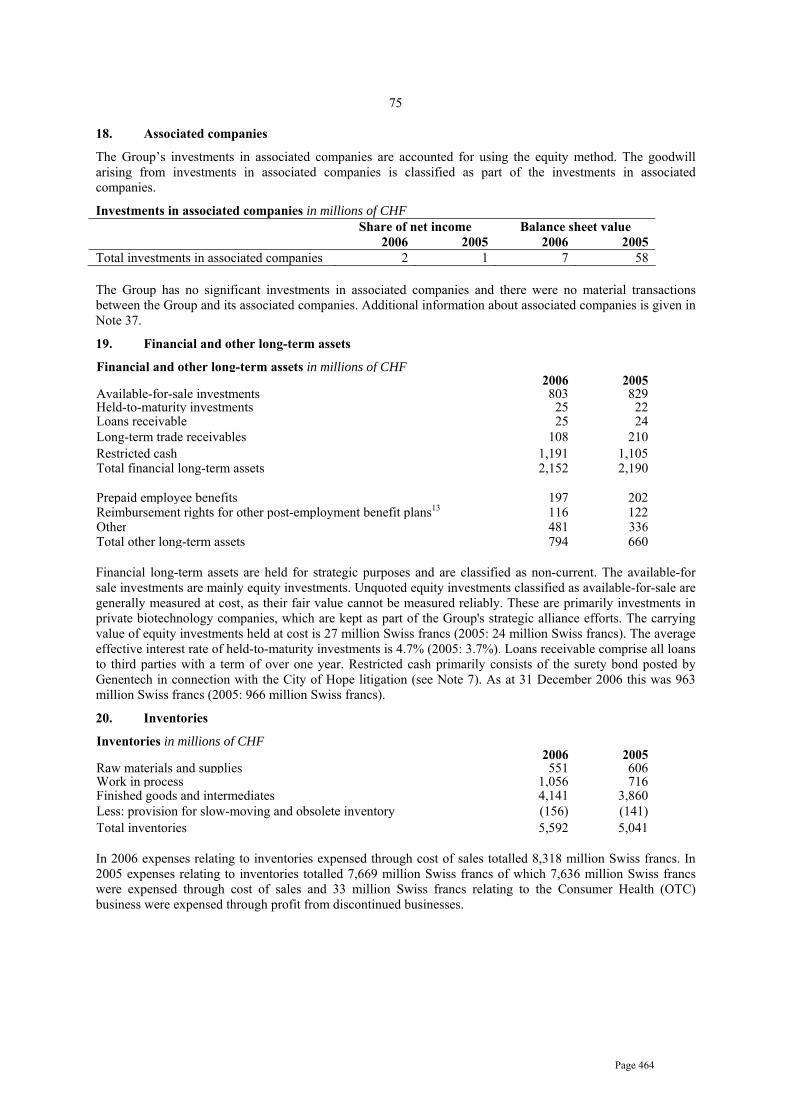
Page 464
75
18. Associated companies
The Group’s investments in associated companies are accounted for using the equity method. The goodwill arising from investments in associated companies is classified as part of the investments in associated companies.
Investments in associated companies in millions of CHF Share of net income Balance sheet value 2006 2005 2006 2005 Total investments in associated companies 2 1 7 58
The Group has no significant investments in associated companies and there were no material transactions between the Group and its associated companies. Additional information about associated companies is given in Note 37.
19. Financial and other long-term assets
Financial and other long-term assets in millions of CHF 2006 2005Available-for-sale investments 803 829Held-to-maturity investments 25 22Loans receivable 25 24Long-term trade receivables 108 210Restricted cash 1,191 1,105Total financial long-term assets 2,152 2,190 Prepaid employee benefits 197 202Reimbursement rights for other post-employment benefit plans13 116 122Other 481 336Total other long-term assets 794 660
Financial long-term assets are held for strategic purposes and are classified as non-current. The available-for sale investments are mainly equity investments. Unquoted equity investments classified as available-for-sale are generally measured at cost, as their fair value cannot be measured reliably. These are primarily investments in private biotechnology companies, which are kept as part of the Group's strategic alliance efforts. The carrying value of equity investments held at cost is 27 million Swiss francs (2005: 24 million Swiss francs). The average effective interest rate of held-to-maturity investments is 4.7% (2005: 3.7%). Loans receivable comprise all loans to third parties with a term of over one year. Restricted cash primarily consists of the surety bond posted by Genentech in connection with the City of Hope litigation (see Note 7). As at 31 December 2006 this was 963 million Swiss francs (2005: 966 million Swiss francs).
20. Inventories
Inventories in millions of CHF 2006 2005Raw materials and supplies 551 606Work in process 1,056 716Finished goods and intermediates 4,141 3,860Less: provision for slow-moving and obsolete inventory (156) (141)Total inventories 5,592 5,041
In 2006 expenses relating to inventories expensed through cost of sales totalled 8,318 million Swiss francs. In 2005 expenses relating to inventories totalled 7,669 million Swiss francs of which 7,636 million Swiss francs were expensed through cost of sales and 33 million Swiss francs relating to the Consumer Health (OTC) business were expensed through profit from discontinued businesses.

Page 465
76
21. Accounts receivable
Accounts receivable in millions of CHF 2006 2005Trade accounts receivable 8,993 7,781Notes receivable 157 146Less: allowances (190) (229)Total accounts receivable 8,960 7,698
At 31 December 2006 accounts receivable include amounts denominated in US dollars equivalent to 2.8 billion Swiss francs (2005: 2.3 billion Swiss francs) and amounts denominated in euros equivalent to 3.5 billion Swiss francs (2005: 3.0 billion Swiss francs).
Following the recovery of previously provided amounts, the Group recorded net income from bad debts of 3 million Swiss francs. Net bad debt expense in 2005 was 8 million Swiss francs. Significant concentrations within trade receivables of counterparty credit risk are described in Note 2.
22. Other current assets
Other current assets in millions of CHF 2006 2005Accrued interest income 36 84Prepaid expenses 343 291Derivative financial instruments27 80 197Restricted cash - -Other receivables 1,295 1,131Total other current assets 1,754 1,703
23. Marketable securities
Marketable securities in millions of CHF 2006 2005Financial assets at fair-value-through-profit-or-loss Held-for-trading investments - bonds and debentures 783 802Designated as fair-value-through-profit-or-loss- bonds and debentures 82 78- other investments 62 -Total financial assets at fair-value-through-profit-or-loss 927 880 Available-for-sale financial assets - shares 876 828- bonds and debentures 6,533 4,274- money market instruments and time accounts over three months 12,785 10,675Total available-for-sale financial assets 20,194 15,777 Total marketable securities 21,121 16,657
Marketable securities are held for fund management purposes and are classified as current. They are primarily denominated in Swiss francs, euros, US dollars and pounds sterling. Other investments held for strategic purposes are classified as non-current (see Note 19).
Shares: These consist primarily of readily saleable equity securities.
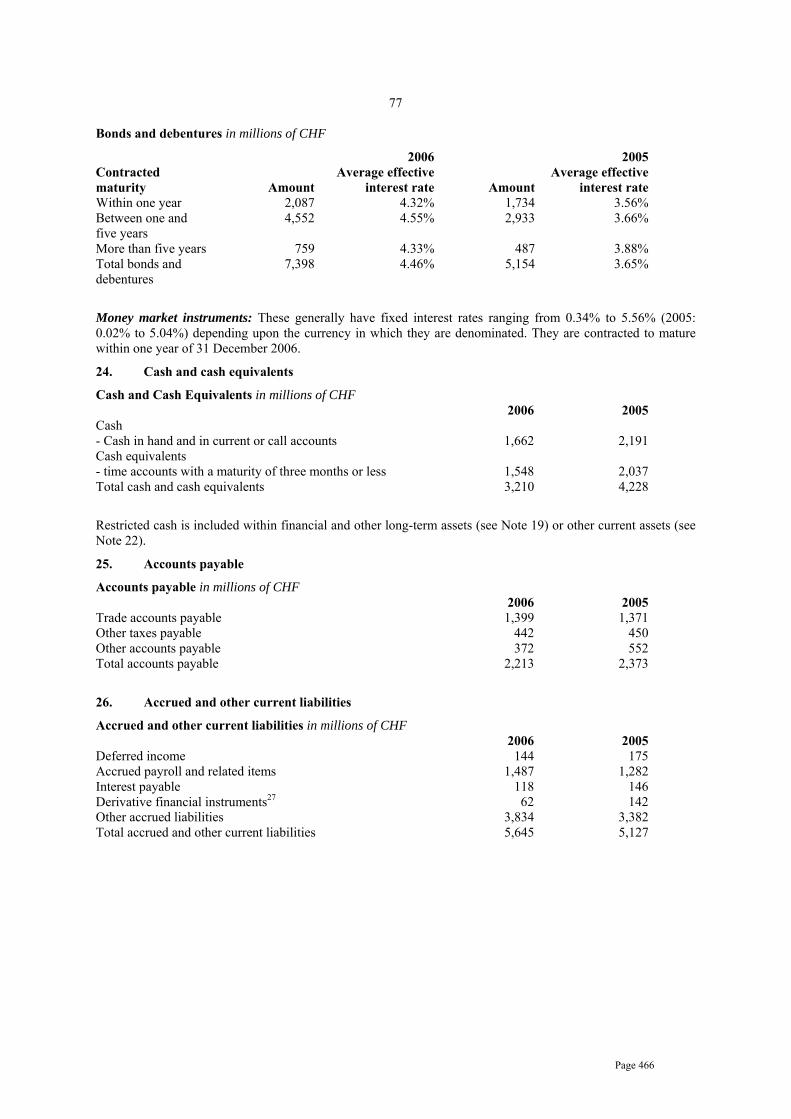
Page 466
77
Bonds and debentures in millions of CHF
Contracted maturity Amount
2006Average effective
interest rate Amount
2005 Average effective
interest rate Within one year 2,087 4.32% 1,734 3.56% Between one and five years
4,552 4.55% 2,933 3.66%
More than five years 759 4.33% 487 3.88% Total bonds and debentures
7,398 4.46% 5,154 3.65%
Money market instruments: These generally have fixed interest rates ranging from 0.34% to 5.56% (2005: 0.02% to 5.04%) depending upon the currency in which they are denominated. They are contracted to mature within one year of 31 December 2006.
24. Cash and cash equivalents
Cash and Cash Equivalents in millions of CHF 2006 2005 Cash - Cash in hand and in current or call accounts 1,662 2,191 Cash equivalents - time accounts with a maturity of three months or less 1,548 2,037 Total cash and cash equivalents 3,210 4,228
Restricted cash is included within financial and other long-term assets (see Note 19) or other current assets (see Note 22).
25. Accounts payable
Accounts payable in millions of CHF 2006 2005 Trade accounts payable 1,399 1,371 Other taxes payable 442 450 Other accounts payable 372 552 Total accounts payable 2,213 2,373
26. Accrued and other current liabilities
Accrued and other current liabilities in millions of CHF 2006 2005 Deferred income 144 175 Accrued payroll and related items 1,487 1,282 Interest payable 118 146 Derivative financial instruments27 62 142 Other accrued liabilities 3,834 3,382 Total accrued and other current liabilities 5,645 5,127

Page 467
78
27. Derivative financial instruments
In appropriate circumstances the Group uses derivative financial instruments as part of its risk management and trading strategies. This is discussed in Note 2. Derivative financial instruments are carried at fair value. The methods used for determining fair value are described in Note 1.
Derivative financial instruments in millions of CHF
2006 Assets
2005 2006 Liabilities
2005 Foreign currency derivatives - forward exchange contracts and swaps 9 24 (42) (95) - other 2 57 (5) (1) Interest rate derivatives - swaps 1 5 (13) (26) - other - - (1) - Other derivatives 68 111 (1) (20) Total derivative financial instruments22, 26 80 197 (62) (142)
Hedge accounting
The Group’s accounting policy on hedge accounting, which is described in Note 1, requires that to qualify for hedge accounting the hedging relationship must meet several strict conditions on documentation, probability of occurrence, hedge effectiveness and reliability of measurement.
As described in Note 2, the Group has financial risk management policies for foreign exchange risk, interest rate risk, market risk, credit risk and liquidity risk. When deemed appropriate, certain of the above risks are managed through the use of derivatives. While many of these transactions can be considered as hedges in economic terms, if the required conditions are not met, then the relationship does not qualify for hedge accounting. In this case the hedging instrument and the hedged item are reported independently as if there were no hedging relationship, which means that any derivatives are reported at fair value, with changes in fair value included in financial income.
The Group generally limits the use of hedge accounting to certain significant transactions. Consequently as at 31 December 2006 the Group has no fair value hedges, cash flow hedges or hedges of net investment in a foreign entity that meet the strict requirements to qualify for hedge accounting, apart from those described below.
Genentech has hedged some of its fixed-term debt instruments with interest rate swaps. As at 31 December 2006 such instruments, which have been designated and qualify as fair value hedges, are recorded in the balance sheet as a liability with a fair value of 13 million Swiss francs (2005: liability of 10 million Swiss francs).
Genentech has non-US dollar cash flows from future royalty income and development expenses expected over the next one to five years. To hedge part of this transaction exposure Genentech enters into derivative financial instruments such as options and forward contracts. Genentech has equity investments in various biotechnology companies that are subject to a greater risk of market fluctuation than the stock market in general. To manage part of this exposure Genentech enters into derivative financial instruments such as zero cost collars and forward contracts. As at 31 December 2006 such instruments, which are designated and qualify for hedge accounting, are recorded as assets with a fair value of 64 million Swiss francs and as liabilities with a fair value of 4 million Swiss francs (2005: assets of 153 million Swiss francs). These matters are also described in Genentech's annual report and quarterly SEC filings.
Movements on the fair value reserve for designated cash flow hedges are included in Note 31.

Page 468
79
28. Provisions and contingent liabilities
Provisions: movements in recognised liabilities in millions of CHF
Environmental and legal
provisions Restructuring
provisions Other
provisions Total Year ended 31 December 2005 At 1 January 2005 1,198 348 360 1,906 Major legal cases2 - additional provisions created 356 - - 356 - utilised during the year (180) - - (180) Other provisions - additional provisions created 39 51 404 494 - unused amounts reversed (34) (12) (27) (73) - utilised during the year (16) (119) (294) (429) Unwinding of discount8 73 4 1 78 Currency translation effects 142 6 80 228 At 31 December 2005 1,578 278 524 2,380 Of which - current portion 418 126 289 833 - non-current portion 1,160 152 235 1,547 Total provisions 1,578 278 524 2,380
Year ended 31 December 2005 At 1 January 2006 1,578 278 524 2,380 Major legal cases7 - additional provisions created - - - - - utilised during the year (31) - - (31) Other provisions - additional provisions created 35 54 588 677 - unused amounts reversed (29) (62) (95) (186) - utilised during the year (13) (98) (331) (442) Unwinding of discount8 66 2 6 74 Currency translation effects (100) - (23) (123) At 31 December 2005 1,506 174 669 2,349 Of which - current portion 388 79 289 756 - non-current portion 1,118 95 380 1,593 Total provisions 1,506 174 669 2,349 Expected outflow of resources - within one year 388 79 289 756 - between one to two years 929 35 135 1,099 - between two to three years 67 20 74 161 - more than three years 122 40 171 333 Total provisions 1,506 174 669 2,349

Page 469
80
Environmental and legal provisions
These provisions include 186 million Swiss francs (2005: 212 million Swiss francs) for environmental matters and 1,320 million Swiss francs (2005: 1,366 million Swiss francs) for litigation, including major legal cases and the vitamin case.
Provisions for environmental matters include various separate environmental issues in a number of countries. Approximately half of these were pre-existing in companies acquired by the Group. By their nature the amounts and timing of any outflows are difficult to predict. The Group estimates that approximately half of the amount provided for may result in cash outflows over the next five years. Significant provisions are discounted by between 5% and 6%.
Legal provisions consist mainly of the major legal cases as described in Note 7. The amounts, timing and uncertainties of any outflows are discussed in those notes, as are the discount rates used. The remaining legal provisions, which account for less than 5% of the balance, consist of a number of other separate legal matters in various Group companies. The majority of any cash outflows are expected to occur within the next one to three years, although these are dependent on the development of the various litigations. These provisions are not discounted as the time value of money is not material in these matters.
Restructuring provisions
These arise from planned programmes that materially change the scope of business undertaken by the Group or the manner in which business is conducted. Such provisions include only the costs necessarily entailed by the restructuring which are not associated with the recurring activities of the Group. The remaining amounts are mostly in respect of obligations towards former employees arising from the Pharmaceuticals Division restructuring and other previous restructuring plans. The timings of these cash outflows are reasonably certain on a global basis and are shown in the table above. Significant provisions are discounted by 3%.
Other provisions
Other provisions consist mostly of claims arising from trade, sales returns, certain employee benefit obligations and various other provisions from Group companies that do not fit into the above categories. The timings of cash outflows are by their nature uncertain and the best estimates are shown in the table above. Significant provisions are discounted by between 4% and 6%.
Contingent liabilities
The operations and earnings of the Group continue, from time to time and in varying degrees, to be affected by political, legislative, fiscal and regulatory developments, including those relating to environmental protection, in the countries in which it operates. The industries in which the Group operates are also subject to other risks of various kinds. The nature and frequency of these developments and events, not all of which are covered by insurance, as well as their effect on future operations and earnings, are not predictable. See also Note 7 in respect of major legal cases.
The Group has entered into strategic alliances with various companies in order to gain access to potential new products or to utilise other companies to help develop the Group's own potential new products. Potential future payments may become due to certain collaboration partners achieving certain milestones as defined in the collaboration agreements. The Group's best estimate of future commitments for such payments is 334 million Swiss francs in 2007, 160 million Swiss francs in 2008 and 121 million Swiss francs in 2009.

Page 470
81
29. Other non-current liabilities
Other non-current liabilities in millions of CHF 2006 2005 Deferred income 163 183 Other long-term liabilities 422 623 Total other non-current liabilities 585 806
30. Debt
Debt: recognised liabilities in millions of CHF 2006 2005 Debt instruments 7,378 8,564 Amounts due to banks and other financial institutions 493 934 Genentech leasing obligations4 219 - Finance lease obligations15 19 31 Other borrowings 134 141 Total debt 8,243 9,670 Reported as - Long-term debt 6,199 9,322 - Short-term debt 2,044 348 Total debt 8,243 9,670
Debt: repayment terms in millions of CHF 2006 2005 Within one year 2,044 348 Between one and two years 2,207 2,526 Between two and three years 624 2,799 Between three and four years 600 690 Between four and five years 23 645 More than five years 2,745 2,662 Total debt 8,243 9,670
The 'LYONs V' zero coupon US dollar exchangeable notes (see below) are reflected as due the first year that the holders of the notes can request the Group to purchase the notes.
The fair value of the debt instruments is 7.7 billion Swiss francs (2005: 9.2 billion Swiss francs) and the fair value of total debt is 8.6 billion Swiss francs (2005: 10.3 billion Swiss francs). This is calculated based on the observable market prices of the debt instruments or the present value of the future cash flows on the instrument, discounted at a market rate of interest for instruments with similar credit status, cash flows and maturity periods.
There are no pledges on the Group's assets in connection with debt.
Amounts due to banks and other financial institutions
These amounts are denominated in various currencies, notably Canadian dollars, Swiss francs, South African rand and Brazilian real. The average interest rate was 6.1%. The average interest rate in 2005 was 3.0%, when the balance was primarily denominated in euros. Repayment dates are up to four years and 442 million Swiss francs (2005: 224 million Swiss francs) are due within one year.

Page 471
82 Debt instruments Recognised liabilities and effective interest rates of debt instruments in millions of CHF Effective
interest rate 2006 2005 European Medium Term Note programme 4% bonds due 9 October 2008, principal 750 million euros 4.16% 1,204 1,193 5.375% bonds due 29 August 2023, principal 250 million pounds sterling
5.46% 590 557
3.25% bonds due 2 October 2007, principal 750 million US dollars
3.28% 916 984
Swiss franc bonds ‘Rodeo’ 1.75% due 20 March 2008, principal 1 billion Swiss francs
3.00% 992 1,001
US dollar bonds ‘Chameleon’ 6.75% due 6 July 2009, principal 487 million US dollars
6.77% 618 681
Zero Coupon US dollar exchangeable notes ‘LYONs V’ due 25 July 2021, principal 869 million US dollars 4.14% 627 1,528 Genentech Senior Notes 4.40% Senior Notes due 15 July 2010, principal 500 million US dollars
4.53% 596 644
4.75% Senior Notes due 15 July 2015, principal 1 billion US dollars
4.87% 1,222 1,314
5.25% Senior Notes due 15 July 2035, principal 500 million US dollars
5.39% 611 657
Japanese yen convertible bonds issued by Chugai ‘Series 6 Chugai Pharmaceutical nsecured Convertible Bonds’ 1.05% due 30 September 2008, principal amount of 151 million Japanese yen (0.45 billion Japanese yen in 2005) 1.05%
2
5
Total debt instruments 7,378 8,564 Unamortised discount included in carrying value of debt instruments in millions of CHF 2006 2005 US Dollar Bonds - 1 Sterling Bonds 9 9 Zero Coupon US Dollar Exchangeable Notes 434 1,166 Total unamortised discount 443 1,176 Fair Value Option In 2005 the Group applied the Fair Value Option on three of its outstanding debt instruments on which the Group had been applying fair value hedge accounting in the past. These debt instruments are the 'European Medium Term Note programme' Euro bonds, the 'Chameleon' US dollar bonds and the 'Rodeo' Swiss franc bonds. The Fair Value Option treatment is based on the elimination of an accounting mismatch which had been recognised between the hedging swaps (reported at fair value) and the hedged bonds (reported at amortised cost). The difference between the carrying value and the principal amount for these debt instruments totals 14 million Swiss francs (2005: 68 million Swiss francs).
Issues of new debt instruments On 18 July 2005 Genentech completed a private placement of 2 billion US dollars aggregate principal amount of Senior Notes. The placement consisted of 500 million US dollars of 4.40% Senior Notes due 2010, 1 billion US dollars of 4.75% Senior Notes due 2015 and 500 million US dollars of 5.25% Senior Notes due 2035. The Senior Notes contain certain restrictive covenants on incurring property liens and entering into sale and leaseback transactions.
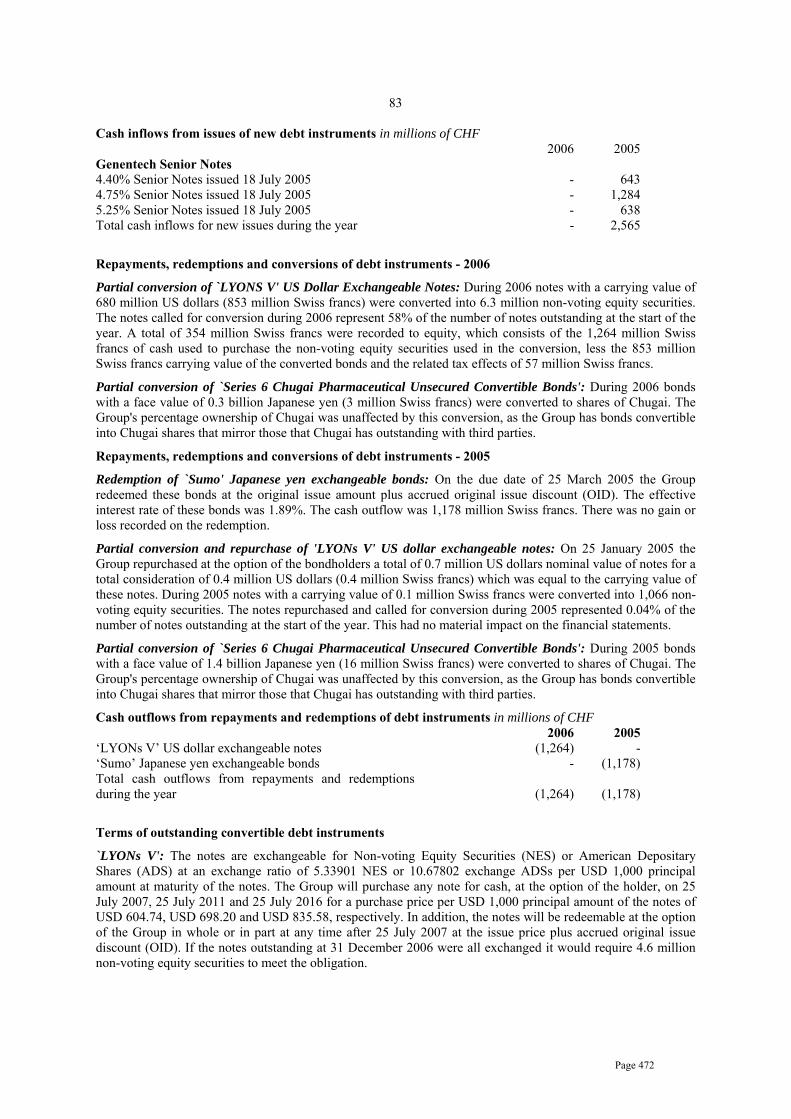
Page 472
83
Cash inflows from issues of new debt instruments in millions of CHF 2006 2005 Genentech Senior Notes 4.40% Senior Notes issued 18 July 2005 - 643 4.75% Senior Notes issued 18 July 2005 - 1,284 5.25% Senior Notes issued 18 July 2005 - 638 Total cash inflows for new issues during the year - 2,565
Repayments, redemptions and conversions of debt instruments - 2006
Partial conversion of `LYONS V' US Dollar Exchangeable Notes: During 2006 notes with a carrying value of 680 million US dollars (853 million Swiss francs) were converted into 6.3 million non-voting equity securities. The notes called for conversion during 2006 represent 58% of the number of notes outstanding at the start of the year. A total of 354 million Swiss francs were recorded to equity, which consists of the 1,264 million Swiss francs of cash used to purchase the non-voting equity securities used in the conversion, less the 853 million Swiss francs carrying value of the converted bonds and the related tax effects of 57 million Swiss francs.
Partial conversion of `Series 6 Chugai Pharmaceutical Unsecured Convertible Bonds': During 2006 bonds with a face value of 0.3 billion Japanese yen (3 million Swiss francs) were converted to shares of Chugai. The Group's percentage ownership of Chugai was unaffected by this conversion, as the Group has bonds convertible into Chugai shares that mirror those that Chugai has outstanding with third parties.
Repayments, redemptions and conversions of debt instruments - 2005
Redemption of `Sumo' Japanese yen exchangeable bonds: On the due date of 25 March 2005 the Group redeemed these bonds at the original issue amount plus accrued original issue discount (OID). The effective interest rate of these bonds was 1.89%. The cash outflow was 1,178 million Swiss francs. There was no gain or loss recorded on the redemption.
Partial conversion and repurchase of 'LYONs V' US dollar exchangeable notes: On 25 January 2005 the Group repurchased at the option of the bondholders a total of 0.7 million US dollars nominal value of notes for a total consideration of 0.4 million US dollars (0.4 million Swiss francs) which was equal to the carrying value of these notes. During 2005 notes with a carrying value of 0.1 million Swiss francs were converted into 1,066 non-voting equity securities. The notes repurchased and called for conversion during 2005 represented 0.04% of the number of notes outstanding at the start of the year. This had no material impact on the financial statements.
Partial conversion of `Series 6 Chugai Pharmaceutical Unsecured Convertible Bonds': During 2005 bonds with a face value of 1.4 billion Japanese yen (16 million Swiss francs) were converted to shares of Chugai. The Group's percentage ownership of Chugai was unaffected by this conversion, as the Group has bonds convertible into Chugai shares that mirror those that Chugai has outstanding with third parties.
Cash outflows from repayments and redemptions of debt instruments in millions of CHF 2006 2005 ‘LYONs V’ US dollar exchangeable notes (1,264) - ‘Sumo’ Japanese yen exchangeable bonds - (1,178) Total cash outflows from repayments and redemptions during the year
(1,264)
(1,178)
Terms of outstanding convertible debt instruments
`LYONs V': The notes are exchangeable for Non-voting Equity Securities (NES) or American Depositary Shares (ADS) at an exchange ratio of 5.33901 NES or 10.67802 exchange ADSs per USD 1,000 principal amount at maturity of the notes. The Group will purchase any note for cash, at the option of the holder, on 25 July 2007, 25 July 2011 and 25 July 2016 for a purchase price per USD 1,000 principal amount of the notes of USD 604.74, USD 698.20 and USD 835.58, respectively. In addition, the notes will be redeemable at the option of the Group in whole or in part at any time after 25 July 2007 at the issue price plus accrued original issue discount (OID). If the notes outstanding at 31 December 2006 were all exchanged it would require 4.6 million non-voting equity securities to meet the obligation.
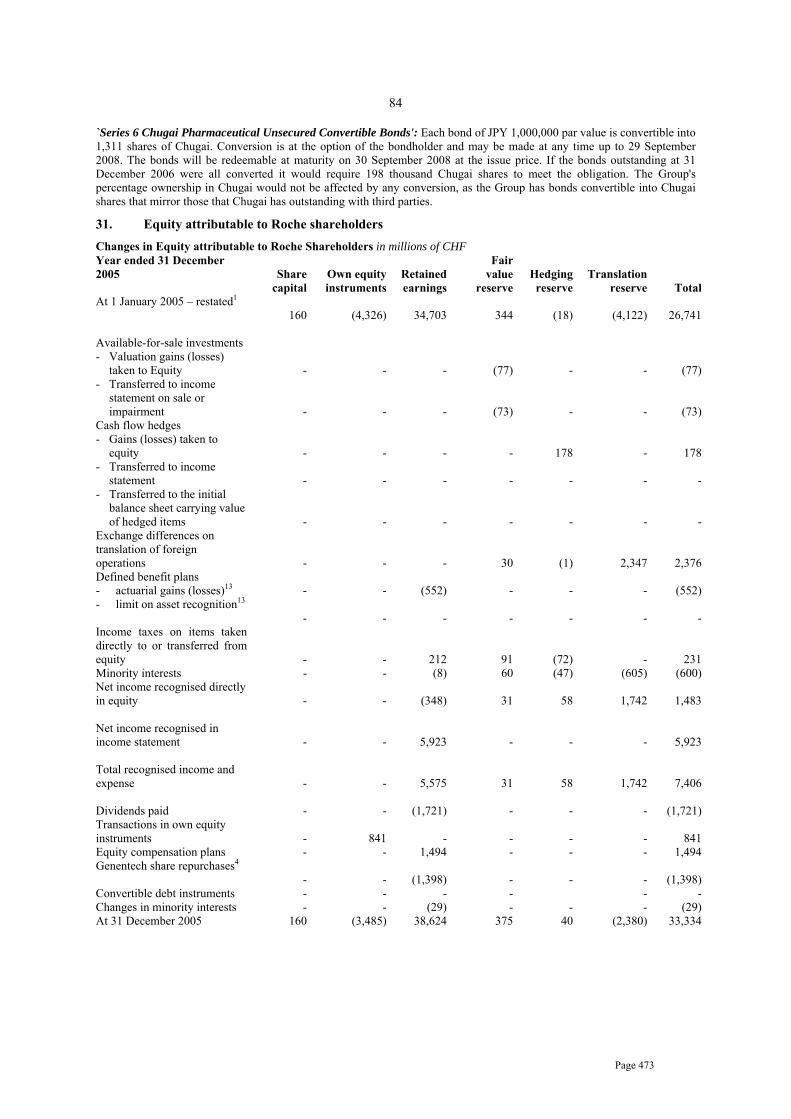
Page 473
84
`Series 6 Chugai Pharmaceutical Unsecured Convertible Bonds': Each bond of JPY 1,000,000 par value is convertible into 1,311 shares of Chugai. Conversion is at the option of the bondholder and may be made at any time up to 29 September 2008. The bonds will be redeemable at maturity on 30 September 2008 at the issue price. If the bonds outstanding at 31 December 2006 were all converted it would require 198 thousand Chugai shares to meet the obligation. The Group's percentage ownership in Chugai would not be affected by any conversion, as the Group has bonds convertible into Chugai shares that mirror those that Chugai has outstanding with third parties.
31. Equity attributable to Roche shareholders Changes in Equity attributable to Roche Shareholders in millions of CHF Year ended 31 December 2005 Share
capital Own equity instruments
Retained earnings
Fair value
reserve Hedging reserve
Translation reserve Total
At 1 January 2005 – restated1 160 (4,326) 34,703 344
(18)
(4,122) 26,741
Available-for-sale investments - Valuation gains (losses)
taken to Equity
- - - (77)
-
- (77) - Transferred to income
statement on sale or impairment
- - - (73)
-
- (73) Cash flow hedges - Gains (losses) taken to
equity
- - - -
178
- 178 - Transferred to income
statement
- - - -
-
- - - Transferred to the initial
balance sheet carrying value of hedged items
- - - -
-
- - Exchange differences on translation of foreign operations
- - - 30
(1)
2,347 2,376 Defined benefit plans - actuarial gains (losses)13 - - (552) - - - (552) - limit on asset recognition13
- - - -
-
- - Income taxes on items taken directly to or transferred from equity
- - 212 91
(72)
- 231 Minority interests - - (8) 60 (47) (605) (600) Net income recognised directly in equity
- - (348) 31
58
1,742 1,483
Net income recognised in income statement
- - 5,923 -
-
- 5,923
Total recognised income and expense
- - 5,575 31
58
1,742 7,406
Dividends paid - - (1,721) - - - (1,721) Transactions in own equity instruments
- 841 - -
-
- 841
Equity compensation plans - - 1,494 - - - 1,494 Genentech share repurchases4
- - (1,398) -
-
- (1,398) Convertible debt instruments - - - - - - Changes in minority interests - - (29) - - - (29) At 31 December 2005 160 (3,485) 38,624 375 40 (2,380) 33,334

Page 474
85
Year ended 31 December 2006
Share capital
Own equity instruments
Retained earnings
Fair value
reserve Hedging reserve
Translation reserve Total
At 1 January 2006
160 (3,485) 348,624 375
40
(2,380) 33,334
Available-for-sale investment - Valuation gains (losses)
taken to equity
- - - 292
-
- 292 - Transferred to income
statement on sale or impairment
- - - (184)
-
- (184) Cash flow hedges - Gains (losses) taken to
equity
- - - -
(71)
- (71) - Transferred to income
statement
- - - -
-
- - - Transferred to the initial
balance sheet carrying value of hedged items
- - -
-
- - Exchange differences on translation of foreign operations
- - - (17)
(1)
(1,469) (1,487) Defined benefit plans - Actuarial gains (losses)13
- - 761 -
-
- 761 - Limit on asset
recognition13
- - (396)
-
- (396) Income taxes on items taken directly to or transferred from equity
- - (149) (15)
29
- (135) Minority interests - - 2 8 18 510 538 Net income recognised directly in equity
- 218 84
(25)
(959) (682)
Net income recognised in income statement
- - 7,880 -
-
- 7,880
Total recognised income and expense
- - 8,098 84
(25)
(959) 7,198
Dividends paid - - (2,152) - - - (2,152) Transactions in own equity instruments
- 1,383 - -
-
- 1,383
Equity compensation plans - - 726 -
-
- 726
Genentech share repurchases4 - (696) - - - (696) Convertible debt instruments - - (354) - - - (354) Changes in minority interests - - 5 - - - 5 At 31 December 2005
160 (2,102) 44,251 459 15 (3,339) 39,444
Share capital As of 31 December 2006, the share capital of Roche Holding Ltd, which is the Group's parent company, consisted of 160,000,000 shares with a nominal value of 1.00 Swiss franc each, as in the preceding year. The shares are bearer shares and the Group does not maintain a register of shareholders. Based on information supplied to the Group, a shareholder group with pooled voting rights owns 50.0125%. (2005: 50.0125%) of the issued shares. This is further described in Note 34. Based on information supplied to the Group, Novartis International Ltd, Basel, and its affiliates own 33.3330% (participation below 33 1/3%) of the issued shares (2005: 33.3330%).

Page 475
86
Non-voting equity securities (Genussscheine)
As of 31 December 2006, 702,562,700 non-voting equity securities were in issue as in the preceding year. Under Swiss company law these non-voting equity securities have no nominal value, are not part of the share capital and cannot be issued against a contribution which would be shown as an asset in the balance sheet of Roche Holding Ltd. Each non-voting equity security confers the same rights as any of the shares to participate in the net profit and any remaining proceeds from liquidation following repayment of the nominal value of the shares and, if any, participation certificates. In accordance with the law and the Articles of Incorporation of Roche Holding Ltd, the Company is entitled at all times to exchange all or some of the non-voting equity securities into shares or participation certificates.
Dividends
On 27 February 2006 the shareholders approved the distribution of a dividend of CHF 2.50 per share and non-voting equity security (2005: CHF 2.00) in respect of the 2005 business year. The distribution to holders of outstanding shares and non-voting equity securities totalled 2,152 million Swiss francs (2005: 1,721 million Swiss francs) and has been recorded against retained earnings in 2005. The Board has proposed dividends for the 2006 business year of 3.40 Swiss francs per share and non-voting equity security. This is subject to approval at the Annual General Meeting on 5 March 2007.
Own equity instruments
Holdings of own equity instruments in equivalentnNumber of non-voting equity securities 31 December
2006(millions)
31 December 2005
(millions) Non-voting equity securities 0.2 - Low Exercise Price Options 6.8 14.3 Derivative instruments 8.2 7.2 Total own equity instruments 15.2 21.5
Own equity instruments are recorded within equity at original purchase cost. Details of own equity instruments held at 31 December 2006 are shown in the table below. Fair values are disclosed for information purposes.
Own equity instruments at 31 December 2006: supplementary information Equivalent number
of non-voting equity securities
(millions) Maturity Strike price
(CHF)
Market value (millions of
CHF) Non-voting equity securities
0.2 n/a n/a 45
Low exercise price options
6.8 24 Jan 2007 -30 Nov 2007
1.25-8.30 1,454
Derivative instruments 8.2 2 Feb 2009 -1 Feb 2013
123.00-195.00 699
Total 15.2 2,198
Non-voting equity securities and Low Exercise Price Options are mainly held for the potential conversion obligations that may arise from the Group's convertible debt instruments (see Note 30). The Group's potential obligations to employees for the Roche Option Plan and Roche Stock-settled Stock Appreciation Rights (see Note 14) are covered by call options that are exercisable at any time up to their maturity. The Group also holds a residual number of options that were purchased for use in the Group's previous option compensation scheme, which is now closed.
Following from the conversion in 2006 of 58% of the convertible debt instruments outstanding at the start of the year (see Note 30), the Group reduced its holdings in own equity instruments during the year. The net cash inflow from transactions in own equity instruments was 1,367 million Swiss francs (2005: net cash inflow of 779 million Swiss francs).
The Group holds none of its own shares.

Page 476
87
Reserves
Fair value reserve: The fair value reserve represents the cumulative net change in the fair value of available-for-sale financial assets until the asset is sold, impaired or otherwise disposed of.
Hedging reserve: The hedging reserve represents the effective portion of the cumulative net change in the fair value of cash flow hedging instruments related to hedged transactions that have not yet occurred.
Translation reserve: The translation reserve represents the cumulative currency translation differences relating to the consolidation of Group companies that use functional currencies other than Swiss francs.
32. Earnings per share and non-voting equity security
Basic earnings per share and non-voting equity security
For the calculation of basic earnings per share and non-voting equity securitiy, the number of shares and non-voting equity securities is reduced by the weighted average number of its own non-voting equity securities held by the Group during the period.
Basic earnings per share and non-voting equity security Continuing businesses Group 2006 2005 2006 2005 Net income (millions of CHF) 7,860 5,935 7,880 5,923 Number of shares (millions)31 160 160 160 160 Number of non-voting equity securities (millions)31 703 703 703 703 Weighted average number of own non-voting equity securities held (millions) (11) (18)
(11) (18)
Weighted average number of shares and non-voting equity securities in issue used to calculate basic earnings per share (millions) 852 845
852 845 Basic earnings per share and non-voting equity security(CHF) 9.22 7.02
9.24 7.01
Diluted earnings per share and non-voting equity security
For the calculation of diluted earnings per share and non-voting equity security, the net income and weighted average number of shares and non-voting equity securities outstanding are adjusted for the effects of all dilutive potential shares and non-voting equity securities.
Potential dilutive effects arise from the convertible debt instruments and the employee stock option plans. If the outstanding convertible debt instruments were to be converted then this would lead to a reduction in interest expense and an increase in the number of shares which may have a net dilutive effect on the earnings per share. The exercise of outstanding vested employee stock options would have a dilutive effect. The exercise of the outstanding vested Genentech employee stock options would have a dilutive effect if the net income of Genentech is positive. The diluted earnings per share and non-voting equity security reflects the potential impacts of these dilutive effects on the earnings per share figures.

Page 477
88
Diluted earnings per share and non-voting equity security
Continuing businesses Group 2006 2005 2006 2005 Net income (millions of CHF) 7,860 5,935 7,880 5,923 Elimination of interest expense, net of tax, of convertible debt instruments, where dilutive (millions of CHF) 25 43
25 43 Increase in minority share of Group net income, net of tax, assuming all outstanding Genentech stock options exercised (millions of CHF) (100) (58)
(100) (58) Net income used to calculate diluted earnings per share (millions of CHF) 7,785 5,920
7,805 5,908
Weighted average number of shares and non-voting equity securities in Issue (millions) 852 845
852 845
Adjustment for assumed conversion of convertible debt instruments, where dilutive (millions) 7 13
7 13
Adjustment for assumed exercise of equity compensation plans, where dilutive (millions) 3 2
3 2
Weighted average number of shares and non-voting equity securities in Issue used to calculate diluted earnings per share (millions) 862 860
862 860 Diluted earnings per share and non-voting equity security (CHF) 9.03 6.89
9.05 6.87
33. Minority interests
Changes in equity attributable to minority interests in millions of CHF 2006 2005 At 1 January – restated1 6,824 5,280 Net income recognised directly in equity (538) 600 Net income recognised in income statement - Genentech4 1,077 616 - Chugai5 202 318 - Other minority interests 12 9 Total net income recognised in income statement 1,291 943 Total recognised income and expense 753 1,543 Dividends paid to minority shareholders5 (105) (68) Equity compensation plans 450 1,131 Genentech share repurchases4 (552) (1,113) Convertible debt instruments 5 22 Changes in minority interests (5) 29 At 31 December 7,370 6,824 Of which - Genentech4 5,250 4,658 - Chugai5 2,088 2,139 - Other minority interests 32 27 Total minority interests 7,370 6,824

Page 478
89
34. Related parties
Controlling shareholders
The share capital of Roche Holding Ltd, which is the Group’s parent company, consists of 160,000,000 bearer shares. Based on information supplied by a shareholder group with pooled voting rights, comprising Ms Vera Michalski-Hoffmann, Ms Maja Hoffmann, Mr Andre Hoffmann, Dr Andreas Oeri, Ms Sabine Duschmale-Oeri, Ms Catherine Oeri, Ms Beatrice Oeri and Ms Maja Oeri, that group holds 80,020,000 shares as in the preceding year, which represents 50.0125% of the issued shares. This figure does not include any shares without pooled voting rights that are held outside this group by individual members of the group.
Mr André Hoffmann and Dr Andreas Oeri are members of the Board of Directors of Roche Holding Ltd and in this capacity each receive an annual remuneration of 300,000 Swiss francs. Since 28 February 2006, Mr Hoffmann is a Vice-Chairman of the Board, and in 2006 he received a further 83,333 Swiss francs in this capacity. Dr Oeri is Chairman of the Corporate Governance and Sustainability Committee and receives 10,000 Swiss francs for his time and expenses in this capacity.
There were no other transactions between the Group and the individual members of the above shareholder group.
Subsidiaries and associated companies
A listing of the major Group subsidiaries and associated companies is included in Note 37. Transactions between the parent company and its subsidiaries and between subsidiaries are eliminated on consolidation. There were no significant transactions between the Group and its associated companies.
Key management personnel
Members of the Board of Directors of Roche Holding Ltd receive an annual remuneration and payment for their time and expenses related to their membership of Board committees.
Remuneration of Members of the Board of Directors in 2006 in CHF
Annual remuneration
Compensation for Board committee
members Total Executive director F.B. Humer 300,000 - 300,000 Non-executive directors B. Gehrig 450,000 - 450,000 R. Hänggi (until 27 February 2006) 66,667 - 66,667 A. Hoffman 383,333 - 383,333 J.I. Bell 300,000 10,000 310,000 P. Brabeck-Letmathe 300,000 - 300,000 L.J.R. de Vink 300,000 10,000 310,000 W. Frey 300,000 20,000 320,000 D.A. Julius 300,000 10,000 310,000 A. Oeri 300,000 10,000 310,000 H. Teltschik 300,000 20,000 320,000 B. Weder di Mauro (from 28 February 2006) 250,000 20,000 270,000 Total non-executive directors 3,250,000 100,000 3,350,000 Total remuneration of Board of Directors 3,550,000 100,000 3,650,000

Page 479
90
Remuneration to Prof. Gehrig includes serving as Independent Lead Director and Vice-Chairman of the Board. Remuneration to Mr Hänggi includes serving as Vice-Chairman of the Board until 27 February 2006. Remuneration to Mr Hoffmann includes serving as Vice-Chairman of the Board from 28 February 2006. Remuneration of non-executive members of the Board of Directors in 2005 totalled 3 million Swiss francs.
Prof. Bell has been on a one-year sabbatical leave from the University of Oxford since August 2006 and is spending the year at Roche. Roche will pay all personal and family expenses that Prof. Bell incurs in relation to his stay in Switzerland, including insurance costs. In 2006 these expenses totalled 67,909 Swiss francs. In addition Roche paid 122,719 Swiss francs into a retirement policy for Prof. Bell in 2006. Prof. Teltschik received honoraria, including expenses, amounting to 25,132 euros (39,457 Swiss francs) for serving on the boards of several Roche subsidiaries in Germany. Otherwise, no additional remuneration was paid to members of the Board of Directors.
In 2005 in connection with the acquisition of GlycArt on 25 July 2005 (see Note 10), the Group paid Mr Hänggi 1,731,248 Swiss francs in consideration for his shareholding in GlycArt. This was equivalent to the amounts paid to other shareholders of GlycArt for the purchase of their shareholdings.
Members of the Corporate Executive Committee of Roche Holding Ltd receive remuneration, indirect benefits and participate in certain equity compensation plans.
Remuneration of members of the Executive Committee in 2006 in CHF Annual salary Bonus Expense allowance Total F.B. Humer 6,030,000 1,500,000 50,000 7,580,000 W.M. Burns 1,875,000 1,000,000 30,000 2,905,000 E. Hunziker 1,900,000 1,000,000 30,000 2,930,000 G.A. Keller 850,000 400,000 30,000 1,280,000 J.K.C. Knowles 1,325,000 670,000 30,000 2,025,000 S. Schwan 762,500 95,000 30,000 887,500 Total 12,742,500 4,665,000 200,000 17,607,500
The annual salary amount for Dr Humer includes the 300,000 Swiss francs that he receives in his capacity as a member of the Board of Directors as described above. Remuneration of members of the Executive Committee in 2005 totalled 17 million Swiss francs. Dr Humer, Dr Hunziker, Mr Burns and Prof. Knowles received in total 193,104 US dollars (241,380 Swiss francs) for serving on the Chugai Board. Dr Hunziker, Mr Burns and Prof. Knowles are also on the Genentech Board but have declined remuneration for serving in this capacity.
Mr H. von Prondzynski stepped down from the Executive Committee on 31 December 2005. During 2006 he assisted with the transition to his successor and he resigned from Roche effective 31 December 2006. In 2006 he was paid a salary of 1,300,000 Swiss francs. He received a bonus of 700,000 Swiss francs in respect of 2005 and an expense allowance of 30,000 Swiss francs.
Otherwise, no additional remuneration was paid to current or former members of the Corporate Executive Committee.
The Group pays social insurance contributions in respect of the above remuneration and pays contributions to pension and other post-employment benefits plans for members of the Executive Committee. Members of the Executive Committee may also participate in the Roche Connect employee stock purchase plan (see Note 14).

Page 480
91
Indirect benefits (employer contributions) of members of the Executive Committee in 2006 in CHF
Pensions Social
insurance Roche
Connect F.B. Humer 1,308,585 830,655 50,004 W.M. Burns 715,019 146,255 30,000 E. Hunziker 556,585 147,518 45,832 G.A. Keller 333,976 88,188 20,420 J.K.C. Knowles 886,153 101,815 22,500 S. Schwan 194,949 46,493 18,444 Total 3,995,267 1,360,924 187,200
Owing to amendments to Switzerland's Federal Occupational Old Age, Survivors' and Disability Pension Act (BVG), contributions on behalf of Dr Humer were limited to 1,308,585 Swiss francs. Due to the existing contractual obligations with Dr Humer an additional provision of 1,549,862 Swiss francs was recognised by the Group.
Pension, social insurance and Roche Connect contributions paid by the Group in 2005 totalled 8 million Swiss francs.
In addition in 2006 the Group paid employer contributions of 883,086 Swiss francs (pensions), 206,094 Swiss francs (social insurance) and 27,500 Swiss francs (Roche Connect) in respect of Mr von Prondzynski.
Roche Long-Term: As discussed in Note 14, during 2005 the Group implemented a new global long-term incentive programme which is available to certain directors, management and employees selected at the discretion of the Group. The programme consists of Stock-settled Stock Appreciation Rights (S-SARs) with the Group having the alternative of granting awards under the existing Roche Option Plan (ROP). During 2006 members of the Executive Committee were granted 151,725 S-SARs and no ROP awards (2005: 223,602 S-SARs and no ROP awards). The terms, vesting conditions and fair value of these awards are disclosed in Note 14.
Roche Performance Share Plan: As disclosed in Note 14, the Board approved a three-year cycle of the Roche Performance Share Plan to operate during 2005-2007 and a further three-year cycle to operate during 2006-2008. During 2006 members of the Executive Committee were targeted with 20,161 awards of the 2006-2008 cycle (2005: 91,195 awards from the 2005-2007 cycle). Each award will result in between zero and two non-voting-equity securities, depending upon the achievement of the performance targets, being allocated to the recipients in February 2009. The terms, vesting conditions and fair value of these awards are disclosed in Note 14.
Other transactions with members of the Executive Committee: Dr Keller had taken out a mortgage loan of 492,500 Swiss francs with the Pension Fund of F. Hoffmann-La Roche Ltd at an interest rate of 4.2% p.a. Dr Keller repaid this at the end of 2006. In 2006 the Group paid Dr Schwan 45,123 Swiss francs for one-time relocation and housing expenses. Pensions totalling 2,014,352 Swiss francs were paid to two former Executive Committee members.
Post-employment benefit plans
Transactions between the Group and the various post-employment defined benefit plans for the employees of the Group are described in Note 13.

Page 481
92
35. Cash flow statement
Cash flows from operating activities
Cash flows from operating activities arise from the Group's primary activities in the Pharmaceuticals and Diagnostics businesses. These are calculated by the indirect method by adjusting the Group's operating profit for any operating income and expenses that are not cash flows (for example depreciation, amortisation and impairment) in order to derive the cash generated from operations. This and other operating cash flows are shown in the cash flow statement. Operating cash flows also include income taxes paid on all activities, including, for example, the taxes paid on the income from bond conversion and redemption.
Cash generated from operations in millions of CHF 2006 2005 Net income 9,171 6,866 Add back non-operating (income) expense - Associated companies18 (2) (1) - Financial income8 (1,829) (1,313) - Financing costs8 974 985 - Income taxes9 3,436 2,284 - Discontinued businesses11 (20) 12 Operating profit 11,730 8,833 Depreciation of property, plant and equipment15 1,461 1,302 Amortisation of intangible assets17 977 1,011 Impairment of intangible assets17 197 - Impairment of property, plant and equipment15 71 66 Major legal cases7 - 356 Operating expenses for defined benefit post-employment plans13 348 149 Operating expenses for equity-settled equity compensation plans14 620 364 Other adjustments 571 445 Cash generated from continuing businesses 15,975 12,526 Operating cash flows generated from discontinued businesses11 - (5) Cash generated from operations 15,975 12,521
Cash Flows from investing sctivities
Cash flows from investing activities are principally those arising from the Group's investments in property, plant and equipment and intangible assets, and from the acquisition and divestment of subsidiaries, associated companies and businesses. Cash flows connected with the Group's portfolio of marketable securities and other investments are also included, as are any interest and dividend payments received in respect of these securities and investments. These cash flows indicate the Group's net reinvestment in its operating assets and the cash flow effects of business combinations and divestments, as well as the cash generated by the Group's other investments.
Interest and dividends received in millions of CHF 2006 2005 Interest received 836 373 Dividends received 10 10 Total 846 383
Cash flows from financing activities
Cash flows from financing activities are primarily the proceeds from the issue and repayment of the Group's equity and debt instruments. They also include interest payments and dividend payments on these instruments. Cash flows from short-term financing, including finance leases, are also included. These cash flows indicate the Group's transactions with the providers of its equity and debt financing. Cash flows from short-term borrowings are shown as a net movement, as these consist of a large number of transactions with short maturity.

Page 482
93 Interest and dividends paid in millions of CHF 2006 2005 Interest paid (343) (194) Dividends paid31, 33 (2,257) (1,789) Total (2,600) (1,983) Significant non-cash transactions
In 2006 additions to property, plant and equipment of 230 million Swiss francs were recorded from Genentech leasing arrangements (see Note 4) and there was a corresponding increase in long-term debt. There were no significant non-cash transactions in 2005.
36. Subsequent events
There were no significant events after the balance sheet date.
37. Subsidiaries and associated companies Listed companies Country Company City Share capital
(in mill.) Equity interest
(in %) Switzerland Roche Holding Ltd.
Stock Exchange: SWX Zurich Valor Share: 1203211 Valor Genussscheine: 1203204 ISIN Share: Ch0012032113 ISIN Genussscheine: CH0012032048Market Capitalisation: CHF 191,575.4 mill.
Basel CHF 160.0
Basilea Pharmaceutica Ltd Stock Exchange: SWX Bio Zurich NASDAQ Biotech Valor: 1143244 ISIN: CH0011432447 Market Capitalisation: CHF 1,658.3 mill.
Basel CHF 7.8 18.1
United States Genentech, Inc.
Stock Exchange: New York ISIN: US3687104063 Market Capitalisation: USD 85,418.4 mill.
South San Francisco (incorporated in Delaware)
USD 21.1 55.8
Japan Chugai Pharmaceutical Co. Ltd.
Stock Exchange: Tokyo ISIN: JP3519400000 Market Capitalisation: JPY 1,360,389.0 mill.
Tokyo JPY 80.0 50.6
Non-listed companies Argentina Productos Roche S.A. Química e
Industrial Buenos Aires ARS 83.0 100
Australia Roche Diagnostics Australia Pty. Limited
Castle Hill AUD 5.0 100
Roche Products Pty. Limited Dee Why AUD 65.0 100 Austria Roche Austria GmbH Vienna EUR 14.5 100 Roche Diagnostics GmbH Vienna EUR 1.5 100 Roche Diagnostics Graz GmbH Graz EUR 0.4 100 Belgium N.V. Roche S.A. Brussels EUR 32.0 100 Roche Diagnostics Belgium S.A. Brussels EUR 3.8 100 Bermuda Canadian Pharmholding Ltd. Hamilton USD (-) 100 Corange International Ltd. Hamilton USD 1.0 100 Corange Ltd. Hamilton USD 38.0 100 Roche Financial Investments Ltd. Hamilton USD (-) 100 Roche Financial Services Ltd. Hamilton USD 0.1 100 Roche Interfinance Ltd. Hamilton USD (-) 100 Roche International Ltd. Hamilton USD (-) 100 Roche Intertrade Ltd. Hamilton USD 10.0 100 Roche Services Holdings Ltd. Hamilton USD (-) 100 Syntex Pharmaceuticals International
Ltd. Hamilton USD (-) 100
Brazil Produtos Roche Químicos e Farmaceuticos S.A.
Sào Paulo BRL 41.7 100
Roche Diagnostica Brasil Ltda. Sào Paulo BRL 149.0 100
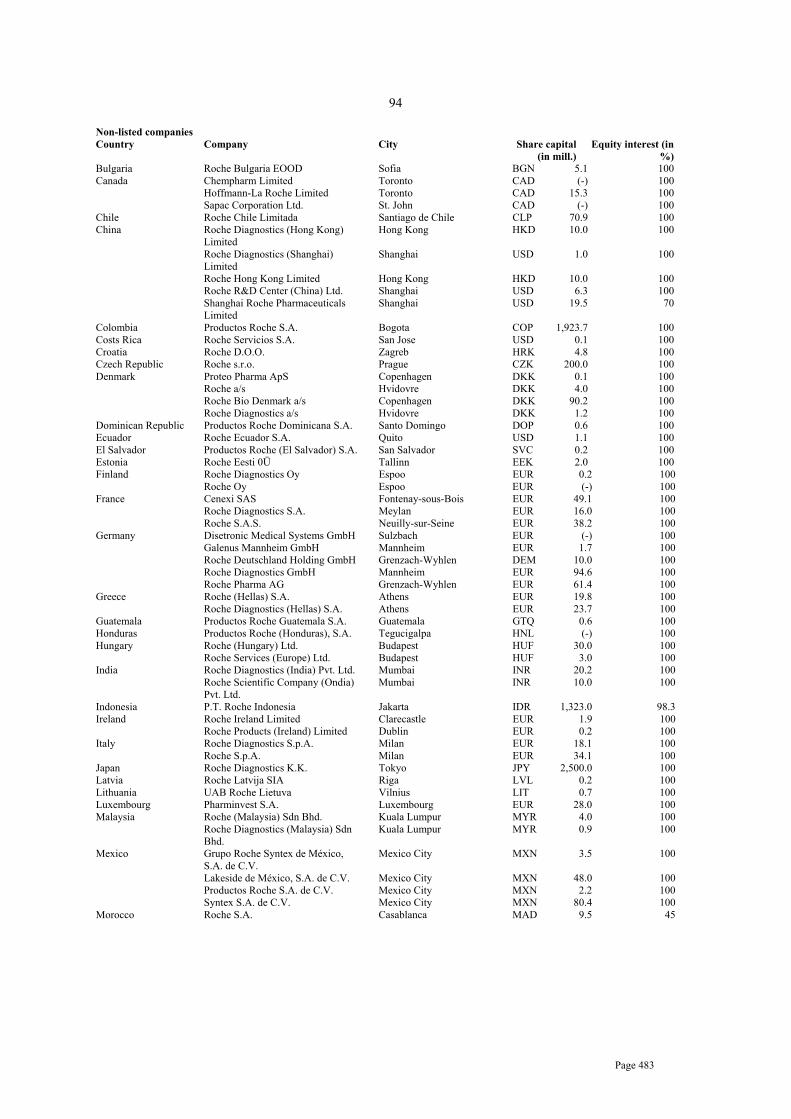
Page 483
94
Non-listed companies Country Company City Share capital
(in mill.) Equity interest (in
%) Bulgaria Roche Bulgaria EOOD Sofia BGN 5.1 100 Canada Chempharm Limited Toronto CAD (-) 100 Hoffmann-La Roche Limited Toronto CAD 15.3 100 Sapac Corporation Ltd. St. John CAD (-) 100 Chile Roche Chile Limitada Santiago de Chile CLP 70.9 100 China Roche Diagnostics (Hong Kong)
Limited Hong Kong HKD 10.0 100
Roche Diagnostics (Shanghai) Limited
Shanghai USD 1.0 100
Roche Hong Kong Limited Hong Kong HKD 10.0 100 Roche R&D Center (China) Ltd. Shanghai USD 6.3 100 Shanghai Roche Pharmaceuticals
Limited Shanghai USD 19.5 70
Colombia Productos Roche S.A. Bogota COP 1,923.7 100 Costs Rica Roche Servicios S.A. San Jose USD 0.1 100 Croatia Roche D.O.O. Zagreb HRK 4.8 100 Czech Republic Roche s.r.o. Prague CZK 200.0 100 Denmark Proteo Pharma ApS Copenhagen DKK 0.1 100 Roche a/s Hvidovre DKK 4.0 100 Roche Bio Denmark a/s Copenhagen DKK 90.2 100 Roche Diagnostics a/s Hvidovre DKK 1.2 100 Dominican Republic Productos Roche Dominicana S.A. Santo Domingo DOP 0.6 100 Ecuador Roche Ecuador S.A. Quito USD 1.1 100 El Salvador Productos Roche (El Salvador) S.A. San Salvador SVC 0.2 100 Estonia Roche Eesti 0Ü Tallinn EEK 2.0 100 Finland Roche Diagnostics Oy Espoo EUR 0.2 100 Roche Oy Espoo EUR (-) 100 France Cenexi SAS Fontenay-sous-Bois EUR 49.1 100 Roche Diagnostics S.A. Meylan EUR 16.0 100 Roche S.A.S. Neuilly-sur-Seine EUR 38.2 100 Germany Disetronic Medical Systems GmbH Sulzbach EUR (-) 100 Galenus Mannheim GmbH Mannheim EUR 1.7 100 Roche Deutschland Holding GmbH Grenzach-Wyhlen DEM 10.0 100 Roche Diagnostics GmbH Mannheim EUR 94.6 100 Roche Pharma AG Grenzach-Wyhlen EUR 61.4 100 Greece Roche (Hellas) S.A. Athens EUR 19.8 100 Roche Diagnostics (Hellas) S.A. Athens EUR 23.7 100 Guatemala Productos Roche Guatemala S.A. Guatemala GTQ 0.6 100 Honduras Productos Roche (Honduras), S.A. Tegucigalpa HNL (-) 100 Hungary Roche (Hungary) Ltd. Budapest HUF 30.0 100 Roche Services (Europe) Ltd. Budapest HUF 3.0 100 India Roche Diagnostics (India) Pvt. Ltd. Mumbai INR 20.2 100 Roche Scientific Company (Ondia)
Pvt. Ltd. Mumbai INR 10.0 100
Indonesia P.T. Roche Indonesia Jakarta IDR 1,323.0 98.3 Ireland Roche Ireland Limited Clarecastle EUR 1.9 100 Roche Products (Ireland) Limited Dublin EUR 0.2 100 Italy Roche Diagnostics S.p.A. Milan EUR 18.1 100 Roche S.p.A. Milan EUR 34.1 100 Japan Roche Diagnostics K.K. Tokyo JPY 2,500.0 100 Latvia Roche Latvija SIA Riga LVL 0.2 100 Lithuania UAB Roche Lietuva Vilnius LIT 0.7 100 Luxembourg Pharminvest S.A. Luxembourg EUR 28.0 100 Malaysia Roche (Malaysia) Sdn Bhd. Kuala Lumpur MYR 4.0 100 Roche Diagnostics (Malaysia) Sdn
Bhd. Kuala Lumpur MYR 0.9 100
Mexico Grupo Roche Syntex de México, S.A. de C.V.
Mexico City MXN 3.5 100
Lakeside de México, S.A. de C.V. Mexico City MXN 48.0 100 Productos Roche S.A. de C.V. Mexico City MXN 2.2 100 Syntex S.A. de C.V. Mexico City MXN 80.4 100 Morocco Roche S.A. Casablanca MAD 9.5 45

Page 484
95
Non-listed companies Country Company City Share capital
(in mill.) Equity interest (in
%) Netherlands Roche Diagnostics Nederland B.V. Almere EUR 2.3 100 Roche Finance Europe B.V. Woerden EUR 2.0 100 Roche Nederland B.V. Woerden EUR 10.9 100 Roche Pharmholding B.V. Woerden EUR 467.8 100 New Zealand Roche Diagnostics New Zealand
Pty. Ltd. Auckland NZD 3.0 100
Roche Products (New Zealand) Limited
Auckland NZD 13.5 100
Nicaragua Productos Roche (Nicaragua) S.A. Managua NIO (-) 100 Norway Roche Diagnostics Norge A/S Oslo NOK 5.8 100 Roche Norge A/S Oslo NOK 6.2 100 Pakistan Roche Pakistan Ltd. Karachi PKR 38.3 100 Panama Productos Roche Interamericana S.A. Panama City USD 0.1 100 Productos Roche Panama S.A. Panama City PAB (-) 100 Syntex Corporation Panama City USD 1.0 100 Syntex Puerto Rico Inc. Panama City USD (-) 100 Technical Development Corp. Panama City CHF 0.8 100 Peru Productos Roche Química
Farmaceutica S.A. Lima PEN 11.1 100
Philippines Roche (Philippines) Inc. Makati PHP 125.0 100 Poland Roche Diagnostics Polska Sp. z o.o. Warsaw PLN 2.0 100 Roche Polska Sp. z o.o. Warsaw PLN 2.0 100 Portugal Roche Farmacêutica Química Lda. Amadora EUR 1.1 100 Roche Sistemas de Diagnosticos
Sociedade Unipessoal Lda. Linda-A-Velha EUR 0.6 100
Romania Roche Romania S.R.L. Bucharest RON 53.4 100 Russia Roche Moscow Ltd. Moscow RUB 2.6 100 Serbia Roche D.O.O. Beograd Belgrade EUR 1.8 100 Singapore Roche Diagnostics Asia Pacific Pte.
Ltd. Singapore SGD 7.4 100
Roche Singapore Pte. Ltd. Singapore SGD 4.0 100 Slovakia Roche Slovensko, S.R.O. Bratislava SKK 10.0 100 Slovenia Roche D.O.O. Pharmaceutical
Company Ljubljana SIT 46.5 100
South Africa Roche Products (Proprietary) Limited
Johannesburg ZAR 55.0 100
South Korea Roche Diagnostics Korea Co., Ltd. Seoul KRW 22,969.0 100 Roche Korea Company Ltd. Seoul KRW 13,375.0 100 Spain Andreu Roche S.A. Madrid EUR 0.1 100 Roche Diagnostics S.L. Barcelona EUR 18.0 100 Roche Farma S.A. Madrid EUR 54.1 100 Syntex Roche S.A. Madrid EUR 0.1 100 Sweden Roche AB Stockholm SEK 20.0 100 Roche Diagnostics Scandinavia AB Bromma SEK 9.0 100 Switzerland Disetronic Handels AG Burgdorf CHF 0.1 100 Disetronic Holding AG Burgdorf CHF 9.7 100 Disetronic Licensing AG Burgdorf CHF 0.1 100 Disetronic Medical Systems AG Burgdorf CHF 0.9 100 F. Hoffmann-La Roche Ltd Basel CHF 150.0 100 GlycArt Biotechnology Ltd. Schlieren CHF 0.3 100 IMIB Institute for Medical
Informatics and Biostatistics Ltd. Basel CHF 0.1 100
Rabbit-Air Ltd. Zurich-Kloten CHF 3.0 100 Roche Diagnostics (Switzerland) Ltd. Rotkreuz CHF 1.0 100 Roche Diagnostics International Ltd. Steinhausen CHF 20.0 100 Roche Finance Ltd. Basel CHF 409.2 100 Roche Instrument Center Ltd. Rotkreuz CHF 5.0 100 Roche Capital Market Ltd. Basel CHF 1.0 100 Roche Pharma (Switzerland) Ltd. Reinach CHF 2.0 100 Syntex Corporation Basel CHF 0.2 100 Taiwan Roche Diagnostics Ltd. TWD 80.0 100 Taipei Roche Products Ltd. Taipei TWD 100.0 100 Thailand Roche Diagnostics (Thailand)
Limited Roche Thailand Limited
Bangkok Bangkok
THB THB
103.0
120
100
100 Turkey Roche Diagnostik Sistemleri Ticaret
AS. Istanbul TRY 30.0 100
Roche Müstahzarlari Sanayi Anonim Sirketi
Istanbul TRY 121.0 100

Page 485
96
Non-listed Companies Country Company City Share capital
(in mill.) Equity interest
(in %) United Kingdom Roche Diagnostics Ltd. Lewes GBP 32.6 100 Roche Holding (UK) Limited Welwyn Garden City GBP 100.0 100 Roche Products Limited Welwyn Garden City GBP 98.3 100 Roche Registration Limited Welwyn Garden City GBP (-) 100 United States Disetronic Medical Systems
Inc. St. Paul USD (-) 100
Hoffmann-La Roche Inc. Nutley USD 3.0 100 Idaho Technology Inc. Salt Lake City USD 2.0 20.4 IGEN International, Inc. Wilmington USD (-) 100 Roche Carolina Inc. Florence USD (-) 100 Roche Colorado Corporation Boulder USD (-) 100 Roche Diagnostics Corporation Indianapolis USD (-) 100 Roche Finance America Inc. Wilmington USD (-) 100 Roche Finance USA Inc. Wilmington USD (-) 100 Roche Holdings, Inc. Wilmington USD 1.0 100 Roche Laboratories Inc. Nutley USD (-) 100 Roche Molecular Systems, Inc. Pleasanton USD (-) 100 Roche Palo Alto LLC Palo Alto USD (-) 100 Uruguay Roche International Ltd. -
Montevideo Branch Montevideo UYU (-) 100
Sapac Corporation Ltd. Montevideo UYU (-) 100 Venezuela Productos Roche S.A. Caracas VEB 200.0 100 (-) = share capital of less than 100,000 local currency units.
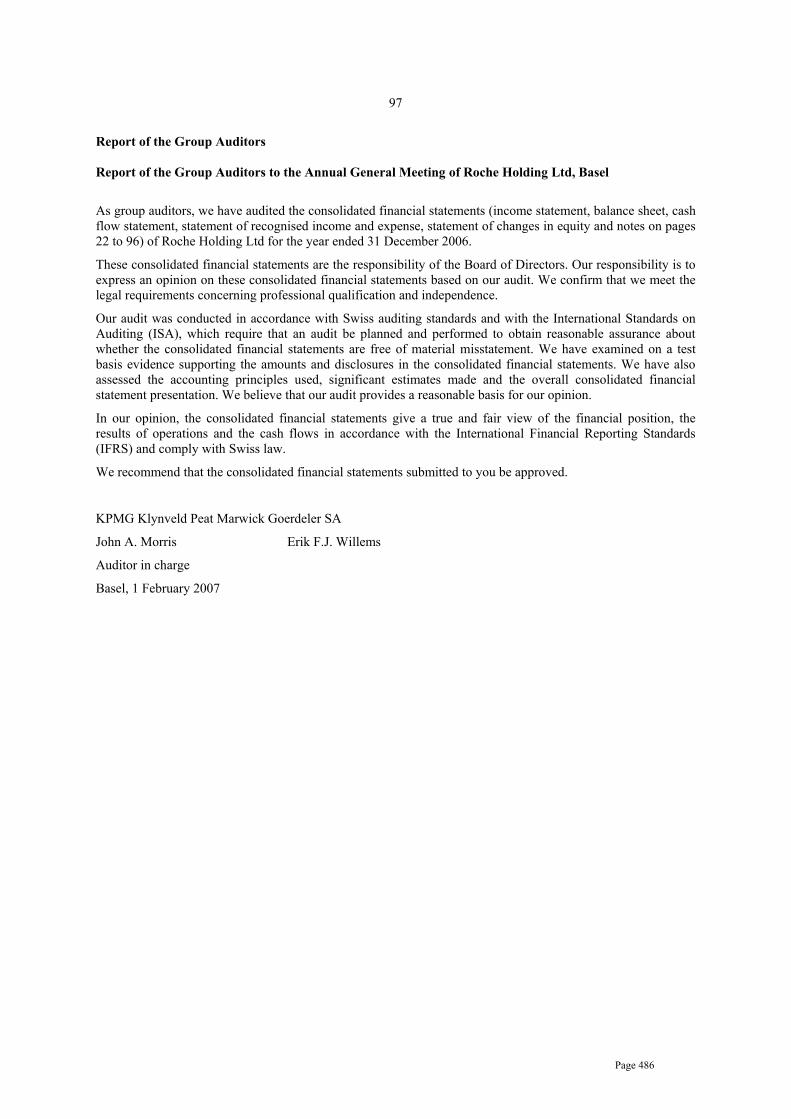
Page 486
97
Report of the Group Auditors Report of the Group Auditors to the Annual General Meeting of Roche Holding Ltd, Basel
As group auditors, we have audited the consolidated financial statements (income statement, balance sheet, cash flow statement, statement of recognised income and expense, statement of changes in equity and notes on pages 22 to 96) of Roche Holding Ltd for the year ended 31 December 2006.
These consolidated financial statements are the responsibility of the Board of Directors. Our responsibility is to express an opinion on these consolidated financial statements based on our audit. We confirm that we meet the legal requirements concerning professional qualification and independence.
Our audit was conducted in accordance with Swiss auditing standards and with the International Standards on Auditing (ISA), which require that an audit be planned and performed to obtain reasonable assurance about whether the consolidated financial statements are free of material misstatement. We have examined on a test basis evidence supporting the amounts and disclosures in the consolidated financial statements. We have also assessed the accounting principles used, significant estimates made and the overall consolidated financial statement presentation. We believe that our audit provides a reasonable basis for our opinion.
In our opinion, the consolidated financial statements give a true and fair view of the financial position, the results of operations and the cash flows in accordance with the International Financial Reporting Standards (IFRS) and comply with Swiss law.
We recommend that the consolidated financial statements submitted to you be approved.
KPMG Klynveld Peat Marwick Goerdeler SA
John A. Morris Erik F.J. Willems
Auditor in charge
Basel, 1 February 2007

Page 487
ROCHE
Roche Holding AG Grenzacherstrasse 124
CH-4058 Basel Switzerland
Roche Holding AG Roche Holding AG
signed Dr. Gottlieb A. Keller signed Dr. Andreas Knierzinger Date: 26 March 2009 Date: 26 March 2009