presentation to investors
TRANSCRIPT
Presentation to Investors Charter Communications Operating, LLC
July 2015

1
Cautionary Statement Regarding Forward-Looking Statements
Certain statements in this communication regarding the proposed transaction between Charter Communications, Inc. (“Charter”) and Time Warner
Cable Inc. (“Time Warner Cable”) and the proposed transaction regarding Charter’s acquisition of Bright House Networks, LLC (“Bright House”),
including any statements regarding the expected timetable for completing the transactions, benefits and synergies of the transactions, future
opportunities for the respective companies and products, and any other statements regarding Charter’s, Time Warner Cable’s and Bright House’s future
expectations, beliefs, plans, objectives, financial conditions, assumptions or future events or performance that are not historical facts are “forward-
looking” statements made within the meaning of Section 27A of the Securities Act of 1933, as amended, and Section 21E of the Securities Exchange
Act of 1934, as amended. These statements are often, but not always, made through the use of words or phrases such as “believe,” “expect,”
“anticipate,” “should,” “planned,” “will,” “may,” “intend,” “estimated,” “aim,” “on track,” “target,” “opportunity,” “tentative,” “positioning,” “designed,”
“create,” “predict,” “project,” “seek,” “would,” “could,” “continue,” “ongoing,” “upside,” “increases,” and “potential” and similar expressions. All such
forward-looking statements involve estimates and assumptions that are subject to risks, uncertainties and other factors that could cause actual results to
differ materially from the results expressed in the statements. Among the key factors that could cause actual results to differ materially from those
projected in the forward-looking statements are the following: the timing to consummate the proposed transactions; the risk that a condition to closing
the proposed transactions may not be satisfied; the risk that a regulatory approval that may be required for the proposed transactions is not obtained or
is obtained subject to conditions that are not anticipated; Charter’s ability to achieve the synergies and value creation contemplated by the proposed
transactions; Charter’s ability to promptly, efficiently and effectively integrate acquired operations into its own operations; and the diversion of
management time on transaction related issues. Additional information concerning these and other factors can be found in Charter’s and Time Warner
Cable’s respective filings with the SEC, including Charter’s and Time Warner Cable’s most recent Annual Reports on Form 10-K, Quarterly Reports on
Form 10-Q and Current Reports on Form 8-K. Charter and Time Warner Cable assume no obligation to update any forward-looking statements.
Readers are cautioned not to place undue reliance on these forward-looking statements that speak only as of the date hereof.

2
Important Information for Investors and Shareholders
This communication does not constitute an offer to sell or the solicitation of an offer to buy any securities or a solicitation of any vote or approval. In
connection with the proposed transaction between Time Warner Cable and Charter, on June 26, 2015, Charter's subsidiary, CCH I, LLC (“New
Charter”), filed with the Securities and Exchange Commission (“SEC”) a registration statement on Form S-4 that included a preliminary joint proxy
statement of Charter and Time Warner Cable that also constitutes a prospectus of New Charter. After the registration statement is declared effective,
Charter and Time Warner Cable will mail a definitive proxy statement/prospectus to stockholders of Charter and stockholders of Time Warner Cable.
This material is not a substitute for the joint proxy statement/prospectus or registration statement or for any other document that Charter or Time Warner
Cable may file with the SEC and send to Charter’s and/or Time Warner Cable’s stockholders in connection with the proposed transactions. INVESTORS
AND SECURITY HOLDERS OF CHARTER AND TIME WARNER CABLE ARE URGED TO READ THE PROXY STATEMENT/PROSPECTUS AND
OTHER DOCUMENTS FILED WITH THE SEC CAREFULLY AND IN THEIR ENTIRETY WHEN THEY BECOME AVAILABLE BECAUSE THEY WILL
CONTAIN IMPORTANT INFORMATION. Investors and security holders will be able to obtain free copies of the proxy statement/prospectus (when
available) and other documents filed with the SEC by Charter or Time Warner Cable through the website maintained by the SEC at http://www.sec.gov.
Copies of the documents filed with the SEC by Charter will be available free of charge on Charter’s website at charter.com, in the “Investor and News
Center” near the bottom of the page, or by contacting Charter’s Investor Relations Department at 203-905-7955. Copies of the documents filed with the
SEC by Time Warner Cable will be available free of charge on Time Warner Cable’s website at www.twc.com/investors or by contacting Time Warner
Cable’s Investor Relations Department at 877-446-3689.
Charter and Time Warner Cable and their respective directors and certain of their respective executive officers may be considered participants in the
solicitation of proxies with respect to the proposed transactions under the rules of the SEC. Information about the directors and executive officers of
Charter is set forth in its Annual Report on Form 10-K for the year ended December 31, 2014, which was filed with the SEC on February 24, 2015, and
its proxy statement for its 2015 annual meeting of stockholders, which was filed with the SEC on March 18, 2015. Information about the directors and
executive officers of Time Warner Cable is set forth in its Annual Report on Form 10-K for the year ended December 31, 2014, which was filed with the
SEC on February 13, 2015, as amended April 27, 2015, its proxy statement for its 2015 annual meeting of stockholders, which was filed with the SEC
on May 18, 2015 and its Current Report on Form 8-K, which was filed with the SEC on June 1, 2015. These documents can be obtained free of charge
from the sources indicated above. Additional information regarding the participants in the proxy solicitations and a description of their direct and indirect
interests, by security holdings or otherwise, will also be included in any proxy statement and other relevant materials to be filed with the SEC when they
become available.
New Charter
In connection with the closing of the transaction with Time Warner Cable, Charter will undergo a tax-free reorganization that will result in a current
subsidiary of Charter, CCH I, LLC becoming the new holding company owning 100% of Charter. The terms “Charter” and “New Charter” are used
interchangeably throughout this presentation.

3
Introduction
Speakers
Christopher Winfrey
CFO
Prior to joining Charter, Mr. Winfrey served as Chief Financial Officer and Managing Director of Unitymedia GmbH
from March 2006 through October 2010. From December 2002 through December 2005, Mr. Winfrey served as
Senior Vice President – Corporate Finance and Development at Cablecom, GmbH. Mr. Winfrey has also served
as Director of Financial Planning and Analysis of NTL’s continental European operations and a Senior Associate in
the private equity group at Communications Equity Associates.
Charles Fisher
SVP Corporate Finance
Mr. Fisher is responsible for Charter's capital markets and merger and acquisition activities. Prior to joining
Charter he served as Senior Managing Director of Guggenheim Securities, LLC. Previously he served as the head
of the media investment banking practice for the Americas at Nomura Securities, he was a Managing Director and
led the European cable investment banking business based in London at Lehman Brothers. From 2000 to 2007,
Mr. Fisher also served as a member of Lehman Brothers' US Media & Communications team based in New York.
Overview of Transactions Christopher Winfrey
CFO
5
Transactions Overview1) 2)
1) See slides 23 and 37 for additional details, including the use of June 1, 2015 Charter stock valuation vs. May 20, 2015 for the transaction announcement.
2) See slide 40 for additional details, including the use of June 1, 2015 Charter stock valuation vs. $173.00 reference price for the transaction announcement.
3) $4.3 billion to be invested at equivalent of $176.95 per share and represents Charter’s closing price on May 20, 2015. $700 million to be invested at equivalent of $173.00, as previously announced on
March 31, 2015 as part of the Charter-A/N transaction.
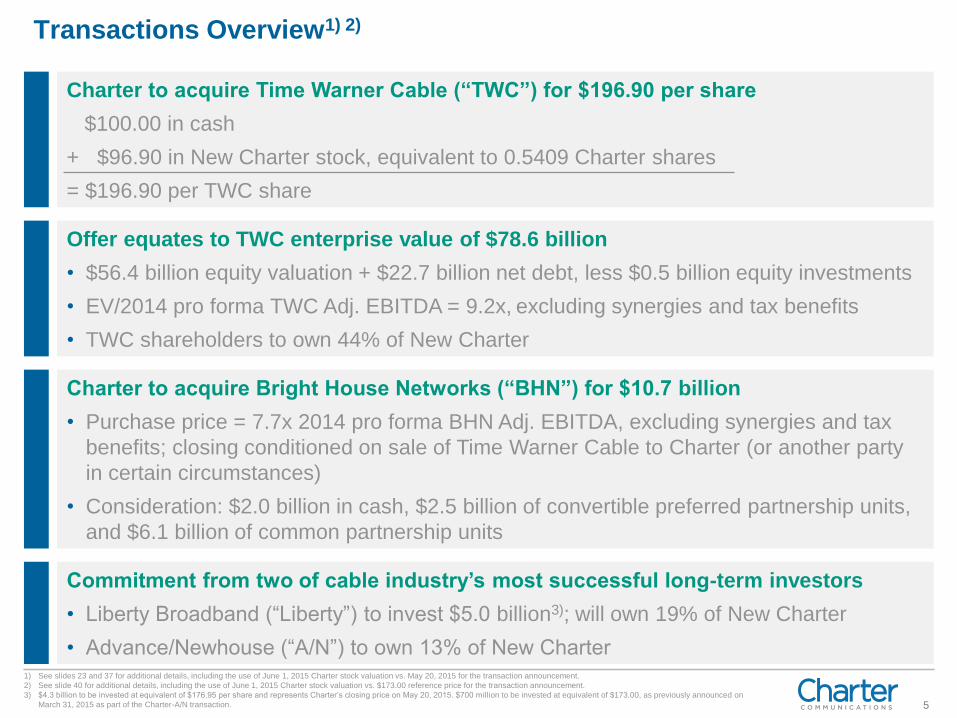
Charter to acquire Time Warner Cable (“TWC”) for $196.90 per share
$100.00 in cash
+ $96.90 in New Charter stock, equivalent to 0.5409 Charter shares
= $196.90 per TWC share
Offer equates to TWC enterprise value of $78.6 billion
• $56.4 billion equity valuation + $22.7 billion net debt, less $0.5 billion equity investments
• EV/2014 pro forma TWC Adj. EBITDA = 9.2x, excluding synergies and tax benefits
• TWC shareholders to own 44% of New Charter
Charter to acquire Bright House Networks (“BHN”) for $10.7 billion
• Purchase price = 7.7x 2014 pro forma BHN Adj. EBITDA, excluding synergies and tax
benefits; closing conditioned on sale of Time Warner Cable to Charter (or another party
in certain circumstances)
• Consideration: $2.0 billion in cash, $2.5 billion of convertible preferred partnership units,
and $6.1 billion of common partnership units
Commitment from two of cable industry’s most successful long-term investors
• Liberty Broadband (“Liberty”) to invest $5.0 billion3); will own 19% of New Charter
• Advance/Newhouse (“A/N”) to own 13% of New Charter

6
0 Accelerate growth by building on TWC momentum and Charter operating strategy
• Combine TWC’s recent operating momentum with Charter’s proven track record of
investing in, and offering, highly competitive products to drive growth
• Continue to remove analog signals in TWC and Bright House networks to free capacity
to offer faster Internet products, more HD content and other advanced products
Greater scale and enhanced footprint drives competitiveness and innovation
• Enhances sales, marketing and branding capabilities vs. national competitors
• Scale enables and accelerates product development and innovation
• New footprint provides larger opportunity to compete in medium/large commercial market
Superior Value Creation For All Stakeholders

7
Cost synergies and tax-efficient returns
• Unlock value through cost synergies inherent in Charter’s operating model, and via
combined purchasing and elimination of duplicate costs
• Transaction structure designed to provide long-dated and low-cost financing, and enable
unified operations which achieves operating cost and tax objectives
• Moderate leverage at closing to facilitate transaction and significant tax assets offer
attractive returns
Investment-grade capital structure
• Charter has designed a capital structure intended to maintain access to long-dated, low-
cost financing in the investment-grade market
• Legacy TWC notes and the new secured notes will be granted security, resulting in
investment-grade ratings at S&P and Fitch and thus investment-grade index eligibility
• Legacy TWC notes, new secured notes and Charter’s bank debt will all be pari passu
• Target total leverage of 4.0x-4.5x, ±0.5x to enable strategic activity, and secured
leverage of approximately 3.5x
• We expect to manage to the low end of this range
• Charter is committed to maintaining investment-grade index eligibility for the legacy TWC
notes and the new secured notes
Superior Value Creation For All Stakeholders

8
Combined Footprint
Charter
Time Warner Cable
Bright House Networks
48 million passings
24 million customer relationships
9 of top 25 DMAs
Improved operating footprint with better marketing and service capabilities
HI
9
A win for consumers and commercial customers
• Continued network investments will drive faster broadband speeds, better video products
and more competition
• Scale will drive greater product innovation, bringing new and advanced services to
consumers
• Investments in insourcing will drive better customer service, higher customer satisfaction
• Medium and large commercial customers will have access to better products, services
and enterprise solutions
Offers significant benefits to employees and vendors
• Charter’s commitment to superior products and customer service, and its strategy of
investing in insourcing, drives opportunities for all employees
• Drives incentives for vendors to invest in and develop new technologies, business lines
and alternative video programming platforms
Meaningful cash flow and prudent capital structure enhance credit profile
• New Charter expected to generate significant cash flow and mechanically delever
• 1st lien creditors, including existing TWC notes, benefit from secured interest in New
Charter assets
• Prudent capital structure utilizes 1st lien debt and achieves longer-dated maturity profile
Combination in Best Interest of All Stakeholders

New Charter Credit Group Christopher Winfrey
CFO

11
23.9
17.3 19.4
9.4
Cust. Rel. Video Internet Voice
New Charter at a Glance
Millions, 12/31/2014
Video Customers, Millions, 12/31/2014
$ Billions
Video Marketplace1)
1) All company customer data based on respective company reporting methodologies, including commercial customers.
2) Addition of historical financials for Charter, TWC and Bright House adjusted for pro forma S-X adjustments (see slide 31). Does not include pro forma adjustments for synergies.
3) See notes on slides 30 and 31.
Wireline Internet Marketplace1)
Internet Customers, Millions, 12/31/2014
Customers1) 2014 Pro Forma Financials2)
$35.7
$12.9
$6.1
Revenue Adj. EBITDA Adj. EBITDA - Capex3) 3)
20.4
5.9
26.3
22.4
17.3
14.0
DirecTV + AT&T Comcast New Charter Dish
22.0
19.4
16.0
9.2
Comcast New Charter AT&T Verizon

12
New Charter: At a Glance
Customers in Millions/ $ in Billions New Charter
Passings2) 12.9 30.5 4.7 48.0
Customer Relationships 6.2 15.2 2.5 23.9
Video 4.3 11.0 2.0 17.3
Internet 5.1 12.3 2.1 19.4
Voice 2.6 5.6 1.2 9.4
Customer Relationships 48% 50% 54% 50%
Video 33% 36% 44% 36%
Internet 40% 40% 44% 41%
Voice 22% 19% 25% 20%
Revenue $9.1B $22.8B $3.8B $35.7B
Adj. EBITDA $3.2B $8.4B $1.4B $12.9B
Capital Expenditures $2.2B $4.1B $0.6B $6.9B
Adj. EBITDA – Capex $1.0B $4.3B $0.8B $6.1B
2014
Cu
sto
me
rs1)
20
14
PF
Fin
an
cia
ls4)
1) All company customer data based on respective company reporting methodologies, including commercial customers. Totals may not recalculate due to rounding.
2) Residential and commercial video passings.
3) Penetration based on residential and commercial passings.
4) Pro forma financials based on Charter, TWC and Bright House historical financials adjusted for S-X pro forma adjustments. See slides 30 and 31.
2014
Pe
ne
tra
tion
3)
13
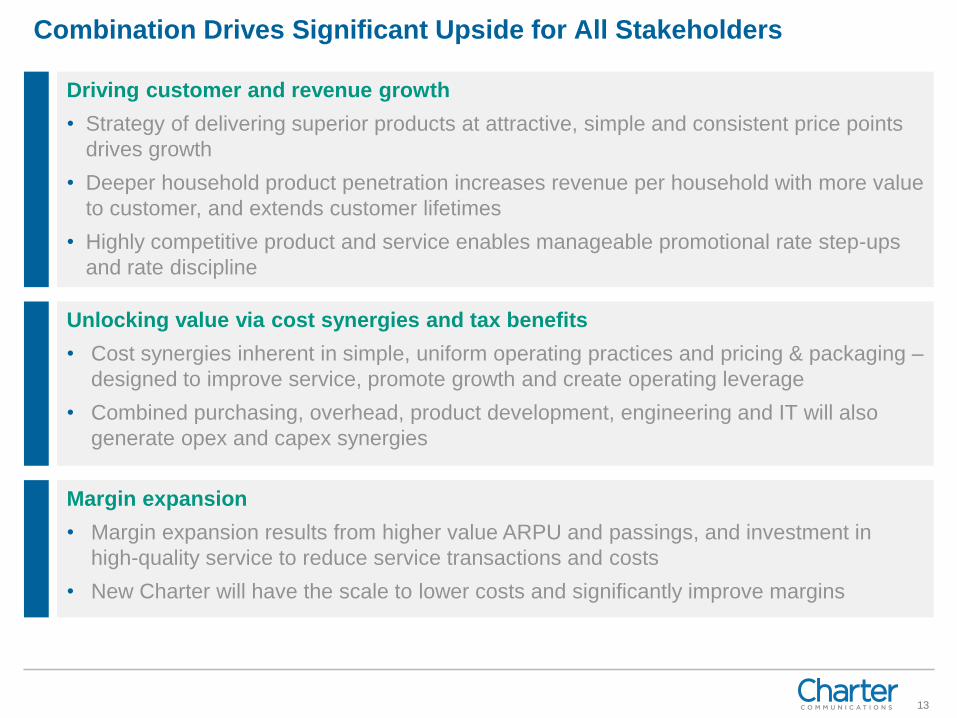
0 Driving customer and revenue growth
• Strategy of delivering superior products at attractive, simple and consistent price points
drives growth
• Deeper household product penetration increases revenue per household with more value
to customer, and extends customer lifetimes
• Highly competitive product and service enables manageable promotional rate step-ups
and rate discipline
Unlocking value via cost synergies and tax benefits
• Cost synergies inherent in simple, uniform operating practices and pricing & packaging –
designed to improve service, promote growth and create operating leverage
• Combined purchasing, overhead, product development, engineering and IT will also
generate opex and capex synergies
Margin expansion
• Margin expansion results from higher value ARPU and passings, and investment in
high-quality service to reduce service transactions and costs
• New Charter will have the scale to lower costs and significantly improve margins
Combination Drives Significant Upside for All Stakeholders

14
Tax Assets are Preserved and Enhanced
Benefit from enhanced NOL usage
• Current NPV of $3 billion of existing Charter NOLs enhanced by over $400 million, as
they will be applied to larger base of operating income
• Outsized tax basis of ~$9.1 billion as of 12/31/14 remains intact; likely section 382
ownership change, not expected to impact value of NOLs on an NPV basis
• Value of existing NOLs benefits Charter/TWC shareholders only, until A/N’s conversion of
partnership units into New Charter stock
Tax receivables agreement with Advance/Newhouse drives additional value
• New Charter will receive additional tax basis step-up upon any future A/N conversion of
partnership units into New Charter stock
• New Charter retains 50% of the cash tax savings value associated with the tax basis
step-up received if and when A/N exchanges partnership units for shares in New Charter
• A/N compensated on 50% of the net cash tax savings value associated with the tax
basis step-up received by Charter, on a with and without FIFO basis, when the step-up
benefits are used by Charter

1Q 2015 Existing Charter Christopher Winfrey
CFO

16
First Quarter Overview
1) Residential video customers generally include units under bulk arrangements with a digital set-top box and direct billing relationship. First quarter 2014 and 2015 residential video net
additions include 16,000 and 1,000 respectively, of bulk video units as a result of adding digital set-top boxes to tenants in bulk agreements driven by our all-digital transition.
2) See notes on slide 30.
Note: All results pro forma for certain acquisitions as if they occurred on January 1, 2012.
Revenue
Adjusted EBITDA2)
Operating and Financial Overview
(In Millions)
(In Millions)
• Revenue growth of 7.3% Y/Y
• Residential customer and PSU trends
• 86K increase in residential customer
relationships
• Residential PSUs increased by 160K
• Video customers declined by 7K1)
• Added 125K residential Internet customers
• Grew residential voice customers by 42K
• Adjusted EBITDA2) growth of 4.2% Y/Y; growth
of 7.0% Y/Y excluding transition costs
• Capital expenditures of $351M (including $14M
of transition Capex related to previous
transactions with Comcast) vs. $539M in 1Q14
• Free cash flow2) of $101M, vs. $74M in 1Q14
• Higher Adjusted EBITDA2) and lower
capital expenditures
• Partly offset by trade working capital,
transition, transaction and interest costs
$2,202$2,259 $2,287
$2,360 $2,362
1Q14 2Q14 3Q14 4Q14 1Q15
$767$795 $783
$845$800
1Q14 2Q14 3Q14 4Q14 1Q15

17
Residential Customer Trends
1) Represents the percentage of residential customers that subscribe to triple play service. Note: All results pro forma for certain acquisitions as if they occurred on January 1, 2012.
2) Expanded basic penetration represents the number of expanded basic residential video customers as a percentage of total residential video customers.
3) All-digital penetration represents the percent of total residential video customers in all-digital video service areas.
Primary Service Units (PSUs)
Triple Play Penetration1)
Primary Service Units (PSUs) Net Gain
Expanded Basics, Penetration2) and All-Digital3)
(In ‘000s) (In ‘000s)
4,261 4,206 4,179 4,177 4,195
4,166 4,204 4,290 4,383 4,519
2,131 2,176 2,217 2,273 2,325
10,558 10,586 10,686 10,833 11,039
1Q13 2Q13 3Q13 4Q13 1Q14
Video Internet Voice
4,261 4,206 4,179 4,177 4,195
4,166 4,204 4,290 4,383 4,519
2,131 2,176 2,217 2,273 2,325
10,558 10,586 10,686 10,833 11,039
1Q13 2Q13 3Q13 4Q13 1Q14
Video Internet Voice
4,195 4,166 4,157 4,160 4,153
4,519 4,568 4,662 4,766 4,891
2,325 2,360 2,389 2,439 2,481
11,039 11,094 11,208 11,365 11,525
1Q14 2Q14 3Q14 4Q14 1Q15
18 (7)
136
125
52
42
206
160
1Q14 1Q15
29.7%
31.2%32.6% 32.8%
1Q12 1Q13 1Q14 1Q15
Total Expanded Cust. (000s) Expanded Pen. % All-Digital Pen. %
3,915 3,9073,939
3,973
88%92% 94% 96%
0% 0%
32%
99%
1Q12 1Q13 1Q14 1Q15

18
Adjusted EBITDA1)
Quarterly Adjusted EBITDA1)
LTM Adjusted EBITDA1)
Quarterly Highlights
(In Millions)
• Adjusted EBITDA1) grew 4.2% Y/Y including
transition costs, and 7.0% excluding $21M
related to previous transactions with Comcast
• Total operating costs rose 8.9% Y/Y:
• Programming expense increase of 10.1%
Y/Y reflecting contractual increases and a
0.9% increase in expanded basic video
customers Y/Y
• Costs to service customers grew by 4.9%
Y/Y driven primarily by a larger customer
base and to provide high quality products
and service
• Comcast transaction costs of $21M
• Other expenses increased 12.6% reflecting
higher administrative labor, bad debt and
commercial expenses
(In Millions)
1) See notes on slide 30.
Note: All results pro forma for certain acquisitions as if they occurred on January 1, 2012.
$767 $795 $783
$845 $800
1Q14 2Q14 3Q14 4Q14 1Q15
$3,000
$3,223
1Q14 1Q15
19
1) See notes on slide 30.
2) Includes payments on interest rate swaps.
3) Includes available cash on hand and revolver availability.
4) Leverage is total debt of $14,157M divided by LTM Adjusted EBITDA1 of $3,223M as of 3/31/15 and total debt of $14,153M divided by LTM pro forma adjusted EBITDA1 of $3,000M as of 3/31/14.
Excludes $3.5B Term Loan G at unrestricted subsidiary, CCO Safari, LLC and $3.5B CCOH Safari, LLC notes.
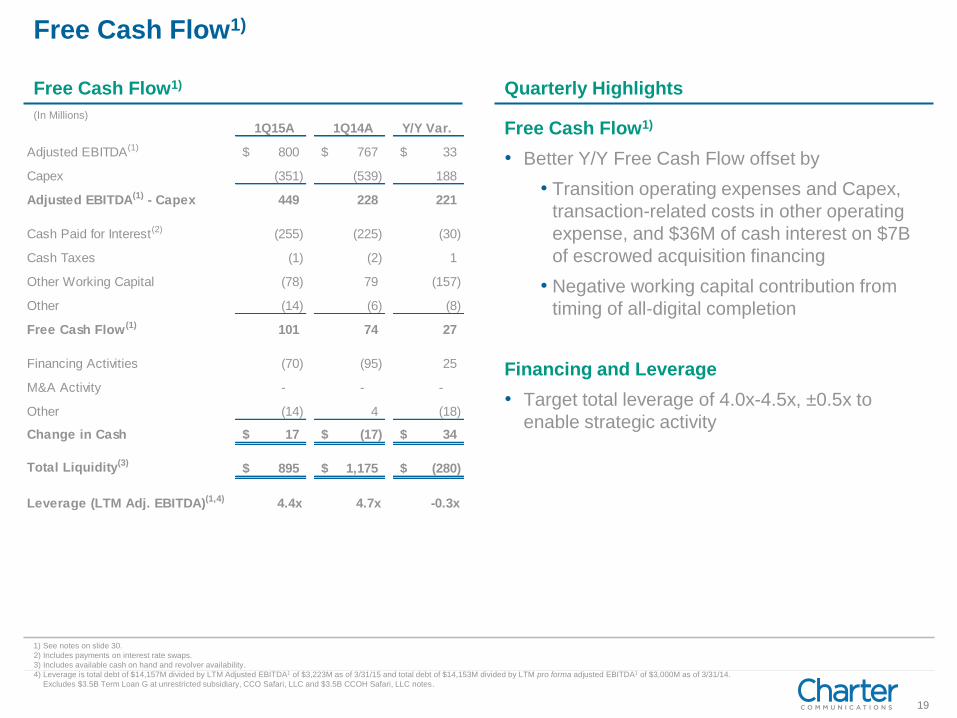
Free Cash Flow1)
Free Cash Flow1) Quarterly Highlights
(In Millions)
Free Cash Flow1)
• Better Y/Y Free Cash Flow offset by
• Transition operating expenses and Capex,
transaction-related costs in other operating
expense, and $36M of cash interest on $7B
of escrowed acquisition financing
• Negative working capital contribution from
timing of all-digital completion
Financing and Leverage
• Target total leverage of 4.0x-4.5x, ±0.5x to
enable strategic activity
1Q15A 1Q14A Y/Y Var.
Adjusted EBITDA(1) 800$ 767$ 33$
Capex (351) (539) 188
Adjusted EBITDA(1) - Capex 449 228 221
Cash Paid for Interest(2) (255) (225) (30)
Cash Taxes (1) (2) 1
Other Working Capital (78) 79 (157)
Other (14) (6) (8)
Free Cash Flow (1) 101 74 27
Financing Activities (70) (95) 25
M&A Activity - - -
Other (14) 4 (18)
Change in Cash 17$ (17)$ 34$
Total Liquidity(3)895$ 1,175$ (280)$
Leverage (LTM Adj. EBITDA)(1,4) 4.4x 4.7x -0.3x
Balance Sheet Charles Fisher
Senior Vice President Corporate Finance

21
Capital Structure Supports Strategy
• Charter has designed a capital structure intended to maintain access to long-dated,
low-cost financing in the investment-grade market
• Legacy TWC notes and debentures and the new secured notes will be granted
security, resulting in investment-grade ratings at S&P and Fitch and thus
investment-grade index eligibility
• Legacy TWC notes and debentures, new secured notes and Charter’s bank debt
will all be pari passu
• Target total leverage of 4.0x-4.5x, ±0.5x to enable strategic activity, and secured
leverage of approximately 3.5x
• We expect to manage to the low end of this range
• Charter is committed to maintaining investment-grade index eligibility for the legacy
TWC notes and debentures and the new secured notes
Credit Profile
• Current mix of bank and bond debt; 18% of debt is floating and expect to maintain similar
level post transaction. Anticipate putting hedges in place to address as needed
• Will continue to monitor market opportunities to balance and extend maturity profile in
order to maintain tenor and cost efficiencies
Balancing &
Extending
Maturities
• Approximately $0.9B of liquidity at March 31, 2015
• Incremental $1.7B in revolving credit facility as a part of this transaction
• Estimated pro forma liquidity of approximately $2.2B at March 31, 2015
Liquidity

22
Sources of Transactions Consideration
Sources and Uses – At $100 per Share in Cash and 0.5409 Equivalent Charter Shares1)
Sources $B Uses $B
New Debt – TWC Transaction 23.6 TWC Equity Value 56.4
Assumed TWC Debt (Principal) 23.3 Existing TWC Debt (Principal) 23.3
Liberty Investment in TWC Rolled 1.5 Fees and Expenses 0.8
New Liberty Equity Investment at $176.95 4.3
New Charter Equity to TWC Shareholders2) 27.3
Cash on TWC Balance Sheet3) 0.5
Total Sources – TWC Transaction 80.5 Total Uses – TWC Transaction 80.5
New Debt – Bright House Transaction 2.0 Bright House Enterprise Value 10.7
Preferred Units 2.5 Fees and Expenses 0.1
Common Units 6.1 Repayment on Charter Revolver 0.6
Liberty Equity Investment at $173.00 0.7
Total Sources – Bright House Transaction 11.4 Total Uses – Bright House Transaction 11.4
Total Sources 91.8 Total Uses 91.8
TW
C
Tra
nsa
cti
on
B
rig
ht
Ho
us
e
Tra
nsa
cti
on
Commitment from two of cable industry’s most successful long-term investors – Liberty investing additional
$5.0 billion to own 19%1) of New Charter and Advance/Newhouse will own 13% of New Charter
1) Liberty and Liberty Interactive Corporation (“LIC”) holding TWC shares have agreed to only take New Charter stock as consideration. $4.3 billion to be invested at equivalent of $176.95 per share and represents
Charter’s closing price on May 20, 2015. $700 million to be invested at equivalent of $173.00, as previously announced on March 31, 2015 as part of the Charter-A/N transaction.
2) Estimated value based on 275.1 million TWC shares outstanding (excluding Liberty) on June 1, 2015 and CHTR closing price on June 1, 2015 of $179.15, plus New Charter equity replacement awards to TWC
employees with an estimated pre-combination vesting period value of $607M.
3) Cash on balance sheet at TWC as of 03/31/2015.

23
PF
Ownership1)
Pro Forma Organizational Structure1)
Combination of Charter, TWC and BHN achieves
operating, financing, tax, synergy and governance
objectives
Charter
Communications
Holdings, LLC
Advance/
Newhouse
TWC
11.0M Video
Customers
Bright House
2.0M Video
Customers
87%
13%
New
Charter
Advance/
Newhouse
44%
Liberty
Charter
4.3M Video
Customers
24% 19%2) 13%
1) Ownership figures are pro forma for Time Warner Cable and Bright House transactions and assume the exchange of Bright House partnership units into New Charter stock. Assumes that Time Warner
Cable shares outstanding, excluding shares held by Liberty and Liberty Interactive are exchanged for $100 in cash and 0.5409 equivalent Charter shares.
2) Liberty and LIC have agreed to only receive stock in New Charter in exchange for their shares in TWC.
3) Security will be pari passu to liens on the collateral securing all other obligations
TWC
Shareholders
Ex-Liberty
Charter
Shareholders
Ex-Liberty
CCOH
CCO
Guarantees Security3)
Existing Debt
• CCOH and all
operating subs of
CCO
• Secured by substantially all operating assets
• Pledge of CCO equity
• CCOH and all
operating subs of
CCO
• Secured by substantially all operating assets
• Pledge of CCO equity
N/A • None
New Debt
• CCOH and all
operating subs of
CCO
• Secured by substantially all operating assets
• Pledge of CCO equity
• CCOH and all
operating subs of
CCO
• Secured by substantially all operating assets
• Pledge of CCO equity
• CCOH and all
operating subs of
CCO
• None
N/A • None
CC
O
Ban
k
Unsecured Notes
Secured Notes (incl.
TWC Notes) / Loans T
WC
No
tes
CC
OH
No
tes
CC
O
Ban
k
CC
O
Sec.
CC
O
Un
sec.
CC
OH
Un
sec.

24
New Charter Credit Group Debt Structure1)
1) Tranching of new debt is illustrative and actual tranching may vary. Amounts reflect principal amounts of debt, and do not include other contractual obligations as disclosed in Charter 's 10-K, TWC’s 10-K and BHN financial statements.
2) Debt balances as of 3/31/2015 are pro forma for April 2015 CCOH senior unsecured notes offering, April and May 2015 CCOH senior unsecured note redemptions, and Safari I debt redemptions.
3) Calculated using aggregate principal amount of debt at 3/31/15 divided by 2014 Adjusted EBITDA8 of $3,190M. See slide 31 for GAAP reconciliations.
4) Includes $816M of intercompany notes and capital leases. Intercompany loan balances consolidate out at the applicable entities as follows: $48M owed by CCO to Charter Communications Holding Company, LLC, $285M owed by CCO to
CCH II and $483M owed by CCO to CCOH. Pro forma amount includes $85M of TWC capital leases.
5) For CCOH, consists of $191M of noncontrolling interest of CC VIII (the “Liquidation Preference”), an indirect subsidiary of CCO, held by CCH I, LLC and Charter, less $483M owed by CCO to CCOH. The Liquidation Preference is included in
the leverage calculation shown for CCOH. The CCO leverage calculation shown is consistent with the CCO Credit Facility and excludes the Liquidation Preference.
6) Includes $285M of intercompany notes from CCO to CCH II, $48M of intercompany notes from CCO to Charter Communications Holding Company, LLC and elimination of the Liquidation Preference.
7) Calculated using aggregate principal amount of debt at 3/31/2015, pro forma for new debt and assumed TWC debt, divided by total pro forma entity 2014 Adjusted EBITDA8 of $12,916M, including Charter 2014 Adjusted EBITDA8 of
$3,190M, TWC 2014 Adjusted EBITDA8 of $8,354M, BHN 2014 Adjusted EBITDA8 of $1,206M, and pro forma adjustments of $166M. See slide 31 for GAAP Reconciliations.
8) See slide 30 for Use of Non-GAAP Financial Metrics.
($ in millions) March 31, 20152) Leverage ratio3)
March 31, 2015
Pro Forma for
New Debt
Pro Forma
Leverage ratio7)
First Lien bank debt due Q2 2015-2021 $3,606 $4,060
New Term Loan A - 2,000
New CCO Sr. Secured Debt - 19,000
Assumed TWC Notes - 23,177
Letters of Credit 71 71
Total CCO 1st Lien Debt $3,677 1.2x $48,308 3.7x
Other CCO debt4) 816 901
Total CCO Debt $4,493 1.4x $49,209 3.8x
CCOH Sr. Unsecured Notes - due 2019 - 2027 10,550 10,550
New CCOH Sr. Unsecured Notes - 3,500
Noncontrolling Interest, net of intercompany note from CCO5) (292) (292)
Total CCOH Debt $10,258 $13,758
Total Debt through CCOH $14,751 4.6x $62,967 4.9x
Intercompany eliminations6) (524) (524)
Total Charter Communications, Inc. debt $14,227 4.5x $62,443 4.8x

25
812 1,415 1,110
600
750 2,000
2,000 2,650 2,638
2,000
3,250
1,500
1,700
1,000
$48 $93
$2,740 $2,812
$3,877 $3,665
$4,810
$2,000
$3,650
$1,000 $750 $800 $926 $1,000
$1,500 $1,500 $1,500 $1,200 $1,250
$2,213
$0
$1,000
$2,000
$3,000
$4,000
$5,000
$6,000
$7,000
$8,000
2015 2016 2017 2018 2019 2020 2021 2022 2023 2024 2025 2026 2027 2028 2029 2030 2031 2032 2033 2037 2038 2039 2040 2041 2042
$ in
mill
ion
s
Existing CCO Term Debt Existing CCOH Debt Assumed TWC Debt
Existing Charter and TWC Maturity Profile1) 2)
1) Includes existing Charter and TWC debt as of 3/31/2015. Charter debt is pro forma for April 2015 CCOH senior unsecured notes offering, April and May 2015 CCOH senior unsecured notes
redemptions and Safari I debt redemptions.
2) Amounts in pro forma maturity profile reflect amortization of principal amounts of debt, and do not include other contractual obligations as disclosed in Charter's 10-K and TWC’s 10-K.
• Flexible syndication strategy allows us to opportunistically access loan and bond markets, including
investment grade and high yield, to minimize interest rate risk and maximize capital structure flexibility
• Strategy aims to achieve optimal pricing while effectively managing pro forma maturity profile
• Access to investment grade market enhances ability to issue longer-dated securities
Conclusions Christopher Winfrey
CFO
27
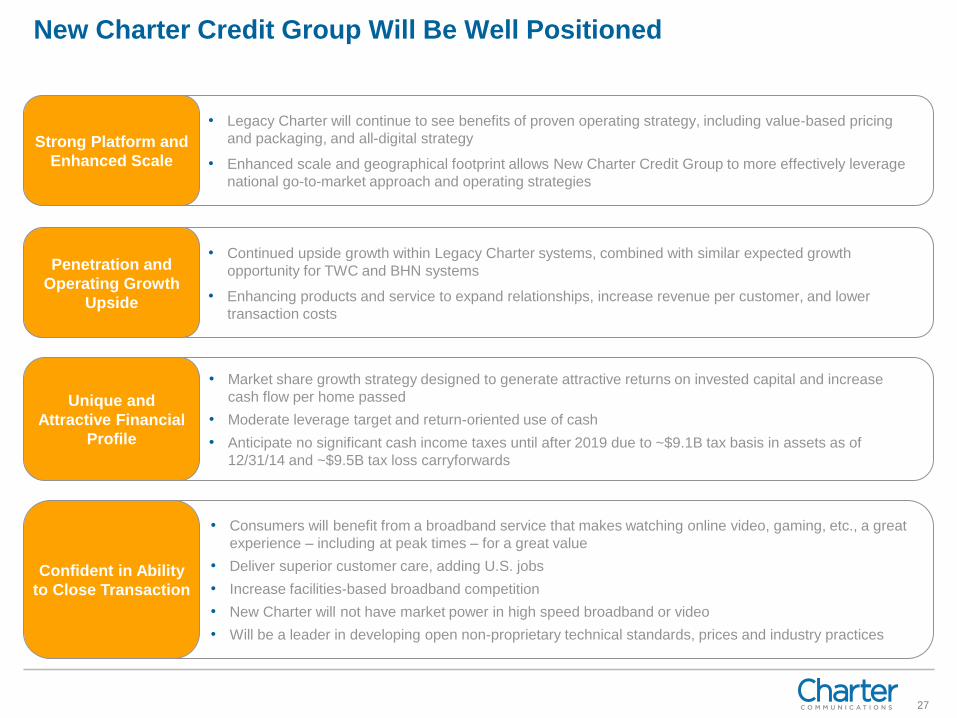
New Charter Credit Group Will Be Well Positioned
• Legacy Charter will continue to see benefits of proven operating strategy, including value-based pricing
and packaging, and all-digital strategy
• Enhanced scale and geographical footprint allows New Charter Credit Group to more effectively leverage
national go-to-market approach and operating strategies
Strong Platform and
Enhanced Scale
• Continued upside growth within Legacy Charter systems, combined with similar expected growth
opportunity for TWC and BHN systems
• Enhancing products and service to expand relationships, increase revenue per customer, and lower
transaction costs
Penetration and
Operating Growth
Upside
• Market share growth strategy designed to generate attractive returns on invested capital and increase
cash flow per home passed
• Moderate leverage target and return-oriented use of cash
• Anticipate no significant cash income taxes until after 2019 due to ~$9.1B tax basis in assets as of
12/31/14 and ~$9.5B tax loss carryforwards
Unique and
Attractive Financial
Profile
• Consumers will benefit from a broadband service that makes watching online video, gaming, etc., a great
experience – including at peak times – for a great value
• Deliver superior customer care, adding U.S. jobs
• Increase facilities-based broadband competition
• New Charter will not have market power in high speed broadband or video
• Will be a leader in developing open non-proprietary technical standards, prices and industry practices
Confident in Ability
to Close Transaction

Q&A

Appendix

30
Use of Non-GAAP Financial Metrics
3) 1)
The Company uses certain measures that are not defined by Generally Accepted Accounting Principles (“GAAP”) to evaluate various aspects of its
business. Adjusted EBITDA, pro forma adjusted EBITDA, adjusted EBITDA less capital expenditures, and free cash flow are non-GAAP financial
measures and should be considered in addition to, not as a substitute for, net income (loss) or cash flows from operating activities reported in
accordance with GAAP. These terms, as defined by Charter, may not be comparable to similarly titled measures used by other companies. Adjusted
EBITDA is reconciled to net income (loss) and free cash flow is reconciled to net cash flows from operating activities in the appendix of this presentation.
Adjusted EBITDA is defined as net income (loss) plus net interest expense, income taxes, depreciation and amortization, stock compensation expense,
loss on extinguishment of debt, (gain) loss on derivative instruments, and other operating expenses, such as equity in income of investees, merger and
acquisition costs, special charges and (gain) loss on sale or retirement of assets. As such, it eliminates the significant non-cash depreciation and
amortization expense that results from the capital-intensive nature of the Company's businesses as well as other non-cash or special items, and is
unaffected by the Company's capital structure or investment activities. However, this measure is limited in that it does not reflect the periodic costs of
certain capitalized tangible and intangible assets used in generating revenues and the cash cost of financing. These costs are evaluated through other
financial measures.
Free cash flow is defined as net cash flows from operating activities, less purchases of property, plant and equipment and changes in accrued expenses
related to capital expenditures.
Management and the Company’s Board use adjusted EBITDA and free cash flow to assess Charter's performance and its ability to service its debt, fund
operations and make additional investments with internally generated funds. In addition, adjusted EBITDA generally correlates to the leverage ratio
calculation under the Company's credit facilities or outstanding notes to determine compliance with the covenants contained in the credit facilities and
notes (all such documents have been previously filed with the SEC). For the purpose of calculating compliance with leverage covenants, we use
adjusted EBITDA, as presented, excluding certain expenses paid by our operating subsidiaries to other Charter entities. Our debt covenants refer to
these expenses as management fees, which fees were in the amount of $76 million and $253 million for the three months ended March 31, 2015 and
twelve months ended December 31, 2014, respectively.
For a reconciliation of adjusted EBITDA to the most directly comparable GAAP financial measure, see slides 31 – 35.

31
3) 1)
Pro Forma GAAP Reconciliations – FY 2014
1) Adjusted EBITDA is defined as net income (loss) plus net interest expense, income taxes, depreciation and amortization, stock
compensation expense, (gain) loss on derivative instruments, and other operating expenses, such as equity in income of
investees, merger and acquisitions costs, special charges and (gain) loss on sale or retirement of assets. As such, it
eliminates the significant non-cash depreciation and amortization expense that results from the capital-intensive nature of our
businesses as well as other non-cash or special items, and is unaffected by our capital structure or investment activities.
2) S-X Pro Forma Adjustments are (i) directly attributable to the Bright House transaction, (ii) factually supportable, and (iii)
expected to have continuing impact on the combined results of pro forma Charter as permitted under regulation S-X.
The above schedules are presented in order to reconcile Adjusted EBITDA, a non-GAAP measure, to the most directly
comparable GAAP measure in accordance with Section 401(b) of the Sarbanes-Oxley Act.
Existing
Charter
Time Warner
Cable Bright House New Charter
Consolidated net income (loss) (183)$ 2,031$ 752$ 2,600$
Plus: Interest expense, net 911 1,419 38 2,368
Income tax expense 236 1,217 - 1,453
Depreciation and amortization 2,102 3,371 416 5,889
Stock compensation expense 55 126 5 186
Loss on derivative instruments, net 7 - - 7
Other, net 62 190 (5) 247
Adjusted EBITDA per Audited Financials 1)3,190$ 8,354$ 1,206$ 12,750$
S-X Pro Forma Adjustments 2)
Plus: Bright House cap labor adjustment - - 112 112
Bright House adjustments related to pension
and other items not included in the transaction - - 57 57
Time Warner Cable amortization of pension
actuarial gains (losses) - (3) - (3)
Pro Forma EBITDA 3,190$ 8,351$ 1,375$ 12,916$
32
3) 1)
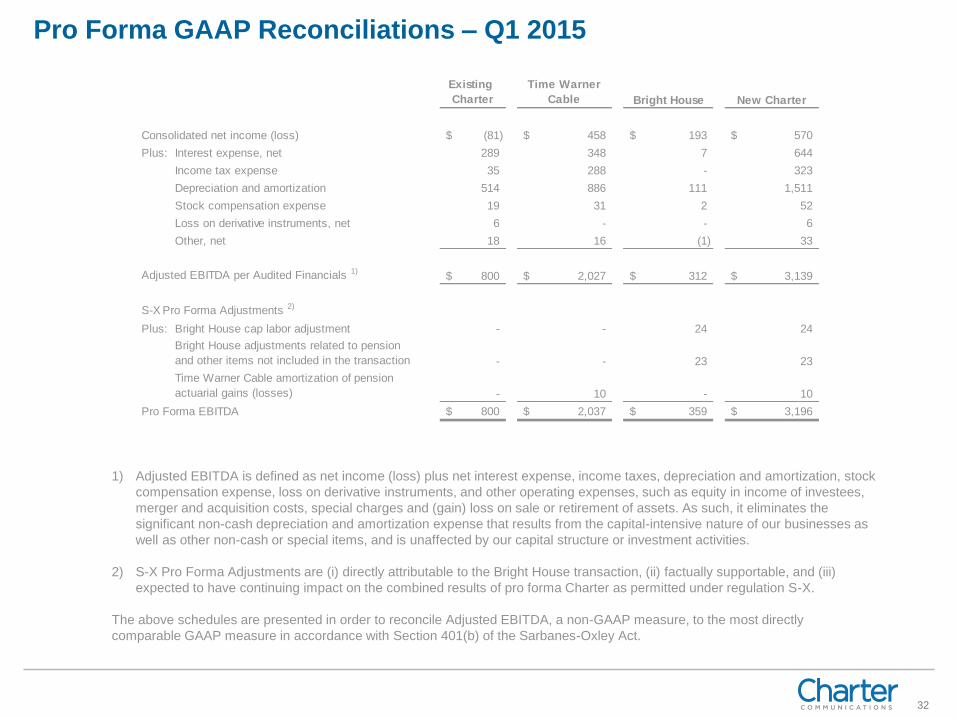
Pro Forma GAAP Reconciliations – Q1 2015
1) Adjusted EBITDA is defined as net income (loss) plus net interest expense, income taxes, depreciation and amortization, stock
compensation expense, loss on derivative instruments, and other operating expenses, such as equity in income of investees,
merger and acquisition costs, special charges and (gain) loss on sale or retirement of assets. As such, it eliminates the
significant non-cash depreciation and amortization expense that results from the capital-intensive nature of our businesses as
well as other non-cash or special items, and is unaffected by our capital structure or investment activities.
2) S-X Pro Forma Adjustments are (i) directly attributable to the Bright House transaction, (ii) factually supportable, and (iii)
expected to have continuing impact on the combined results of pro forma Charter as permitted under regulation S-X.
The above schedules are presented in order to reconcile Adjusted EBITDA, a non-GAAP measure, to the most directly
comparable GAAP measure in accordance with Section 401(b) of the Sarbanes-Oxley Act.
Existing
Charter
Time Warner
Cable Bright House New Charter
Consolidated net income (loss) (81)$ 458$ 193$ 570$
Plus: Interest expense, net 289 348 7 644
Income tax expense 35 288 - 323
Depreciation and amortization 514 886 111 1,511
Stock compensation expense 19 31 2 52
Loss on derivative instruments, net 6 - - 6
Other, net 18 16 (1) 33
Adjusted EBITDA per Audited Financials 1)800$ 2,027$ 312$ 3,139$
S-X Pro Forma Adjustments 2)
Plus: Bright House cap labor adjustment - - 24 24
Bright House adjustments related to pension
and other items not included in the transaction - - 23 23
Time Warner Cable amortization of pension
actuarial gains (losses) - 10 - 10
Pro Forma EBITDA 800$ 2,037$ 359$ 3,196$

33
3) 1)
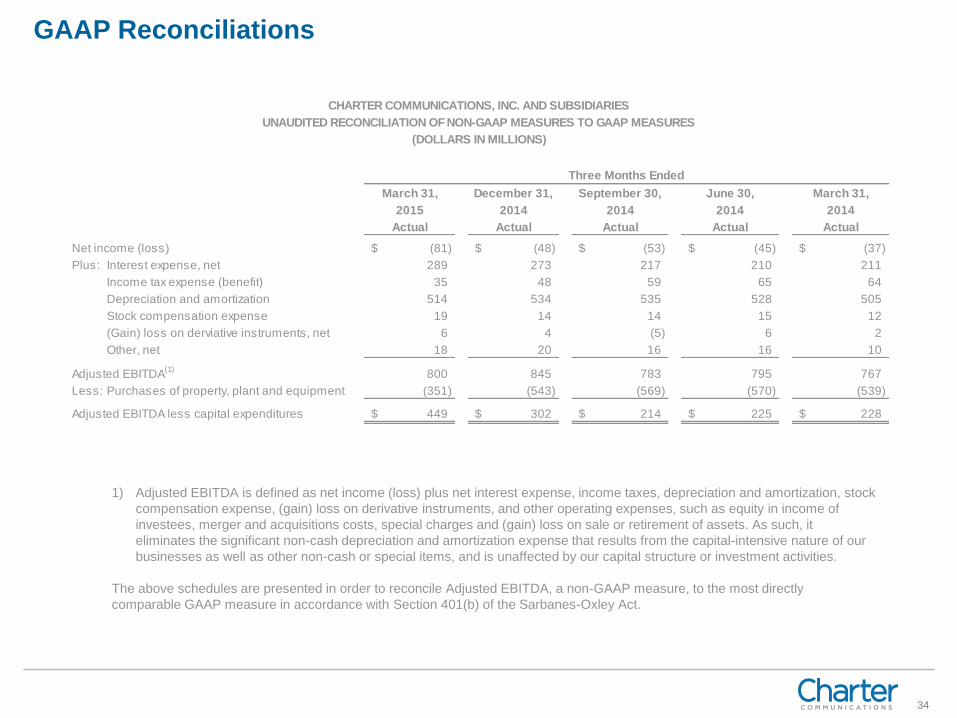
GAAP Reconciliations
March 31, March 31,
2015 2014
Actual Actual
Net income (loss) (81)$ (37)$
Plus: Interest expense, net 289 211
Income tax expense / (benefit) 35 64
Depreciation and amortization 514 505
Stock compensation expense 19 12
(Gain) loss on derviative instruments, net 6 2
Other, net 18 10
Adjusted EBITDA(1)
800 767
Less: Purchases of property, plant and equipment (351) (539)
Adjusted EBITDA less capital expenditures 449$ 228$
Net cash flows from operating activities 528$ 577$
Less: Purchases of property, plant and equipment (351) (539)
Change in accrued expenses related to capital expenditures (76) 36
Free cash flow 101$ 74$
CHARTER COMMUNICATIONS, INC. AND SUBSIDIARIES
UNAUDITED RECONCILIATION OF NON-GAAP MEASURES TO GAAP MEASURES
(DOLLARS IN MILLIONS)
Three Months Ended
1) Adjusted EBITDA is defined as net income (loss) plus net interest expense, income taxes, depreciation and amortization, stock
compensation expense, (gain) loss on derivative instruments, and other operating expenses, such as equity in income of
investees, merger and acquisitions costs, special charges and (gain) loss on sale or retirement of assets. As such, it
eliminates the significant non-cash depreciation and amortization expense that results from the capital-intensive nature of our
businesses as well as other non-cash or special items, and is unaffected by our capital structure or investment activities.
The above schedules are presented in order to reconcile Adjusted EBITDA, a non-GAAP measure, to the most directly
comparable GAAP measure in accordance with Section 401(b) of the Sarbanes-Oxley Act.
34
3) 1)
GAAP Reconciliations
March 31, December 31, September 30, June 30, March 31,
2015 2014 2014 2014 2014
Actual Actual Actual Actual Actual
Net income (loss) (81)$ (48)$ (53)$ (45)$ (37)$
Plus: Interest expense, net 289 273 217 210 211
Income tax expense (benefit) 35 48 59 65 64
Depreciation and amortization 514 534 535 528 505
Stock compensation expense 19 14 14 15 12
(Gain) loss on derviative instruments, net 6 4 (5) 6 2
Other, net 18 20 16 16 10
Adjusted EBITDA(1)
800 845 783 795 767
Less: Purchases of property, plant and equipment (351) (543) (569) (570) (539)
Adjusted EBITDA less capital expenditures 449$ 302$ 214$ 225$ 228$
CHARTER COMMUNICATIONS, INC. AND SUBSIDIARIES
UNAUDITED RECONCILIATION OF NON-GAAP MEASURES TO GAAP MEASURES
(DOLLARS IN MILLIONS)
Three Months Ended
1) Adjusted EBITDA is defined as net income (loss) plus net interest expense, income taxes, depreciation and amortization, stock
compensation expense, (gain) loss on derivative instruments, and other operating expenses, such as equity in income of
investees, merger and acquisitions costs, special charges and (gain) loss on sale or retirement of assets. As such, it
eliminates the significant non-cash depreciation and amortization expense that results from the capital-intensive nature of our
businesses as well as other non-cash or special items, and is unaffected by our capital structure or investment activities.
The above schedules are presented in order to reconcile Adjusted EBITDA, a non-GAAP measure, to the most directly
comparable GAAP measure in accordance with Section 401(b) of the Sarbanes-Oxley Act.

35
3) 1)
GAAP Reconciliations
2015 2014
Actual Actual
Net loss (227)$ (163)$
Plus: Interest expense, net 989 860
Income tax expense 207 179
Depreciation and amortization 2,111 1,961
Stock compensation expense 62 49
Loss on extinguishment of debt - 81
(Gain) loss on derviative instruments, net 11 (12)
Other, net 70 45
Adjusted EBITDA(2)
3,223 3,000
Less: Purchases of property, plant and equipment (2,033) (1,970)
Adjusted EBITDA less capital expenditures 1,190$ 1,030$
CHARTER COMMUNICATIONS, INC. AND SUBSIDIARIES
UNAUDITED RECONCILIATION OF NON-GAAP MEASURES TO GAAP MEASURES
(DOLLARS IN MILLIONS)
Last Twelve Months Ended March 31,
1) Pro forma results reflect certain acquisitions of cable systems as if they occurred as of January 1, 2012.
2) Adjusted EBITDA is defined as net income (loss) plus net interest expense, income taxes, depreciation and amortization, stock
compensation expense, loss on derivative instruments, and other operating expenses, such as equity in income of investees,
merger and acquisition costs, special charges and (gain) loss on sale or retirement of assets. As such, it eliminates the
significant non-cash depreciation and amortization expense that results from the capital-intensive nature of our businesses as
well as other non-cash or special items, and is unaffected by our capital structure or investment activities.
The above schedules are presented in order to reconcile Adjusted EBITDA, a non-GAAP measure, to the most directly
comparable GAAP measure in accordance with Section 401(b) of the Sarbanes-Oxley Act.

36
0 Board representation and structure
• 13 directors at closing
• A/N nominates 2 directors and Liberty nominates 3 directors
Proxy and voting
• For 5 years after closing, A/N to grant Liberty a proxy, capped at 7%, giving Liberty total
voting power of up to 25.01%; proxy excludes votes on certain matters
• A/N voting cap of 23.5%, increased 1:1, to max 35%, to the extent Liberty ownership falls
permanently below 15%
• Liberty voting cap greater of:
• 25.01% and 0.01% above highest voting % of any other person and
• 23.5%, increased 1:1, to max 35%, if A/N ownership is permanently below 15%
Preemptive rights
• A/N and Liberty receive preemptive rights to maintain certain ownership thresholds
• Liberty ownership capped at the greater of 26% and its voting cap. A/N capped at the
greater of its ownership percentage at closing, 25% and its voting cap
• Liberty and A/N required to participate in any share repurchase so as not to exceed their
respective ownership caps, and transfer rights are generally restricted
Governance Structure

37
Time Warner Cable Transaction Overview
Consideration and Valuation Highlights
• EV/2014 pro forma TWC Adj. EBITDA = 9.2x,
excluding synergies and tax benefits
• Accretive to Charter shareholders and TWC
shareholders receive 18% premium3)
• TWC shareholders to own 44% of New Charter,
with balance owned by legacy Charter
shareholders and Advance/Newhouse
• Election option for TWC stockholders to receive
$115 of cash and New Charter shares
equivalent to 0.4562 shares of Charter
• Liberty Broadband and Liberty Interactive
Corporation (“LIC”) to exchange TWC stock for
New Charter stock; Liberty Broadband to invest
$4.3 billion in TWC transaction and $700 million
in BHN transaction in exchange for New Charter
shares
Cash $100.00
+ 0.5409 Equivalent New Charter Shares1) $96.90
Offer per TWC Share $196.90
Total Equity Value2) $56.4B
+ Net Debt (Principal) $22.7B
- Est. Equity Investments $0.5B
TWC Enterprise Value $78.6B
- Est. Present Value of Tax Assets $1.6B
TWC Adjusted Enterprise Value $77.0B
1) Value based on $179.15 Charter closing price as of June 1, 2015.
2) Value based on 282.8 million TWC shares outstanding (including Liberty) on June 1, 2015 and CHTR closing price on June 1, 2015 of $179.15, plus New Charter equity replacement awards to TWC employees
with an estimated pre-combination vesting period value of $607M and $118M in cash paid for TWC non-employee equity awards.
3) Based on $179.15 Charter closing price as of June 1, 2015 and $166.55 TWC closing price as of May 20, 2015.

38
Consumers will benefit from a broadband service that makes watching online video,
gaming, etc., a great experience – including at peak times – for a great value
• Charter’s slowest speed tier (60 Mbps downstream) is considerably faster and less
expensive than TWC’s comparable tiers, with no data caps or usage-based pricing
• Charter will bring these products and pricing to TWC and BHN customers, while
embracing TWC’s and BHN’s rollouts of a 300 Mbps tier
• Charter will continue to invest in interconnection to minimize likelihood of congestion
• Regardless of Title II litigation, we have no plans to block, throttle or engage in paid
prioritization because our customers demand an open Internet
We will deliver superior customer care, adding U.S. jobs
• Charter has added 7,000 new jobs since 2012, most of which have been in customer
service fields
• New Charter will bring TWC’s customer care jobs back from overseas, too, training new
employees to provide superior service while adding jobs to the U.S. economy
• New Charter will build on BHN’s reputation for quality customer service
Regulatory Discussion

39
0 New Charter will increase facilities-based broadband competition
• New Charter will expand its broadband offerings for consumers by investing significantly
in out-of-home WiFi, building on what TWC and BHN have already accomplished
• We will invest significantly in building out our optical network beyond our existing
footprint to inject much needed competition in the commercial markets
New Charter will not have market power in high speed broadband or video
• Transaction does not reduce any competition in any market
• The combined entities today are estimated to serve less than 30% of broadband
customers receiving 25 Mbps or greater speeds nationwide
• Similarly, New Charter will serve only about 17% of MVPD subscribers nationwide
• Charter owns no interests in national programming
• New Charter will have the largest cable presence in only 5 of the top 20 DMAs. The
transaction does not change this metric, as TWC and BHN are already affiliated, and
Charter isn’t the largest operator in any of the top 20 DMAs.
New Charter will be a strong competitor and a leader in developing open non-
proprietary technical standards, prices and industry practices
Regulatory Discussion

40
Purchase Price and Debt Financing Bridge
1) Reflects increase in CHTR share price from $176.95
on May 20, 2015 to $179.15 on June 1, 2015,
multiplied by 0.5409x
2) Transaction announcement applied deal stock/cash
mix for former employees, directors (to receive all
cash), and existing employees (to receive all stock),
and S-4 reflects actual mix as of June 1, 2015.
Decrease is a result of $0.6B value associated with
equity replacement awards for the post-combination
period not included in TWC equity value, partially
offset by $0.3B related to higher share price
assumption
3) Revised estimated fair value of TWC equity
investments based on additional information
4) TWC purchase multiple in May 26 announcement
based on Bloomberg consensus estimates for TWC’s
2015 Adjusted EBITDA with and without synergies vs.
multiple derived from S-4 filing based on 2014 pro
forma Adjusted EBITDA*
5) Fair value based on $173.00 reference price in May 26
announcement materials vs. CHTR closing price of
$179.15 on June 1, 2015 to correspond with S-4
treatment
6) Transaction announcement applied deal stock/cash
mix for former employees, directors (to receive all
cash), and existing employees (to receive all stock),
and S-4 reflects actual mix as of June 1, 2015
7) May 26 materials were based on estimated year-end
2015 cash on balance sheet at Charter and TWC.
June 26 S-4 materials were based on actual cash on
TWC’s balance sheet as of March 31, 2015
8) Fees and expenses in May 26 materials included all
estimated fees for both TWC and BHN transactions
vs. S-4 filing which breaks out fees for each
transaction separately
Note: See slide 31 for additional details on GAAP reconciliation.
Stats per Stats Derived
May 26 Public from June 26
Announcement Adjustments S-4 Filing
Cash $100.00 $100.00
+ 0.5409 Equivalent New Charter Shares $95.71 $1.19 $96.90 (1)
Offer per TWC Share $195.71 $196.90
TWC Equity Value $56.7 ($0.3) $56.4 (2)
+ TWC Net Debt (Principal) 22.7 22.7
- Est. Equity Investments 0.7 (0.2) 0.5 (3)
TWC Enterprise Value $78.7 (0.0) $78.6
- Est. Present Value of Tax Assets 1.6 1.6
TWC Adjusted Enterprise Value $77.0 $77.0
TWC Pro Forma Adjusted EBITDA 8.442 ($0.1) 8.351 (4)
Purchase Multiple 8.3x / 9.1x 0.1x 9.2x
Charter Holdings Common Units $5.9 $0.2 $6.1 (5)
Cash Paid to A/N 2.0 2.0
Charter Holdings Preferred Units 2.5 2.5
BHN Enterprise Value $10.4 $0.2 $10.7
BHN Pro Forma Adjusted EBITDA 1.4 1.4
Purchase Multiple 7.6x 7.7x
Cash Portion of TWC Purchase Price $28.2 (0.6) $27.6 (6)
- Liberty Equity Investment (4.3) (4.3)
- Cash on Balance Sheet (1.9) 1.3 (0.5) (7)
+ Fees and Expenses 1.0 (0.2) 0.8 (8)
New Debt Requirement: TWC Transaction $23.0 0.5 $23.6
Cash Paid to A/N $2.0 $2.0
- Liberty Equity Investment (0.7) (0.7)
+ Fees and Expenses - 0.1 0.1 (8)
New Debt Requirement: BHN Transaction 1.3 1.4
Total New Debt Requirement for Transactions $24.4 $25.0
TW
C T
ran
sa
cti
on
BH
N T
ran
sa
cti
on
Pu
rch
as
e P
ric
e B
rid
ge
TW
CB
HN
De
bt
Fin
an
cin
g B
rid
ge