presentation to the financial community milan - … · outlook 2014 & 2013 annual results ended...
TRANSCRIPT
Outlook 2014 &
2013 Annual Results
Ended 31st December 2013
Presentation to the Financial Community
Milan 16th April 2014

1. TREVI Group
2. FY 2013 Financial Results
3. Foundation Engineering
4. Oil & Gas Focus
5. Appendix
2
(ITALY) World Record at 250 meters (820ft) depth Soilmec Hydromill

FOUNDATION
ENGINEERING
TREVI Group: Competitive Advantage
3
Special foundation serv ices
Special foundation rigs
Oil drilling rigs
Oil drilling serv ices
GROUP
SYNERGIES
CONSTANT
INNOVATION
OUR COMPETITVE
ADVANTAGE
STRENGTHENING MARKET LEADERSHIP
OIL&GAS

Thailand
Venezuela
U.S.A.
Mozambique
Nigeria
U.A.E.
Oman
Italy
Colombia
Canada
Qatar
New Zealand
Peru
Austria
Venezuela
Argentina
AlgeriaPhilippines
Panama
Angola
Colombia
Saudi Arabia
Libya
PETREVE
N
Division
TREVI
Division
Italy
Chile
Denmark
Kuwait
Turkey
Brazil
4Argentina
Brazil
Hong Kong
34 Operating Companies in 25 Countries – 48 Business Units
TREVI Group: Services Sector Presence
Germany
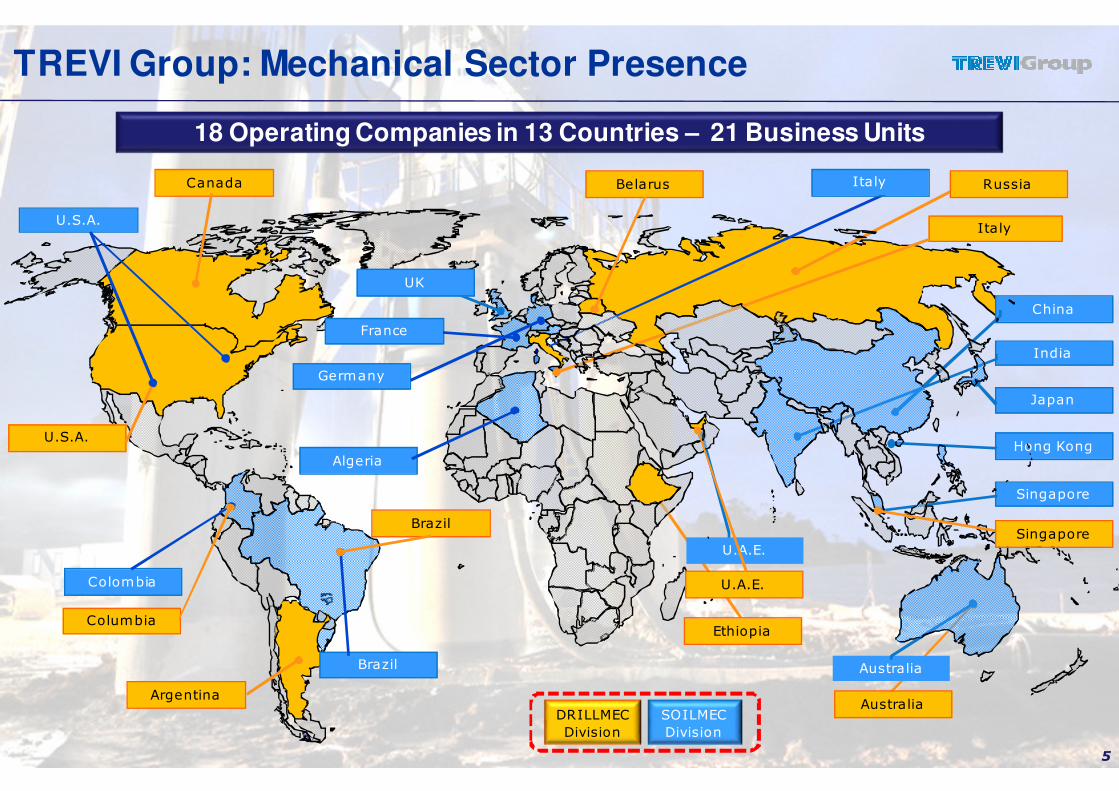
18 Operating Companies in 13 Countries – 21 Business Units
TREVI Group: Mechanical Sector Presence
Japan
China
Singapore
Italy
U.S.A.
France
India
Germany
U.S.A.
Australia
Italy
Brazil
Algeria
U.A.E.
Hong Kong
Colombia
Russia
UK
DRILLMEC
Division
SOILMEC
Division
5
Canada
Brazil
Columbia
Argentina
U.A.E.
Ethiopia
Australia
Singapore
Belarus

• Strong set of results Ongoing business improvement with sound business growth
• Consolidation of Group’s companies JVs Consolidated the majority stake of JVs considering the wider perimeter of
consolidation
• Marginality raised
� EBITDA 11,3% (2012*: 11,4%)� EBIT 6,3% (2012*: 5,2%)
• Stable financial ratios
6
TREVI Group: Results Key Highlights
2013: A year of Growth
*Applied accounting principles and changes that require the restatement of previous financial statements.

7
TREVI Group: Key 2013 accomplishments
� Expanded operations in Oil & Gas, resiliency shown in Core Business
� Key contracts awarded provide security & positive outlook
� New & strategic contracts have been awarded in the Foundation Engineering Division in different geographies confirming a gradual improvement in key markets (see US Corps of Engineers + Middle East + Africa contracts)
� Recently announced new contracts in the Oil & Gas sector
� Momentum in the Offshore market expanding in new key geographies with HH technology
� Focus on efficient cost improvement Actions have been taken forward at a Group level to enact efficient cost savings initiatives by assessing areas of
major interests. Overall reduction of inventories at the Soilmec level have been taken accomplished.
� Delivery and growthAt all business levels actions have been taken to improve profitability with worthy prospects for growth
� Total proposed dividend at 0,13 Euro per share in line with last year’s
*Applied accounting principles and changes that require the restatement of previous financial statements.
Guidance & Results
8
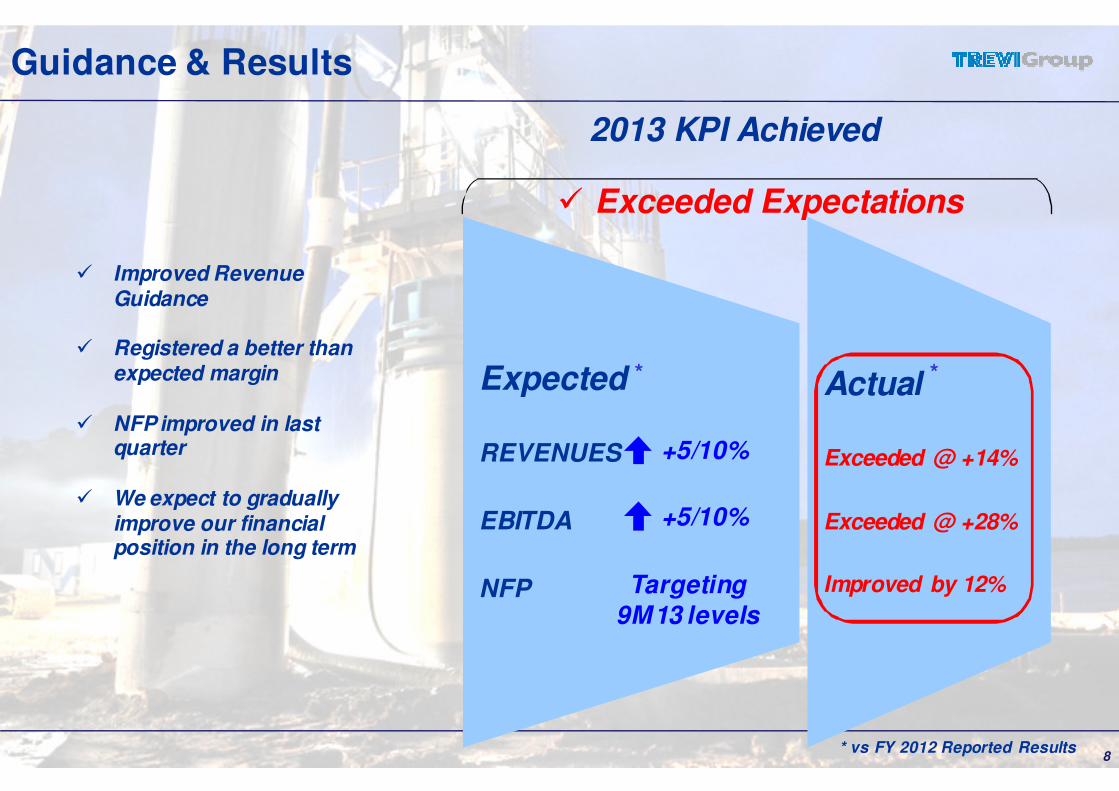
Expected
REVENUES
EBITDA
NFP
Actual
Exceeded @ +14%
Exceeded @ +28%
Improved by 12%
� Improved Revenue Guidance
� Registered a better than expected margin
� NFP improved in last quarter
� We expect to gradually improve our financial position in the long term
*
* vs FY 2012 Reported Results
*
2013 KPI Achieved
Targeting 9M13 levels
+5/10%
+5/10%
� Exceeded Expectations
Group’s Divisions OverlookS
PE
CIA
L F
OU
ND
AT
ION
S
SE
RV
ICE
S
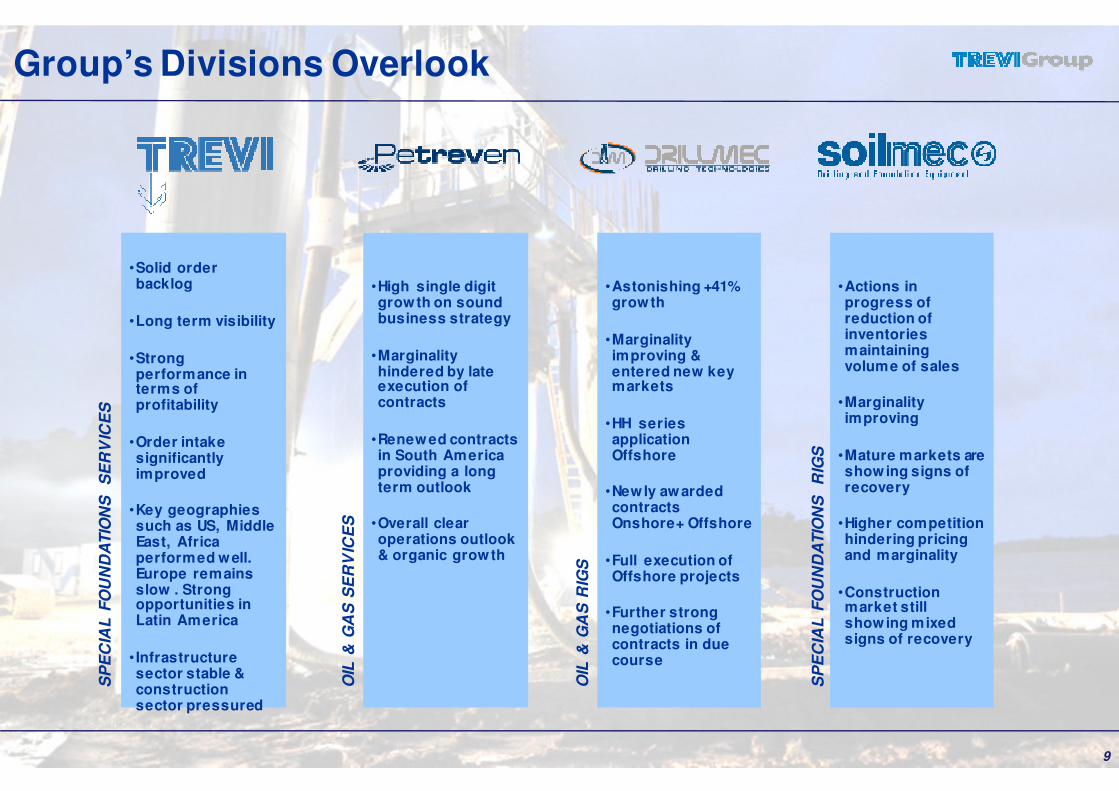
•Solid order backlog
•Long term visibility
•Strong performance in terms of profitability
•Order intake significantly improved
•Key geographies such as US, Middle East, Africa performed well. Europe remains slow . Strong opportunities in Latin America
• Infrastructure sector stable & construction sector pressured
OIL
& G
AS
SE
RV
ICE
S
•High single digit growth on sound business strategy
•Marginality hindered by late execution of contracts
•Renewed contracts in South America providing a long term outlook
•Overall clear operations outlook & organic growth
OIL
& G
AS
RIG
S
•Astonishing +41% growth
•Marginality improving & entered new key markets
•HH series application Offshore
•Newly awarded contracts Onshore+ Offshore
•Full execution of Offshore projects
•Further strong negotiations of contracts in due course
SP
EC
IAL
FO
UN
DA
TIO
NS
R
IGS
•Actions in progress of reduction of inventories maintaining volume of sales
•Marginality improving
•Mature markets are showing signs of recovery
•Higher competition hindering pricing and marginality
•Construction market still showing mixed signs of recovery
9

1. TREVI Group
2. FY 2013 Financial Results
3. Foundation Engineering
4. Oil & Gas Focus
5. Appendix
10
Copenaghen (DENMARK) CITYRINGEN work site

11
2013 Annual Results
� Increase in consolidated revenues +10% Strong volume of sales
� Marginality improved by 9%EBITDA significantly improved overall in the business
� Significant Profit Before Taxes
� Revenues: €1,276m €1,155m vs FY12*
� EBITDA: €144m €132m vs FY12*
� EBIT: €80m €60m vs FY12*
� PBT: €44m €34m vs FY12*
� Backlog: €877m €1,090m vs FY12*
� NFP: €443m €400m vs FY12*
*Applied accounting principles and changes that require the restatement of previous financial statements.

12
TREVI Group: (KPI) Key Performance Indicators
REVENUES
NET INCOME
EBITDA
EBIT
+10,4%
+8,8%
+32,9%+19,7%
FY12 vs FY12* vs FY13
Eur m
ln
*Ap
plie
d a
cco
un
ting p
rincip
les a
nd
ch
an
ge
s th
at re
qu
ire th
e re
sta
tem
en
t of p
revio
us fin
an
cia
l sta
tem
en
ts.
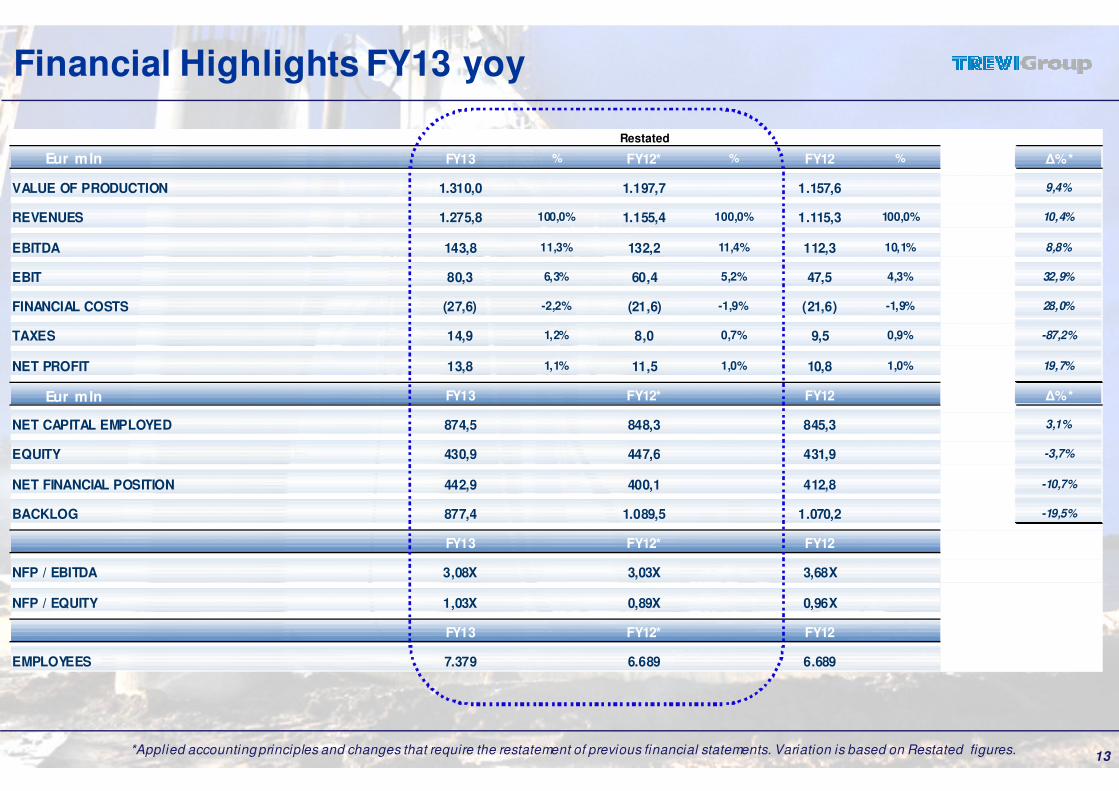
Restated
FY13 % FY12* % FY12 % Δ%*
VALUE OF PRODUCTION 1.310,0 1.197,7 1.157,6 9,4%
REVENUES 1.275,8 100,0% 1.155,4 100,0% 1.115,3 100,0% 10,4%
EBITDA 143,8 11,3% 132,2 11,4% 112,3 10,1% 8,8%
EBIT 80,3 6,3% 60,4 5,2% 47,5 4,3% 32,9%
FINANCIAL COSTS (27,6) -2,2% (21,6) -1,9% (21,6) -1,9% 28,0%
TAXES 14,9 1,2% 8,0 0,7% 9,5 0,9% -87,2%
NET PROFIT 13,8 1,1% 11,5 1,0% 10,8 1,0% 19,7%
FY13 FY12* FY12 Δ%*
NET CAPITAL EMPLOYED 874,5 848,3 845,3 3,1%
EQUITY 430,9 447,6 431,9 -3,7%
NET FINANCIAL POSITION 442,9 400,1 412,8 -10,7%
BACKLOG 877,4 1.089,5 1.070,2 -19,5%
FY13 FY12* FY12
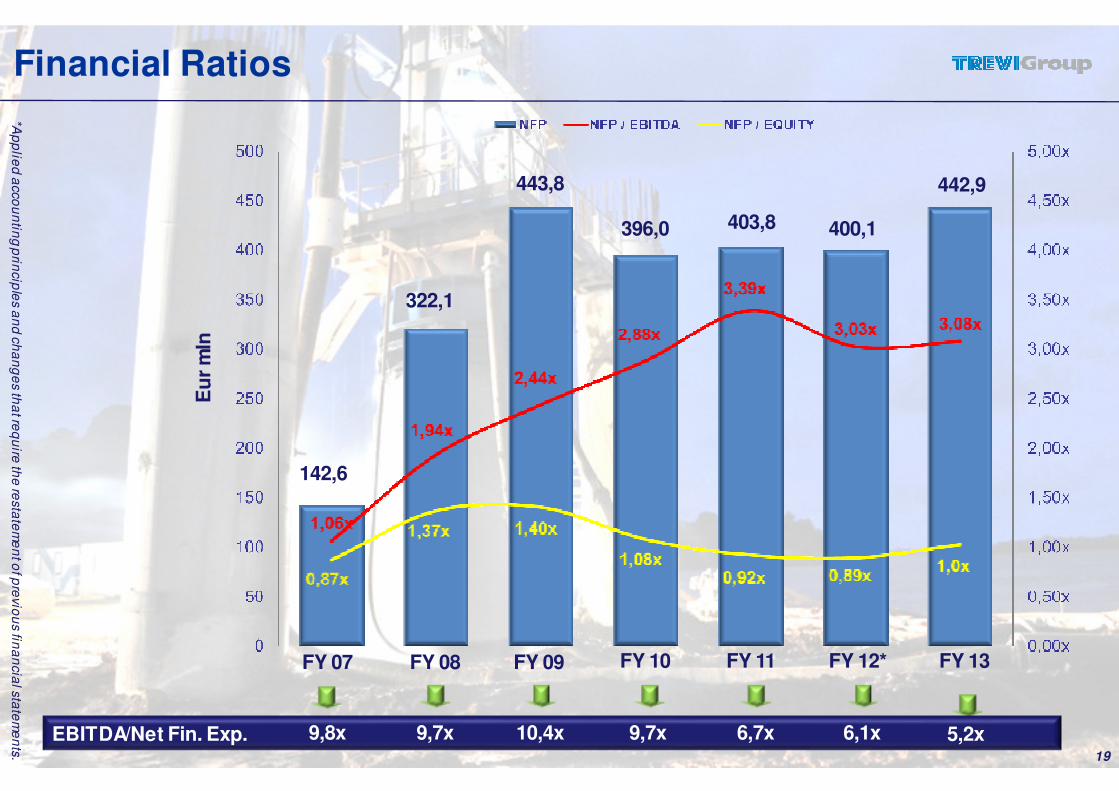
NFP / EBITDA 3,08X 3,03X 3,68X
NFP / EQUITY 1,03X 0,89X 0,96X
FY13 FY12* FY12
EMPLOYEES 7.379 6.689 6.689
13
Financial Highlights FY13 yoy
Eur mln
Eur mln
*Applied accounting principles and changes that require the restatement of previous financial statements. Variation is based on Restated figures.
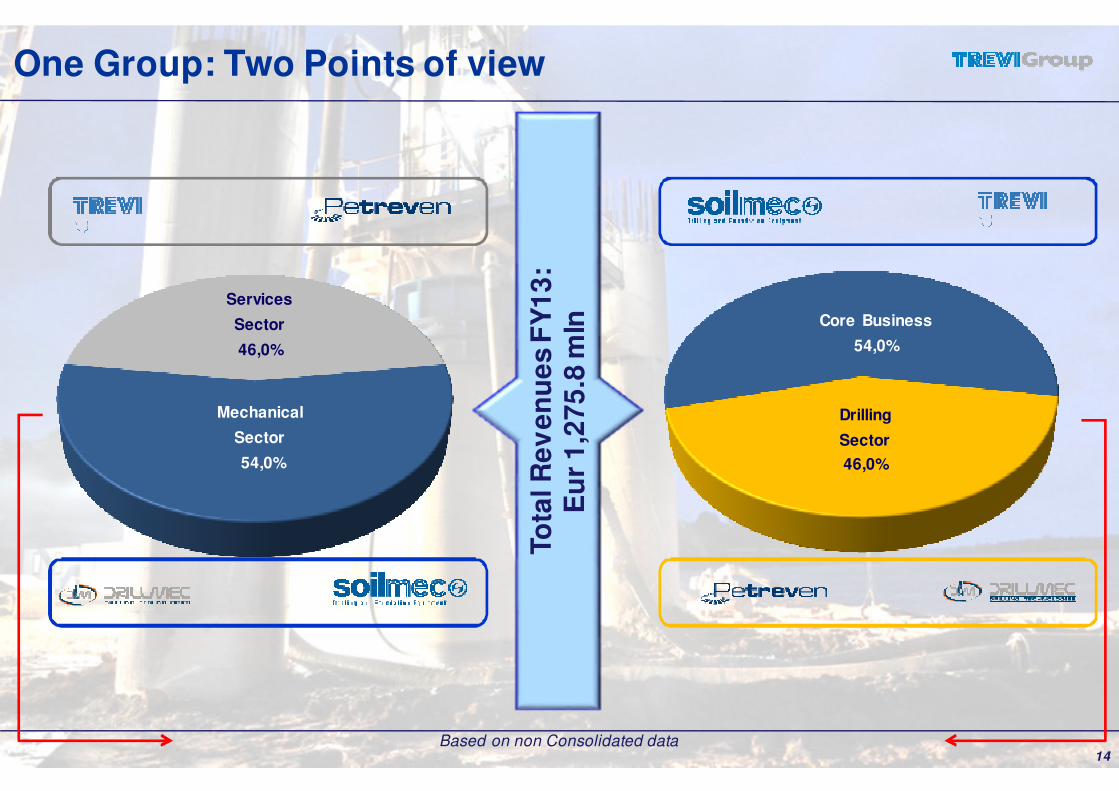
Based on non Consolidated data14
Services
Sector
46,0%
Mechanical
Sector
54,0%
Drilling
Sector
46,0%
Core Business
54,0%
One Group: Two Points of view
To
tal R
ev
en
ue
s F
Y1
3:
Eu
r1
,27
5.8
mln

Restated
Eur mln FY13 FY12* FY12 ∆ %∗ ∆ %∗ ∆ %∗ ∆ %∗
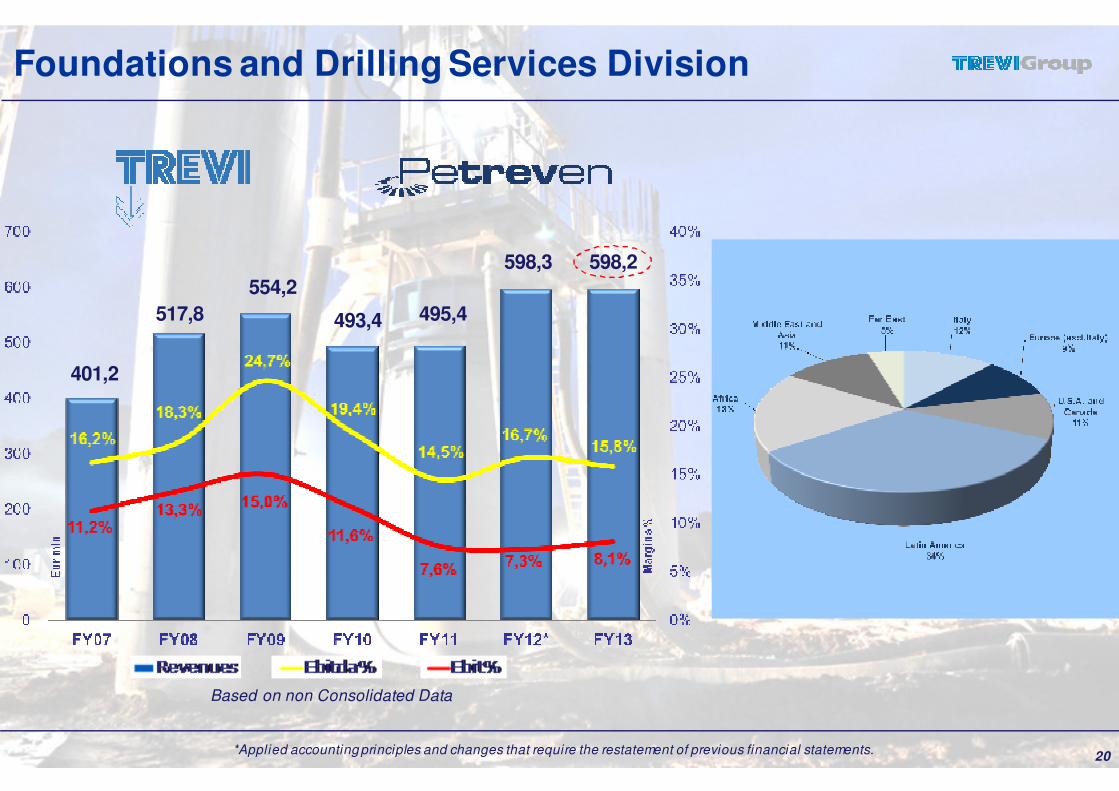
Special Foundation Services (TREVI) 482,4 493,6 453,4 -2,3%
Drilling Services (PETREVEN) 119,9 109,1 109,1 9,9%
Interdivisional Adjustments and Eliminations (4,2) (4,4) (4,4)
Sub-Total Foundations and Drilling Services Sector 598,2 598,3 558,1 0,0%
Machines for Special Foundations (SOILMEC) 220,9 236,3 236,3 -6,5%
Drilling Rigs (DRILLMEC) 491,9 348,9 348,9 41,0%
Interdivisional Adjustments and Eliminations (1,1) (2,0) (2,0)
Sub-Total Mechanical Sector 711,7 583,2 583,2 22,0%
Parent Company 14,5 13,5 13,5
Interdivisional Eliminations (48,5) (39,6) (39,5)
TOTAL CONSOLIDATED REVENUES 1.275,8 1.155,4 1.115,3 10,4%
15
Revenues Before and After Consolidation
*Applied accounting principles and changes that require the restatement of previous financial statements. Variation is based on Restated figures.

16
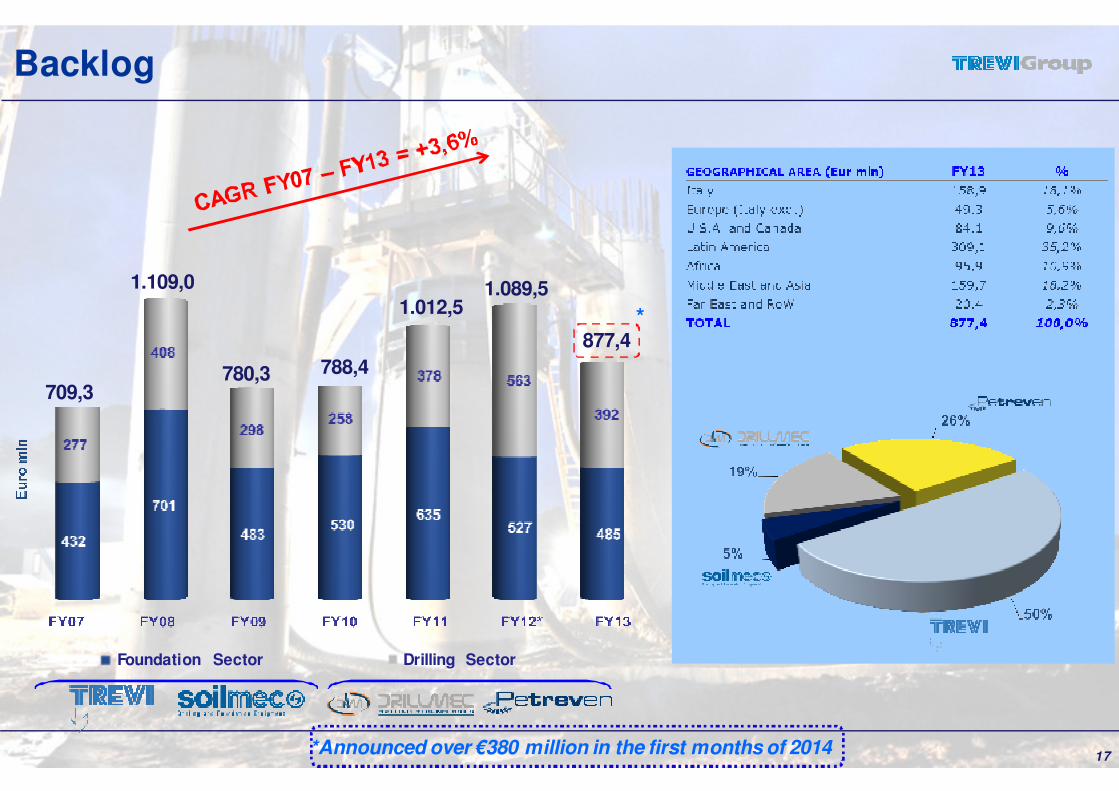
Breakdown per Geographical Area
642,4
1.069,21.035,8
952,9
1.061,4
1.155,4
841,6
Middle East: Contribution from this area has somewhat improved with respect to the previous quarters. Infrastructural & Residential projects are key and drive the growth
USA: Tendering activities appear to be picking up and greater demand for infrastructure works is shown. Primary construction & economic indicators improving
Latin America: High degree of business is being brought forward both in the construction and oil & gas fields
1.275,8
*Applied accounting principles and changes that require the restatement of previous financial statements.
17
Backlog
709,3780,3
1.109,0
788,4
1.012,51.089,5
Foundation Sector Drilling Sector
877,4
*Announced over €380 million in the first months of 2014
*
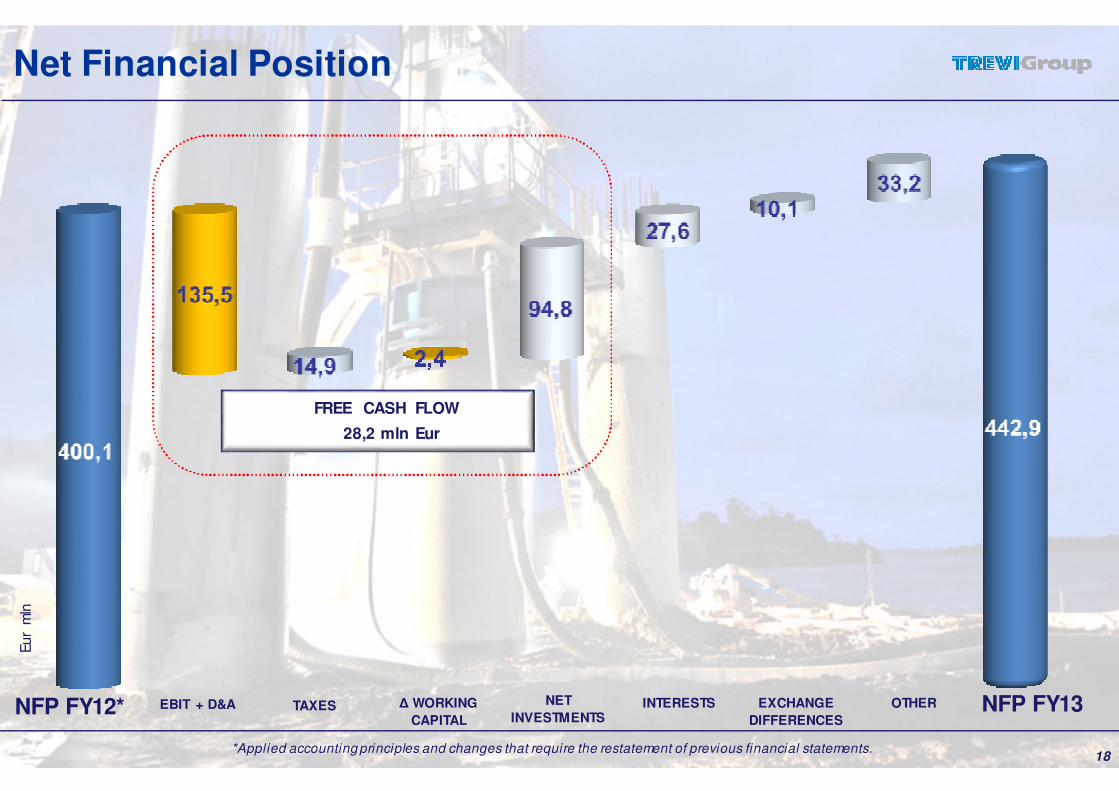
NFP FY13NFP FY12* EBIT + D&A
FREE CASH FLOW
28,2 mln Eur
Eur
mln
NET
INVESTMENTSINTERESTS EXCHANGE
DIFFERENCES
OTHERTAXES Δ WORKING
CAPITAL
18
Net Financial Position
*Applied accounting principles and changes that require the restatement of previous financial statements.
FY 09 FY 10 FY 11 FY 12* FY 13
Eu
r m
ln
FY 08
EBITDA/Net Fin. Exp. 5,2x6,1x6,7x9,7x10,4x9,7x19
Financial Ratios
FY 07
9,8x
*Ap
plie
d a
cco
un
ting p
rincip
les a
nd
ch
an
ge
s th
at re
qu
ire th
e re
sta
tem
en
t of p
revio
us fin
an
cia
l sta
tem
en
ts.
142,6
443,8
322,1
403,8 400,1396,0
442,9
20
Based on non Consolidated Data
Foundations and Drilling Services Division
401,2
554,2
517,8 493,4 495,4
598,3 598,2
*Applied accounting principles and changes that require the restatement of previous financial statements.

Based on non Consolidated Data
21
Mechanical Division
464,9496,4
607,2
485,4
596,7 583,2
711,7
*Applied accounting principles and changes that require the restatement of previous financial statements.
22
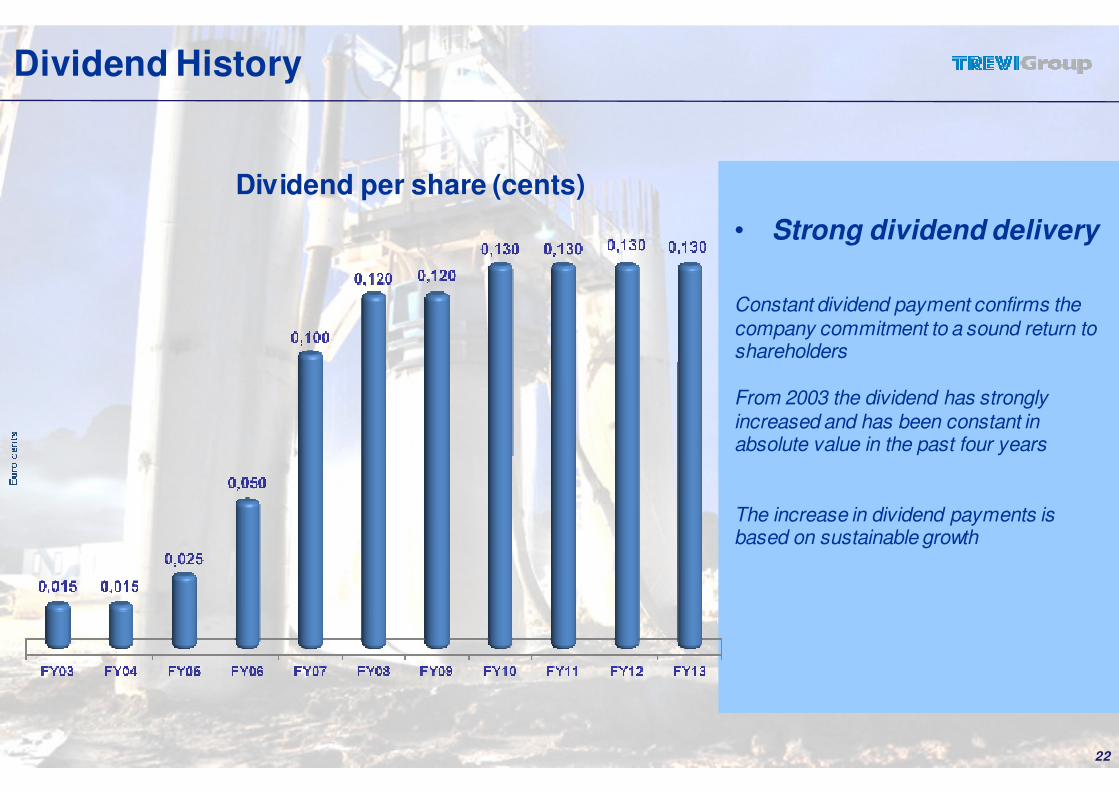
Dividend History
• Strong dividend delivery
Constant dividend payment confirms the company commitment to a sound return to shareholders
From 2003 the dividend has strongly increased and has been constant in absolute value in the past four years
The increase in dividend payments is based on sustainable growth
Dividend per share (cents)
1. TREVI Group
2. FY 2013 Financial Results
3. Foundation Engineering
4. Oil & Gas Focus
5. Appendix
23
Fogg Art M useum M assachusetts (USA)
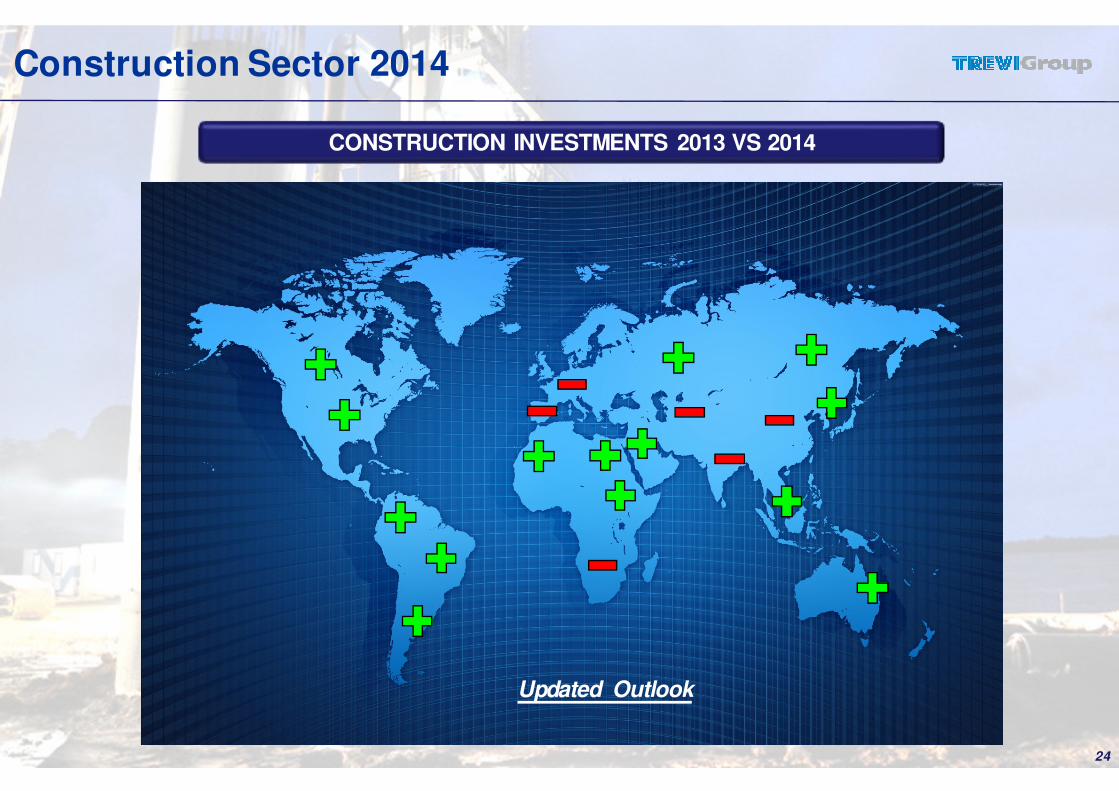
CONSTRUCTION INVESTMENTS 2013 VS 2014
24
Construction Sector 2014
Updated Outlook
25
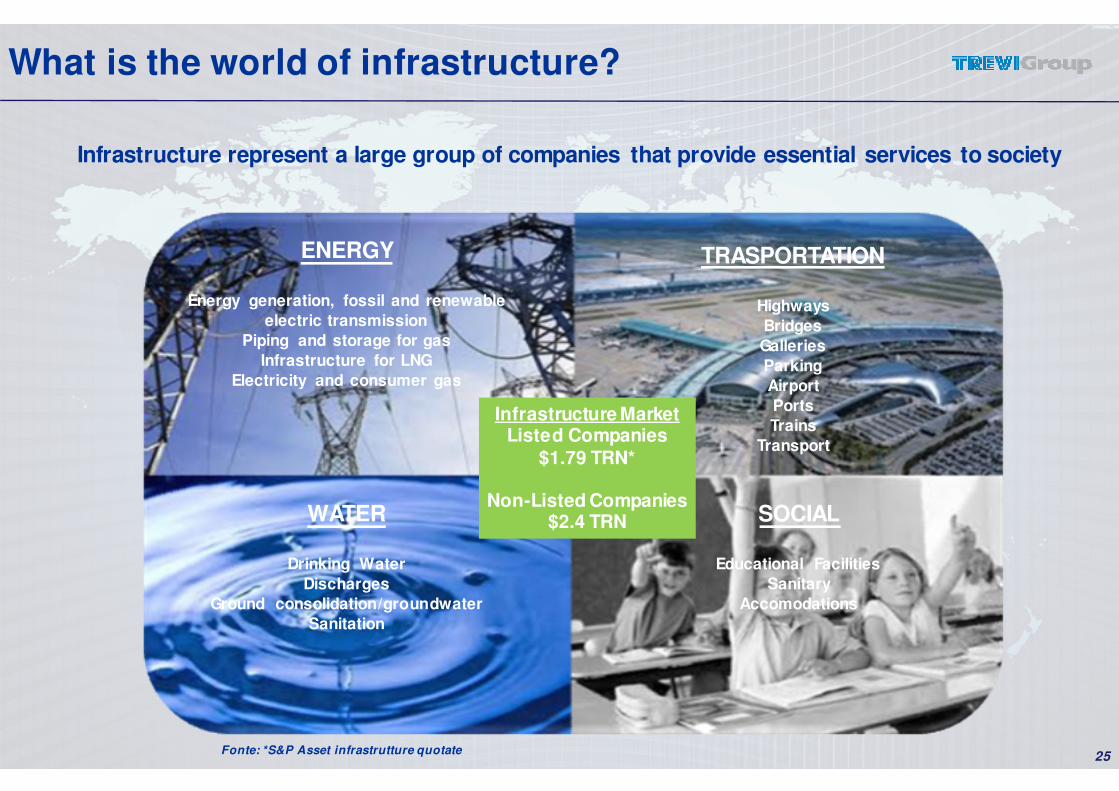
What is the world of infrastructure?
ENERGY
Energy generation, fossil and renewable
electric transmission
Piping and storage for gas
Infrastructure for LNG
Electricity and consumer gas
TRASPORTATION
Highways
Bridges
Galleries
Parking
Airport
Ports
Trains
Transport
WATER
Drinking Water
Discharges
Ground consolidation/groundwater
Sanitation
SOCIAL
Educational Facilities
Sanitary
Accomodations
Infrastructure MarketListed Companies
$1.79 TRN*
Non-Listed Companies$2.4 TRN
Infrastructure represent a large group of companies that provide essential services to society
Fonte: *S&P Asset infrastrutture quotate

26
Global Infrastructure Investments
INFRASTRUCTURE INVESTMENTS 2013-2030 (%)
� Investments in infrastructure are particularly effective for the economic recovery
of the markets
� In recent years, the lack of adequate financing projects has substantially
reduced investments in infrastructure
� In more recent times specific funds dedicated to infrastructure have been
created and many equity counterparts (Pension Funds and Sovereign Wealth
Funds) invest directly in asset
� According to the OECD (Organization for Economic
Development and Cooperation) between 2013 and 2030 $
48 trillion of investment are planned
� 6% Distribution Oil & Gas
� 9% Electricity
� 17% Telecommunications
� 38% Water
� 30% Transportation
5 YEARS OUTLOOK INVESTMENTS FOR 7.5 TRN
27
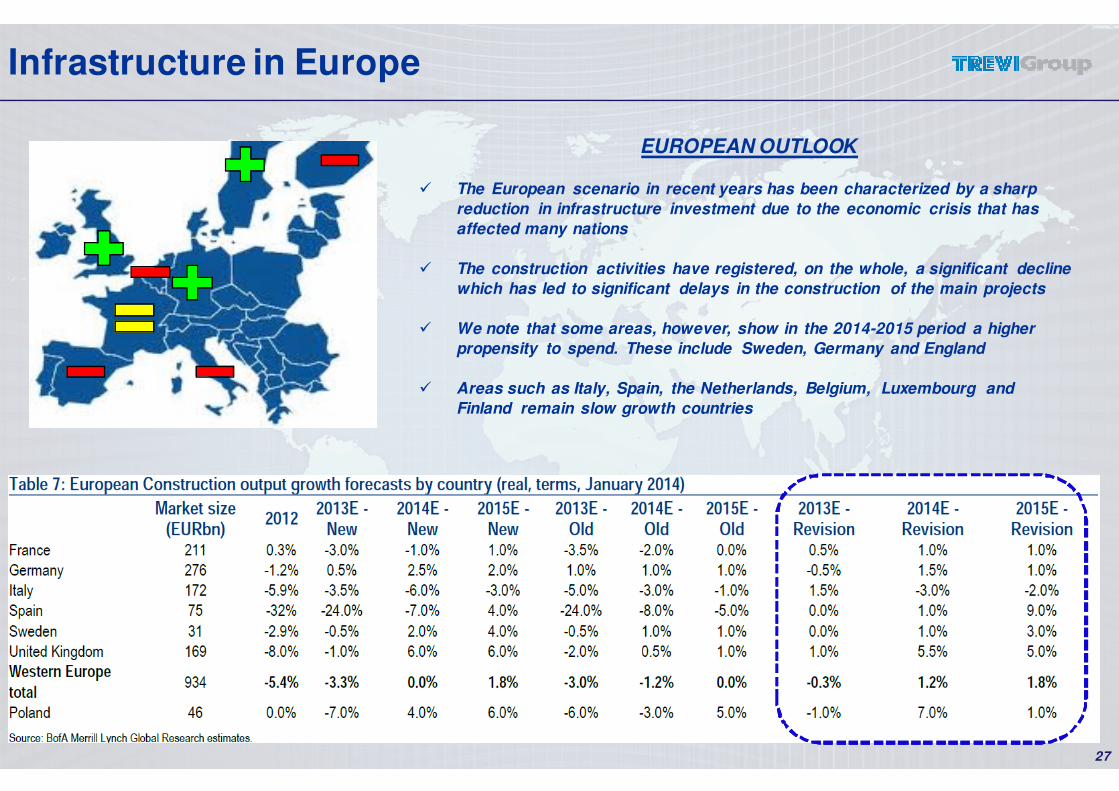
Infrastructure in Europe
EUROPEAN OUTLOOK
� The European scenario in recent years has been characterized by a sharp
reduction in infrastructure investment due to the economic crisis that has
affected many nations
� The construction activities have registered, on the whole, a significant decline
which has led to significant delays in the construction of the main projects
� We note that some areas, however, show in the 2014-2015 period a higher
propensity to spend. These include Sweden, Germany and England
� Areas such as Italy, Spain, the Netherlands, Belgium, Luxembourg and
Finland remain slow growth countries

28
Infrastructure in Europe
20142014
Residential:
• Germany
• Sweden
• England
Highway Trafficincreasing:
• France
Infrastructure & non residential:
• Spain
• Italy
• Finland
• Netherlands
• CEE
Infrastructure & non residential :
• England
Construction Volume:
• CEE
• France
2015
CEE = Central and Eastern Europe
Source: Bank of America Merrill Lynch Global Research
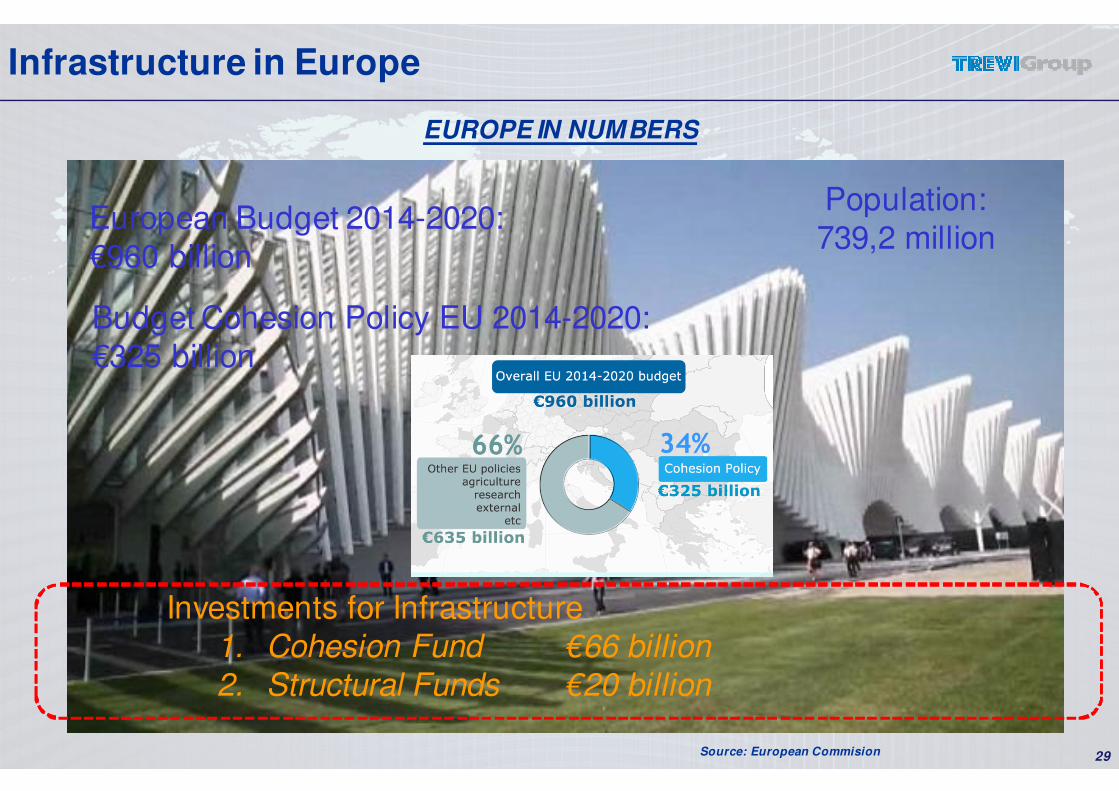
29
EUROPE IN NUMBERS
Population:
739,2 million
Budget Cohesion Policy EU 2014-2020:
€325 billion
European Budget 2014-2020:
€960 billion
Investments for Infrastructure
1. Cohesion Fund €66 billion2. Structural Funds €20 billion
Source: European Commision
Infrastructure in Europe

30
Infrastructure in Africa
MACROECONOMIC OUTLOOK IN AFRICA
The African continent over the past few years is considered to be one of the
newest and most promising investment opportunities worldwide.
The role of transport and logistics sectors has grown in importance and there
are great investments for the improvement of all the main lines of
communication.
Africa's future will depend heavily on the quality of infrastructure, and the
efficiency of its transport networks.
Following are the 10 countries that have the highest growth rate
- Algeria - Kenya
- Angola - Mozambique
- Dem. Rep. of Congo - Nigeria
- Egypt - South Africa
- Ghana - Tanzania
Source: PwC
31
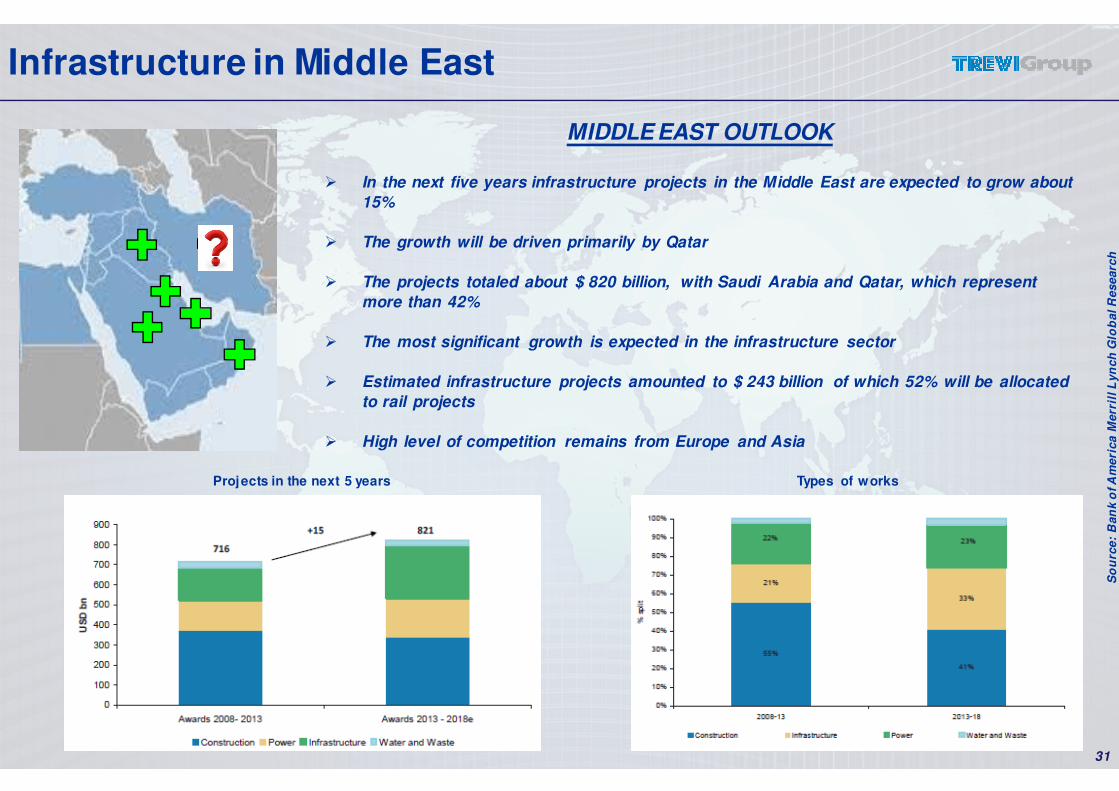
MIDDLE EAST OUTLOOK
� In the next five years infrastructure projects in the Middle East are expected to grow about
15%
� The growth will be driven primarily by Qatar
� The projects totaled about $ 820 billion, with Saudi Arabia and Qatar, which represent
more than 42%
� The most significant growth is expected in the infrastructure sector
� Estimated infrastructure projects amounted to $ 243 billion of which 52% will be allocated
to rail projects
� High level of competition remains from Europe and Asia
Source: BoA-ML Global Research stime
Projects in the next 5 years Types of works
So
urc
e:
Ban
ko
f A
meri
ca M
err
illL
yn
ch
Glo
bal R
esearc
h
Infrastructure in Middle East
32
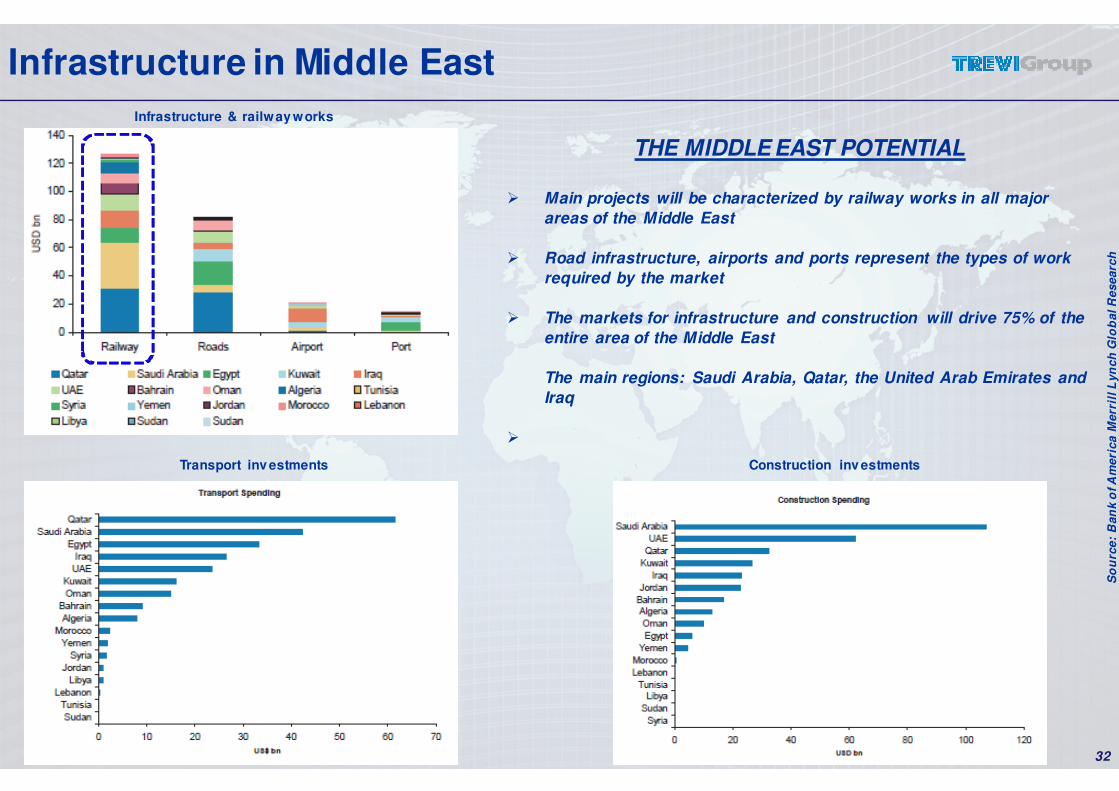
THE MIDDLE EAST POTENTIAL
� Main projects will be characterized by railway works in all major
areas of the Middle East
� Road infrastructure, airports and ports represent the types of work
required by the market
� The markets for infrastructure and construction will drive 75% of the
entire area of the Middle East
The main regions: Saudi Arabia, Qatar, the United Arab Emirates and
Iraq
�
Infrastructure & railway works
Construction inv estments
So
urc
e:
Ban
ko
f A
meri
ca M
err
illL
yn
ch
Glo
bal R
esearc
h
Transport inv estments
Infrastructure in Middle East
33
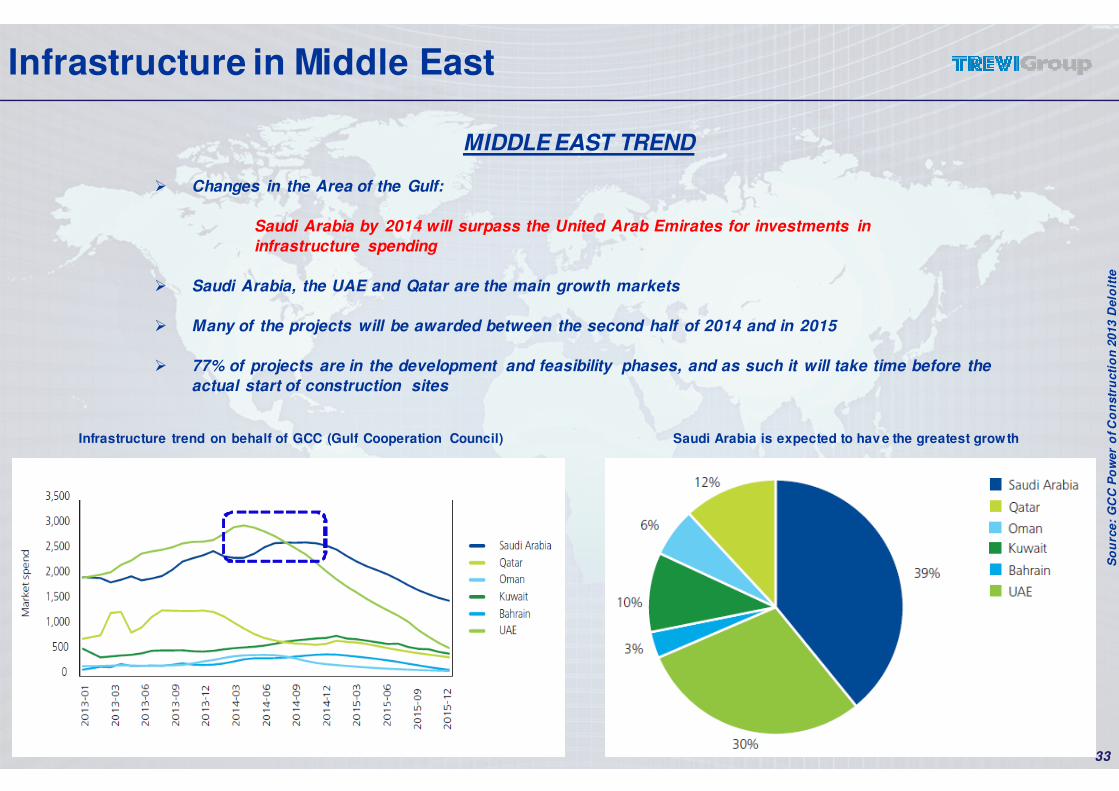
MIDDLE EAST TREND
� Changes in the Area of the Gulf:
Saudi Arabia by 2014 will surpass the United Arab Emirates for investments in
infrastructure spending
� Saudi Arabia, the UAE and Qatar are the main growth markets
� Many of the projects will be awarded between the second half of 2014 and in 2015
� 77% of projects are in the development and feasibility phases, and as such it will take time before the
actual start of construction sites
Infrastructure trend on behalf of GCC (Gulf Cooperation Council)
So
urc
e:
GC
C P
ow
er
of C
on
str
ucti
on
2013 D
elo
itte
Saudi Arabia is expected to hav e the greatest growth
Infrastructure in Middle East

34
USA OUTLOOK
� Significant growth in the market with excellent future prospects
� Main opportunities:
Residential +21% 2014
Non-residential +5% 2014
Transportation Infrastructures +2% 2014
� Greater interest on significant infrastructure projects
� Over $ 2 trillion in infrastructure needs over the next five years
� Large projects to be tendered (e.g. dams)
Infrastructure in the USA

35
NEW STANDARDS FOR INFRASTRUCTURE
The WRRDA (Water Resources Development and Reform Act) of 2013, a bill passed by the U.S. Congress at the end of 2013,
aims to improve the infrastructure in the United States
Through WRRDA Congress authorizes the key missions of the US Army Corps of Engineers (in charge of infrastructure on
US soil) for the construction and maintenance of strategic infrastructure at the national level
DAMS PORTS LEVEES HIGHWAYS
Fonte: Water Resources Reform and Development Act - US Congress
Infrastructure in the USA

36
THE EFFECTS OF WRRDA
Among the expected effects of the approval of the WRRDA 2013 we
highlight the following:
1. Priority to new and strategic projects nationwide that require immediate
action
2. Authorization to proceed with the U.S. Army Corps of Engineers for the
development of infrastructure projects already in the pipeline
3. Streamlining of authorization procedures for the initiation of projects
approved
4. Check and sale of assets not in use by the U.S. Army Corps of
Engineers
5. Financial involvement by private investors and non-federal
6. Increased competitiveness of structures
7. Creating new jobs
Fo
nte
: W
ate
r R
eso
urc
es R
efo
rm a
nd
Develo
pm
en
t A
ct -
US
Co
ng
ress
Infrastructure in the USA
3737
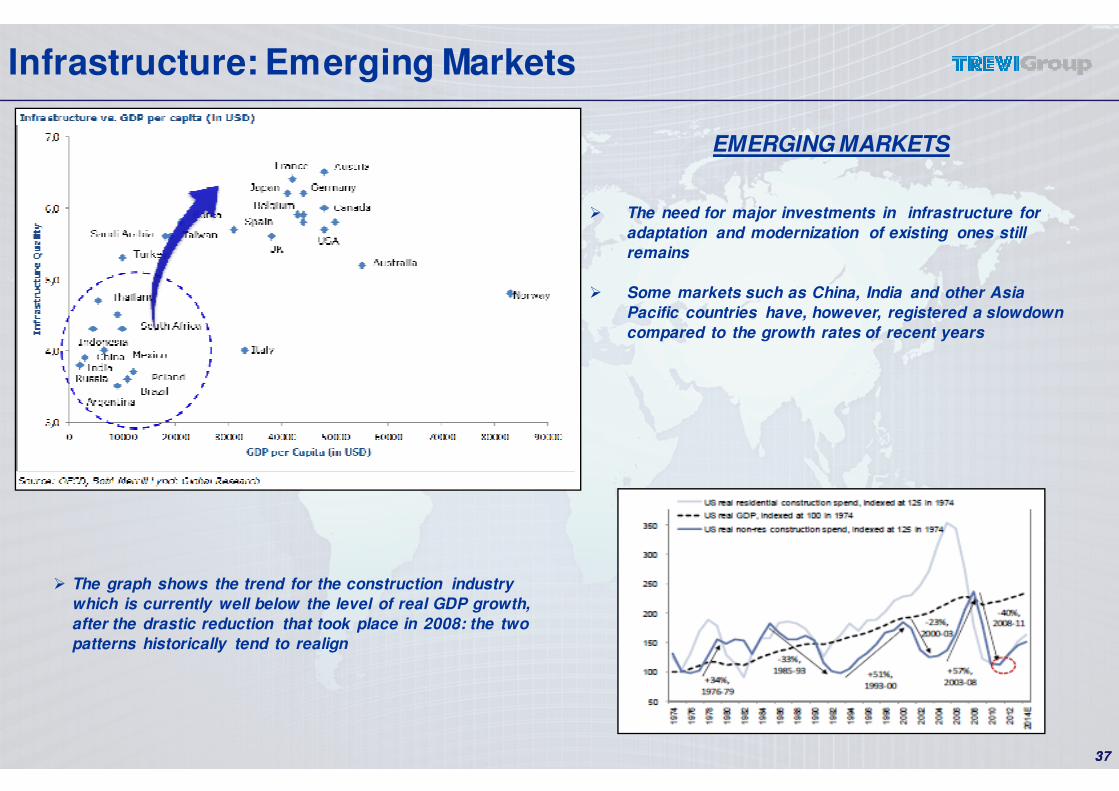
� The graph shows the trend for the construction industry
which is currently well below the level of real GDP growth,
after the drastic reduction that took place in 2008: the two
patterns historically tend to realign
EMERGING MARKETS
� The need for major investments in infrastructure for
adaptation and modernization of existing ones still
remains
� Some markets such as China, India and other Asia
Pacific countries have, however, registered a slowdown
compared to the growth rates of recent years
Infrastructure: Emerging Markets

38
AREAS & REGIONS
� The main areas of infrastructural development will interest areas such as China, India, Russia, Indonesia
� China alone will reach nearly 9 trillion USD
� 67% of the investment will come from Asia
Source: JP Morgan, Morgan Stanley Research
Breakdown by regionInvestments ’08-’17
Infrastructure in the Far East
Percentage Breakdown by region Investments ’08-’17
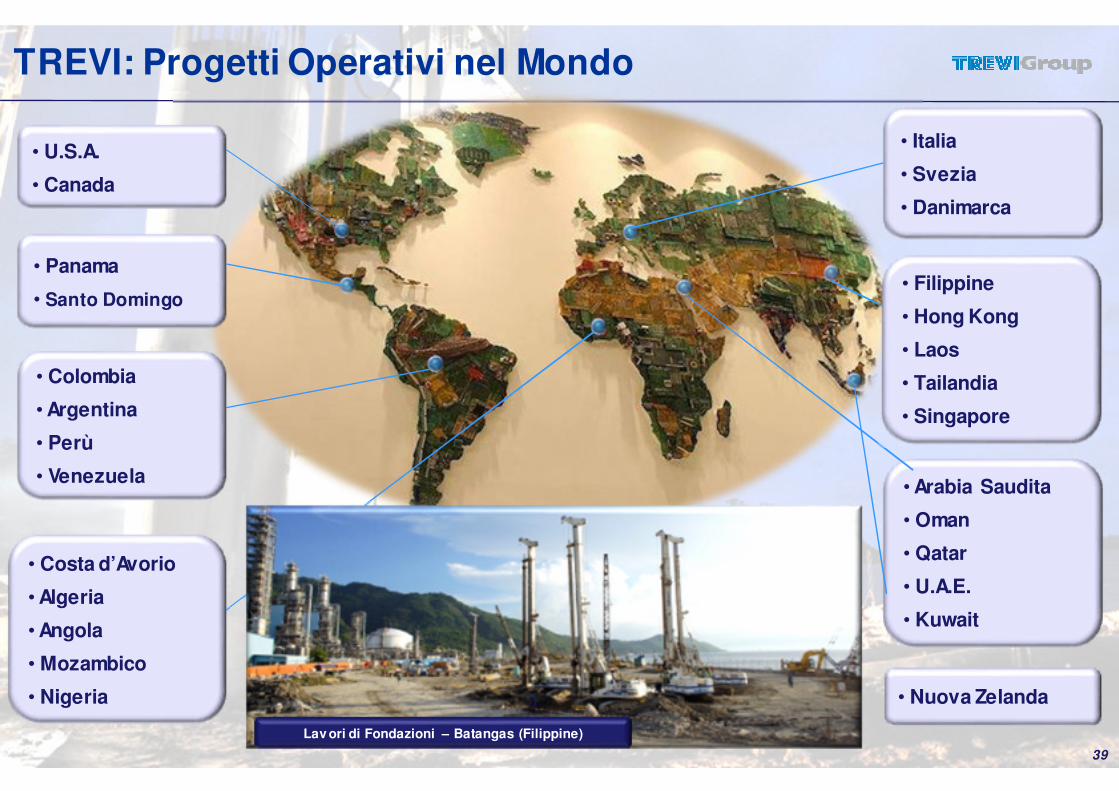
TREVI: Progetti Operativi nel Mondo
• U.S.A.
• Canada
• Panama
• Santo Domingo
• Colombia
• Argentina
• Perù
• Venezuela
• Nuova Zelanda
• Arabia Saudita
• Oman
• Qatar
• U.A.E.
• Kuwait
39
• Italia
• Svezia
• Danimarca
• Filippine
• Hong Kong
• Laos
• Tailandia
• Singapore
• Costa d’Avorio
• Algeria
• Angola
• Mozambico
• Nigeria
Lav ori di Fondazioni – Batangas (Filippine)

40
TREVI: Key Contract Wins
• Bolivar Dam
The US Army Corps of Engineers has awarded the Major Project of Rehabilitation of Bolivar Dam in Ohio
Total contract value $44m
Seepage barrier of approximately 4,500 ft. (1,372 meters) in length and a maximum depth of 144 ft. (44 meters)
Drilling and grouting along an alignment approximately 300 ft. (91 meters) in length by 60 ft. (18 meters) average depth in the left abutment of the dam from the end of the seepage barrier to near the emergency spillway is also required as part of the project

1
MICROPILING HOUSING REAL ESTATE COMMERCIAL
41
SOILMEC: Complete Range of Products
LARGE DIAMETER PILE
CRANES
CFA
ATTACHMENTS
TOOLS&INSTRUMENTS
PUMPS & ANCILLARIES
MICRODRILLING
HYDROMILL & GRABS
MAJOR
WORKS
€6 MLN
250 Ton3 Ton
€100 K
TRENCH CUTTERS
� DRILLING M ATE SYSTEM (DM S)
� REM OTE LIVE WORLDWIDE ASSISTANCE
� OVER 45 OFFICES AROUND THE
WORLD IN 90 COUNTRIES
Value
Capacity

42
SOILMEC: Production – Logistical Network
Brazil
UK
France
North America
Germany
Moscow
Arabia
Misr
EmiratesIndia
ITALY
Bejiing
Japan
Hong Kong
Far East
Australia

43
SOILMEC: Dealers’ Network
Brazil
UK
FranceNorth America
Germania Russia
Arabia
Misr
Emirates
India
ITALY
JapanChina
Far East
Australia
DIRECT RELATIONSHIP WITH DEALERS INCREASES THE VALUE CHAIN
44
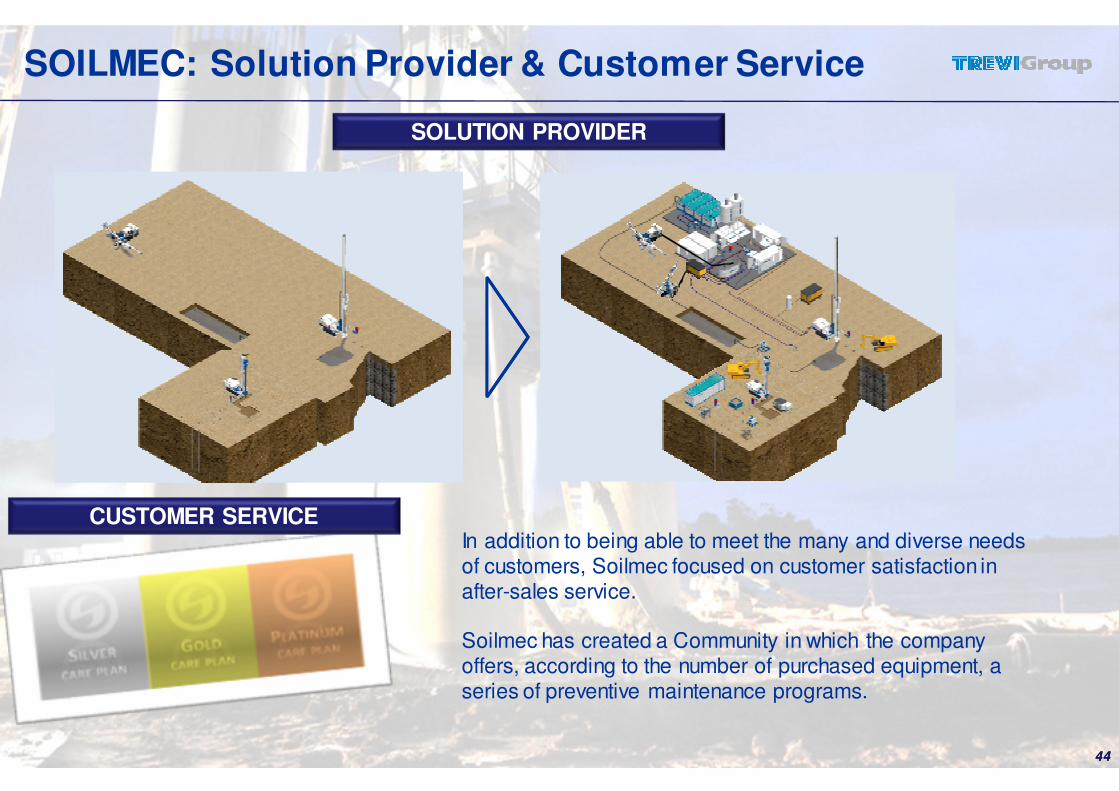
SOILMEC: Solution Provider & Customer Service
44
In addition to being able to meet the many and diverse needs of customers, Soilmec focused on customer satisfaction in after-sales service.
Soilmec has created a Community in which the company offers, according to the number of purchased equipment, a series of preventive maintenance programs.
SOLUTION PROVIDER
CUSTOMER SERVICE

45
SOILMEC: Product Innovation & Rationalization
• RIDUZIONE DELLE RIMANENZE• MANTENIMENTO DEL VOLUME DI VENDITE
• PRODUZIONE MODELLI RICHIESTI
CONTINUA RICERCA E SVILUPPO PER NUOVE SOLUZIONI
� PRESTAZIONI SEMPRE MIGLIORI
� INNOVAZIONE CONTINUA
� SODDISFAZIONE TOTALE DEL
CLIENTE
AZIONI MIRATE

1. TREVI Group
2. FY 2013 Financial Results
3. Foundation Engineering
4. Oil & Gas Focus
5. Appendix
46
Drillmec 1,500 HP

47
The Oil & Gas Market
ENERGY
Fossil Fuels
Hydrocarbons
Gas
Shale Bituminous
OFFSHORE
Platforms
Offshore Drilling Rigs
Jack-ups
Floaters
Semi-subs
ONSHORE
Rigs
Conventional
Hydraulic
WORK OVER
Rigs for existing oil wells
All industrial activities related to the extraction, processing, transportation and marketing of oil
Source: S&P Asset infrastrutture quotate
Oil & Gas MarketInvestments in Exploration
& Production 2014$723 billion +6,1% vs 2013

48
� The O & G market tends to be cyclical, and in recent years has experienced strong growth despite a global landscape of uncertainty
� 2013 was characterized by a number of concerns as the US "fiscal cliff", European uncertainty and a slowdown in the Chinese market
� The average oil price was in line with 2012 109bbl $ 2013 vs. $ 2012 112bbl
� The order books of companies operating in the sector have increased significantly in recent years
� There is great interest at the international level for Shale Gas to Oil Shale and other alternatives to Oil
� The capex related to E & P (Exploration & Production) have increased significantly in recent years
The Oil & Gas market…..in recent years
49
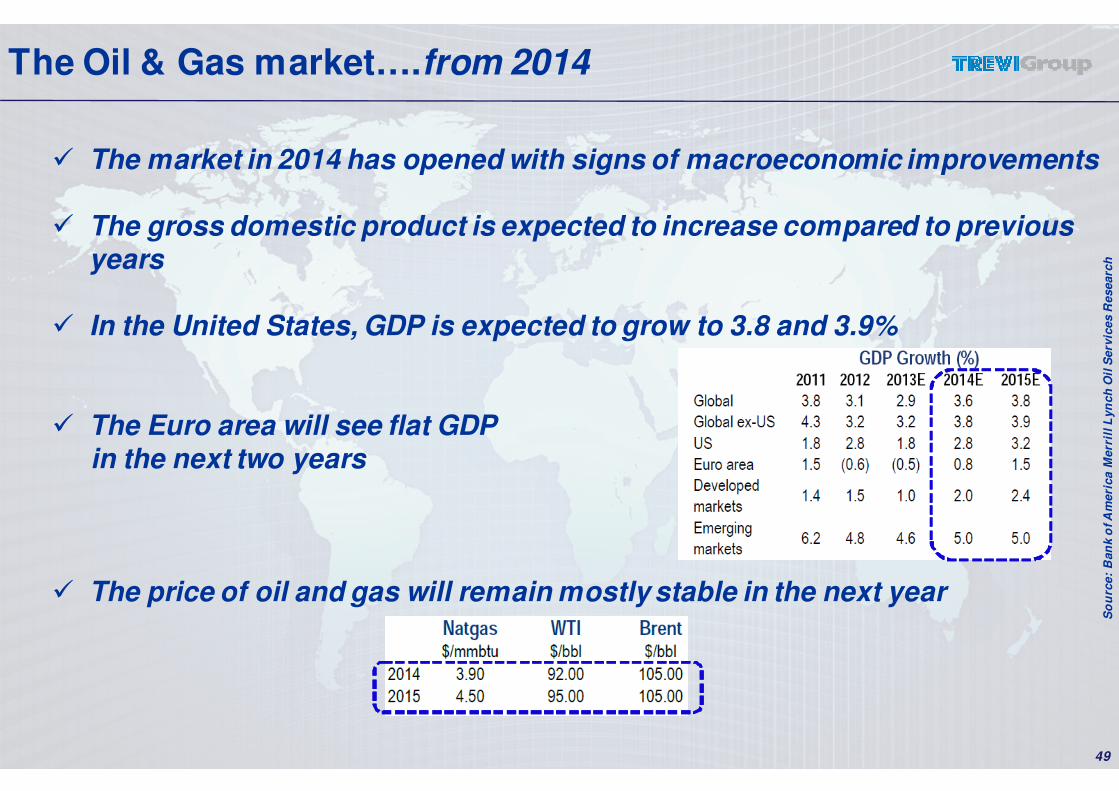
� The market in 2014 has opened with signs of macroeconomic improvements
� The gross domestic product is expected to increase compared to previous years
� In the United States, GDP is expected to grow to 3.8 and 3.9%
� The Euro area will see flat GDPin the next two years
� The price of oil and gas will remain mostly stable in the next year
So
urc
e:
Ban
ko
f A
meri
ca M
err
illL
yn
ch
Oil
Serv
ices R
esearc
h
The Oil & Gas market….from 2014

50
� Investment in E&P (Exploration & Production) in 2014 are expected to increase
� The capital expenditure of the major Oil companies (representing approximately 20% of the total worldwide) will grow about 1% vs. 2013
The E&P worldwide will increase by 4-8% assuming stable oil prices
The E&P in the United States will increase by 5-7% for an increase in drilling activity (increase in activity in the Permian Basin)
The international E&P will increase by 4-8% (Saudi Aramco primary player)
Total expenditure in the offshore market is expected to increase
The D&C* (Drilling & Completion) is expected to increase by 7% So
urc
e:
Ban
ko
f A
meri
ca M
err
illL
yn
ch
Oil
Serv
ices R
esearc
h
*D&C: A subcategory of E &P; specific spending on oil rigs
The Oil & Gas market….E&P Capex

51
So
urc
e:
Ban
ko
f A
meri
ca M
err
illL
yn
ch
Oil
Serv
ices R
esearc
h,
Baker
Hu
gh
es
The Oil & Gas market….Rig Count
3,5173,407
3,547
3,675
OUTLOOK 2014
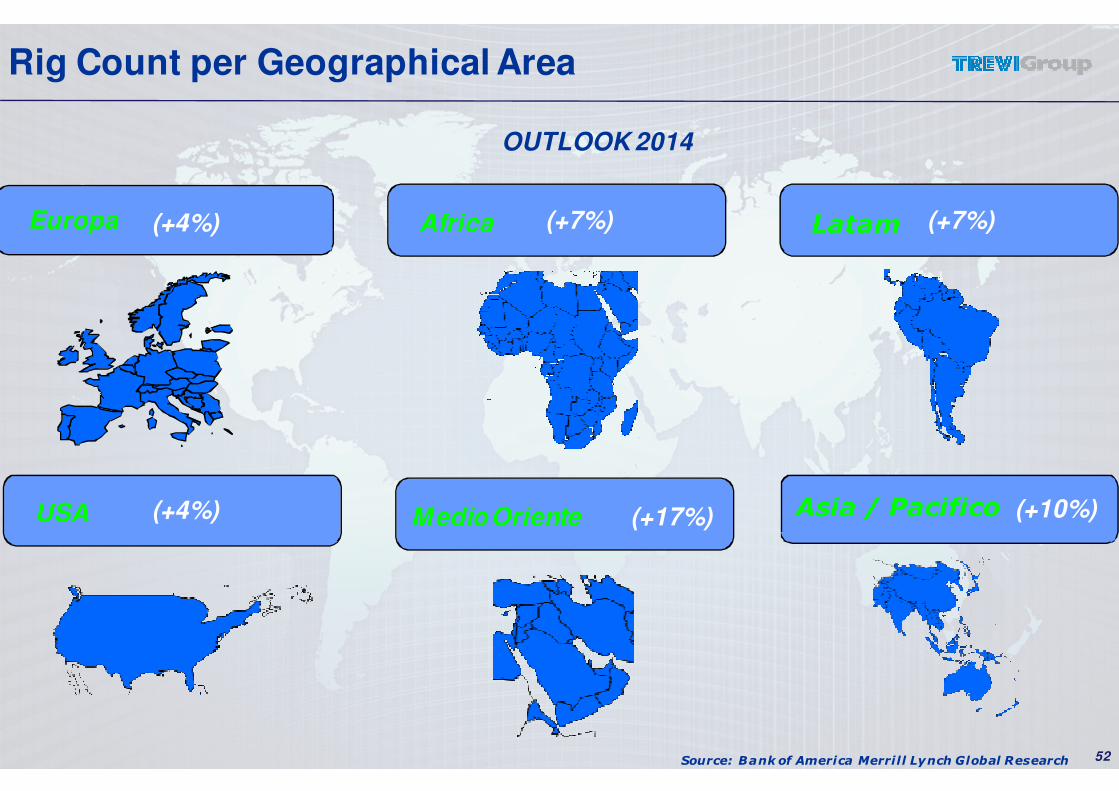
52
Rig Count per Geographical Area
Europa Africa Latam
Source: Bank of America Merrill Lynch Global Research
Asia / PacificoMedio Oriente
(+4%)
USA
(+7%) (+7%)
(+4%) (+17%) (+10%)

53
Worldwide trends in the Oil & Gas markets
Source: Bank of America Merrill Lynch Global Research, Company & Peers analysis
North America
Latin America
� Opportunities in the Gulf of Mexico
� US Shale increased interest
� Increase in the onshore market
� Higher visibility in Brazil
� Innovative Technologies & Solutions
� Increased activities on platform rigs
� Large and complex projects
� Tendering in subsea markets
North Sea
� Increase in the volume of activities
� Good opportunities offshore, subsea &
downstream
Middle East
� Strong investments in West Africa
� New onshore & offshore findings
Africa
� Interest in deep-water
� Development Projects
in Gas
� Minor developments
onshore
Asia Pacific
54Source: IEA World Energy Outlook & Peers analysis
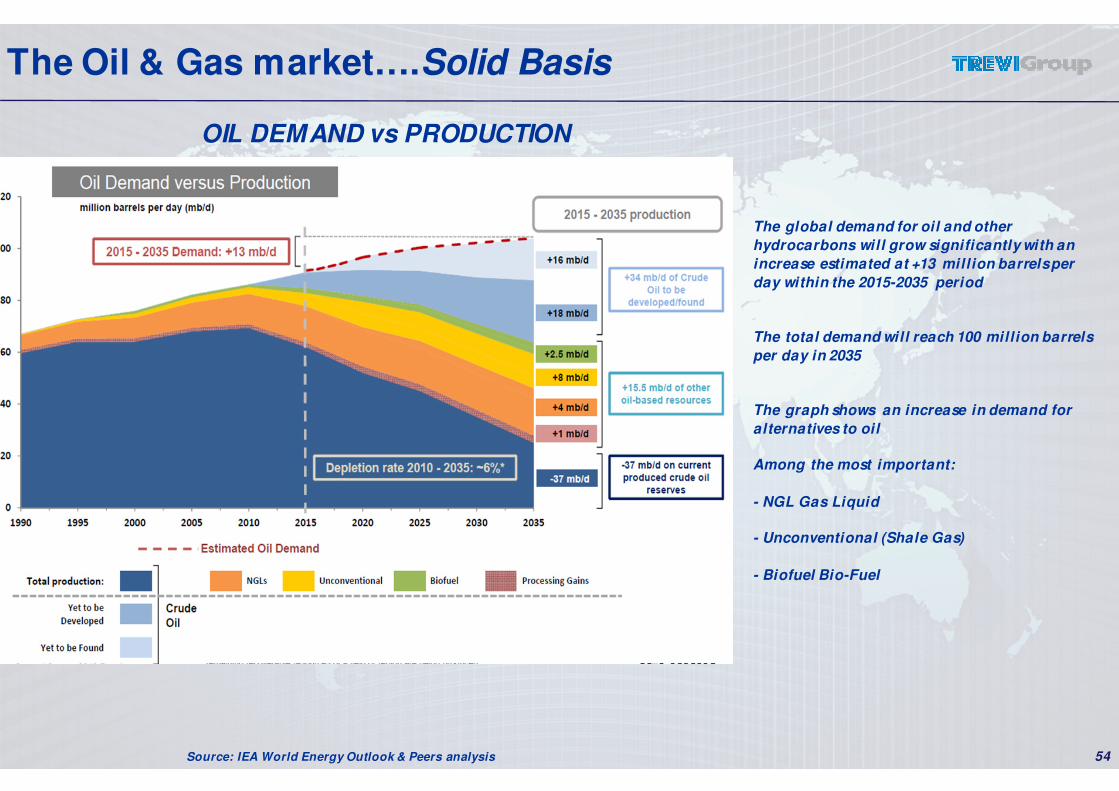
OIL DEMAND vs PRODUCTION
The global demand for oil and other
hydrocarbons will grow significantly with an
increase estimated at +13 million barrels per
day within the 2015-2035 period
The total demand will reach 100 million barrels
per day in 2035
The graph shows an increase in demand for
alternatives to oil
Among the most important:
- NGL Gas Liquid
- Unconventional (Shale Gas)
- Biofuel Bio-Fuel
The Oil & Gas market….Solid Basis

55
DRILLMEC: Strategy
RANGE OF PRODUCT
COSTS MARKETS SEGMENTS
APPROACH TO THE FUTURE
MAIN OPTIONS
� Selected Acquisitions
� JV Agreements
� Internal Development
RELOCATION
� Belarus
� India
� Other Locations
MAIN AREAS
� Russia and CIS
� Far East
� US & Central America
TARGETS
� Modular Rigs
� Deep Water
56
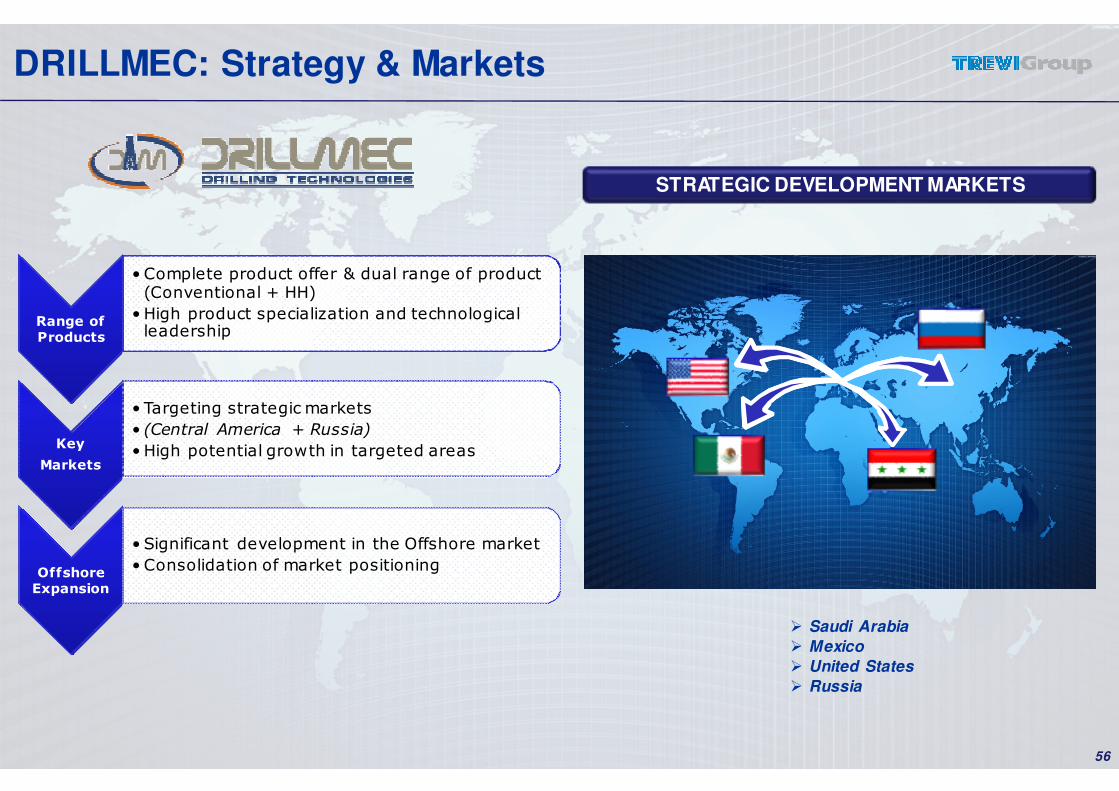
DRILLMEC: Strategy & Markets
Range of Products Range of Products
• Complete product offer & dual range of product (Conventional + HH)
• High product specialization and technological leadership
Key
Markets
Key
Markets
• Targeting strategic markets
• (Central America + Russia)
• High potential growth in targeted areas
Offshore Expansion Offshore
Expansion
• Significant development in the Offshore market
• Consolidation of market positioning
� Saudi Arabia
� Mexico
� United States
� Russia
STRATEGIC DEVELOPMENT MARKETS
57
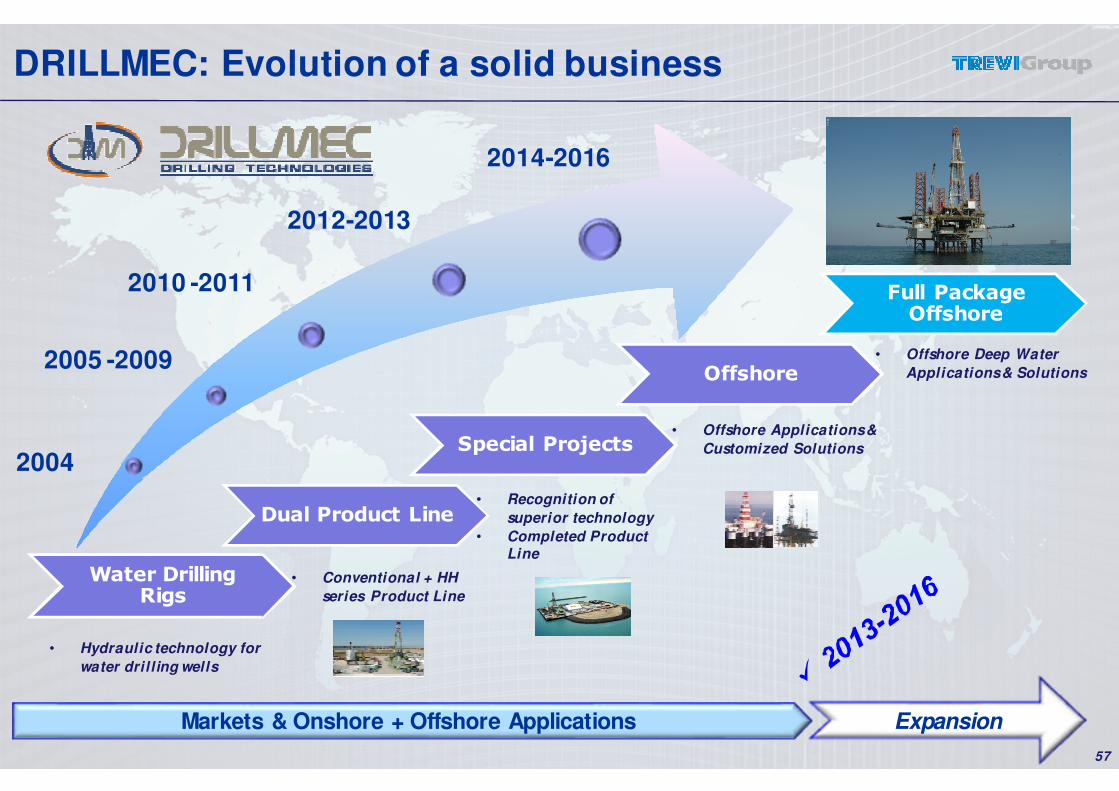
DRILLMEC: Evolution of a solid business
Water Drilling Rigs
Dual Product Line
Special Projects
Offshore
Full Package Offshore
• Hydraulic technology for
water drilling wells
• Conventional + HH
series Product Line
• Offshore Deep Water
Applications & Solutions
Markets & Onshore + Offshore Applications Expansion
2005 -2009
2004
2010 -2011
2012-2013
2014-2016
• Recognition of
superior technology
• Completed Product Line
• Offshore Applications &
Customized Solutions

1
750HP 1,000HP 1,500HP
6
2,000HP 1,500HP 2,000HP 3,000HP
ADVANCED HH NEW GENERATION HH
OF
F-S
HO
RE
ON
-SH
OR
E
DRILLMEC: New product range
HH-75
HH-102
HH-200
HH-220
HH-300HH-750
HH-500
HH-375
REDESIGNED & BRAND NEW
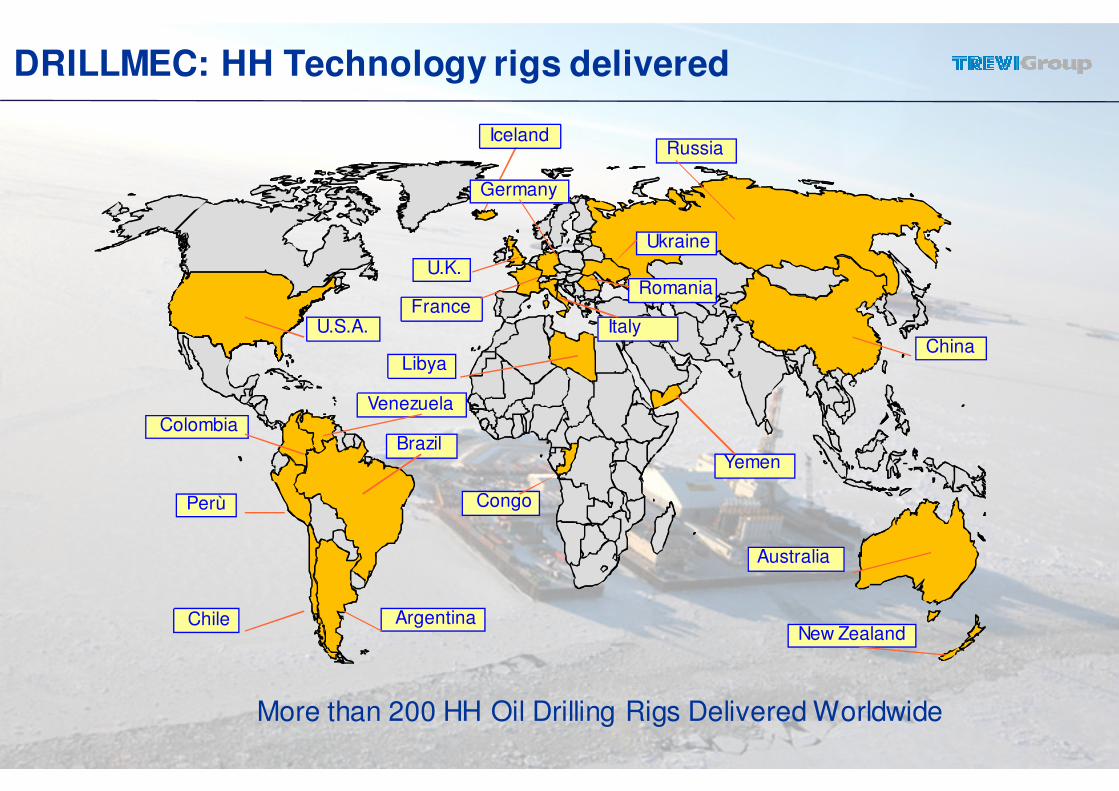
DRILLMEC: HH Technology rigs delivered
IcelandRussia
U.K.
China
France
Libya
U.S.A.
Congo
Australia
Perù
Argentina
BrazilColombia
Chile
Venezuela
Italy
Germany
Yemen
Ukraine
Romania
New Zealand
More than 200 HH Oil Drilling Rigs Delivered Worldwide
60
DRILLMEC: Key Contract Wins
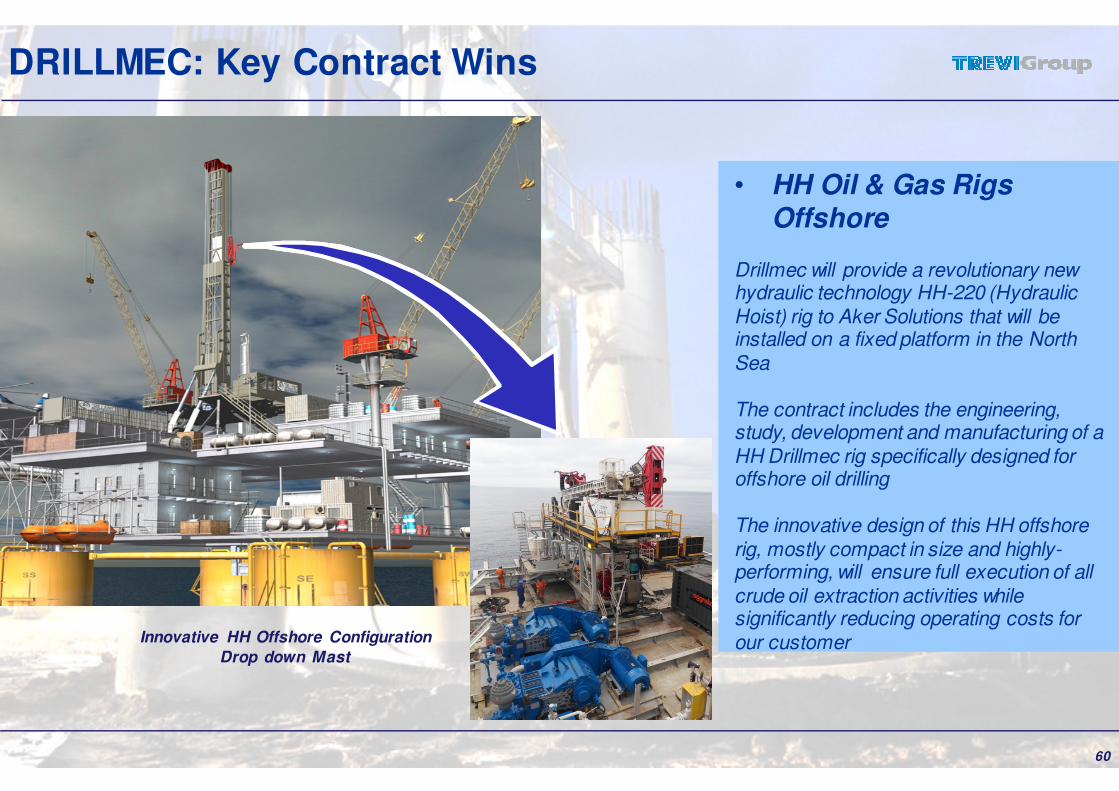
• HH Oil & Gas Rigs Offshore
Drillmec will provide a revolutionary new hydraulic technology HH-220 (Hydraulic Hoist) rig to Aker Solutions that will be installed on a fixed platform in the North Sea
The contract includes the engineering, study, development and manufacturing of a HH Drillmec rig specifically designed for offshore oil drilling
The innovative design of this HH offshore rig, mostly compact in size and highly-performing, will ensure full execution of all crude oil extraction activities while significantly reducing operating costs for our customer Innovative HH Offshore Configuration
Drop down Mast
61
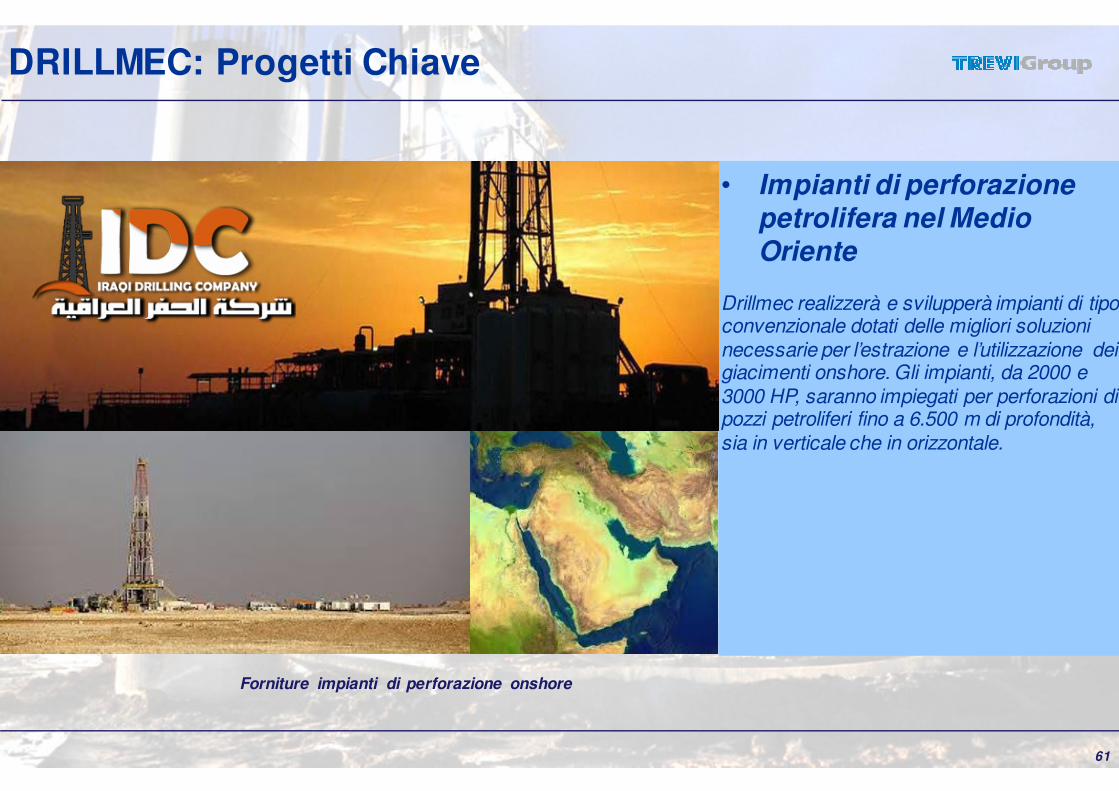
DRILLMEC: Progetti Chiave
• Impianti di perforazionepetrolifera nel Medio Oriente
Drillmec realizzerà e svilupperà impianti di tipo convenzionale dotati delle migliori soluzioni necessarie per l’estrazione e l’utilizzazione dei giacimenti onshore. Gli impianti, da 2000 e 3000 HP, saranno impiegati per perforazioni di pozzi petroliferi fino a 6.500 m di profondità, sia in verticale che in orizzontale.
Forniture impianti di perforazione onshore

62
DRILLMEC: Key Contracts
• 3 HH-300 rigs per PetroJunin
The innovative design of these HH onshore rigs will ensure full execution of all crude oil extraction activities while significantly reducing operating costs for our customer. The HH rigs will be produced and tested at the Drillmecfactories in Piacenza, Italy and Houston, Texas (USA) and will be subsequently transferred and installed in the “Junin 5” oil field located in the Faja del Orinoco in Venezuela, 550 km south-east of Caracas in an area under development, with a capacity of 35 billion barrels of oil.
Drillmec HH-300 onshore
63
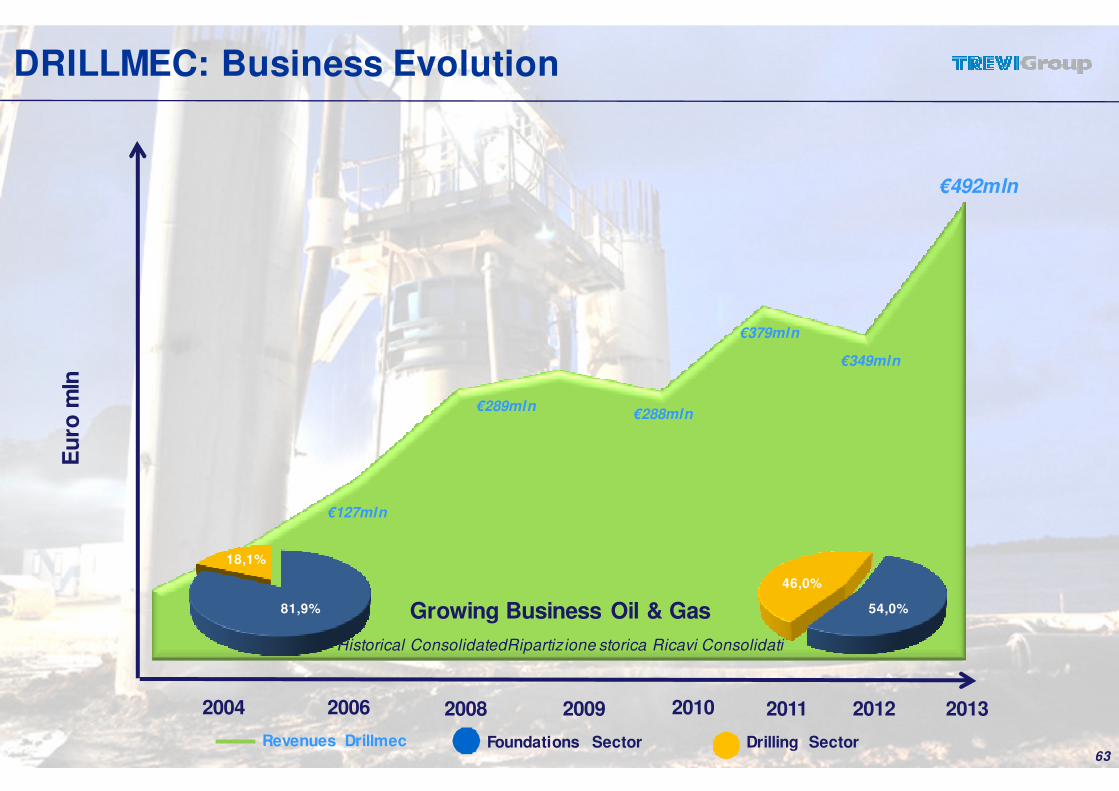
DRILLMEC: Business EvolutionE
uro
mln
2004 2006 2008 20112010
Growing Business Oil & Gas
Historical ConsolidatedRipartizione storica Ricavi Consolidati
Foundations Sector Drilling SectorRevenues Drillmec
€127mln
€289mln€288mln
2012
€379mln
€492mln
2009
81,9%
18,1%
54,0%
46,0%
€349mln
2013
64
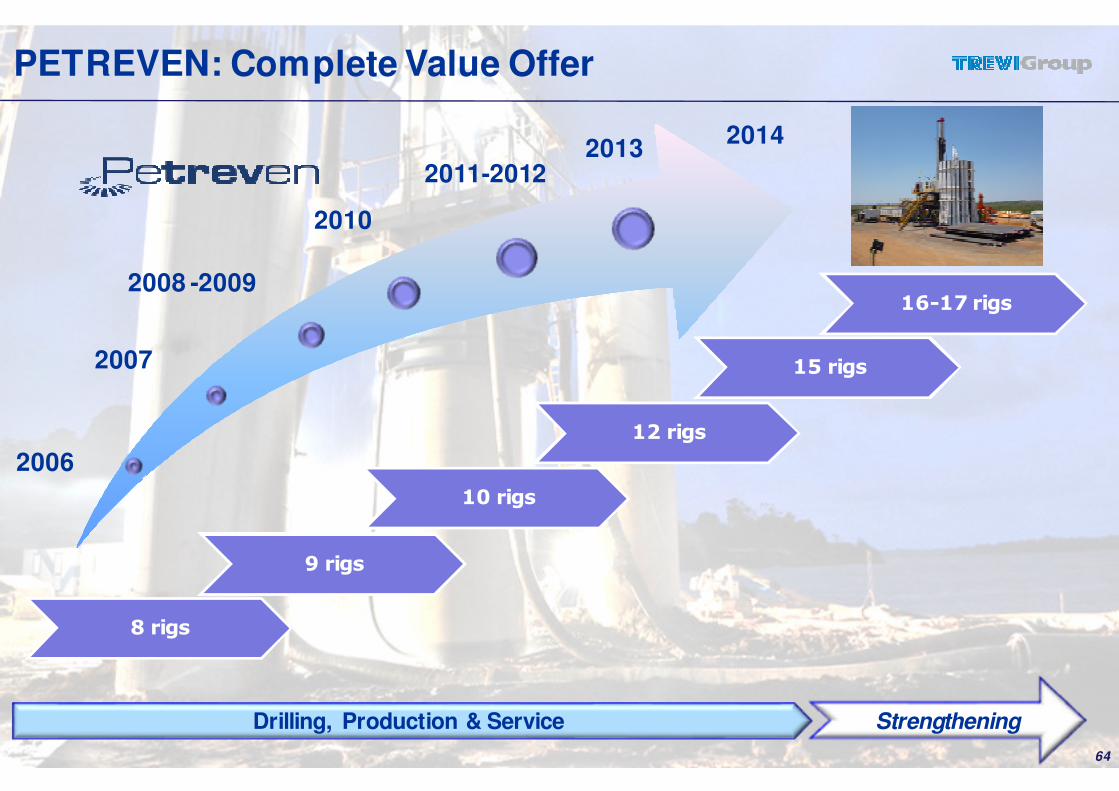
PETREVEN: Complete Value Offer
Drilling, Production & Service Strengthening
2007
2006
2008 -2009
2010
20132011-2012
2014
8 rigs
9 rigs
10 rigs
12 rigs
16-17 rigs
15 rigs

PETREVEN: Diversified Geographical Presence
65
CILE:
1 RIG HH220
1 RIG HH102
2 WO HH102
VENEZUELA:
1 RIG HH200
1 RIG HH300
ARGENTINA:
6 RIGS HH102
1 RIGS HH220PERU’:
1 RIGS HH102
COLOMBIA:
1 RIGS HH102

66
PETREVEN: Progetti Chiave
• Contratto con YPF
Petreven in Argentina, ha siglato un nuovo contratto della durata di tre anni relativo all’impianto di perforazione petrolifera DrillmecHH-102. Il contratto prevede, inoltre, l’estensione per due ulteriori anni e l’inizio delle attività di perforazione nelle prossime settimane.
Forniture impianti Drillmec HH-102 onshore
1. TREVI Group
2. FY 2013 Financial Results
3. Foundation Engineering
4. Oil & Gas Focus
5. Appendix
67
WASHINGTON D.C. New Marriott Hotel
68
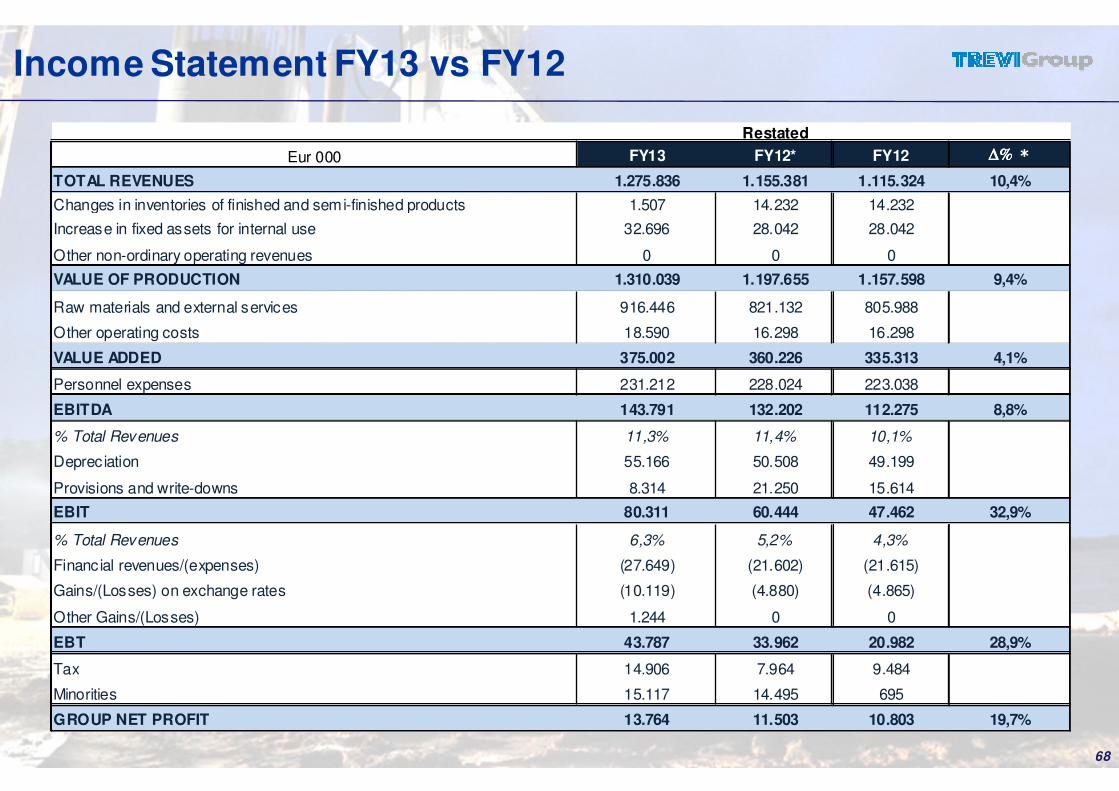
Income Statement FY13 vs FY12
Restated
Eur 000 FY13 FY12* FY12 ∆%∆%∆%∆% *
TOTAL REVENUES 1.275.836 1.155.381 1.115.324 10,4%
Changes in inventories of finished and semi-finished products 1.507 14.232 14.232
Increase in fixed assets for internal use 32.696 28.042 28.042
Other non-ordinary operating revenues 0 0 0
VALUE OF PRODUCTION 1.310.039 1.197.655 1.157.598 9,4%
Raw materials and external services 916.446 821.132 805.988
Other operating costs 18.590 16.298 16.298
VALUE ADDED 375.002 360.226 335.313 4,1%
Personnel expenses 231.212 228.024 223.038
EBITDA 143.791 132.202 112.275 8,8%
% Total Revenues 11,3% 11,4% 10,1%
Depreciation 55.166 50.508 49.199
Provisions and write-downs 8.314 21.250 15.614
EBIT 80.311 60.444 47.462 32,9%
% Total Revenues 6,3% 5,2% 4,3%
Financial revenues/(expenses) (27.649) (21.602) (21.615)
Gains/(Losses) on exchange rates (10.119) (4.880) (4.865)
Other Gains/(Losses) 1.244 0 0
EBT 43.787 33.962 20.982 28,9%
Tax 14.906 7.964 9.484
Minorities 15.117 14.495 695
GROUP NET PROFIT 13.764 11.503 10.803 19,7%

69
Statement of Financial Position FY13 vs FY12
Restated
Eur 000 FY13 FY12* FY12 ∆%∆%∆%∆% *
Fixed assets
- Tangible fixed assets 359.634 347.836 339.471
- Intangible fixed assets 48.271 28.035 28.025
- Financial fixed assets 6.001 8.500 8.479
Net working capital
- Inventories 520.882 493.823 493.317
- Trade receivables 387.902 357.036 345.839
- Trade payables (-) (303.023) (210.573) (209.702)
- Pre-payments (-) (131.842) (153.221) (153.221)
- Other assets (liabilities) 6.904 (3.830) 12.382
Fixed assets plus net working capital 894.728 867.606 864.590 3,1%
Post-employment benefits (-) (20.222) (19.335) (19.335)
NET INVESTED CAPITAL 874.506 848.273 845.255 3,1%
Financed by:
Group net shareholders' funds 405.797 419.261 419.339
Minorities' share of net shareholders ' funds 25.065 28.364 12.549
Total financial indebtedness 443.644 400.648 413.367
TOTAL SOURCES OF FINANCING 874.506 848.273 845.255 3,1%
The Executive in charge of the preparation of accounting documents “Daniele Forti” declares, pursuant toparagraph 2 of article 154-bis of the consolidated law on finance, that the accounting information contained in
this presentation corresponds to the document results, books and accounting records.
This presentation, prepared by TREVI – Finanziaria Industriale SpA, contains forward looking information andstatements about the group and in no case may it be interpreted as an offer or an invitation to sell or purchase
any security issued by the company or its subsidiaries.
These statements include financial projections and estimates and their underlying assumptions, statementsregarding plans, objectives and expectations to future operations, products and services, and statements
regarding future performance.
Forward looking statements involve inherent risks and uncertainties are current only at the date they aremade.
However, the management of TREVI – Finanziaria Industriale SpA believes that the expectations are
reasonable, but, at the same time, points out to holders and investors that all the information and all thestatements are subject to various risk and many of which are very difficult to predict and to control.
TREVI – Finanziaria Industriale SpA does not undertake any obligation to update forward looking statements
to reflect any changes in own expectations with regard thereto or any changes in events.
70
Disclaimer
