president trump's fy 2018 "skinny budget" and the american health care act
TRANSCRIPT

CRFB.org

CRFB.org
President Trump’s FY 2018 “Skinny Budget” Proposal
1

CRFB.org
FY 2018 Defense Hikes Paid For With Non-Defense Cuts
2

CRFB.org
Non-Defense Reductions Would Affect Most Agencies
3
CRFB.org
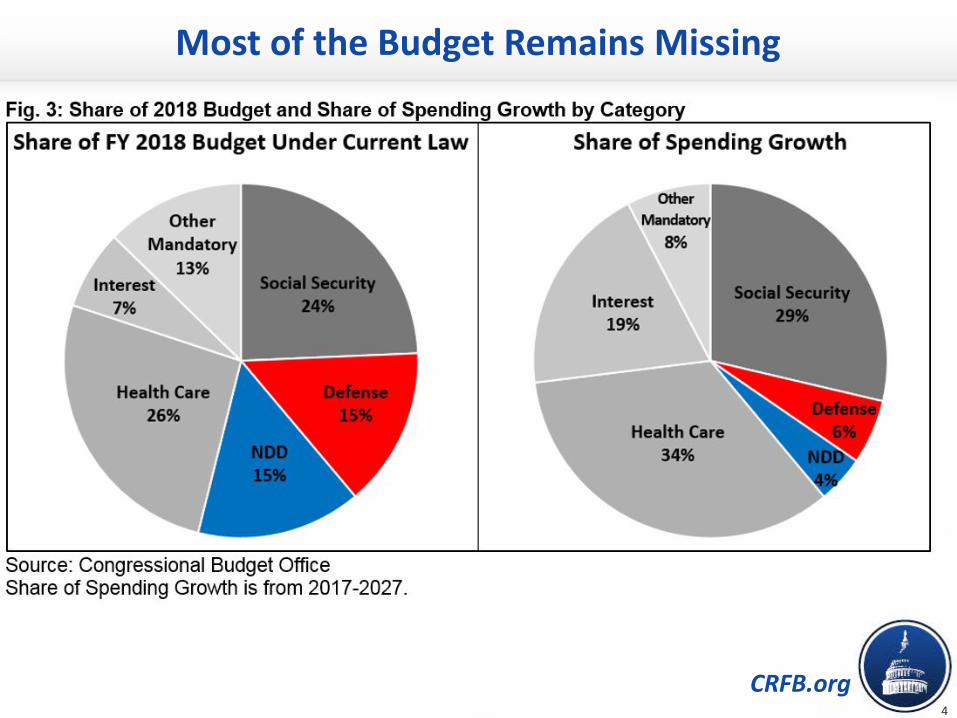
Most of the Budget Remains Missing
4

CRFB.org
The American Health Care Act
5

CRFB.org
Budgetary Effects of the AHCA
Source: CRFB calculations based on CBO AHCA score.
Billions of Dollars
Net Cost ofCoverageProvisionsRepeal ACA Subsidies
-$673B
Repeal Mandate Penalties$210B
-$337B
Medicaid Savings-$880B
Repeal ACA Taxes$575B
Other/Interactions-$111B
Promote Coverage$542B
-$2,000
-$1,500
-$1,000
-$500
$0
$500
$1,000
$1,500
$2,000Savings Costs Total Deficit Impact
$1.33T
-$1.66T
6

CRFB.orgSource: CRFB calculations based on CBO AHCA score
Provision 2017-2026 Cost/Savings (-)Reduce Individual Mandate Penalty to $0 $171 billionReduce Employer Mandate Penalty to $0 $38 billionSubtotal, End Mandate Penalties $210 billion
Repeal ACA Premium and Cost-Sharing Subsidies in 2020 -$673 billionReduce ACA Medicaid Match to Base Medicaid Rate for “Expansion” Beneficiaries and Establish Per-Capita Caps -$880 billion
Other Reductions -$41 billionCoverage Interactions -$70 billionSubtotal, Reduce Spending and Tax Subsidies -$1.66 trillion
Establish Flat Age-Adjusted Health Care Tax Credits in 2020 $361 billionEstablish Patient and State Stability Fund $80 billionRepeal Disproportionate Share Hospital Payment Cuts (Medicare & Medicaid) $74 billion
Expand Health Savings Accounts $19 billionOther Costs $8 billionSubtotal, Increase Spending and Tax Subsidies $542 billion
Repeal ACA 3.8% Net Investment Income Tax (NIIT) $158 billionRepeal ACA Health Insurer Tax $145 billionRepeal ACA Medicare Hospital Insurance 0.9% Surtax $117 billionDelay ACA “Cadillac Tax” Start Date from 2020 to 2025 $49 billionRepeal Most Other ACA Tax Increases $106 billionSubtotal, Repeal ACA Taxes $575 billion
Total Deficit Impact (Conventional Scoring) -$337 billion
7

CRFB.org
Change in Coverage Under AHCA
8
-7M
-3M
-14M
-24M-30
-25
-20
-15
-10
-5
0
5
Employer Non-Group/Exchange Medicaid Insured
Millions of People in 2026
Source: CBO. Note: non-group includes Basic Health Plan.

CRFB.org
Federal Reserve Raises Interest Rates:What does that mean for the debt?
9

CRFB.org
0.0%
1.0%
2.0%
3.0%
4.0%
5.0%
6.0%
7.0%
1996 1999 2002 2005 2008 2011 2014 2017 2020 2023 2026
Projected
10-Year Treasury Yield
3-MonthTreasury Yield
Percent Yield
Historic and Projected Interest Rates
Source: CBO January 2017 Baseline, Federal Reserve10

CRFB.org
$229 $223 $241$270
$295$332
$380
$435
$492
$550
$604
$657
$714
$768
$0
$100
$200
$300
$400
$500
$600
$700
$800
$900
2014 2015 2016 2017 2018 2019 2020 2021 2022 2023 2024 2025 2026 2027
Billions of Dollars
Net Interest in the CBO Baseline
Source: CBO January 2017 Baseline, CRFB Calculations11