priest rapids hatchery monitoring and evaluation annual ...priest rapids hatchery monitoring and...
TRANSCRIPT
Priest Rapids Hatchery Monitoring and Evaluation
Annual Report for 2015-16
Steven P. Richards
Washington Department of Fish & Wildlife
And
Todd N. Pearsons
Public Utility District Number 2 of Grant County, Washington
October 24, 2016

This report should be cited as:
Richards, S. P. and T. N. Pearsons. 2016. Priest Rapids Hatchery Monitoring and Evaluation
Annual Report for 2015-16. Public Utility District Number 2 of Grant County, Ephrata, Washington.
© 2016, PUBLIC UTILITY DISTRICT NO. 2 OF GRANT COUNTY, WASHINGTON.
ALL RIGHTS RESERVED UNDER U.S. AND FOREIGN LAW, TREATIES AND CONVENTIONS.
i
Executive Summary
This report is the fifth annual report dedicated to monitoring and evaluating the Priest Rapids
Hatchery (PRH) production of fall Chinook salmon. The PRH is located below Priest Rapids
Dam adjacent to the Columbia River and has been in operation since 1963. The monitoring and
evaluation program associated with PRH consists of nine objectives and is intended to evaluate
the performance of the program in meeting hatchery and natural production goals. This report is
intended to be cumulative, but also focus attention on the most recent year of data collection and
production (2015-2016).
The PRH was originally built to mitigate for the construction and operation of Priest Rapids and
Wanapum dams. The hatchery is operated as an integrated program for the purpose of increasing
harvest while limiting undesirable risks to the naturally spawning population. The hatchery
produces 5.6 million subyearling fall Chinook salmon for Public Utility District No. 2 of Grant
County, Washington’s (GPUD) mitigation requirement and 1.7 million subyearling fall Chinook
salmon under contract with the United States Army Corps of Engineers for mitigation for the
construction and operation of John Day Dam. These fish contribute significantly to a variety of
fisheries, such as fisheries off the coasts of Alaska and Canada and fisheries in the Columbia
River.
The estimated total escapement of fall Chinook salmon to the Hanford Reach in 2015 was
266,327 fish. This is the third consecutive record high escapement and substantially higher than
average historic abundances. The historical mean and median escapement for 1991 through 2015
is 73,550 and 55,208 fish, respectively.
The 2015 returns to PRH volunteer trap totaled 63,978 fall Chinook salmon, the second highest
on record and less than the 2014 record returns of 77,779. A total of 6,133 fish that returned to
the volunteer trap at PRH were ponded at the hatchery for broodstock. An additional 524 fish
were ponded from the Angler Broodstock Collection (ABC) fishery and 467 fish were ponded
from Priest Rapids Dam Off Ladder Adult Fish Trap (OLAFT) in an effort to increase the
number of natural-origin broodstock. In total, 5,524 fish were spawned to meet egg take goals for
multiple hatchery programs. The mortality rate of ponded adult fish was 17% which is lower
than recent years: this value includes fish from all broodstock sources. The volunteer trap was
operated nearly daily from September 9 through December 1 with the majority of fish removed
from the trap by each afternoon. Most of the fish that were surplus to broodstock needs were
provided to food-banks.
There were a number of similarities and differences of hatchery and natural origin fall Chinook
salmon. The hatchery origin fish appeared to return at a younger age than natural origin fish. The
size at maturity data for recent brood years suggest there are virtually no difference in fork
lengths between natural and hatchery origin fish at age-3 and 4 and perhaps slight differences in
fork lengths for age-2 and 5 males. The number of eggs, egg size, and egg mass produced by
hatchery and natural origin females of similar length was similar. With the exception of one year,
egg retention in female carcasses in the Hanford Reach has been low.
Hatchery origin fish released from PRH spawned throughout the Hanford Reach. In addition, the
hatchery origin proportions of spawners relative to total spawners in the different sections of the
Hanford Reach were similar. Recent evidence suggested that adult carcasses drift downstream of
their spawning location and bias the estimated spawning distribution downstream. Stray rates
into other populations appeared to be low based upon coded-wire tag recoveries and PIT tag
© 2016, PUBLIC UTILITY DISTRICT NO. 2 OF GRANT COUNTY, WASHINGTON.
ALL RIGHTS RESERVED UNDER U.S. AND FOREIGN LAW, TREATIES AND CONVENTIONS.
ii
detections of PRH adults in the Snake River were also low. However, there have been notable
numbers of PIT tag detections of PRH adults above Priest Rapids Dam.
The PRH continued to contribute substantially to ocean and Columbia River fisheries and to
have higher adult recruitment rates than the natural spawning fall Chinook salmon in the Hanford
Reach of the Columbia River. Adult recruitment rate of brood year 2009 for PRH was the
highest that has been observed (26.92) for this program and was substantially higher than the fish
spawning in the Hanford Reach (3.97).
PRH origin fish were estimated to make up 7.6% of the natural spawning population in the
Hanford Reach during 2015. All hatchery fish combined (including fish released from Ringold
Hatchery and strays from outside the Hanford Reach) comprised 9.7% of the fall Chinook
salmon on the spawning grounds. Otolith recoveries at the PRH volunteer trap indicated that a
very high percentage of fish returning to the PRH were of PRH origin. The proportion of natural
influence (PNI) for Hanford Reach fall Chinook salmon including all hatcheries was 0.762 in
2015. This value was calculated using a gene flow model based on the Ford model and exceeded
the PNI target of 0.67 for the second consecutive year. Additional natural origin broodstock for
PRH was collected at the Priest Rapids Dam OLAFT and from the ABC fishery. These
additional fish increased the proportion of natural origin broodstock from 0.081 to 0.179. Adult
management of fish at the PRH volunteer trap and alternative broodstock collection techniques
to increase natural origin fish in the broodstock have contributed to improvements in PNI for the
PRH program.
© 2016, PUBLIC UTILITY DISTRICT NO. 2 OF GRANT COUNTY, WASHINGTON.
ALL RIGHTS RESERVED UNDER U.S. AND FOREIGN LAW, TREATIES AND CONVENTIONS.
iii
Table of Contents
1.0 Introduction ......................................................................................................................... 1
2.0 Objectives ........................................................................................................................... 3
3.0 Project Coordination ........................................................................................................... 3
4.0 Life History – Hanford Reach Fall Chinook Salmon ......................................................... 4
5.0 Sample Size Considerations ................................................................................................ 4
6.0 Current Operation of Priest Rapids Hatchery ..................................................................... 5
7.0 Origin of Adult Returns to Priest Rapids Hatchery ............................................................ 7
Origin Based on Hatchery Marks ....................................................................................... 7
Origin Based on Coded-Wire Tag Recoveries.................................................................... 9
8.0 Broodstock Collection and Sampling ............................................................................... 10
Broodstock Age Composition ........................................................................................... 11
Length by Age Class of Broodstock ................................................................................. 13
Gender Ratios.................................................................................................................... 14
Fecundity........................................................................................................................... 15
9.0 Hatchery Rearing .............................................................................................................. 19
Number of eggs taken ....................................................................................................... 19
Number of acclimation days ............................................................................................. 19
Annual Releases, Tagging and Marking ........................................................................... 20
Fish Size and Condition at Release ................................................................................... 23
Survival Estimates ............................................................................................................ 24
Juvenile PIT Tag Detections at the Priest Rapids Hatchery Array ................................... 25
10.0 Adult Fish Pathogen Monitoring ...................................................................................... 27
11.0 Juvenile Fish Health Inspections ...................................................................................... 28
12.0 Redd Surveys .................................................................................................................... 29
Hanford Reach Aerial Redd Counts ................................................................................. 29
Redd Distribution .............................................................................................................. 30
Spawn Timing ................................................................................................................... 31
Escapement ....................................................................................................................... 31
Hatchery Discharge Channel Redd Counts....................................................................... 32
13.0 Carcass Surveys ................................................................................................................ 32
Hanford Reach Carcass Survey: Section 1 – 5 ................................................................. 34
Proportion of Escapement Sampled: Section 1 – 5 ............................................... 34
© 2016, PUBLIC UTILITY DISTRICT NO. 2 OF GRANT COUNTY, WASHINGTON.
ALL RIGHTS RESERVED UNDER U.S. AND FOREIGN LAW, TREATIES AND CONVENTIONS.
iv
Carcass Distribution and Origin............................................................................ 35
Priest Rapids Dam Pool Carcass Survey: Section 6 ......................................................... 38
Number sampled: Section 6 .................................................................................. 38
Proportion of Escapement Sampled: Section 6 ..................................................... 38
Carcass Origin: Section 6...................................................................................... 38
Hatchery Discharge Channel: Sections 7 and 8 Carcass Survey ...................................... 39
Number sampled: Sections 7 and 8 ....................................................................... 40
Proportion of Escapement Sampled: Sections 7 and 8 ......................................... 40
Carcass Distribution and Origin: Sections 7 and 8 ............................................... 40
14.0 Life History Monitoring .................................................................................................... 41
Migration Timing .............................................................................................................. 42
Age at Maturity ................................................................................................................. 44
Size at Maturity ................................................................................................................. 47
Gender Composition for Adult Escapement ..................................................................... 49
Spawn Success .................................................................................................................. 50
15.0 Contribution to Fisheries................................................................................................... 51
16.0 Straying ............................................................................................................................. 54
17.0 Genetics............................................................................................................................. 58
18.0 Proportion of Natural Influence ........................................................................................ 58
Estimates of pNOB ........................................................................................................... 58
Estimates of pHOS ............................................................................................................ 60
Estimates of PNI ............................................................................................................... 61
19.0 Natural and Hatchery Replacement Rates ........................................................................ 63
20.0 Smolt-to-Adult Survivals .................................................................................................. 64
21.0 ESA/HCP Compliance ...................................................................................................... 66
Broodstock Collection ...................................................................................................... 66
Hatchery Rearing and Release .......................................................................................... 67
Distribution of Surplused, Mortalities, and Spawned, Adult fall Chinook Salmon from
Priest Rapids Hatchery ...................................................................................................... 67
Hatchery Effluent Monitoring........................................................................................... 68
Ecological Risk Assessment ............................................................................................. 68
22.0 Acknowledgments............................................................................................................. 68
Literature Cited ............................................................................................................................. 69
© 2016, PUBLIC UTILITY DISTRICT NO. 2 OF GRANT COUNTY, WASHINGTON.
ALL RIGHTS RESERVED UNDER U.S. AND FOREIGN LAW, TREATIES AND CONVENTIONS.
v
List of Figures
Figure 1 Location of Priest Rapids and Ringold Springs hatcheries and the Hanford Reach
(indicated by stars). ................................................................................................. 2
Figure 2 Priest Rapids Hatchery facility and Priest Rapids Dam OLAFT. ........................... 2
Figure 3 Weekly first detections of upstream passage of unique PRH origin PIT tagged
adult Chinook salmon at the PIT tag array located in the Priest Rapids Hatchery
discharge channel, 2015. ......................................................................................... 6
Figure 4 Linear relationship between fecundity and fork length for combined samples of
natural and hatchery origin fall Chinook salmon spawned at Priest Rapids
Hatchery, Return Years 2013 - 2015 .................................................................... 16
Figure 5 Fecundity versus fork length for natural and hatchery origin fall Chinook salmon
sub-sampled at Priest Rapids Hatchery, Return Years 2013 - 2015 ..................... 17
Figure 6 Mean egg weight versus fork length for natural and hatchery origin fall Chinook
salmon sub-sampled at Priest Rapids Hatchery, Return Years 2013 – 2015 ........ 18
Figure 7 Total egg mass weight versus fork length for natural and hatchery origin fall
Chinook salmon sub-sampled at Priest Rapids Hatchery, Return Years 2013 -
2015....................................................................................................................... 18
Figure 8 Distribution of fall Chinook salmon redd counts by location for the 2015 aerial
surveys in the Hanford Reach, Columbia River (Data provided by Mission
Support Alliance) .................................................................................................. 30
Figure 9 Locations of aerial redd index areas and river survey sections in the Hanford
Reach..................................................................................................................... 33
List of Tables
Table 1 Source and disposition of Chinook salmon collected for broodstock at Priest
Rapids Hatchery, Return Year 2015. ...................................................................... 5
Table 2 Total fish handled, numbers sampled, and proportions of hatchery and natural
origin Chinook salmon collected at Priest Rapids Hatchery, Priest Rapids Dam
Off-Ladder Adult Fish Trap, and Angler Broodstock Collection fishery. Origin
determined by otolith thermal marks, presence of coded-wire tags, and/or adipose
clips, Brood Years 2013 - 2015 .............................................................................. 8
Table 3 Estimated numbers of hatchery and natural origin Chinook salmon collected at
Priest Rapids Hatchery, Priest Rapids Dam Off-Ladder Adult Fish Trap, and
Angler Broodstock Collection fishery. Origin determined by otolith thermal
marks, presence of coded-wire tags, and/or adipose clips, Brood Years 2013 -
2015......................................................................................................................... 9
Table 4 Estimated proportion of hatchery and natural origin adult Chinook salmon
returning to the Priest Rapids Hatchery volunteer trap based on coded-wire tag
expansion. The entire collection was sampled for coded-wire tags, Return Years
2005 - 2015 ........................................................................................................... 10

© 2016, PUBLIC UTILITY DISTRICT NO. 2 OF GRANT COUNTY, WASHINGTON.
ALL RIGHTS RESERVED UNDER U.S. AND FOREIGN LAW, TREATIES AND CONVENTIONS.
vi
Table 5 Age composition for hatchery and natural origin fall Chinook salmon spawned at
Priest Rapids Hatchery (includes all sources of broodstock), Return Years 2007 –
2015. Proportions calculated from expanded age composition by origin for each
source of broodstock to account for differing sample rates. ................................. 11
Table 6 Age composition for hatchery and natural origin fall Chinook broodstock
collected form the Priest Rapids Hatchery volunteer trap, Return Years 2012 -
2015....................................................................................................................... 12
Table 7 Age composition for hatchery and natural origin fall Chinook salmon broodstock
collected from the Off Ladder Adult Fish Trap at Priest Rapids Dam, Return
Years 2012 - 2015 ................................................................................................. 12
Table 8 Age composition for hatchery and natural origin fall Chinook salmon broodstock
collected from Angler Broodstock Collection, Return Years 2012 – 2015 .......... 13
Table 9 Mean fork length (cm) at age (total age) of fall Chinook salmon sampled from
each source of broodstock spawned at Priest Rapids Hatchery, Return Year 2015.
N = sample size and SD = 1 standard deviation. .................................................. 13
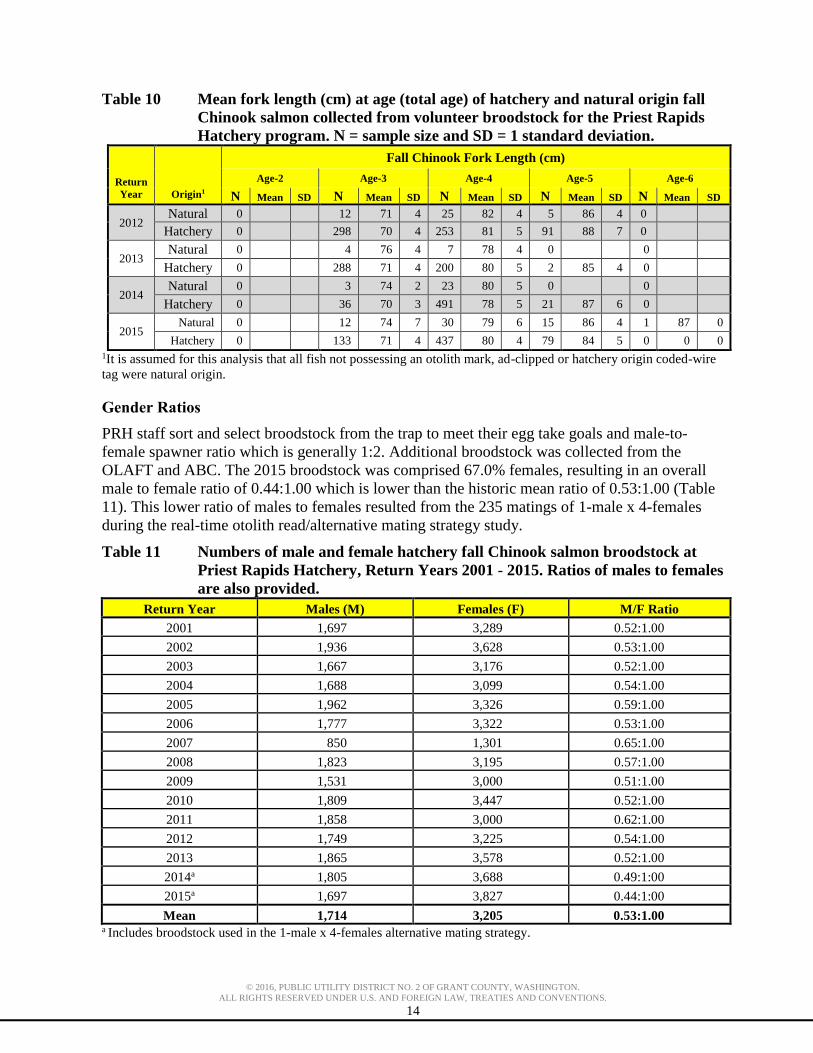
Table 10 Mean fork length (cm) at age (total age) of hatchery and natural origin fall
Chinook salmon collected from volunteer broodstock for the Priest Rapids
Hatchery program. N = sample size and SD = 1 standard deviation. ................... 14
Table 11 Numbers of male and female hatchery fall Chinook salmon broodstock at Priest
Rapids Hatchery, Return Years 2001 - 2015. Ratios of males to females are also
provided. ............................................................................................................... 14
Table 12 Mean fecundity of fall Chinook salmon collected for broodstock at Priest Rapids
Hatchery, Return Years 2001 - 2015 .................................................................... 15
Table 13 Mean fecundity at age for fall Chinook salmon sampled at the Priest Rapids
Hatchery, Return Years 2010 – 2015. N = sample size and SD = 1 standard
deviation. ............................................................................................................... 17
Table 14 Numbers of eggs taken from fall Chinook salmon broodstock collected at Priest
Rapids Hatchery, Return Years 1984 - 2014 ........................................................ 19
Table 15 Number of days fall Chinook salmon fry were reared at Priest Rapids Hatchery
prior to release, Brood Year 2015 ......................................................................... 20
Table 16 Numbers of marked, unmarked, and tagged fall Chinook salmon smolts released
from Priest Rapids Hatchery, Brood Years 1977 – 2015...................................... 22
Table 17 Mean length (FL, mm), weight (g and fish/pound), and coefficient of variations
(CV) of fall Chinook smolts released from Priest Rapids Hatchery, Brood Years
1991 - 2015. .......................................................................................................... 23
Table 18 Hatchery life-stage survival rates (%) for fall Chinook salmon at Priest Rapids
Hatchery, brood years 1989 – 2015. ..................................................................... 24
Table 19 Number of sub-yearlings PIT tagged, mark and release dates, and the number of
unique tags detected at the array in the Priest Rapids discharge channel, Brood
Years 2011 - 2015. ................................................................................................ 26

© 2016, PUBLIC UTILITY DISTRICT NO. 2 OF GRANT COUNTY, WASHINGTON.
ALL RIGHTS RESERVED UNDER U.S. AND FOREIGN LAW, TREATIES AND CONVENTIONS.
vii
Table 20 Viral inspections of fall Chinook salmon broodstock at Priest Rapids Hatchery,
Return Years 1991 - 2015 ..................................................................................... 27
Table 21 ELISA test results to determine risk of bacterial kidney disease of adult female
fall Chinook salmon broodstock at Priest Rapids Hatchery, Return Years 2008 –
2015....................................................................................................................... 28
Table 22 Juvenile fish health inspections for Priest Rapids Hatchery fall Chinook salmon,
Brood Years 2006 - 2015 ...................................................................................... 28
Table 23 Summary of fall Chinook salmon peak redd counts for the 1948 – 2015 aerial
surveys in the Hanford Reach, Columbia River. .................................................. 29
Table 24 Number of fall Chinook salmon redds counted in difference reaches on the
Hanford Reach area of the Columbia River during the October 2015 through
November 2015 aerial redd counts. (Data provided by Mission Support Alliance)
............................................................................................................................... 30
Table 25 Calculation of escapement estimates for fall Chinook salmon in the Hanford
Reach, Return Year 2015 ...................................................................................... 31
Table 26 Escapement for fall Chinook salmon in the Hanford Reach, Return Years 1991 –
2015....................................................................................................................... 32
Table 27 Numbers and Percentages of fall Chinook salmon carcasses sampled within each
survey section and of the total escapement on the Hanford Reach, Return Years,
2010 - 2015. .......................................................................................................... 34
Table 28 Number of carcass surveys conducted by section in the Hanford Reach, Return
Years 2010 – 2015. ............................................................................................... 34
Table 29 Number of redds and carcasses, total spawning escapement, and proportion of
escapement sampled for fall Chinook salmon in Section 1 through 5 of the
Hanford Reach, Return Year 2015. ....................................................................... 35
Table 30 Numbers of natural and hatchery origin fall Chinook salmon carcasses sampled
within Sections 1 through 5 of Hanford Reach based on expansions of coded-wire
tag recoveries, Return Years 2010 - 2015 ............................................................. 36
Table 31 Origin of Chinook salmon carcasses recovered in the Hanford Reach by section
based on recoveries of marked and unmarked carcasses within the biological
sample, Return Years 2012 - 2015. ....................................................................... 37
Table 32 Number of fall Chinook salmon carcasses sampled within Section 6 (Priest
Rapids Dam Pool). ................................................................................................ 38
Table 33 Carcasses sampled, total spawning escapement and proportion of escapement for
fall Chinook salmon in Section 6 (Priest Rapids Dam Pool), return years 2010 -
2015....................................................................................................................... 38
Table 34 Origin of fall Chinook salmon spawning in Section 6 (Priest Rapids Dam Pool),
Return Years 2012 - 2015 ..................................................................................... 39
Table 35 The number of fall Chinook salmon carcass surveys within Section 7 (Priest
Rapids Hatchery Discharge Channel) and Section 8 (Columbia River at the
confluence of the hatchery discharge channel). .................................................... 40
© 2016, PUBLIC UTILITY DISTRICT NO. 2 OF GRANT COUNTY, WASHINGTON.
ALL RIGHTS RESERVED UNDER U.S. AND FOREIGN LAW, TREATIES AND CONVENTIONS.
viii
Table 36 Number of carcasses sampled, total spawning escapement and proportion of
escapement sampled for fall Chinook salmon within Section 7 (Priest Rapids
Hatchery Discharge Channel) and Section 8 (Columbia River at confluence of the
hatchery discharge channel), Return Year 2015 ................................................... 40
Table 37 The origin of Chinook salmon carcasses recovered within Section 7 (Priest Rapids
Hatchery Discharge Channel) and Section 8 (Columbia River at the confluence of
the hatchery discharge channel), Return Years 2012 – 2015. ............................... 41
Table 38 The week that 10%, 50% (median), and 90% of the natural and hatchery origin
fall Chinook salmon passed Bonneville Dam, 2010 – 2015. Migration timing is
based on PIT tag passage of Hanford natural origin and Priest Rapids Hatchery in
the adult fish ladder at Bonneville Dam. .............................................................. 43
Table 39 Age compositions for fall Chinook salmon sampled in the Hanford Reach
escapement compared to fall Chinook salmon sampled at Priest Rapids Hatchery
(genders combined), brood years 1998 – 2009. .................................................... 45
Table 40 Age compositions for natural and hatchery origin fall Chinook salmon sampled in
the Hanford Reach escapement, Brood Years 2007 – 2010. ................................ 46
Table 41 Mean fork length (cm) at age (total age) of fall Chinook salmon sampled in the
Hanford Reach escapement compared to fall Chinook salmon sampled at Priest
Rapids Hatchery, Brood Years 1999 - 2010. N = sample size and SD = 1 standard
deviation. ............................................................................................................... 47
Table 42 Mean fork length (cm) at age (total age) of natural and hatchery origin fall
Chinook salmon that spawned naturally in the Hanford Reach, Brood Years 2007
– 2009. N = sample size and SD = 1 standard deviation. ..................................... 48
Table 43 Comparison male to female ratio of fall Chinook salmon sampled at Priest Rapids
Hatchery and in the Hanford Reach stream surveys, Brood Years 2007 – 2010. . 49
Table 44 Comparison male to female ratio of fall Chinook salmon sampled in the Hanford
Reach stream surveys, Brood Years 2007 – 2010. ............................................... 50
Table 45 Comparison of spawn success of natural and hatchery origin fall Chinook
sampled in the Hanford Reach stream survey, Return Year 2015. ....................... 50
Table 46 Comparison of spawn success of natural and hatchery origin fall Chinook
sampled in the Hanford Reach stream survey, Return Years 2010 – 2015. ......... 51
Table 47 Hatchery fall Chinook salmon contributions to harvest in the Hanford Reach fall
Chinook salmon fishery. Coded-wire tag recoveries provided from RMIS
database were expanded by sample rate and juvenile tag rate, return years 2003 –
2015....................................................................................................................... 53
Table 48 Priest Rapids Hatchery coded-wire tag recoveries provided from RMIS by brood
year and harvest type expanded by sample rate and juvenile tag rate, Brood Years
1997 – 2009. Data only includes coded-wire tag recoveries from adipose clipped
fish expanded by the juvenile tag rate. .................................................................. 53
Table 49 Estimated number and proportions of Priest Rapids Hatchery fall Chinook salmon
spawning escapement to Priest Rapids Hatchery and streams within and outside of
the presumptive target stream by brood year (1992-2009). Coded-wire tag
© 2016, PUBLIC UTILITY DISTRICT NO. 2 OF GRANT COUNTY, WASHINGTON.
ALL RIGHTS RESERVED UNDER U.S. AND FOREIGN LAW, TREATIES AND CONVENTIONS.
ix
recoveries are expanded by juvenile mark rate and survey sample rate for each
brood year. ............................................................................................................ 55
Table 50 Proportion of fall/summer Chinook spawning populations by return year
comprised of Priest Rapids Hatchery fall Chinook from 1998 – 2012 brood
releases based on coded wire tag recoveries. ........................................................ 56
Table 51 Last observations of unique passive-integrated-transponder tagged adult fall
Chinook from Priest Rapids Hatchery at detection sites upstream of McNary
Dam, Brood Years 1999 - 2012. ........................................................................... 57
Table 52 Last observations of unique passive-integrated-transponder tagged natural origin
Hanford Reach fall Chinook at detection sites upstream of McNary Dam, Brood
Years 2002, 2003, 2006- 2012 .............................................................................. 57
Table 53 Origin of broodstock and pNOB apportioned to program for fall Chinook salmon
spawned at Priest Rapids Hatchery, Return Years 2012 – 2015........................... 59
Table 54 Origin of broodstock and pNOB apportioned to program for fall Chinook salmon
spawned at Priest Rapids Hatchery, Brood Year 2015. ........................................ 60
Table 55 Proportion of hatchery Chinook salmon on the spawning grounds (pHOS) in the
Hanford Reach, Brood Years 2012 – 2015. .......................................................... 60
Table 56 Origin of pHOS apportioned by program source for fall Chinook salmon
spawning naturally in the Hanford Reach, Return Years 2012 – 2015. ............... 61
Table 57 Proportionate Natural Influence (PNI) of the Hanford Reach fall Chinook salmon
supplementation program based on expanded coded wire-tag recoveries of all fish
surveyed, Return Year 2001 – 2015. .................................................................... 62
Table 58 Proportionate Natural Influence (PNI) estimates for the Hanford Reach fall
Chinook salmon supplementation programs, Return Years 2012 – 2015.
Calculated from multiple population gene flow model based on the Ford model
which has been extended to three or more populations. ....................................... 62
Table 59 Broodstock spawned at Priest Rapids Hatchery, estimated escapement to the
Hanford Reach, natural and hatchery origin recruits (NOR and HOR), and natural
and hatchery replacement rates (NRR and HRR, with and without harvest) for
natural origin fall Chinook salmon in the Hanford Reach, Brood Years 1996 –
2009....................................................................................................................... 64
Table 60 Smolt-to-adult-Survival ratios (SAR) for Priest Rapids Hatchery fall Chinook
salmon, Brood Years 1992 -2009. Data includes coded-wire tag recoveries from
adipose clipped fish............................................................................................... 65
Table 61 Smolt-to-adult-Survival ratios (SAR) for Hanford Reach natural origin fall
Chinook salmon, Brood Years 1992 – 2009. Data includes coded-wire tag
recoveries from adipose clipped fish. ................................................................... 66
Table 62 Recoveries and disposition of steelhead at the Priest Rapids Hatchery volunteer
trap, Return Year 2015. ......................................................................................... 67
Table 63 Disposition of Chinook salmon collected at the Priest Rapids Hatchery volunteer
trap, Return Year 2015. ......................................................................................... 67

© 2016, PUBLIC UTILITY DISTRICT NO. 2 OF GRANT COUNTY, WASHINGTON.
ALL RIGHTS RESERVED UNDER U.S. AND FOREIGN LAW, TREATIES AND CONVENTIONS.
x
List of Appendices
Evaluation of Coded-Wire Tag Bias ................................................................... A-1
Recovery of coded-wire tags collected from adult Chinook salmon broodstock
spawned at Priest Rapids hatchery during return year 2015. .............................. B-1
Recovery of coded-wire tags collected from adult Chinook salmon surplus or
mortalities from Priest Rapids hatchery during return year 2015. ...................... C-1
Juvenile fish health inspections for Priest Rapids Hatchery fall Chinook salmon,
Brood Years 1999 – 2015. The description in the Condition column indicates the
presence of a certain condition within at least one of the fish examined. .......... D-1
Summary of aerial fall Chinook salmon redd counts in the Hanford Reach,
Columbia River, Washington............................................................................... E-1
Historical numbers of Chinook salmon carcasses recovered during the annual
Hanford Reach fall Chinook salmon carcass survey. .......................................... F-1
Estimated escapements for fall Chinook spawning in Hanford Reach and Priest
Rapids Dam pool, Return Year 2015 .................................................................. G-1
Carcass Drift Assessment ................................................................................... H-1
Carcass bias assessment results for return years 2011, 2012, 2013, and 2015. .... I-1
Demographic comparisons for double index tag groups released from Priest
Rapids Hatchery, Brood Years 2009 – 2010. ...................................................... J-1
Explanation of methods for calculating adult-to-adult expansions based on coded-
wire tag recoveries at Priest Rapids Hatchery. ................................................... K-1
Alternative pNOB and PNI Estimates ................................................................. L-1
© 2016, PUBLIC UTILITY DISTRICT NO. 2 OF GRANT COUNTY, WASHINGTON.
ALL RIGHTS RESERVED UNDER U.S. AND FOREIGN LAW, TREATIES AND CONVENTIONS.
1
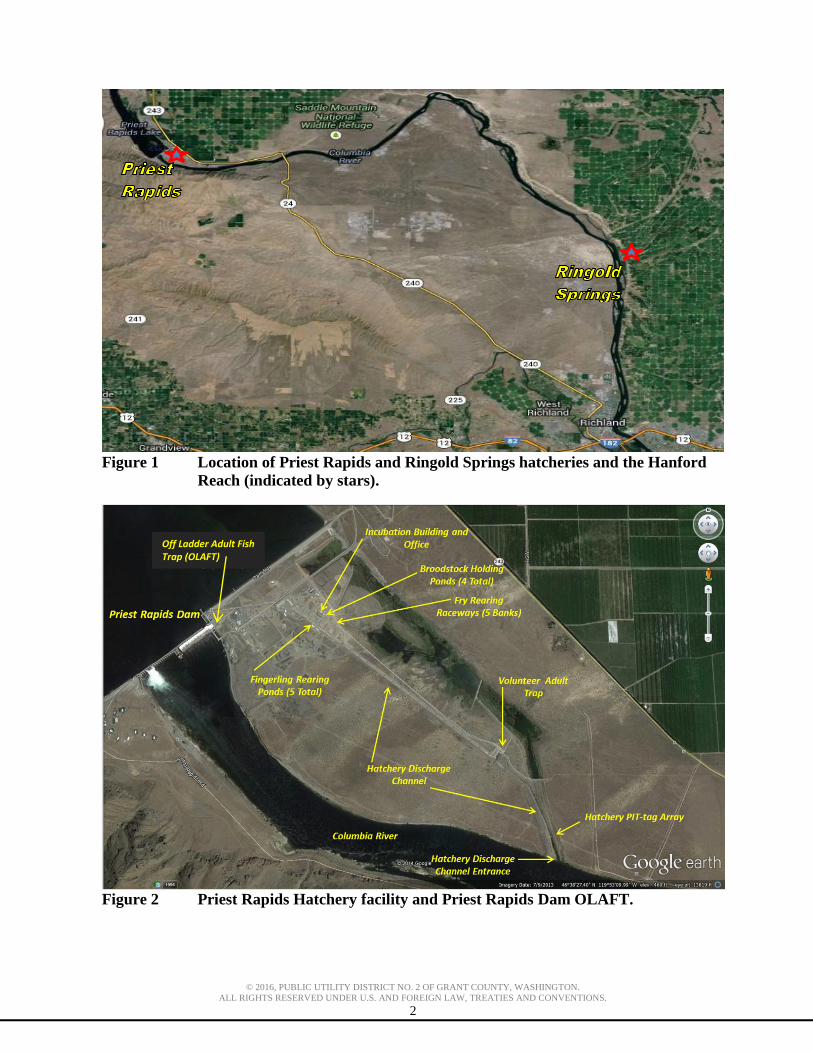
1.0 Introduction
The Public Utility District No. 2 of Grant County, Washington (GCPUD) produces and releases
5.6 million subyearling fall Chinook salmon smolts from Priest Rapids Hatchery (PRH) as part
of its mitigation for the construction and operation of Priest Rapids and Wanapum dams.
Mitigation is the result of three components 1) inundation of historic spawning habitat (5
million), annual losses of fish that migrate through the project (325,543), and flow fluctuation
impacts in the Hanford Reach (273,961). The PRH is located on the east bank of the Columbia
River immediately downstream of Priest Rapids Dam (Figure 1 and Figure 2). The Washington
Department of Fish & Wildlife (WDFW) operates PRH which is owned, maintained, and funded
in by the GCPUD. This report describes the monitoring and evaluation of the PRH M&E
program.
PRH also produces fish for other organizations. PRH produces and releases 1.7 million
subyearling smolts on-site for the U.S. Army Corps of Engineers (USACE) John Day Mitigation.
PRH collects broodstock, spawns, and incubates eggs for other hatcheries in the region. PRH
provides approximately 3.7 million eyed eggs for the USACE John Day Mitigation released at
Ringold Springs Hatchery (RSH). These eggs are transferred to Bonneville Hatchery and
ultimately about 3.5 million subyearlings are transported to, acclimated, and released as
subyearling smolts from RSH. During previous years, PRH has accommodated egg takes and/or
incubated eggs for the Yakama Nation (YN) upper river bright (URB) fall Chinook salmon
releases in the lower Yakima River at their Prosser facility. Additional eggs have also been taken
for other programs such as Umatilla Hatchery, WDFW’s Salmon in the Classroom program and
to support various research projects.
A cooperative effort between Grant, Douglas, and Chelan County Public Utility Districts and
Washington Department of Fish and Wildlife (WDFW) has resulted in an updated Monitoring
and Evaluation Plan for PUD Hatchery Programs (Hillman et al. 2013). This document provides
guiding principles and approaches for the monitoring and evaluation (M&E) of PRH. Objectives,
hypotheses, measured and derived variables, and field methods that will be used to collect data
are listed in this document.
This report of the PRH M&E program encompasses data collected during fiscal year (FY) 2015 -
16 as well as earlier years where data were available. The data presented in this report are
preliminary and subject to change as new data and analyses become available. Readers are
encouraged to consult the most recent annual report in order to obtain the most current and
accurate information.
© 2016, PUBLIC UTILITY DISTRICT NO. 2 OF GRANT COUNTY, WASHINGTON.
ALL RIGHTS RESERVED UNDER U.S. AND FOREIGN LAW, TREATIES AND CONVENTIONS.
2
Figure 1 Location of Priest Rapids and Ringold Springs hatcheries and the Hanford
Reach (indicated by stars).
Figure 2 Priest Rapids Hatchery facility and Priest Rapids Dam OLAFT.
Off Ladder Adult Fish Trap (OLAFT)

© 2016, PUBLIC UTILITY DISTRICT NO. 2 OF GRANT COUNTY, WASHINGTON.
ALL RIGHTS RESERVED UNDER U.S. AND FOREIGN LAW, TREATIES AND CONVENTIONS.
3
2.0 Objectives
The objective of the PRH M&E plan is to evaluate the performance of the PRH program relative
to the goals and objectives of the PRH program. The overarching goal of the PRH program is to
meet GCPUD’s hatchery mitigation by producing fish for harvest while keeping genetic and
ecological impacts within acceptable limits. The M&E objectives of the PRH program are
described below.
Objective 1: Determine if the Priest Rapids Hatchery program has affected abundance
and productivity of the Hanford Reach population.
Objective 2: Determine if the run timing, spawn timing, and spawning distribution of
both the natural and Priest Rapids Hatchery components of the Hanford Reach population
are similar.
Objective 3: Determine if genetic diversity, population structure, and effective
population size have changed in natural spawning populations as a result of the Priest
Rapids Hatchery program. Additionally, determine if Priest Rapids Hatchery programs
have caused changes in phenotypic characteristics of the Hanford Reach population.
Objective 4: Determine if the Priest Rapids Hatchery adult-to-adult survival (i.e.,
hatchery replacement rate) is greater than the Hanford Reach adult-to-adult survival (i.e.,
natural replacement rate) and equal to or greater than the program specific hatchery
replacement rate (HRR) expected value based on survival rates listed in the BAMP
(1998).
Objective 5: Determine if the stray rate of Priest Rapids Hatchery fish is below the
acceptable levels to maintain genetic variation between populations.
Objective 6: Determine if Priest Rapids Hatchery fish were released at the programmed
size and number.
Objective 7: Determine if harvest opportunities have been provided using Priest Rapids
Hatchery returning adults.
We also present information in this report about two regional objectives that relate to disease and
ecological interactions.
3.0 Project Coordination
WDFW M&E staff partially assigned to PRH also conducts similar work at RSH. The M&E staff
also works in conjunction with multiple WDFW groups that include PRH fish culture staff, the
Columbia River Coded-Wire Tag Recovery Program (CRCWTRP), Region 3 Fish Management
staff, the Supplementation Research Team in Wenatchee, and the GCPUD biological science
staff to complete many of the tasks included in the M&E Plan. In addition, samples collected at
the hatchery and in the field were transported and analyzed by WDFW laboratories including the
WDFW Scale Reading Lab and the WDFW Otolith Lab. Coded-wire tags were processed by the
M&E staff either at the WDFW District 4 office or the PRH wet lab. Data and analysis collected
in association with the PRH M&E and Hanford Reach population monitoring is incorporated into
the WDFW Traps, Weirs, and Surveys (TWS) database which is administered by WDFW staff
stationed in the Region 5 Headquarters in Vancouver. Agency managers use this data for
forecasting and managing fall Chinook salmon populations in the Columbia and Snake rivers and
tributaries. WDFW secured and held all environmental permits necessary for the work.
© 2016, PUBLIC UTILITY DISTRICT NO. 2 OF GRANT COUNTY, WASHINGTON.
ALL RIGHTS RESERVED UNDER U.S. AND FOREIGN LAW, TREATIES AND CONVENTIONS.
4
4.0 Life History – Hanford Reach Fall Chinook Salmon
The Hanford Reach is one of the last non-impounded reaches of the Columbia River and the
location of the largest and most productive natural spawning fall Chinook salmon population in
the United States (Harnish et al. 2012). The Hanford Reach extends 51 miles from the city of
Richland to the base of Priest Rapids Dam. Natural origin fall Chinook salmon emerge from the
substrate in the spring and rear in the Hanford Reach until outmigration in the summer. Egg-to-
fry survival has been estimated to be about 71% in the Hanford Reach (Oldenburg et al. 2012)
and egg-to-pre-smolt survival has been estimated to be about 40.2% (Harnish et al. 2012). Both
of these estimates are high when compared to other Chinook salmon populations (Harnish et al.
2012). The age at maturity for naturally produced fish in the Hanford Reach varies between age-
1 mini-jack and age-6 adults: albeit recoveries of age-1 and 6 fish are generally rare. The age of
fish reported in this document begins with the first birthday occurring the year after the parents
spawned. The abundance of mini-jacks which mature as age-1 males is currently not known.
Age-2 male fall Chinook salmon (a.k.a jacks) return to the Hanford Reach after spending roughly
one year in the ocean. The majority of the natural origin adults return after having spent three to
four years in the ocean (age-4 and 5). A small portion, typically less than 2%, will spend up to
five years in the ocean and return as age-6.
5.0 Sample Size Considerations
We attempted to strike an appropriate balance between statistical precision, logistics, and
financial investment when setting sample size targets. A phased approach was used to collect
biological samples with sufficient accuracy and precision. In general, we attempted to
oversample the raw samples such as carcasses and trap recoveries and then use post season
analysis to determine if sub-sampling was appropriate. The sample size target of systematic field
sampling is 2,500 of the carcasses in the Hanford Reach, 1,000 at the hatchery trap, and 1,000 of
the hatchery volunteer broodstock, and 200 broodstock collected from each other source such as
OLAFT and ABC fishery.
All adult fall Chinook salmon recovered at PRH, in the Hanford Reach sport fishery, and in the
stream surveys are sampled for the presence of coded-wire tags to maximize the precision of
estimates generated from these data.
Representative otolith samples by survey type were randomly selected for processing to estimate
origin by age class. In some cases, all otolith samples for a survey type were processed if the
sampling rate provided relatively low numbers of otoliths collected or if there was a need for
higher precision or accuracy. During return year 2015, randomly selected sub-samples of otoliths
collected from the PRH volunteer trap and volunteer broodstock were submitted for processing.
The methodologies for selecting otolith sub-samples have differed between return years. In
general, we randomly selected otoliths from various survey types to obtain roughly 120 otoliths
for each age and gender. In some cases, all otoliths were submitted for stratified groups
(age/gender) when specific age classes contain less than 100 samples. For example, typically all
samples of age-5 and 6 fish were submitted because of the low number of fish represented in the
field collected sample. The stratified sub-sample size refinement process is described in Richards
and Pearsons 2014. The sub-sample groups often included coded-wire tagged fish recovered
within the biological sample.
Some of these tagged fish were randomly selected as we randomly select the desired number of
otoliths to decode. This was done to increase the number of fish sampled for origin with no
additional cost.

© 2016, PUBLIC UTILITY DISTRICT NO. 2 OF GRANT COUNTY, WASHINGTON.
ALL RIGHTS RESERVED UNDER U.S. AND FOREIGN LAW, TREATIES AND CONVENTIONS.
5
6.0 Current Operation of Priest Rapids Hatchery
In 2015, a near record high of 63,978 adult fall Chinook salmon were handled at PRH (Table 1).
The 2015 broodstock for PRH were collected at the hatchery volunteer trap, the OLAFT, and
from the ABC fishery. The majority of the broodstock were collected from the PRH volunteer
trap which was operated from September 9 through December 1, 2015.
Table 1 Source and disposition of Chinook salmon collected for broodstock at Priest
Rapids Hatchery, Return Year 2015.
Collection
Location Gender Collected
Trap
Surplused
Trap
Mortalities Ponded Spawned1
Pond
Surplused
Pond
Mortalities
Volunteer
Trap
(Sept 11-Dec 1)
Males 34,381 32,463 103 1,765 1,420 36 359
Females 26,102 21,744 184 3,377 3,455 285 434
Jacks 3,495 3,418 77 0 0 0
Total 63,978 57,625 364 5,142 4,875 321 793
OLAFT
(Sept 16-Nov 12)
Males 189 189 130 36 23
Females 278 278 218 3 57
Jacks 0 0 0 0 0
Total 467 0 0 467 348 39 80
ABC
(Oct 30&31, Nov 1)
Males 216 216 147 39 30
Females 304 304 154 11 139
Jacks 4 4 0 3 1
Total 524 0 0 524 301 53 170
Facility Total 64,969 57,625 364 6,133 5,524 413 1,043
1 There were 50 males and 797 female taken directly from the trap and spawned. These fish are not included in the
total fish ponded.
The arrival timing of adult fall Chinook salmon to the PRH discharge channel was estimated by
tracking the passage of adults possessing a passive integrated transponder (PIT) tag as they swam
through the array located in the lower section of the discharge channel. Irregular trap operations
prevent using daily trap returns to estimate arrival timing as precisely as can be done with PIT
tags.
The array is generally operated in the fall from mid-September through early December. During
2015, the array was out-of-service for a period between November 2 and 5 which coincided with
the period of high unique PIT tag detections. The annual PIT rates at PRH dramatically increased
beginning with brood year 2011from 0.04% (3,000) tags to 0.61% (43,000 tags). Consequently,
the tag rate of age-5 adults from brood year 2010 is lower than those of age-2 and 4 fish. The
return timing of PIT tagged adults during return year 2015 suggests there was a bi-model peak
return with the majority of fish returning during the latter half of October (Figure 3).

© 2016, PUBLIC UTILITY DISTRICT NO. 2 OF GRANT COUNTY, WASHINGTON.
ALL RIGHTS RESERVED UNDER U.S. AND FOREIGN LAW, TREATIES AND CONVENTIONS.
6
Figure 3 Weekly first detections of upstream passage of unique PRH origin PIT
tagged adult Chinook salmon at the PIT tag array located in the Priest
Rapids Hatchery discharge channel, 2015.
PRH has four adult salmon holding ponds. Ponds 1 and 2 were used to hold broodstock collected
at the PRH Volunteer Trap. Pond 4 was used to hold broodstock collected from the ABC and
OLAFT. Pond 3 was used on occasion to temporarily hold males collected from ABC and
OLAFT. Several hundred adipose clipped adults were held in Pond 4 to facilitate hatchery x
natural origin crosses during spawning. The PRH staff generally transported fish from the
volunteer trap seven days per week to collect broodstock and or to surplus the excess fish. Male
fall Chinook salmon, both adult and jack, typically comprised the majority of the fish surplused
from the trap.
Spawning days generally occurred on Mondays and Tuesdays each week from October 26
through December 7 (N = 12). Hatchery staff simultaneously employed two systems for
spawning broodstock to increase the number of fish processed on spawn days. There was an
emphasis to use the electro-anesthetic system for the majority of spawning of operations. Late in
the season, it appeared that the electro-anesthetic system was overly stressful on broodstock and
slow to facilitate efficient spawning operations. Accordingly, hatchery staff switched to the old
practice of seining the ponds to sort fish for spawning or surplus.
The egg take goal for PRH is 12,692,400. The actual egg take from the 2015 broodstock was
13,379,404 (105% of the goal). During routine spawn days, the eggs from two females were
stripped into a five gallon bucket and then the milt from a single male was mixed with the eggs.
Fertilized eggs were then transferred to the incubation room, combined with multiple egg takes,
weighed to estimate numbers of eggs, and then placed in vertical incubation trays at roughly
10,000 eggs per tray.
Similar to return year 2014, a cooperative effort between WDFW and GCPUD staff to perform
real-time otolith reading (RTOR) coinciding with an alternative mating strategy occurred on
November 9 and 10. This activity entailed examining 305 otoliths during the spawn to facilitate
mating 233 natural origin males to known hatchery origin females at ratios of 1:4. Otoliths were

© 2016, PUBLIC UTILITY DISTRICT NO. 2 OF GRANT COUNTY, WASHINGTON.
ALL RIGHTS RESERVED UNDER U.S. AND FOREIGN LAW, TREATIES AND CONVENTIONS.
7
only read from males that had the potential to be natural origin. The milt collected from 71
hatchery origin males and one presumed natural origin identified during the RTOR was
discarded due to insufficient milt volume. An estimated 3,078,513 eggs were taken from the
natural x hatchery 1:4 crosses.
After shipping groups of live eggs to other facilities, twelve batches of fry were moved from the
vertical trays in the incubation building to outdoor raceways between January 28 and February
26, 2016. The fry were reared in the raceways until they were of sufficient size that a portion of
them could be marked in some manner (i.e., adipose clipped, coded-wire tagged, and/or PIT
tagged). The adipose clip and code-wire tagged fish were collected directly from the raceways
banks and then released into the corresponding concrete rearing ponds. Fish not selected for
marking were transferred from the raceway banks into the corresponding rearing ponds. Groups
of fish selected to be PIT tagged were collected by a cast net out of the rearing ponds C, D, and E
and raceway banks A and B. They were placed into their origin rearing pond after being held for
a week in segregated races for recovery. Beginning June 16, subyearling fall Chinook salmon
were released one pond at a time with one to three days between each release. These fish migrate
down the old one mile long spawning channel and then down the hatchery discharge channel to
the Columbia River. The fish were released from the last holding pond on June 24.
7.0 Origin of Adult Returns to Priest Rapids Hatchery
There were three sources for collection of adult Chinook salmon broodstock for PRH during the
2015 return: PRH volunteer trap, OLAFT, and ABC. The origin of fish collected at these
locations was determined by examination of hatchery marks (i.e., otolith marks, adipose clips,
and coded-wire tags) for the fish within the demographic sample groups. PRH origin fish were
identified by their otolith mark. The fish that did not possess a thermal mark or other hatchery
marks were classified as natural origin. Historically, the very low recovery (<1%) of coded-wire
tagged strays at PRH suggests that a high percentage of the un-marked fish may be of natural
origin (See Section 9.0). In some sections of the report, we make a simplifying assumption that
fish without hatchery marks are of natural origin. Similar to that observed in previous years,
there is a discrepancy between estimates of origin based on coded-wire tag and those based on
otoliths. Origin based on otolith sampling provides the most accurate data under the current
marking regime at PRH. The error rate associated with determination of origin by otoliths is
reported at less than 1% (J. Grimm, WDFW Otolith Lab, personal communication). Each otolith
is independently read by two experienced lab staff. Upon completion of the second read, any
discrepancies are read a third time to resolve the conflict. If the marks are poor quality, three
staff independently read the otoliths. The otolith marks created by the PRH fish culture staff are
high quality and generally require only two readings. Most discrepancies related to these data are
clerical in nature (data entry). Discrepancies associated with the data collect by the M&E team
were generally clerical and easy to resolve and correct.
We present estimates of abundance based on coded-wire tags (1:1 sample rate) and estimates
based on sub-samples of hatchery marked fish collected from specific groups (varying sample
rates) to illustrate differences in the estimates for the proportions of natural and hatchery origin
fish recovered at PRH as well as the potential for creating a method to correct the historical
database that was generated using coded-wire tag recoveries.
Origin Based on Hatchery Marks
For return year 2015, the proportion of broodstock obtained from the PRH volunteer trap that
was natural origin is estimated at 0.081. Overall, it is estimated that 0.052 of the volunteer trap
© 2016, PUBLIC UTILITY DISTRICT NO. 2 OF GRANT COUNTY, WASHINGTON.
ALL RIGHTS RESERVED UNDER U.S. AND FOREIGN LAW, TREATIES AND CONVENTIONS.
8
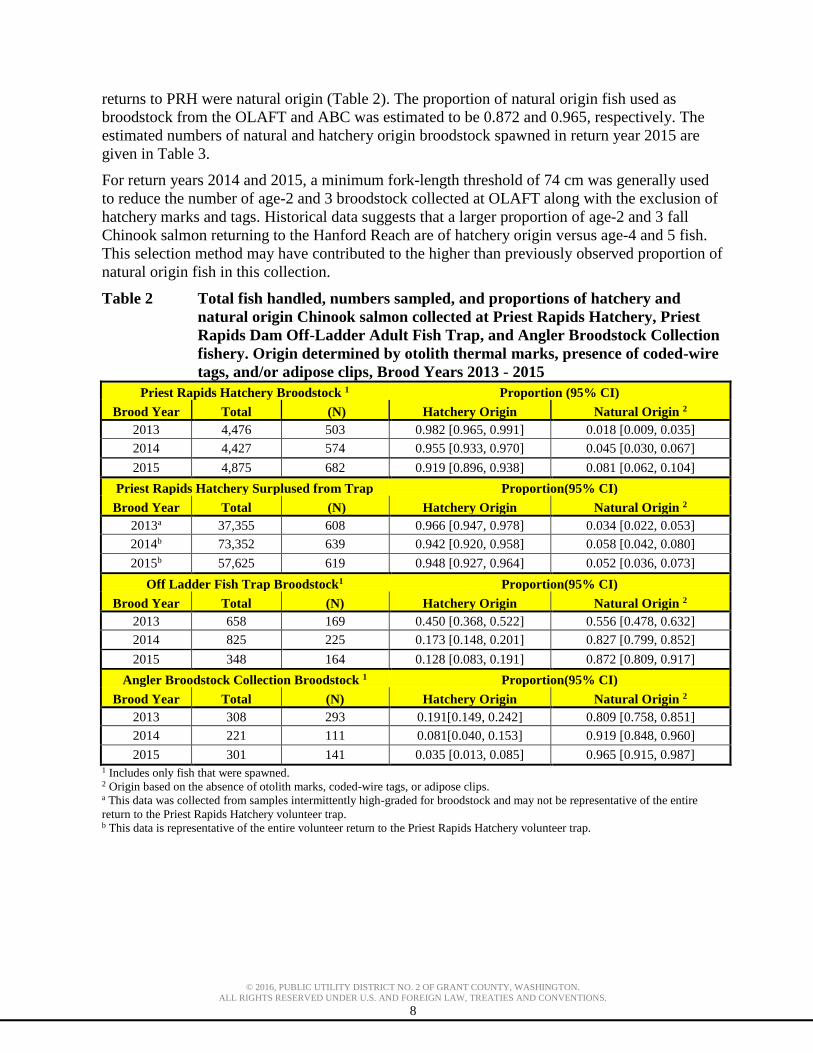
returns to PRH were natural origin (Table 2). The proportion of natural origin fish used as
broodstock from the OLAFT and ABC was estimated to be 0.872 and 0.965, respectively. The
estimated numbers of natural and hatchery origin broodstock spawned in return year 2015 are
given in Table 3.
For return years 2014 and 2015, a minimum fork-length threshold of 74 cm was generally used
to reduce the number of age-2 and 3 broodstock collected at OLAFT along with the exclusion of
hatchery marks and tags. Historical data suggests that a larger proportion of age-2 and 3 fall
Chinook salmon returning to the Hanford Reach are of hatchery origin versus age-4 and 5 fish.
This selection method may have contributed to the higher than previously observed proportion of
natural origin fish in this collection.
Table 2 Total fish handled, numbers sampled, and proportions of hatchery and
natural origin Chinook salmon collected at Priest Rapids Hatchery, Priest
Rapids Dam Off-Ladder Adult Fish Trap, and Angler Broodstock Collection
fishery. Origin determined by otolith thermal marks, presence of coded-wire
tags, and/or adipose clips, Brood Years 2013 - 2015
Priest Rapids Hatchery Broodstock 1 Proportion (95% CI)
Brood Year Total (N) Hatchery Origin Natural Origin 2
2013 4,476 503 0.982 [0.965, 0.991] 0.018 [0.009, 0.035]
2014 4,427 574 0.955 [0.933, 0.970] 0.045 [0.030, 0.067]
2015 4,875 682 0.919 [0.896, 0.938] 0.081 [0.062, 0.104]
Priest Rapids Hatchery Surplused from Trap Proportion(95% CI)
Brood Year Total (N) Hatchery Origin Natural Origin 2
2013a 37,355 608 0.966 [0.947, 0.978] 0.034 [0.022, 0.053]
2014b 73,352 639 0.942 [0.920, 0.958] 0.058 [0.042, 0.080]
2015b 57,625 619 0.948 [0.927, 0.964] 0.052 [0.036, 0.073]
Off Ladder Fish Trap Broodstock1 Proportion(95% CI)
Brood Year Total (N) Hatchery Origin Natural Origin 2
2013 658 169 0.450 [0.368, 0.522] 0.556 [0.478, 0.632]
2014 825 225 0.173 [0.148, 0.201] 0.827 [0.799, 0.852]
2015 348 164 0.128 [0.083, 0.191] 0.872 [0.809, 0.917]
Angler Broodstock Collection Broodstock 1 Proportion(95% CI)
Brood Year Total (N) Hatchery Origin Natural Origin 2
2013 308 293 0.191[0.149, 0.242] 0.809 [0.758, 0.851]
2014 221 111 0.081[0.040, 0.153] 0.919 [0.848, 0.960]
2015 301 141 0.035 [0.013, 0.085] 0.965 [0.915, 0.987] 1 Includes only fish that were spawned. 2 Origin based on the absence of otolith marks, coded-wire tags, or adipose clips. a This data was collected from samples intermittently high-graded for broodstock and may not be representative of the entire
return to the Priest Rapids Hatchery volunteer trap. b This data is representative of the entire volunteer return to the Priest Rapids Hatchery volunteer trap.

© 2016, PUBLIC UTILITY DISTRICT NO. 2 OF GRANT COUNTY, WASHINGTON.
ALL RIGHTS RESERVED UNDER U.S. AND FOREIGN LAW, TREATIES AND CONVENTIONS.
9
Table 3 Estimated numbers of hatchery and natural origin Chinook salmon collected
at Priest Rapids Hatchery, Priest Rapids Dam Off-Ladder Adult Fish Trap,
and Angler Broodstock Collection fishery. Origin determined by otolith
thermal marks, presence of coded-wire tags, and/or adipose clips, Brood
Years 2013 - 2015
Priest Rapids Hatchery Broodstock
Brood
Year
Hatchery Origin Natural Origin
Lower 95% CI Estimate Upper 95% CI Lower 95% CI Estimate Upper 95% CI
2013 4,319 4,395 4,436 40 81 157
2014 4,130 4,228 4,294 133 199 297
2015 4,368 4,482 4,573 302 393 507
Priest Rapids Hatchery Surplused from Trap
Brood
Year
Hatchery Origin Natural Origin
Lower 95% CI Estimate Upper 95% CI Lower 95% CI Estimate Upper 95% CI
2013a 35,375 36,085 36,533 822 1,270 1,980
2014b 67,484 69,024 70,271 3,081 4,328 5,868
2015b 53,418 54,646 55,551 2,075 2,979 4,207
Off Ladder Fish Trap Broodstock
Brood
Year
Hatchery Origin Natural Origin
Lower 95% CI Estimate Upper 95% CI Lower 95% CI Estimate Upper 95% CI
2013 242 343 343 315 420 416
2014 122 143 166 659 682 703
2015 29 45 66 282 303 319
ABC Fishery Broodstock
Brood
Year
Hatchery Origin Natural Origin
Lower 95% CI Estimate Upper 95% CI Lower 95% CI Estimate Upper 95% CI
2013 46 59 75 233 249 262
2014 9 17 34 187 204 212
2015 4 11 26 275 290 297 a This data was collected from samples intermittently high-graded for broodstock and may not be representative of the entire
return to the Priest Rapids Hatchery volunteer trap. b This data is representative of the entire volunteer return to the Priest Rapids Hatchery volunteer trap.
Origin Based on Coded-Wire Tag Recoveries
The expansion of coded-wire tags recovered at PRH have until recent years frequently under
estimated the returns of PRH origin fish by return year and brood year. This underestimate bias
and steps taken to identify the source are provided in Appendix A.
All Chinook salmon returning to PRH and broodstock collected from the OLAFT and ABC were
sampled for the presence of coded-wire tags. A total of 10,748 coded-wire tags were recovered
from Chinook salmon sampled at PRH in 2015, of which 533 were obtained from the broodstock
collected from the PRH volunteer trap (Appendix B). The broodstock collected from the PRH
volunteer trap were generally high-graded to exclude coded-wire tagged fish. Therefore, this
coded-wire tag group is not representative of the volunteer broodstock. There were seven coded-
wire tags recovered in the ABC broodstock. The ABC fish were not screened for code-wire tags
during collection. The staff collecting the OLAFT fish attempted to screen out coded-wire tags
fish during the collection; however, eight coded-wire tags were recovered from this group. In
total, there were 10,674 coded-wire tags that were recovered from Chinook salmon collected

© 2016, PUBLIC UTILITY DISTRICT NO. 2 OF GRANT COUNTY, WASHINGTON.
ALL RIGHTS RESERVED UNDER U.S. AND FOREIGN LAW, TREATIES AND CONVENTIONS.
10
from the PRH volunteer trap (Appendix C). The juvenile mark rate expansions of coded-wire tag
recoveries at PRH in 2015 suggest that 92.9% of the returns to the PRH volunteer trap were
hatchery origin fish. If we were to make the assumption that these coded-wire tag expansions
accurately reflected the proportion of hatchery origin fish, then the remaining 7.1% of the
unaccounted fish could potentially be natural origin (Table 4).
During return year 2015, PRH origin coded-wire tags accounted for 91.4% of the total return to
the PRH volunteer trap and 98.5% of the hatchery origin tags recovered. There were 14 natural
origin Hanford Reach fall Chinook salmon coded-wire tags recovered at the hatchery in 2015;
two of these fish were were included in the broodstock. There is not an expansion factor for the
natural origin coded-wire tag fish so there was no attempt to estimate the proportion of natural
origin fish based on these 14 coded-wire tag recoveries.
Table 4 Estimated proportion of hatchery and natural origin adult Chinook salmon
returning to the Priest Rapids Hatchery volunteer trap based on coded-wire
tag expansion. The entire collection was sampled for coded-wire tags, Return
Years 2005 - 2015
Return
Year
Returns to Priest
Rapids Hatchery
Volunteer Trap
Origin based on Coded-Wire Tag expansions
Natural Origin 1 Priest Rapids Hatchery Other Hatchery
2005 10,616 0.622 0.006 0.329
2006 8,223 0.490 0.006 0.436
2007 6,000 0.671 0.004 0.525
2008 19,586 0.491 0.008 0.409
2009 12,778 0.428 0.003 0.540
2010 19,169 0.602 0.003 0.486
2011 20,823 0.613 0.006 0.381
2012 28,039 0.692 0.004 0.304
2013 41,831 0.713 0.034 0.252
2014 77,259 0.809 0.020 0.170
2015 63,978 0.914 0.015 0.071 1 The proportion not accounted for by coded-wire tag expansion is assumed to be of natural origin.
8.0 Broodstock Collection and Sampling
Similar to as done during recent years, the 2015 broodstock collected at the PRH volunteer trap
and the OLAFT were generally high-graded for gender, size, and/or origin to increase the
probability of collecting natural origin fish. For example, fish that had an adipose clip or coded-
wire tag were excluded from OLAFT collections. In addition, most of the fish measuring less
than 74 cm FL were excluded from the OLAFT broodstock to reduce the number of age-3 fish
and likely PRH origin fish. Late in the 2015 season, low passage and collection numbers at
OLAFT prompted the collection of non-coded-wire tagged adipose intact age-3 males and
females for broodstock. The broodstock collected from the ABC excluded jacks and adipose
clipped fish: these fish were not screened for coded-wire tags at time of collection.
The broodstock collected at the PRH volunteer trap were systematically sampled at a 1:5 rate for
otoliths, scales (age), gender, and length. The broodstock collected at the OLAFT and ABC were
sampled at a 1:2 rate for otoliths, scales (age), gender, and length. Post spawn data for the PRH
volunteer trap broodstock were randomly sub-sampled to determine origin by age, gender, and
length. The demographic data for OLAFT and ABC broodstock were not sub-sampled due an
adequate initial sample size.

© 2016, PUBLIC UTILITY DISTRICT NO. 2 OF GRANT COUNTY, WASHINGTON.
ALL RIGHTS RESERVED UNDER U.S. AND FOREIGN LAW, TREATIES AND CONVENTIONS.
11
Broodstock Age Composition
A combined total of 5,524 fish were spawned from the three sources of broodstock. In general,
hatchery origin broodstock tend to be younger than natural origin broodstock (Table 5). The
historical broodstock age compositions are not directly comparable to the 2012 through 2015
broodstock age compositions due to inconsistent methodology for assigning origin. Prior to
2012, the origin of broodstock was estimated by adult coded-wire tag recoveries which in turn
were expanded by the specific juvenile tag rates.
Table 5 Age composition for hatchery and natural origin fall Chinook salmon
spawned at Priest Rapids Hatchery (includes all sources of broodstock),
Return Years 2007 – 2015. Proportions calculated from expanded age
composition by origin for each source of broodstock to account for differing
sample rates.
Return Year Origin
Age Composition
Age-2 Age-3 Age-4 Age-5 Age-6
2007 Natural1 0.000 1.000 0.000 0.000 0.000
Hatchery1 0.081 0.274 0.486 0.138 0.020
2008 Natural1 -- -- -- -- --
Hatchery1 0.011 0.848 0.100 0.039 0.002
2009 Natural1 -- -- -- -- --
Hatchery1 0.012 0.086 0.883 0.019 0.000
2010 Natural1 -- -- -- -- --
Hatchery 0.016 0.755 0.111 0.118 0.000
2011 Natural1 -- -- -- -- --
Hatchery1 0.010 0.229 0.753 0.008 0.000
2012 Natural2 0.032 0.435 0.400 0.131 0.002
Hatchery2 0.006 0.487 0.376 0.130 0.000
2013 Natural2 0.000 0.446 0.517 0.037 0.000
Hatchery2 0.001 0.658 0.339 0.002 0.000
2014 Natural2 0.000 0.045 0.886 0.070 0.000
Hatchery2 0.000 0.064 0.897 0.039 0.000
2015 Natural2 0.000 0.183 0.506 0.305 0.006
Hatchery2 0.000 0.210 0.680 0.110 0.000 1 Origin determined from coded-wire tag expansions of juvenile mark rate. 2 Origin determined from presence of hatchery marks (i.e., coded-wire tags, adipose clips, and otoliths)
In recent years, the broodstock selected from the PRH volunteer trap consisted primarily of age-4
fish (Table 6). A length based high-grading procedure (>73cm) was generally used during
broodstock collection during 2014 and 2015. The hatchery origin broodstock for return years
2012 and 2013 had higher proportions of age-3 fish due to the scarcity of older fish returning to
the trap.
The hatchery and natural origin fish recovered at the OLAFT and spawned were primarily age-4
and age-5 (Table 7). A length based high-grading procedure (>73cm) was used during
broodstock collection.

© 2016, PUBLIC UTILITY DISTRICT NO. 2 OF GRANT COUNTY, WASHINGTON.
ALL RIGHTS RESERVED UNDER U.S. AND FOREIGN LAW, TREATIES AND CONVENTIONS.
12
Table 6 Age composition for hatchery and natural origin fall Chinook broodstock
collected form the Priest Rapids Hatchery volunteer trap, Return Years 2012
- 2015
Return Year Origin1
Age Composition
N Age-2 Age-3 Age-4 Age-5 Age-6
2012 Natural 39 0.000 0.295 0.585 0.121 0.000
Hatchery 646 0.000 0.477 0.389 0.134 0.000
2013 Natural 11 0.000 0.390 0.610 0.000 0.000
Hatchery 497
0.000 0.656 0.342 0.002 0.000
2014 Natural 26 0.000 0.115 0.885 0.000 0.000
Hatchery 548 0.000 0.065 0.899 0.036 0.000
2015 Natural 55 0.000 0.218 0.491 0.273 0.018
Hatchery 627 0.000 0.215 0.668 0.116 0.000
Mean Natural 33 0.000 0.255 0.643 0.099 0.005
Hatchery 580 0.000 0.353 0.575 0.072 0.000 1 Origin determined from “in-sample” otoliths, adipose clips and/or coded-wire tags.
Table 7 Age composition for hatchery and natural origin fall Chinook salmon
broodstock collected from the Off Ladder Adult Fish Trap at Priest Rapids
Dam, Return Years 2012 - 2015
Return Year Origin1
Age Composition
N Age-2 Age-3 Age-4 Age-5 Age-6
2012 Natural 281 0.048 0.540 0.257 0.151 0.004a
Hatchery 219 0.106 0.687 0.136 0.071 0.000
2013 Natural 94 0.000 0.417 0.528 0.005 0.000
Hatchery 75 0.003 0.665 0.334 0.007 0.000
2014 Natural 186 0.000 0.000 0.902 0.098 0.000
Hatchery 39 0.000 0.000 0.870 0.130 0.000
2015 Natural 143 0.000 0.132 0.513 0.347 0.007
Hatchery 21 0.000 0.211 0.563 0.226 0.000
Mean Natural 176 0.012 0.272 0.550 0.150 0.003
Hatchery 89 0.027 0.391 0.476 0.109 0.000 1 Origin determined from “in-sample” otoliths, adipose clips and/or coded-wire tags. a One age-6 female assigned to natural origin based on the absence of marks or tags. The 2006 brood year was not
otolith marked.
Both the PRH origin and natural origin fish spawned from the ABC broodstock were mostly age-
4 (Table 8). This collection generally excludes jacks.

© 2016, PUBLIC UTILITY DISTRICT NO. 2 OF GRANT COUNTY, WASHINGTON.
ALL RIGHTS RESERVED UNDER U.S. AND FOREIGN LAW, TREATIES AND CONVENTIONS.
13
Table 8 Age composition for hatchery and natural origin fall Chinook salmon
broodstock collected from Angler Broodstock Collection, Return Years 2012
– 2015
Return Year Origin1
Age Composition
N Age-2 Age-3 Age-4 Age-5 Age-6
2012 Natural 59 0.000 0.542 0.339 0.119 0.000
Hatchery 6 0.000 0.667 0.333 0.000 0.000
2013 Natural 237 0.000 0.511 0.468 0.021 0.000
Hatchery 56 0.000 0.839 0.161 0.000 0.000
2014 Natural 102 0.000 0.126 0.830 0.044 0.000
Hatchery 9 0.059 0.369 0.572 0.000 0.000
2015 Natural 136 0.000 0.196 0.499 0.305 0.000
Hatchery 5 0.000 0.397 0.603 0.000 0.000
Mean Natural 134 0.000 0.344 0.534 0.122 0.000
Hatchery 19 0.015 0.568 0.417 0.000 0.000
1 Origin determined from “in-sample” otoliths, adipose clips and/or coded-wire tags.
Length by Age Class of Broodstock
The average fork length (cm) by age for each source of broodstock is provided in Table 9.
Error! Reference source not found. The hatchery origin age-3 fish appear to be slightly larger
than natural origin age-3 fish. This may be due to the size high-grading processes.
Table 9 Mean fork length (cm) at age (total age) of fall Chinook salmon sampled
from each source of broodstock spawned at Priest Rapids Hatchery, Return
Year 2015. N = sample size and SD = 1 standard deviation.
Return Year Origin1
Fall Chinook Fork Length (cm)
Age-2 Age-3 Age-4 Age-5 Age-6
N Mean SD N Mean SD N Mean SD N Mean SD N Mean SD
Volunteer
Returns
Natural 0 12 74 7 30 79 6 15 86 4 1 87 0
Hatchery 0 133 71 4 437 80 4 79 84 5 0 0 0
OLAFT Natural 0 180 68 4 73 84 6 51 89 6 1 88 0
Hatchery 0 40 69 4 10 78 3 5 80 3 0
ABC Natural 1 54 0 29 68 6 67 82 5 39 89 5 0
Hatchery 0 2 67 3 3 80 4 0 1 It is assumed for this analysis that all fish not possessing an otolith mark, ad-clipped or hatchery origin coded-wire tag were
natural origin.
© 2016, PUBLIC UTILITY DISTRICT NO. 2 OF GRANT COUNTY, WASHINGTON.
ALL RIGHTS RESERVED UNDER U.S. AND FOREIGN LAW, TREATIES AND CONVENTIONS.
14
Table 10 Mean fork length (cm) at age (total age) of hatchery and natural origin fall
Chinook salmon collected from volunteer broodstock for the Priest Rapids
Hatchery program. N = sample size and SD = 1 standard deviation.
Return
Year Origin1
Fall Chinook Fork Length (cm)
Age-2 Age-3 Age-4 Age-5 Age-6
N Mean SD N Mean SD N Mean SD N Mean SD N Mean SD
2012 Natural 0 12 71 4 25 82 4 5 86 4 0
Hatchery 0 298 70 4 253 81 5 91 88 7 0
2013 Natural 0 4 76 4 7 78 4 0 0
Hatchery 0 288 71 4 200 80 5 2 85 4 0
2014 Natural 0 3 74 2 23 80 5 0 0
Hatchery 0 36 70 3 491 78 5 21 87 6 0
2015 Natural 0 12 74 7 30 79 6 15 86 4 1 87 0
Hatchery 0 133 71 4 437 80 4 79 84 5 0 0 0
1It is assumed for this analysis that all fish not possessing an otolith mark, ad-clipped or hatchery origin coded-wire
tag were natural origin.
Gender Ratios
PRH staff sort and select broodstock from the trap to meet their egg take goals and male-to-
female spawner ratio which is generally 1:2. Additional broodstock was collected from the
OLAFT and ABC. The 2015 broodstock was comprised 67.0% females, resulting in an overall
male to female ratio of 0.44:1.00 which is lower than the historic mean ratio of 0.53:1.00 (Table
11). This lower ratio of males to females resulted from the 235 matings of 1-male x 4-females
during the real-time otolith read/alternative mating strategy study.
Table 11 Numbers of male and female hatchery fall Chinook salmon broodstock at
Priest Rapids Hatchery, Return Years 2001 - 2015. Ratios of males to females
are also provided.
Return Year Males (M) Females (F) M/F Ratio
2001 1,697 3,289 0.52:1.00
2002 1,936 3,628 0.53:1.00
2003 1,667 3,176 0.52:1.00
2004 1,688 3,099 0.54:1.00
2005 1,962 3,326 0.59:1.00
2006 1,777 3,322 0.53:1.00
2007 850 1,301 0.65:1.00
2008 1,823 3,195 0.57:1.00
2009 1,531 3,000 0.51:1.00
2010 1,809 3,447 0.52:1.00
2011 1,858 3,000 0.62:1.00
2012 1,749 3,225 0.54:1.00
2013 1,865 3,578 0.52:1.00
2014a 1,805 3,688 0.49:1:00
2015a 1,697 3,827 0.44:1:00
Mean 1,714 3,205 0.53:1.00 a Includes broodstock used in the 1-male x 4-females alternative mating strategy.

© 2016, PUBLIC UTILITY DISTRICT NO. 2 OF GRANT COUNTY, WASHINGTON.
ALL RIGHTS RESERVED UNDER U.S. AND FOREIGN LAW, TREATIES AND CONVENTIONS.
15
Fecundity
The annual average fecundity for PRH was calculated as the proportion of the total number of
females spawned to the total estimated take of green eggs. The total number of green eggs is
calculated after the first pick of dead eggs from the incubation trays. Fish culture staff weighs
large lots of either dead or live eggs and then sub-samples the lots to calculate a mean individual
egg weight. The number of eggs per lot is estimated by dividing the weight of the each egg lot by
the calculated mean individual egg weight. The egg count for each lot is summed to estimate the
facility egg take. Each egg lot likely contained slightly varying amounts of interstitial water
which might overestimate the egg count.
Fecundity for the 2015 broodstock sampled averaged 3,651 eggs per female which is less than
the historical mean of 3,987 (Table 12). Pre-spawn egg loss was often observed during the
electro-anesthetic and pneumatic fish euthanizing process and may have contributed to reduced
fecundity of fish used for broodstock.
Table 12 Mean fecundity of fall Chinook salmon collected for broodstock at Priest
Rapids Hatchery, Return Years 2001 - 2015
Return Year Egg Take Viable Females Fecundity/Female
2001 10,750,000 3,161 3,401
2002 12,180,000 3,489 3,491
2003 12,814,000 3,078 4,163
2004 12,753,500 3,019 4,224
2005 14,085,000 3,211 4,386
2006 13,511,200 3,217 4,200
2007a 5,067,319 1,249 4,057
2008 12,643,600 3,074 4,113
2009 13,074,798 2,858 4,575
2010 11,903,407 3,342 3,562
2011 12,693,000 3,038 4,178
2012 12,398,389 3,053 4,061
2013 12,947,070 3,473 3,728
2014 14,321,183 3,563 4,019
2015 13,530,988 3,706 3,651
Mean 12,311,546 3,102 3,987 a Did not reach egg take goal.
Fecundities of individual females were taken from sub-samples at PRH during the spawn of 2010
through 2015 broodstock to estimate fecundity by length and age. For the 2013 through 2015
brood year data, we show comparisons between hatchery and natural origin fall Chinook salmon
sampled at PRH which include fork length/fecundity, fork length/egg size (weight) and fork
length and gamete mass. Both these years, we attempted to stratify the females sampled by fork
length categories to obtain fecundity samples for all sizes of fish to better estimate the
relationship between length and fecundity. Comparisons between age classes are not
representative of the females spawned from 2013 through 2015 broodstocks.
M&E staff performed the fecundity estimates on green eggs during the spawn days. The entire
gamete mass was drained of most all ovarian fluid and weighed within 0.1 gram. Sub-sample
sizes ranged between years from 60 or 100 green eggs which were counted out and weighed
within 0.01 gram to estimate individual egg weight (g) for each female. This sample size was

© 2016, PUBLIC UTILITY DISTRICT NO. 2 OF GRANT COUNTY, WASHINGTON.
ALL RIGHTS RESERVED UNDER U.S. AND FOREIGN LAW, TREATIES AND CONVENTIONS.
16
determined to be sufficient based upon previous work that examined different samples sizes
(Richards and Pearsons 2014). The total fecundity of each female was estimated by dividing the
weight of the total egg mass by the calculated mean individual egg weight. Each sample of the
total egg mass likely contained slight varying amounts of ovarian fluid which might over
estimate fecundity.
The fecundity data was pooled for return year 2010 through 2015 to provide a simple linear
regression to predict fecundity based on fork-length (natural and hatchery females combined).
This data shows a strong positive correlation between size and fecundity (Figure 4). The
regression formula may be useful for coarse predictions of egg production for different size fish.
Figure 4 Linear relationship between fecundity and fork length for combined samples
of natural and hatchery origin fall Chinook salmon spawned at Priest Rapids
Hatchery, Return Years 2013 - 2015
Fecundity samples collected in years 2010 through 2012 were not identified as to the origin of
the females. For years 2013 through 2015, fecundity samples were taken from the broodstock at
PRH to collect data associated with fecundity by size, age and origin (hatchery or natural).
Females were selected from both the PRH volunteer broodstock as well as from ponds which
possessed broodstock primarily from the OLAFT and ABC. For the most part, the origin of fish
during sampling was unknown. Therefore, we made a concerted effort to select females that were
not adipose clipped so as to increase the chances of obtaining natural origin fish which were less
common than hatchery origin fish. The origins of females sampled for fecundity were
determined by hatchery marks (i.e., otoliths, adipose clips and coded-wire tags). We make the
assumption that fish not possessing any type of hatchery marks were of natural origin.
The average fecundity by age is given in Table 13. This information is useful for forecasting
potential egg takes based on the numbers and age composition of the forecasted return.
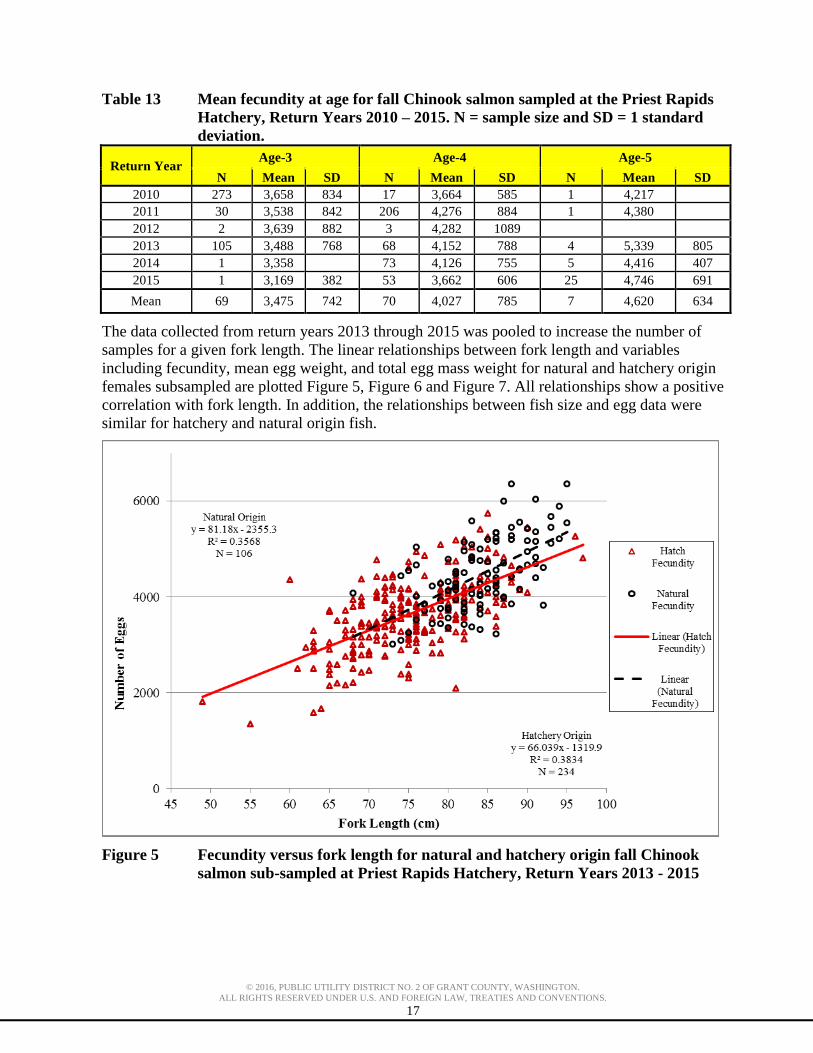
© 2016, PUBLIC UTILITY DISTRICT NO. 2 OF GRANT COUNTY, WASHINGTON.
ALL RIGHTS RESERVED UNDER U.S. AND FOREIGN LAW, TREATIES AND CONVENTIONS.
17
Table 13 Mean fecundity at age for fall Chinook salmon sampled at the Priest Rapids
Hatchery, Return Years 2010 – 2015. N = sample size and SD = 1 standard
deviation.
Return Year Age-3 Age-4 Age-5
N Mean SD N Mean SD N Mean SD
2010 273 3,658 834 17 3,664 585 1 4,217
2011 30 3,538 842 206 4,276 884 1 4,380
2012 2 3,639 882 3 4,282 1089
2013 105 3,488 768 68 4,152 788 4 5,339 805
2014 1 3,358
73 4,126 755 5 4,416 407
2015 1 3,169 382 53 3,662 606 25 4,746 691
Mean 69 3,475 742 70 4,027 785 7 4,620 634
The data collected from return years 2013 through 2015 was pooled to increase the number of
samples for a given fork length. The linear relationships between fork length and variables
including fecundity, mean egg weight, and total egg mass weight for natural and hatchery origin
females subsampled are plotted Figure 5, Figure 6 and Figure 7. All relationships show a positive
correlation with fork length. In addition, the relationships between fish size and egg data were
similar for hatchery and natural origin fish.
Figure 5 Fecundity versus fork length for natural and hatchery origin fall Chinook
salmon sub-sampled at Priest Rapids Hatchery, Return Years 2013 - 2015
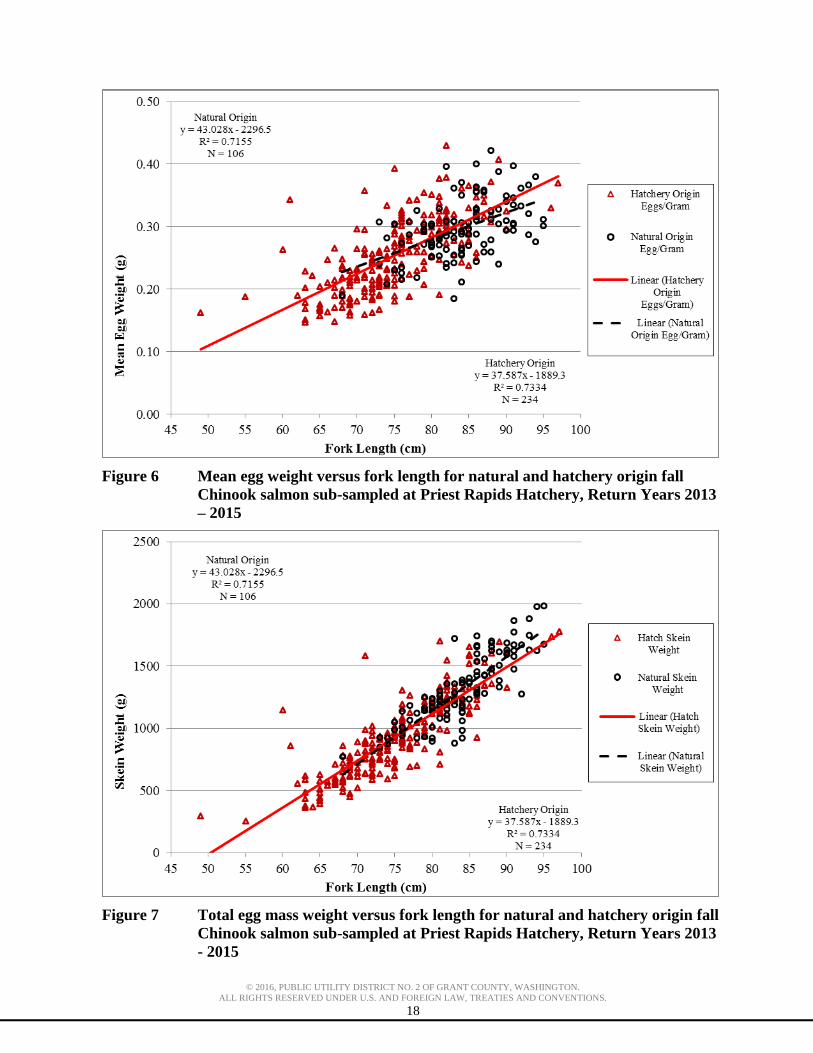
© 2016, PUBLIC UTILITY DISTRICT NO. 2 OF GRANT COUNTY, WASHINGTON.
ALL RIGHTS RESERVED UNDER U.S. AND FOREIGN LAW, TREATIES AND CONVENTIONS.
18
Figure 6 Mean egg weight versus fork length for natural and hatchery origin fall
Chinook salmon sub-sampled at Priest Rapids Hatchery, Return Years 2013
– 2015
Figure 7 Total egg mass weight versus fork length for natural and hatchery origin fall
Chinook salmon sub-sampled at Priest Rapids Hatchery, Return Years 2013
- 2015

© 2016, PUBLIC UTILITY DISTRICT NO. 2 OF GRANT COUNTY, WASHINGTON.
ALL RIGHTS RESERVED UNDER U.S. AND FOREIGN LAW, TREATIES AND CONVENTIONS.
19
9.0 Hatchery Rearing
Number of eggs taken
In 2015, an estimated total of 13,379,404 eggs were collected at the PRH facility. The egg take
goal for return year 2015 was 12,692,460. The egg take goal is calculated annually based on
current program needs. This goal is established to meet the fall Chinook salmon production goals
at both PRH and RSH as well as provide eggs for the salmon in the Classroom Program. Eggs
taken in excess of the two program’s needs for brood year 2015 were shipped to other hatcheries
and education and research organizations. At total of 502,405 eyed eggs were shipped to the
Klickitat Hatchery and 64,099 green or eyed eggs to other research or education organizations.
PRH incubates approximately 7.9 million eyed eggs to produce the 7.3 million smolt release at
the hatchery. Roughly an additional 3.7 million eyed eggs are needed to meet the program goal
of eyed egg delivery to Bonneville Hatchery for the 3.5 million subyearling release at RSH. Egg
takes at PRH were sufficient to meet all hatchery production goals from 1984 through 2015, with
the exception of 2007 (Table 14).
Table 14 Numbers of eggs taken from fall Chinook salmon broodstock collected at
Priest Rapids Hatchery, Return Years 1984 - 2014
Return Year Number of Eggs Taken
Return Year Number of Eggs Taken
1984 10,342,000 2001 10,750,000
1985 10,632,000 2002 12,180,000
1986 22,126,100 2003 12,814,000
1987 24,123,000 2004 12,753,500
1988 16,682,000 2005 14,085,000
1989 13,856,500 2006 13,511,200
1990 9,605,000 2007 5,067,319
1991 6,338,000 2008 12,643,600
1992 11,156,400 2009 13,074,798
1993 14,785,000 2010 11,903,407
1994 16,074,600 2011 12,693,000
1995 17,345,900 2012 12,398,389
1996 14,533,500 2013 13,276,000
1997 17,007,000 2014 14,321,818
1998 13,981,300 2015 12,692,400
1999 16,089,600
2000 15,359,500 8 year (08-15) Mean1 12,875,427
1Began additional annual egg takes starting in return year 2008 for the 3.5 million Ringold Springs Hatchery
Program
Number of acclimation days
The 2015 brood were incubated on a combination of well water and river water before being
transferred to intermediate concrete raceways and then transferred to the concrete holding ponds
for final acclimation before release into the Columbia River in June 2016. The egg takes for the
2015 brood were distributed into twelve batches associated with the dates in which fish were
spawned. The twelfth egg take (December 7) included only one presumed natural origin female
and the eggs were given to PNNL. The number of acclimation days ranged from 119 for the later
egg takes to 140 for the earlier egg takes (Table 15).
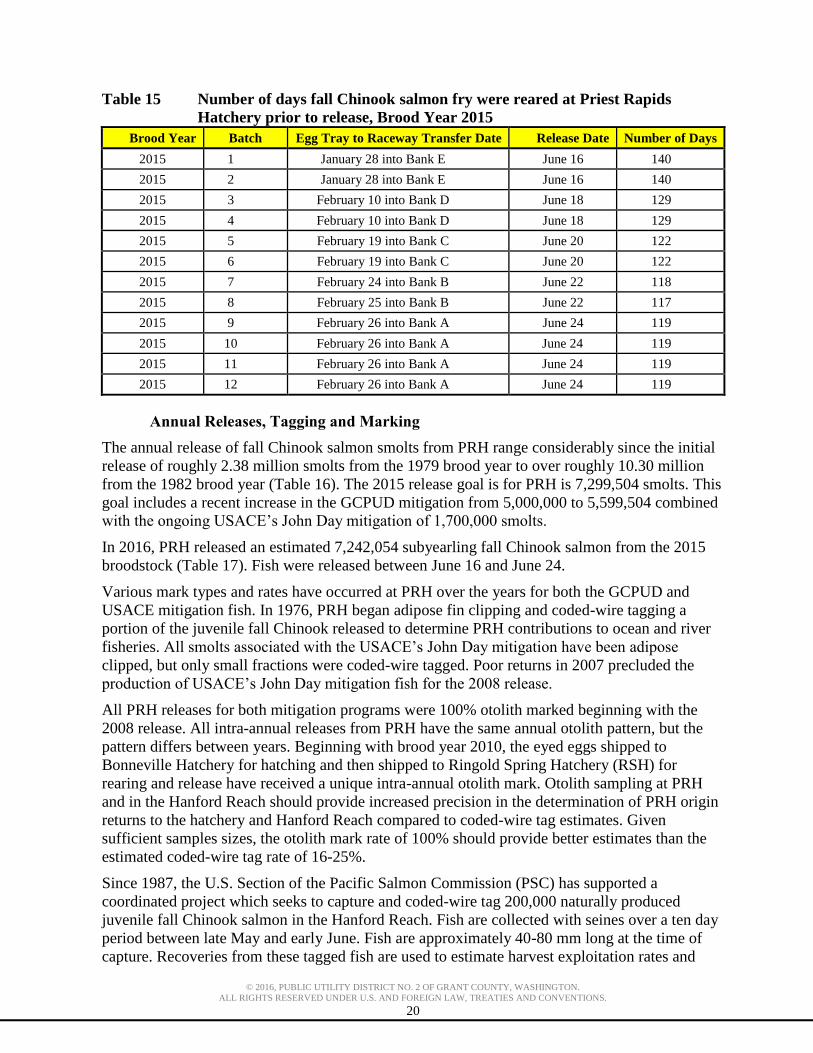
© 2016, PUBLIC UTILITY DISTRICT NO. 2 OF GRANT COUNTY, WASHINGTON.
ALL RIGHTS RESERVED UNDER U.S. AND FOREIGN LAW, TREATIES AND CONVENTIONS.
20
Table 15 Number of days fall Chinook salmon fry were reared at Priest Rapids
Hatchery prior to release, Brood Year 2015
Brood Year Batch Egg Tray to Raceway Transfer Date Release Date Number of Days
2015 1 January 28 into Bank E June 16 140
2015 2 January 28 into Bank E June 16 140
2015 3 February 10 into Bank D June 18 129
2015 4 February 10 into Bank D June 18 129
2015 5 February 19 into Bank C June 20 122
2015 6 February 19 into Bank C June 20 122
2015 7 February 24 into Bank B June 22 118
2015 8 February 25 into Bank B June 22 117
2015 9 February 26 into Bank A June 24 119
2015 10 February 26 into Bank A June 24 119
2015 11 February 26 into Bank A June 24 119
2015 12 February 26 into Bank A June 24 119
Annual Releases, Tagging and Marking
The annual release of fall Chinook salmon smolts from PRH range considerably since the initial
release of roughly 2.38 million smolts from the 1979 brood year to over roughly 10.30 million
from the 1982 brood year (Table 16). The 2015 release goal is for PRH is 7,299,504 smolts. This
goal includes a recent increase in the GCPUD mitigation from 5,000,000 to 5,599,504 combined
with the ongoing USACE’s John Day mitigation of 1,700,000 smolts.
In 2016, PRH released an estimated 7,242,054 subyearling fall Chinook salmon from the 2015
broodstock (Table 17). Fish were released between June 16 and June 24.
Various mark types and rates have occurred at PRH over the years for both the GCPUD and
USACE mitigation fish. In 1976, PRH began adipose fin clipping and coded-wire tagging a
portion of the juvenile fall Chinook released to determine PRH contributions to ocean and river
fisheries. All smolts associated with the USACE’s John Day mitigation have been adipose
clipped, but only small fractions were coded-wire tagged. Poor returns in 2007 precluded the
production of USACE’s John Day mitigation fish for the 2008 release.
All PRH releases for both mitigation programs were 100% otolith marked beginning with the
2008 release. All intra-annual releases from PRH have the same annual otolith pattern, but the
pattern differs between years. Beginning with brood year 2010, the eyed eggs shipped to
Bonneville Hatchery for hatching and then shipped to Ringold Spring Hatchery (RSH) for
rearing and release have received a unique intra-annual otolith mark. Otolith sampling at PRH
and in the Hanford Reach should provide increased precision in the determination of PRH origin
returns to the hatchery and Hanford Reach compared to coded-wire tag estimates. Given
sufficient samples sizes, the otolith mark rate of 100% should provide better estimates than the
estimated coded-wire tag rate of 16-25%.
Since 1987, the U.S. Section of the Pacific Salmon Commission (PSC) has supported a
coordinated project which seeks to capture and coded-wire tag 200,000 naturally produced
juvenile fall Chinook salmon in the Hanford Reach. Fish are collected with seines over a ten day
period between late May and early June. Fish are approximately 40-80 mm long at the time of
capture. Recoveries from these tagged fish are used to estimate harvest exploitation rates and
© 2016, PUBLIC UTILITY DISTRICT NO. 2 OF GRANT COUNTY, WASHINGTON.
ALL RIGHTS RESERVED UNDER U.S. AND FOREIGN LAW, TREATIES AND CONVENTIONS.
21
interception rates for Hanford Reach natural origin fall Chinook salmon. These data have also
more recently been used to estimate the number of natural origin juveniles produced in the
Hanford Reach (Harnish et al. 2012).
WDFW operates the OLAFT at Priest Rapids Dam three days per week beginning in July and
continuing through mid to late October. This project began in 1986 and was designed to sample
steelhead to (1) determine upriver run size, (2) estimate hatchery to natural origin (wild) fish
ratios, (3) determine age class distribution, and (4) evaluate the need for managing returning
hatchery steelhead consistent with ESA recovery objectives. In 2009, WDFW began sampling
fall Chinook salmon at the trap for run composition assessment. A study was initiated in 2010 to
determine the efficacy of using the OLAFT to increase natural origin broodstock for PRH. In
return years 2010 - 2013, adipose fin present and coded-wire tag absent adult fall Chinook
salmon were PIT tagged and released at the OLAFT to assess migration and spawning
distribution. In addition, the OLAFT was used to collect potential natural origin fall Chinook
salmon for incorporation into the broodstock at PRH. This work is presented in Tonseth et al. (in
preparation).

© 2016, PUBLIC UTILITY DISTRICT NO. 2 OF GRANT COUNTY, WASHINGTON.
ALL RIGHTS RESERVED UNDER U.S. AND FOREIGN LAW, TREATIES AND CONVENTIONS.
22
Table 16 Numbers of marked, unmarked, and tagged fall Chinook salmon smolts
released from Priest Rapids Hatchery, Brood Years 1977 – 2015.
Brood Year
Total
Released
Non Ad-Clip
Released AD/CWT CWT Only AD Only PIT
1977 150,625 0 147,338 0 3,287
1978 153,840 0 152,532 0 1,308
1979 3,005,654 2,858,509 147,145 0
1980 4,832,591 4,581,054 251,537 0
1981 5,509,241 5,198,365 310,876 0
1982 10,296,700 9,888,989 407,711 0
1983 9,742,700 9,517,263 222,055 0 3,382
1984 6,363,000 6,253,240 106,960 0 2,800
1985 6,048,000 5,843,176 203,534 0 1,290
1986 7,709,000 7,506,142 201,843 0 1,015
1987 7,709,000 7,501,578 196,221 0 11,201
1988 5,404,550 5,200,080 201,608 0 2,862
1989 6,431,100 6,224,770 194,530 0 11,800
1990 5,333,500 5,134,031 199,469 0
1991 7,000,100 6,798,453 201,647 0
1992 7,134,159 6,939,537 194,622 0
1993 6,705,836 6,520,153 185,683 0
1994 6,702,000 6,526,120 175,880 0 1,500
1995 6,700,000 6,503,811 196,189 0 3,000
1996 6,644,100 6,450,885 193,215 0 3,000
1997 6,737,600 6,541,351 196,249 0 3,000
1998 6,504,800 6,311,140 193,660 0 3,000
1999 6,856,000 6,651,664 204,336 0 3,000
2000 6,862,550 6,661,771 200,779 0 3,000
2001 6,779,035 6,559,109 219,926 0 3,000
2002 6,777,605 6,422,232 355,373 0 3,000
2003 6,814,560 6,415,444 399,116 0 3,000
2004 6,599,838 6,399,766 200,072 0 3,000
2005 6,876,290 6,676,845 199,445 0 3,000
2006 6,743,101 4,912,487 202,000 0 1,628,614 3,000
2007a 4,548,307 4,344,926 202,568 0 813b 3,000
2008 a 6,788,314 4,850,844 218,082 0 1,719,388 2,994
2009 a 6,776,651 3,413,334 619,568 1,026,561 1,717,188 1,995
2010 a 6,798,390 3,383,859 602,580 1,108,990 1,702,961 3,000
2011 a 7,056,948 3,094,666 595,608 598,031 2,768,643 42,844
2012 a 6,822,861 2,905,694 603,930 601,009 2,712,228 42,908
2013 a 7,267,248 3,347,417 603,417 603,439 2,712,975 42,908
2014 a 7,039,543 3,125,734 600,688 600,730 2,712,392 42,621
2015 a 7,242,054 3,317,992 602,116 601,770 2,720,176 42,999 1 PIT tagged are included in the AD Only totals a Entire release was otolith marked bLow returns to PRH precluded the production of the USACE adipose clipped release.

© 2016, PUBLIC UTILITY DISTRICT NO. 2 OF GRANT COUNTY, WASHINGTON.
ALL RIGHTS RESERVED UNDER U.S. AND FOREIGN LAW, TREATIES AND CONVENTIONS.
23
Fish Size and Condition at Release
The data associated with fish size and condition at release from PRH prior to brood year 2013
was obtained from the hatchery staff. The average fish weight was obtained by weighing groups
of roughly 300 fish sampled from each pond to the nearest gram and then dividing the group
weight by the total number of fish weighed. The fork length of each fish from the group weight
was measured to the nearest millimeter to calculate average length and coefficient of variance.
Each of the four ponds was sampled just prior to release. The results were pooled to provide an
average for the facility as a whole. The size and condition data for the 2013 through 2015 broods
were collected by M&E staff. We attempted to collect representative samples from each of the
channel ponds the day prior or day of release. Each fish sampled was individually weighed to the
nearest 0.1 gram and measured for fork length to the nearest millimeter. The results were pooled
to provide an average for the facility as a whole.
The goal for PRH is to release fall Chinook salmon smolts at 50 fish per pound. At release, the
smolts from the 2015 brood averaged 49 fish per pound and 92 mm in fork length (Table 17).
The coefficient of variation of the fork length was 6.1. For brood years 1991 through 2015,
smolts released from PRH have averaged 48 fish per pound with an average fork of 95 and an
average CV of 7.4.
Table 17 Mean length (FL, mm), weight (g and fish/pound), and coefficient of
variations (CV) of fall Chinook smolts released from Priest Rapids Hatchery,
Brood Years 1991 - 2015.
Brood year Release Year
Fork Length (mm) Mean Weight
N Mean CV Grams (g) Fish/pound
1991 1992 93 8.7 8.3 55 1,500
1992 1993 92 8.6 8.3 54 1,500
1993 1994 95 6.9 9.3 49 1,500
1994 1995 96 6.7 9.7 47 1,500
1995 1996 97 6.6 10 45 1,500
1996 1997 95 11 8.7 52 1,500
1997 1998 103 8.9 10.1 45 1,500
1998 1999 95 6.5 9.6 48 1,500
1999 2000 93 6.6 8.9 51 1,500
2000 2001 97 6.3 10.2 45 1,500
2001 2002 96 6.9 10.1 45 1,500
2002 2003 95 6.9 9.5 48 1,500
2003 2004 96 6.8 9.6 48 1,500
2004 2005 95 5.9 9.4 48 1,500
2005 2006 98 6.3 10.1 45 1,500
2006 2007 98 7 9.9 46 1,500
2007 2008 101 8.3 10.2 45 1,200
2008 2009 94 6.7 9.3 49 1,500
2009 2010 94 7.3 9.2 49 1,500
2010 2011 92 9.1 9.7 47 1,500
2011 2012 94 7.1 9.2 49 1,500
2012 2013 95 7.6 9.7 47 1,500
2013 2014 92 8.4 9.0 50 648
2014 2015 91 6.6 8.7 52 1,728
2015 2016 92 6.1 9.3 49 1,595
Mean 95 7.4 9.4 48 1,467
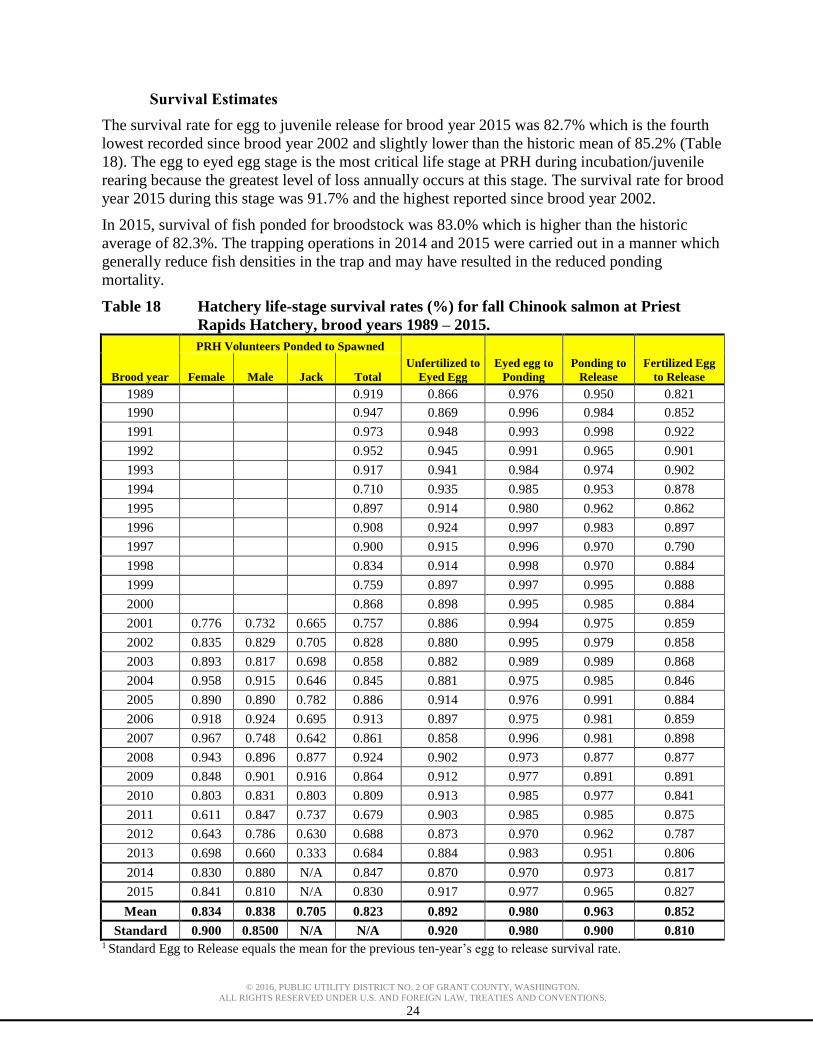
© 2016, PUBLIC UTILITY DISTRICT NO. 2 OF GRANT COUNTY, WASHINGTON.
ALL RIGHTS RESERVED UNDER U.S. AND FOREIGN LAW, TREATIES AND CONVENTIONS.
24
Survival Estimates
The survival rate for egg to juvenile release for brood year 2015 was 82.7% which is the fourth
lowest recorded since brood year 2002 and slightly lower than the historic mean of 85.2% (Table
18). The egg to eyed egg stage is the most critical life stage at PRH during incubation/juvenile
rearing because the greatest level of loss annually occurs at this stage. The survival rate for brood
year 2015 during this stage was 91.7% and the highest reported since brood year 2002.
In 2015, survival of fish ponded for broodstock was 83.0% which is higher than the historic
average of 82.3%. The trapping operations in 2014 and 2015 were carried out in a manner which
generally reduce fish densities in the trap and may have resulted in the reduced ponding
mortality.
Table 18 Hatchery life-stage survival rates (%) for fall Chinook salmon at Priest
Rapids Hatchery, brood years 1989 – 2015.
Brood year
PRH Volunteers Ponded to Spawned
Unfertilized to
Eyed Egg
Eyed egg to
Ponding
Ponding to
Release
Fertilized Egg
to Release Female Male Jack Total
1989 0.919 0.866 0.976 0.950 0.821
1990 0.947 0.869 0.996 0.984 0.852
1991 0.973 0.948 0.993 0.998 0.922
1992 0.952 0.945 0.991 0.965 0.901
1993 0.917 0.941 0.984 0.974 0.902
1994 0.710 0.935 0.985 0.953 0.878
1995 0.897 0.914 0.980 0.962 0.862
1996 0.908 0.924 0.997 0.983 0.897
1997 0.900 0.915 0.996 0.970 0.790
1998 0.834 0.914 0.998 0.970 0.884
1999 0.759 0.897 0.997 0.995 0.888
2000 0.868 0.898 0.995 0.985 0.884
2001 0.776 0.732 0.665 0.757 0.886 0.994 0.975 0.859
2002 0.835 0.829 0.705 0.828 0.880 0.995 0.979 0.858
2003 0.893 0.817 0.698 0.858 0.882 0.989 0.989 0.868
2004 0.958 0.915 0.646 0.845 0.881 0.975 0.985 0.846
2005 0.890 0.890 0.782 0.886 0.914 0.976 0.991 0.884
2006 0.918 0.924 0.695 0.913 0.897 0.975 0.981 0.859
2007 0.967 0.748 0.642 0.861 0.858 0.996 0.981 0.898
2008 0.943 0.896 0.877 0.924 0.902 0.973 0.877 0.877
2009 0.848 0.901 0.916 0.864 0.912 0.977 0.891 0.891
2010 0.803 0.831 0.803 0.809 0.913 0.985 0.977 0.841
2011 0.611 0.847 0.737 0.679 0.903 0.985 0.985 0.875
2012 0.643 0.786 0.630 0.688 0.873 0.970 0.962 0.787
2013 0.698 0.660 0.333 0.684 0.884 0.983 0.951 0.806
2014 0.830 0.880 N/A 0.847 0.870 0.970 0.973 0.817
2015 0.841 0.810 N/A 0.830 0.917 0.977 0.965 0.827
Mean 0.834 0.838 0.705 0.823 0.892 0.980 0.963 0.852
Standard 0.900 0.8500 N/A N/A 0.920 0.980 0.900 0.810 1 Standard Egg to Release equals the mean for the previous ten-year’s egg to release survival rate.

© 2016, PUBLIC UTILITY DISTRICT NO. 2 OF GRANT COUNTY, WASHINGTON.
ALL RIGHTS RESERVED UNDER U.S. AND FOREIGN LAW, TREATIES AND CONVENTIONS.
25
Juvenile PIT Tag Detections at the Priest Rapids Hatchery Array
Roughly 3,000 sub-yearlings at PRH were annually PIT tagged and released from PRH for brood
years 1995 through 2010 to assess timing, migration speed, and juvenile survival from PRH to
McNary Dam. The analysis for these measures is reported annually by the Fish Passage Center
and can be found at www.fpc.org/documents/FPC_memos.html
Beginning with the 2011 brood, approximately 40,000 additional juveniles were annually tagged
and released to bolster the data collected for estimation of juvenile abundance at release and
adult straying. These tags can also be used to estimate adult migration timing, conversion rates
from Bonneville Dam to McNary Dam to PRH, smolt to adult survival rates, as well as fallback
and re-ascension estimates at McNary, Ice Harbor, and Priest Rapids dams. The annual detection
rates are given in Table 19. Prior to the 2012 release (brood year 2011), a PIT tag array
consisting of six antennas was installed in the hatchery discharge channel to detect both juvenile
out-migrants and adult returns. The detection rates reported below account for the relatively few
shed PIT tags found in the rearing raceways. The mortalities routinely recovered from the rearing
ponds were not scanned for PIT tags. This prohibits us from knowing the actual total number of
PIT tagged fish released. Hence, the overall proportion of released PIT tagged fish detected
would likely be higher than reported if we knew the actual number of live PIT tagged fish that
left the ponds.
The overall detection rate for the releases of the 2011 brood year was 70.4%. The release
occurred over an eight day period, with only two days of consecutive releases. Detection rates
for the 2011 brood year release may have been reduced as a result of the array being inundated
by high river elevations during the four consecutive days of release. The overall detection rate
for the 2012 brood year was 3.4%. The low detection rates were likely due to force releasing all
of the smolts in four consecutive days which appears to have overwhelmed the PIT tag detection
equipment. The restricted release period was necessitated by the construction schedule of the
new hatchery.
A concerted effort was made during both the 2013 and 2014 brood year releases to improve the
PIT tag detection efficiency at the PRH array. First, the automatic upload function of the array
was discontinued to reduce the usage demand on the system’s processor. Secondly, the five
releases from the hatchery were conducted over a fourteen day period beginning on June 12 to
spread out over time the number of PIT tags passing the array. This was managed by pulling the
individual weir boards for each pond over a two day period. Overall proportion of PIT tagged
subyearlings detected of the total number tagged for both the 2013 and 2014 brood years were
92.9% and 94.5%, respectively.
The releases of the 2015 brood occurred every two days between June 16 and June 24, 2016 to
accommodate a day versus night release evaluation. During the evaluation, all weir boards for a
given pond where incrementally pulled over an eight hour period on the date of release. The
overall proportion of PIT tagged subyearlings detected was 84.3%. The detected proportions
between release groups varied from 33.6% to 97.0%. These values are lower than the previous
two years. It’s possible that forced releases over an 8 hour period may have resulted in high rates
of tag collision at the array resulting in poor detection efficiency.

© 2016, PUBLIC UTILITY DISTRICT NO. 2 OF GRANT COUNTY, WASHINGTON.
ALL RIGHTS RESERVED UNDER U.S. AND FOREIGN LAW, TREATIES AND CONVENTIONS.
26
Table 19 Number of sub-yearlings PIT tagged, mark and release dates, and the
number of unique tags detected at the array in the Priest Rapids discharge
channel, Brood Years 2011 - 2015.
Brood
Year Tag File
Tagging
Date
Release
Date # Tagged
# of Tags
Recovered
from
Facility
Mortalities
# of Unique
Detections
%
Detected
2011 CSM12114.A01 4/23/2012 6/20/2012 9937 No Data 6,277 63.2
2011 CSM12114.A03 4/23/2012 6/14/2012 9948 No Data 6,674 67.1
2011 CSM12114.A04 4/24/2012 6/15/2012 9997 No Data 6,963 69.7
2011 CSM12115.A02 4/24/2012 6/16/2012 9967 No Data 8,115 81.4
2011 SMP12151.PR1 5/30/2012 6/20/2012 1000 No Data 499 49.9
2011 SMP12151.PR2 5/30/2012 6/16/2012 998 No Data 806 80.8
2011 SMP12152.PR3 5/31/2012 6/12/2012 996 No Data 810 81.3
Totals 42,844 N/A 30,144 70.4
2012 CSM13143.A06 5/23/2013 6/14/2013 9,982 No Data 317 3.2
2012 CSM13143.A07 5/23/2013 6/13/2013 9,983 No Data 267 2.7
2012 CSM13144.A08 5/24/2013 6/12/2013 9,974 No Data 335 3.4
2012 CSM13144.A09 5/24/2013 6/15/2013 9,977 No Data 325 3.3
2012 SMP13149.PR1 5/29/2013 6/15/2013 997 No Data 131 13.1
2012 SMP13149.PR2 5/29/2013 6/14/2013 996 No Data 33 3.3
2012 SMP13150.PR3 5/30/2013 6/12/2013 999 No Data 48 4.9
Totals 42,908 N/A 1,456 3.4
2013 CSM14148.PRA 5/28/2014 6/25/2014 7,994 21 7,215 90.5
2013 CSM14148.PRB 5/28/2014 6/23/2014 7,998 14 7,389 92.5
2013 CSM14149.PRC 5/29/2014 6/18/2014 7,996 11 7,443 93.2
2013 CSM14149.PRD 5/29/2014 6/16/2014 7,993 6 7,662 95.9
2013 CSM14149.PRE 5/29/2014 6/12/2014 7,998 7 7,407 92.7
2013 SMP14148.PR1 5/29/2014 6/25/2014 996 0 914 91.8
2013 SMP14148.PR2 5/29/2014 6/18/2014 994 0 927 93.3
2013 SMP14149.PR3 5/30/2014 6/12/2014 998 0 951 95.3
Totals 42,967 59 39,908 92.9
2014 CSM15147.PRE 5/27/2015 6/12/2015 7,999 169 7,438 95
2014 CSM15147.PRD 5/27/2015 6/15/2015 7,996 39 7,685 96.6
2014 CSM15147.PRC 5/27/2015 6/18/2015 7,996 63 7,524 94.8
2014 CSM15147.PRB 5/28/2015 6/22/2015 7,998 50 7,696 96.8
2014 CSM15147.PRA 5/28/2015 6/25/2015 7,994 31 7,447 93.5
2014 SMP15140.PR1 5/20/2015 6/25/2015 993 0 940 94.7
2014 SMP15140.PR2 5/20/2015 6/18/2015 998 0 946 94.8
2014 SMP15141.PR3 5/21/2015 6/12/2015 999 0 935 93.6
Totals 42,973 352 40,611 95.3
2015 CSM16153.PRE 6/01/2016 6/16/2016 7,996 13 6,032 75.6
2015 CSM16153.PRD 6/01/2016 6/18/2016 7,998 224 7,537 97.0
2015 CSM16153.PRC 6/01/2016 6/20/2016 7,985 137 6,777 86.4
2015 CSM16154.PRB 6/02/2016 6/22/2016 7,993 13 7,136 89.4
2015 CSM16154.PRA 6/02/2016 6/24/2016 7,990 26 6,590 82.7
2015 SMP16153.PR1 6/01/2016 6/24/2016 995 88 513 56.6
2015 SMP16153.PR2 6/01/2016 6/20/2016 998 5 795 80.1
2015 SMP16154.PR3 6/02/2016 6/16/2016 1001 109 300 33.6
Totals 42,956 615 35,680 84.3

© 2016, PUBLIC UTILITY DISTRICT NO. 2 OF GRANT COUNTY, WASHINGTON.
ALL RIGHTS RESERVED UNDER U.S. AND FOREIGN LAW, TREATIES AND CONVENTIONS.
27
10.0 Adult Fish Pathogen Monitoring
At spawning, adult fall Chinook are sampled for viral pathogens and Renibacterium
salmoninarum, the causative agent for bacterial kidney disease (BKD). Viral inspections
included sampling the ovarian fluid and kidney/spleen for pathogens. All results of viral testing
in 2015 were negative (Table 20). Annual testing for BKD was initiated with the 2008
broodstock to address concerns associated with shipping eyed-eggs to Bonneville Hatchery for
the USACE RSH production. The risk of BKD was assayed using the enzyme linked
immunosorbent assay (ELISA). Results of adult broodstock BKD monitoring in 2015 indicated
that 59 of the 60 (98.3%) females tested had ELISA values less than an optical density of 0.10
(Table 21).
Table 20 Viral inspections of fall Chinook salmon broodstock at Priest Rapids
Hatchery, Return Years 1991 - 2015
Year Date(s) Stock Life stage Ovarian Fluid Kidney/Spleen Results
1991 28-Oct, 4, 13-Nov Priest Rapids Adult 150 60 Negative
1992 2,9-Nov Priest Rapids Adult 150 60 Negative
1993 25-Oct, 1-Nov Priest Rapids Adult 150 60 Negative
1994 7-Nov Priest Rapids Adult 60 60 Negative
1995 9,13,19,21-Nov Priest Rapids Adult 160 160 Negative
1996 17-Nov Priest Rapids Adult 60 60 Negative
1997 17-Nov Priest Rapids Adult 60 60 Negative
1998 16-Nov Priest Rapids Adult 60 60 Negative
1999 8-Nov Priest Rapids Adult 60 60 Negative
2000 13-Nov Priest Rapids Adult 60 60 Negative
2001 13-Nov Priest Rapids Adult 60 60 Negative
2002 13-Nov Priest Rapids Adult 60 60 Negative
2003 17-Nov Priest Rapids Adult 60 60 Negative
2004 8-Nov Priest Rapids Adult 60 60 Negative
2005 14-Nov Priest Rapids Adult 60 60 Negative
2006 6-Nov Priest Rapids Adult 60 60 Negative
2007 5-Nov Priest Rapids Adult 60 60 Negative
2008 3-Nov Priest Rapids Adult 60 60 Negative
2009 2-Nov Priest Rapids Adult 60 60 Negative
2010 15-Nov Priest Rapids Adult 60 60 Negative
2011 7,14, 21-Nov Priest Rapids Adult 180 180 Negative
2012 5-Nov Priest Rapids Adult 60 60 Negative
2013 18-Nov Priest Rapids Adult 60 60 Negative
2014 18-Nov Priest Rapids Adult 60 60 Negative
2015 11-Nov Priest Rapids Adult 60 60 Negative

© 2016, PUBLIC UTILITY DISTRICT NO. 2 OF GRANT COUNTY, WASHINGTON.
ALL RIGHTS RESERVED UNDER U.S. AND FOREIGN LAW, TREATIES AND CONVENTIONS.
28
Table 21 ELISA test results to determine risk of bacterial kidney disease of adult
female fall Chinook salmon broodstock at Priest Rapids Hatchery, Return
Years 2008 – 2015
Year Stock Number %Below-Low
(<0.10)
% Low
0.11 - 0.19
% Mod
(0.2 - 0.45) % High
(> 0.45) 2008 Priest Rapids 60 100.0% 0.0% 0.0% 0.0%
2009 Priest Rapids 60 100.0% 0.0% 0.0% 0.0%
2010 Priest Rapids 60 100.0% 0.0% 0.0% 0.0%
2011 Priest Rapids 135 100.0% 0.0% 0.0% 0.0%
2012 Priest Rapids 60 98.3% 0.0% 1.7% 0.0%
2013 Priest Rapids 60 100.0% 0.0% 0.0% 0.0%
2014 Priest Rapids 60 100.0% 0.0% 0.0% 0.0%
2015 Priest Rapids 60 98.3% 1.7% 0.0% 0.0%
11.0 Juvenile Fish Health Inspections
Juvenile fish are visually inspected on a monthly basis following ponding. The 2015 brood year
juveniles were healthy throughout the rearing period (Table 22). Inspection results for brood
years 1995 through 2009 are provided in Appendix D.
Table 22 Juvenile fish health inspections for Priest Rapids Hatchery fall Chinook
salmon, Brood Years 2006 - 2015
Date Stock
Brood
Year Condition
18-Feb-10 Priest Rapids 2009 Coagulated Yolk Syndrome observed in some fish sampled
1-Apr-10 Priest Rapids 2009 Healthy
19-May-10 Priest Rapids 2009 Healthy
25-Mar-11 Priest Rapids 2010 Healthy
18-Apr-11 Priest Rapids 2010 Healthy
06-Jun-11 Priest Rapids 2010 Healthy
01-Mar-12 Priest Rapids 2011 Healthy
26-Apr-12 Priest Rapids 2011 Healthy
24-May-12 Priest Rapids 2011 Healthy
11-Feb-13 Priest Rapids 2012 Healthy
3-Mar-13 Priest Rapids 2012 Healthy
29-Apr-13 Priest Rapids 2012 Healthy
28-May-13 Priest Rapids 2012 Healthy
27-Mar-14 Priest Rapids 2013 Dropout Syndrome present
23-Apr-14 Priest Rapids 2013 Dropout Syndrome present
29-May-14 Priest Rapids 2013 Healthy
26-Feb-15 Priest Rapids 2014 Coagulated Yolk Syndrome observed in some fish sampled
26-Mar-15 Priest Rapids 2014 Healthy
21-Apr-15 Priest Rapids 2014 Healthy
28-May-15 Priest Rapids 2014 Healthy
22-June-15 Priest Rapids 2014 Columnaris present in some fish sampled from Pond B.
24-Feb-16 Priest Rapids 2015 Healthy
15-Mar-16 Priest Rapids 2015 Coagulated Yolk Syndrome observed in some fish sampled
15-June-16 Priest Rapids 2015 Mild Ich infection but healthy and ready for release
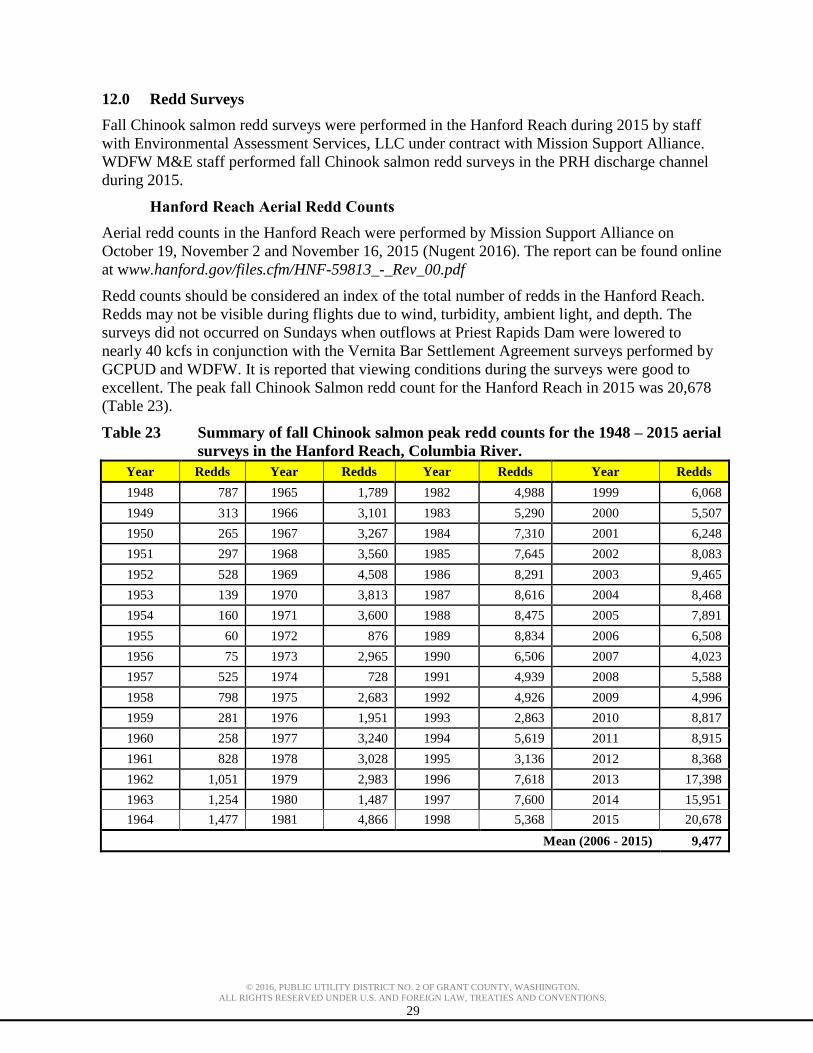
© 2016, PUBLIC UTILITY DISTRICT NO. 2 OF GRANT COUNTY, WASHINGTON.
ALL RIGHTS RESERVED UNDER U.S. AND FOREIGN LAW, TREATIES AND CONVENTIONS.
29
12.0 Redd Surveys
Fall Chinook salmon redd surveys were performed in the Hanford Reach during 2015 by staff
with Environmental Assessment Services, LLC under contract with Mission Support Alliance.
WDFW M&E staff performed fall Chinook salmon redd surveys in the PRH discharge channel
during 2015.
Hanford Reach Aerial Redd Counts
Aerial redd counts in the Hanford Reach were performed by Mission Support Alliance on
October 19, November 2 and November 16, 2015 (Nugent 2016). The report can be found online
at www.hanford.gov/files.cfm/HNF-59813_-_Rev_00.pdf
Redd counts should be considered an index of the total number of redds in the Hanford Reach.
Redds may not be visible during flights due to wind, turbidity, ambient light, and depth. The
surveys did not occurred on Sundays when outflows at Priest Rapids Dam were lowered to
nearly 40 kcfs in conjunction with the Vernita Bar Settlement Agreement surveys performed by
GCPUD and WDFW. It is reported that viewing conditions during the surveys were good to
excellent. The peak fall Chinook Salmon redd count for the Hanford Reach in 2015 was 20,678
(Table 23).
Table 23 Summary of fall Chinook salmon peak redd counts for the 1948 – 2015 aerial
surveys in the Hanford Reach, Columbia River.
Year Redds Year Redds Year Redds Year Redds
1948 787 1965 1,789 1982 4,988 1999 6,068
1949 313 1966 3,101 1983 5,290 2000 5,507
1950 265 1967 3,267 1984 7,310 2001 6,248
1951 297 1968 3,560 1985 7,645 2002 8,083
1952 528 1969 4,508 1986 8,291 2003 9,465
1953 139 1970 3,813 1987 8,616 2004 8,468
1954 160 1971 3,600 1988 8,475 2005 7,891
1955 60 1972 876 1989 8,834 2006 6,508
1956 75 1973 2,965 1990 6,506 2007 4,023
1957 525 1974 728 1991 4,939 2008 5,588
1958 798 1975 2,683 1992 4,926 2009 4,996
1959 281 1976 1,951 1993 2,863 2010 8,817
1960 258 1977 3,240 1994 5,619 2011 8,915
1961 828 1978 3,028 1995 3,136 2012 8,368
1962 1,051 1979 2,983 1996 7,618 2013 17,398
1963 1,254 1980 1,487 1997 7,600 2014 15,951
1964 1,477 1981 4,866 1998 5,368 2015 20,678
Mean (2006 - 2015) 9,477

© 2016, PUBLIC UTILITY DISTRICT NO. 2 OF GRANT COUNTY, WASHINGTON.
ALL RIGHTS RESERVED UNDER U.S. AND FOREIGN LAW, TREATIES AND CONVENTIONS.
30
Redd Distribution
The main spawning areas observed during the 2015 counts were located near Vernita Bar and
among Islands 8-10 (Table 24 & Figure 8). Historical redd counts by location from 2001 through
2015 are included in Appendix E of this report.
Table 24 Number of fall Chinook salmon redds counted in difference reaches on the
Hanford Reach area of the Columbia River during the October 2015 through
November 2015 aerial redd counts. (Data provided by Mission Support
Alliance)
General Location
Start
KM
End
KM
Total
Length 10/19 11/2 11/16
Max
Count
Average Redd Per
River KM
Islands 17-21 545 558 13 0 0 0 0 0
Islands 11-16 558 573 15 4 581 1,193 1,193 80
Islands 8-10 587 593 6 18 1,320 3,145 3,145 524
Near Island 7 593 594 1 1 535 800 800 800
Island 6 (lower half) 594 599 5 5 1,630 2,315 2,315 463
Island 4, 5 and upper 6 599 602 3 13 1,550 2,540 2,540 847
Near Island 3 602 604 2 5 320 1,100 1,100 550
Near Island 2 604 606 2 12 1,400 1,900 1,900 950
Near Island 1 606 608 2 0 400 1,000 1,000 500
Near Coyote Rapids 608 619 11 15 215 765 765 70
Midway (China Bar) 620 630 10 3 471 1,730 1,730 173
Near Vernita Bar 630 635 5 10 3,250 4,175 4,175 835
Near Priest Rapids Dam 635 638 3 0 10 15 15 5
Total -- -- -- 86 11,682 20,678 20,678 --
Figure 8 Distribution of fall Chinook salmon redd counts by location for the 2015
aerial surveys in the Hanford Reach, Columbia River (Data provided by
Mission Support Alliance)
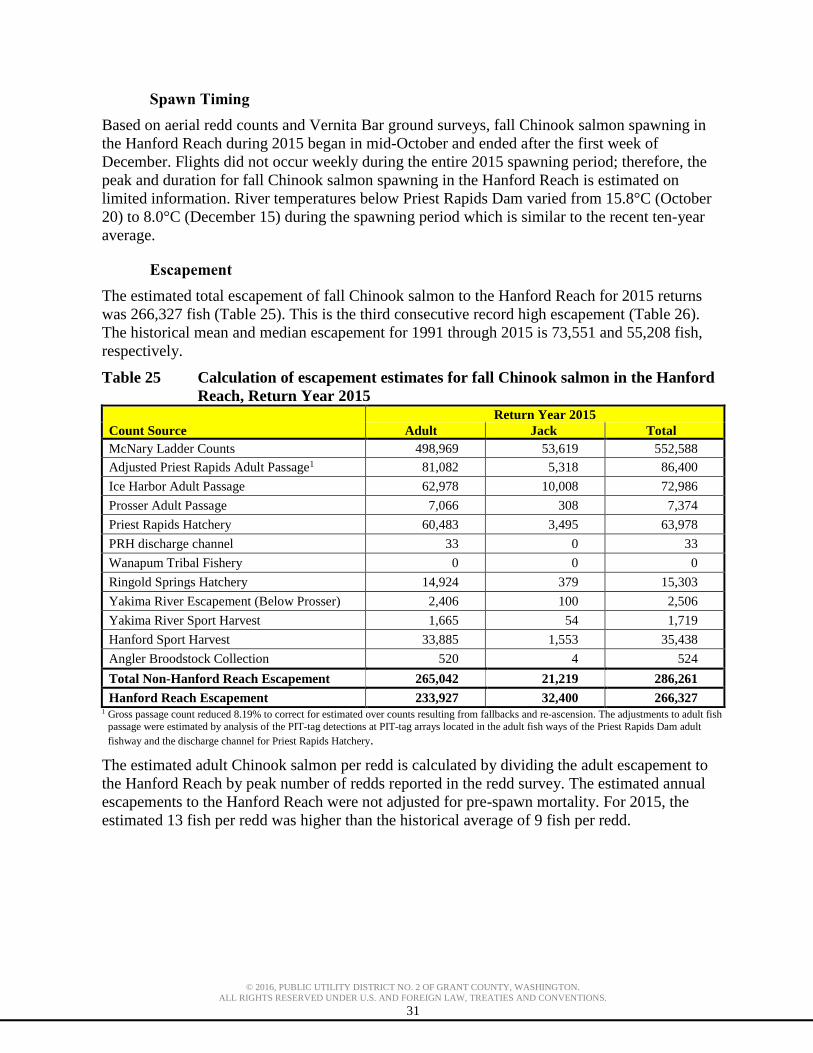
© 2016, PUBLIC UTILITY DISTRICT NO. 2 OF GRANT COUNTY, WASHINGTON.
ALL RIGHTS RESERVED UNDER U.S. AND FOREIGN LAW, TREATIES AND CONVENTIONS.
31
Spawn Timing
Based on aerial redd counts and Vernita Bar ground surveys, fall Chinook salmon spawning in
the Hanford Reach during 2015 began in mid-October and ended after the first week of
December. Flights did not occur weekly during the entire 2015 spawning period; therefore, the
peak and duration for fall Chinook salmon spawning in the Hanford Reach is estimated on
limited information. River temperatures below Priest Rapids Dam varied from 15.8°C (October
20) to 8.0°C (December 15) during the spawning period which is similar to the recent ten-year
average.
Escapement
The estimated total escapement of fall Chinook salmon to the Hanford Reach for 2015 returns
was 266,327 fish (Table 25). This is the third consecutive record high escapement (Table 26).
The historical mean and median escapement for 1991 through 2015 is 73,551 and 55,208 fish,
respectively.
Table 25 Calculation of escapement estimates for fall Chinook salmon in the Hanford
Reach, Return Year 2015
Count Source
Return Year 2015
Adult Jack Total
McNary Ladder Counts 498,969 53,619 552,588
Adjusted Priest Rapids Adult Passage1 81,082 5,318 86,400
Ice Harbor Adult Passage 62,978 10,008 72,986
Prosser Adult Passage 7,066 308 7,374
Priest Rapids Hatchery 60,483 3,495 63,978
PRH discharge channel 33 0 33
Wanapum Tribal Fishery 0 0 0
Ringold Springs Hatchery 14,924 379 15,303
Yakima River Escapement (Below Prosser) 2,406 100 2,506
Yakima River Sport Harvest 1,665 54 1,719
Hanford Sport Harvest 33,885 1,553 35,438
Angler Broodstock Collection 520 4 524
Total Non-Hanford Reach Escapement 265,042 21,219 286,261
Hanford Reach Escapement 233,927 32,400 266,327 1 Gross passage count reduced 8.19% to correct for estimated over counts resulting from fallbacks and re-ascension. The adjustments to adult fish
passage were estimated by analysis of the PIT-tag detections at PIT-tag arrays located in the adult fish ways of the Priest Rapids Dam adult
fishway and the discharge channel for Priest Rapids Hatchery.
The estimated adult Chinook salmon per redd is calculated by dividing the adult escapement to
the Hanford Reach by peak number of redds reported in the redd survey. The estimated annual
escapements to the Hanford Reach were not adjusted for pre-spawn mortality. For 2015, the
estimated 13 fish per redd was higher than the historical average of 9 fish per redd.
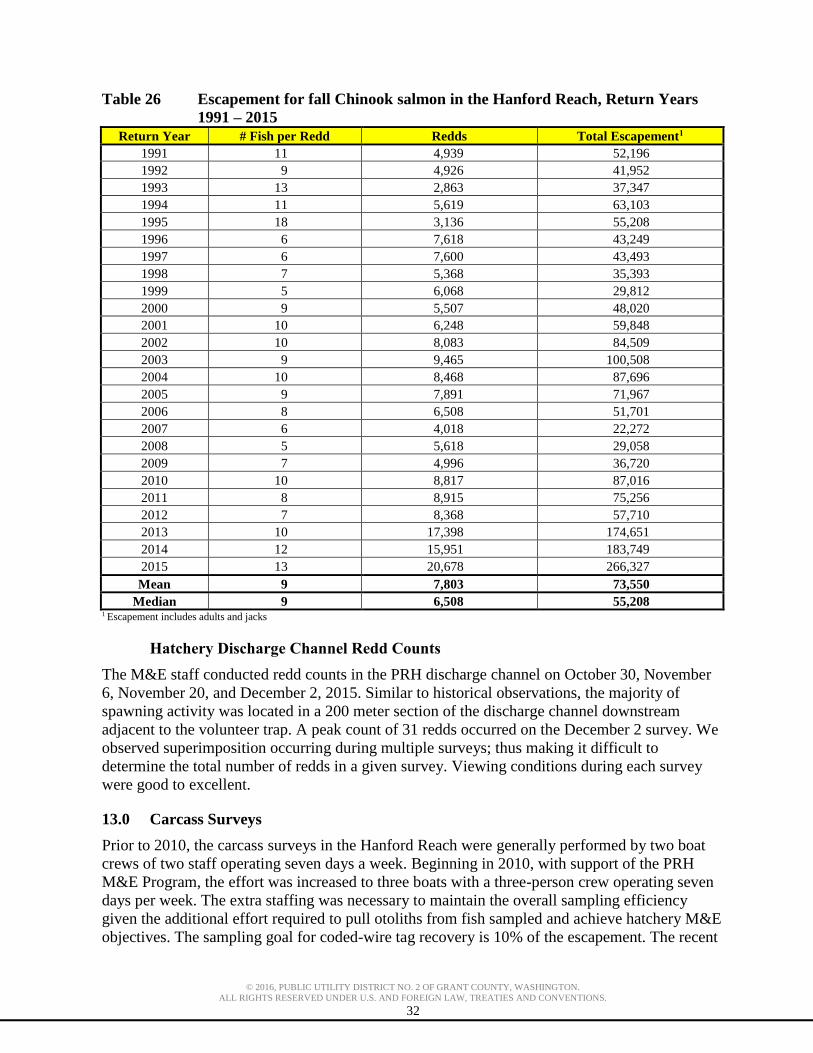
© 2016, PUBLIC UTILITY DISTRICT NO. 2 OF GRANT COUNTY, WASHINGTON.
ALL RIGHTS RESERVED UNDER U.S. AND FOREIGN LAW, TREATIES AND CONVENTIONS.
32
Table 26 Escapement for fall Chinook salmon in the Hanford Reach, Return Years
1991 – 2015
Return Year # Fish per Redd Redds Total Escapement1
1991 11 4,939 52,196
1992 9 4,926 41,952
1993 13 2,863 37,347
1994 11 5,619 63,103
1995 18 3,136 55,208
1996 6 7,618 43,249
1997 6 7,600 43,493
1998 7 5,368 35,393
1999 5 6,068 29,812
2000 9 5,507 48,020
2001 10 6,248 59,848
2002 10 8,083 84,509
2003 9 9,465 100,508
2004 10 8,468 87,696
2005 9 7,891 71,967
2006 8 6,508 51,701
2007 6 4,018 22,272
2008 5 5,618 29,058
2009 7 4,996 36,720
2010 10 8,817 87,016
2011 8 8,915 75,256
2012 7 8,368 57,710
2013 10 17,398 174,651
2014 12 15,951 183,749
2015 13 20,678 266,327
Mean 9 7,803 73,550
Median 9 6,508 55,208 1 Escapement includes adults and jacks
Hatchery Discharge Channel Redd Counts
The M&E staff conducted redd counts in the PRH discharge channel on October 30, November
6, November 20, and December 2, 2015. Similar to historical observations, the majority of
spawning activity was located in a 200 meter section of the discharge channel downstream
adjacent to the volunteer trap. A peak count of 31 redds occurred on the December 2 survey. We
observed superimposition occurring during multiple surveys; thus making it difficult to
determine the total number of redds in a given survey. Viewing conditions during each survey
were good to excellent.
13.0 Carcass Surveys
Prior to 2010, the carcass surveys in the Hanford Reach were generally performed by two boat
crews of two staff operating seven days a week. Beginning in 2010, with support of the PRH
M&E Program, the effort was increased to three boats with a three-person crew operating seven
days per week. The extra staffing was necessary to maintain the overall sampling efficiency
given the additional effort required to pull otoliths from fish sampled and achieve hatchery M&E
objectives. The sampling goal for coded-wire tag recovery is 10% of the escapement. The recent

© 2016, PUBLIC UTILITY DISTRICT NO. 2 OF GRANT COUNTY, WASHINGTON.
ALL RIGHTS RESERVED UNDER U.S. AND FOREIGN LAW, TREATIES AND CONVENTIONS.
33
record returns to the Hanford Reach have increased the level of effort required to pursue the 10%
sampling goal.
Carcass surveys were performed from November 4 through December 13, 2015. All recovered
carcasses were sampled for the presence of a coded-wire tag. Of those, 14% were sampled (i.e.,
random systematic 1:7 rate) for scales (age), otoliths, gender, length, and egg retention. All
carcasses recovered were chopped in half after sampling to prevent the chance of double
sampling.
Similar to methods used since 2010, the carcass survey crews recorded the sections in which
carcasses were recovered in the Hanford Reach and adjacent areas. The Hanford Reach survey is
divided into Sections 1 through 5 (Figure 9). The Priest Rapids Pool is designated as Section 6.
The PRH discharge channel and the area of the Columbia River immediately below the discharge
channel are designated as Sections 7 and 8, respectively. The fall Chinook salmon carcasses
recovered in Section 8 were likely wash outs from the hatchery discharge channel.
Section 1. Priest Rapids Dam to Vernita Bridge (14 km)
Section 2. Vernita Bridge to Island 2 (19 km)
Section 3. Island 2 to Power line Towers at Hanford town site (21 km)
Section 4. Power line Towers to Wooded Island (21 km)
Section 5. Wooded Island to Interstate 182 Bridge (19 km)
Section 6. Priest Rapids Pool (34 km)
Section 7. Priest Rapids Hatchery discharge channel (0.5 km)
Section 8. Columbia River at the mouth of the Hatchery discharge channel (0.5 km)
Figure 9 Locations of aerial redd index areas and river survey sections in the Hanford
Reach.

© 2016, PUBLIC UTILITY DISTRICT NO. 2 OF GRANT COUNTY, WASHINGTON.
ALL RIGHTS RESERVED UNDER U.S. AND FOREIGN LAW, TREATIES AND CONVENTIONS.
34
Hanford Reach Carcass Survey: Section 1 – 5
Staff recovered a record 17,738 fall Chinook salmon in the Hanford Reach in 2015; equating to
6.7% of the estimated fall Chinook salmon escapement (Table 27). The annual number of fall
Chinook salmon carcass recovered in the Hanford Reach for the period of 1991 through 2015 is
provided in Appendix F.
Table 27 Numbers and Percentages of fall Chinook salmon carcasses sampled within
each survey section and of the total escapement on the Hanford Reach,
Return Years, 2010 - 2015.
Return
Year # 1 # 2 # 3 # 4 # 5
Total
Sampled
Escapement
2010 1,832 (18.7%) 519 (5.3%) 3,129 (32.0%) 3,362 (34.4%) 937 (9.6%) 9,779 (11.2%) 87,016
2011 1,581 (18.8%) 160 (1.9%) 2,606 (31.1%) 2,622 (31.2%) 1,422 (16.9%) 8,391 (11.1%) 75,256
2012 1,091 (16.0%) 149 (2.2%) 1,685 (24.7%) 2,213 (32.5%) 1,676 (24.6%) 6,814 (11.8%) 57,715
2013 2,182 (16.7%) 1,973 (15.1%) 2,844 (21.8%) 3,774 (28.9%) 2,298 (17.6%) 13,071 (7.5%) 174,651
2014 2,682 (16.0%) 1,142 (6.8) 5,544 (33.1%) 4,573 (27.3%) 2,815 (16.8%) 16,756 (9.1%) 183,680
2015 2,913 (16.4%) 823 (4.6%) 6,187 (34.9%) 5,868 (33.1%) 1,947 (11.0%) 17,738 (6.7%) 266,346
Mean 2,047 (16.9%) 794 (6.6%) 3,666 (30.3%) 3,735 (30.9%) 1,849 (15.3%) 12,091 (8.6%) 140,777
The survey effort was not equal for each section. Sections 3 and 4 were surveyed the most
because these sections generally contain the largest number of carcasses (Table 28). As each
season progresses, crews focused their effort in sections which provided greater chances to
recover carcasses.
Table 28 Number of carcass surveys conducted by section in the Hanford Reach,
Return Years 2010 – 2015.
Return Year # 1 # 2 # 3 # 4 # 5 Total
2010 21 6 26 26 11 90
2011 33 5 38 29 13 118
2012 19 4 26 28 24 101
2013 18 15 16 17 13 79
2014 23 17 30 31 24 125
2015 23 8 35 37 13 116
Mean 23 9 29 28 16 105
Proportion of Escapement Sampled: Section 1 – 5
The spawning escapement for sections 1 through 5 was estimated by the proportion of redds
counted in aerial surveys to the estimated escapement of natural spawners to the Hanford Reach
(see Section 14 - Redd Surveys). The calculations for estimating the escapement to the Hanford
Reach are given in Appendix G.
We recently identified through the carcass bias assessment that an unknown number of carcasses
drift into downstream sections after spawning. The recovery of these carcasses confounds the
estimate of the spawning escapement sampled by section as shown in Table 29. For example,
there were no redds identified in Section 5 but 1,947 carcasses were recovered in that section. It
is likely that sections 1 and 3 which have the greatest number of redds and largest spawning
escapement end up with a net loss of carcasses to downstream sections. In 2015, we continued a
pilot study to evaluate the magnitude and distribution of post spawn carcass drift. The
preliminary results of this study are included in the Appendix H.
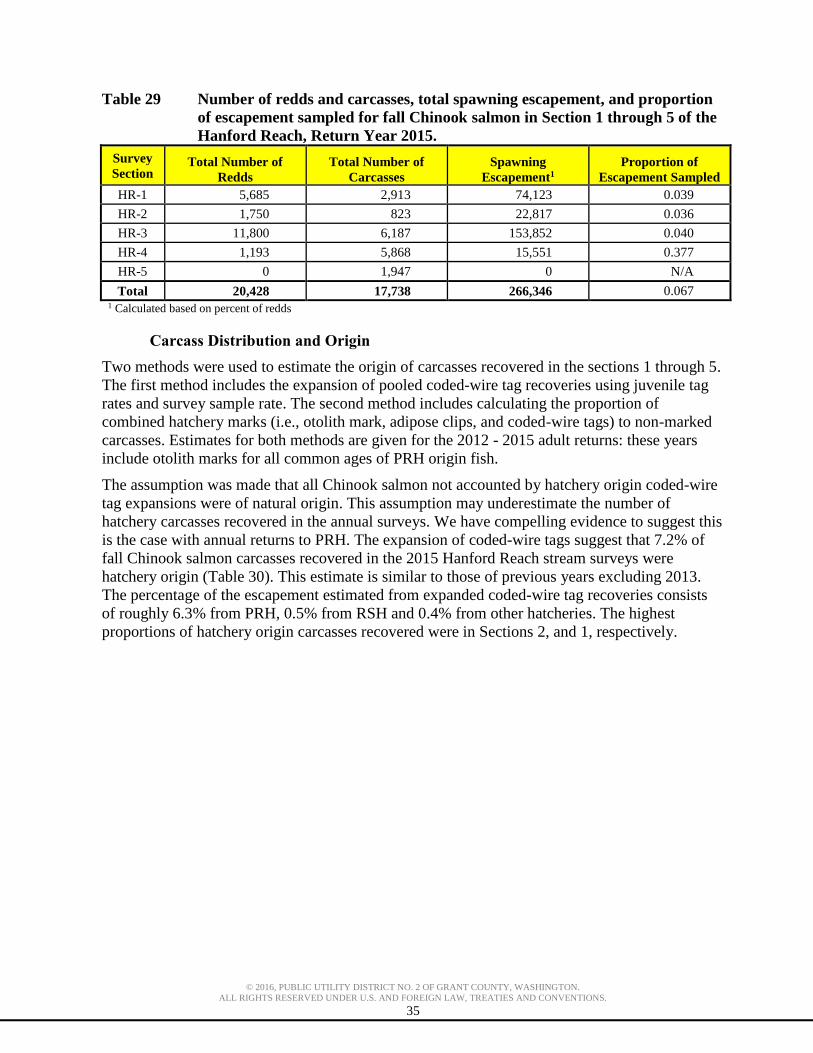
© 2016, PUBLIC UTILITY DISTRICT NO. 2 OF GRANT COUNTY, WASHINGTON.
ALL RIGHTS RESERVED UNDER U.S. AND FOREIGN LAW, TREATIES AND CONVENTIONS.
35
Table 29 Number of redds and carcasses, total spawning escapement, and proportion
of escapement sampled for fall Chinook salmon in Section 1 through 5 of the
Hanford Reach, Return Year 2015.
Survey
Section Total Number of
Redds
Total Number of
Carcasses
Spawning
Escapement1
Proportion of
Escapement Sampled
HR-1 5,685 2,913 74,123 0.039
HR-2 1,750 823 22,817 0.036
HR-3 11,800 6,187 153,852 0.040
HR-4 1,193 5,868 15,551 0.377
HR-5 0 1,947 0 N/A
Total 20,428 17,738 266,346 0.067 1 Calculated based on percent of redds
Carcass Distribution and Origin
Two methods were used to estimate the origin of carcasses recovered in the sections 1 through 5.
The first method includes the expansion of pooled coded-wire tag recoveries using juvenile tag
rates and survey sample rate. The second method includes calculating the proportion of
combined hatchery marks (i.e., otolith mark, adipose clips, and coded-wire tags) to non-marked
carcasses. Estimates for both methods are given for the 2012 - 2015 adult returns: these years
include otolith marks for all common ages of PRH origin fish.
The assumption was made that all Chinook salmon not accounted by hatchery origin coded-wire
tag expansions were of natural origin. This assumption may underestimate the number of
hatchery carcasses recovered in the annual surveys. We have compelling evidence to suggest this
is the case with annual returns to PRH. The expansion of coded-wire tags suggest that 7.2% of
fall Chinook salmon carcasses recovered in the 2015 Hanford Reach stream surveys were
hatchery origin (Table 30). This estimate is similar to those of previous years excluding 2013.
The percentage of the escapement estimated from expanded coded-wire tag recoveries consists
of roughly 6.3% from PRH, 0.5% from RSH and 0.4% from other hatcheries. The highest
proportions of hatchery origin carcasses recovered were in Sections 2, and 1, respectively.
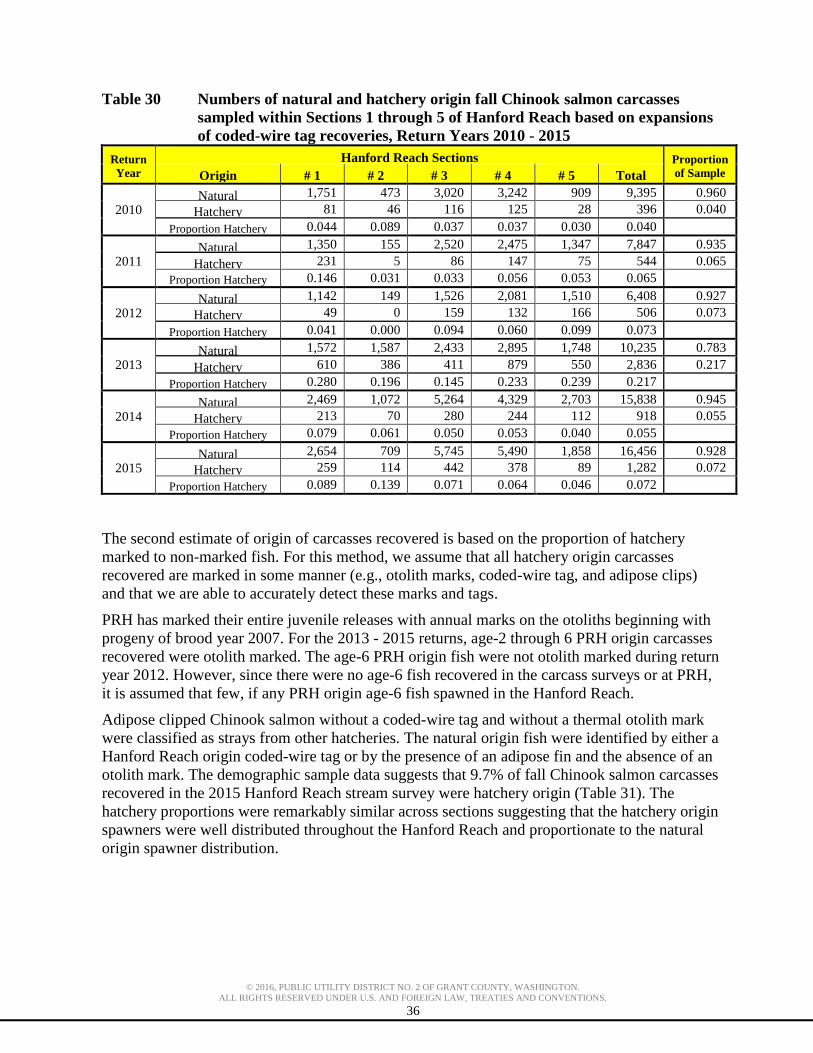
© 2016, PUBLIC UTILITY DISTRICT NO. 2 OF GRANT COUNTY, WASHINGTON.
ALL RIGHTS RESERVED UNDER U.S. AND FOREIGN LAW, TREATIES AND CONVENTIONS.
36
Table 30 Numbers of natural and hatchery origin fall Chinook salmon carcasses
sampled within Sections 1 through 5 of Hanford Reach based on expansions
of coded-wire tag recoveries, Return Years 2010 - 2015
Return
Year
Hanford Reach Sections Proportion
of Sample Origin # 1 # 2 # 3 # 4 # 5 Total
2010 Natural 1,751 473 3,020 3,242 909 9,395 0.960
Hatchery 81 46 116 125 28 396 0.040
Proportion Hatchery 0.044 0.089 0.037 0.037 0.030 0.040
2011 Natural 1,350 155 2,520 2,475 1,347 7,847 0.935
Hatchery 231 5 86 147 75 544 0.065
Proportion Hatchery 0.146 0.031 0.033 0.056 0.053 0.065
2012 Natural 1,142 149 1,526 2,081 1,510 6,408 0.927
Hatchery 49 0 159 132 166 506 0.073
Proportion Hatchery 0.041 0.000 0.094 0.060 0.099 0.073
2013 Natural 1,572 1,587 2,433 2,895 1,748 10,235 0.783
Hatchery 610 386 411 879 550 2,836 0.217
Proportion Hatchery 0.280 0.196 0.145 0.233 0.239 0.217
2014 Natural 2,469 1,072 5,264 4,329 2,703 15,838 0.945
Hatchery 213 70 280 244 112 918 0.055
Proportion Hatchery 0.079 0.061 0.050 0.053 0.040 0.055
2015 Natural 2,654 709 5,745 5,490 1,858 16,456 0.928
Hatchery 259 114 442 378 89 1,282 0.072
Proportion Hatchery 0.089 0.139 0.071 0.064 0.046 0.072
The second estimate of origin of carcasses recovered is based on the proportion of hatchery
marked to non-marked fish. For this method, we assume that all hatchery origin carcasses
recovered are marked in some manner (e.g., otolith marks, coded-wire tag, and adipose clips)
and that we are able to accurately detect these marks and tags.
PRH has marked their entire juvenile releases with annual marks on the otoliths beginning with
progeny of brood year 2007. For the 2013 - 2015 returns, age-2 through 6 PRH origin carcasses
recovered were otolith marked. The age-6 PRH origin fish were not otolith marked during return
year 2012. However, since there were no age-6 fish recovered in the carcass surveys or at PRH,
it is assumed that few, if any PRH origin age-6 fish spawned in the Hanford Reach.
Adipose clipped Chinook salmon without a coded-wire tag and without a thermal otolith mark
were classified as strays from other hatcheries. The natural origin fish were identified by either a
Hanford Reach origin coded-wire tag or by the presence of an adipose fin and the absence of an
otolith mark. The demographic sample data suggests that 9.7% of fall Chinook salmon carcasses
recovered in the 2015 Hanford Reach stream survey were hatchery origin (Table 31). The
hatchery proportions were remarkably similar across sections suggesting that the hatchery origin
spawners were well distributed throughout the Hanford Reach and proportionate to the natural
origin spawner distribution.
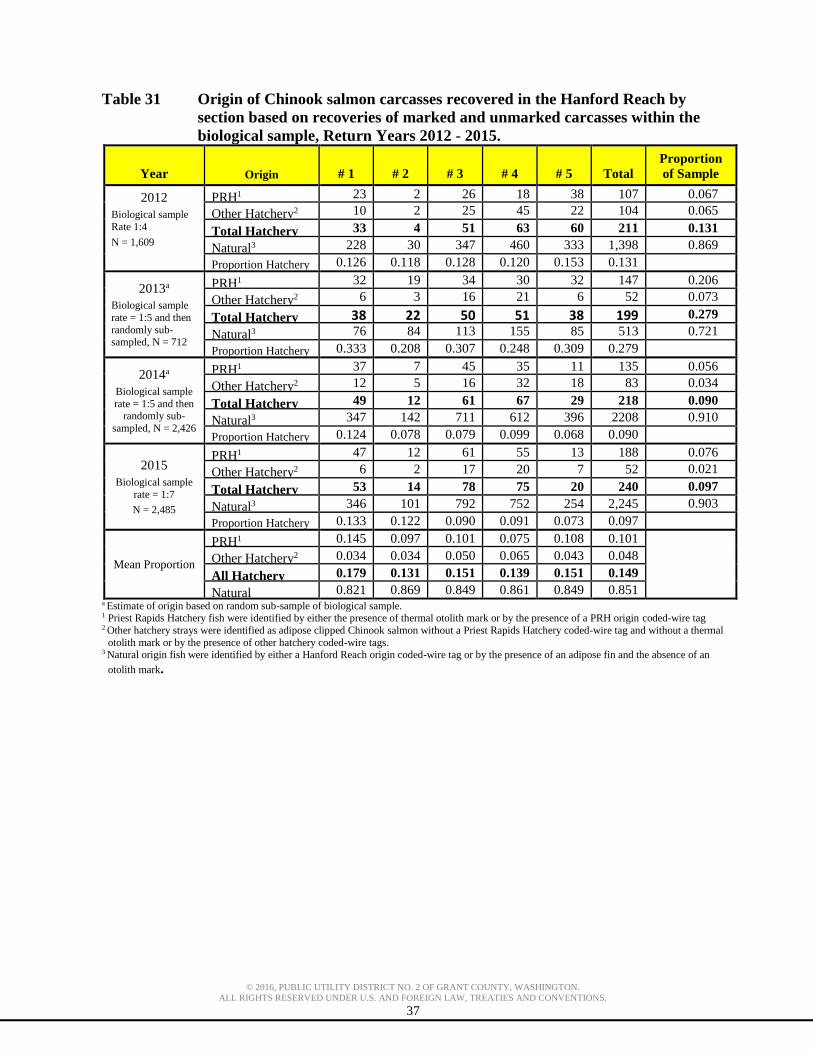
© 2016, PUBLIC UTILITY DISTRICT NO. 2 OF GRANT COUNTY, WASHINGTON.
ALL RIGHTS RESERVED UNDER U.S. AND FOREIGN LAW, TREATIES AND CONVENTIONS.
37
Table 31 Origin of Chinook salmon carcasses recovered in the Hanford Reach by
section based on recoveries of marked and unmarked carcasses within the
biological sample, Return Years 2012 - 2015.
Year Origin # 1 # 2 # 3 # 4 # 5 Total
Proportion
of Sample
2012
Biological sample
Rate 1:4
N = 1,609
PRH1 23 2 26 18 38 107 0.067
Other Hatchery2 10 2 25 45 22 104 0.065
Total Hatchery 33 4 51 63 60 211 0.131
Natural3 228 30 347 460 333 1,398 0.869
Proportion Hatchery 0.126 0.118 0.128 0.120 0.153 0.131
2013a
Biological sample
rate = 1:5 and then
randomly sub-
sampled, N = 712
PRH1 32 19 34 30 32 147 0.206
Other Hatchery2 6 3 16 21 6 52 0.073
Total Hatchery 38 22 50 51 38 199 0.279
Natural3 76 84 113 155 85 513 0.721
Proportion Hatchery 0.333 0.208 0.307 0.248 0.309 0.279
2014a
Biological sample
rate = 1:5 and then randomly sub-
sampled, N = 2,426
PRH1 37 7 45 35 11 135 0.056
Other Hatchery2 12 5 16 32 18 83 0.034
Total Hatchery 49 12 61 67 29 218 0.090
Natural3 347 142 711 612 396 2208 0.910
Proportion Hatchery 0.124 0.078 0.079 0.099 0.068 0.090
2015
Biological sample
rate = 1:7
N = 2,485
PRH1 47 12 61 55 13 188 0.076
Other Hatchery2 6 2 17 20 7 52 0.021
Total Hatchery 53 14 78 75 20 240 0.097
Natural3 346 101 792 752 254 2,245 0.903
Proportion Hatchery 0.133 0.122 0.090 0.091 0.073 0.097
Mean Proportion
PRH1 0.145 0.097 0.101 0.075 0.108 0.101
Other Hatchery2 0.034 0.034 0.050 0.065 0.043 0.048
All Hatchery 0.179 0.131 0.151 0.139 0.151 0.149
Natural 0.821 0.869 0.849 0.861 0.849 0.851 a Estimate of origin based on random sub-sample of biological sample. 1 Priest Rapids Hatchery fish were identified by either the presence of thermal otolith mark or by the presence of a PRH origin coded-wire tag 2 Other hatchery strays were identified as adipose clipped Chinook salmon without a Priest Rapids Hatchery coded-wire tag and without a thermal
otolith mark or by the presence of other hatchery coded-wire tags. 3 Natural origin fish were identified by either a Hanford Reach origin coded-wire tag or by the presence of an adipose fin and the absence of an
otolith mark.
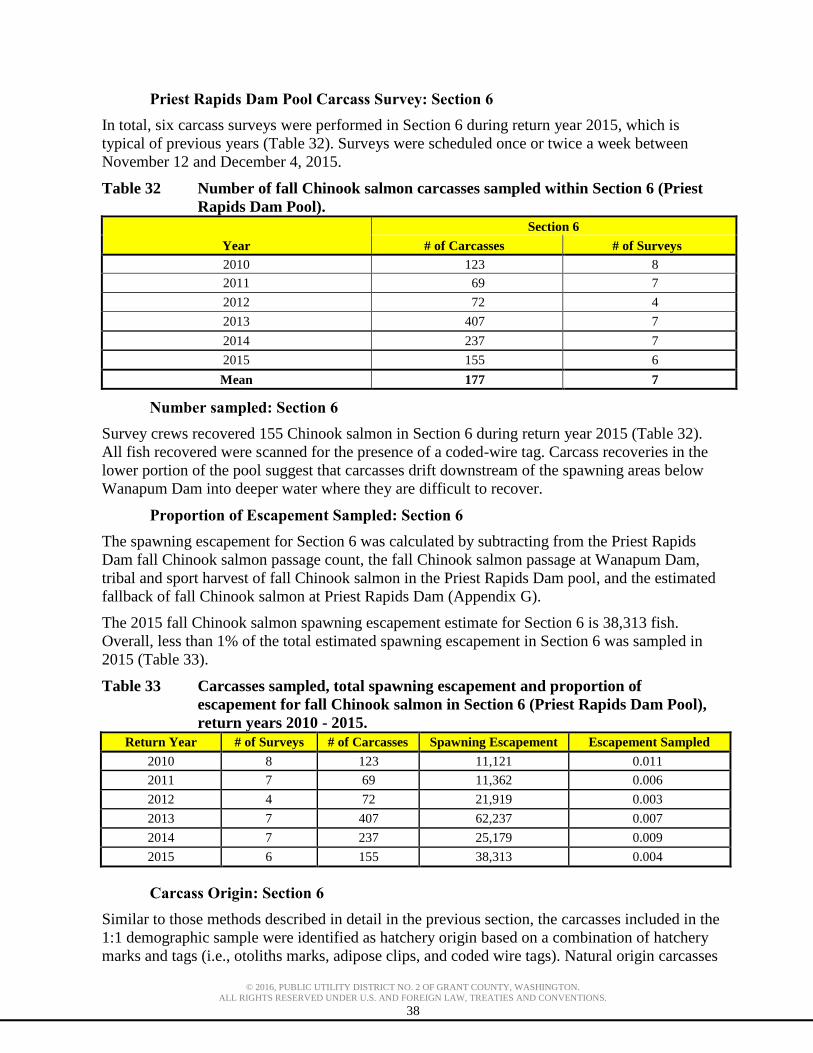
© 2016, PUBLIC UTILITY DISTRICT NO. 2 OF GRANT COUNTY, WASHINGTON.
ALL RIGHTS RESERVED UNDER U.S. AND FOREIGN LAW, TREATIES AND CONVENTIONS.
38
Priest Rapids Dam Pool Carcass Survey: Section 6
In total, six carcass surveys were performed in Section 6 during return year 2015, which is
typical of previous years (Table 32). Surveys were scheduled once or twice a week between
November 12 and December 4, 2015.
Table 32 Number of fall Chinook salmon carcasses sampled within Section 6 (Priest
Rapids Dam Pool).
Year
Section 6
# of Carcasses # of Surveys
2010 123 8
2011 69 7
2012 72 4
2013 407 7
2014 237 7
2015 155 6
Mean 177 7
Number sampled: Section 6
Survey crews recovered 155 Chinook salmon in Section 6 during return year 2015 (Table 32).
All fish recovered were scanned for the presence of a coded-wire tag. Carcass recoveries in the
lower portion of the pool suggest that carcasses drift downstream of the spawning areas below
Wanapum Dam into deeper water where they are difficult to recover.
Proportion of Escapement Sampled: Section 6
The spawning escapement for Section 6 was calculated by subtracting from the Priest Rapids
Dam fall Chinook salmon passage count, the fall Chinook salmon passage at Wanapum Dam,
tribal and sport harvest of fall Chinook salmon in the Priest Rapids Dam pool, and the estimated
fallback of fall Chinook salmon at Priest Rapids Dam (Appendix G).
The 2015 fall Chinook salmon spawning escapement estimate for Section 6 is 38,313 fish.
Overall, less than 1% of the total estimated spawning escapement in Section 6 was sampled in
2015 (Table 33).
Table 33 Carcasses sampled, total spawning escapement and proportion of
escapement for fall Chinook salmon in Section 6 (Priest Rapids Dam Pool),
return years 2010 - 2015.
Return Year # of Surveys # of Carcasses Spawning Escapement Escapement Sampled
2010 8 123 11,121 0.011
2011 7 69 11,362 0.006
2012 4 72 21,919 0.003
2013 7 407 62,237 0.007
2014 7 237 25,179 0.009
2015 6 155 38,313 0.004
Carcass Origin: Section 6
Similar to those methods described in detail in the previous section, the carcasses included in the
1:1 demographic sample were identified as hatchery origin based on a combination of hatchery
marks and tags (i.e., otoliths marks, adipose clips, and coded wire tags). Natural origin carcasses

© 2016, PUBLIC UTILITY DISTRICT NO. 2 OF GRANT COUNTY, WASHINGTON.
ALL RIGHTS RESERVED UNDER U.S. AND FOREIGN LAW, TREATIES AND CONVENTIONS.
39
were identified by the absence of any hatchery mark or the presence of a natural origin coded-
wire tag.
An estimated 55.5% of fall Chinook salmon spawning in Section 6 were hatchery origin of
which 96.5% were PRH origin (Table 34).
Table 34 Origin of fall Chinook salmon spawning in Section 6 (Priest Rapids Dam
Pool), Return Years 2012 - 2015
Year Origin Total Proportion of Sample
2012
N = 70
PRH1 18 0.257
Other Hatchery2 2 0.029
Total Hatchery 20 0.286
Natural3 50 0.714
2013
N = 98
PRH1 62 0.633
Other Hatchery2 5 0.051
Total Hatchery 67 0.684
Natural3 31 0.316
2014
N = 229
PRH1 81 0.354
Other Hatchery2 5 0.022
Total Hatchery 86 0.376
Natural3 143 0.624
2015
N = 155
PRH1 83 0.535
Other Hatchery2 3 0.019
Total Hatchery 155 0.555
Natural3 69 0.445
Means
N = 132
PRH1 61 0.445
Other Hatchery2 4 0.030
Total Hatchery 82 0.475
Natural3 73 0.525 1 Priest Rapids Hatchery fish were identified by either the presence of thermal otolith mark or by the presence of a PRH origin coded-wire tag 2 Other hatchery strays were identified as adipose clipped Chinook salmon without a Priest Rapids Hatchery coded-wire tag and without a thermal
otolith mark. 3 Natural origin fish were identified by either a Hanford Reach origin coded-wire tag or by the presence of an adipose fin and the absence of an
otolith mark.
Hatchery Discharge Channel: Sections 7 and 8 Carcass Survey
During return year 2015, crews performed two carcass surveys in Section 8 by boat and one
carcass survey in Section 7 by foot. It has been observed that many carcasses drift out of the
discharge channel under full flow conditions. Performing carcass surveys in the discharge
channel when it is at full flow is difficult and dangerous due to poor footing and high velocities.
Staff performed the one survey in Section 7 on December 8 after discharge levels in the channel
were reduced.

© 2016, PUBLIC UTILITY DISTRICT NO. 2 OF GRANT COUNTY, WASHINGTON.
ALL RIGHTS RESERVED UNDER U.S. AND FOREIGN LAW, TREATIES AND CONVENTIONS.
40
Number sampled: Sections 7 and 8
Survey crews recovered 33 carcasses in Section 7 and 26 in Section 8 (Table 35). All fish
recovered were scanned for the presence of a coded-wire tag.
Table 35 The number of fall Chinook salmon carcass surveys within Section 7 (Priest
Rapids Hatchery Discharge Channel) and Section 8 (Columbia River at the
confluence of the hatchery discharge channel).
Return Year
Section 7 Section 8 Total
# of
Carcasses
# of
Surveys
# of
Carcasses
# of
Surveys
# of
Carcasses
# of
Surveys
2010 87 1 123 9 210 10
2011 123 2 80 8 203 10
2012 99 3 108 10 207 13
2013 105 3 159 4 264 7
2014 9 1 52 7 61 8
2015 33 1 26 2 59 3
Proportion of Escapement Sampled: Sections 7 and 8
The 2015 fall Chinook salmon spawning escapement index for Sections 7 and 8 is 62 fish (Table
36). The spawning escapement for these Sections is a minimum estimate based on the peak
number of 31 redds observed in the discharge channel. We assume that most of the carcasses
recovered in Section 8 drifted downstream from Section 7. In addition, it is likely a portion of
carcasses from Sections 7 and 8 drift downstream into Sections 1 and 2.
Table 36 Number of carcasses sampled, total spawning escapement and proportion of
escapement sampled for fall Chinook salmon within Section 7 (Priest Rapids
Hatchery Discharge Channel) and Section 8 (Columbia River at confluence
of the hatchery discharge channel), Return Year 2015
Section Total Number of Carcasses Spawning Escapement Escapement Sampled
# 7 33 62 0.532
# 8 26 0 0.419
Total 59 62 0.952
Carcass Distribution and Origin: Sections 7 and 8
The demographic sample rate was set at 1:1 to account for the low numbers of carcasses
recovered. As described in detail previously, the carcasses included the demographic sample
were identified as hatchery origin based on a combination of hatchery marks and tags (i.e.,
otoliths marks, adipose clips, and coded wire tags). Natural origin carcasses were identified by
the absence of any hatchery mark or the presence of a natural origin coded-wire tag.
It is estimated that 35.6% of fall Chinook salmon recovered in Sections 7 and 8 were hatchery
origin of which most all were PRH origin (Table 37.)

© 2016, PUBLIC UTILITY DISTRICT NO. 2 OF GRANT COUNTY, WASHINGTON.
ALL RIGHTS RESERVED UNDER U.S. AND FOREIGN LAW, TREATIES AND CONVENTIONS.
41
Table 37 The origin of Chinook salmon carcasses recovered within Section 7 (Priest
Rapids Hatchery Discharge Channel) and Section 8 (Columbia River at the
confluence of the hatchery discharge channel), Return Years 2012 – 2015.
Return
Year Origin Total Proportion of Sample
2012
N = 70
PRH 18 0.257
Other Hatchery 2 0.029
Total Hatchery 20 0.286
Natural 50 0.714
2013
N = 33
PRH 28 0.848
Other Hatchery 2 0.061
Total Hatchery 30 0.909
Natural 3 0.091
2014
N= 5
PRH 3 0.600
Other Hatchery 0 0.000
Total Hatchery 3 0.600
Natural 2 0.400
2015
N= 59
PRH 19 0.322
Other Hatchery 2 0.034
Total Hatchery 21 0.356
Natural 38 0.644
Means
N = 42
PRH 17 0.407
Other Hatchery 2 0.036
Total Hatchery 19 0.443
Natural 23 0.557
14.0 Life History Monitoring
Migration timing of hatchery and natural origin Hanford Reach fall Chinook salmon is estimated
from arrival timing at Bonneville Dam based on PIT tag observations at the adult fish ladder for
both PRH and Hanford Reach origin fall Chinook salmon.
Life history characteristics of Hanford Reach fall Chinook salmon were assessed by examining
carcasses on spawning grounds, fish collected or examined at broodstock collection sites, and by
reviewing tagging data and fisheries statistics.
For the 2012 - 2015 returns, the origin of fall Chinook salmon for the comparison of age and
length at maturity is based on a combination of hatchery marks and tags (i.e., otolith, adipose
clips, and coded-wire tags). PRH origin fall Chinook Salmon were identified by either the
presence of an otolith mark specific to PRH or by the presence of a PRH origin coded-wire tag.
Adipose clipped Chinook salmon without a coded-wire tag and without an otolith mark were
classified as fish from other hatcheries. The natural origin fish were identified by either a
Hanford Reach origin coded-wire tag or by the presence of an adipose fin combined with the
absence of any hatchery marks. The age composition for both the natural and hatchery origin fall
Chinook salmon recovered in return years 2012 - 2015 were assembled from the carcass
recoveries in sections 1-8 of the Hanford Reach.
In order to make coarse comparisons between hatchery and natural origin fish prior to return year
2012, the determination of origin employed the assumption that all fish collected in the Hanford
Reach, except for those that were of known hatchery origin (e.g., adipose clipped or coded-wire

© 2016, PUBLIC UTILITY DISTRICT NO. 2 OF GRANT COUNTY, WASHINGTON.
ALL RIGHTS RESERVED UNDER U.S. AND FOREIGN LAW, TREATIES AND CONVENTIONS.
42
tagged), were natural origin. We know this was not the case, but we were not able to identify all
of the hatchery origin fish in the demographic samples and it was assumed that the majority of
the fish sampled in the stream surveys were natural origin.
Migration Timing
PIT tag observations for both PRH and Hanford Reach natural origin adult fall Chinook salmon
at the PIT tag arrays in the Bonneville Dam adult fish ladders were used to assess arrival timing.
The PIT tag observation data was obtained from the PTAGIS website. Arrival dates for each
unique tagged adult was based on its first observation date and time at Bonneville Dam.
Annually, the sample sizes have been relatively small due to the low numbers of both hatchery
and natural origin fall Chinook salmon PIT tagged. Beginning with the 2011 brood, the number
of juveniles PIT tagged at PRH increased from 3,000 to roughly 43,000 annually
The adult PIT tag detections at Bonneville Dam are useful to compare migration timing between
Hanford Reach natural origin and PRH origin fall Chinook salmon because harvest and other
losses upstream of Bonneville Dam reduce the number of potential detections at upstream sites.
The 10th, 50th, and 90th percentiles of the annual migration timing to Bonneville Dam are given in
(Table 38). The observation sample size of both groups of PIT tagged fish at Bonneville Dam
can be small and therefore, may not be representative of the populations. However this may be
the best migration information currently available.

© 2016, PUBLIC UTILITY DISTRICT NO. 2 OF GRANT COUNTY, WASHINGTON.
ALL RIGHTS RESERVED UNDER U.S. AND FOREIGN LAW, TREATIES AND CONVENTIONS.
43
Table 38 The week that 10%, 50% (median), and 90% of the natural and hatchery
origin fall Chinook salmon passed Bonneville Dam, 2010 – 2015. Migration
timing is based on PIT tag passage of Hanford natural origin and Priest
Rapids Hatchery in the adult fish ladder at Bonneville Dam.
Return
Year Origin
Hanford Reach Fall Chinook Migration Time (Date)
Priest Rapids Origin Hanford Reach Natural Origin
Age 2 Age 3 Age 4 Age 5 Age 2 Age 3 Age 4 Age 5
2010
10th Percentile 28-Aug 26-Aug 24-Aug 31-Aug 5-Sep 25-Aug
50th Percentile 9-Sep 17-Sep 4-Sep 21-Sep 17-Sep 9-Sep
90th Percentile 15-Sep 24-Sep 6-Sep 4-Oct 6-Oct 15-Sep
N 5 20 0 3 8 22 18 0
2011
10th Percentile 8-Aug 3-Sep 23-Aug 4-Sep 24-Aug 4-Aug
50th Percentile 8-Sep 20-Sep 8-Sep 4-Sep 10-Sep 30-Aug
90th Percentile 21-Sep 25-Sep 21-Sep 10-Sep 2-Oct 1-Sep
N 6 7 10 0 0 2 65 3
2012
10th Percentile 31-Aug 6-Sep 13-Sep 7-Sep 14-Sep 4-Sep 28-Aug 27-Aug
50th Percentile 16-Sep 11-Sep 13-Sep 7-Sep 23-Sep 16-Sep 5-Sep 8-Sep
90th Percentile 27-Sep 21-Sep 19-Sep 7-Sep 10-Oct 26-Sep 21-Sep 19-Sep
N 7 13 2 1 10 11 19 26
2013
10th Percentile 24-Aug 28-Aug 25-Aug 11-Sep 2-Sep 2-Sep 9-Aug
50th Percentile 8-Sep 9-Sep 3-Sep 11-Sep 22-Sep 9-Sep 27-Aug
90th Percentile 18-Sep 22-Sep 15-Sep 11-Sep 10-Oct 19-Sep 2-Oct
N 40 55 16 0 1 29 22 10
2014
10th Percentile 6-Sep 4-Sep 5-Sep 24-Sep 10-Sep 3-Sep 29-Aug
50th Percentile 16-Sep 13-Sep 12-Sep 25-Sep 11-Sep 12-Sep 1-Sep
90th Percentile 28-Sep 25-Sep 23-Sep 1-Oct 28-Sep 26-Sep 15-Sep
N 175 228 50 0 3 4 62 5
2015
10th Percentile 16-Oct 8-Sep 25-Aug 14-Sep 10-Sep 30-Aug 29-Aug
50th Percentile 16-Oct 21-Sep 6-Sep 26-Sep 20-Sep 10-Sep 09-Sep
90th Percentile 16-Oct 9-Oct 18-Sep 26-Sep 1-Oct 25-Sep 25-Sep
N 1 345 323 2 0 5 13 32
© 2016, PUBLIC UTILITY DISTRICT NO. 2 OF GRANT COUNTY, WASHINGTON.
ALL RIGHTS RESERVED UNDER U.S. AND FOREIGN LAW, TREATIES AND CONVENTIONS.
44
Age at Maturity
Prior to return year 2012, the age composition for hatchery origin returns to PRH was generated
by pooling all of the sub-samples from the volunteer trap and ponded fish after expanding for
differing demographic sample rates and sub-sample rates. Only one demographic sample rate
was used annually in the Hanford Reach stream survey; precluding the need to expand and pool
samples. In addition, the fish origin was assigned by location of survey due to the lack of
identifiable hatchery marks and low coded-wire tag recoveries that were not representative of
natural origin fish. Hence, the age composition for natural origin returns was generated from all
the samples collected within the carcass survey. Likewise, the age composition for hatchery
origin fish was generated from all samples collected at PRH.
The age compositions of the Hanford Reach escapement and the PRH returns are not directly
comparable between locations without some adjustment. There is likely a recovery bias against
smaller/younger fish in the stream surveys (Zhou 2002; Murdoch et al. 2010; Richards and
Pearsons, 2013). Hence, the age composition for the Hanford Reach escapement is likely biased
towards larger/older fish. Results and brief discussion for the pilot carcass bias assessments are
given in Appendix I. All fish recovered from the PRH volunteer trap are available for systematic
sampling; reducing the potential bias of the age composition data. Although this dataset is
imperfect, the dataset is maintained for future reference should a method be established to
correct the data for associated age and origin bias (Table 39).
The availability of otolith data combined with other hatchery mark data from the Hanford Reach
carcass recoveries for the 2012 through 2015 return years provide the ability to estimate age
compositions for both hatchery and natural origin fish within the Hanford Reach escapement
(Table 40). However, the hatchery origin age composition may be influenced by the low number
of hatchery origin fish present in the demographic samples which is further reduced by sub-
sampling the demographic origin. In addition, the age composition for both groups may be
biased towards larger fish due to potential size recovery biases in the carcass surveys. Larger
demographic samples per return year may be required to better represent the age composition
data before conclusions can be made. Beginning with return year 2014, the sub-sample size to
determine origin was increased substantially to roughly 2,500 fish in order to capture more
hatchery origin fish in the sub-sample. The limited available data suggests that natural origin fish
return at older ages than hatchery origin fish.

© 2016, PUBLIC UTILITY DISTRICT NO. 2 OF GRANT COUNTY, WASHINGTON.
ALL RIGHTS RESERVED UNDER U.S. AND FOREIGN LAW, TREATIES AND CONVENTIONS.
45
Table 39 Age compositions for fall Chinook salmon sampled in the Hanford Reach
escapement compared to fall Chinook salmon sampled at Priest Rapids
Hatchery (genders combined), brood years 1998 – 2009.
Brood Year Source1
Age Composition
Age-2 Age-3 Age-4 Age-5 Age-6
1998 Escapement 0.119 0.097 0.420 0.346 0.018
PRH Returns 0.034 0.575 0.353 0.038 0.000
1999 Escapement 0.123 0.089 0.390 0.392 0.005
PRH Returns 0.061 0.366 0.432 0.140 0.001
2000 Escapement 0.262 0.081 0.290 0.359 0.009
PRH Returns 0.070 0.303 0.467 0.152 0.007
2001 Escapement 0.152 0.149 0.488 0.206 0.005
PRH Returns 0.061 0.506 0.309 0.122 0.002
2002 Escapement 0.178 0.154 0.568 0.099 0.001
PRH Returns 0.103 0.386 0.466 0.043 0.001
2003 Escapement 0.249 0.170 0.248 0.331 0.000
PRH Returns 0.041 0.443 0.355 0.160 0.000
2004 Escapement 0.216 0.064 0.406 0.311 0.003
PRH Returns 0.133 0.398 0.406 0.063 0.000
2005 Escapement 0.151 0.082 0.306 0.458 0.003
PRH Returns 0.116 0.572 0.284 0.028 0.000
2006 Escapement 0.109 0.052 0.632 0.206 0.000
PRH Returns 0.331 0.325 0.314 0.030 0.000
2007 Escapement 0.109 0.230 0.490 0.171 0.001
PRH Returns 0.103 0.483 0.381 0.033 0.000
2008 Escapement 0.159 0.193 0.511 0.137 0.000
PRH Returns 0.221 0.497 0.279 0.002 0.000
2009 Escapement 0.091 0.136 0.688 0.083 0.001
PRH Returns 0.125 0.564 0.240 0.071 0.000
2010a Escapement 0.020 0.270 0.444 0.266 0.000
PRH Returns 0.108 0.386 0.468 0.038 0.000
Mean Escapement 0.149 0.136 0.452 0.259 0.004
PRH Returns 0.116 0.446 0.366 0.071 0.001
Mean 2007 - 2010 Escapement 0.095 0.207 0.533 0.164 0.001
PRH Returns 0.139 0.483 0.342 0.036 0.000 1The origin is assigned by survey. a Does not include age-6 returns.
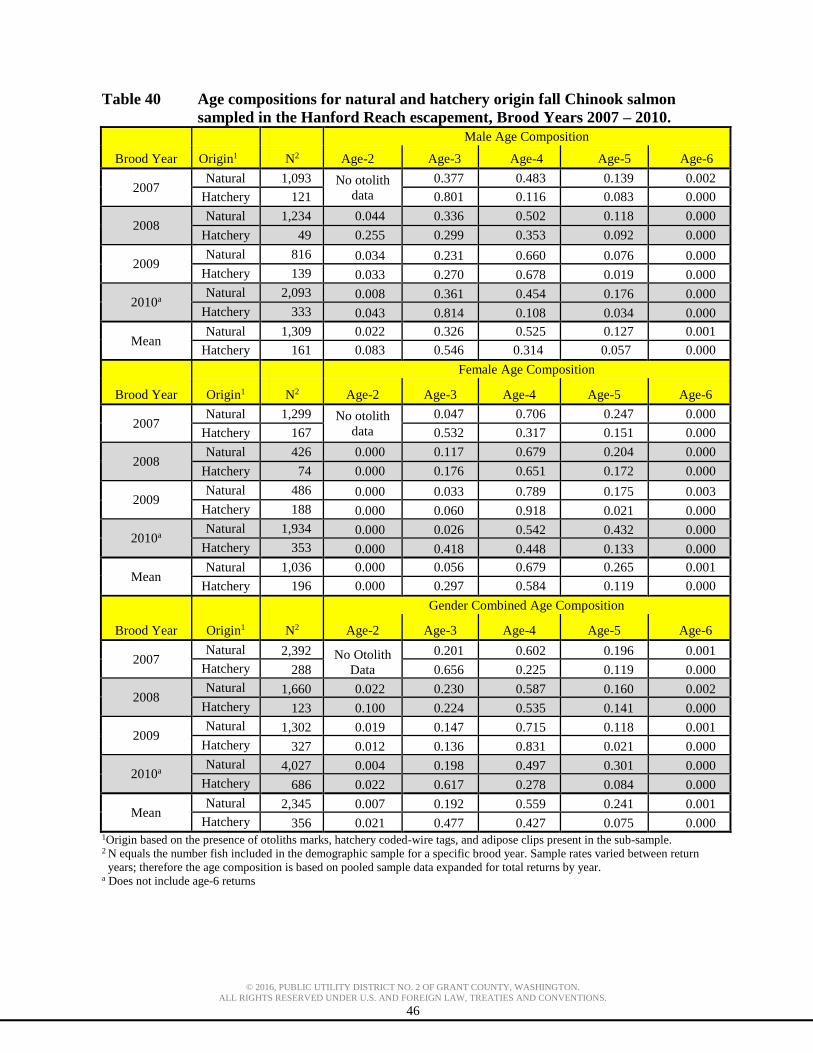
© 2016, PUBLIC UTILITY DISTRICT NO. 2 OF GRANT COUNTY, WASHINGTON.
ALL RIGHTS RESERVED UNDER U.S. AND FOREIGN LAW, TREATIES AND CONVENTIONS.
46
Table 40 Age compositions for natural and hatchery origin fall Chinook salmon
sampled in the Hanford Reach escapement, Brood Years 2007 – 2010.
Brood Year
Male Age Composition
Origin1 N2 Age-2 Age-3 Age-4 Age-5 Age-6
2007 Natural 1,093 No otolith
data
0.377 0.483 0.139 0.002
Hatchery 121 0.801 0.116 0.083 0.000
2008 Natural 1,234 0.044 0.336 0.502 0.118 0.000
Hatchery 49 0.255 0.299 0.353 0.092 0.000
2009 Natural 816 0.034 0.231 0.660 0.076 0.000
Hatchery 139 0.033 0.270 0.678 0.019 0.000
2010a Natural 2,093 0.008 0.361 0.454 0.176 0.000
Hatchery 333 0.043 0.814 0.108 0.034 0.000
Mean Natural 1,309 0.022 0.326 0.525 0.127 0.001
Hatchery 161 0.083 0.546 0.314 0.057 0.000
Brood Year
Female Age Composition
Origin1 N2 Age-2 Age-3 Age-4 Age-5 Age-6
2007 Natural 1,299 No otolith
data
0.047 0.706 0.247 0.000
Hatchery 167 0.532 0.317 0.151 0.000
2008 Natural 426 0.000 0.117 0.679 0.204 0.000
Hatchery 74 0.000 0.176 0.651 0.172 0.000
2009 Natural 486 0.000 0.033 0.789 0.175 0.003
Hatchery 188 0.000 0.060 0.918 0.021 0.000
2010a Natural 1,934 0.000 0.026 0.542 0.432 0.000
Hatchery 353 0.000 0.418 0.448 0.133 0.000
Mean Natural 1,036 0.000 0.056 0.679 0.265 0.001
Hatchery 196 0.000 0.297 0.584 0.119 0.000
Brood Year
Gender Combined Age Composition
Origin1 N2 Age-2 Age-3 Age-4 Age-5 Age-6
2007 Natural 2,392 No Otolith
Data
0.201 0.602 0.196 0.001
Hatchery 288 0.656 0.225 0.119 0.000
2008 Natural 1,660 0.022 0.230 0.587 0.160 0.002
Hatchery 123 0.100 0.224 0.535 0.141 0.000
2009 Natural 1,302 0.019 0.147 0.715 0.118 0.001
Hatchery 327 0.012 0.136 0.831 0.021 0.000
2010a Natural 4,027 0.004 0.198 0.497 0.301 0.000
Hatchery 686 0.022 0.617 0.278 0.084 0.000
Mean Natural 2,345 0.007 0.192 0.559 0.241 0.001
Hatchery 356 0.021 0.477 0.427 0.075 0.000 1Origin based on the presence of otoliths marks, hatchery coded-wire tags, and adipose clips present in the sub-sample. 2 N equals the number fish included in the demographic sample for a specific brood year. Sample rates varied between return
years; therefore the age composition is based on pooled sample data expanded for total returns by year. a Does not include age-6 returns

© 2016, PUBLIC UTILITY DISTRICT NO. 2 OF GRANT COUNTY, WASHINGTON.
ALL RIGHTS RESERVED UNDER U.S. AND FOREIGN LAW, TREATIES AND CONVENTIONS.
47
Size at Maturity
Prior to return year 2012, the size (fork length) at maturity comparisons between fall Chinook
salmon recovered at PRH and the Hanford Reach stream survey were calculated in a similar
manner as the age composition data for the same time period (Table 41). Likewise, the
assignment of origin was based on the survey (i.e., stream or hatchery). The estimates based on
this method may not be representative of natural and hatchery origin fish due to possible size
bias during recovery of carcasses.
Table 41 Mean fork length (cm) at age (total age) of fall Chinook salmon sampled in
the Hanford Reach escapement compared to fall Chinook salmon sampled at
Priest Rapids Hatchery, Brood Years 1999 - 2010. N = sample size and SD =
1 standard deviation.
Brood
Year Origin
Fall Chinook fork length (cm)
Age-2 Age-3 Age-4 Age-5 Age-6
N Mean SD N Mean SD N Mean SD N Mean SD N Mean SD
1999 Escapement 83 44 4 227 70 6 1,423 86 7 1,085 93 7 22 103 10
PRH Returns 85 46 5 488 70 5 762 84 6 170 92 6 2 94 11
2000 Escapement 17 44 4 118 65 7 428 82 6 669 94 8 6 96 9
PRH Returns 25 44 5 136 69 6 196 82 6 58 93 7 2 103 10
2001 Escapement 32 44 5 251 69 6 1,157 84 6 288 93 7 18 97 5
PRH Returns 121 48 4 1,040 69 5 628 81 6 183 91 6 9 94 9
2002 Escapement 31 46 4 229 70 6 194 86 8 239 95 8 2 99 6
PRH Returns 80 52 4 281 70 5 246 84 6 61 91 6 1 73 0
2003 Escapement 19 48 5 42 69 7 395 85 6 450 96 8 0
PRH Returns 12 49 6 93 70 6 215 83 6 20 91 4 0
2004 Escapement 34 47 4 71 68 6 386 84 6 208 94 8 2 91 1
PRH Returns 19 55 4 115 69 5 51 84 5 9 95 7 0
2005 Escapement 25 50 5 202 70 6 532 84 7 744 96 8 5 96 6
PRH Returns 31 49 4 429 73 4 428 84 6 180 91 6 0
2006 Escapement 20 48 4 85 69 6 962 86 6 340 92 7 0
PRH Returns 3 45 3 42 71 4 170 84 6 13 92 7 0
2007 Escapement 24 46 5 642 72 6 1,468 84 7 482 92 7 1 105 0
PRH Returns 5 50 4 1,149 71 4 1,419 80 5 179 87 6 0
2008 Escapement 34 50 4 243 70 5 620 84 7 72 92 8 1 84 0
PRH Returns 22 52 5 652 69 4 573 81 6 1 84 0 0
2009 Escapement 50 48 4 421 69 6 931 81 6 183 92 10
PRH Returns 308 48 4 1,690 68 5 218 77 5 70 86 7
2010a Escapement 63 47 7 1,040 68 5 2,754 82 7 826 88 7
PRH Returns 883 48 4 1,375 69 4 1,528 78 5 55 84 4
Mean 99
-10
Escapement 36 47 5 298 69 6 938 84 7 466 93 8 5 94 4
PRH Returns 133 49 4 624 70 5 536 82 6 83 90 6 1 91 8
Mean
07- 10
Escapement 43 48 5 587 70 6 1,443 83 7 391 91 8 1 95
0
PRH Returns 305 50 4 1,217 69 4 935 79 5 76 85 4 0 0 0 a Does not include age-6 returns
The availability of otolith marks in addition to other hatchery marks (i.e., otoliths, adipose clips,
and coded-wire tags) for the 2012 through 2015 return years provide the ability to estimate size
at maturity for both hatchery and natural origin fish within the Hanford Reach escapement. Sub-
sample sizes were determined as described in Section 7.

© 2016, PUBLIC UTILITY DISTRICT NO. 2 OF GRANT COUNTY, WASHINGTON.
ALL RIGHTS RESERVED UNDER U.S. AND FOREIGN LAW, TREATIES AND CONVENTIONS.
48
The size at maturity data is essentially complete for brood years 2007 through 2010. The sizes at
age by gender are generally similar between hatchery and natural origin; although, age 2
hatchery origin males and age 5 natural origin males tend to be larger than their counterparts
(Table 42).
Table 42 Mean fork length (cm) at age (total age) of natural and hatchery origin fall
Chinook salmon that spawned naturally in the Hanford Reach, Brood Years
2007 – 2009. N = sample size and SD = 1 standard deviation.
Brood
Year Origin
Male Fork Length (cm)
Age-2 Age-3 Age-4 Age-5 Age-6
N Mean SD N Mean SD N Mean SD N Mean SD N Mean SD
2007 Natural
No otolith Data 362 70 5 206 84 8 154 98 8 1 105 0
Hatchery 44 72 4 16 82 5 6 93 7 0
2008 Natural 22 49 4 134 69 5 260 85 8 25 99 7 0
Hatchery 8 52 3 20 69 5 7 86 4 2 91 15 0
2009 Natural 3 48 3 325 68 6 123 82 6 40 99 7 0
Hatchery 2 55 5 34 71 6 21 79 10 2 96 6 0
2010a Natural 33 45 4 325 68 6 855 83 8 238 94 8
Hatchery 25 50 4 34 71 6 34 79 7 7 92 7
Mean Natural 19 47 4 287 69 6 361 84 8 114 98 8 1 105 0
Hatchery 12 52 4 33 71 5 20 82 7 4 93 9 0 0 0
Brood
Year Origin
Female Fork Length (cm)
Age-2 Age-3 Age-4 Age-5 Age-6
N Mean SD N Mean SD N Mean SD N Mean SD N Mean SD
2007 Natural 0 83 72 5 376 83 5 326 89 5 0
Hatchery 0 48 72 4 48 80 4 8 86 6 0
2008 Natural 0 36 70 3 344 83 5 49 88 5 1 84 0
Hatchery 0 23 70 5 21 82 4 7 85 6 0
2009 Natural 0 44 71 5 105 80 4 82 87 11 1 73 0
Hatchery 0 12 68 4 49 78 6 4 85 4 0
2010a Natural 0 44 71 5 82 87 5 550 85 4 0
Hatchery 0 10 69 4 4 87 5 29 82 4 0
Mean Natural 0 52 71 5 227 83 5 252 87 6 1 79 0
Hatchery 0 23 70 4 31 82 5 12 85 5 0
Brood
Year Origin
Gender Combined Fork Length (cm)
Age-2 Age-3 Age-4 Age-5 Age-6
N Mean SD N Mean SD N Mean SD N Mean SD N Mean SD
2007 Natural
No otolith Data 445 70 5 582 83 6 480 92 6 1 105 0
Hatchery 92 72 4 64 81 4 14 89 6 0
2008 Natural 22 49 4 170 69 5 604 84 6 74 92 6 1 84 0
Hatchery 8 52 3 43 70 5 28 83 4 9 86 8 0
2009 Natural 3 48 3 369 68 6 228 81 5 122 91 10 1 73 0
Hatchery 2 55 5 46 70 5 70 78 7 6 89 5 0
2010a Natural 33 45 4 369 68 6 937 83 8 788 88 5 0
Hatchery 25 50 4 44 71 6 38 80 7 36 84 5 0
Mean Natural 19 47 4 338 69 5 588 83 6 366 91 7 1 87 0
Hatchery 12 52 4 56 71 5 50 80 6 16 87 6 0 0 0 a Brood year does not include age-6 returns

© 2016, PUBLIC UTILITY DISTRICT NO. 2 OF GRANT COUNTY, WASHINGTON.
ALL RIGHTS RESERVED UNDER U.S. AND FOREIGN LAW, TREATIES AND CONVENTIONS.
49
Gender Composition for Adult Escapement
Prior to return year 2012, the gender ratio comparisons between fall Chinook salmon recovered
at PRH and the Hanford Reach stream survey were based on the survey type (i.e., stream or
hatchery). Although the estimates based on this method may are imperfect, we continue to
present this information to maintain the longest data set available (Table 43).
Table 43 Comparison male to female ratio of fall Chinook salmon sampled at Priest
Rapids Hatchery and in the Hanford Reach stream surveys, Brood Years
2007 – 2010.
Brood Year Origin Male1 : Female Ratio
1996 Stream 1.21:1
Hatchery 1.98:1
1997 Stream 0.82:1
Hatchery 1.88:1
1998 Stream 0.72:1
Hatchery 1.38:1
1999 Stream 0.65:1
Hatchery 2.15:1
2000 Stream 0.66:1
Hatchery 2.40:1
0.55:1 2001
Stream 0.55:1
Hatchery 2.31:1
2002 Stream 1.08:1
Hatchery 1.94:1
2003 Stream 0.59:1
Hatchery 1.64:1
2004 Stream 0.80:1
Hatchery 1.63:1
2005 Stream 0.76:1
Hatchery 2.15:1
2006 Stream 0.67:1
Hatchery 2.57:1
2007 Stream 0.84:1
Hatchery 1.60:1
2008 Stream 1.06:1
Hatchery 1.89:1
2009 Stream 1.42:1
Hatchery 2.57:1
2010a Stream 1.06:1
Hatchery 1.47:1 1 Includes both adults and jacks. a Includes age-2 through 5.
Gender ratios (male/females) by brood year and origin of adult fall Chinook salmon sampled in
the Hanford Reach carcass survey are given in
© 2016, PUBLIC UTILITY DISTRICT NO. 2 OF GRANT COUNTY, WASHINGTON.
ALL RIGHTS RESERVED UNDER U.S. AND FOREIGN LAW, TREATIES AND CONVENTIONS.
50
Table 44. Annually, higher male to female ratios have been observed in the natural origin fish
than that of the hatchery origin fish. This may be the result of earlier age of maturity of hatchery
origin fish and a size related bias of recovering carcasses in the Hanford Reach.

© 2016, PUBLIC UTILITY DISTRICT NO. 2 OF GRANT COUNTY, WASHINGTON.
ALL RIGHTS RESERVED UNDER U.S. AND FOREIGN LAW, TREATIES AND CONVENTIONS.
51
Table 44 Comparison male to female ratio of fall Chinook salmon sampled in the
Hanford Reach stream surveys, Brood Years 2007 – 2010.
Brood Year Origin Male1 : Female Ratio
2007a Natural 0.86:1.00
Hatchery 0.74:1.00
2008 Natural 1.06:1.00
Hatchery 0.64:1.00
2009 Natural 1.38:1.00
Hatchery 0.56:1.00
2010b Natural 1.05:1.00
Hatchery 1.01:1.00 1 Includes both adults and jacks. a Does not include age-2. b Includes age-2 through 5.
Spawn Success
All female Chinook included in the demographic sample for the Hanford Reach stream surveys
were examined for egg retention to assess spawn success. The females sampled were partitioned
into the egg retention categories of 0%, 25%, 50%, 75% and 100%. The assignment of origin for
each female for years 2010 and 2011 were based on the presence or absence of an adipose fin.
The adipose intact group may include non-adipose clipped fish from PRH. A combination of
hatchery marks (i.e., adipose clips, coded-wire tags, and otolith marks were used to identify
hatchery origin fish in years 2013 - 2015. For all years, we assume that fish not possessing any
hatchery marks are natural origin fish.
The assessment of egg retention is compromised by the loss of eggs during the collection and
transport of carcasses prior to sampling. In addition, the methods for quantifying egg retention
and assignment of origin for each female have varied between years. The amount of egg
retention for years 2010 through 2013 were determined by visual estimates; whereas, during
2014 and 2015, the amount of retention was based on egg counts when the gametes were not
completely intact. For these recent data sets, the percent of egg retention was calculated by
dividing the amount of egg retained by an estimated fecundity based on length versus fecundity
regressions by origin (Hatchery or Natural). An explanation of these regressions is provided in
the fecundity section of this report.
During 2015, staff recorded visual observations of egg retention based on the standard egg
retention categories to make comparisons with egg retention based on egg counts. The data from
the egg counts were categorized into the standard egg retention categories based on the following
ranges: 1 = 100-88%, 2 = 87-63%, 3 = 62-38%, 4 = 37-11%, and 10-0%. This comparison may
allow us to assess the egg retention estimates based on methods used prior to 2014. The
difference between two methods was less than 1 percentage point by category (Table 45), which
provides some confidence that the visual methods of the past may provide reasonable indices of
spawning success.
Table 45 Comparison of spawn success of natural and hatchery origin fall Chinook
sampled in the Hanford Reach stream survey, Return Year 2015.
Egg Retention Categories
% by Category based
on Egg Counts
% by Category based
on Visual Observations
Difference between Actual
and Observed (%)
1 – 100% 0.0 0.4 -0.4 2 – 75% 0.3 0.5 -0.2
3 – 50% 0.6 0.6 0.0
4 – 25% 1.5 1.6 -0.1
5 – 0% 97.7 96.9 0.8
N = 1,405

© 2016, PUBLIC UTILITY DISTRICT NO. 2 OF GRANT COUNTY, WASHINGTON.
ALL RIGHTS RESERVED UNDER U.S. AND FOREIGN LAW, TREATIES AND CONVENTIONS.
52
The adjusted spawn successes for the escapement between years 2010 and 2015 were generally
greater than 97% (Table 46). The spawn success was lower for both hatchery and natural origin
females in return year 2013 compared to other years. These observations coincide with an
elevated pHOS which most likely resulted from high hatchery fish escapement and restrictive
operations of the PRH volunteer trap during 2013. It is possible that a portion of these PRH
origin females which were unable to enter the trap, died without spawning, and ended up being
surveyed in the Hanford Reach carcass survey. The spawn success was high during 2014 and
2015 despite historically high record escapements to the Hanford Reach.
Table 46 Comparison of spawn success of natural and hatchery origin fall Chinook
sampled in the Hanford Reach stream survey, Return Years 2010 – 2015.
The measure for reporting egg retention changed from that used for previous years beginning in 2010 b Otoliths were used to determine origin in addition to adipose clips and CWTs
15.0 Contribution to Fisheries
The contribution of fish produced at PRH to fisheries was estimated by querying the Regional
Mark Processing Center (RMPC) database. This is central repository for all coded-wire tagged
and otherwise associated release, catch, sample, and recovery data of anadromous salmonids in
the greater Pacific Coast Region of the United States of America (RMPC Strategic Plan 2006-
2009). The Regional Mark Information System database (RMIS) within the RMPC provides
Return Year Origin
Females
Sampled
Egg Retention Categories No Egg
Retention
(%)
Adj Spawn Success
for Escapement
(%) 0 % 25% 50% 75% 100%
2004 Combined 1,176 1,151 NA 21 NA 4 97.9 98.8
2005 Combined 1,323 1,310 NA 6 NA 7 99.0 99.2
2006 Combined 352 343 NA 8 NA 1 97.4 98.6
2007 Combined 454 443 NA 8 NA 3 97.6 98.5
2008 Combined No spawn success data collected
2009 Combined 499 484 NA 5 NA 10 97.0 97.5
2010 Combined 1,173 1,147 6 13 1 6 97.8 98.7
2011 Combined 1,264 1,203 1 52 5 3 95.2 97.4
2012b
Natural 681 658 14 5 1 3 96.6 98.6
Hatchery 90 89 0 0 0 1 98.9 98.9
Total 771 747 14 5 1 4 96.9 98.6
2013b
Natural 461 392 51 9 3 6 85.0 94.5
Hatchery 224 144 39 11 13 17 64.3 81.3
Total 685 536 90 20 16 23 78.2 90.1
2014b
Natural 1,082 1,074 1 0 0 7 99.3 99.3
Hatchery 153 141 3 0 0 9 92.2 93.6
Total 1,235 1,215 4 0 0 16 98.4 98.6
2015b
Natural 1256 1237 14 3 2 0 98.5 99.5
Hatchery 149 135 7 5 2 0 90.6 96.1
Total 1405 1372 21 8 4 0 97.7 99.1
Mean
(RY 2010 -
2015)
Combined 1,089 1,037 23 16 5 9 94.0 97.1

© 2016, PUBLIC UTILITY DISTRICT NO. 2 OF GRANT COUNTY, WASHINGTON.
ALL RIGHTS RESERVED UNDER U.S. AND FOREIGN LAW, TREATIES AND CONVENTIONS.
53
specific recovery data for individual tag codes, along with the sample rate used to derive the
estimated total number of recoveries by fishery type.
Coded-wire tag data reported to RMPC are expanded by sample rates generated by the agency
reporting the data. In some cases, the estimated number of tags reported is less than the number
actually observed. This typically occurs when the sample rate is unknown, not reported, or
biased (Gilbert Lensegrav, WDFW, personal communication). In these instances, the observed
number was used instead of the estimated number to calculate the numbers of PRH origin fish
recovered by location.
The RMIS database was queried for tag recoveries on April 13, 2016 to provide recoveries of
coded-wire tagged PRH origin fish. The database for the 2009 brood should be complete for age-
2 through age-5. The age-6 recovered during RY2015 may not be included until January 1, 2017
due to the lag in reporting field data to RMPC.
Beginning with the 2010 release year, portions of the non-adipose clipped smolts released from
PRH were coded-wire tagged as part of a double index tag (DIT) study to evaluate the effect of
various mark-selective fisheries occurring in Oregon, Washington, and British Columbia waters
(PSC 2013). We are currently reviewing the data reported to the RMPC database to evaluate the
results of the double index tagging for the PRH origin fish. Data for brood years 2009 and 2010
show that adipose clipped fish from the DIT groups are being recovered in mark selective
fisheries occurring in ocean, marine, and freshwater zones. Comparisons of the demographics
between the DIT groups recovered at PRH are very similar (Appendix J). Therefore, mark
selective fisheries do not appear to influence the demographic data collected at PRH.
Fall Chinook salmon released from PRH supplement Pacific Ocean harvest for both commercial
and sport fisheries from Washington to Southeast Alaska as well as Columbia River commercial,
sport, and treaty tribal harvest. The Hanford Reach sport fishery for fall Chinook salmon is an
extremely popular fishery. This fishery typically runs annually from August 1 to late October. In
2015, an estimated 35,419 fall Chinook salmon were harvested during this fishery; 33,866 adults
and 1,553 jacks. Estimates generated from coded-wire tags recovered from the Hanford Reach
sport fishery suggest that 11.7% (4,144 fish) of the total sport harvest in the Hanford Reach was
comprised of fall Chinook salmon released from PRH (Table 47). Likewise, fall Chinook salmon
released from Ringold Springs Hatchery comprised 2.8% (992 fish) of the sport fishery. Strays
from other hatcheries combined represent 0.9% (319 fish) of the harvest. Sport harvest
monitoring in the Hanford Reach and lower Yakima includes surveying both adipose intact and
adipose clipped fish for coded-wire tags. Recent data from otolith sampling indicates that coded-
wire tag expansions may underestimate the number of PRH origin fall Chinook salmon annually
returning to PRH. A similar situation may occur when evaluating hatchery contributions to the
sport fishery.
Coded-wire tag data for PRH origin fall Chinook salmon that were marked with an adipose clip
were reviewed to assess contributions to marine and freshwater, commercial, tribal, and sport
fisheries. The largest proportion of the harvest of PRH origin fall Chinook salmon occurred in
ocean fisheries followed by Zone-6 tribal harvest. For brood years 1997 through 2009, 49% of
the reported harvest was taken in ocean fisheries and the other 51% in the Columbia River
fisheries (Table 48). The adipose clip coded-wire tag rate for the 2009 brood notably increased
from previous brood years. Not all coded-wire recovery locations survey for adipose intact
coded-wire tagged harvest. Therefore, the data presented in Table 48 includes harvest estimates
based on recoveries of adipose clipped coded-wire tagged fish.
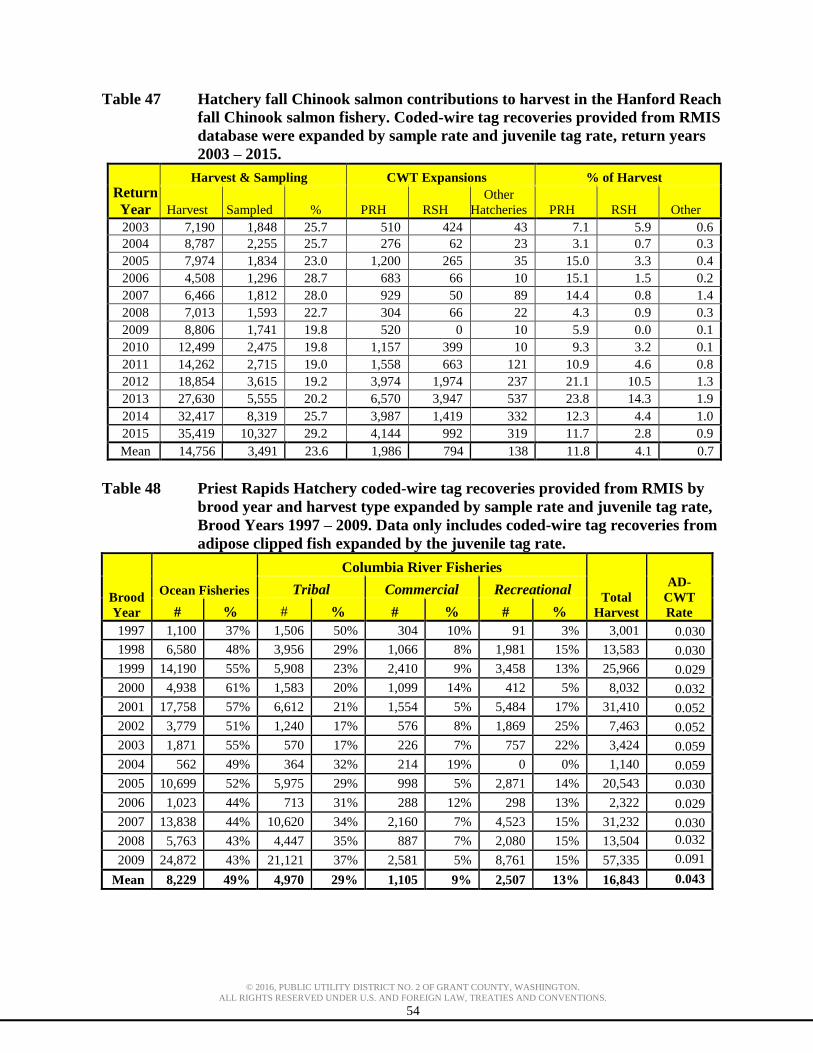
© 2016, PUBLIC UTILITY DISTRICT NO. 2 OF GRANT COUNTY, WASHINGTON.
ALL RIGHTS RESERVED UNDER U.S. AND FOREIGN LAW, TREATIES AND CONVENTIONS.
54
Table 47 Hatchery fall Chinook salmon contributions to harvest in the Hanford Reach
fall Chinook salmon fishery. Coded-wire tag recoveries provided from RMIS
database were expanded by sample rate and juvenile tag rate, return years
2003 – 2015.
Return
Year
Harvest & Sampling CWT Expansions % of Harvest
Harvest Sampled % PRH RSH
Other
Hatcheries PRH RSH Other
2003 7,190 1,848 25.7 510 424 43 7.1 5.9 0.6
2004 8,787 2,255 25.7 276 62 23 3.1 0.7 0.3
2005 7,974 1,834 23.0 1,200 265 35 15.0 3.3 0.4
2006 4,508 1,296 28.7 683 66 10 15.1 1.5 0.2
2007 6,466 1,812 28.0 929 50 89 14.4 0.8 1.4
2008 7,013 1,593 22.7 304 66 22 4.3 0.9 0.3
2009 8,806 1,741 19.8 520 0 10 5.9 0.0 0.1
2010 12,499 2,475 19.8 1,157 399 10 9.3 3.2 0.1
2011 14,262 2,715 19.0 1,558 663 121 10.9 4.6 0.8
2012 18,854 3,615 19.2 3,974 1,974 237 21.1 10.5 1.3
2013 27,630 5,555 20.2 6,570 3,947 537 23.8 14.3 1.9
2014 32,417 8,319 25.7 3,987 1,419 332 12.3 4.4 1.0
2015 35,419 10,327 29.2 4,144 992 319 11.7 2.8 0.9
Mean 14,756 3,491 23.6 1,986 794 138 11.8 4.1 0.7
Table 48 Priest Rapids Hatchery coded-wire tag recoveries provided from RMIS by
brood year and harvest type expanded by sample rate and juvenile tag rate,
Brood Years 1997 – 2009. Data only includes coded-wire tag recoveries from
adipose clipped fish expanded by the juvenile tag rate.
Brood
Year
Ocean Fisheries
Columbia River Fisheries
Total
Harvest
AD-
CWT
Rate
Tribal Commercial Recreational
# % # % # % # %
1997 1,100 37% 1,506 50% 304 10% 91 3% 3,001 0.030 1998 6,580 48% 3,956 29% 1,066 8% 1,981 15% 13,583 0.030 1999 14,190 55% 5,908 23% 2,410 9% 3,458 13% 25,966 0.029 2000 4,938 61% 1,583 20% 1,099 14% 412 5% 8,032 0.032 2001 17,758 57% 6,612 21% 1,554 5% 5,484 17% 31,410 0.052 2002 3,779 51% 1,240 17% 576 8% 1,869 25% 7,463 0.052 2003 1,871 55% 570 17% 226 7% 757 22% 3,424 0.059 2004 562 49% 364 32% 214 19% 0 0% 1,140 0.059 2005 10,699 52% 5,975 29% 998 5% 2,871 14% 20,543 0.030 2006 1,023 44% 713 31% 288 12% 298 13% 2,322 0.029 2007 13,838 44% 10,620 34% 2,160 7% 4,523 15% 31,232 0.030 2008 5,763 43% 4,447 35% 887 7% 2,080 15% 13,504 0.032
2009 24,872 43% 21,121 37% 2,581 5% 8,761 15% 57,335 0.091
Mean 8,229 49% 4,970 29% 1,105 9% 2,507 13% 16,843 0.043
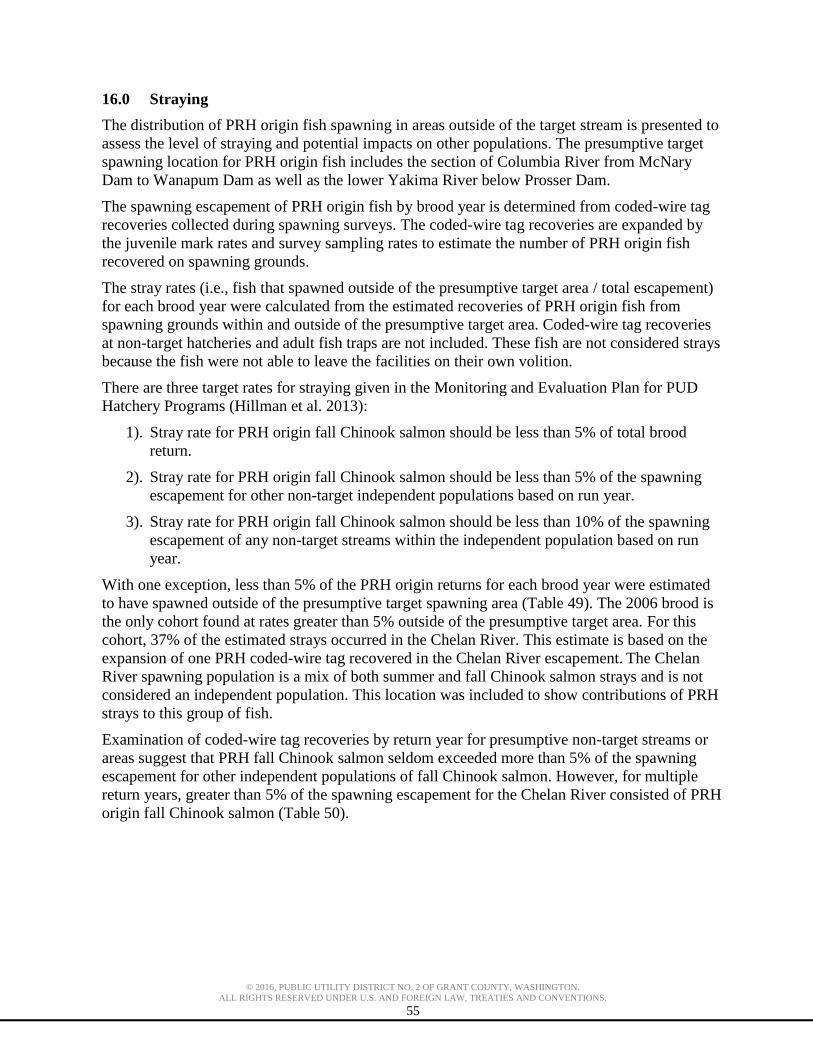
© 2016, PUBLIC UTILITY DISTRICT NO. 2 OF GRANT COUNTY, WASHINGTON.
ALL RIGHTS RESERVED UNDER U.S. AND FOREIGN LAW, TREATIES AND CONVENTIONS.
55
16.0 Straying
The distribution of PRH origin fish spawning in areas outside of the target stream is presented to
assess the level of straying and potential impacts on other populations. The presumptive target
spawning location for PRH origin fish includes the section of Columbia River from McNary
Dam to Wanapum Dam as well as the lower Yakima River below Prosser Dam.
The spawning escapement of PRH origin fish by brood year is determined from coded-wire tag
recoveries collected during spawning surveys. The coded-wire tag recoveries are expanded by
the juvenile mark rates and survey sampling rates to estimate the number of PRH origin fish
recovered on spawning grounds.
The stray rates (i.e., fish that spawned outside of the presumptive target area / total escapement)
for each brood year were calculated from the estimated recoveries of PRH origin fish from
spawning grounds within and outside of the presumptive target area. Coded-wire tag recoveries
at non-target hatcheries and adult fish traps are not included. These fish are not considered strays
because the fish were not able to leave the facilities on their own volition.
There are three target rates for straying given in the Monitoring and Evaluation Plan for PUD
Hatchery Programs (Hillman et al. 2013):
1). Stray rate for PRH origin fall Chinook salmon should be less than 5% of total brood
return.
2). Stray rate for PRH origin fall Chinook salmon should be less than 5% of the spawning
escapement for other non-target independent populations based on run year.
3). Stray rate for PRH origin fall Chinook salmon should be less than 10% of the spawning
escapement of any non-target streams within the independent population based on run
year.
With one exception, less than 5% of the PRH origin returns for each brood year were estimated
to have spawned outside of the presumptive target spawning area (Table 49). The 2006 brood is
the only cohort found at rates greater than 5% outside of the presumptive target area. For this
cohort, 37% of the estimated strays occurred in the Chelan River. This estimate is based on the
expansion of one PRH coded-wire tag recovered in the Chelan River escapement. The Chelan
River spawning population is a mix of both summer and fall Chinook salmon strays and is not
considered an independent population. This location was included to show contributions of PRH
strays to this group of fish.
Examination of coded-wire tag recoveries by return year for presumptive non-target streams or
areas suggest that PRH fall Chinook salmon seldom exceeded more than 5% of the spawning
escapement for other independent populations of fall Chinook salmon. However, for multiple
return years, greater than 5% of the spawning escapement for the Chelan River consisted of PRH
origin fall Chinook salmon (Table 50).
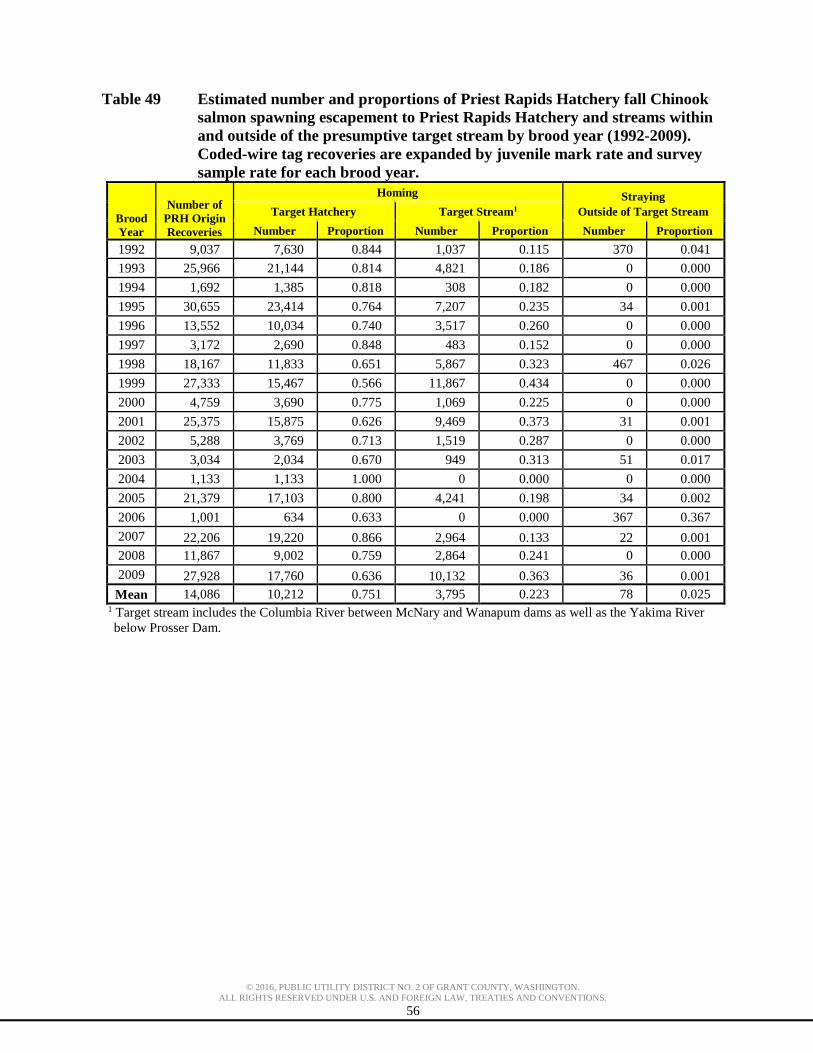
© 2016, PUBLIC UTILITY DISTRICT NO. 2 OF GRANT COUNTY, WASHINGTON.
ALL RIGHTS RESERVED UNDER U.S. AND FOREIGN LAW, TREATIES AND CONVENTIONS.
56
Table 49 Estimated number and proportions of Priest Rapids Hatchery fall Chinook
salmon spawning escapement to Priest Rapids Hatchery and streams within
and outside of the presumptive target stream by brood year (1992-2009).
Coded-wire tag recoveries are expanded by juvenile mark rate and survey
sample rate for each brood year.
Brood
Year
Number of
PRH Origin
Recoveries
Homing Straying
Outside of Target Stream Target Hatchery Target Stream1
Number Proportion Number Proportion Number Proportion
1992 9,037 7,630 0.844 1,037 0.115 370 0.041
1993 25,966 21,144 0.814 4,821 0.186 0 0.000
1994 1,692 1,385 0.818 308 0.182 0 0.000
1995 30,655 23,414 0.764 7,207 0.235 34 0.001
1996 13,552 10,034 0.740 3,517 0.260 0 0.000
1997 3,172 2,690 0.848 483 0.152 0 0.000
1998 18,167 11,833 0.651 5,867 0.323 467 0.026
1999 27,333 15,467 0.566 11,867 0.434 0 0.000
2000 4,759 3,690 0.775 1,069 0.225 0 0.000
2001 25,375 15,875 0.626 9,469 0.373 31 0.001
2002 5,288 3,769 0.713 1,519 0.287 0 0.000
2003 3,034 2,034 0.670 949 0.313 51 0.017
2004 1,133 1,133 1.000 0 0.000 0 0.000
2005 21,379 17,103 0.800 4,241 0.198 34 0.002
2006 1,001 634 0.633 0 0.000 367 0.367
2007 22,206 19,220 0.866 2,964 0.133 22 0.001
2008 11,867 9,002 0.759 2,864 0.241 0 0.000
2009 27,928 17,760 0.636 10,132 0.363 36 0.001
Mean 14,086 10,212 0.751 3,795 0.223 78 0.025 1 Target stream includes the Columbia River between McNary and Wanapum dams as well as the Yakima River
below Prosser Dam.

© 2016, PUBLIC UTILITY DISTRICT NO. 2 OF GRANT COUNTY, WASHINGTON.
ALL RIGHTS RESERVED UNDER U.S. AND FOREIGN LAW, TREATIES AND CONVENTIONS.
57
Table 50 Proportion of fall/summer Chinook spawning populations by return year
comprised of Priest Rapids Hatchery fall Chinook from 1998 – 2012 brood
releases based on coded wire tag recoveries.
Return
Year
Presumptive Non-Target Stream
Yakima Fall
Chinook
Okanogan Summer
Chinook
White
salmon Fall
Chinook
Wenatchee
Summer
Chinook
Methow
Summer
Chinook
Chelan
River1
2000 0.000 0.000 0.000 0.000 0.000 0.000
2001 0.000 0.000 0.000 0.000 0.000 0.339
2002 0.000 0.000 0.000 0.000 0.000 0.229
2003 0.000 0.000 0.000 0.000 0.000 0.000
2004 0.000 0.000 0.000 0.000 0.000 0.000
2005 0.000 0.000 0.000 0.000 0.000 0.000
2006 0.000 0.000 0.000 0.000 0.000 0.000
2007 0.000 0.000 0.000 0.000 0.000 0.000
2008 0.000 0.015 0.000 0.000 0.000 0.000
2009 0.000 0.000 0.000 0.000 0.000 0.066
2010 0.000 0.000 0.000 0.000 0.000 0.328
2011 0.000 0.000 0.000 0.000 0.000 0.000
2012 0.000 0.000 0.000 0.000 0.000 0.000
2013 0.000 0.000 0.000 0.000 0.000 0.000
2014 0.000 0.000 0.000 0.000 0.000 0.000
Mean 0.000 0.001 0.000 0.000 0.000 0.061 1The Chelan River spawning population is a mix of both summer and fall Chinook salmon strays and is not considered an independent
population. This location was included to show contributions of PRH strays to this group of fish.
As previously described in Section 4, approximately 3,000 smolts at PRH have been annually
PIT-tagged at PRH from brood years 1995 through 2010. The annual release of PIT-tagged
smolts was increased to 43,000 beginning with brood year 2011. The last known observations of
individual PIT-tag adult fall Chinook salmon originating from PRH at detection locations above
McNary Dam are given in Table 51 for brood years 1999 through 2012. The number of observed
PRH PIT-tagged adults should dramatically increase in the forthcoming years.
The majority of the PIT-tagged PRH adults observed at McNary Dam have been observed at
PRD and/or PRH. Very few fish have been detected in the Snake River, which is possibly the
area of most concern for straying. In addition, notable proportions of the returns for several
brood years have been observed at sites upstream of PRD. It is unclear whether fish spawned
outside of the target areas because fish could return to a target location after being detected at a
PIT tag array outside of the target stream without being detected again. Observations for PIT-
tagged presumptive Hanford Reach natural origin adults show detections at PRD and few at
dams above PRD (Table 52).

© 2016, PUBLIC UTILITY DISTRICT NO. 2 OF GRANT COUNTY, WASHINGTON.
ALL RIGHTS RESERVED UNDER U.S. AND FOREIGN LAW, TREATIES AND CONVENTIONS.
58
Table 51 Last observations of unique passive-integrated-transponder tagged adult fall
Chinook from Priest Rapids Hatchery at detection sites upstream of McNary
Dam, Brood Years 1999 - 2012.
Number of unique adult detections by site
Brood Year # Tagged MCN ICH PRA PRH RIA RRF WEA LWE LMR Total
1999 3000 9 0 7 1 1 18
2000 3000 3 0 4
7
2001 3000 5 0 6
11
2002 3000 7 0 1
8
2003 3000
0
2004 3000
0
2005 3000 9 0 4
1
14
2006 3000
0
2007 3,000 20 0 12 1 2 2 1
1 39
2008 2,994 5 0 6
1
12
2009 1,995 4 1 8 8 2
23
2010 (age 2- 5) 3,000 8 0 23 34 5 3 3 1
77
2011 (age 2- 4) 42,844 69 0 149 271 8 26 22 2 5 552
2012 (age 2-3) 42,908 77 1 92 344 5 12 12 1 1 544
MCN McNary Dam Adult Fishways RKM 470 WEA Well Dam Adult Fishways RKM 830
ICH Ice Harbor Dam Adult Fishways RKM 522 LWE Lower Wenatchee River RKM 754
PRA Priest Rapids Dam Adult Fishways RKM 639 PRH Priest Rapids Hatchery Outfall RKM 635
RIA Rock Island Dam Adult Fishways RKM 730 LMR Lower Methow River at Pateros RKM 843
RRF Rocky Reach Dam Adult Fishway RKM 763
Table 52 Last observations of unique passive-integrated-transponder tagged natural
origin Hanford Reach fall Chinook at detection sites upstream of McNary
Dam, Brood Years 2002, 2003, 2006- 2012
Number of unique adult detections by site
Brood Year # Tagged MCN ICH PRA PRH RIA RRF WEA LWE LMR Total
2002 2,975 3 0 0 0 0 0 0 0 0 3
2003 2,989 1 0 0 0 0 0 0 0 0 1
2006 22,633 13 0 0 0 0 0 0 0 0 13
2007 21,007 30 0 0 0 0 0 0 0 0 30
2008 16,651 85 0 6 0 0 1 0 0 0 92
2009 13,728 26 0 2 2 0 0 0 0 0 30
2010 (age 2-5) 4,850 27 0 9 0 0 2 0 0 0 38
2011 (age 2-4) 10,337 92 0 1 3 2 0 0 0 0 96
2012 (age 2-3) 4,891 11 0 0 0 0 0 0 0 0 11
MCN McNary Dam Adult Fishways RKM 470 WEA Well Dam Adult Fishways RKM 830
ICH Ice Harbor Dam Adult Fishways RKM 522 LWE Lower Wenatchee River RKM 754
PRA Priest Rapids Dam Adult Fishways RKM 639 PRH Priest Rapids Hatchery Outfall RKM 635
RIA Rock Island Dam Adult Fishways RKM 730 LMR Lower Methow River at Pateros RKM 843
RRF Rocky Reach Dam Adult Fishway RKM 763

© 2016, PUBLIC UTILITY DISTRICT NO. 2 OF GRANT COUNTY, WASHINGTON.
ALL RIGHTS RESERVED UNDER U.S. AND FOREIGN LAW, TREATIES AND CONVENTIONS.
59
17.0 Genetics
Genetic tissue was collected from each Chinook salmon spawned at PRH during 2015 by staff
from the Columbia River Inter-Tribal Fish Commission (CRITFC). In total 5,524 specimens
were collected to support their work associated with genetic stock identification and parentage-
based tagging. Tissue samples were numbered consistent with PRH M&E data so that biological
information could be associated with genetic data. The tissue samples collected from return years
2011 through 2015 is currently being archived by CRITFC. During 2010, WDFW staff collected
100 genetic tissue samples from both the Priest Rapids Hatchery broodstock and naturally
spawning broodstock from the Hanford Reach. WDFW has not collected genetic samples since
the 2010 return because of the large sampling and archiving effort by CRITFC.
18.0 Proportion of Natural Influence
The intent of integrated hatchery programs is to have hatchery and natural origin fish as a
common gene pool. Gene flow and the associated risks within and between the hatchery and
natural environments can be estimated using a simple ratio estimator using the proportion of
natural origin fish in the hatchery broodstock (pNOB) and the proportion of hatchery origin fish
in the natural spawning escapement (pHOS). This ratio of pNOB/(pHOS+pNOB) is termed the
Proportionate Natural Influence (PNI). The larger the PNI ratio, the greater selection in the
natural environment has on the population relative to that of the hatchery environment.
Alternatively, PNI estimates addressing gene flow from multiple sources/hatchery programs can
be calculated from a multiple population gene flow model based on the Ford model which has
been extended to three or more populations (Busack 2015, 2016).
In order for the natural environment to drive selection, PNI for either calculation should be
greater than 0.5 and for integrated hatchery programs the Hatchery Scientific Review Group
(HSRG) recommends a PNI ≥ 0.67 (HSRG/WDFW/NWIFC 2004). The HSRG recommends a
minimum target of 0.15 for the proportion of natural origin Chinook salmon to be incorporated
into the hatchery broodstock (pNOB) as well as a maximum target of 0.30 for the proportion of
hatchery origin Chinook allowed to spawn in the natural environment (pHOS) for the Hanford
Reach if it is to be managed as an integrated hatchery program.
Several estimates of PNI have been calculated to show the contributions of multiple programs on
the overall PNI for the Hanford Reach. These programs include the hatchery production
associated with the GCPUD and USACE mitigation and the influence of strays. The different
PNI estimates are based on pNOB and pHOS estimates specific to each source of spawning
adults. The methods used to allocate pNOB and pHOS are described in the following sections.
Estimates of pNOB
Estimates of pNOB based on otolith samples are limited to return years 2012 through 2015.
Otolith marking began with the 2007 brood. Therefore, otolith marks are only available for
specific age classes of PRH origin fish during return years 2010 and 2011 and do not provide
representative samples for estimating pNOB for the PRH broodstock.
The annual pNOB for fish spawned at PRH and used for GCPUD and USACE smolt releases
into the Hanford Reach during return years 2012 through 2015 is provided in

© 2016, PUBLIC UTILITY DISTRICT NO. 2 OF GRANT COUNTY, WASHINGTON.
ALL RIGHTS RESERVED UNDER U.S. AND FOREIGN LAW, TREATIES AND CONVENTIONS.
60
Table 53.
© 2016, PUBLIC UTILITY DISTRICT NO. 2 OF GRANT COUNTY, WASHINGTON.
ALL RIGHTS RESERVED UNDER U.S. AND FOREIGN LAW, TREATIES AND CONVENTIONS.
61
Table 53 Origin of broodstock and pNOB apportioned to program for fall Chinook
salmon spawned at Priest Rapids Hatchery, Return Years 2012 – 2015.
Return Year N GCPUD pNOB USACE pNOB
PRH and RSH
Combined pNOB
Other
Programs
pNOB1
2012 4,974 0.182 0.057 0.119 N/A
2013 5,442 0.225 0.026 0.127 N/A
2014 5,443 0.343 0.076 0.206 0.000
2015 5,524 0.313 0.045 0.179 0.000
1 Represents pHOB associated with egg takes utilized outside of the Hanford Reach.
The 2015 broodstock included 5,524 adults which were comprised of 4,875 fish from the
volunteer trap, 348 from the OLAFT and 301 from the ABC. In general, broodstock from ABC
and OLAFT are mated with adipose clipped broodstock obtained from the PRH volunteer trap.
In addition, adipose intact broodstock from the PRH volunteer trap are mated with adipose
clipped broodstock from the volunteer trap. The fish culturists segregate the progeny resulting
from these potential natural x hatchery matings for release from PRH. Matings of adipose clip
parents does occur. A portion of the progeny of these known hatchery matings are shipped to
other facilities for use by other programs.
GCPUD funds the collection of non-marked or tagged broodstock from the ABC and OLAFT
with the intent of improving the pNOB associated with the production of their 5.6 million smolt
mitigation requirement. The inclusion of these fish contributed greatly to the GCPUD program’s
egg take goal and the resulting pNOB. The 2015 PRH volunteer broodstock comprised an
estimated 150 and 194 natural origin males and females, respectively. The GCPUD alternative
mating strategy used 27 of these males. The remaining natural origin fish from the volunteer trap
were allocated by the proportion of the PRH volunteer broodstock used for the GCPUD and
USACE egg takes associated 1 x 2 matings and held for release at PRH. The average fecundity
(3,577) for the 2015 broodstock was used to calculate the number of females used for 1x2
matings that were required by each program (Table 54). The females used in the 1x4 matings had
an average fecundity of 3,406
The GCPUD program included sufficient numbers of eggs from natural x hatchery and hatchery
x hatchery matings (identified by adipose clip) to meet the program egg take goals for brood year
2015. Egg takes from the hatchery x hatchery matings that were in excess of the combined
GCPUD and USACE egg take goals for eventual release from PRH were either culled or
provided to other hatchery programs or educational programs (e.g., RSH, Umatilla Hatchery, and
Prosser Hatchery, Salmon in the Classroom). Shipping excess eggs resulting from hatchery x
hatchery matings to locations outside of the Hanford Reach resulted in a pNOB of 0.179 for the
combined GCPUD and USACE fall Chinook salmon production in the Hanford Reach versus the
pNOB of 0.172 for the entire broodstock spawned at PRH.
An alternative pNOB for calculating PNI was developed to account for the genetic influence on
pNOB resulting from the PRH spawning protocol of spawning one male with one, two, or four
females. It is intended to represent actual gene flow to the progeny instead of strictly the origin
and number of parents. This information is presented in Appendix L for comparison to other
conventional pNOB calculations.
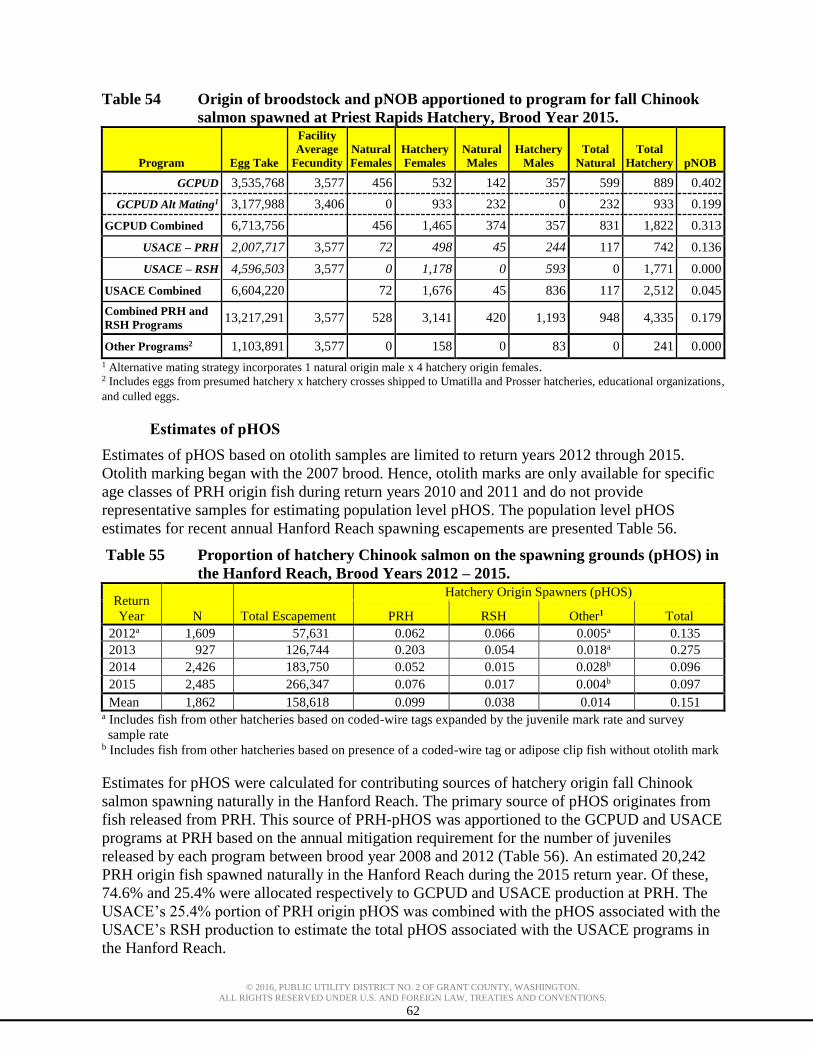
© 2016, PUBLIC UTILITY DISTRICT NO. 2 OF GRANT COUNTY, WASHINGTON.
ALL RIGHTS RESERVED UNDER U.S. AND FOREIGN LAW, TREATIES AND CONVENTIONS.
62
Table 54 Origin of broodstock and pNOB apportioned to program for fall Chinook
salmon spawned at Priest Rapids Hatchery, Brood Year 2015.
Program Egg Take
Facility
Average
Fecundity
Natural
Females
Hatchery
Females
Natural
Males
Hatchery
Males
Total
Natural
Total
Hatchery pNOB
GCPUD 3,535,768 3,577 456 532 142 357 599 889 0.402
GCPUD Alt Mating1 3,177,988 3,406 0 933 232 0 232 933 0.199
GCPUD Combined 6,713,756 456 1,465 374 357 831 1,822 0.313
USACE – PRH 2,007,717 3,577 72 498 45 244 117 742 0.136
USACE – RSH 4,596,503 3,577 0 1,178 0 593 0 1,771 0.000
USACE Combined 6,604,220 72 1,676 45 836 117 2,512 0.045
Combined PRH and
RSH Programs 13,217,291 3,577 528 3,141 420 1,193 948 4,335 0.179
Other Programs2 1,103,891 3,577 0 158 0 83 0 241 0.000
1 Alternative mating strategy incorporates 1 natural origin male x 4 hatchery origin females. 2 Includes eggs from presumed hatchery x hatchery crosses shipped to Umatilla and Prosser hatcheries, educational organizations,
and culled eggs.
Estimates of pHOS
Estimates of pHOS based on otolith samples are limited to return years 2012 through 2015.
Otolith marking began with the 2007 brood. Hence, otolith marks are only available for specific
age classes of PRH origin fish during return years 2010 and 2011 and do not provide
representative samples for estimating population level pHOS. The population level pHOS
estimates for recent annual Hanford Reach spawning escapements are presented Table 56.
Table 55 Proportion of hatchery Chinook salmon on the spawning grounds (pHOS) in
the Hanford Reach, Brood Years 2012 – 2015.
Return
Year N Total Escapement
Hatchery Origin Spawners (pHOS)
PRH RSH Other1 Total
2012a 1,609 57,631 0.062 0.066 0.005a 0.135
2013 927 126,744 0.203 0.054 0.018a 0.275
2014 2,426 183,750 0.052 0.015 0.028b 0.096
2015 2,485 266,347 0.076 0.017 0.004b 0.097
Mean 1,862 158,618 0.099 0.038 0.014 0.151 a Includes fish from other hatcheries based on coded-wire tags expanded by the juvenile mark rate and survey
sample rate b Includes fish from other hatcheries based on presence of a coded-wire tag or adipose clip fish without otolith mark
Estimates for pHOS were calculated for contributing sources of hatchery origin fall Chinook
salmon spawning naturally in the Hanford Reach. The primary source of pHOS originates from
fish released from PRH. This source of PRH-pHOS was apportioned to the GCPUD and USACE
programs at PRH based on the annual mitigation requirement for the number of juveniles
released by each program between brood year 2008 and 2012 (Table 56). An estimated 20,242
PRH origin fish spawned naturally in the Hanford Reach during the 2015 return year. Of these,
74.6% and 25.4% were allocated respectively to GCPUD and USACE production at PRH. The
USACE’s 25.4% portion of PRH origin pHOS was combined with the pHOS associated with the
USACE’s RSH production to estimate the total pHOS associated with the USACE programs in
the Hanford Reach.

© 2016, PUBLIC UTILITY DISTRICT NO. 2 OF GRANT COUNTY, WASHINGTON.
ALL RIGHTS RESERVED UNDER U.S. AND FOREIGN LAW, TREATIES AND CONVENTIONS.
63
The calculation of pHOS specific to each program includes proportions which are based on the
entire population of natural origin fish in the denominators. Therefore this method of calculating
program specific pHOS results in lower values than the population level pHOS and may only be
useful for assessing the individual program’s contribution of hatchery origin fish to the spawning
population in the natural environment.
Table 56 Origin of pHOS apportioned by program source for fall Chinook salmon
spawning naturally in the Hanford Reach, Return Years 2012 – 2015.
Return
Year
Natural
Origin
Hatchery Origin Spawners pHOS by Source
GCPUD1 USACE1,2 Other3 Total GCPUD1 USACE1,2 Other3 Combined
2012 50,072 3,943 3,598 261 7,803 0.068 0.062 0.005 0.135
2013 126,782 26,507 18,427 3,123 48,057 0.152 0.105 0.018 0.275
2014 166,183 7,185 5,262 5,120 17,567 0.039 0.029 0.028 0.096
2015 240,511 15,101 9,669 1,065 25,835 0.057 0.036 0.004 0.097 1Estimated number of PRH origin fish that spawned naturally in the Hanford Reach. Of these, 74.6% and 25.4% were
apportioned to GCPUD-PRH and USACE-PRH, respectively. The allocation of pHOS was based on the proportion of annual
juvenile mitigation goals for each agency for brood years 2008 through 2012. 2Includes hatchery origin fish released from Ringold Springs Hatchery.
3Includes hatchery origin fish released from other hatcheries based on CWT recoveries.
Estimates of PNI
We present a hierarchy of PNI estimates based on pNOB and pHOS values calculated to reflect
differing methodologies driven by the type of data available to assign origin of adult Chinook
salmon returns. The population level PNI for the Hanford Reach includes all hatchery origin fish
regardless of hatchery program or funding source.
Prior to return year 2012, pHOS, pNOB and PNI rates are based on coded-wire tag recoveries
from the adult returns. Historically, we used juvenile mark rate expansions of coded-wire tag
recoveries in the hatchery and stream surveys for these calculations. The pNOB estimated from
coded-wire tags requires the assumption that fish unaccounted for by the juvenile mark rate
expansions are natural origin fish. As discussed in Section 10 of this report, this assumption
significantly over estimates pNOB and PNI. This method of estimated pNOB for the 2015
broodstock was not calculated due to high-grading to remove fish possessing coded-wire tags as
well as adipose clipped fish. Hence, the broodstock origin is poorly represented by coded-wire
tag expansions.
The pHOS estimates based on juvenile mark rate expansions of coded-wire tag recoveries also
likely underestimate the presences of PRH and RSH origin fish as explained in Section 10. For
comparison, we present coded-wire tag based estimates of PNI derived from coded-wire tagged
adult-to-adult expansions for PRH and RSH origin adult recoveries at their respective hatcheries.
An explanation of methods is given in Appendix K. Estimates of pNOB, pHOS, and PNI based
on both methods of coded-wire tag expansions are presented in

© 2016, PUBLIC UTILITY DISTRICT NO. 2 OF GRANT COUNTY, WASHINGTON.
ALL RIGHTS RESERVED UNDER U.S. AND FOREIGN LAW, TREATIES AND CONVENTIONS.
64
Table 57. The pHOS and pNOB estimates from limited otolith datasets for recent complete
brood years is more similar to the estimates produced by adult-to-adult coded wire tag
expansions versus juvenile mark rate expansions of coded-wire tagged adult recoveries.

© 2016, PUBLIC UTILITY DISTRICT NO. 2 OF GRANT COUNTY, WASHINGTON.
ALL RIGHTS RESERVED UNDER U.S. AND FOREIGN LAW, TREATIES AND CONVENTIONS.
65
Table 57 Proportionate Natural Influence (PNI) of the Hanford Reach fall Chinook
salmon supplementation program based on expanded coded wire-tag
recoveries of all fish surveyed, Return Year 2001 – 2015.
Return
Year pNOB1 pHOS1 pNOB2 PHOS2
PNI based on
pNOB1 and
pHOS1
PNI based on
pNOB2 and
pHOS2
2001 0.155 0.094 0.046 0.066 0.622 0.411
2002 0.145 0.101 0.046 0.125 0.589 0.269
2003 0.132 0.099 0.046 0.117 0.571 0.282
2004 0.229 0.081 0.046 0.099 0.739 0.317
2005 0.370 0.106 0.046 0.155 0.777 0.229
2006 0.507 0.057 0.046 0.124 0.899 0.271
2007 0.326 0.041 0.046 0.065 0.888 0.414
2008 0.501 0.046 0.046 0.087 0.916 0.346
2009 0.568 0.077 0.046 0.174 0.881 0.209
2010 0.392 0.040 0.046 0.076 0.907 0.377
2011 0.381 0.075 0.046 0.154 0.836 0.230
2012 0.304 0.045 0.119a 0.106 0.871 0.529
2013 0.252 0.217 0.127a 0.297 0.537 0.300
2014 0.443 0.056 0.206a 0.065 0.888 0.760
2015 N/A3 0.072 0.179a 0.080 N/A3 0.691
Mean
(RY01-10) 0.333 0.074 0.046 0.109 0.779 0.311
pNOB1 Assumes that all fish not accounted for by juvenile coded-wire tag expansions are natural origin.
pHOS1 based on hatchery origin coded-wire recoveries expanded by juvenile mark rate and survey sample rate.
pNOB2 is assigned to years 2001 – 2011 based on an average proportion of natural origin returns to PRH for return years 2012 -
2014 as determined by otolith and other hatchery marks.
pHOS2 is based on an adult coded-wire tag expansion rate for PRH and RSH origin adults recovered in the Hanford Reach
escapement combined with juveniles coded-wire tag mark rate expansions for other hatchery strays. Both groups were expanded
by the survey sample rate. 3 Brood stock was often high-graded to remove coded-wire tagged fish during ponding. apNOB of broodstock used for production of PRH and RSH programs as determined from otoliths and other hatchery marks.
For return years 2012-2015 we present PNI estimates calculated from the multiple population
gene flow model (Table 58). The output from this model suggests that the PNI values for return
years 2014 and 2015 have exceeded the goal of 0.67.
Table 58 Proportionate Natural Influence (PNI) estimates for the Hanford Reach fall
Chinook salmon supplementation programs, Return Years 2012 – 2015.
Calculated from multiple population gene flow model based on the Ford
model which has been extended to three or more populations.
Return
Year
pNOB pHOS pHOS
Reach7
PNI
GCPUD1 USACE2 Facility3 GCPUD4 USACE5 Other6 Population8
2012 0.182 0.057 0.119 0.068 0.062 0.005 0.135 0.599
2013 0.225 0.027 0.127 0.152 0.105 0.018 0.275 0.463
2014 0.343 0.076 0.206 0.039 0.029 0.028 0.096 0.775
2015 0.313 0.045 0.179 0.057 0.036 0.004 0.097 0.762 1Includes broodstock associated with GCPUD production at PRH. 2 Includes broodstock associated with USACE production at PRH and RSH. 3 Includes broodstock spawned at PRH for all production 4 Includes pHOS associated with GCPUD mitigation smolt releases at PRH 5 Includes pHOS associated with USACE mitigation smolt releases at PRH and RSH
6 Includes pHOS associated with strays from hatcheries outside of the Hanford Reach 7 Population level pHOS in the Hanford Reach 8 Population level PNI for the Hanford Reach. Assumes strays from hatcheries outside of the Hanford Reach have an associated pNOB of zero.

© 2016, PUBLIC UTILITY DISTRICT NO. 2 OF GRANT COUNTY, WASHINGTON.
ALL RIGHTS RESERVED UNDER U.S. AND FOREIGN LAW, TREATIES AND CONVENTIONS.
66
19.0 Natural and Hatchery Replacement Rates
The numbers of hatchery origin recruits (HOR) were estimated from coded-wire tag recoveries
for brood year returns to the PRH and the Hanford Reach of the Columbia River. The recovered
coded-wire tags are expanded by sample rate and then by the juvenile tag rate. Coded-wire tags
recovered from natural origin recruits (NOR) originating from the Hanford Reach are difficult to
expand accurately because the juvenile tag rates are unknown. Therefore, the assumption was
made that returns not accounted for by HOR coded-wire tag recoveries are NOR. Recent data
indicates that that coded-wire tag data likely underestimates the true number of HOR; Hence, our
assumption likely overestimates the number of NOR.
Hatchery replacement rates (HRR) were calculated as the ratio of HOR to the parent broodstock
at PRH. This broodstock is an estimate of the number of fish spawned at PRH to produce the
target release of subyearling fall Chinook salmon. Similarly, natural replacement rates (NRR) for
the Hanford Reach URB fall Chinook salmon were calculated as the ratio of NOR to the parent
population spawning naturally in the Hanford Reach natural environment. This spawning
population is based on the escapement estimate to the Hanford Reach without adjustments for
spawn success.
Harvest estimates for HOR were calculated from the proportion of the expanded coded-wire tag
recoveries in the fisheries to the total number of the expanded coded-wire tags recovered. The
recovered coded-wire tags are expanded by sample rate of the survey and juvenile mark rate for
the coded wire tag group. Since there is not a coded-wire tag mark rate for NOR, the harvest
rates for HOR were used as an indicator for similar brood years of NOR.
For brood years 1996 through 2009, the HRR (10.85) has been consistently higher than the NRR
(2.94, Table 59). The HRR for BY 2009 including harvest was the highest that has been
observed (26.92) and was substantially higher than the NRR (3.97). The HRR should be greater
than or equal to 5.30 (the target value in Murdoch and Peven 2005).
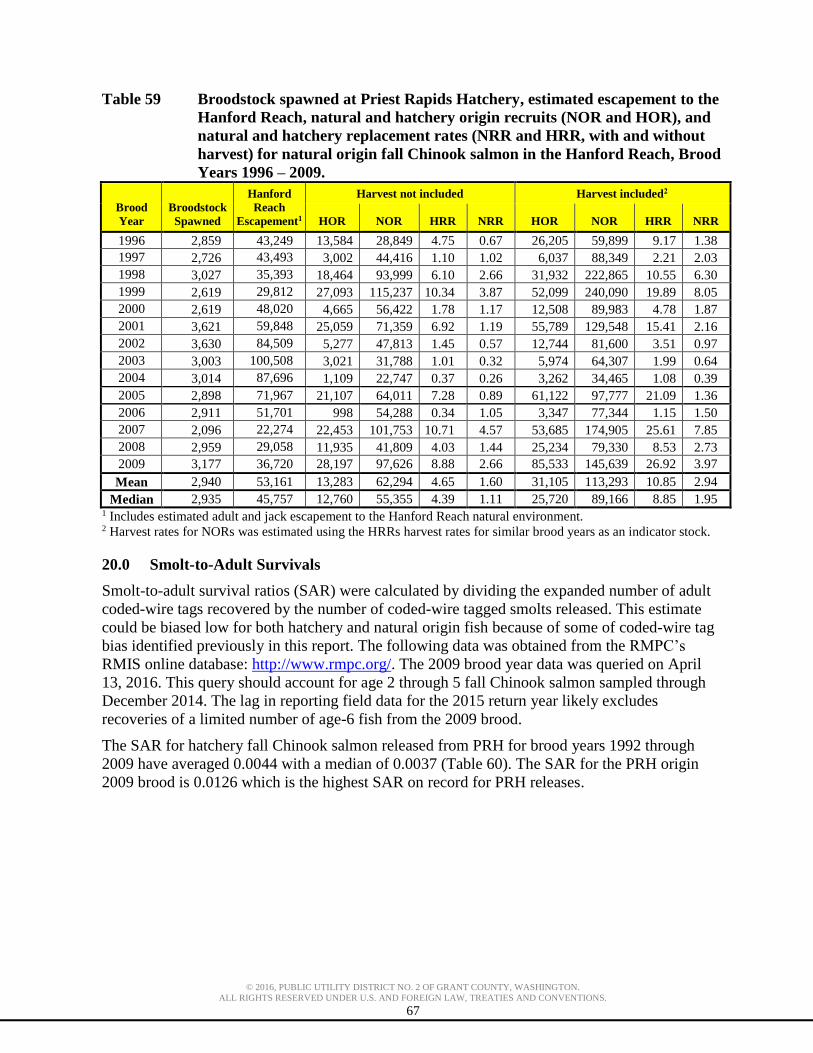
© 2016, PUBLIC UTILITY DISTRICT NO. 2 OF GRANT COUNTY, WASHINGTON.
ALL RIGHTS RESERVED UNDER U.S. AND FOREIGN LAW, TREATIES AND CONVENTIONS.
67
Table 59 Broodstock spawned at Priest Rapids Hatchery, estimated escapement to the
Hanford Reach, natural and hatchery origin recruits (NOR and HOR), and
natural and hatchery replacement rates (NRR and HRR, with and without
harvest) for natural origin fall Chinook salmon in the Hanford Reach, Brood
Years 1996 – 2009.
Brood
Year
Broodstock
Spawned
Hanford
Reach
Escapement1
Harvest not included Harvest included2
HOR NOR HRR NRR HOR NOR HRR NRR
1996 2,859 43,249 13,584 28,849 4.75 0.67 26,205 59,899 9.17 1.38
1997 2,726 43,493 3,002 44,416 1.10 1.02 6,037 88,349 2.21 2.03
1998 3,027 35,393 18,464 93,999 6.10 2.66 31,932 222,865 10.55 6.30
1999 2,619 29,812 27,093 115,237 10.34 3.87 52,099 240,090 19.89 8.05
2000 2,619 48,020 4,665 56,422 1.78 1.17 12,508 89,983 4.78 1.87
2001 3,621 59,848 25,059 71,359 6.92 1.19 55,789 129,548 15.41 2.16
2002 3,630 84,509 5,277 47,813 1.45 0.57 12,744 81,600 3.51 0.97
2003 3,003 100,508 3,021 31,788 1.01 0.32 5,974 64,307 1.99 0.64
2004 3,014 87,696 1,109 22,747 0.37 0.26 3,262 34,465 1.08 0.39
2005 2,898 71,967 21,107 64,011 7.28 0.89 61,122 97,777 21.09 1.36
2006 2,911 51,701 998 54,288 0.34 1.05 3,347 77,344 1.15 1.50
2007 2,096 22,274 22,453 101,753 10.71 4.57 53,685 174,905 25.61 7.85
2008 2,959 29,058 11,935 41,809 4.03 1.44 25,234 79,330 8.53 2.73
2009 3,177 36,720 28,197 97,626 8.88 2.66 85,533 145,639 26.92 3.97
Mean 2,940 53,161 13,283 62,294 4.65 1.60 31,105 113,293 10.85 2.94
Median 2,935 45,757 12,760 55,355 4.39 1.11 25,720 89,166 8.85 1.95 1 Includes estimated adult and jack escapement to the Hanford Reach natural environment. 2 Harvest rates for NORs was estimated using the HRRs harvest rates for similar brood years as an indicator stock.
20.0 Smolt-to-Adult Survivals
Smolt-to-adult survival ratios (SAR) were calculated by dividing the expanded number of adult
coded-wire tags recovered by the number of coded-wire tagged smolts released. This estimate
could be biased low for both hatchery and natural origin fish because of some of coded-wire tag
bias identified previously in this report. The following data was obtained from the RMPC’s
RMIS online database: http://www.rmpc.org/. The 2009 brood year data was queried on April
13, 2016. This query should account for age 2 through 5 fall Chinook salmon sampled through
December 2014. The lag in reporting field data for the 2015 return year likely excludes
recoveries of a limited number of age-6 fish from the 2009 brood.
The SAR for hatchery fall Chinook salmon released from PRH for brood years 1992 through
2009 have averaged 0.0044 with a median of 0.0037 (Table 60). The SAR for the PRH origin
2009 brood is 0.0126 which is the highest SAR on record for PRH releases.

© 2016, PUBLIC UTILITY DISTRICT NO. 2 OF GRANT COUNTY, WASHINGTON.
ALL RIGHTS RESERVED UNDER U.S. AND FOREIGN LAW, TREATIES AND CONVENTIONS.
68
Table 60 Smolt-to-adult-Survival ratios (SAR) for Priest Rapids Hatchery fall
Chinook salmon, Brood Years 1992 -2009. Data includes coded-wire tag
recoveries from adipose clipped fish.
Brood Year
Number of Tagged
Smolts Released Estimated Adult Captures SAR
1992 194,622 448 0.0023
1993 185,683 1,479 0.0080
1994 175,880 108 0.0006
1995 196,189 1,786 0.0091
1996 193,215 762 0.0040
1997 196,249 183 0.0009
1998 193,660 946 0.0049
1999 204,346 1,573 0.0077
2000 200,779 370 0.0018
2001 219,926 1,810 0.0082
2002 355,373 669 0.0019
2003 399,116 352 0.0009
2004 200,072 100 0.0005
2005 199,445 1,718 0.0086
2006 202,000 100 0.0005
2007 202,568 2,391 0.0118
2008 218,082 740 0.0034
2009 619,568 7,800 0.0126
Mean 242,043 1,296 0.0049
Median 200,426 751 0.0037

© 2016, PUBLIC UTILITY DISTRICT NO. 2 OF GRANT COUNTY, WASHINGTON.
ALL RIGHTS RESERVED UNDER U.S. AND FOREIGN LAW, TREATIES AND CONVENTIONS.
69
The SAR for Hanford Reach natural origin fall Chinook salmon for brood years 1992 through
2009 have averaged 0.0035 and a median of 0.0021 (Table 61). The SAR for the Hanford Reach
natural origin 2009 brood is 0.0079 which is the second highest SAR on record for the Hanford
Reach natural origin stock.
Table 61 Smolt-to-adult-Survival ratios (SAR) for Hanford Reach natural origin fall
Chinook salmon, Brood Years 1992 – 2009. Data includes coded-wire tag
recoveries from adipose clipped fish.
Brood Year
Number of Tagged
Smolts Released Estimated Adult Captures SAR
1992 203,591 829 0.0041
1993 95,897 485 0.0051
1994 148,585 74 0.0005
1995 146,887 340 0.0023
1996 92,262 111 0.0012
1997 199,896 365 0.0018
1998 129,850 784 0.0060
1999 213,259 2,378 0.0112
2000 204,925 362 0.0018
2001 127,758 519 0.0041
2002 203,557 338 0.0017
2003 207,168 199 0.0010
2004 163,884 147 0.0009
2005 203,929 301 0.0015
2006 263,478 356 0.0007
2007 53,618 456 0.0085
2008 203,947 520 0.0025
2009 201,606 1,597 0.0079
Mean 170,228 565 0.0035
Median 200,751 364 0.0021
21.0 ESA/HCP Compliance
Broodstock Collection
Section 10(a)(1)(B) Permit 1347 authorizes collection of fall Chinook broodstock at the OLAFT
for the Priest Rapids hatchery program with an incidental take limit of 10 steelhead (an aggregate
of hatchery or wild). Due to the absence of an identified steelhead take limit for operation of the
PRH volunteer trap in permit 1347 and through ongoing coordination with NOAA Fisheries, the
10 fish take limit for broodstock collection at the OLAFT, on an interim basis (until a new permit
is issued), has been re-conceptualized to include broodstock collection at the PRH volunteer trap,
and in the ABC fishery. During the 2015 fall Chinook broodstock collection activities, a total of
13 steelhead were encountered at the PRH volunteer trap with no incidental mortality reported.
No steelhead mortalities were associated with broodstock collection at the OLAFT or in the ABC
fishery (Table 62).

© 2016, PUBLIC UTILITY DISTRICT NO. 2 OF GRANT COUNTY, WASHINGTON.
ALL RIGHTS RESERVED UNDER U.S. AND FOREIGN LAW, TREATIES AND CONVENTIONS.
70
Table 62 Recoveries and disposition of steelhead at the Priest Rapids Hatchery
volunteer trap, Return Year 2015.
No Mark Ad Only Ad-RV Total
Rel
ease
d
Males 1 0 1 2
Females 2 7 2 11
Sub Total 3 7 3 13
Kil
led
Males 0 0 0 0
Females 0 0 0 0
Sub Total 0 0 0 0
Total 3 7 3 13
Hatchery Rearing and Release
The juvenile fall Chinook salmon from the 2015 brood year reared throughout their life-stages at
PRH without incident. The 2016 smolt release totaled 7,242,054 URB fall Chinook salmon,
representing 99% of the production objective and was compliant with the 10% overage allowable
in ESA Section 10 Permit 1347.
Distribution of Surplused, Mortalities, and Spawned, Adult fall Chinook Salmon
from Priest Rapids Hatchery
All adult Chinook salmon recovered at PRH are eventually distributed to multiple organizations
depending on the condition and treatment of the individual fish while at the hatchery. A large
majority of these fish are suitable for consumption and transported to Foodbanks (Table 63).
Table 63 Disposition of Chinook salmon collected at the Priest Rapids Hatchery
volunteer trap, Return Year 2015.
Distribution Numbers
Total Disposal of Mortalities and Treated Fish 7,402
American Canadian Fisheries Inc. 7,402
Total Donations to Educational Programs 366
Benton County Conservation District 80
Franklin County Conservation District 46
Yakima Basin Environmental Education Program 240
Total Donations to Foodbanks 52,987
Fish Food Bank 293
Moses Lake Food Bank 392
Northwest Harvest 52,302
Total Donations to Tribes 4,228
Shoshone-Bannock 525
Yakama 3,703
Total Fish Removed from Priest Rapids Hatchery 64,983
© 2016, PUBLIC UTILITY DISTRICT NO. 2 OF GRANT COUNTY, WASHINGTON.
ALL RIGHTS RESERVED UNDER U.S. AND FOREIGN LAW, TREATIES AND CONVENTIONS.
71
Hatchery Effluent Monitoring
Per ESA Permits 1196, 1347, and 1395, permit holders shall monitor and report hatchery
effluents in compliance with applicable National Pollution Discharge Elimination Systems
(NPDES) (EPA 1999) permit limitations. There were no NPDES violations reported at Grant
PUD Hatchery facilities during the September 2016 through June 2017 collection and rearing
periods.
Ecological Risk Assessment
One of the regional objectives in the GCPUD M&E plan is to conduct an ecological risk
assessment on non-target taxa of concern to determine if additional M&E is necessary (Pearsons
and Langshaw 2009). The methodology that was used to assess risks was presented in Pearsons
et al. (2012) and Pearsons and Busack (2012). This objective was completed through an
approved report that summarized the methods and results of the risk assessment (Mackey et al.
2014).
22.0 Acknowledgments
We thank the many individuals and organizations that helped collect the data or provided data
for inclusion in this report: Shawnaly Meehan and Dennis Werlau for the leadership of their
WDFW M&E crews that sorted and sampled over 80,000 fall Chinook salmon, along with
entering and reviewing all the sample data collected in 2015; Paul Hoffarth for supervising the
creel and carcass staff and summarizing the sport harvest data; and Anthony Fritts and Andrew
Murdoch provided helpful suggestions for the improvement of this report. Furthermore, we
would like to thank the hatchery staff at Priest Rapids and Ringold Springs Hatcheries: Mike
Lewis, Glen Pearson, Mike Erickson and their crews for accommodating the activities associated
with M&E. This work was primarily funded by Grant County PUD, the United States Army
Corps of Engineers, WDFW, and the Columbia River Coded Wire Tag Recovery Program.
© 2016, PUBLIC UTILITY DISTRICT NO. 2 OF GRANT COUNTY, WASHINGTON.
ALL RIGHTS RESERVED UNDER U.S. AND FOREIGN LAW, TREATIES AND CONVENTIONS.
72
Literature Cited
Busack, C. 2015. Extending the Ford model to three or more populations. August 31, 2015.
Sustainable Fisheries Division, West Coast Region, National Marine Fisheries Service.
5p.
Busack , C. 2016. Methow Gene Flow 2.xlsx. NMFS West Coast Region Portland, Oregon.
Ham, K. D., and T. N. Pearsons. 2001. A practical approach for containing ecological risks
associated with fish stocking programs. Fisheries 25(4):15-23.
Harnish, R.A., R. Sharma, G. A. McMichael, R.B. Langshaw, T.N. Pearsons, and D.A. Bernard.
2012. Effects of Priest Rapids Dam Operations on Hanford Reach Fall Chinook Salmon
Productivity and Estimation of Maximum Sustainable Yield, 1975-2004. Prepared for:
Public Utility District No. 2 of Grant County, Ephrata, WA. Contract Number 430-2464.
Hillman, T., T. Kahler, G. Mackey, J. Murauskas, A. Murdoch, K. Murdoch, T. Pearsons, and M.
Tonseth. 2013. Monitoring and evaluation plan for PUD hatchery programs. Chelan
PUD, Wenatchee, Washington.
Hoffarth, P. A. and T. N. Pearsons. 2012. Priest Rapids Hatchery Monitoring and Evaluation:
Annual Report for 2010. Grant County Public Utility District, Ephrata, Washington.
Hoffarth, P. A. and T. N. Pearsons. 2012. Priest Rapids Hatchery Monitoring and Evaluation:
Annual Report for 2011. Grant County Public Utility District, Ephrata, Washington.
Mackey, G., T. N. Pearsons, M. R. Cooper, K. G. Murdoch, A. R. Murdoch, and T. W. Hillman.
2014. Ecological risk assessment of upper Columbia hatchery programs on non-target
taxa of concern. Report produced by the Hatchery Evaluation Technical Team (HETT)
for the HCP Wells Hatchery Committee, HCP Rocky Reach Hatchery Committee, HCP
Rock Island Hatchery Committee, and the Priest Rapids Hatchery Sub-Committee. Grant
County Public Utility District, Ephrata, Washington.
McCarthy, M. A., D. Keith, J. Tietjen, M. A. Burgman, M. Maunder, L. Master, B. W. Brook, G.
Mace, H. P. Possingham, R. Medellin, S. Andelman, H. Regan, T. Regan, and M.
Ruckelshaus. 2004. Comparing predictions of extinction risk using models and subjective
judgement. Acta Oecologica 26(2004):67-74. doi10.1016/actao.2004.01.008.
Murdoch, A., and C. Peven. 2005. Conceptual approach to monitoring and evaluating the Chelan
County Public Utility District Hatchery Programs. Final report to the Chelan PUD
Habitat Conservation Plan’s Hatchery Committee.
Murdoch, A. R., T. N. Pearsons, and T. W. Maitland. 2010. Estimating the spawning escapement
of hatchery- and natural-origin spring Chinook Salmon using redd and carcass data.
North American Journal of Fisheries Management 30:361-375.
Naiman, R. J., J. R. Alldredge, D. A. Beauchamp, P. A. Bisson, J. Congleton, C. J. Henny, N.
Huntly, R. Lamberson, C. Levings, E. N. Merrill, W. G. Pearcy, B. E. Riemann, G. T.
Ruggerone, D. Scarnecchia, P. E. Smouse, and C. C. Wood. 2012. Developing a broader
scientific foundation for river restoration: Columbia River food webs. PNAS 1-7. Online
at: www.pnas.org/cgi/doi/10.1073/pnas.1213408109

© 2016, PUBLIC UTILITY DISTRICT NO. 2 OF GRANT COUNTY, WASHINGTON.
ALL RIGHTS RESERVED UNDER U.S. AND FOREIGN LAW, TREATIES AND CONVENTIONS.
73
Nugent, J. 2016. Hanford Reach Fall Chinook Redd Monitoring Report for Calendar Year 2015,
HNF 59813, Rev. 0, Prepared by Mission Support Alliance for the U.S. Department of
Energy, Richland, Washington. Online at: http://www.hanford.gov/files.cfm/HNF-59813
- Rev 00 NC.pdf
Oldenburg, E.W., B.J. Goodman, G.A. McMichael, and R.B. Langshaw. 2012. Forms of
Production Loss During the Early Life History of Fall Chinook Salmon in the Hanford
Reach of the Columbia River. Prepared for the Public Utility District No. 2 of Grant
County, Ephrata, WA. Contract Number 430-2464.
Pearsons, T. N., A. R. Murdoch, G. Mackey, K. G. Murdoch, T. W. Hillman, M. R. Cooper,and
J. L. Miller. 2012. Ecological risk assessment of multiple hatchery programs in the upper
Columbia watershed using Delphi and modeling approaches. Environmental Biology of
Fishes 94:87-100. DOI 10.1007/s10641-011-9884-1.
Pearsons, T. N. and C. A. Busack. 2012. PCD Risk 1: A tool for assessing and reducing
ecological risks of hatchery operations in freshwater. Environmental Biology of Fishes
94:45-65. DOI:10.1007/s10641-011-9926-8.
Pearsons, T. N., and C. W. Hopley. 1999. A practical approach for assessing ecological risks
associated with fish stocking programs. Fisheries 24(9):16-23.
Pearsons, T. N., and R. B. Langshaw. 2009. Monitoring and evaluation plan for Grant PUDs
Salmon and steelhead supplementation Programs. Grant PUD, Ephrata, Washington.
PSC (Pacific Salmon Commission). 2013. 2013 Exploitation Rate Analysis and Model
Calibration - Volume One. A report of the Pacific Salmon Commission Joint Chinook
Technical Committee. Technical Report (14)-1 V.1

© 2016, PUBLIC UTILITY DISTRICT NO. 2 OF GRANT COUNTY, WASHINGTON.
ALL RIGHTS RESERVED UNDER U.S. AND FOREIGN LAW, TREATIES AND CONVENTIONS.
A-1
Evaluation of Coded-Wire Tag Bias
We annually evaluate the bias associated with estimates of the number of hatchery origin returns
to PRH generated using coded-wire tags. Results from demographic sampling of the fall Chinook
returns for 2010 through 2013 indicate that estimates of hatchery contributions to broodstock, the
terminal sport fishery, and to escapement of the Hanford Reach calculated from otolith marks
were substantially different from estimates generated using coded-wire tags expanded by
sampling rates and juvenile mark rates. This was of significant concern because many estimates
such as stray rate, survival, origin, and harvest are dependent upon estimates generated from
coded-wire tags.
To assess the level of coded-wire tag recovery bias, we made comparisons of the proportion of
PRH origin coded-wire tag returns to PRH with the coded-wire tag mark rate for individual ages
by brood year using the following equation:
Where:
# of PRH origin fish collected = Estimate of the number of PRH origin fish for a specific age/brood year as
determined by otoliths, scale aging, and expansion and pooling of age
samples to represent total returns by age
# of PRH Origin CWT Fish Recovered = Number of PRH origin CWT fish for a specific age/brood
recovered at the hatchery (100% sample rate)
CWT Mark Rate = CWT marking rate for the specific brood year which is the number of CWT
placed in fish divided by the estimated total number of fish at the time of
marking.
If a coded-wire tag bias did not exist, the proportion of PRH coded-wire tag returns to the PRH
coded-wire tag mark rate should equal 1.000. As shown in Table 1, the estimated bias ranged
from 0.573 to 2.026 for the different age/broods examined. The level of bias appears to be much
less for brood years 2012 and 2013 to that of previous brood years. It is unclear whether coded-
wire tag estimates are biased because of 1) tag loss, 2) less than 100% detection of tags when
scanned, 3) inappropriate expansion estimates, 4) differential survival of tagged fish, or 5)
incorrect estimates of the total number of fish released from PRH. The precision of the estimated
# of PRH origin fish collected varies for each age class of a given brood year due to size of the
otolith sub-sample pulled from the demographic sample. In some cases, there are relatively few
samples for age-2 and 5 fish for a given brood year for this estimate.
(# of PRH Origin CWT Fish Recovered / # of PRH Origin Fish Collected)
CWT Mark Rate for Brood Year
CWT Recovery Bias =

© 2016, PUBLIC UTILITY DISTRICT NO. 2 OF GRANT COUNTY, WASHINGTON.
ALL RIGHTS RESERVED UNDER U.S. AND FOREIGN LAW, TREATIES AND CONVENTIONS.
A-2
Table 1 Estimate of coded-wire tags bias for Priest Rapids origin returns to the
hatchery, Brood Years 2007- 2013.
Brood Age
Proportion
CWT
Marked
# of PRH
Origin CWT
Fish
Recovered
Estimated #
of PRH
origin Fish
Collected
Proportion of
PRH Origin
Brood Return
CWT
Proportion of PRH CWT
Returns to the PRH
CWT Mark Rate (CWT
Recovery Bias)
2007 5 0.0445 48 928 0.052 1.169
2007 4 0.0445 280 10,977 0.026 0.584
2007 3 0.0445 410 14,078 0.029 0.652
2007 2 No otolith data collected during return year 2009
2008 5 0.0318 2 31 0.065 2.044
2008 4 0.0318 81 2,983 0.027 0.849
2008 3 0.0318 127 5,606 0.023 0.723
2008 2 0.0318 57 2,578 0.022 0.692
2009 5 0.2429 407 1,827 0.223 0.918
2009 4 0.2429 1,081 5,944 0.182 0.749
2009 3 0.2429 2,309 13,544 0.170 0.700
2009 2 0.2429 628 3,082 0.204 0.840
2010 5 0.2371 861 2,375 0.362 1.529
2010 4 0.2371 8,719 41,076 0.212 0.894
2010 3 0.2371 5,828 31,568 0.185 0.780
2010 2 0.2371 1,498 8,896 0.168 0.709
2011 4 0.1691 2,719 19,909 0.137 0.808
2011 3 0.1691 2,596 18,905 0.137 0.810
2011 2 0.1691 349 2,777 0.126 0.745
2012 3 0.1766 5,836 34,082 0.171 0.970
2012 2 0.1766 1,910 11,123 0.172 0.974
2013 2 0.1662 548 3,495 0.157 0.943
Assessment of coded-wire tag detection efficiency has been conducted annually at PRH since
2010 during the sampling of adult fish. During 2013, M&E staff randomly selected a total of
1,063 quality control fish being surplused that did not register as possessing a coded-wire tag as
determined by scanning them with the new T-wand. These quality control fish were re-scanned
with the older blue-wand to evaluate the performance of the T-wand. The quality control fish that
register positive coded-wire tags were re-scanned by the T-wand to determine if the missed
coded-wire tag was the result of operator error or the inability of the T-wand to detect the coded-
wire tag. On the few occasions that the T-wand could not detect a coded-wire tag identified by
the blue-wand, the snouts were removed from each fish to increase the likelihood of detection
and then passed through a V-detector. Similar to quality control results for previous years, there
were few (4 tags; 0.4%) additional coded-wire tag detections observed from the 1,063 fish
sampled during 2013 that were not initially detected by the T-wands.
During 2013 and 2014, we found the T-wands to be overly sensitive which resulted in false
positive detections and additional work related to collecting and extracting coded-wire tags. On
October 2, 2014 we setup two series R9500 detectors to expedite the scanning for coded-wire
tags (Figure ). The detectors were checked for proper operation each day prior to scanning fish.

© 2016, PUBLIC UTILITY DISTRICT NO. 2 OF GRANT COUNTY, WASHINGTON.
ALL RIGHTS RESERVED UNDER U.S. AND FOREIGN LAW, TREATIES AND CONVENTIONS.
A-3
Informal quality control checks occurred daily during the first two weeks of operation in order to
identify the detection efficiency of each detector. These checks involved running 100 fish
through each machine and then re-scanning the fish with the T-wands. A total of 2,000 fish were
passed through the R9500 units of which 422 were identified to possess coded-wire tags. Of
these fish, 419 signaled positive for coded-wire tags during the initial scanning. The three fish
possessing a coded-wire tag that were not identified by the R9500 during the initial scanning
were correctly detected when re-ran though the detectors. The missed fish were likely the result
of passing fish through the detectors too rapidly.
The R9500 detectors were used to scan the vast majority of fish surplused at PRH during 2015.
The first group of fish handled each day was used to test the coded-wire tag detection of each
R9500 detector. The test fish without a detected coded-wire tag were re-scanned with a T-wand
to assess the performance of the R9500 detectors. In total, the quality control fish included 4,596
fish of which 2 (0.04%) were found to possess a coded-wire tag that did not initially get diverted
to the fish tote for coded-wire tag fish. Similar to observations in 2014, these fish were correctly
diverted to the tote receiving coded-wire tagged fish when re-scanned by the R9500.
Figure 1 Series R9500 Coded-wire tag detectors used at Priest Rapids Hatchery, 2014
The methods describe here do not provide a definitive estimate of undetected coded-wire tags for
fish sampled at PRH. We make the assumption, that if the coded-wire tag detection wands and
R9500 units do not detect a coded-wire tag in a given fish, then it did not possess a tag. Based on
this assumption, the coded-wire detection efficiency at PRH is likely greater than 99%.
Therefore, the magnitude of the coded-wire recovery bias expressed in Table 1 is not likely due
to poor coded-wire detection efficiency.
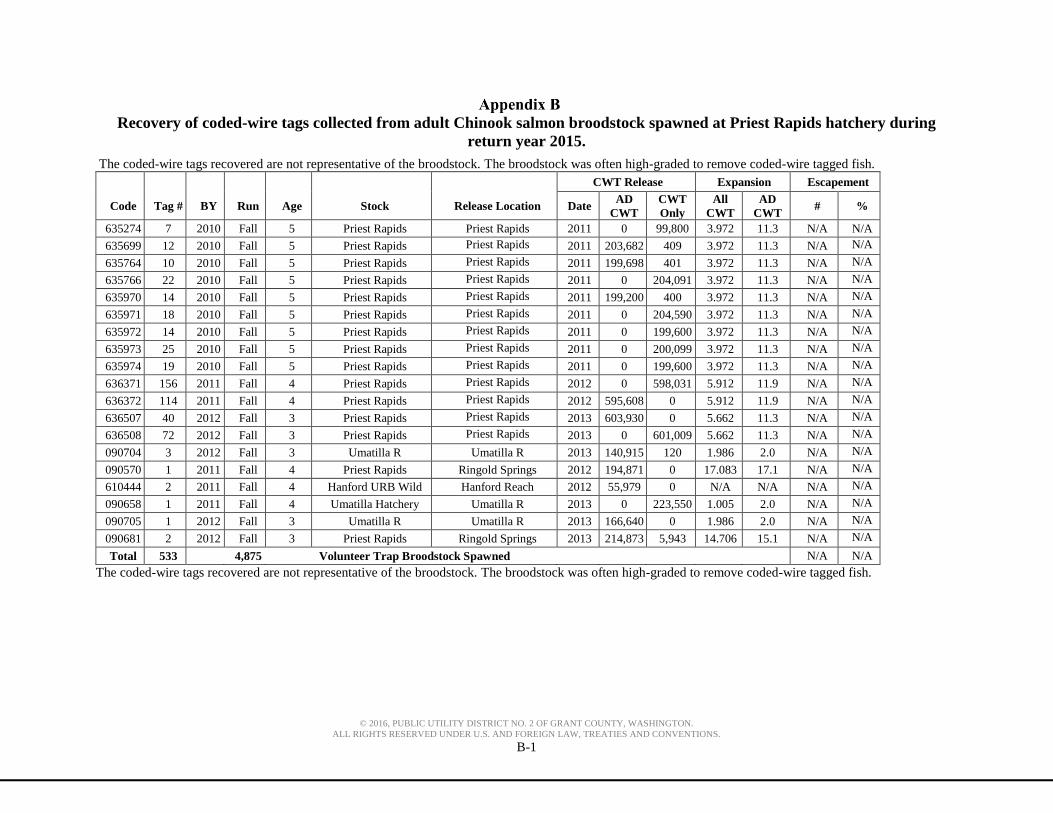
© 2016, PUBLIC UTILITY DISTRICT NO. 2 OF GRANT COUNTY, WASHINGTON.
ALL RIGHTS RESERVED UNDER U.S. AND FOREIGN LAW, TREATIES AND CONVENTIONS.
B-1
Recovery of coded-wire tags collected from adult Chinook salmon broodstock spawned at Priest Rapids hatchery during
return year 2015.
The coded-wire tags recovered are not representative of the broodstock. The broodstock was often high-graded to remove coded-wire tagged fish.
CWT Release Expansion Escapement
Code Tag # BY Run Age Stock Release Location Date AD
CWT
CWT
Only
All
CWT
AD
CWT # %
635274 7 2010 Fall 5 Priest Rapids Priest Rapids 2011 0 99,800 3.972 11.3 N/A N/A
635699 12 2010 Fall 5 Priest Rapids Priest Rapids 2011 203,682 409 3.972 11.3 N/A N/A
635764 10 2010 Fall 5 Priest Rapids Priest Rapids 2011 199,698 401 3.972 11.3 N/A N/A
635766 22 2010 Fall 5 Priest Rapids Priest Rapids 2011 0 204,091 3.972 11.3 N/A N/A
635970 14 2010 Fall 5 Priest Rapids Priest Rapids 2011 199,200 400 3.972 11.3 N/A N/A
635971 18 2010 Fall 5 Priest Rapids Priest Rapids 2011 0 204,590 3.972 11.3 N/A N/A
635972 14 2010 Fall 5 Priest Rapids Priest Rapids 2011 0 199,600 3.972 11.3 N/A N/A
635973 25 2010 Fall 5 Priest Rapids Priest Rapids 2011 0 200,099 3.972 11.3 N/A N/A
635974 19 2010 Fall 5 Priest Rapids Priest Rapids 2011 0 199,600 3.972 11.3 N/A N/A
636371 156 2011 Fall 4 Priest Rapids Priest Rapids 2012 0 598,031 5.912 11.9 N/A N/A
636372 114 2011 Fall 4 Priest Rapids Priest Rapids 2012 595,608 0 5.912 11.9 N/A N/A
636507 40 2012 Fall 3 Priest Rapids Priest Rapids 2013 603,930 0 5.662 11.3 N/A N/A
636508 72 2012 Fall 3 Priest Rapids Priest Rapids 2013 0 601,009 5.662 11.3 N/A N/A
090704 3 2012 Fall 3 Umatilla R Umatilla R 2013 140,915 120 1.986 2.0 N/A N/A
090570 1 2011 Fall 4 Priest Rapids Ringold Springs 2012 194,871 0 17.083 17.1 N/A N/A
610444 2 2011 Fall 4 Hanford URB Wild Hanford Reach 2012 55,979 0 N/A N/A N/A N/A
090658 1 2011 Fall 4 Umatilla Hatchery Umatilla R 2013 0 223,550 1.005 2.0 N/A N/A
090705 1 2012 Fall 3 Umatilla R Umatilla R 2013 166,640 0 1.986 2.0 N/A N/A
090681 2 2012 Fall 3 Priest Rapids Ringold Springs 2013 214,873 5,943 14.706 15.1 N/A N/A
Total 533
4,875 Volunteer Trap Broodstock Spawned
N/A N/A
The coded-wire tags recovered are not representative of the broodstock. The broodstock was often high-graded to remove coded-wire tagged fish.
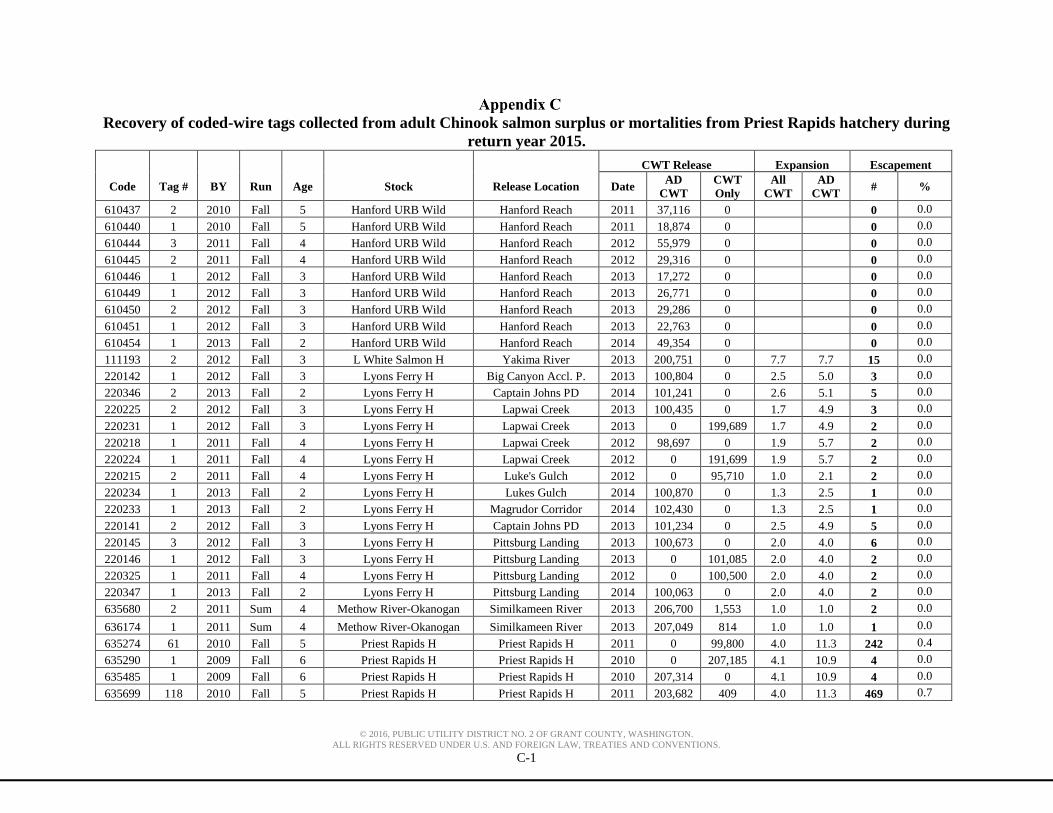
© 2016, PUBLIC UTILITY DISTRICT NO. 2 OF GRANT COUNTY, WASHINGTON.
ALL RIGHTS RESERVED UNDER U.S. AND FOREIGN LAW, TREATIES AND CONVENTIONS.
C-1
Recovery of coded-wire tags collected from adult Chinook salmon surplus or mortalities from Priest Rapids hatchery during
return year 2015.
CWT Release Expansion Escapement
Code Tag # BY Run Age Stock Release Location Date AD
CWT
CWT
Only
All
CWT
AD
CWT # %
610437 2 2010 Fall 5 Hanford URB Wild Hanford Reach 2011 37,116 0 0 0.0
610440 1 2010 Fall 5 Hanford URB Wild Hanford Reach 2011 18,874 0 0 0.0
610444 3 2011 Fall 4 Hanford URB Wild Hanford Reach 2012 55,979 0 0 0.0
610445 2 2011 Fall 4 Hanford URB Wild Hanford Reach 2012 29,316 0 0 0.0
610446 1 2012 Fall 3 Hanford URB Wild Hanford Reach 2013 17,272 0 0 0.0
610449 1 2012 Fall 3 Hanford URB Wild Hanford Reach 2013 26,771 0 0 0.0
610450 2 2012 Fall 3 Hanford URB Wild Hanford Reach 2013 29,286 0 0 0.0
610451 1 2012 Fall 3 Hanford URB Wild Hanford Reach 2013 22,763 0 0 0.0
610454 1 2013 Fall 2 Hanford URB Wild Hanford Reach 2014 49,354 0 0 0.0
111193 2 2012 Fall 3 L White Salmon H Yakima River 2013 200,751 0 7.7 7.7 15 0.0
220142 1 2012 Fall 3 Lyons Ferry H Big Canyon Accl. P. 2013 100,804 0 2.5 5.0 3 0.0
220346 2 2013 Fall 2 Lyons Ferry H Captain Johns PD 2014 101,241 0 2.6 5.1 5 0.0
220225 2 2012 Fall 3 Lyons Ferry H Lapwai Creek 2013 100,435 0 1.7 4.9 3 0.0
220231 1 2012 Fall 3 Lyons Ferry H Lapwai Creek 2013 0 199,689 1.7 4.9 2 0.0
220218 1 2011 Fall 4 Lyons Ferry H Lapwai Creek 2012 98,697 0 1.9 5.7 2 0.0
220224 1 2011 Fall 4 Lyons Ferry H Lapwai Creek 2012 0 191,699 1.9 5.7 2 0.0
220215 2 2011 Fall 4 Lyons Ferry H Luke's Gulch 2012 0 95,710 1.0 2.1 2 0.0
220234 1 2013 Fall 2 Lyons Ferry H Lukes Gulch 2014 100,870 0 1.3 2.5 1 0.0
220233 1 2013 Fall 2 Lyons Ferry H Magrudor Corridor 2014 102,430 0 1.3 2.5 1 0.0
220141 2 2012 Fall 3 Lyons Ferry H Captain Johns PD 2013 101,234 0 2.5 4.9 5 0.0
220145 3 2012 Fall 3 Lyons Ferry H Pittsburg Landing 2013 100,673 0 2.0 4.0 6 0.0
220146 1 2012 Fall 3 Lyons Ferry H Pittsburg Landing 2013 0 101,085 2.0 4.0 2 0.0
220325 1 2011 Fall 4 Lyons Ferry H Pittsburg Landing 2012 0 100,500 2.0 4.0 2 0.0
220347 1 2013 Fall 2 Lyons Ferry H Pittsburg Landing 2014 100,063 0 2.0 4.0 2 0.0
635680 2 2011 Sum 4 Methow River-Okanogan Similkameen River 2013 206,700 1,553 1.0 1.0 2 0.0
636174 1 2011 Sum 4 Methow River-Okanogan Similkameen River 2013 207,049 814 1.0 1.0 1 0.0
635274 61 2010 Fall 5 Priest Rapids H Priest Rapids H 2011 0 99,800 4.0 11.3 242 0.4
635290 1 2009 Fall 6 Priest Rapids H Priest Rapids H 2010 0 207,185 4.1 10.9 4 0.0
635485 1 2009 Fall 6 Priest Rapids H Priest Rapids H 2010 207,314 0 4.1 10.9 4 0.0
635699 118 2010 Fall 5 Priest Rapids H Priest Rapids H 2011 203,682 409 4.0 11.3 469 0.7

© 2016, PUBLIC UTILITY DISTRICT NO. 2 OF GRANT COUNTY, WASHINGTON.
ALL RIGHTS RESERVED UNDER U.S. AND FOREIGN LAW, TREATIES AND CONVENTIONS.
C-2
635764 104 2010 Fall 5 Priest Rapids H Priest Rapids H 2011 199,698 401 4.0 11.3 413 0.6
635766 136 2010 Fall 5 Priest Rapids H Priest Rapids H 2011 0 204,091 4.0 11.3 540 0.8
635970 106 2010 Fall 5 Priest Rapids H Priest Rapids H 2011 199,200 400 4.0 11.3 421 0.7
635971 116 2010 Fall 5 Priest Rapids H Priest Rapids H 2011 0 204,590 4.0 11.3 461 0.7
635972 126 2010 Fall 5 Priest Rapids H Priest Rapids H 2011 0 199,600 4.0 11.3 500 0.8
635973 122 2010 Fall 5 Priest Rapids H Priest Rapids H 2011 0 200,099 4.0 11.3 485 0.8
635974 106 2010 Fall 5 Priest Rapids H Priest Rapids H 2011 0 199,600 4.0 11.3 421 0.7
636371 1575 2011 Fall 4 Priest Rapids H Priest Rapids H 2012 0 598,031 5.9 11.8 9,312 14.6
636372 1409 2011 Fall 4 Priest Rapids H Priest Rapids H 2012 595,608 0 5.9 11.8 8,330 13.0
636507 2820 2012 Fall 3 Priest Rapids H Priest Rapids H 2013 603,930 0 5.7 11.3 15,968 25.0
636508 3108 2012 Fall 3 Priest Rapids H Priest Rapids H 2013 0 601,009 5.7 11.3 17,599 27.5
636681 281 2013 Fall 2 Priest Rapids H Priest Rapids H 2014 600,883 2,914 6.0 12.1 1,691 2.6
636682 264 2013 Fall 2 Priest Rapids H Priest Rapids H 2014 0 603,819 6.0 12.1 1,589 2.5
636837 1 2014 Fall 1 Priest Rapids H Priest Rapids H 2015 0 604,861 5.8 11.7 6 0.0
090488 6 2010 Fall 5 Priest Rapids H Ringold Spring H 2011 221,389 1,527 15.6 15.7 94 0.1
090570 9 2011 Fall 4 Priest Rapids H Ringold Spring H 2012 194,871 0 17.1 17.1 154 0.2
090681 23 2012 Fall 3 Priest Rapids H Ringold Spring H 2013 214,873 5,943 14.7 15.1 338 0.5
090863 3 2013 Fall 2 Priest Rapids H Ringold Spring H 2014 219,956 2,784 15.1 15.3 45 0.1
100241 1 2011 Sum 4 South Fork Salmon R Crooked River Trap 2013 190,115 0 1.0 1.1 1 0.0
100257 1 2012 Sum 3 South Fork Salmon R Knox Bridge 2014 111,350 0 7.3 7.3 7 0.0
636575 1 2012 Fall 3 Snake River Couse Creek 2013 202,036 2,135 1.0 1.0 1 0.0
636576 2 2012 Fall 3 Snake River Grande Ronde R 2013 216,889 430 1.8 1.9 4 0.0
636739 2 2013 Fall 2 Snake River Grande Ronde R 2014 202,273 0 2.0 2.0 4 0.0
636574 1 2012 Fall 3 Snake River Lyons Ferry 2013 210,479 148 1.0 1.0 1 0.0
636583 1 2012 Fall 3 Snake River Lyons Ferry 2014 246,702 2,685 1.0 2.0 1 0.0
090703 2 2012 Fall 3 Snake River Hells Canyon 2013 228,054 156 3.9 3.9 8 0.0
100201 3 2011 Fall 4 Snake River Hells Canyon 2012 187,146 0 1.1 1.1 3 0.0
636444 1 2011 Fall 4 Snake River Lyons Ferry H 2013 242,041 804 1.8 1.9 2 0.0
090434 2 2010 Fall 5 Umatilla H Umatilla R 2011 138,007 0 1.0 1.0 2 0.0
090435 2 2010 Fall 5 Umatilla H Umatilla R 2011 141,332 0 1.0 1.0 2 0.0
090436 2 2010 Fall 5 Umatilla H Umatilla R 2011 140,958 0 1.0 1.0 2 0.0
090489 1 2010 Fall 5 Umatilla H Umatilla R 2012 50,751 0 1.0 2.1 1 0.0
090490 3 2010 Fall 5 Umatilla H Umatilla R 2012 45,937 0 1.0 2.1 3 0.0
090492 2 2010 Fall 5 Umatilla H Umatilla R 2012 90,390 0 1.0 2.1 2 0.0
090493 8 2010 Fall 5 Umatilla H Umatilla R 2012 0 254,769 1.0 2.1 8 0.0
090585 7 2011 Fall 4 Umatilla H Umatilla R 2012 154,611 0 1.7 1.7 12 0.0
090586 10 2011 Fall 4 Umatilla H Umatilla R 2012 166,448 0 1.7 1.7 17 0.0
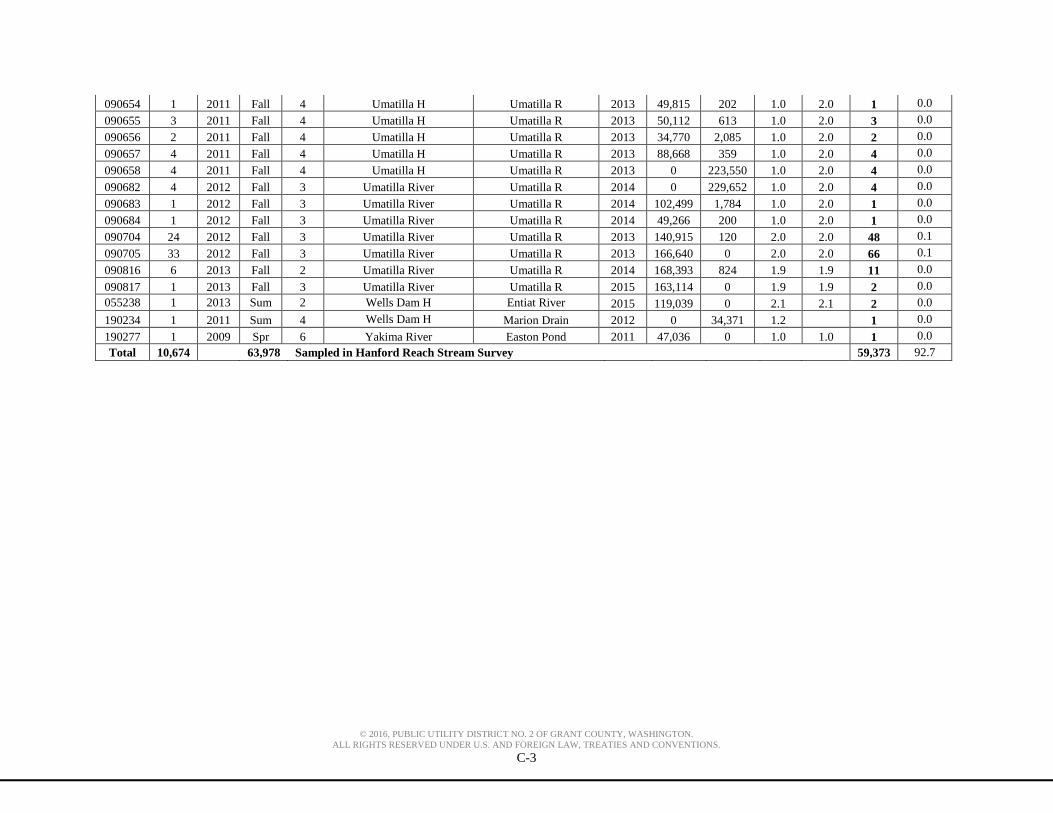
© 2016, PUBLIC UTILITY DISTRICT NO. 2 OF GRANT COUNTY, WASHINGTON.
ALL RIGHTS RESERVED UNDER U.S. AND FOREIGN LAW, TREATIES AND CONVENTIONS.
C-3
090654 1 2011 Fall 4 Umatilla H Umatilla R 2013 49,815 202 1.0 2.0 1 0.0
090655 3 2011 Fall 4 Umatilla H Umatilla R 2013 50,112 613 1.0 2.0 3 0.0
090656 2 2011 Fall 4 Umatilla H Umatilla R 2013 34,770 2,085 1.0 2.0 2 0.0
090657 4 2011 Fall 4 Umatilla H Umatilla R 2013 88,668 359 1.0 2.0 4 0.0
090658 4 2011 Fall 4 Umatilla H Umatilla R 2013 0 223,550 1.0 2.0 4 0.0
090682 4 2012 Fall 3 Umatilla River Umatilla R 2014 0 229,652 1.0 2.0 4 0.0
090683 1 2012 Fall 3 Umatilla River Umatilla R 2014 102,499 1,784 1.0 2.0 1 0.0
090684 1 2012 Fall 3 Umatilla River Umatilla R 2014 49,266 200 1.0 2.0 1 0.0
090704 24 2012 Fall 3 Umatilla River Umatilla R 2013 140,915 120 2.0 2.0 48 0.1
090705 33 2012 Fall 3 Umatilla River Umatilla R 2013 166,640 0 2.0 2.0 66 0.1
090816 6 2013 Fall 2 Umatilla River Umatilla R 2014 168,393 824 1.9 1.9 11 0.0
090817 1 2013 Fall 3 Umatilla River Umatilla R 2015 163,114 0 1.9 1.9 2 0.0
055238 1 2013 Sum 2 Wells Dam H Entiat River 2015 119,039 0 2.1 2.1 2 0.0
190234 1 2011 Sum 4 Wells Dam H Marion Drain 2012 0 34,371 1.2 1 0.0
190277 1 2009 Spr 6 Yakima River Easton Pond 2011 47,036 0 1.0 1.0 1 0.0
Total 10,674 63,978 Sampled in Hanford Reach Stream Survey 59,373 92.7

© 2016, PUBLIC UTILITY DISTRICT NO. 2 OF GRANT COUNTY, WASHINGTON.
ALL RIGHTS RESERVED UNDER U.S. AND FOREIGN LAW, TREATIES AND CONVENTIONS.
D-1
Juvenile fish health inspections for Priest Rapids Hatchery fall Chinook salmon, Brood
Years 1999 – 2015. The description in the Condition column indicates the presence of a
certain condition within at least one of the fish examined.
Hatchery Date Species Stock Brood Year Condition
Priest Rapids 23-Feb-99 CHF Priest Rapids 1998 Healthy
Priest Rapids 22-Mar-99 CHF Priest Rapids 1998 Healthy
Priest Rapids 23-Apr-99 CHF Priest Rapids 1998 Healthy
Priest Rapids 25-May-99 CHF Priest Rapids 1998 Dropout Syndrome & Bacterial
Gill Disease Priest Rapids 08-Sep-99 CHF Priest Rapids 1998 Bacterial Kidney Disease
Priest Rapids 06-Mar-00 CHF Priest Rapids 1999 Healthy
Priest Rapids 14-Apr-00 CHF Priest Rapids 1999 Healthy
Priest Rapids 16-May-00 CHF Priest Rapids 1999 Healthy
Priest Rapids 12-Jun-00 CHF Priest Rapids 1999 Healthy
Priest Rapids 23-Feb-01 CHF Priest Rapids 2000 Healthy
Priest Rapids 05-Apr-01 CHF Priest Rapids 2000 Healthy
Priest Rapids 07-May-01 CHF Priest Rapids 2000 Healthy
Priest Rapids 06-Jun-01 CHF Priest Rapids 2000 Healthy
Priest Rapids 13-Feb-02 CHF Priest Rapids 2001 Healthy
Priest Rapids 01-Mar-02 CHF Priest Rapids 2001 Coagulated Yolk Syndrome
Priest Rapids 22-Apr-02 CHF Priest Rapids 2001 Healthy
Priest Rapids 10-Jun-02 CHF Priest Rapids 2001 Healthy
Priest Rapids 07-Mar-03 CHF Priest Rapids 2002 Healthy
Priest Rapids 15-Apr-03 CHF Priest Rapids 2002 Healthy
Priest Rapids 02-Jun-03 CHF Priest Rapids 2002 Healthy
Priest Rapids 01-Apr-04 CHF Priest Rapids 2003 Healthy
Priest Rapids 06-May-04 CHF Priest Rapids 2003 Healthy
Priest Rapids 07-Jun-04 CHF Priest Rapids 2003 Healthy
Priest Rapids 11-Mar-05 CHF Priest Rapids 2004 Healthy
Priest Rapids 14-Apr-05 CHF Priest Rapids 2004 Healthy
Priest Rapids 1-Jun-05 CHF Priest Rapids 2004 Healthy
Priest Rapids 6-Mar-06 CHF Priest Rapids 2005 Healthy
Priest Rapids 25-Apr-06 CHF Priest Rapids 2005 Healthy
Priest Rapids 13-Jun-06 CHF Priest Rapids 2005 Healthy
Priest Rapids 9-Mar-07 CHF Priest Rapids 2006 Healthy
Priest Rapids 19-Apr-07 CHF Priest Rapids 2006 Healthy
Priest Rapids 1-Jun-07 CHF Priest Rapids 2006 Healthy
Priest Rapids 12-Feb-08 CHF Priest Rapids 2007 Coagulated Yolk Syndrome
observed in some fish sampled Priest Rapids 23-Apr-08 CHF Priest Rapids 2007 Healthy
Priest Rapids 4-Jun-08 CHF Priest Rapids 2007 Healthy
Priest Rapids 12-Feb-09 CHF Priest Rapids 2008 Coagulated Yolk Syndrome
observed in some fish sampled Priest Rapids 22-Apr-09 CHF Priest Rapids 2008 Healthy
Priest Rapids 8-Jun-09 CHF Priest Rapids 2008 Healthy
Data for brood years 1995 to 1998 are available in Richards and Pearsons, 2014

© 2016, PUBLIC UTILITY DISTRICT NO. 2 OF GRANT COUNTY, WASHINGTON.
ALL RIGHTS RESERVED UNDER U.S. AND FOREIGN LAW, TREATIES AND CONVENTIONS.
E-1
Summary of aerial fall Chinook salmon redd counts in the Hanford Reach, Columbia
River, Washington. Number and percent of fall Chinook salmon redds counted in different reaches of the Columbia River, 2001-
2015. Data for years 2001-2010 was collected by staff with Pacific Northwest National Laboratory. Data for
years 2011 – 2015 was collected by staff with Environmental Assessment Services, LLC.
Location 2001 2002 2003 2004 2005 2006 2007 2008 2009 2010
Islands 11-21 297 509 554 337 708 36 302 371 176 562
Islands 8-10 480 865 1,133 867 1,067 435 338 416 722 870
Near Island 7 350 280 455 415 500 873 311 360 380 457
Island 6
(lower) 750 940 1,241 1,084 1,229 289 615 753 878 1,135
Island 4, 5,6 1,130 1,165 1,242 1,655 1,130 934 655 960 796 1,562
Near Island 3 460 249 475 325 345 1,305 152 230 285 244
Near Island 2 780 955 850 960 895 523 455 555 459 657
Near Island 1 35 235 270 330 255 253 47 148 160 324
Coyote
Rapids 16 63 354 180 304 150 10 29 34 49
China Bar 20 25 85 75 28 52 3 35 1,090 299
Vernita Bar 1,930 2,755 2,806 2,240 1,430 1,658 1,135 1,731 16 2,658
Total 6,248 8,041 9,465 8,468 7,891 6,508 4,023 5,588 4,996 8,817
Location 2001 2002 2003 2004 2005 2006 2007 2008 2009 2010
Islands 11-21 5% 6% 6% 4% 9% 1% 8% 7% 4% 6%
Islands 8-10 8% 11% 12% 10% 14% 7% 8% 7% 14% 10%
Near Island 7 6% 3% 5% 5% 6% 13% 8% 6% 8% 5%
Island 6 (lower)
12% 12% 13% 13% 16% 4% 15% 13% 18% 13%
Island 4, 5, 6 18% 14% 13% 20% 14% 14% 16% 17% 16% 18%
Near Island 3 7% 3% 5% 4% 4% 20% 4% 4% 6% 3%
Near Island 2 12% 12% 9% 11% 11% 8% 11% 10% 9% 7%
Near Island 1 1% 3% 3% 4% 3% 4% 1% 3% 3% 4%
Coyote
Rapids >1% 1% 4% 2% 4% 2% >1% 1% 1% 1%
China Bar >1% >1% 1% 1% >1% 1% >1% 1% 22% 3%
Vernita Bar 31% 34% 30% 26% 18% 25% 28% 31% >1% 30%
Location 2011 2012 2013 2014 2015 Ten-Year (2006-15) Mean
Islands 11-21 676 533 798 906 1,193
555
Islands 8-10 814 807 2,200 1,565 3,145
1,131
Near Island 7 670 700 655 1,100 800
631
Island 6 (lower)
1,181 1,375 3,340 2,530 2,315
1,441
Island 4, 5,6 1,524 1,195 2,650 2,080 2,540
1,490
Near Island 3 525 475 1,000 1,000 1,100
632
Near Island 2 653 528 1,700 2,050 1,900
948
Near Island 1 295 340 900 500 1,000
397
Coyote
Rapids 44 29 520 500 765
212
China Bar 67 68 100 60 1,730
327
Vernita Bar 2,466 2,318 3,535 3,650 4,190
2,335
Total 8,915 8,368 17,398 15,951 20,678
10,100
Location 2011 2012 2013 2014 2015
Ten-Year (2006-15) Mean
Islands 11-21 8% 6% 5% 6% 6%
5%
Islands 8-10 9% 10% 13% 10% 15%
11%
Near Island 7 8% 8% 4% 7% 4%
6%
Island 6 (lower)
13% 16% 19% 16% 11%
14%
Island 4, 5, 6 17% 14% 15% 13% 12%
15%
Near Island 3 6% 6% 6% 6% 5%
6%
Near Island 2 7% 6% 10% 13% 9%
9%
Near Island 1 3% 4% 5% 3% 5%
4%
Coyote Rapids
>1% >1% 3% 3% 4%
2%
China Bar 1% 1% 1% 0% 7%
3%
Vernita Bar
28% 28% 20% 23% 20%
23%

© 2016, PUBLIC UTILITY DISTRICT NO. 2 OF GRANT COUNTY, WASHINGTON.
ALL RIGHTS RESERVED UNDER U.S. AND FOREIGN LAW, TREATIES AND CONVENTIONS.
F-1
Historical numbers of Chinook salmon carcasses recovered during the annual Hanford
Reach fall Chinook salmon carcass survey.
Return Year Total Recoveries Total Escapement
Proportion of Escapement
Recovered
1991 2,519 52,196 0.048
1992 2,221 41,952 0.053
1993 3,340 37,347 0.089
1994 5,739 63,103 0.091
1995 3,914 55,208 0.071
1996 4,529 43,249 0.105
1997 5,053 43,493 0.116
1998 4,456 35,393 0.126
1999 4,412 29,812 0.148
2000 10,556 48,020 0.220
2001 6,072 59,848 0.101
2002 8,402 84,509 0.099
2003 13,573 100,840 0.135
2004 11,030 87,696 0.126
2005 8,491 71,967 0.118
2006 5,972 51,701 0.116
2007 3,115 22,272 0.140
2008 5,455 29,058 0.188
2009 5,318 36,720 0.145
2010 9,779 87,016 0.112
2011 8,391 75,256 0.111
2012 6,814 57,710 0.118
2013 13,071 174,651 0.075
2014 16,756 183,749 0.091
2015 17,738 266,346 0.086
Mean 7,469 73,564 0.102
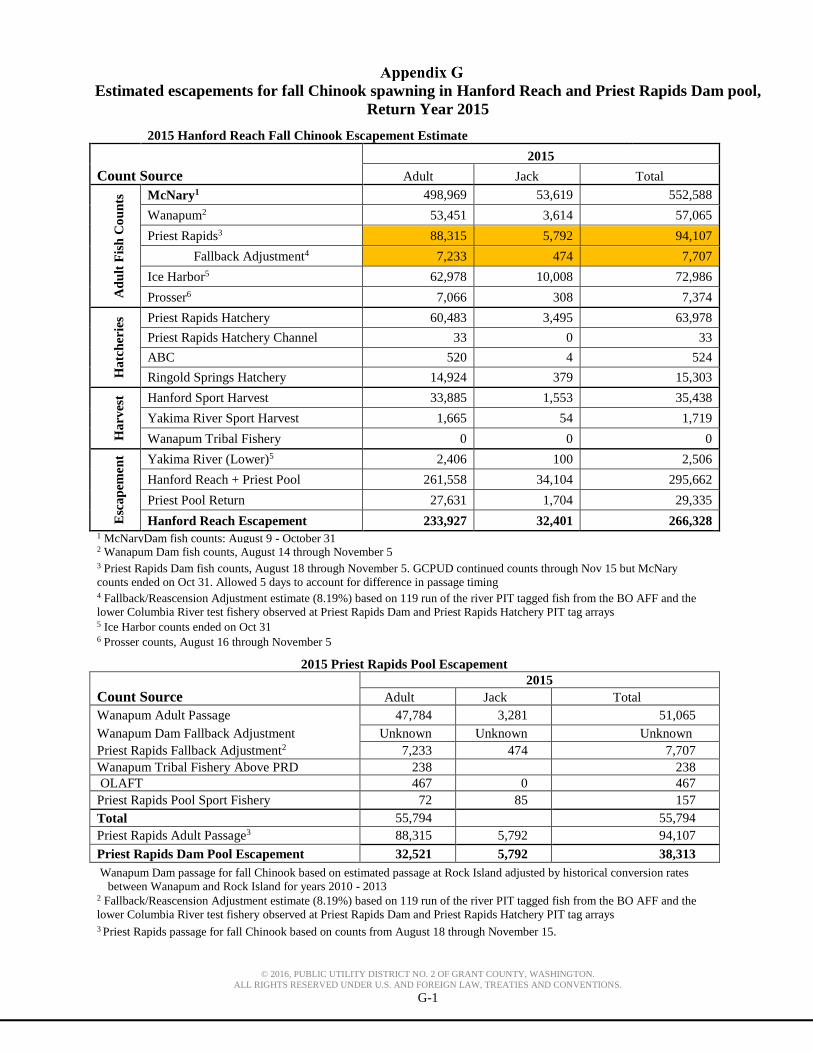
© 2016, PUBLIC UTILITY DISTRICT NO. 2 OF GRANT COUNTY, WASHINGTON.
ALL RIGHTS RESERVED UNDER U.S. AND FOREIGN LAW, TREATIES AND CONVENTIONS.
G-1
Estimated escapements for fall Chinook spawning in Hanford Reach and Priest Rapids Dam pool,
Return Year 2015
2015 Hanford Reach Fall Chinook Escapement Estimate
Count Source
2015
Adult Jack Total
Ad
ult
Fis
h C
ou
nts
McNary1 498,969 53,619 552,588
Wanapum2 53,451 3,614 57,065
Priest Rapids3 88,315 5,792 94,107
Fallback Adjustment4 7,233 474 7,707
Ice Harbor5 62,978 10,008 72,986
Prosser6 7,066 308 7,374
Ha
tch
erie
s Priest Rapids Hatchery 60,483 3,495 63,978
Priest Rapids Hatchery Channel 33 0 33
ABC 520 4 524
Ringold Springs Hatchery 14,924 379 15,303
Ha
rves
t Hanford Sport Harvest 33,885 1,553 35,438
Yakima River Sport Harvest 1,665 54 1,719
Wanapum Tribal Fishery 0 0 0
Esc
ap
emen
t Yakima River (Lower)5 2,406 100 2,506
Hanford Reach + Priest Pool 261,558 34,104 295,662
Priest Pool Return 27,631 1,704 29,335
Hanford Reach Escapement 233,927 32,401 266,328 1 McNaryDam fish counts: August 9 - October 31 2 Wanapum Dam fish counts, August 14 through November 5 3 Priest Rapids Dam fish counts, August 18 through November 5. GCPUD continued counts through Nov 15 but McNary
counts ended on Oct 31. Allowed 5 days to account for difference in passage timing 4 Fallback/Reascension Adjustment estimate (8.19%) based on 119 run of the river PIT tagged fish from the BO AFF and the
lower Columbia River test fishery observed at Priest Rapids Dam and Priest Rapids Hatchery PIT tag arrays 5 Ice Harbor counts ended on Oct 31 6 Prosser counts, August 16 through November 5
2015 Priest Rapids Pool Escapement
Count Source
2015
Adult Jack Total
Wanapum Adult Passage 47,784 3,281 51,065
Wanapum Dam Fallback Adjustment Unknown Unknown Unknown
Priest Rapids Fallback Adjustment2 7,233 474 7,707
Wanapum Tribal Fishery Above PRD 238 238
OLAFT 467 0 467
Priest Rapids Pool Sport Fishery 72 85 157
Total 55,794 55,794
Priest Rapids Adult Passage3 88,315 5,792 94,107
Priest Rapids Dam Pool Escapement 32,521 5,792 38,313
Wanapum Dam passage for fall Chinook based on estimated passage at Rock Island adjusted by historical conversion rates
between Wanapum and Rock Island for years 2010 - 2013 2 Fallback/Reascension Adjustment estimate (8.19%) based on 119 run of the river PIT tagged fish from the BO AFF and the
lower Columbia River test fishery observed at Priest Rapids Dam and Priest Rapids Hatchery PIT tag arrays 3 Priest Rapids passage for fall Chinook based on counts from August 18 through November 15.
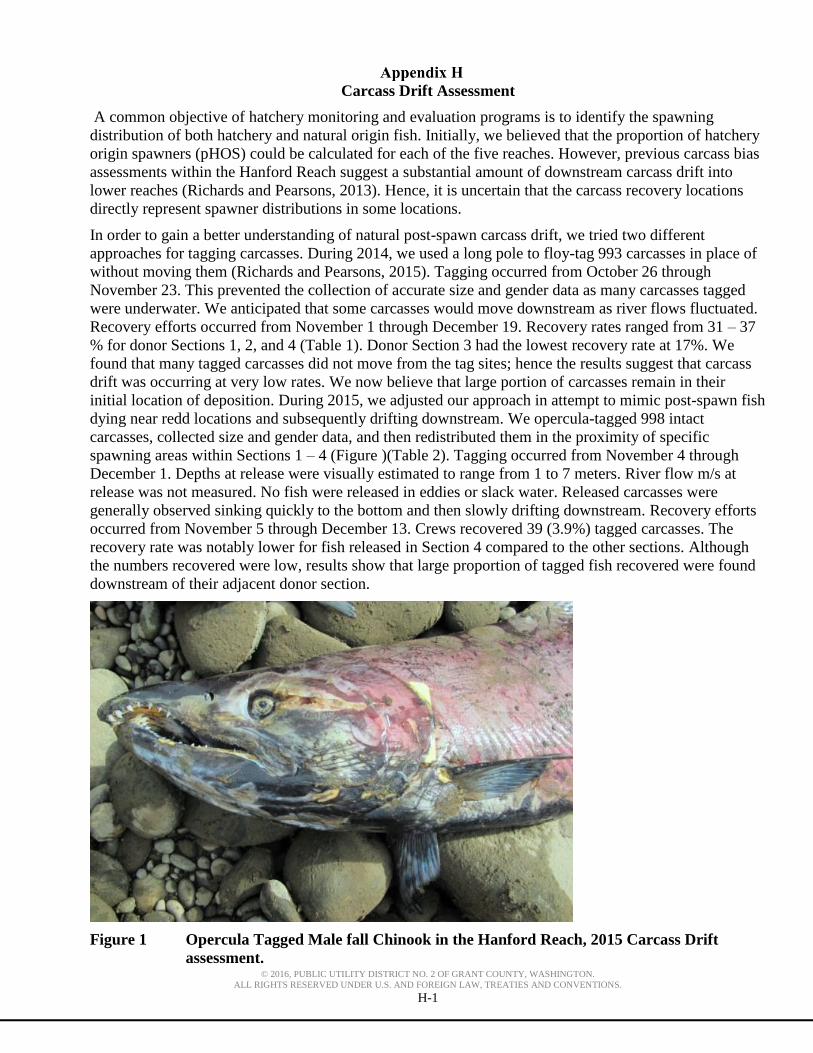
© 2016, PUBLIC UTILITY DISTRICT NO. 2 OF GRANT COUNTY, WASHINGTON.
ALL RIGHTS RESERVED UNDER U.S. AND FOREIGN LAW, TREATIES AND CONVENTIONS.
H-1
Carcass Drift Assessment
A common objective of hatchery monitoring and evaluation programs is to identify the spawning
distribution of both hatchery and natural origin fish. Initially, we believed that the proportion of hatchery
origin spawners (pHOS) could be calculated for each of the five reaches. However, previous carcass bias
assessments within the Hanford Reach suggest a substantial amount of downstream carcass drift into
lower reaches (Richards and Pearsons, 2013). Hence, it is uncertain that the carcass recovery locations
directly represent spawner distributions in some locations.
In order to gain a better understanding of natural post-spawn carcass drift, we tried two different
approaches for tagging carcasses. During 2014, we used a long pole to floy-tag 993 carcasses in place of
without moving them (Richards and Pearsons, 2015). Tagging occurred from October 26 through
November 23. This prevented the collection of accurate size and gender data as many carcasses tagged
were underwater. We anticipated that some carcasses would move downstream as river flows fluctuated.
Recovery efforts occurred from November 1 through December 19. Recovery rates ranged from 31 – 37
% for donor Sections 1, 2, and 4 (Table 1). Donor Section 3 had the lowest recovery rate at 17%. We
found that many tagged carcasses did not move from the tag sites; hence the results suggest that carcass
drift was occurring at very low rates. We now believe that large portion of carcasses remain in their
initial location of deposition. During 2015, we adjusted our approach in attempt to mimic post-spawn fish
dying near redd locations and subsequently drifting downstream. We opercula-tagged 998 intact
carcasses, collected size and gender data, and then redistributed them in the proximity of specific
spawning areas within Sections 1 – 4 (Figure )(Table 2). Tagging occurred from November 4 through
December 1. Depths at release were visually estimated to range from 1 to 7 meters. River flow m/s at
release was not measured. No fish were released in eddies or slack water. Released carcasses were
generally observed sinking quickly to the bottom and then slowly drifting downstream. Recovery efforts
occurred from November 5 through December 13. Crews recovered 39 (3.9%) tagged carcasses. The
recovery rate was notably lower for fish released in Section 4 compared to the other sections. Although
the numbers recovered were low, results show that large proportion of tagged fish recovered were found
downstream of their adjacent donor section.
Figure 1 Opercula Tagged Male fall Chinook in the Hanford Reach, 2015 Carcass Drift
assessment.

© 2016, PUBLIC UTILITY DISTRICT NO. 2 OF GRANT COUNTY, WASHINGTON.
ALL RIGHTS RESERVED UNDER U.S. AND FOREIGN LAW, TREATIES AND CONVENTIONS.
H-2
Table 1 Numbers of operculum-tagged Chinook salmon carcasses released and
recovered by donor section within the Hanford Reach, Return Year 2014
Donor
Section 1
Donor
Section 2
Donor
Section 3
Donor
Section 4 Totals
Fish Tagged by Donor Section 486 107 225 175 994
Fish Recovered by
Recipient Section
1 143 4
2 1 32 1
3 3 1 35 13
4 4 0 4 60 19
5 1 1 0 4 2
P^ Recovered for each Donor Section 0.313 0.318 0.173 0.366 0.291
Proportion
Recovered by
Section
1 0.941
2 0.007 0.941
3 0.020 0.029 0.897
4 0.026 0.000 0.103 0.938
5 0.007 0.029 0.000 0.063
Proportion
Recovered by
Section into
recipient Section
1 1.000
2 0.007 0.993
3 0.021 0.031 0.948
4 0.025 0.000 0.096 0.879
5 0.067 0.299 0.000 0.635
Table 2 Numbers of operculum-tagged Chinook salmon carcasses released and
recovered by donor section within the Hanford Reach, Return Year 2015
Donor
Section 1
Donor
Section 2
Donor
Section 3
Donor
Section 4 Totals
Fish Tagged by Donor Section 231 62 343 362 998
Fish Recovered by
Recipient Section
1 4 4
2 0 1 1
3 6 3 4 13
4 2 0 13 4 19
5 0 0 1 1 2
P^ Recovered for each Donor Section 0.052 0.065 0.052 0.014 0.039
Proportion
Recovered by
Section
1 0.333
2 0.000 0.250
3 0.500 0.750 0.222
4 0.167 0.000 0.722 0.800
5 0.000 0.000 0.056 0.200
Proportion
Recovered by
Section into
recipient Section
1 1.000
2 0.000 1.000
3 0.340 0.509 0.151
4 0.099 0.000 0.428 0.474
5 0.000 0.000 0.217 0.783

© 2016, PUBLIC UTILITY DISTRICT NO. 2 OF GRANT COUNTY, WASHINGTON.
ALL RIGHTS RESERVED UNDER U.S. AND FOREIGN LAW, TREATIES AND CONVENTIONS.
I-1
Carcass bias assessment results for return years 2011, 2012, 2013, and 2015.
Carcass surveys of Chinook Salmon are conducted each fall to characterize spawners in the Hanford
Reach. However, it is possible that carcasses collected during surveys do not represent the spawning
population. There could be carcass collection bias against smaller/younger fish or males in the stream
surveys (Zhou 2002; Murdoch et al. 2010; Richards and Pearsons, 2013). If true, this bias may
compromise estimates associated with age and gender compositions by origin as well as escapement
estimates of hatchery and natural origin fish. We began a pilot project to evaluate potential size and sex
recovery bias in 2011. This work has occurred annually with the exception of 2014 when measurements
were not taken on the mark sample so a bias estimate could not be estimated.
The methods for collecting, sampling, and releasing tagged carcass associated with this evaluation have
varied slightly between years. In general, 1,000 carcasses were collected and used for age or size
composition. These carcasses were tagged with a 3.5 x 3.5 cm numbered plastic tag either systematically
released either near shore or mid river or over known active redd locations (Figure 1).
Figure 1 An example of a tagged fall Chinook Salmon used in the carcass bias assessment. The
tag can be seen underneath the edge of the opercle.
The release strategy for years 2011-2013 included releasing tagged carcass either near shore or mid-
channel near the point of initial recovery. Carcasses released near shore had higher proportions of
recaptures compared to fish released mid channel (Table 1). It was not uncommon for carcasses released
near shore to be recovered the following day in the same vicinity of their release. In 2015, we released
tagged carcasses over active redd locations to better match the natural disposition of post spawn
carcasses. After release into the river, the carcasses generally sunk quickly and gradually moved
downstream along the bottom in a similar manner to that of post-spawn fish.
The annual recovery rates of tagged carcasses decreased annually from a high of 17.2% in 2011 to a low
of 4.1% in 2015. The annual recovery rates may be influenced by the release method and by reduced
chances of recovering tagged carcasses during large spawning escapements of fall Chinook salmon to the
Hanford Reach.
In general, the carcass recovery bias was low; suggesting that carcass samples are a good indicator of the
spawning population (Tables 1-4). However, a few exceptions are of interest. It appears that small male
fish (e.g, jacks) are recovered at lower rates than larger fish. This finding is consistent with other studies
that evaluated carcass recovery bias in smaller rivers (Zhou 2002; Murdoch et al. 2010). In addition,
females appear to be recaptured at lower proportions than the male fish. Small sample sizes may
influence the results.

© 2016, PUBLIC UTILITY DISTRICT NO. 2 OF GRANT COUNTY, WASHINGTON.
ALL RIGHTS RESERVED UNDER U.S. AND FOREIGN LAW, TREATIES AND CONVENTIONS.
I-2
Table 1 Summary of mark recapture of post-spawn fall Chinook Salmon in the Hanford
Reach, 2011.
Release Location Total
Bank Mid-River Unknown Released
Released 495 487 11 993
Recaptured 108 59 4 171
Recapture (%) 21.8 12.1 36.4 17.2
Mark Release Fall Chinook Salmon
Age 2 Age 3 Age 4 Age 5 Age 6 Total
Gender # % # % # % # % # % # %
Male 26 2.6 82 8.3 230 23.2 63 6.3 0 0.0 401 40.4
Female 0 0 24 2.4 469 47.2 97 9.8 2 0.0 592 59.6
Total 26 2.6 106 10.7 699 70.4 160 16.1 2 0.0 993 100.0
Recaptures
Age 2 Age 3 Age 4 Age 5 Age 6 Total
Gender # % # % # % # % # % # %
Male 3 1.8 15 8.8 45 26.3 10 5.8 0 0.0 73 42.7
Female 0 3 1.8 74 43.3 21 12.3 0 0.0 98 57.3
Total 3 1.8 18 10.5 119 69.6 31 18.1 0 0.0 171 100.0
Bias (%)
Gender Age 2 Age 3 Age 4 Age 5 Age 6 Total
Male -0.8 0.5 3.2 -0.5 0 2.3
Female 0 0.6 -4 2.5 0 -2.3
Total -0.8 -0.2 -0.8 2.0 0
Table 2 Summary of mark recapture of post-spawn fall Chinook Salmon in the Hanford
Reach, 2012.
Release Location Total
Bank Mid-River
Unknown Released
Released 491 498 989
Recaptured 103 34 137
Recapture (%) 21.0 6.8 13.9
Mark Release Fall Chinook Salmon
Age 2 Age 3 Age 4 Age 5 Age
6 Total
Gender # % # % # % # % # % # %
Male 43 4.3 225 22.8 155 15.7 99 10.0 0 0.0 522 52.8
Female 0 0.0 45 4.6 237 24.0 185 18.7 0 0.0 467 47.9
Total 43 4.3 270 27.3 392 49.6 284 28.7 0 0.0 989 100.0
Recaptures
Age 2 Age 3 Age 4 Age 5 Age
6 Total
Gender # % # % # % # % # % # %
Male 0 0.0 22 31.4 11 15.7 7 10.0 0 0.0 40 57.1
Female 0 0.0 2 2.9 17 24.3 11 15.7 0 0.0 30 42.9
Total 0 0.0 24 34.3 28 40.0 18 25.7 0 0.0 70 100.0
Bias (%)
Gender Age 2 Age 3 Age 4 Age 5 Age
6 Total
Male -4.3 8.7 0.0 0.0 0.0 4.3
Female 0.0 -1.7 0.0 -3.0 0.0 -5.0
Total -4.3 7.0 0.0 -3.0 0.0
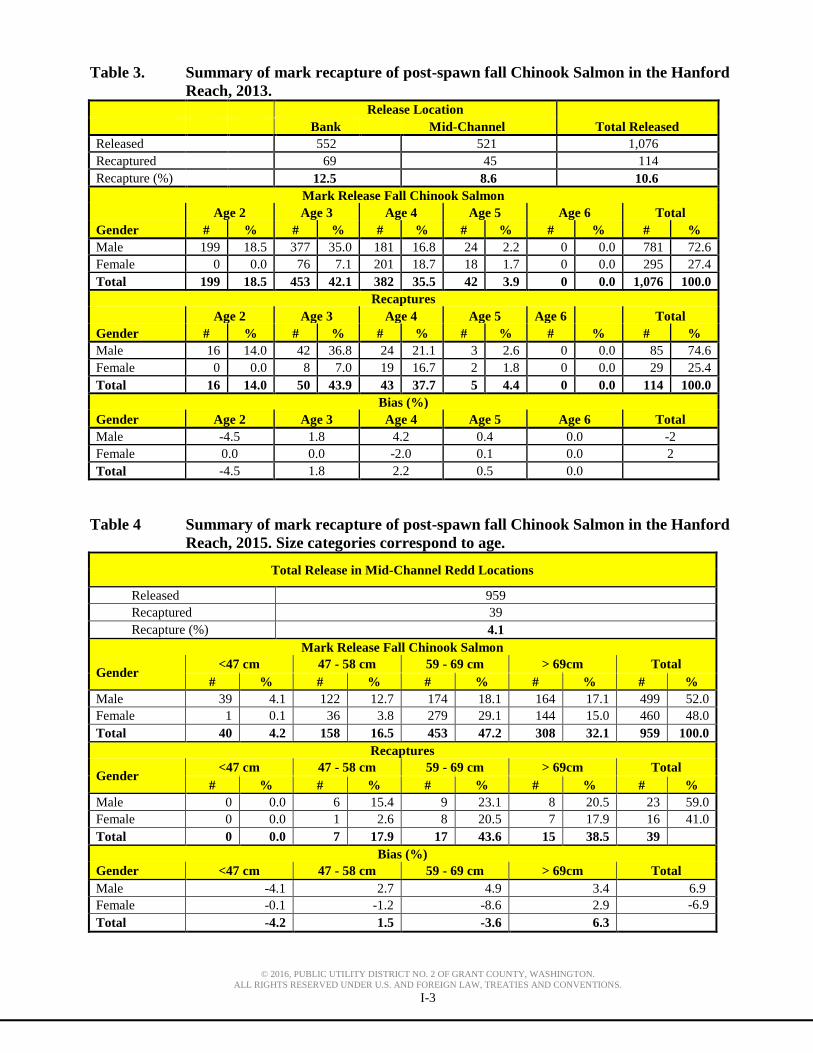
© 2016, PUBLIC UTILITY DISTRICT NO. 2 OF GRANT COUNTY, WASHINGTON.
ALL RIGHTS RESERVED UNDER U.S. AND FOREIGN LAW, TREATIES AND CONVENTIONS.
I-3
Table 3. Summary of mark recapture of post-spawn fall Chinook Salmon in the Hanford
Reach, 2013.
Release Location
Total Released Bank Mid-Channel
Released
552 521 1,076
Recaptured
69 45 114
Recapture (%)
12.5 8.6 10.6
Mark Release Fall Chinook Salmon
Age 2 Age 3 Age 4 Age 5 Age 6 Total
Gender # % # % # % # % # % # %
Male 199 18.5 377 35.0 181 16.8 24 2.2 0 0.0 781 72.6
Female 0 0.0 76 7.1 201 18.7 18 1.7 0 0.0 295 27.4
Total 199 18.5 453 42.1 382 35.5 42 3.9 0 0.0 1,076 100.0
Recaptures
Age 2 Age 3 Age 4 Age 5 Age 6 Total
Gender # % # % # % # % # % # %
Male 16 14.0 42 36.8 24 21.1 3 2.6 0 0.0 85 74.6
Female 0 0.0 8 7.0 19 16.7 2 1.8 0 0.0 29 25.4
Total 16 14.0 50 43.9 43 37.7 5 4.4 0 0.0 114 100.0
Bias (%)
Gender Age 2 Age 3 Age 4 Age 5 Age 6 Total
Male -4.5 1.8 4.2 0.4 0.0 -2
Female 0.0 0.0 -2.0 0.1 0.0 2
Total -4.5 1.8 2.2 0.5 0.0
Table 4 Summary of mark recapture of post-spawn fall Chinook Salmon in the Hanford
Reach, 2015. Size categories correspond to age.
Total Release in Mid-Channel Redd Locations
Released 959
Recaptured 39
Recapture (%) 4.1
Mark Release Fall Chinook Salmon
Gender <47 cm 47 - 58 cm 59 - 69 cm > 69cm Total
# % # % # % # % # %
Male 39 4.1 122 12.7 174 18.1 164 17.1 499 52.0
Female 1 0.1 36 3.8 279 29.1 144 15.0 460 48.0
Total 40 4.2 158 16.5 453 47.2 308 32.1 959 100.0
Recaptures
Gender <47 cm 47 - 58 cm 59 - 69 cm > 69cm Total
# % # % # % # % # %
Male 0 0.0 6 15.4 9 23.1 8 20.5 23 59.0
Female 0 0.0 1 2.6 8 20.5 7 17.9 16 41.0
Total 0 0.0 7 17.9 17 43.6 15 38.5 39
Bias (%)
Gender <47 cm 47 - 58 cm 59 - 69 cm > 69cm Total
Male -4.1 2.7 4.9 3.4 6.9
Female -0.1 -1.2 -8.6 2.9 -6.9
Total -4.2 1.5 -3.6 6.3
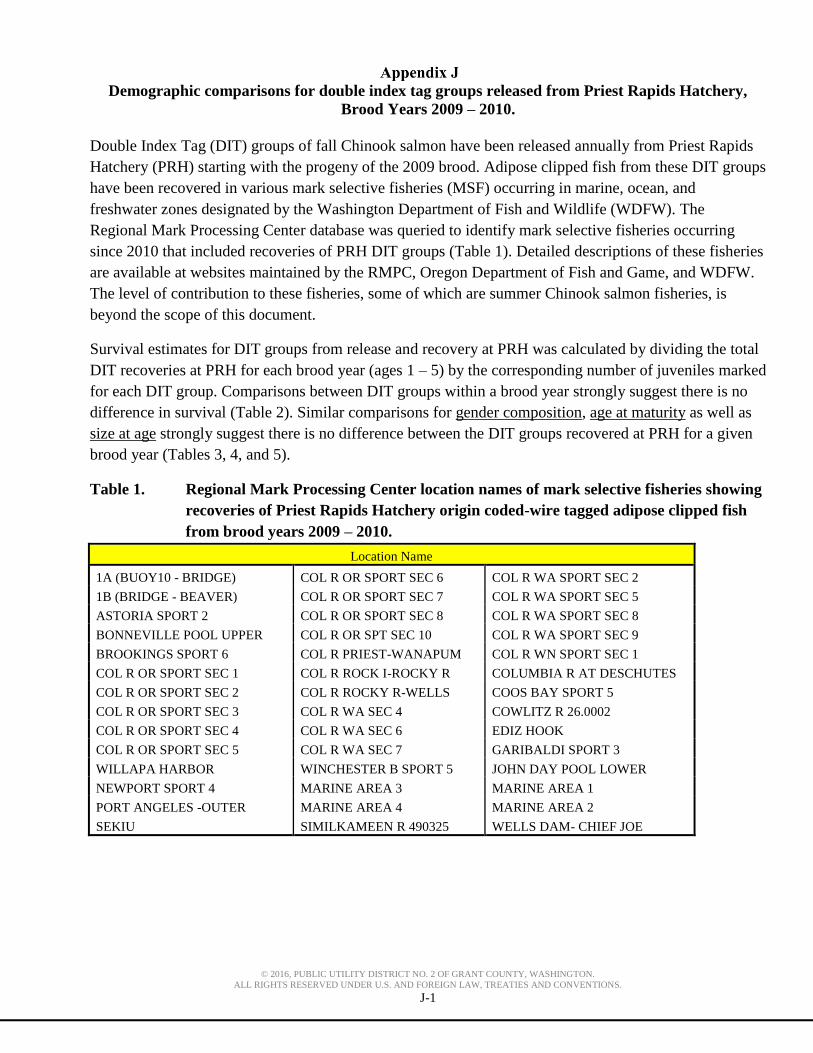
© 2016, PUBLIC UTILITY DISTRICT NO. 2 OF GRANT COUNTY, WASHINGTON.
ALL RIGHTS RESERVED UNDER U.S. AND FOREIGN LAW, TREATIES AND CONVENTIONS.
J-1
Demographic comparisons for double index tag groups released from Priest Rapids Hatchery,
Brood Years 2009 – 2010.
Double Index Tag (DIT) groups of fall Chinook salmon have been released annually from Priest Rapids
Hatchery (PRH) starting with the progeny of the 2009 brood. Adipose clipped fish from these DIT groups
have been recovered in various mark selective fisheries (MSF) occurring in marine, ocean, and
freshwater zones designated by the Washington Department of Fish and Wildlife (WDFW). The
Regional Mark Processing Center database was queried to identify mark selective fisheries occurring
since 2010 that included recoveries of PRH DIT groups (Table 1). Detailed descriptions of these fisheries
are available at websites maintained by the RMPC, Oregon Department of Fish and Game, and WDFW.
The level of contribution to these fisheries, some of which are summer Chinook salmon fisheries, is
beyond the scope of this document.
Survival estimates for DIT groups from release and recovery at PRH was calculated by dividing the total
DIT recoveries at PRH for each brood year (ages 1 – 5) by the corresponding number of juveniles marked
for each DIT group. Comparisons between DIT groups within a brood year strongly suggest there is no
difference in survival (Table 2). Similar comparisons for gender composition, age at maturity as well as
size at age strongly suggest there is no difference between the DIT groups recovered at PRH for a given
brood year (Tables 3, 4, and 5).
Table 1. Regional Mark Processing Center location names of mark selective fisheries showing
recoveries of Priest Rapids Hatchery origin coded-wire tagged adipose clipped fish
from brood years 2009 – 2010.
Location Name
1A (BUOY10 - BRIDGE) COL R OR SPORT SEC 6 COL R WA SPORT SEC 2
1B (BRIDGE - BEAVER) COL R OR SPORT SEC 7 COL R WA SPORT SEC 5
ASTORIA SPORT 2 COL R OR SPORT SEC 8 COL R WA SPORT SEC 8
BONNEVILLE POOL UPPER COL R OR SPT SEC 10 COL R WA SPORT SEC 9
BROOKINGS SPORT 6 COL R PRIEST-WANAPUM COL R WN SPORT SEC 1
COL R OR SPORT SEC 1 COL R ROCK I-ROCKY R COLUMBIA R AT DESCHUTES
COL R OR SPORT SEC 2 COL R ROCKY R-WELLS COOS BAY SPORT 5
COL R OR SPORT SEC 3 COL R WA SEC 4 COWLITZ R 26.0002
COL R OR SPORT SEC 4 COL R WA SEC 6 EDIZ HOOK
COL R OR SPORT SEC 5 COL R WA SEC 7 GARIBALDI SPORT 3
WILLAPA HARBOR WINCHESTER B SPORT 5 JOHN DAY POOL LOWER
NEWPORT SPORT 4 MARINE AREA 3 MARINE AREA 1
PORT ANGELES -OUTER MARINE AREA 4 MARINE AREA 2
SEKIU SIMILKAMEEN R 490325 WELLS DAM- CHIEF JOE
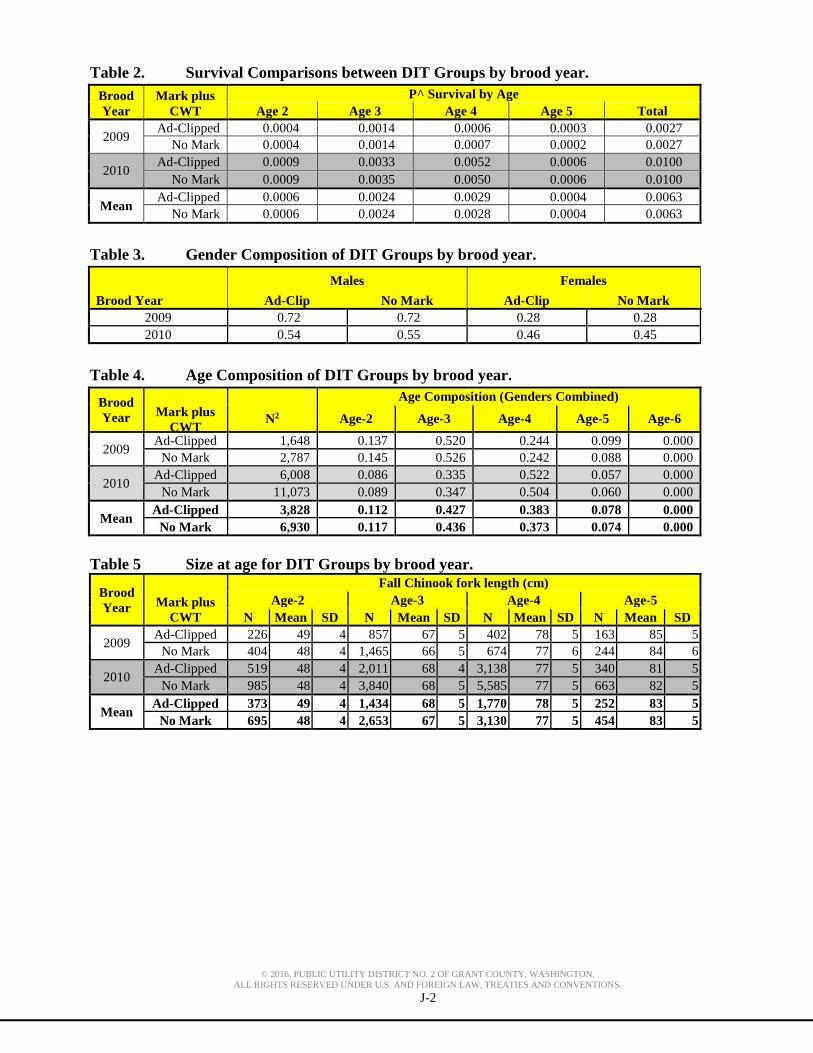
© 2016, PUBLIC UTILITY DISTRICT NO. 2 OF GRANT COUNTY, WASHINGTON.
ALL RIGHTS RESERVED UNDER U.S. AND FOREIGN LAW, TREATIES AND CONVENTIONS.
J-2
Table 2. Survival Comparisons between DIT Groups by brood year.
Brood
Year
Mark plus
CWT
P^ Survival by Age
Age 2 Age 3 Age 4 Age 5 Total
2009 Ad-Clipped 0.0004 0.0014 0.0006 0.0003 0.0027
No Mark 0.0004 0.0014 0.0007 0.0002 0.0027
2010 Ad-Clipped 0.0009 0.0033 0.0052 0.0006 0.0100
No Mark 0.0009 0.0035 0.0050 0.0006 0.0100
Mean Ad-Clipped 0.0006 0.0024 0.0029 0.0004 0.0063
No Mark 0.0006 0.0024 0.0028 0.0004 0.0063
Table 3. Gender Composition of DIT Groups by brood year.
Brood Year
Males Females
Ad-Clip No Mark Ad-Clip No Mark
2009 0.72 0.72 0.28 0.28
2010 0.54 0.55 0.46 0.45
Table 4. Age Composition of DIT Groups by brood year.
Brood
Year
Mark plus
CWT
Age Composition (Genders Combined)
N2 Age-2 Age-3 Age-4 Age-5 Age-6
2009 Ad-Clipped 1,648 0.137 0.520 0.244 0.099 0.000
No Mark 2,787 0.145 0.526 0.242 0.088 0.000
2010 Ad-Clipped 6,008 0.086 0.335 0.522 0.057 0.000
No Mark 11,073 0.089 0.347 0.504 0.060 0.000
Mean Ad-Clipped 3,828 0.112 0.427 0.383 0.078 0.000
No Mark 6,930 0.117 0.436 0.373 0.074 0.000
Table 5 Size at age for DIT Groups by brood year.
Brood
Year
Mark plus
CWT
Fall Chinook fork length (cm)
Age-2 Age-3 Age-4 Age-5
N Mean SD N Mean SD N Mean SD N Mean SD
2009 Ad-Clipped 226 49 4 857 67 5 402 78 5 163 85 5
No Mark 404 48 4 1,465 66 5 674 77 6 244 84 6
2010 Ad-Clipped 519 48 4 2,011 68 4 3,138 77 5 340 81 5
No Mark 985 48 4 3,840 68 5 5,585 77 5 663 82 5
Mean Ad-Clipped 373 49 4 1,434 68 5 1,770 78 5 252 83 5
No Mark 695 48 4 2,653 67 5 3,130 77 5 454 83 5

© 2016, PUBLIC UTILITY DISTRICT NO. 2 OF GRANT COUNTY, WASHINGTON.
ALL RIGHTS RESERVED UNDER U.S. AND FOREIGN LAW, TREATIES AND CONVENTIONS.
K-1
Explanation of methods for calculating adult-to-adult expansions based on coded-wire tag
recoveries at Priest Rapids Hatchery.
Expanding adult coded-wire tag recoveries of either PRH or RSH origin fish by the corresponding
brood’s juvenile coded-wire tag rates has historically resulted in an under estimate of adult returns to
locations within the Hanford Reach for each brood. Over the last fifteen years juvenile code-wire tag
rates ranged from roughly 3% to 25% for PRH and roughly 6% for RSH. The relatively low tag rates
combined with low proportions (<1%) of smolt to adult returns to the Hanford Reach may preclude the
use of juvenile coded-wire tag rates in PNI calculations. For many years, WDFW fish management staff
has used adult-to-adult coded wire tag expansions for the PRH origin returns to PRH for run-
reconstruction associated with their annual fall Chinook Salmon forecast. We used similar methods to
expand PRH and RSH origin adult coded wire tag recoveries in the vicinity of Hanford Reach to
calculate PNI. An example of the calculations for the adult-to-adult expansion for the 2010 brood during
return year 2014 is provided below. We make the assumption that the total number of PRH origin returns
to PRH can be determined by removing other hatchery fish from the return: this is done by expanding the
few other hatchery coded-wire recoveries by their corresponding juvenile coded-wire tag rates. Other
hatchery coded-wire tag groups often have tag rates exceeding 50%; therefore, we assume juvenile tag
rate expansions are representative for these groups. In addition, we make the assumption that very few
natural origin fish return to PRH.
Adult-to-Adult Expansion BY2010 = Total BY2010 CWT Recoveries at PRH
Total BY2010 PRH Origin Returns to PRH
Adult-to-Adult Expansion BY2010 = 8719 = 0.211
41,348
We then use the Adult-to-Adult Expansion BY2010 to expand all recoveries of PRH BY2010 in the Hanford
Reach stream survey for return year 2014. This method is duplicated for each brood present in the given
return year for both PRH and RSH to determine the total number of PRH and RSH origin fish in the
escapement. The estimated number of PRH origin fish in the RY2014 Hanford Reach escapement based
on the adult-to-adult expansion is higher than the number calculated using the conventional juvenile tag
rate (Table 1).
Table 1 The number of PRH origin fish in the RY 2014 Hanford Reach escapement
calculated form Adult-to-Adult Expansions versus Juvenile Tag Rates.
BY CWT Recovered
Adult-to-
Adult Exp
Expanded
CWT
Survey Sample
Rate
Total PRH origin in
Escapement
2009 5 0.216 23 0.1063 218
2010 139 0.211 659 0.1063 6,197
2011 18 0.127 142 0.1063 1,333
2012 5 0.160 31 0.019 1,645
Adult-to-Adult Exp estimate for PRH origin fish in the Hanford Reach Escapement 9,393
Juvenile Tag Rate estimate for PRH origin fish in the Hanford Reach Escapement 7,934

© 2016, PUBLIC UTILITY DISTRICT NO. 2 OF GRANT COUNTY, WASHINGTON.
ALL RIGHTS RESERVED UNDER U.S. AND FOREIGN LAW, TREATIES AND CONVENTIONS.
L-1
Alternative pNOB and PNI Estimates
An alternative pNOB was developed to account for the genetic influence on pNOB resulting from the
PRH spawning protocol of spawning one male with one, two, or four females. It is intended to represent
actual gene flow to the progeny instead of strictly the origin and number of parents. However, it should
be noted that although PNI was intended to index gene flow, the alternative method of estimating pNOB
as described below has not been used elsewhere and is currently undergoing review. The PNI calculation
for the alternative pNOB method is PNI = Alt pNOB/(Alt pNOB + pHOS)
The alternative pNOB is calculated by assigning scores to the estimated matings of males and females
based on origin during the spawning of the PRH broodstock.
The hatchery x hatchery matings = 0.0 points,
Hatchery x natural matings = 0.5 points, and
Natural x natural matings = 1.0 points.
The scores of all of the matings were averaged to generate the overall alternative pNOB. For example,
the alternative pNOB calculation for the mating of one natural origin male x two hatchery origin females
is (0.5 + 0.5) / 2 females) = 0.5, whereas the conventional pNOB calculation for this mating equals (1
natural / (1 natural + 2 hatchery) = 0.33.
The origin assignments of fish spawned were based on a combination of otolith marks, adipose clips, and
coded-wire tags, as done for the conventional pNOB calculation previously discussed. The fish from the
OLAFT and ABC were spawned with adipose clipped broodstock fish from the PRH volunteer trap to try
to increase the hatchery x natural matings which generally resulted in 0.5 points per mating. Adipose
intact and adipose clipped broodstock from the volunteer trap were often mated together to increase the
chance of natural by hatchery matings. These matings generally resulted in 0.0 points. Likewise, known
hatchery by hatchery matings of PRH broodstock occurred to meet egg take goals which resulted in 0.0
points. It’s unlikely that natural x natural matings occurred since staff intentionally did not mate adipose
intact fish with other adipose intact fish.
Similar to that done for estimates of pNOB by program, alternative pNOB and PNI estimates are given
for the PRH facility as a whole and specific to the GCPUD production associated with each brood year.
The pHOS used for these estimates are given in Table 56.
The conventional and alternative pNOB values for GCPUD production spawned at PRH and GCPUD
associated pHOS in Table. Both methods of calculating PNI associated with the GCPUD production
provide PNI values in excess of the stated PNI target of 0.67 for most years.

© 2016, PUBLIC UTILITY DISTRICT NO. 2 OF GRANT COUNTY, WASHINGTON.
ALL RIGHTS RESERVED UNDER U.S. AND FOREIGN LAW, TREATIES AND CONVENTIONS.
L-2
Table 1 Conventional and alternative calculations of pNOB and PNI associated with the
production specific to Grant County PUD, Return Years 2012 – 2015 Conventional pNOB = pNOB/(NOB + HOB)
Return Year GCPUD Broodstock Combined GCPUD pHOS1 PNI
2012 0.182 0.068 0.729
2013 0.225 0.151 0.598
2014 0.343 0.039 0.898
2015 0.313 0.057 0.846
Alternative pNOB = Total Score / Total Matings
Return Year GCPUD Broodstock GCPUD pHOS1 PNI
2012 0.197 0.068 0.744
2013 0.284 0.151 0.653
2014 0.423 0.039 0.916
2015 0.434 0.057 0.884 1The proportion of the pHOS specific to the GCPUD mitigation smolt releases from PRH