prince rupert marine risk...
TRANSCRIPT
The safety and security of vessels and cargo using the Port of Prince Rupert is a first-level priority for the Prince Rupert Port Authority (PRPA).
For planning purposes, PRPA proactively commissioned Det Norske Veritas (DNV), an independent, globally-recognized foundation with the purpose of safeguarding life, property, and the environment, to undertake a navigational risk assessment of the safety of its vessel
routes in the context of an expected increase in vessel traffic, and the potential incorporation of new vessel types and new cargoes using these routes.
The assessment is intended to provide a measure of safety for the Port of Prince Rupert in contrast to other ports and gateways worldwide using recognized risk assessment methodology. The assess-ment also provides a valuable benchmark of navigational risk to inform future programs to improve and enhance safety procedures and protocols at the Port of Prince Rupert.
DNV’s assessment provides PRPA with a baseline marine risk profile and makes recommendations for further reducing and mitigating identified risks.
DNV was asked to use an assumption that traffic at the Port of Prince Rupert would reach 1000 vessels by 2020, and that 100 LNG carriers and 100 tankers could be introduced into the traffic mix to reflect a diverse port operation.
The assessment’s findings are summarized below.
OVERALL FINDINGS � DNV found that based on current
traffic levels and vessel mix, and after adjusting for local factors, a commercial vessel incident could be expected at a frequency of once every 23 years.
� DNV found that based on the 2020 traffic level assumptions reflective of a sample composition of commercial ship traffic inclusive of LNG carriers and tankers, a vessel incident could be expected at a frequency of once
every 10 years, after adjusting for local factors.
� DNV indicated that grounding is the most likely incident type; however, it also indicated that it is the incident type that can be most effectively mitigated by the use of escort tugs and pilots.
� DNV suggested that additional mitigation measures be considered to further minimize the frequency
and consequence of an incident, including tug escorts, enhancement of navigational aids, and exclusion and/or security zones.
� DNV found that the use a close escort tug from Triple Island pilot station to terminal berth would further reduce the incident of groundings an estimated 80%.
Prince Rupert Marine Risk AssessmentOverview and Highlights
VESSEL-SPECIFIC FINDINGS � DNV found that based on the 2020
traffic level assumptions that includes LNG carriers and tankers, after adjusting for local factors, incidents (which may or may not have tangible consequences to vessel or cargo) for specific ship types could be expected at the following frequencies:
Bulk carrier Once every 28 years
Container ship Once every 26 years
Cruise ship Once every 64 years
LNG carrier Once every 183 years
Tanker Once every 173 years
� DNV found that the use an escort tug from Triple Island pilot station to port terminal would significantly reduce the frequency of incidents (which may or may not have tangible consequences to vessel or cargo):
LNG carrier Reduced to once every 356 years
Tanker Reduced to once every 337 years
� DNV confirmed the low frequency of major LNG accidents. DNV found that after adjusting for local factors,
a fatality resulting from an incident involving an LNG carrier or tanker could be expected once every 876 years.
� DNV quantitatively measured risk for oil tanker incidents. DNV found that after adjusting for local factors, a tanker incident, that also involved an oil or bunker spill, could be expected once every 781 years.
PRPA ACTIONS RESULTING FROM DNV ANALYSIS � Based on DNV’s analysis and
recommendations, PRPA is taking action to further improve its safety and risk profile for existing vessels and existing cargo, their expected growth over the next decade, and the
introduction of potential new cargoes (including LNG carriers and tankers).
� PRPA has embarked on a comprehensive revision of its Practices and Procedures for vessels operating in the Port of Prince Rupert to identify
potential scope for improvement. PRPA will be seeking to establish a standard of international best practices for all vessels.
STUDY BACKGROUND AND ASSUMPTIONS � DNV’s procedure uses worldwide
incident frequencies for different vessel types, and then adjusts those frequencies based on an assessment of the local coast environment and traffic volumes. An “incident” is defined as an unintended event, such as a grounding or collision, which may or may not have tangible consequences to the vessel or cargo.
� Specific adjustment factors were developed for specific portions of the route to and from a PRPA terminal. Relevant data includes route information, route length, navigation hazards, water depth, channel width, tidal streams, navigation systems, weather data, forecast vessel traffic, proposed ship specifications and terminal features.
� Generally, these local adjustment factors were deemed by DNV to decrease risk when comparing Prince Rupert to global averages.
The full Det Norske Veritas analysis is available online at www.rupertport.com/safety.
PRINCE RUPERT PORT AUTHORITY200 – 215 COW BAY ROAD
PRINCE RUPERT, BRITISH COLUMBIATELEPHONE: 250 627-8899 · EMAIL: [email protected]
DET NORSKE VERITAS
Prince Rupert Marine Risk Assessment
Navigational Risk Assessment Report
Prince Rupert Port Authority
Report No./DNV Reg No.: / 13JIMVK-8
Rev 3, 2012-02-29
DET NORSKE VERITAS
Report for Prince Rupert Port Authority
MANAGING RISK Prince Rupert Marine Risk Assessment Table of Contents
EXECUTIVE SUMMARY ...................................................................................................... 1
1 INTRODUCTION ............................................................................................................. 3
1.1 Purpose ....................................................................................................................... 3
1.2 Out of scope ............................................................................................................... 3
1.3 Definitions .................................................................................................................. 3
2 PROPOSED TRADE AND SHIP TYPES ....................................................................... 5
2.1 Ship design ................................................................................................................. 6
3 METHODOLOGY ............................................................................................................ 7 3.1.1 Per voyage ........................................................................................................... 7 3.1.2 Application of methodology ................................................................................ 8
4 SYSTEM DEFINITION .................................................................................................. 10
4.1 The study Area ......................................................................................................... 11
4.2 Current traffic patterns ............................................................................................. 11 4.2.1 Deep sea route to Ridley Island, Prince Rupert – CHS Chart no. 3002 ............ 11 4.2.2 Short sea shipping routes and coastal routes - CHS Chart no. 3002 ................. 12 4.2.3 Vessel types ....................................................................................................... 13
4.3 Navigational description – Operational and waterway management conditions ..... 14 4.3.1 Segment 1A and 1B- Open Water, Dixon Entrance towards the area west
of Triple Island Pilot boarding station ............................................................... 15 4.3.2 Segment 1B - Island Groups & Shoals near Triple Island Pilot boarding
station ................................................................................................................. 17 4.3.3 Segment 2A and 3A (Alternative 1) – Water sheltered by Islands – from
the Triple Island boarding station north of Rachel, south of Kinahan Islands ................................................................................................................ 18
4.3.4 Segment 2B and 3B (Alternative 2) – Water sheltered by Islands – from the Triple Island boarding station south of Rachel, south of Kinahan Islands ................................................................................................................ 20
4.3.5 Segment 4 - Approach to terminal –Kinahan Islands to Ridley Island ........... 21
4.4 Prince Rupert anchorages: ........................................................................................ 22
4.5 Marine Communications and Traffic Services (MCTS) .......................................... 22
4.6 Navigational Aids ..................................................................................................... 23
5 FORECAST TRAFFIC PATTERNS ............................................................................ 25
5.1 2015 vessel type & movements ................................................................................ 25
DNV Reg. No.: 13JIMVK-8 Revision No. 3 Date : 2013-03-24 Page ii of v
DET NORSKE VERITAS
Report for Prince Rupert Port Authority
MANAGING RISK Prince Rupert Marine Risk Assessment
5.2 Proposed ship specifications to existing / proposed terminal locations ................... 26
5.3 Other adaptations and risk mitigation ...................................................................... 26 5.3.1 Regulatory.......................................................................................................... 26
6 INCIDENT ANALYSIS .................................................................................................. 28
6.1 Review of incidents in study area ............................................................................ 28
7 HAZARD IDENTIFICATION ....................................................................................... 31
7.1 HAZID workshop ..................................................................................................... 31 7.1.1 HAZID participants ........................................................................................... 31
7.2 Risk Scenarios .......................................................................................................... 32
8 FREQUENCY ASSESSMENT ....................................................................................... 34
8.1 Assumptions on sailing time and sailing distances relevant to incidents ................. 34
8.2 K Factors .................................................................................................................. 34 8.2.1 Grounding .......................................................................................................... 36 8.2.2 Collision ............................................................................................................. 39 8.2.3 Foundering ......................................................................................................... 40 8.2.4 Fire and / or Explosion ...................................................................................... 42
9 CONSEQUENCE ASSESSMENT ................................................................................. 43
9.1 Tanker spill consequence assessment ...................................................................... 43 9.1.1 Consequence assessment during transit to and from the proposed Ridley
Island terminal and open water .......................................................................... 43 9.1.2 Grounding .......................................................................................................... 43 9.1.3 Collision ............................................................................................................. 44 9.1.4 Foundering ......................................................................................................... 45 9.1.5 Fire and/or explosion ......................................................................................... 45
9.2 Tanker fatality consequence assessment .................................................................. 46
9.3 LNG release consequence assessment ..................................................................... 46 9.3.1 LNG Carrier Characteristics .............................................................................. 47 9.3.2 Accident release scenarios ................................................................................. 47 9.3.3 LNG cargo consequence conclusions ................................................................ 52 9.3.4 LNG bunker consequence assessment ............................................................... 53
9.4 LNG fatality consequence assessment ..................................................................... 54
10 RISK EVALUATION ..................................................................................................... 55
10.1 Description and application of risk acceptance matrix ............................................ 56
10.2 Overall base incident return periods ......................................................................... 57
10.3 Oil Spill base return periods ..................................................................................... 58
DNV Reg. No.: 13JIMVK-8 Revision No. 3 Date : 2013-03-24 Page iii of v

DET NORSKE VERITAS
Report for Prince Rupert Port Authority
MANAGING RISK Prince Rupert Marine Risk Assessment
10.4 Overall adjusted incident return periods .................................................................. 59
10.5 Overall adjusted oil spill return periods ................................................................... 60
10.6 Risk of Fatality ......................................................................................................... 61
10.7 Overall Risk Discussion ........................................................................................... 62
10.8 Risk Scenario evaluation .......................................................................................... 63
11 RISK MITIGATION MEASURES ................................................................................ 66
11.1 Current Defenses ...................................................................................................... 66
11.2 Suggested additional defenses .................................................................................. 66 11.2.1 Tug escort .......................................................................................................... 67 11.2.2 Enhancement of navigational aids ..................................................................... 67 11.2.3 Traffic separation scheme .................................................................................. 67 11.2.4 Exclusion and security zones ............................................................................. 68 11.2.5 Other potential mitigation measures .................................................................. 68
11.3 Conclusion risk mitigation measure ......................................................................... 69
12 COMMUNICATION PLAN ........................................................................................... 70
13 COMPARISON WITH OTHER GATEWAYS ........................................................... 72
13.1 Rabaska project ........................................................................................................ 72
13.2 North America west coast ........................................................................................ 73
13.3 The worldwide shipping scene ................................................................................. 74
13.4 Conclusion ................................................................................................................ 74
14 REFERENCES ................................................................................................................ 75
APPENDIX 1 - GLOBAL AND LOCAL INCIDENT DATA ............................................ 77
Global Trend in Maritime Shipping Safety ....................................................................... 77 Review of global LNG and Oil tanker incidents ........................................................... 77 Overall global LNG and Oil tanker incidents ................................................................ 77
Review of incidents in Canadian waters ............................................................................ 80 Overall numbers of shipping incidents .......................................................................... 80 Fatalities and injuries ..................................................................................................... 81 Shipping incidents by incident type ............................................................................... 82 Shipping incidents by vessel type .................................................................................. 83
Review of incidents in the study area ................................................................................ 84 Shipping incidents by geographical region .................................................................... 84 Oil spills in western region ............................................................................................ 87
APPENDIX 2 - RISK SCENARIOS ..................................................................................... 89
DNV Reg. No.: 13JIMVK-8 Revision No. 3 Date : 2013-03-24 Page iv of v

DET NORSKE VERITAS
Report for Prince Rupert Port Authority
MANAGING RISK Prince Rupert Marine Risk Assessment
Scenario Number: 01 - Mechanical Failure (Steering) Resulting in a Powered Grounding of an Aframax Oil Tanker .............................................................. 90
Scenario Number: 02 - Mechanical Failure (Steering) Resulting in a Powered Grounding of a Q-Max LNG Carrier ................................................................. 92
Scenario Number: 03 - Human Error Resulting in a Collision involving an Aframax Oil Tanker ........................................................................................... 93
Scenario Number: 04 -Human Error Resulting in a Collision Involving a Q-Max LNG Carrier ....................................................................................................... 96
Scenario Number: 05 - Human Factor (Pilot Incapacitation) Resulting in a Powered Grounding of an Aframax oil tanker .................................................. 97
Scenario Number: 06 - Human Factor (Pilot Incapacitation) Resulting in a Powered Grounding of a Q-Max LNG Carrier .................................................. 99
Scenario Number: 07 - Environmental Factor (Severe Weather/ High Winds) Resulting in a Drift Grounding of an Aframax Oil Tanker ............................. 101
Scenario Number: 08 -Environmental Factor (Severe Weather/ High Winds) Resulting in a Drift Grounding of a Q-Max LNG Carrier ............................... 103
Scenarios Hazards Defined .......................................................................................... 105 Scenarios Current defenses defined ............................................................................. 106
APPENDIX 3 FREQUENCY ASSESSMENT .................................................................. 108
Vessel incident frequency data ........................................................................................ 108 Distance sailed by tankers & LNG carriers annually ................................................... 108
Distance sailed where Grounding, Collision and Foundering is a Hazard ...................... 109
APPENDIX 4 - CONSEQUENCE ASSESSMENT ........................................................... 118 Grounding .................................................................................................................... 118 Collision ....................................................................................................................... 119 Foundering ................................................................................................................... 120 Fire and/or explosion ................................................................................................... 121 LNG Carrier (LNGC) Vessel design ........................................................................... 122 LNG as Cargo Characteristics ..................................................................................... 122
DNV Reg. No.: 13JIMVK-8 Revision No. 3 Date : 2013-03-24 Page v of v
DET NORSKE VERITAS
Report for Prince Rupert Port Authority
MANAGING RISK Prince Rupert Marine Risk Assessment
EXECUTIVE SUMMARY This report describes the navigational risk assessment done for Prince Rupert Port Authority. It is a semi-quantitative assessment looking at the risks associated with a potential introduction of 100 crude oil tankers and 100 LNG carriers annually to and from a potential terminal at Ridley Island, British Colombia.
Important outcomes of this assessment are:
• The accident type evaluated to have the highest accident frequency for marine traffic transiting to and from Ridley Island is grounding.
• While grounding is the most likely accident type, it is also the accident type that can be most effectively mitigated by the use of escort tugs (for drift grounding) and pilots (for powered grounding).
• There is no evidence that risks levels at Prince Rupert are any higher than at comparable terminals in the US and Europe.
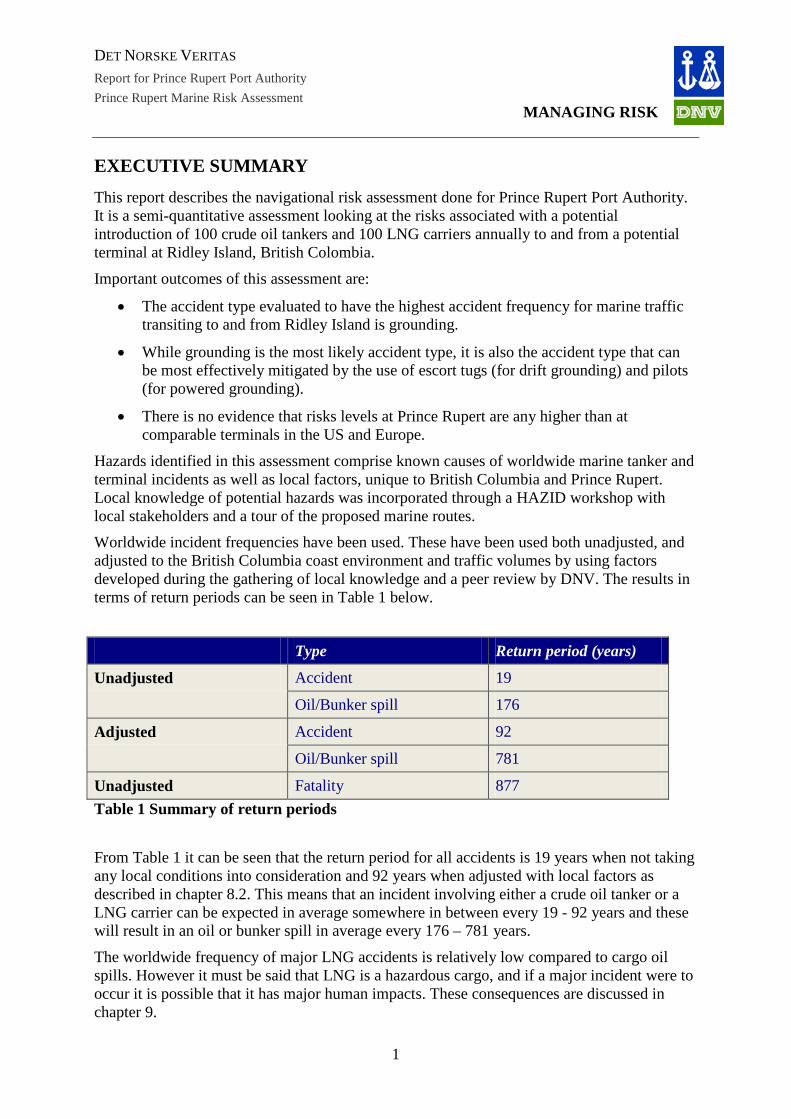
Hazards identified in this assessment comprise known causes of worldwide marine tanker and terminal incidents as well as local factors, unique to British Columbia and Prince Rupert. Local knowledge of potential hazards was incorporated through a HAZID workshop with local stakeholders and a tour of the proposed marine routes. Worldwide incident frequencies have been used. These have been used both unadjusted, and adjusted to the British Columbia coast environment and traffic volumes by using factors developed during the gathering of local knowledge and a peer review by DNV. The results in terms of return periods can be seen in Table 1 below.
Type Return period (years)
Unadjusted Accident 19
Oil/Bunker spill 176
Adjusted Accident 92
Oil/Bunker spill 781
Unadjusted Fatality 877 Table 1 Summary of return periods
From Table 1 it can be seen that the return period for all accidents is 19 years when not taking any local conditions into consideration and 92 years when adjusted with local factors as described in chapter 8.2. This means that an incident involving either a crude oil tanker or a LNG carrier can be expected in average somewhere in between every 19 - 92 years and these will result in an oil or bunker spill in average every 176 – 781 years.
The worldwide frequency of major LNG accidents is relatively low compared to cargo oil spills. However it must be said that LNG is a hazardous cargo, and if a major incident were to occur it is possible that it has major human impacts. These consequences are discussed in chapter 9.
1
DET NORSKE VERITAS
Report for Prince Rupert Port Authority
MANAGING RISK Prince Rupert Marine Risk Assessment
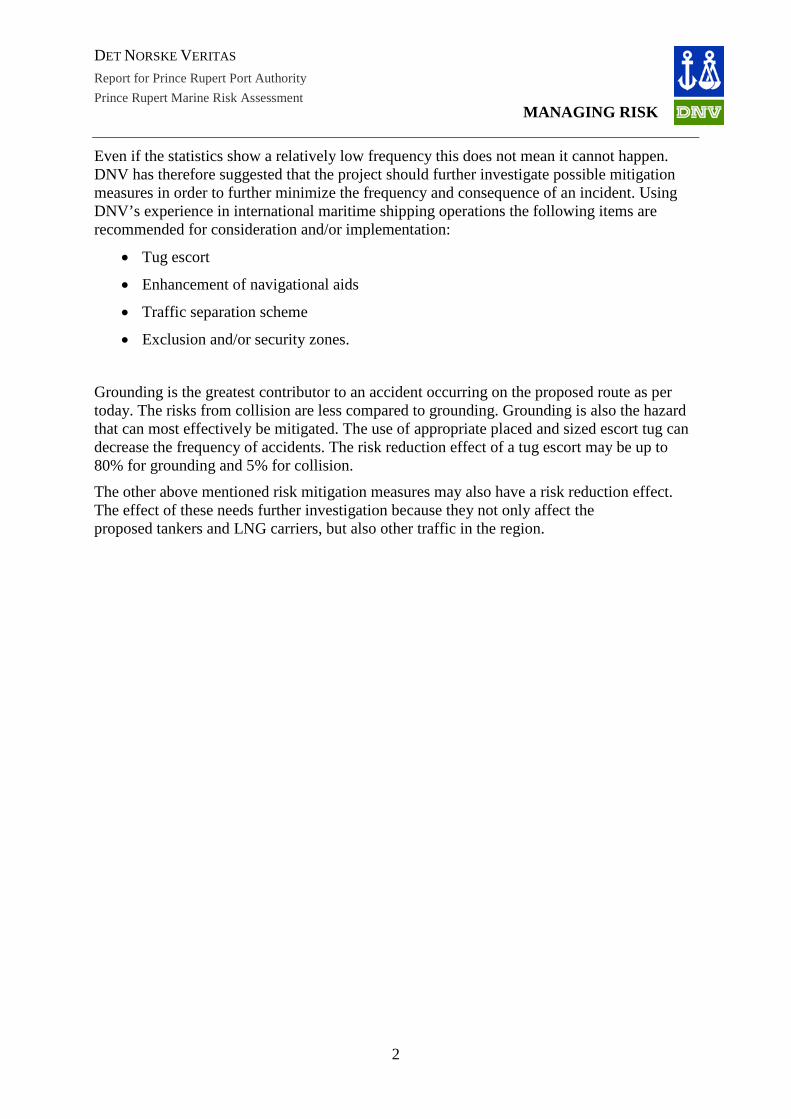
Even if the statistics show a relatively low frequency this does not mean it cannot happen. DNV has therefore suggested that the project should further investigate possible mitigation measures in order to further minimize the frequency and consequence of an incident. Using DNV’s experience in international maritime shipping operations the following items are recommended for consideration and/or implementation:
• Tug escort
• Enhancement of navigational aids
• Traffic separation scheme
• Exclusion and/or security zones.
Grounding is the greatest contributor to an accident occurring on the proposed route as per today. The risks from collision are less compared to grounding. Grounding is also the hazard that can most effectively be mitigated. The use of appropriate placed and sized escort tug can decrease the frequency of accidents. The risk reduction effect of a tug escort may be up to 80% for grounding and 5% for collision.
The other above mentioned risk mitigation measures may also have a risk reduction effect. The effect of these needs further investigation because they not only affect the proposed tankers and LNG carriers, but also other traffic in the region.
2
DET NORSKE VERITAS
Report for Prince Rupert Port Authority
MANAGING RISK Prince Rupert Marine Risk Assessment
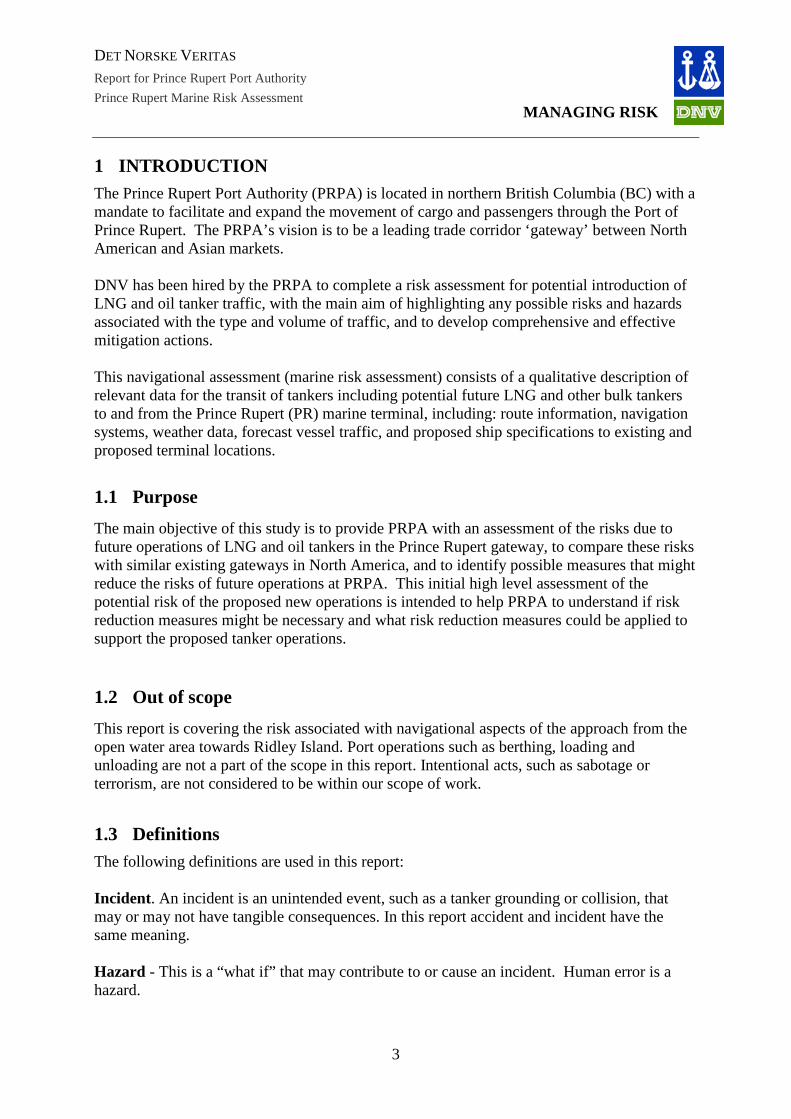
1 INTRODUCTION The Prince Rupert Port Authority (PRPA) is located in northern British Columbia (BC) with a mandate to facilitate and expand the movement of cargo and passengers through the Port of Prince Rupert. The PRPA’s vision is to be a leading trade corridor ‘gateway’ between North American and Asian markets. DNV has been hired by the PRPA to complete a risk assessment for potential introduction of LNG and oil tanker traffic, with the main aim of highlighting any possible risks and hazards associated with the type and volume of traffic, and to develop comprehensive and effective mitigation actions. This navigational assessment (marine risk assessment) consists of a qualitative description of relevant data for the transit of tankers including potential future LNG and other bulk tankers to and from the Prince Rupert (PR) marine terminal, including: route information, navigation systems, weather data, forecast vessel traffic, and proposed ship specifications to existing and proposed terminal locations.
1.1 Purpose The main objective of this study is to provide PRPA with an assessment of the risks due to future operations of LNG and oil tankers in the Prince Rupert gateway, to compare these risks with similar existing gateways in North America, and to identify possible measures that might reduce the risks of future operations at PRPA. This initial high level assessment of the potential risk of the proposed new operations is intended to help PRPA to understand if risk reduction measures might be necessary and what risk reduction measures could be applied to support the proposed tanker operations.
1.2 Out of scope This report is covering the risk associated with navigational aspects of the approach from the open water area towards Ridley Island. Port operations such as berthing, loading and unloading are not a part of the scope in this report. Intentional acts, such as sabotage or terrorism, are not considered to be within our scope of work.
1.3 Definitions The following definitions are used in this report: Incident. An incident is an unintended event, such as a tanker grounding or collision, that may or may not have tangible consequences. In this report accident and incident have the same meaning. Hazard - This is a “what if” that may contribute to or cause an incident. Human error is a hazard.
3

DET NORSKE VERITAS
Report for Prince Rupert Port Authority
MANAGING RISK Prince Rupert Marine Risk Assessment
Incident (or accident) frequency - This is a measure of how often an event (such as an incident) either has happened (historical incident rates) or is predicted to happen (as estimated by a risk assessment). Incident frequencies are also expressed in terms of return periods (return period = 1/(incident frequency)) normally expressed in years. Accident consequence - This is either a statistical summary of the severity of historical accidents or an estimate of how severe the consequences of an accident might be. A qualitative risk assessment, such as the work reported here, can only assess the most likely or perhaps a reasonable worst case accident consequence. In reality any accident can have a wide range of consequences from none to extremely severe, but only fully quantitative methods can correctly address this full range effectively. Accident consequence will normally have a unit, so typically will be evaluated in financial terms for asset damage, numbers of fatalities/ injuries for human safety, and perhaps amount of oil released into the water for cargo oil spills. Risk - Risk is the combination of accident frequency and accident consequence.
4
DET NORSKE VERITAS
Report for Prince Rupert Port Authority
MANAGING RISK Prince Rupert Marine Risk Assessment
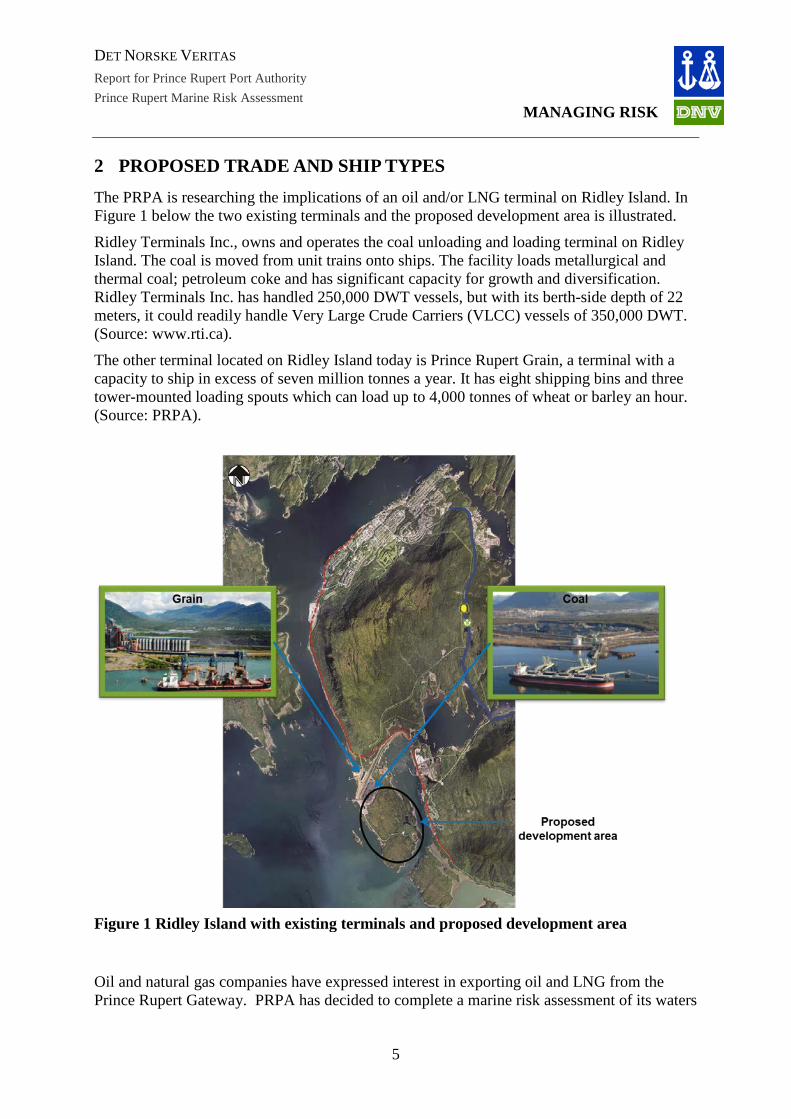
2 PROPOSED TRADE AND SHIP TYPES The PRPA is researching the implications of an oil and/or LNG terminal on Ridley Island. In Figure 1 below the two existing terminals and the proposed development area is illustrated.
Ridley Terminals Inc., owns and operates the coal unloading and loading terminal on Ridley Island. The coal is moved from unit trains onto ships. The facility loads metallurgical and thermal coal; petroleum coke and has significant capacity for growth and diversification. Ridley Terminals Inc. has handled 250,000 DWT vessels, but with its berth-side depth of 22 meters, it could readily handle Very Large Crude Carriers (VLCC) vessels of 350,000 DWT. (Source: www.rti.ca).
The other terminal located on Ridley Island today is Prince Rupert Grain, a terminal with a capacity to ship in excess of seven million tonnes a year. It has eight shipping bins and three tower-mounted loading spouts which can load up to 4,000 tonnes of wheat or barley an hour. (Source: PRPA).
Oil and natural gas companies have expressed interest in exporting oil and LNG from the Prince Rupert Gateway. PRPA has decided to complete a marine risk assessment of its waters
Figure 1 Ridley Island with existing terminals and proposed development area
5
DET NORSKE VERITAS
Report for Prince Rupert Port Authority
MANAGING RISK Prince Rupert Marine Risk Assessment
and approaches to get a qualitative overview of the potential risk associated with the introduction of oil and LNG carrier operations on the gateway to and from Ridley Island, see Figure 1 above for the proposed location.
2.1 Ship design A proposed LNG and/or tanker terminal would likely be located off the south western end of Ridley Island. The terminal would likely be situated such that a minimal amount of dredging will be required to accommodate the berth of the laden tankersThe designs of tankers that are proposed for Prince Rupert are described in general in this chapter. Only double hull tankers will be accepted at the terminal as per international guidelines to which Canada is a party.
The approach to Prince Rupert harbour is a natural deep harbour and there are currently no size restrictions to vessels entering the harbour. It is not envisioned that any adjustments to ship specifications will be needed for existing or proposed terminal locations.
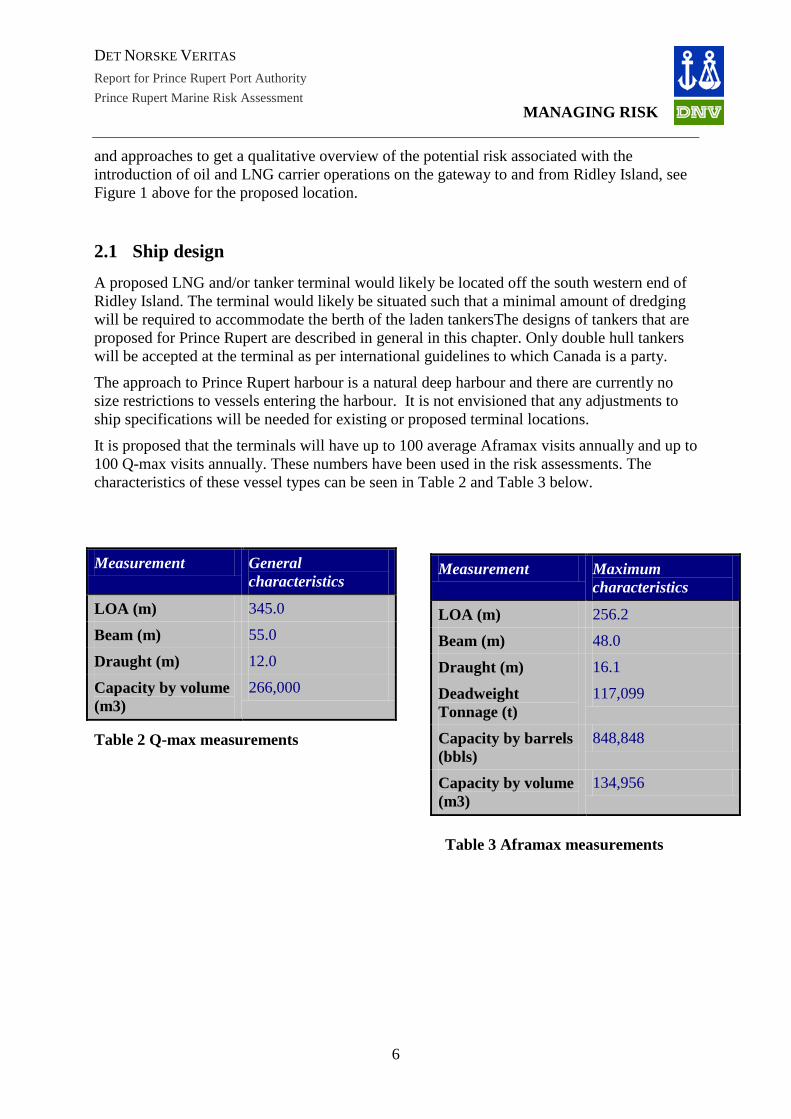
It is proposed that the terminals will have up to 100 average Aframax visits annually and up to 100 Q-max visits annually. These numbers have been used in the risk assessments. The characteristics of these vessel types can be seen in Table 2 and Table 3 below.
Measurement General characteristics
LOA (m) 345.0
Beam (m) 55.0
Draught (m) 12.0
Capacity by volume (m3)
266,000
Measurement Maximum characteristics
LOA (m) 256.2
Beam (m) 48.0
Draught (m) 16.1
Deadweight Tonnage (t)
117,099
Capacity by barrels (bbls)
848,848
Capacity by volume (m3)
134,956
Table 2 Q-max measurements
Table 3 Aframax measurements
6
DET NORSKE VERITAS
Report for Prince Rupert Port Authority
MANAGING RISK Prince Rupert Marine Risk Assessment
3 METHODOLOGY Several different methodologies exist for completing a navigational risk assessment, for example “per voyage method” or “per volume method”. Since this assessment is evaluating different types of cargo it was decided to use the per voyage method, described further in chapter 3.1.1. The work has to a large extent been based on a qualitative analysis and review of previous studies done by DNV and other reports provided by PRPA. The marine navigational risk assessment has been conducted in three major steps:
• Determination of the current traffic patterns and makeup in the study region
• Identification of operational and waterway management conditions (traffic separation schemes, established channels, vessel traffic services, pilotage, navigational restrictions, etc) and environmental conditions (visibility, winds, currents, tides, etc.)
• Projection of potential future traffic patterns, makeup and routes.
DNV undertook a hazard identification (HAZID) workshop with a number of stakeholders, further described in chapter 7.1. The information collected during the HAZID has served as the basis for the above steps with additional information researched by DNV and, in addition, expert judgment. In the case of LNG and oil tanker assessment, DNV has used available LNG and oil tanker consequence studies to determine the potential consequences in the case of an incident involving the assessed vessel types.
3.1.1 Per voyage
The “per voyage” methodology was used in this navigational risk assessment. It is considered to be the most appropriate method for completing a navigational risk assessment for PRPA. It can assess the range of tanker and LNG sizes, the relatively long distances travelled in open water and in coastal waters and the risk mitigation measures planned.
The per voyage methodology calculates risk for each segment, taking into consideration:
The route or navigation track(s) length;
Local factors, such as wind and bathymetry;
Size of the vessels, and;
Number of voyages for each vessel category.
The per voyage methodology has previously been used in several TERMPOL Review Processes, for example the proposed LNG terminal at Rabaska in Eastern Canada (Source: Rabaska 2004) and the proposed oil terminal at Kitimat in British Columbia (Source: Enbridge Northern Gateway 2010). There is always a potential conflict, or tension, between “risk per unit operation” and “risk per time”. E.g. when considering risk to the environment, where natural processes “clean” the
7
DET NORSKE VERITAS
Report for Prince Rupert Port Authority
MANAGING RISK Prince Rupert Marine Risk Assessment
system, we have to consider risk per unit time because the acceptance of risk is linked to system recovery processes based on time. In well-regulated systems risk criteria are sometimes set for both unit operations and per time.
3.1.2 Application of methodology
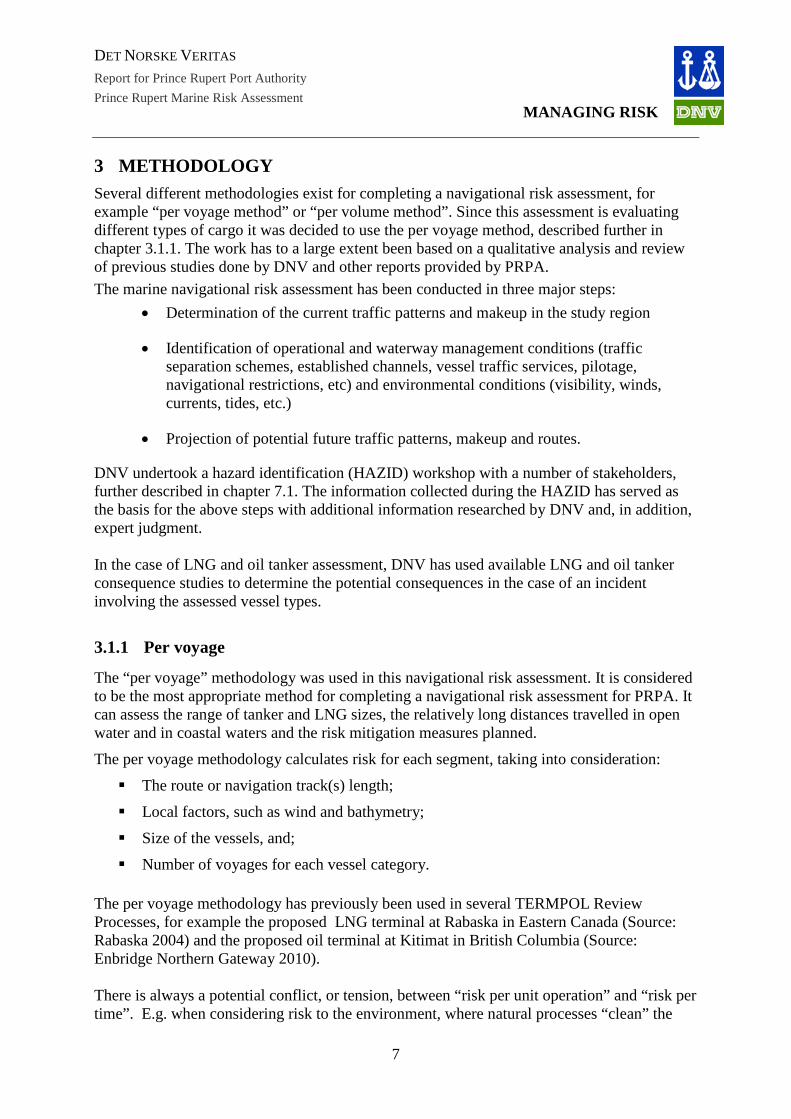
The Pilotage Risk Management Methodology (PRMM) (Source: Transport Canada) was used to complement the per voyage methodology. In the context of this risk assessment the steps of the PRMM shown in Figure 2 have been performed:
DNV’s application of each step in the PRMM process is described in brief below and in detail in subsequent chapters of this report.
1. Risk scenarios (chapter 7.2) The risk scenario definition consists of describing relevant data for the transit of vessels to and from the Prince Rupert terminal, including: route information, navigation systems, weather data, forecast vessel traffic, proposed ship specifications and terminal features. It also includes hazard identification and qualitatively examines relevant causes of incidents. The influence of local conditions, as defined in the risk scenarios, is also assessed. This information is then used in the quantitative assessment of frequency and qualitative assessment of consequence.
Hazard Identification
Identification of Current Defensives
Evaluation of Defense Effectiveness
Description of Risk Scenarios
Probability of Adverse Consequences
Severity of Adverse Consequences
Scenario Risk Level
Acceptability of Risk to Stakeholders
Risk Team Conclusion
Identify Feasible Risk Control Options
Assess Impact on Severity and Probability
Assess the Impact on the Stakeholders NICs (Needs, Issues, Concerns)
Risk Team Conclusion
1.
4.
2.
3.
Risk Scenarios
Risk Estimation
Risk Evaluation
Risk Mitigation / Control Strategies
Figure 2 Illustration of the steps performed in the risk assessment
8
DET NORSKE VERITAS
Report for Prince Rupert Port Authority
MANAGING RISK Prince Rupert Marine Risk Assessment
2. Frequency and consequence estimation (chapter 8 and chapter 9)
In the frequency assessment the likelihood of an incident occurring given the proposed system is assessed. The assessment is based on worldwide incident frequencies together with local data (including route and route length, marine traffic and navigation hazards) and DNV research of other terminals. There are too few incidents that have occurred off the coast of BC to form a statistically valid local frequency parameter set and therefore worldwide frequencies need to be used. For worldwide frequencies to better reflect local conditions, K factors are applied using the following formula: Frequency Prince Rupert = Frequency Global x K local K factor [Incidents per nautical mile] The results are presented in terms of an annual frequency. This is a statistical representation of the number of incidents that are likely to occur, expressed on an annualized basis. For the purposes of this report, the term consequence refers to the vessel damage, a volume of oil spilled, or the harm to humans. The results of the consequence assessment are expressed in terms of conditional probability of spill given an accident and probability of fatality given an accident.
3. Risk estimation and evaluation (chapter 10)
Based on the frequency and consequence assessment and the forecast number of tankers that will operate to and from the different terminals in Prince Rupert, the overall risk is assessed. The frequencies calculated are converted to return periods (1/accident frequency). The overall oil spill return periods and fatality return periods are also provided.
4. Risk Mitigation and Control Strategies (chapter 11)
In this step the effect of risk mitigation measures on the risks calculated in the risk estimation and risk evaluation are quantified. Risk mitigation measures are categorized by their effect on either frequency reduction and/ or consequence mitigation (an example of a measure that can mitigate both frequency and consequence is a well-trained crew). The main focus in this report has been on incident frequency reduction.
9
DET NORSKE VERITAS
Report for Prince Rupert Port Authority
MANAGING RISK Prince Rupert Marine Risk Assessment
4 SYSTEM DEFINITION Forming the initial task of the full risk assessment study, the navigational assessment (marine risk assessment) consists of a qualitative description of relevant data for the transit of vessels to and from a Prince Rupert marine terminal. It includes key aspects such as: route information, navigation systems, weather data, forecast vessel traffic and proposed ship specifications to existing and proposed terminal locations. The navigational assessment is based on a qualitative analysis and review of information contained in applicable navigational documents such as the relevant Charts from the Canadian hydrographic services (CHS), and the sailing directions, as well as in various existing studies and applicable research. Much of this information was provided by the PRPA, supplemented by that found in publicly available sources. A list of documents reviewed by DNV and used in this report is detailed below in Table 4: Document name Author Date of
Distribution Ref.
Presentation: Port of Prince Rupert: Welcome to North America’s Leading Edge
PRPA 2011-09 PRPA
Report: Description of Marine and Climatic Aspects of the Bulk Coal Shiploading Terminal
Swan Wooster Engineering
1981-02 Swan Wooster
Report: Background information for the Initial federal Public Comment Period on the Canpotex Potash Terminal Project, Prince Rupert, BC
CEAA 2011-09 CEAA
Report: Ridley Island Marine Safety Study DNV 1980-05 DNV 2004
Table 4 Documentation reviewed DNV’s risk assessment process includes a hazard identification (HAZID) workshop, see chapter 7.1, with key stakeholders (as agreed by DNV and the PRPA), aimed at obtaining information and clarification on the key hazards that may present themselves, through guided discussions. DNV conducted a HAZID workshop in Prince Rupert and the information obtained during the workshop formed an integral part to this navigational assessment. In addition to the more formal HAZID Workshop, DNV held various discussions with stakeholders to clarify key points as needed. Information collected during the HAZID served as the basis for the steps detailed below, with additional information researched by DNV and, in addition, utilizing DNV’s expert judgment.
10
DET NORSKE VERITAS
Report for Prince Rupert Port Authority
MANAGING RISK Prince Rupert Marine Risk Assessment
A descriptive assessment of the marine navigational risks is discussed in terms of three major areas as follows:
• Determination of the current traffic patterns and makeup in the study region
• Identification of operational and waterway management conditions (e.g. Traffic Separation Schemes (TSS), established channels, Vessel Traffic Services (VTS), pilotage, navigational restrictions, etc) and environmental conditions (visibility, winds, currents, tides, etc.)
• Projection of potential future traffic patterns, makeup and routes.
4.1 The study Area Deep sea vessel traffic heading for Prince Rupert harbour currently approach from the open waters north of the Haida Gwaii (also known as the Queen Charlotte Islands), through Dixon Entrance north of Stephens Island, following the deep sea traffic route into the Port of Prince Rupert. It is expected that future tanker and LNG traffic will approach along the same route to the future terminal location at Ridley Island, and exit via the same route. The study area for the risk assessment is generally defined as the area from Dixon Entrance through to the proposed LNG/tanker terminal site at Ridley Island in the Port of Prince Rupert. For the purposes of this study, the transit operations are divided into four main segments, two of which are divided into parts a and b, providing alternatives depending on conditions such as vessel draft, weather conditions, and pilot preference. The segments were identified in conjunction with the description of the traffic routes provided in the sailing directions (Source: Sailing Directions PAC205, PAC206) and discussions with stakeholders in the HAZID workshop.
A detailed navigational description of each of the segments identified is provided in chapter 4.3 below.
4.2 Current traffic patterns As can be seen from Table 5, there are approximately 885 vessels entering annually into PR today. The type and number of vessels in the area varies seasonally. This chapter describes the different deep and short sea shipping routes and the vessels occurring in the area today.
4.2.1 Deep sea route to Ridley Island, Prince Rupert – CHS Chart no. 3002
The route for all deep sea traffic heading from the open ocean of the pacific into the northern British Columbian Port of Prince Rupert, as well as a large proportion of the deep draft traffic heading into the port of Kitimat follow the same shipping channel entering through Dixon Entrance above Graham Island, the northern part of the Haida Gwaii. Pilotage into the area past Dixon Entrance is compulsory for all vessels over 350 gross tons. The pilot boarding station is located off Triple Island, at the eastern end of Dixon Entrance above Stephens Island at approximately 54° 17' 6" N; 130° 52' 7 W, and 42 km from the Port of Prince Rupert (Source: PRPA, 2011). Vessels may be instructed to follow the pilot boat into sheltered
11
DET NORSKE VERITAS
Report for Prince Rupert Port Authority
MANAGING RISK Prince Rupert Marine Risk Assessment
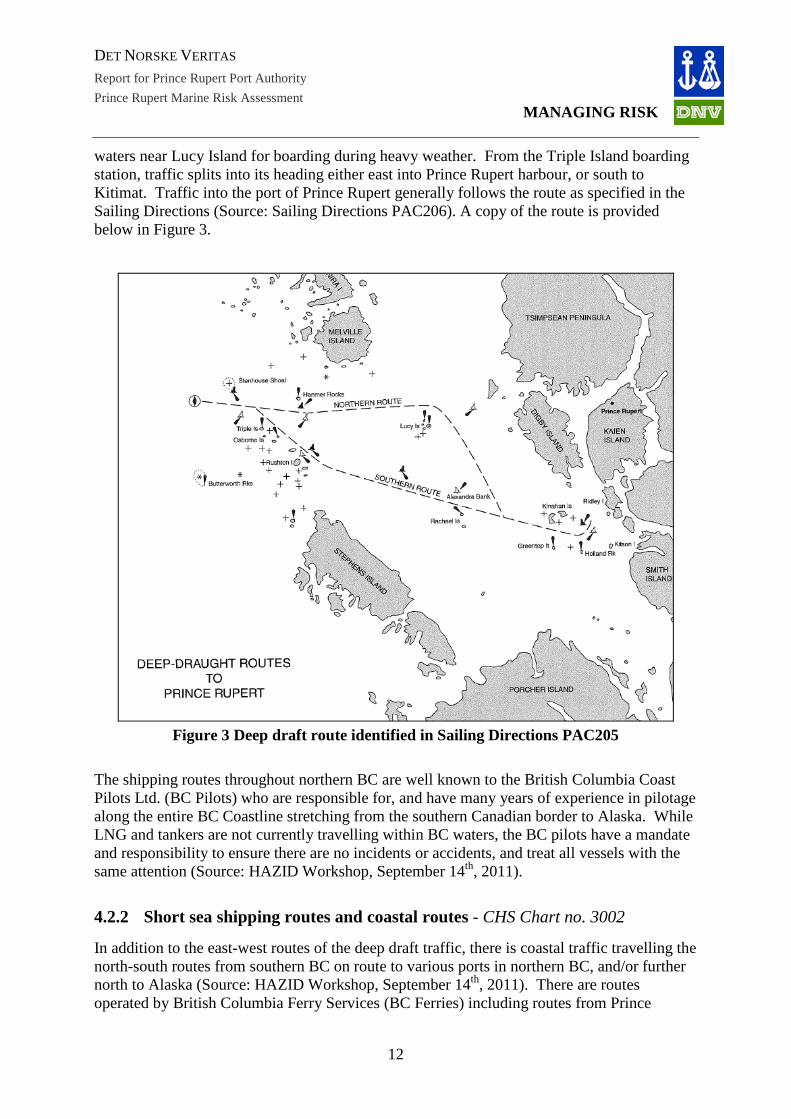
waters near Lucy Island for boarding during heavy weather. From the Triple Island boarding station, traffic splits into its heading either east into Prince Rupert harbour, or south to Kitimat. Traffic into the port of Prince Rupert generally follows the route as specified in the Sailing Directions (Source: Sailing Directions PAC206). A copy of the route is provided below in Figure 3.
Figure 3 Deep draft route identified in Sailing Directions PAC205
The shipping routes throughout northern BC are well known to the British Columbia Coast Pilots Ltd. (BC Pilots) who are responsible for, and have many years of experience in pilotage along the entire BC Coastline stretching from the southern Canadian border to Alaska. While LNG and tankers are not currently travelling within BC waters, the BC pilots have a mandate and responsibility to ensure there are no incidents or accidents, and treat all vessels with the same attention (Source: HAZID Workshop, September 14th, 2011).
4.2.2 Short sea shipping routes and coastal routes - CHS Chart no. 3002
In addition to the east-west routes of the deep draft traffic, there is coastal traffic travelling the north-south routes from southern BC on route to various ports in northern BC, and/or further north to Alaska (Source: HAZID Workshop, September 14th, 2011). There are routes operated by British Columbia Ferry Services (BC Ferries) including routes from Prince
12
DET NORSKE VERITAS
Report for Prince Rupert Port Authority
MANAGING RISK Prince Rupert Marine Risk Assessment
Rupert to the Haida Gwaii, and the Alaska Marine Highway System (AMHS) operating routes from Washington State to Ketchikan and further locations in Alaska (Source: Alaska Marine Highway System). Short sea traffic includes the regular operations of companies such as Totem Ocean Trailer Express (TOTE) which operate a twice weekly service between the Port of Tacoma, Washington and the Port of Anchorage, Alaska (Source: TOTE). Most of this traffic crosses the path of deep draft traffic, most frequently, any North-South traffic runs north between the Kinahan Islands and Rachel Island west of Kinahan Islands and east of Lucy Island, which is at the points defined in segment 2A and 2B in the chapters further below.
Throughout the summer months, cruise lines operate along either the inside or outside passage, on route to Prince Rupert and/or Alaska. Cruise ships heading north normally travel up Hecate Strait, Loretto Channel, Browning Entrance, then out to Triple Island (Source: HAZID Workshop, September 14th, 2011).
4.2.3 Vessel types
As mentioned above, there are various routes following by ships in the area around Prince Rupert, and there is a variety of vessel types transiting the area. In discussions during the HAZID workshop, the mix of traffic transiting within the study area includes the following ship types:
- Tugs and barges (with or without tows). Tow could include logs, general cargo, containers, bulk, oil and other)
- Passenger ferries (including BC Ferries route from Prince Rupert to Skidegate on the Haida Gwaii)
- Container vessels
- Bulk carriers (including product carriers / grain carriers)
- Cruise ships
- Fishing vessels (commercial and native fisheries)
- Pleasure craft (sailing yachts, motor yachts, and sport fishing vessels)
- Government vessels
These vessel types will be considered in the risk analysis.
Current vessel types entering into the port of Prince Rupert are outlined below in Table 5. This table provides an indication of the cargo carried and the size and frequency of the vessels in and out of the Port of Prince Rupert harbour over a one year period.
13

DET NORSKE VERITAS
Report for Prince Rupert Port Authority
MANAGING RISK Prince Rupert Marine Risk Assessment
Type of Vessel
Size DWT
Cargo Tons of cargo (if laden) Metric Tonnes
Destination # of movements
/year
Seasonal?
If yes, describe
Bulker 56,000 Grain 50,000 PR Grain /Ridley Isl.
112 No
Bulker 87,000 Coal/Wood Pellets
66,000 Ridley Terminals Inc.
107 No
Bulker 32,000 Logs 14,800 Anchorages D,V,E
32 No
Tanker 19,992 Wax 3,047 Fairview 5 No
Container 67,209 Containers 22,550 Fairview Container Terminal
130 No
Tug/
Barge
Chemicals/L.P. Gas
0.85 Cdn National Aquatrain
31 No
Ferry – BC 1640 Passengers 155 passengers BC Ferry Terminal
320 Partially
Ferry – Alaska
260 Passengers 141
Passengers
Alaska Ferry Terminal
123 Partially
Cruise 7,500 Passengers 2,732 passengers Northland Terminal
25 Yes
Total 885
Table 5 Current vessel types and descriptions, as provided by the Port of Prince Rupert (Source: PRPA)
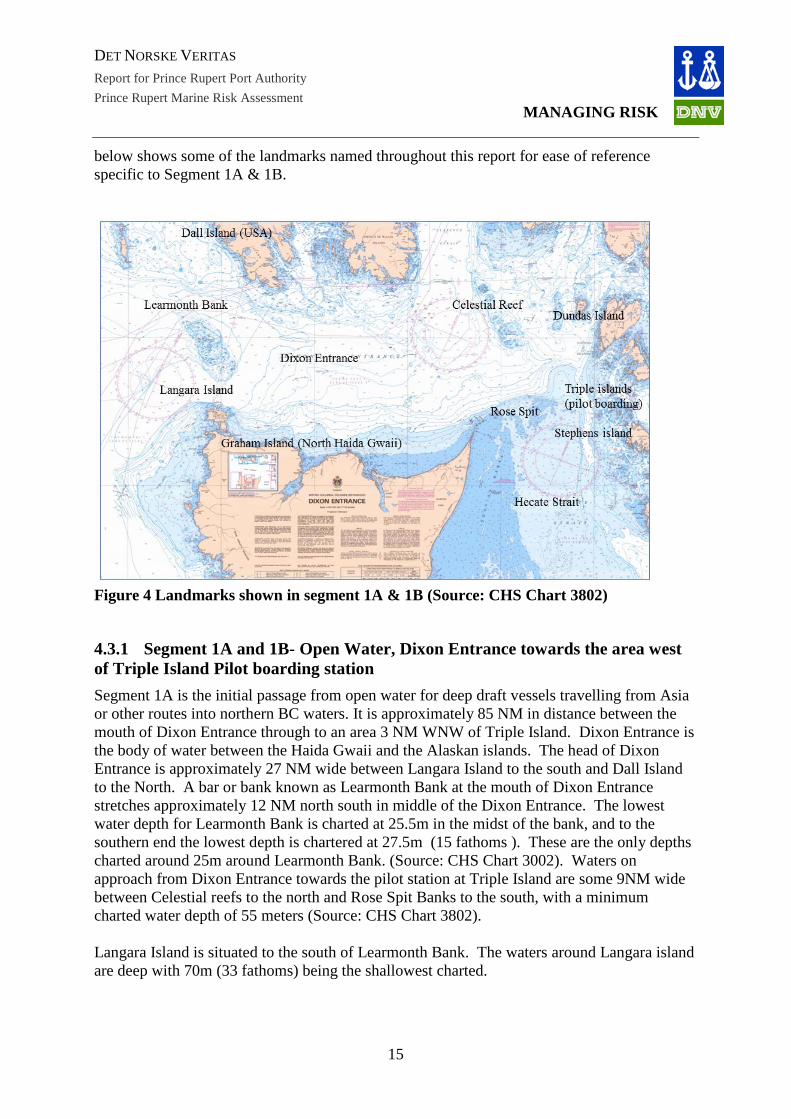
4.3 Navigational description – Operational and waterway management conditions In order to provide an accurate navigational description of the route from the open ocean to the proposed terminal site on Ridley Island, Prince Rupert, the route has been divided into 7 segments. These are described in detail below and depicted in Figure 5 & Figure 7. For each segment, descriptions of any features relative to navigational hazards are provided. Figure 4
14
DET NORSKE VERITAS
Report for Prince Rupert Port Authority
MANAGING RISK Prince Rupert Marine Risk Assessment
below shows some of the landmarks named throughout this report for ease of reference specific to Segment 1A & 1B.
Figure 4 Landmarks shown in segment 1A & 1B (Source: CHS Chart 3802)
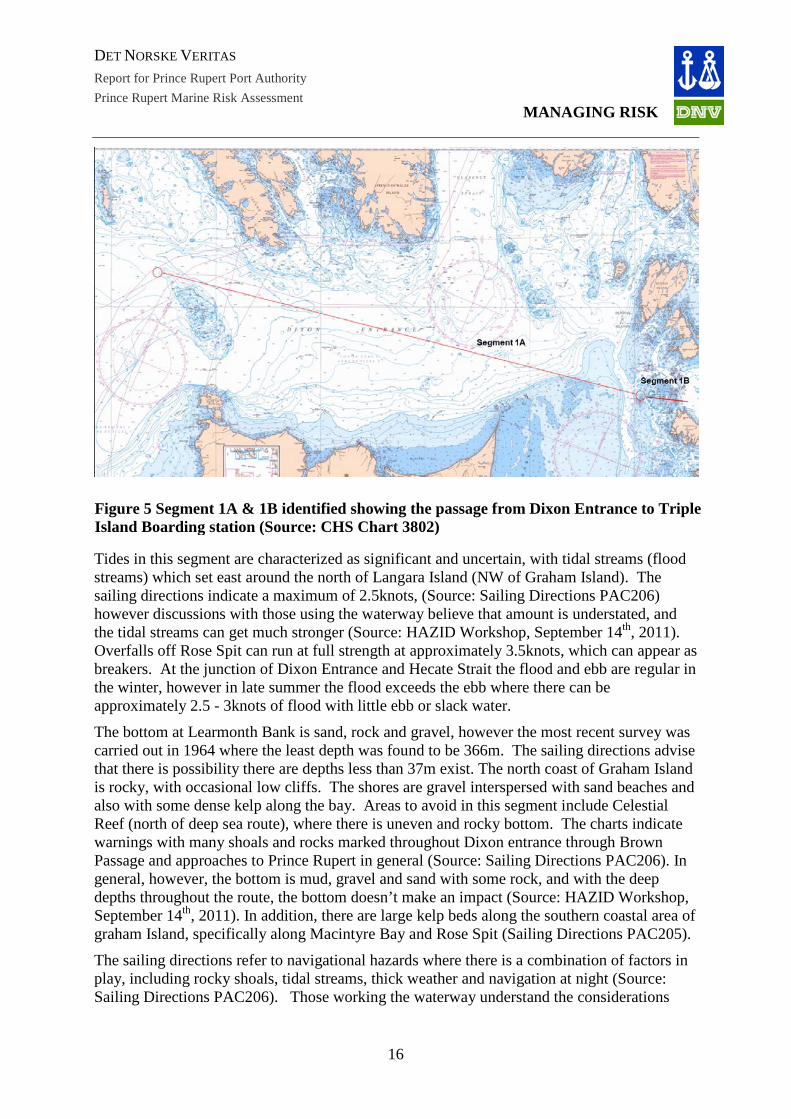
4.3.1 Segment 1A and 1B- Open Water, Dixon Entrance towards the area west of Triple Island Pilot boarding station Segment 1A is the initial passage from open water for deep draft vessels travelling from Asia or other routes into northern BC waters. It is approximately 85 NM in distance between the mouth of Dixon Entrance through to an area 3 NM WNW of Triple Island. Dixon Entrance is the body of water between the Haida Gwaii and the Alaskan islands. The head of Dixon Entrance is approximately 27 NM wide between Langara Island to the south and Dall Island to the North. A bar or bank known as Learmonth Bank at the mouth of Dixon Entrance stretches approximately 12 NM north south in middle of the Dixon Entrance. The lowest water depth for Learmonth Bank is charted at 25.5m in the midst of the bank, and to the southern end the lowest depth is chartered at 27.5m (15 fathoms ). These are the only depths charted around 25m around Learmonth Bank. (Source: CHS Chart 3002). Waters on approach from Dixon Entrance towards the pilot station at Triple Island are some 9NM wide between Celestial reefs to the north and Rose Spit Banks to the south, with a minimum charted water depth of 55 meters (Source: CHS Chart 3802). Langara Island is situated to the south of Learmonth Bank. The waters around Langara island are deep with 70m (33 fathoms) being the shallowest charted.
15
DET NORSKE VERITAS
Report for Prince Rupert Port Authority
MANAGING RISK Prince Rupert Marine Risk Assessment
Tides in this segment are characterized as significant and uncertain, with tidal streams (flood streams) which set east around the north of Langara Island (NW of Graham Island). The sailing directions indicate a maximum of 2.5knots, (Source: Sailing Directions PAC206) however discussions with those using the waterway believe that amount is understated, and the tidal streams can get much stronger (Source: HAZID Workshop, September 14th, 2011). Overfalls off Rose Spit can run at full strength at approximately 3.5knots, which can appear as breakers. At the junction of Dixon Entrance and Hecate Strait the flood and ebb are regular in the winter, however in late summer the flood exceeds the ebb where there can be approximately 2.5 - 3knots of flood with little ebb or slack water.
The bottom at Learmonth Bank is sand, rock and gravel, however the most recent survey was carried out in 1964 where the least depth was found to be 366m. The sailing directions advise that there is possibility there are depths less than 37m exist. The north coast of Graham Island is rocky, with occasional low cliffs. The shores are gravel interspersed with sand beaches and also with some dense kelp along the bay. Areas to avoid in this segment include Celestial Reef (north of deep sea route), where there is uneven and rocky bottom. The charts indicate warnings with many shoals and rocks marked throughout Dixon entrance through Brown Passage and approaches to Prince Rupert in general (Source: Sailing Directions PAC206). In general, however, the bottom is mud, gravel and sand with some rock, and with the deep depths throughout the route, the bottom doesn’t make an impact (Source: HAZID Workshop, September 14th, 2011). In addition, there are large kelp beds along the southern coastal area of graham Island, specifically along Macintyre Bay and Rose Spit (Sailing Directions PAC205).
The sailing directions refer to navigational hazards where there is a combination of factors in play, including rocky shoals, tidal streams, thick weather and navigation at night (Source: Sailing Directions PAC206). Those working the waterway understand the considerations
Figure 5 Segment 1A & 1B identified showing the passage from Dixon Entrance to Triple Island Boarding station (Source: CHS Chart 3802)
16
DET NORSKE VERITAS
Report for Prince Rupert Port Authority
MANAGING RISK Prince Rupert Marine Risk Assessment
listed, however they believe this is manageable, as the sailing directions do not factor in the use of satellite, GPS, gyro, traffic control, experience of pilots, and other mitigating measures in place (Source: HAZID Workshop, September 14th, 2011).
The occurrence of advection fog in Dixon Entrance particularly during the summer months from July to September puts visibility at less than 0.5 miles and occurring up to 15% of the time, and often over several days (Source: Sailing Directions PAC206). However during discussions with stakeholders it was agreed to be an average of less than 1km visibility due to fog for approximately 20 days in the year (between 15-25 days) (Source: HAZID Workshop, September 14th, 2011).
Gales blow frequently from the South East northwards up Hecate Strait predominantly from October to April (and throughout the year). In the approached to Triple Islands, there is a radar beacon (racon) at Butterworth Rocks, to the south of Triple Island, towards Hecate Strait. There is a manned lighthouse at Triple Island (Source: HAZID Workshop, September 14th, 2011). For a deep sea vessel approaching the Triple Island pilot station there is a distance of approximately 8.5 NM between Celestial reefs to the north and Rose Spit banks to the south, with a minimum charted water depth of 55 m.
4.3.2 Segment 1B - Island Groups & Shoals near Triple Island Pilot boarding station Segment 1B is the approach closing into the Triple Island Boarding Station from Segment 1A. It is approximately 3 NM in distance West North West of the Triple Islands station, and slightly to the East of the boarding station. It is bordered by island groups and shoals. The proposed navigation route from the Triple Islands is defined by the Pilotage Act as a mandatory pilotage area. The boarding station is where incoming and outgoing tankers on the proposed route would interact with Prince Rupert Marine Communications and Traffic Services (MCTS) and other vessels transiting the inside and outer passages. Approaching the Triple Islands, there is a radio beacon (racon) at Butterworth Rocks, to the south of Triple Island, towards Hecate Strait (Source: Sailing Directions PAC206). For a deep sea vessel approaching the Triple Island Pilot Station there is a distance of approximately 16 km between Celestial reefs to the north and Rose Spit banks to the south, with a minimum charted water depth of 55 m. The waters off Triple Island are open and exposed and arrival may need to be delayed during periods of severe weather. The British Columbia Coast Pilots (BCCP) would instruct the approaching tanker to a safe position, suitable for making a lee for pilot boarding. This position is likely to be about 5 to 10 km west of Triple Islands. The boarding ground area is bounded by Stenhouse Shoals to the north, Butterworth Rocks 9.3 km to the south and the Tree Nob group of islands to the east, which includes Triple Islands. Stenhouse Shoals are marked by a green buoy equipped with a flashing light and a radar responder beacon (racon). Butterworth Rocks are marked by a flashing light, mounted on a white tripod skeleton tower that is also equipped with a racon. There is a manned lighthouse
17
DET NORSKE VERITAS
Report for Prince Rupert Port Authority
MANAGING RISK Prince Rupert Marine Risk Assessment
at Triple Island (Source: HAZID Workshop, September 14th, 2011) located on the most north-westerly rock of the Triple Islands group. The Triple Island pilot boarding station is the primary pilotage station for vessels visiting the region and is therefore a focal point for traffic. In the future it may be an option to use helicopter to board the pilots to the vessels. Using this option would allow the pilots to board the vessel well before the approaches to Prince Rupert Gateway. It shall be noted that with introducing such an activity new hazards will be introduced. Those hazards have not been assessed in this report.
4.3.3 Segment 2A and 3A (Alternative 1) – Water sheltered by Islands – from the Triple Island boarding station north of Rachel, south of Kinahan Islands
Segment 2A, a distance of 16.5 NM, and segment 3A, a distance of 5.4 NM, show the waters from the Triple Island boarding station heading east, and running north of the Rachel Islands, and then south of the Kinahan Islands. This is known as the northern route. It is an alternative route for the deep sea traffic however most will use the southern route as detailed below in chapter 4.3.4. The northern route as defined by sailing directions is rarely used under specific weather conditions (Source: HAZID Workshop, September 14th, 2011).
From Triple Islands, the Northern route follows Browns Passage, a deep water channel. The passage is approximately 18NM at the widest section, however narrows to approximately 6NM at the south western end of the passage, bounded by the islands and shoals which form the Tree Nob group in the south, and various shoals trailing from the Hanmer Rocks from the North. The narrow neck is marked by twin buoys. The bathometry drops very sharply from the islands of the Tree Nob Group. The shallowest points are at the edge of the islands, where there are some areas of mud which may be visible during low tides. The northern shoals all measure 25 meters or more.
18
DET NORSKE VERITAS
Report for Prince Rupert Port Authority
MANAGING RISK Prince Rupert Marine Risk Assessment
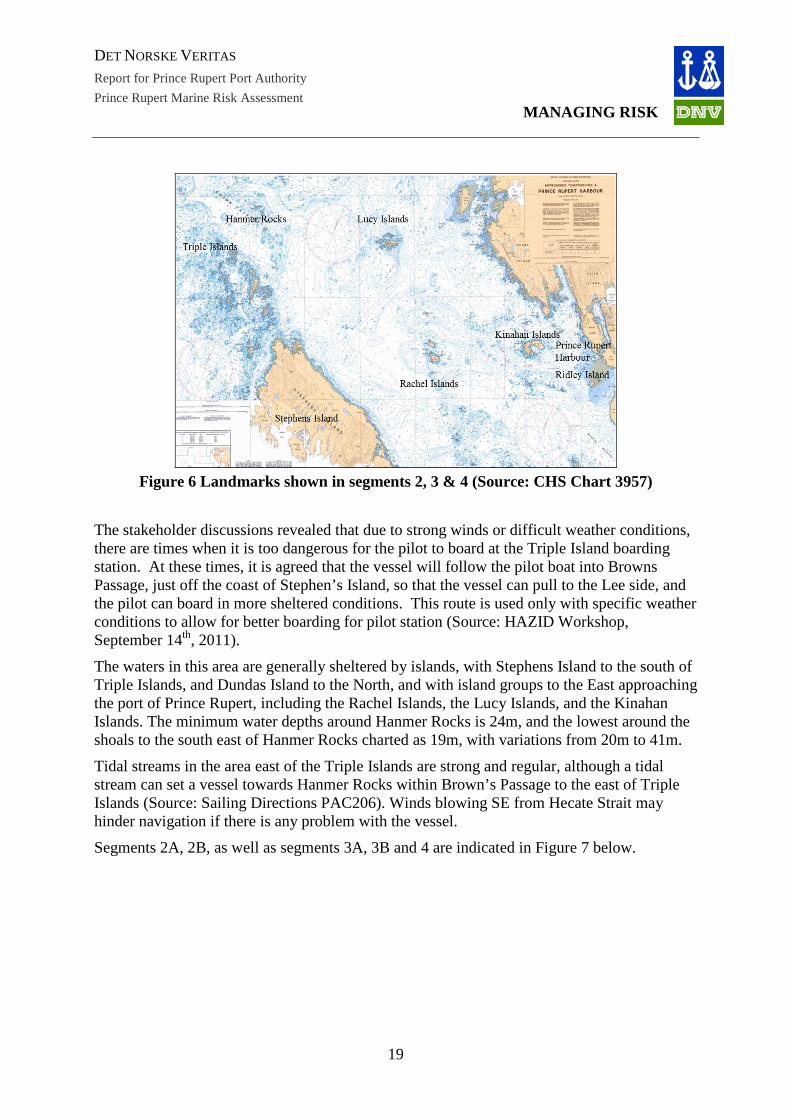
Figure 6 Landmarks shown in segments 2, 3 & 4 (Source: CHS Chart 3957)
The stakeholder discussions revealed that due to strong winds or difficult weather conditions, there are times when it is too dangerous for the pilot to board at the Triple Island boarding station. At these times, it is agreed that the vessel will follow the pilot boat into Browns Passage, just off the coast of Stephen’s Island, so that the vessel can pull to the Lee side, and the pilot can board in more sheltered conditions. This route is used only with specific weather conditions to allow for better boarding for pilot station (Source: HAZID Workshop, September 14th, 2011).
The waters in this area are generally sheltered by islands, with Stephens Island to the south of Triple Islands, and Dundas Island to the North, and with island groups to the East approaching the port of Prince Rupert, including the Rachel Islands, the Lucy Islands, and the Kinahan Islands. The minimum water depths around Hanmer Rocks is 24m, and the lowest around the shoals to the south east of Hanmer Rocks charted as 19m, with variations from 20m to 41m.
Tidal streams in the area east of the Triple Islands are strong and regular, although a tidal stream can set a vessel towards Hanmer Rocks within Brown’s Passage to the east of Triple Islands (Source: Sailing Directions PAC206). Winds blowing SE from Hecate Strait may hinder navigation if there is any problem with the vessel.
Segments 2A, 2B, as well as segments 3A, 3B and 4 are indicated in Figure 7 below.
19
DET NORSKE VERITAS
Report for Prince Rupert Port Authority
MANAGING RISK Prince Rupert Marine Risk Assessment
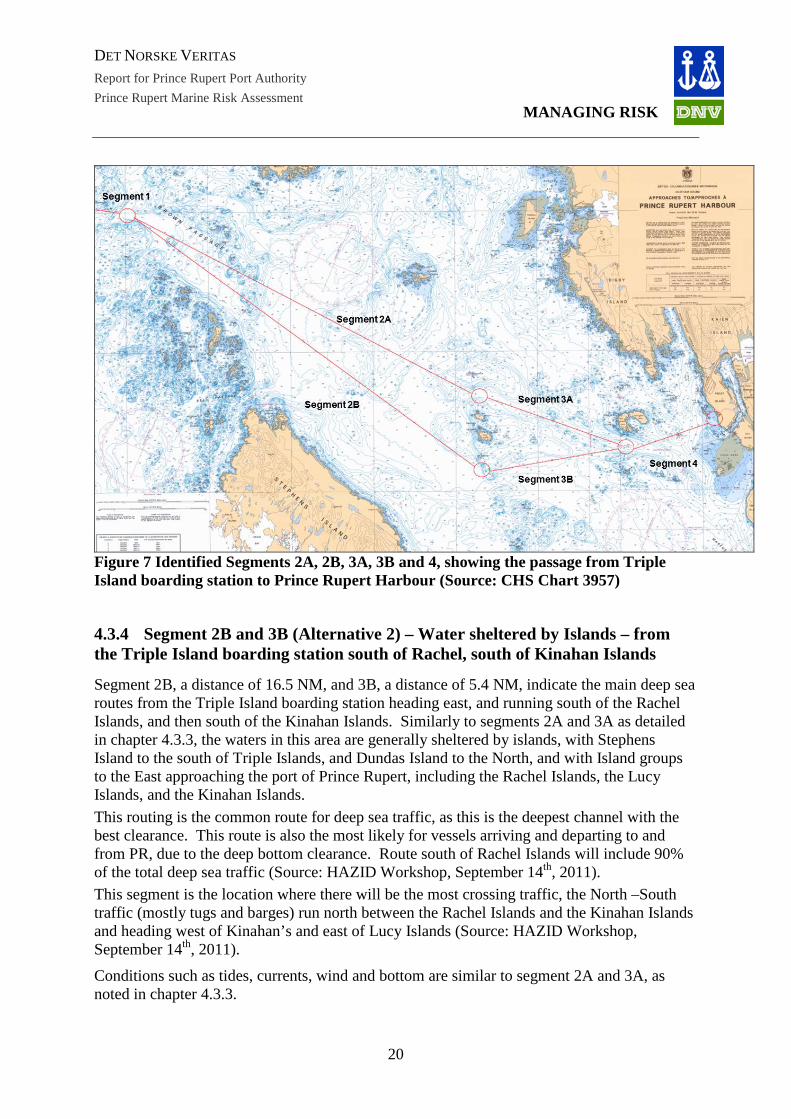
Figure 7 Identified Segments 2A, 2B, 3A, 3B and 4, showing the passage from Triple Island boarding station to Prince Rupert Harbour (Source: CHS Chart 3957)
4.3.4 Segment 2B and 3B (Alternative 2) – Water sheltered by Islands – from the Triple Island boarding station south of Rachel, south of Kinahan Islands
Segment 2B, a distance of 16.5 NM, and 3B, a distance of 5.4 NM, indicate the main deep sea routes from the Triple Island boarding station heading east, and running south of the Rachel Islands, and then south of the Kinahan Islands. Similarly to segments 2A and 3A as detailed in chapter 4.3.3, the waters in this area are generally sheltered by islands, with Stephens Island to the south of Triple Islands, and Dundas Island to the North, and with Island groups to the East approaching the port of Prince Rupert, including the Rachel Islands, the Lucy Islands, and the Kinahan Islands. This routing is the common route for deep sea traffic, as this is the deepest channel with the best clearance. This route is also the most likely for vessels arriving and departing to and from PR, due to the deep bottom clearance. Route south of Rachel Islands will include 90% of the total deep sea traffic (Source: HAZID Workshop, September 14th, 2011). This segment is the location where there will be the most crossing traffic, the North –South traffic (mostly tugs and barges) run north between the Rachel Islands and the Kinahan Islands and heading west of Kinahan’s and east of Lucy Islands (Source: HAZID Workshop, September 14th, 2011).
Conditions such as tides, currents, wind and bottom are similar to segment 2A and 3A, as noted in chapter 4.3.3.
20
DET NORSKE VERITAS
Report for Prince Rupert Port Authority
MANAGING RISK Prince Rupert Marine Risk Assessment
Lucy Islands to the north has shallow waters of 7.5 m and 8 m, with a trail of shallow water leading to the south of the islands, where the minimum depth is 7.3m. Approximately 32NM to the south east, the Rachel Islands sit in deeper waters with the shallowest depths being around 22m in the north, and shallower to the east of the Islands with depth of 5.5m.
4.3.5 Segment 4 - Approach to terminal –Kinahan Islands to Ridley Island
Segment 4 is a distance of 3 NM and indicates the deep sea route south of the Kinahan Islands into the Port of Prince Rupert including Ridley Island. Segment 4 is shown in Figure 7 above. Prince Rupert harbour can be subject to extreme gusts of wind from the mountain slopes during SE gales, which are prevalent during the autumn and winter months. When these weather conditions are expected, all necessary precautions to guard against anchor dragging must be taken. It is a requirement within the Prince Rupert harbour that vessels have engines at standby with a 2nd anchor ready to let go immediately. The Vessel Traffic Services (VTS) will send out an alert in this situation. In addition, the PRPA have an additional requirement that all vessels must remain in ballast during the period between October to April. This requirement is effective in preventing incidents due to vessel dragging anchor caused by strong winds (Source: HAZID Workshop, September 14th, 2011). The Kinahan Islands is a group of four small islands directly to the east of the Rachel Islands. The depths approximately 5 NM south of the Kinahan’s is deep, to about 106 m, however the waters become shallower with 29 m to the west of the group, and minimum of about 25m around to the eastern side of the island. There are several locations within this segment where vessels should not meet due to the tight turning radius and other concerns. All parties working on the waterways are aware of these dangers, and avoid such situations where possible, however these are not noted in the Sailing Directions (Source: HAZID Workshop, September 14th, 2011):
- The turning point south of Kinahan Islands into Ridley and around Ridley Island Buoy - Alexander Bank provides approximately 1.5 mile passing area, and should be avoided
where possible - 2 buoys off Rushton Island (known locally as the goal posts) should be avoided with a
loaded tanker.
21

DET NORSKE VERITAS
Report for Prince Rupert Port Authority
MANAGING RISK Prince Rupert Marine Risk Assessment
Below table shows a summary of the minimum known depths throughout the approach. Segment Area Minimum known depth 1A Lermonth bank 25.5m 1A Between Celestial reef and Rose spit 55 m 1A Langara Island 70 m 1B & 2A Tree Nob Groups (Northern Shoals) 25 m 2A Hanmer Rocks 24 m 2A & 2B South East of Hanmer Rocks 19 m 2A Lucy Island 7.5 m 2A & 3A North of Rachel Islands 22 m 3A & 3B East of Rachel Islands 5.5 m 4 5 NM South of Kinahan Island 106 m 4 West of Kinahan Island 29 m 4 East of Kinahan Island 25 m Table 6 Summary of chartered depths
4.4 Prince Rupert anchorages: PRPA has identified several anchorage positions both in the inner harbour, and additional anchorages in the Chatham Sound. The PRPA also identifies an additional 11 anchorages available outside the harbour limits near Prescott, Stephens and Lucy Islands. Anchorages outside harbour limits are utilized at the discretion of the vessel and pilot. Given the growth expected at PRPA, discussed in Chapter 4, the Port will conduct an anchorage review of its existing anchorages including investigating the use of mooring buoys to secure ships waiting for berth.
2 54 07' 24" N 130 17' 20" W 3 54 06' 24" N 130 17' 00" W 4 54 07' 00" N 130 18' 50" W 5 54 05' 33" N 130 33' 35" W 6 54 06' 27" N 130 34' 25" W 7 54 07' 06" N 130 35' 38" 8 54 07' 54" N 130 36' 44" W 9 54 08' 48"N 130 37' 30" W
10 54 09' 36" N 130 38' 24" W 11 54 16' 48" N 130 38' 43" W 12 54 15' 29" N 130 37' 36" W
Table 7 Prince Rupert Anchorages located outside PRPA harbour limits, (Source: PRPA).
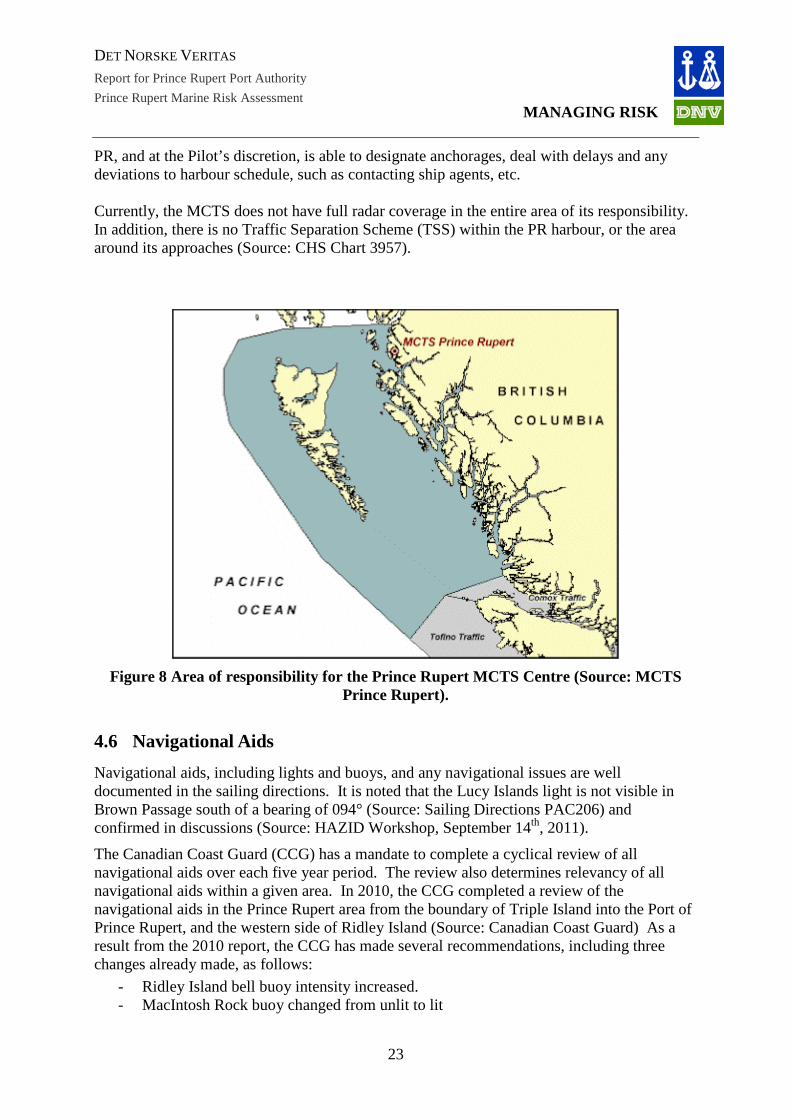
4.5 Marine Communications and Traffic Services (MCTS) The Marine Communications and Traffic Services (MCTS) operated by the Canadian coast guard in Prince Rupert has a large area of responsibility, reaching from the Alaskan Border in the north, through to the Northern edge of Vancouver Island in the south. The area of responsibility is shown in Figure 8 below. The MCTS acts on behalf of the Harbour Master at
22
DET NORSKE VERITAS
Report for Prince Rupert Port Authority
MANAGING RISK Prince Rupert Marine Risk Assessment
PR, and at the Pilot’s discretion, is able to designate anchorages, deal with delays and any deviations to harbour schedule, such as contacting ship agents, etc. Currently, the MCTS does not have full radar coverage in the entire area of its responsibility. In addition, there is no Traffic Separation Scheme (TSS) within the PR harbour, or the area around its approaches (Source: CHS Chart 3957).
Figure 8 Area of responsibility for the Prince Rupert MCTS Centre (Source: MCTS
Prince Rupert).
4.6 Navigational Aids Navigational aids, including lights and buoys, and any navigational issues are well documented in the sailing directions. It is noted that the Lucy Islands light is not visible in Brown Passage south of a bearing of 094° (Source: Sailing Directions PAC206) and confirmed in discussions (Source: HAZID Workshop, September 14th, 2011).
The Canadian Coast Guard (CCG) has a mandate to complete a cyclical review of all navigational aids over each five year period. The review also determines relevancy of all navigational aids within a given area. In 2010, the CCG completed a review of the navigational aids in the Prince Rupert area from the boundary of Triple Island into the Port of Prince Rupert, and the western side of Ridley Island (Source: Canadian Coast Guard) As a result from the 2010 report, the CCG has made several recommendations, including three changes already made, as follows:
- Ridley Island bell buoy intensity increased. - MacIntosh Rock buoy changed from unlit to lit
23
DET NORSKE VERITAS
Report for Prince Rupert Port Authority
MANAGING RISK Prince Rupert Marine Risk Assessment
- Bouy inside bifurcation mark, now lit, due to incident with Washington State Ferries.
In addition, the following recommendations were made and submitted for funding approval: - Phillips Point oscillating sector light around Ridley Island - Parizeau Point light beacon changed to white light.
The CCG has an agreement with some Canadian Ports that the Ports should provide funding of navigational aids if the need is within the boundaries of the Port.
24
DET NORSKE VERITAS
Report for Prince Rupert Port Authority
MANAGING RISK Prince Rupert Marine Risk Assessment
5 FORECAST TRAFFIC PATTERNS The risks associated with new operations of LNG and oil tanker traffic movements in the study area are increased by other traffic within the area, and therefore any analysis of risks for additional vessel traffic should take into consideration increased traffic in the area.
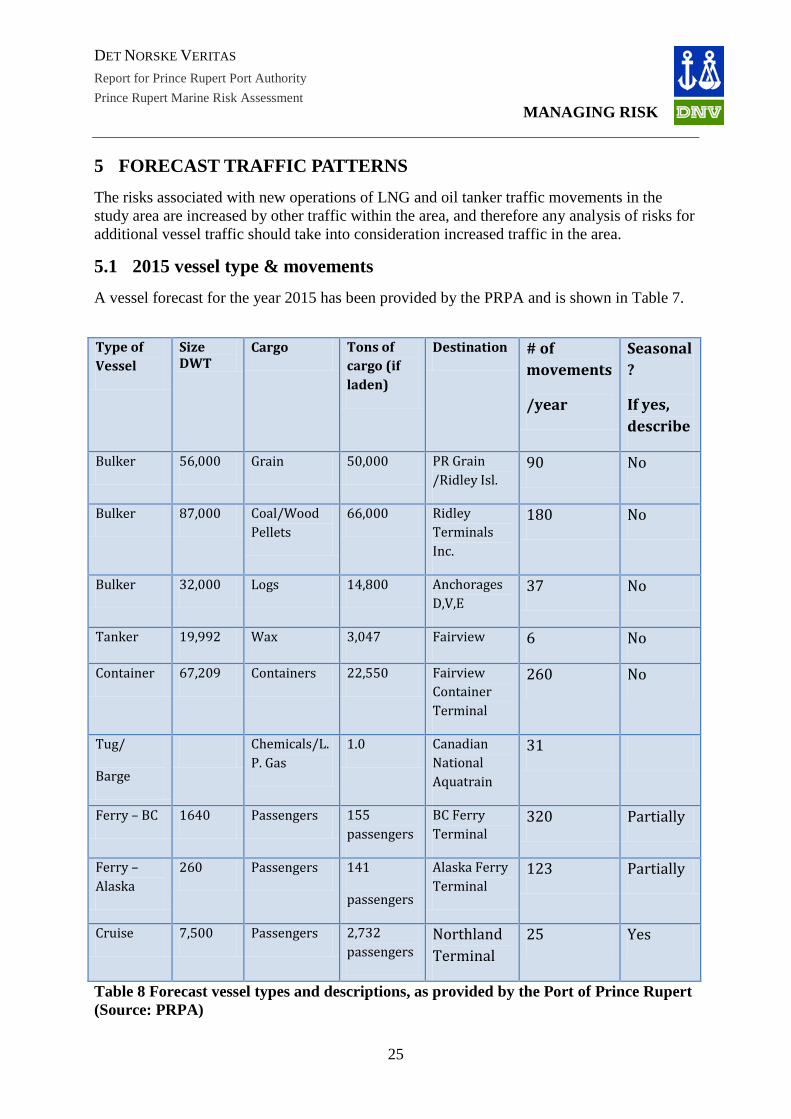
5.1 2015 vessel type & movements A vessel forecast for the year 2015 has been provided by the PRPA and is shown in Table 7.
Type of Vessel
Size DWT
Cargo Tons of cargo (if laden)
Destination # of movements
/year
Seasonal?
If yes, describe
Bulker 56,000 Grain 50,000 PR Grain /Ridley Isl.
90 No
Bulker 87,000 Coal/Wood Pellets
66,000 Ridley Terminals Inc.
180 No
Bulker 32,000 Logs 14,800 Anchorages D,V,E
37 No
Tanker 19,992 Wax 3,047 Fairview 6 No
Container 67,209 Containers 22,550 Fairview Container Terminal
260 No
Tug/
Barge
Chemicals/L.P. Gas
1.0 Canadian National Aquatrain
31
Ferry – BC 1640 Passengers 155 passengers
BC Ferry Terminal
320 Partially
Ferry – Alaska
260 Passengers 141
passengers
Alaska Ferry Terminal
123 Partially
Cruise 7,500 Passengers 2,732 passengers
Northland Terminal
25 Yes
Table 8 Forecast vessel types and descriptions, as provided by the Port of Prince Rupert (Source: PRPA)
25
DET NORSKE VERITAS
Report for Prince Rupert Port Authority
MANAGING RISK Prince Rupert Marine Risk Assessment
The forecast is based on the numbers of vessels expected to be operating in the PR area in 2015, but does not include possible future LNG and/or tanker traffic as per the proposed project for which this study prepares.
As can be seen by comparing Table 5 (current traffic in 2011) with Table 8 (future traffic in 2015) there is expected to be limited net change in the numbers of traffic predicted in 2015, with the most pronounced changes in the numbers of container traffic rising from 180 in 2011 to 260 movements in 2015, an increase of 30% in container traffic entering to the Port of Prince Rupert.
For the purposes of this report, the numbers of LNG ships is assumed to be 100 per year and the numbers of tankers is assumed to be 100 per year. The significance of these changes will be discussed in detail in further chapters of this report.
In addition, the route followed by vessels operating to and from Asian Ports through the deep sea vessel route from Dixon Entrance en route to other BC terminals such as Kitimat and or other terminals may also impact the risks associated with increases in traffic through to Prince Rupert. At the time of writing this report, these numbers are not known or not clear.
5.2 Proposed ship specifications to existing / proposed terminal locations The approach to Prince Rupert harbour is a natural deep harbour and there are currently no size restrictions to vessels entering the harbour. It is not envisioned that any adjustments to ship specifications will be needed for existing or proposed terminal locations.
5.3 Other adaptations and risk mitigation The picture of risk due to vessel traffic in the area will be altered depending on various changes (either known or unknown) occurring over the next 3 years. Some expected legislative changes include regulatory requirements for vessels operating in international and/or Canadian waters, changes in ship design and changes in mandatory vessel operational procedures. Some of the expected and known changes are highlighted below.
5.3.1 Regulatory
US's Oil Pollution Act of 1990 (OPA 90) Canada has joined the global initiative to phase out single-hulled tankers, including tankers and tanker barges, in order to protect the world’s waters from oil pollution. Transport Canada’s oil pollution prevention regulations include The International Maritime Organization's Annex 1 of MARPOL (Regulation 13F and 13G) and the US's Oil Pollution Act of 1990 (OPA 90). Canada has adopted the MARPOL requirements for the phase out of single hulled tankers on international voyages in waters under Canadian jurisdiction, and will apply OPA 90 provisions for Canadian tankers on domestic voyages or trading to the US and
26

DET NORSKE VERITAS
Report for Prince Rupert Port Authority
MANAGING RISK Prince Rupert Marine Risk Assessment
for US tankers trading in waters under Canadian jurisdiction. The final phase out will occur in 2015 (Source: Transport Canada).
North American Emissions Control Area (ECA) In 2010, the International Maritime Organization (IMO) amended the International Convention for the Prevention of Pollution from Ships (MARPOL) designating specific portions of U.S., Canadian and French waters as an Emission Control Area (ECA). The North American ECA will become enforceable in August 2012. Ships complying with ECA standards will reduce their emissions of nitrogen oxides (NOx), sulfur oxides (SOx), and fine particulate matter (PM2.5). The area of the North American ECA includes waters adjacent to the Pacific coast and extends up to 200 nautical miles from coasts of the United States and Canada.
A concern noted by various stakeholders during the HAZID workshop discussions was the ability of ship engines to switch to the low sulphur fuel without disruption to the speed or other navigation of the vessel. It was thought that when switching fuels, there may be a danger of the vessel power cutting out and the consequent danger of a vessel drifting into the Dixon Entrance, a high wind and turbulent tidal area ECA (Source: HAZID Workshop, September 14th, 2011).
Currently, there are no bunker operations in northern BC. The closest bunkering facilities are known to be either Port Angeles, Vancouver, Singapore etc. This may change with the implementation of the ECA (Source: HAZID Workshop, September 14th, 2011).
Pacific North Coast Integrated Management Area (PNCIMA)
The PNCIMA is an interdisciplinary stakeholder engagement initiative aimed at development of an Integrated Management Area. The PNCIMA initiative is made up of a broad range of people who contribute to the initiative in different ways, with representatives from the Federal, Provincial and First Nations governments. Any developments in the future may affect the operations and routing of vessels such as tankers in the area, specifically in areas such as in the vicinity of the Haida Gwaii and Dixon Entrance, as well as the marine protected areas in the Hecate Strait.
27
DET NORSKE VERITAS
Report for Prince Rupert Port Authority
MANAGING RISK Prince Rupert Marine Risk Assessment
6 INCIDENT ANALYSIS DNV has performed a global and local incident review that can be seen in Appendix 1. This review has provided input to the frequency and consequence assessment, see Chapters 8 and 9. The following chapter reviews oil tanker incidents that have occurred in the area around PR. The information and data presented is based on statistics for the years 2000 to 2010 obtained from the Lloyd’s Register Fairplay Incident database and World Fleet Statistics (Source: IHS Fairplay Global Maritime Statistics 2011), and the International Tanker Owners Pollution Federation Ltd (Source: ITOPF 2011) which also included statistics up to 2008. The main conclusions from this review were that the safety record in the marine industry has improved continuously in the last four decades. Regulatory improvements and lessons learned from past incidents have led to improved safety procedures and increased commercial and regulatory safety emphasis. In chapter 6.1 an overview is provided of incidents in the Prince Rupert area between 1999–2008.
6.1 Review of incidents in study area In order to better understand the effect local conditions may have on the overall incident frequency, DNV examined incidents occurring in the study area, as shown below in Figure 9.
The figure plots the location of incidents (marked as green stars) that occurred between 1999 and 2008 in the Western Region (Source: TSB 2009). Only incidents that have resulted in damage to vessels over 1,000 gross tons are shown below as these are comparable in size to the vessels planned to be used for operation to/from a Ridley Island terminal. The information and data presented is based on statistics for the years 2000 to 2010 obtained from the Lloyd’s Register Fairplay Incident database and World Fleet Statistics (Source: IHS Fairplay Global Maritime Statistics 2011), and the International Tanker Owners Pollution Federation Ltd (Source: ITOPF 2009) which also included statistics up to 2008. Incidents/accidents registered in Loyds Register Fairplay (LRFP) for double hull tankers have all happened to vessels larger than 1,000 gross tons, and the tanker accident frequencies are established for vessels from 10,000 dwt and upwards.
28
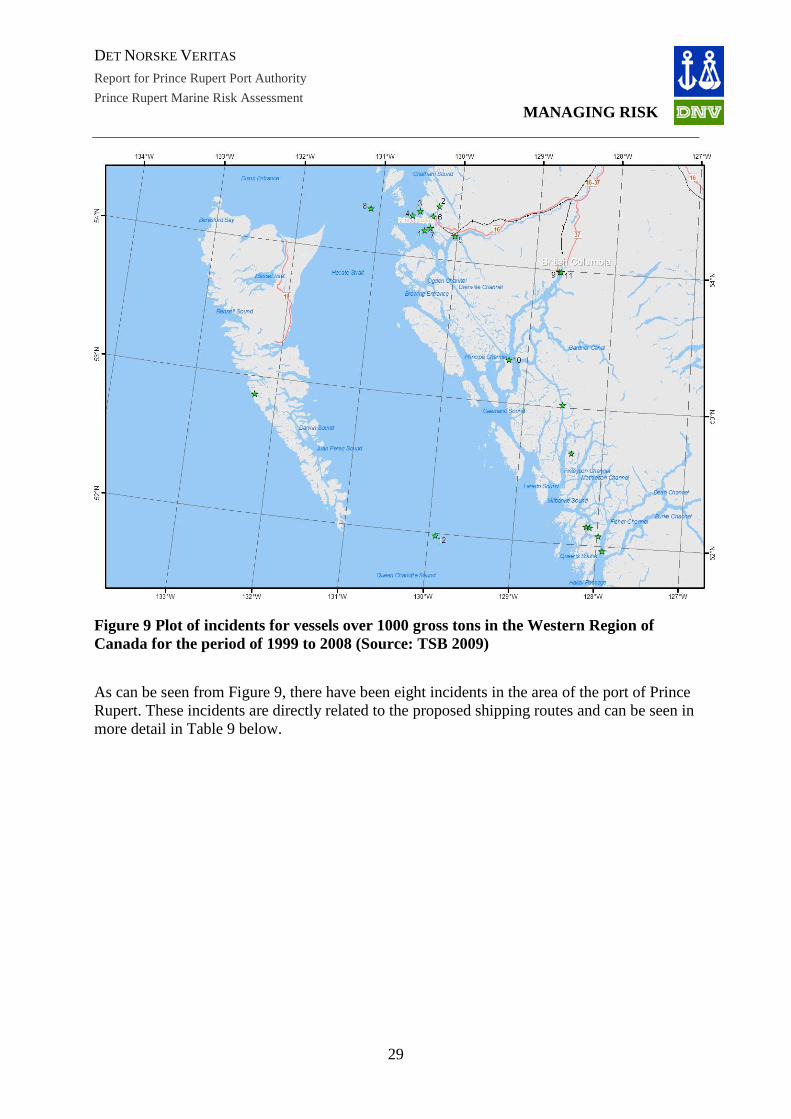
DET NORSKE VERITAS
Report for Prince Rupert Port Authority
MANAGING RISK Prince Rupert Marine Risk Assessment
Figure 9 Plot of incidents for vessels over 1000 gross tons in the Western Region of Canada for the period of 1999 to 2008 (Source: TSB 2009)
As can be seen from Figure 9, there have been eight incidents in the area of the port of Prince Rupert. These incidents are directly related to the proposed shipping routes and can be seen in more detail in Table 9 below.
29

DET NORSKE VERITAS
Report for Prince Rupert Port Authority
MANAGING RISK Prince Rupert Marine Risk Assessment
ID Date Location Incident type
Ship type Gross tonnage
Damage severity
1 9-Apr 1999
SE of Kinahan Islands
Grounding, taking water
Bulk carrier 87,803 Extensive
2 20-Mar 2000
Prince Rupert Grounding Bulk carrier 20,433 Considerable
3 18-Jun 2001
Duncan Bay Striking General cargo & container
30,745 Minor
4 6-Jan 2004
Lucy Island, Chatham Sound
Capsize Barge 1,617 Extensive
5 16-Jun 2004
New Westminster Striking Barge 2,141 Minor
6 10-Sep 2005
Prince Rupert Harbour
Striking Passenger 50,764 Minor
7 11-Mar 2008
Prince Rupert Taking water Barge 4,411 Considerable
8 5-May 2008
Rose Spit Struck by another vessel
Bulk carrier 35,899 Some
Table 9 Details of incidents near Prince Rupert, BC for vessels over 1000 gross tons for the period of 1999 to 2008 (Source: TSB 2009)
30

DET NORSKE VERITAS
Report for Prince Rupert Port Authority
MANAGING RISK Prince Rupert Marine Risk Assessment
7 HAZARD IDENTIFICATION This describes the methodology and findings from the HAZID process completed as a part of the navigational risk assessment. The identification involved the following parts:
- HAZID workshop
- Hazard evaluation of the proposed routes
- Meetings and discussion with local stakeholders
- Risk scenario identification and description.
7.1 HAZID workshop A HAZID workshop was held in Prince Rupert, British Columbia, September 14th, 2011 with local maritime experts to identify local hazards to the proposed routes and to assess how the hazards could influence risk to the existing transportation to and from the Prince Rupert harbour.
HAZID workshops are commonly used in the risk industry to incorporate local knowledge into an assessment such as the one summarized in this report. The goals of the HAZID included identification of credible causes of relevant marine incidents and a qualitative assessment of the frequency and consequence of each cause in order to capture the effect of local conditions. Results from the HAZID are used in chapter 8 to forecast future incident frequencies for the PR area and is a helpful component of this particular navigational risk assessment due to the lack of statistically valid local frequencies.
7.1.1 HAZID participants A group of local experts knowledgeable of the area of Prince Rupert was assembled. Members of the team had experience of piloting and conning vessels to and from the Prince Rupert harbour and working on marine projects in the Prince Rupert and BC coast areas. DNV believe that the team assembled for the exercise comprised a significant body of both risk and local knowledge. The team comprised:
Gary Paulson - VP Operations, Prince Rupert Port Authority Lorne Keller – VP Project Development, Prince Rupert Port Authority Steve Robin - Marine Operations Supervisor, Prince Rupert Port Authority Joe Ralph – Patrol Vessel Operator - Operates Prince Rupert patrol vessel, Prince Rupert Port Authority Fred Denning – VP, BC Coast Pilot Art Statham – Officer in Charge, MCTS Prince Rupert Mike Stevensen – Harbour tug and towing
31
DET NORSKE VERITAS
Report for Prince Rupert Port Authority
MANAGING RISK Prince Rupert Marine Risk Assessment
The HAZID was facilitated by: Viktor Friberg, Facilitator – DNV David Pertuz, Facilitator – DNV Tim Fowler, Navigational Risk expert – DNV (Live Meeting) Sheryl Lawry, Scribe – DNV
7.2 Risk Scenarios The workshop identified four different base scenarios resulting from the introduction of oil and LNG carriers to the Prince Rupert Gateway. These scenarios do not mean other scenarios are excluded from further evaluation. The detailed description of each scenario can be seen in appendix 4. The four identified base scenarios that were applied to two different types of vessels (Aframax oil tanker and Q-Max LNG carrier) resulting in eight risk scenarios. The 4 base scenarios are:
1. Mechanical failure (Steering) resulting in a powered grounding
An outbound Aframax/Q-max vessel having completed loading operations of crude oil/LNG departs the Ridley Island (hypothetically) in route to an overseas destination. A tethered tug assists the vessel get underway and during its initial leg of the outbound journey, then it releases its line. The vessel transit is normal as it passes south of the Kinahan Islands. The vessel heading is 255 ° T, transiting at 15 knots when the pilots issues a command to begin altering the course to 260 ° following the deepwater channel south of Rachel Islands. The wheelman acknowledges the command, after several seconds the wheelman reports that the rudder is not responding and he will manually switch the secondary (redundant system) hydraulic system, confusion ensues as the pilot has trouble understanding the wheelman (due to language) and the master of the vessel attends to the issue and fails to explain the situation to the pilot. Meanwhile the pilot from experience recognizes the imminent casualty and orders a reduction of speed and anchors on standby as the vessel gets close to a critical change of direction point. The confusion delays the switching to the secondary system. By the time rudder control is restored the vessel reaches shallow ground south of the Kinahan islands and just north of Greentop. Its anchors are not deployed.
2. Human error resulting in a collision
An outbound Aframax/Q-max vessel having completed loading operations departs the Ridley Island terminal (hypothetically) in route to an overseas destination. Vessel is traveling at night with light rain. A tethered tug assists the vessel get underway and during its initial leg of the outbound journey, then it releases its line. The vessel transit is normal as it passes south of the Kinahan Islands. The vessel heading is 255 ° T, transiting at 15 knots when the pilots issues a command to begin altering the course to 260 ° following the deep water channel south of Rachel Islands. The wheelman acknowledges the command, and successfully alters course as directed. Prior to the turn, the pilot observes on radar a vessel transiting northbound via the Malacca passage currently in a collision course. The master initiates contact with the vessel identified on AIS as a pleasure craft transiting at approximately 20 knots. The pilot’s attention is on negotiating the course alteration
32
DET NORSKE VERITAS
Report for Prince Rupert Port Authority
MANAGING RISK Prince Rupert Marine Risk Assessment
ensuring the vessel is on the right course. Master’s attempts to raise the pleasure craft are unsuccessful and both vessels continue in a collision course. Pilot orders reduction of speed to allow the pleasure craft to cross ahead and maintains course. Inexplicably the pleasure craft, a large yacht, alters course to starboard as to cross behind the vessel thus placing the vessels in an imminent collision course. The pilot maintains the vessel on course as is restricted by the waterway as it approaches the Rachel Islands. The yacht collides and glances off the stern of the vessel.
3. Human factor resulting in a powered grounding (pilot incapacitation)
An Aframax/Q-max vessel is outbound with a full load. The vessel heading is 310 ° T, following the deep water channel South of Rachael Islands transiting at 15 knots towards Triple Island pilots boarding area. Wheelman maintains course as per last pilot command. All seems normal as the vessel approaches the Rushton Islands. Then the wheelman and captain notice the vessel transit will take them very close to navigational aid Bell D72. Master calls upon the pilot who is sitting in a captain chair. The pilot is unresponsive and the master orders the engines slow as he tries to get a reaction from the pilot. The vessel runs aground in the vicinity of Rushton Island.
4. Environmental factor resulting in a drift grounding (severe weather/ high winds)
An Aframax/Q-max vessel completed loading operations and has to move to anchorage X due to illness of the master. As required by port practices, the vessel maintains bridge watches, monitors channel 71, has engines ready for immediate maneuvering, in ballast and second anchor ready for letting go. MCTS issues a gale warning winds, strong winds are expected to occur in the PR area. Weather is described as strong gale out of the southeast, with heavy rain. The second officer reports the vessel is dragging anchor from the strong winds. The second anchor is let go and the engine is put at slow ahead, however due to excessive strain on the anchor chain, the starboard anchor chain snaps and is lost. The vessel begins a slow drift towards the Kinahan Islands dragging the port anchor. The vessel attempts to maintain control with full engine power, but her drift towards the Kinahan Islands continues and the second anchor is lost. After several minutes of drifting and numerous attempts to gain control of the vessel a moderate shock is felt as the vessel runs aground and the engine is stopped. The severe weather continued causing the vessel to continue impacting the ground. A crew member reports a strong smell of fuel.
These scenarios have been used as input to the frequency and consequence assessment that can be seen in chapter 8 and 9.
33

DET NORSKE VERITAS
Report for Prince Rupert Port Authority
MANAGING RISK Prince Rupert Marine Risk Assessment
8 FREQUENCY ASSESSMENT
In the following chapter the frequencies for an incident are discussed. The frequency assessment has been assessed as the frequency of an incident occurring during passage to and from the proposed terminal at Ridley Island.
Base frequencies are taken from LRFP database and each of the four incident categories discussed in this chapter are summarized below in Table 10.
Incident Frequency* Unit
Grounding frequency (worldwide)
5.53 E-03 Per ship year
Collision frequency (worldwide)
6.72 E-03 Per ship year
Foundering frequency (worldwide)
3.36 E-05 Per ship year
Fire and/or explosion frequency (worldwide)
2.41 E-03 Per ship year
Table 10 Base worldwide tanker incident frequencies (Source: LRFP 2007) Note: *In the table 5.53 E-03 is equivalent to 0.00553, and 3.36E-04 is equivalent to 0.0000336.
In the above table frequencies are defined in terms of incidents per ship year. A ship year is defined as one ship operating for one year. An incident frequency of 0.0067 per ship year (6.7E-03) equates to one incident on average every 150 years per ship (1/6.7E-03 ~150).
8.1 Assumptions on sailing time and sailing distances relevant to incidents Using the per voyage method for the navigational risk assessment necessitates transforming annual frequencies into frequencies per nautical mile travelled in coastal waters by vessels. To complete this transformation some assumptions related to the distance a vessel sails every year are required.
The assumptions can be seen in the tables presented in the following chapters. The reasons behind these assumptions and further explanations can be seen in Appendix 3.
8.2 K Factors As described in Chapter 3, the frequency assessment involves assessment of K factors to take local conditions (e.g. wind, current and ship traffic) into consideration. K factors are multiplied with the incident frequencies described above to estimate the frequencies of incidents occurring in the approach to Prince Rupert harbour area and waters off the BC coast using the following formula:
34
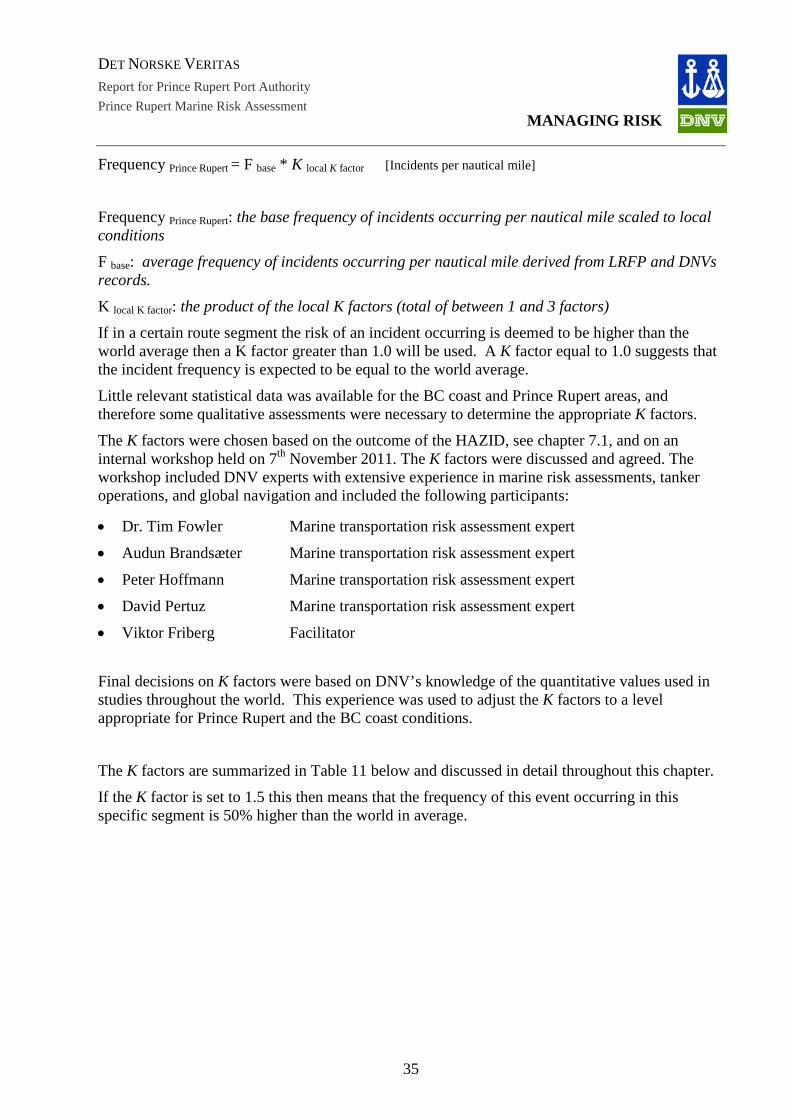
DET NORSKE VERITAS
Report for Prince Rupert Port Authority
MANAGING RISK Prince Rupert Marine Risk Assessment
Frequency Prince Rupert = F base * K local K factor [Incidents per nautical mile]
Frequency Prince Rupert: the base frequency of incidents occurring per nautical mile scaled to local conditions F base: average frequency of incidents occurring per nautical mile derived from LRFP and DNVs records. K local K factor: the product of the local K factors (total of between 1 and 3 factors) If in a certain route segment the risk of an incident occurring is deemed to be higher than the world average then a K factor greater than 1.0 will be used. A K factor equal to 1.0 suggests that the incident frequency is expected to be equal to the world average.
Little relevant statistical data was available for the BC coast and Prince Rupert areas, and therefore some qualitative assessments were necessary to determine the appropriate K factors.
The K factors were chosen based on the outcome of the HAZID, see chapter 7.1, and on an internal workshop held on 7th November 2011. The K factors were discussed and agreed. The workshop included DNV experts with extensive experience in marine risk assessments, tanker operations, and global navigation and included the following participants:
• Dr. Tim Fowler Marine transportation risk assessment expert
• Audun Brandsæter Marine transportation risk assessment expert
• Peter Hoffmann Marine transportation risk assessment expert
• David Pertuz Marine transportation risk assessment expert
• Viktor Friberg Facilitator
Final decisions on K factors were based on DNV’s knowledge of the quantitative values used in studies throughout the world. This experience was used to adjust the K factors to a level appropriate for Prince Rupert and the BC coast conditions.
The K factors are summarized in Table 11 below and discussed in detail throughout this chapter.
If the K factor is set to 1.5 this then means that the frequency of this event occurring in this specific segment is 50% higher than the world in average.
35
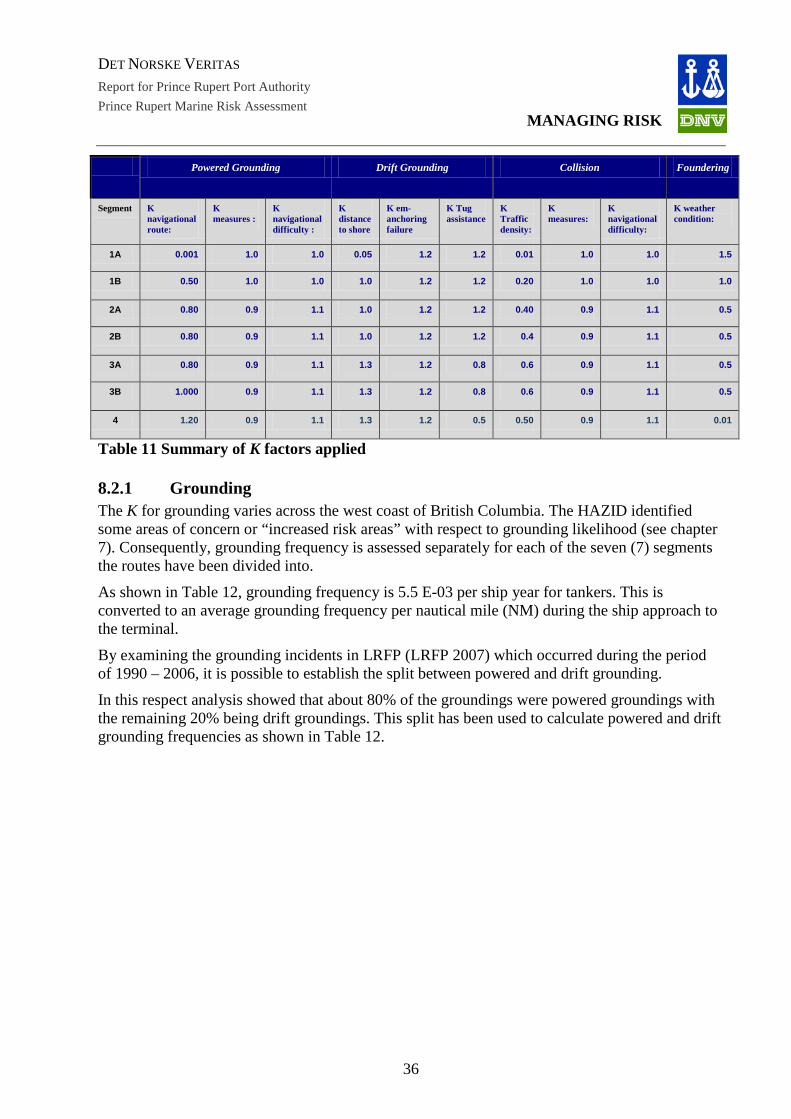
DET NORSKE VERITAS
Report for Prince Rupert Port Authority
MANAGING RISK Prince Rupert Marine Risk Assessment
Powered Grounding Drift Grounding Collision Foundering
Segment K navigational route:
K measures :
K navigational difficulty :
K distance to shore
K em-anchoring failure
K Tug assistance
K Traffic density:
K measures:
K navigational difficulty:
K weather condition:
1A 0.001 1.0 1.0 0.05 1.2 1.2 0.01 1.0 1.0 1.5
1B 0.50 1.0 1.0 1.0 1.2 1.2 0.20 1.0 1.0 1.0
2A 0.80 0.9 1.1 1.0 1.2 1.2 0.40 0.9 1.1 0.5
2B 0.80 0.9 1.1 1.0 1.2 1.2 0.4 0.9 1.1 0.5
3A 0.80 0.9 1.1 1.3 1.2 0.8 0.6 0.9 1.1 0.5
3B 1.000 0.9 1.1 1.3 1.2 0.8 0.6 0.9 1.1 0.5
4 1.20 0.9 1.1 1.3 1.2 0.5 0.50 0.9 1.1 0.01
Table 11 Summary of K factors applied
8.2.1 Grounding The K for grounding varies across the west coast of British Columbia. The HAZID identified some areas of concern or “increased risk areas” with respect to grounding likelihood (see chapter 7). Consequently, grounding frequency is assessed separately for each of the seven (7) segments the routes have been divided into.
As shown in Table 12, grounding frequency is 5.5 E-03 per ship year for tankers. This is converted to an average grounding frequency per nautical mile (NM) during the ship approach to the terminal.
By examining the grounding incidents in LRFP (LRFP 2007) which occurred during the period of 1990 – 2006, it is possible to establish the split between powered and drift grounding.
In this respect analysis showed that about 80% of the groundings were powered groundings with the remaining 20% being drift groundings. This split has been used to calculate powered and drift grounding frequencies as shown in Table 12.
36
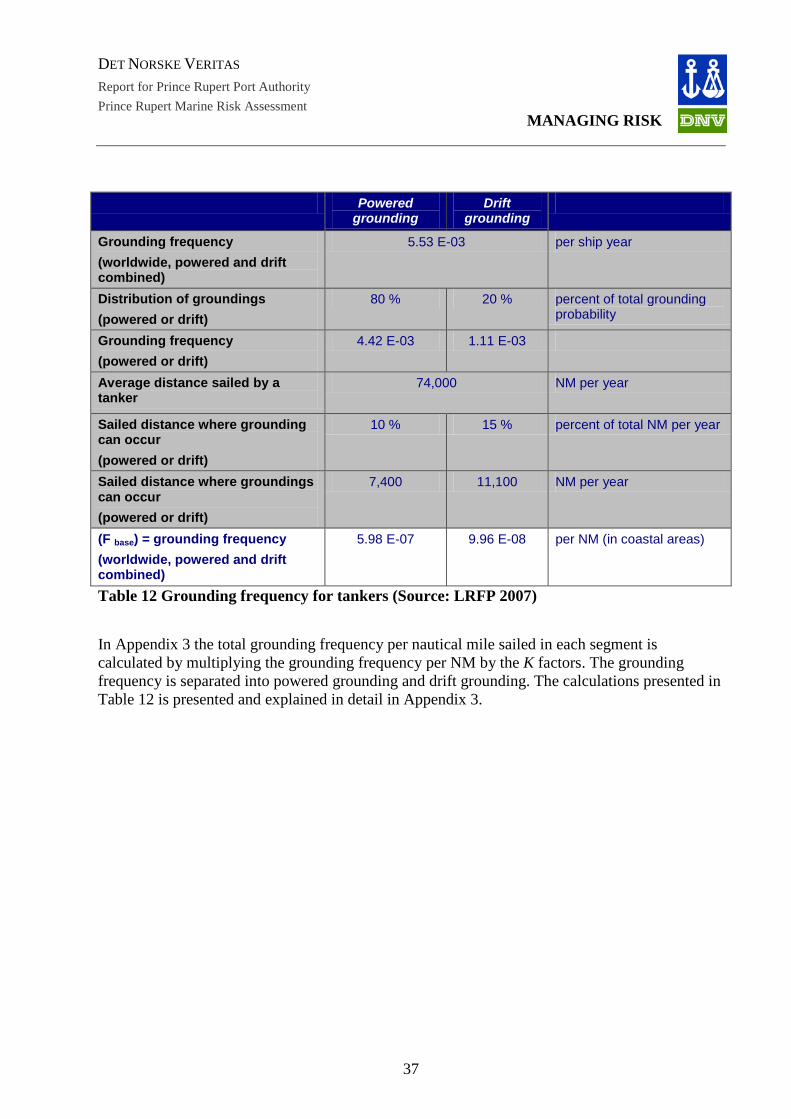
DET NORSKE VERITAS
Report for Prince Rupert Port Authority
MANAGING RISK Prince Rupert Marine Risk Assessment
Powered
grounding Drift
grounding
Grounding frequency (worldwide, powered and drift combined)
5.53 E-03 per ship year
Distribution of groundings (powered or drift)
80 % 20 % percent of total grounding probability
Grounding frequency (powered or drift)
4.42 E-03 1.11 E-03
Average distance sailed by a tanker
74,000 NM per year
Sailed distance where grounding can occur (powered or drift)
10 % 15 % percent of total NM per year
Sailed distance where groundings can occur (powered or drift)
7,400 11,100 NM per year
(F base) = grounding frequency (worldwide, powered and drift combined)
5.98 E-07 9.96 E-08 per NM (in coastal areas)
Table 12 Grounding frequency for tankers (Source: LRFP 2007)
In Appendix 3 the total grounding frequency per nautical mile sailed in each segment is calculated by multiplying the grounding frequency per NM by the K factors. The grounding frequency is separated into powered grounding and drift grounding. The calculations presented in Table 12 is presented and explained in detail in Appendix 3.
37

DET NORSKE VERITAS
Report for Prince Rupert Port Authority
MANAGING RISK Prince Rupert Marine Risk Assessment
8.2.1.1 Powered grounding frequencies per segment
The table below summarizes the effect of the factors that have been analyzed. It also summarizes the total powered grounding frequency per nautical mile in each segment.
K factor Segment
1A 1B 2A 2B 3A 3B 4 K navigational route
0.001 0.5 0.8 0.8 0.8 1.0 1.2
K measures 1.0 1.0 0.9 0.9 0.9 0.9 0.9
K navigational difficulty
1.0 1.0 1.1 1.1 1.1 1.1 1.1
Total K factor:
0.001 0.5 0.792 0.792 0.792 0.99 1.188
Powered grounding frequency per NM:
5.98E-10
2.99E-07 4.73E-07 4.73E-07 4.73E-07 5.92E-07 7.10E-07
Table 13 Incident frequencies per NM for powered grounding for tankers and LNG carriers
As can be seen in the table above the highest likelihood of powered grounding per nautical mile sailed, is in segment 4. For segment 4, the frequency of a powered grounding is 7.10E-7 or 0.000000710. This means that the analysis predicts that the average incident frequency will be once every 1,400,000 nautical miles sailed in Segment 4. 1,400,000 NM divided by the length of Segment 4 (3 NM) equals 469,000. The analysis predicts an average of one incident per 469,000 transits of segment 4 by tankers and LNG carriers. Of the powered grounding incidents that may occur, only some will result in a spill or personal injury occurring, as described in chapter 9.
8.2.1.2 Drift grounding frequencies per segment
The table below summarizes the effect of the factors that have been analyzed. It also summarizes the total drift grounding frequency per nautical mile in each segment.
K factor Segment
1A 1B 2A 2B 3A 3B 4 K distance to shore 0.05 1.0 1.0 1.0 1.3 1.3 1.3
K em-anchoring 1.2 1.2 1.2 1.2 1.2 1.2 1.2
K tug assistance 1.2 1.2 1.2 1.2 0.8 0.8 0.5
Total K factor:
0.072 1.44 1.44 1.44 1.248 1.248 0.78
Drift grounding frequency per NM:
7.17E-09
1.43E-07 1.43E-07 1.43E-07 1.24E-07 1.24E-07 7.77E-08
Table 14 Incident frequencies for drift grounding for tankers
38
DET NORSKE VERITAS
Report for Prince Rupert Port Authority
MANAGING RISK Prince Rupert Marine Risk Assessment
As can be seen in the table above the likelihood of drift grounding per nautical mile sailed is quite similar for most segments, except for segment 1A where the likelihood is considerably lower.
8.2.2 Collision Collision is caused by navigational failure of one or both vessels involved in the collision. One important factor that influences the collision frequency is the density of vessel traffic. Simplified models of ship collision predict that the likelihood of collision increases with the vessel density squared (if the density doubles, the likelihood of a collision quadruples). Other factors that influence the collision frequency are the quality of the crew’s navigational skills, traffic separation, environmental conditions (visibility), support from VTS and the use of pilots.
The collision frequency based on LRFP represents the average collision frequency for the tanker fleet in worldwide trade. In order to make the frequency specific for the Prince Rupert area, the collision frequency is adjusted to local conditions.
The frequency does not separate whether the vessel struck another vessel or if it was struck. This is a conservative assumption and is an important factor in the assessment of consequences discussed in chapter 9. Collision frequency (worldwide) 6.72 E-03 per ship year
Average distance sailed by a tanker 74,000 NM per year
Distance sailed where collision can occur (near coastal) 20 % percent of total
Distance sailed where collision can occur (near coastal) 14,800 NM per year
Fbase = collision frequency (worldwide) 4.54 E-07 per NM
Table 15 Collision frequency for tankers (Source: LRFP 2007)
The collision frequency is adjusted with respect to traffic density, mitigating measures (pilot, VTS and traffic separation) and navigational difficulty (visibility, markings, and currents). The calculation is shown in Appendix 3.
39
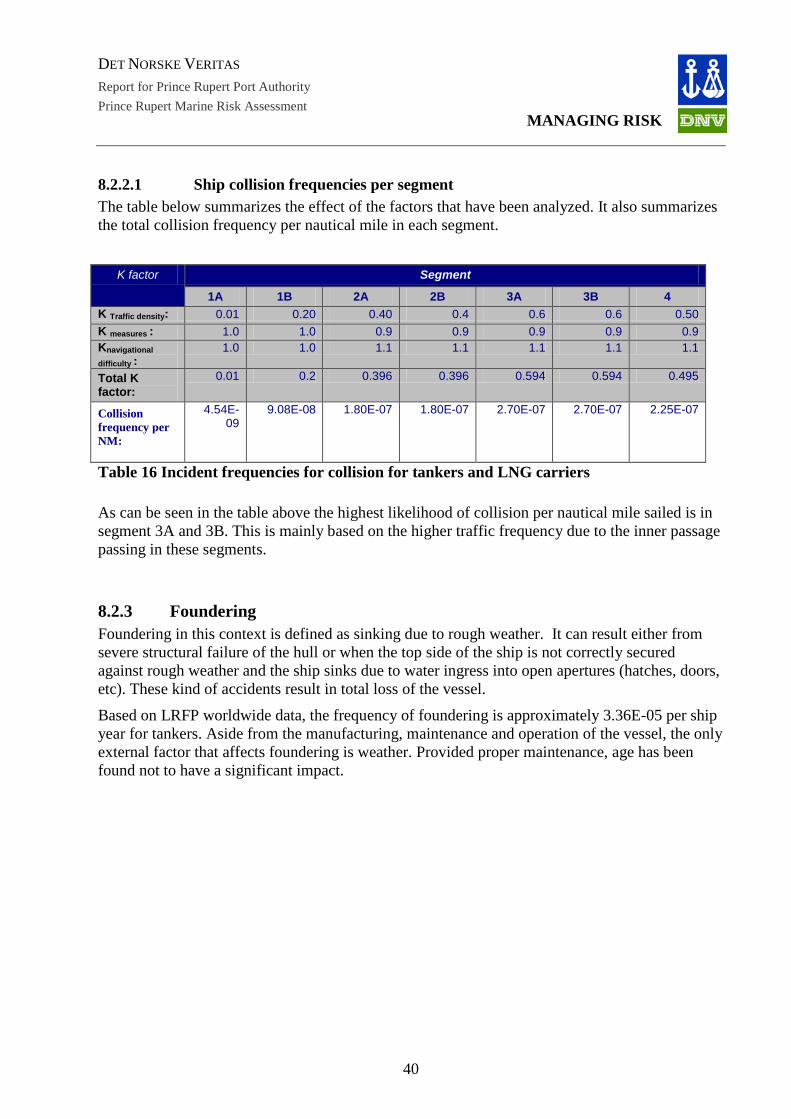
DET NORSKE VERITAS
Report for Prince Rupert Port Authority
MANAGING RISK Prince Rupert Marine Risk Assessment
8.2.2.1 Ship collision frequencies per segment The table below summarizes the effect of the factors that have been analyzed. It also summarizes the total collision frequency per nautical mile in each segment.
K factor Segment
1A 1B 2A 2B 3A 3B 4 K Traffic density: 0.01 0.20 0.40 0.4 0.6 0.6 0.50
K measures : 1.0 1.0 0.9 0.9 0.9 0.9 0.9 Knavigational difficulty :
1.0 1.0 1.1 1.1 1.1 1.1 1.1
Total K factor:
0.01 0.2 0.396 0.396 0.594 0.594 0.495
Collision frequency per NM:
4.54E-09
9.08E-08 1.80E-07 1.80E-07 2.70E-07 2.70E-07 2.25E-07
Table 16 Incident frequencies for collision for tankers and LNG carriers As can be seen in the table above the highest likelihood of collision per nautical mile sailed is in segment 3A and 3B. This is mainly based on the higher traffic frequency due to the inner passage passing in these segments.
8.2.3 Foundering Foundering in this context is defined as sinking due to rough weather. It can result either from severe structural failure of the hull or when the top side of the ship is not correctly secured against rough weather and the ship sinks due to water ingress into open apertures (hatches, doors, etc). These kind of accidents result in total loss of the vessel.
Based on LRFP worldwide data, the frequency of foundering is approximately 3.36E-05 per ship year for tankers. Aside from the manufacturing, maintenance and operation of the vessel, the only external factor that affects foundering is weather. Provided proper maintenance, age has been found not to have a significant impact.
40

DET NORSKE VERITAS
Report for Prince Rupert Port Authority
MANAGING RISK Prince Rupert Marine Risk Assessment
The frequency of foundering increases with harsh weather and large waves in open sea areas. Once inside coastal channels the size of waves and the forces acting on the tanker decrease. Therefore, only the nautical miles sailed in open waters are relevant when examining the risk of foundering.
Foundering frequency (worldwide) 3.36 E-05 per ship year
Average distance sailed by a tanker 74,000 NM per year
Sailed distance where foundering can occur (powered or drift) 90% percent of total
Sailed distance where foundering can occur (powered or drift) 66,600 NM per year
Foundering frequency (worldwide) 5.04 E-10 per NM
Table 17 Foundering frequency for tankers (Source: LRFP 2007)
The foundering frequency per NM is adjusted with respect to weather conditions. These calculations are presented in Appendix 3.
8.2.3.1 Foundering Frequencies per segment The table below summarizes the effect of the factors that have been analyzed. It also summarizes the total foundering frequency per nautical mile in each segment.
K factor Segment
1A 1B 2A 2B 3A 3B 4 K weather condition:
1.5 1 0.5 0.5 0.5 0.5 0.01
Total K factor:
1.5 1 0.5 0.5 0.5 0.5 0.01
Foundering frequency per NM:
7.58E-10
5.05E-10 2.53E-10 2.53E-10 2.53E-10 2.53E-10 5.05E-12
Table 18 Incident frequencies for foundering per nautical mile
As can be seen in the table above the frequency for foundering is extremely small in all segments. The segment with the highest frequency is segment 1A due to open water area with higher waves than the other segments.
41
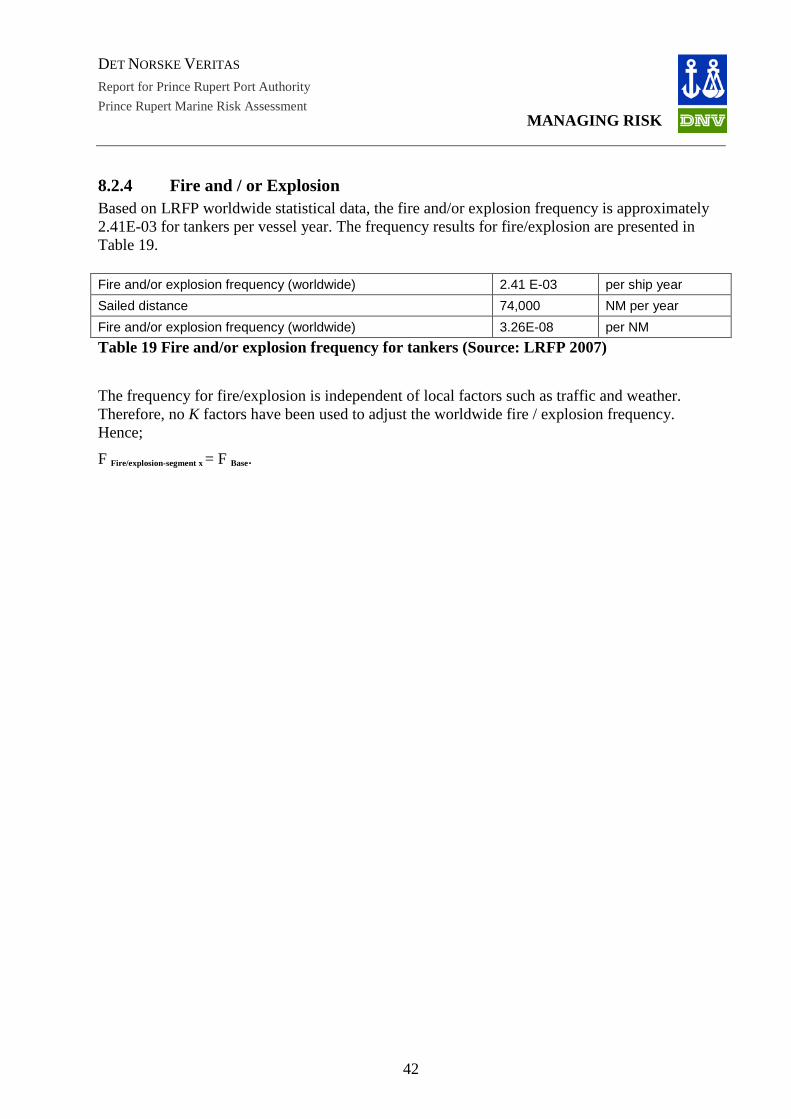
DET NORSKE VERITAS
Report for Prince Rupert Port Authority
MANAGING RISK Prince Rupert Marine Risk Assessment
8.2.4 Fire and / or Explosion Based on LRFP worldwide statistical data, the fire and/or explosion frequency is approximately 2.41E-03 for tankers per vessel year. The frequency results for fire/explosion are presented in Table 19.
Fire and/or explosion frequency (worldwide) 2.41 E-03 per ship year
Sailed distance 74,000 NM per year
Fire and/or explosion frequency (worldwide) 3.26E-08 per NM
Table 19 Fire and/or explosion frequency for tankers (Source: LRFP 2007)
The frequency for fire/explosion is independent of local factors such as traffic and weather. Therefore, no K factors have been used to adjust the worldwide fire / explosion frequency. Hence;
F Fire/explosion-segment x = F Base.
42
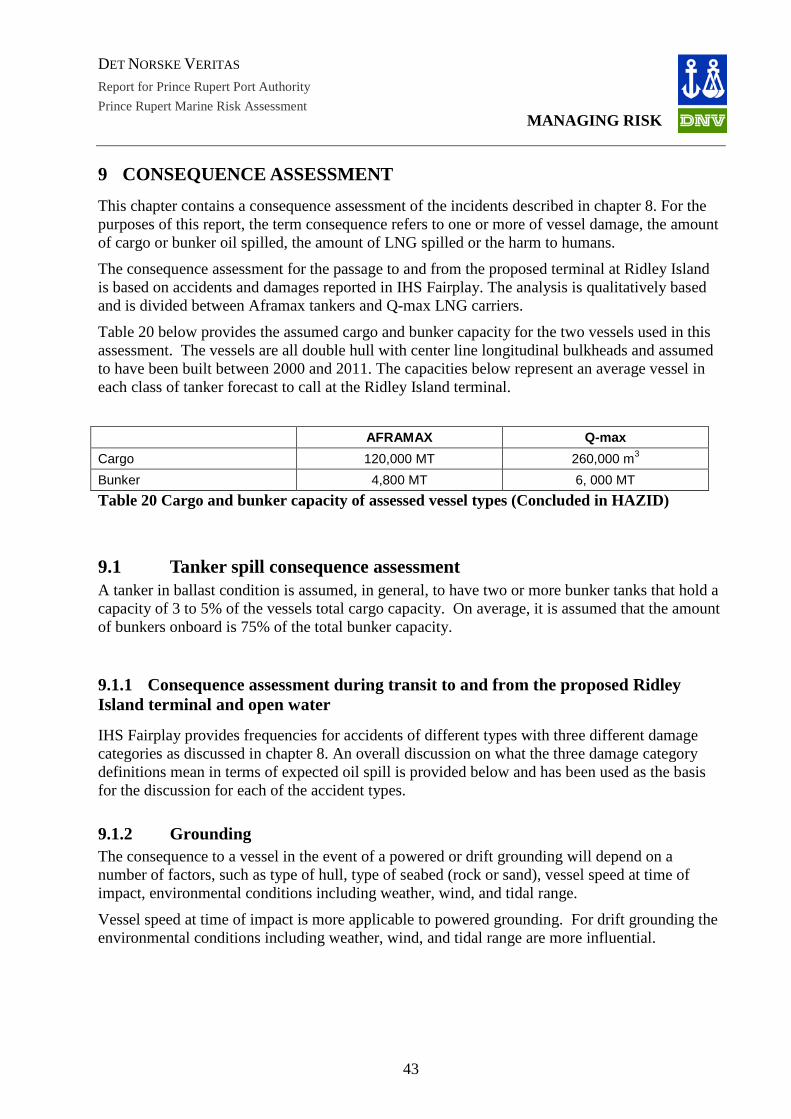
DET NORSKE VERITAS
Report for Prince Rupert Port Authority
MANAGING RISK Prince Rupert Marine Risk Assessment
9 CONSEQUENCE ASSESSMENT This chapter contains a consequence assessment of the incidents described in chapter 8. For the purposes of this report, the term consequence refers to one or more of vessel damage, the amount of cargo or bunker oil spilled, the amount of LNG spilled or the harm to humans.
The consequence assessment for the passage to and from the proposed terminal at Ridley Island is based on accidents and damages reported in IHS Fairplay. The analysis is qualitatively based and is divided between Aframax tankers and Q-max LNG carriers.
Table 20 below provides the assumed cargo and bunker capacity for the two vessels used in this assessment. The vessels are all double hull with center line longitudinal bulkheads and assumed to have been built between 2000 and 2011. The capacities below represent an average vessel in each class of tanker forecast to call at the Ridley Island terminal.
AFRAMAX Q-max
Cargo 120,000 MT 260,000 m3
Bunker 4,800 MT 6, 000 MT
Table 20 Cargo and bunker capacity of assessed vessel types (Concluded in HAZID)
9.1 Tanker spill consequence assessment A tanker in ballast condition is assumed, in general, to have two or more bunker tanks that hold a capacity of 3 to 5% of the vessels total cargo capacity. On average, it is assumed that the amount of bunkers onboard is 75% of the total bunker capacity.
9.1.1 Consequence assessment during transit to and from the proposed Ridley Island terminal and open water
IHS Fairplay provides frequencies for accidents of different types with three different damage categories as discussed in chapter 8. An overall discussion on what the three damage category definitions mean in terms of expected oil spill is provided below and has been used as the basis for the discussion for each of the accident types.
9.1.2 Grounding The consequence to a vessel in the event of a powered or drift grounding will depend on a number of factors, such as type of hull, type of seabed (rock or sand), vessel speed at time of impact, environmental conditions including weather, wind, and tidal range.
Vessel speed at time of impact is more applicable to powered grounding. For drift grounding the environmental conditions including weather, wind, and tidal range are more influential.
43

DET NORSKE VERITAS
Report for Prince Rupert Port Authority
MANAGING RISK Prince Rupert Marine Risk Assessment
9.1.2.1 Probability of Oil Spill The frequency distribution between minor damage, major damage and total loss, as recorded in LRFP, is shown in Table 21 below. The conditional probability of a spill, or the probability a spill results provided an incident has already occurred, is based on the discussion that follows.
Damage Category
Description Frequency distribution
(%)
Conditional probability of spill (%)
laden ballast total loss the vessel is damaged beyond repair from
an insurance perspective 2.4 100 100
major damage Damage through the outer hull. 40.4 75 10
minor damage small indents that do not penetrate the outer hull
57.2 0 0
Total 32.7 6.4
Table 21 Material damage from grounding and conditional probability of spill (Source: LRFP 2007)
In Table 21 above, and the tables that follow in this chapter, the numbers in frequency distribution column are derived directly from LRFP worldwide statistics. The conditional probability of a spill is based on DNV research and assessments of spill to damage data. The term conditional probability refers to the probability there will be a spill conditional on the fact an incident has already occurred. The total in the bottom row is the conditional probability multiplied by the frequency distribution (i.e. 2.4% x 100% + 40.4% x 75% = 32.7%). This means that a spill is predicted to occur 32.7% of the time there is a grounding incident involving a laden tanker.
9.1.3 Collision When assessing a spill resulting from a collision the vessel used in the assessment is assumed to have been struck by another vessel. This is a conservative, worst case, scenario as the vessel struck is likely to suffer greater damage than the other vessel.
The distribution of consequences given a collision occurs are provided in Table 22 below. Conservative assumptions have been made given that the exact nature of the collision will have great impact on whether a spill occurs and what size of spill occurs.
44
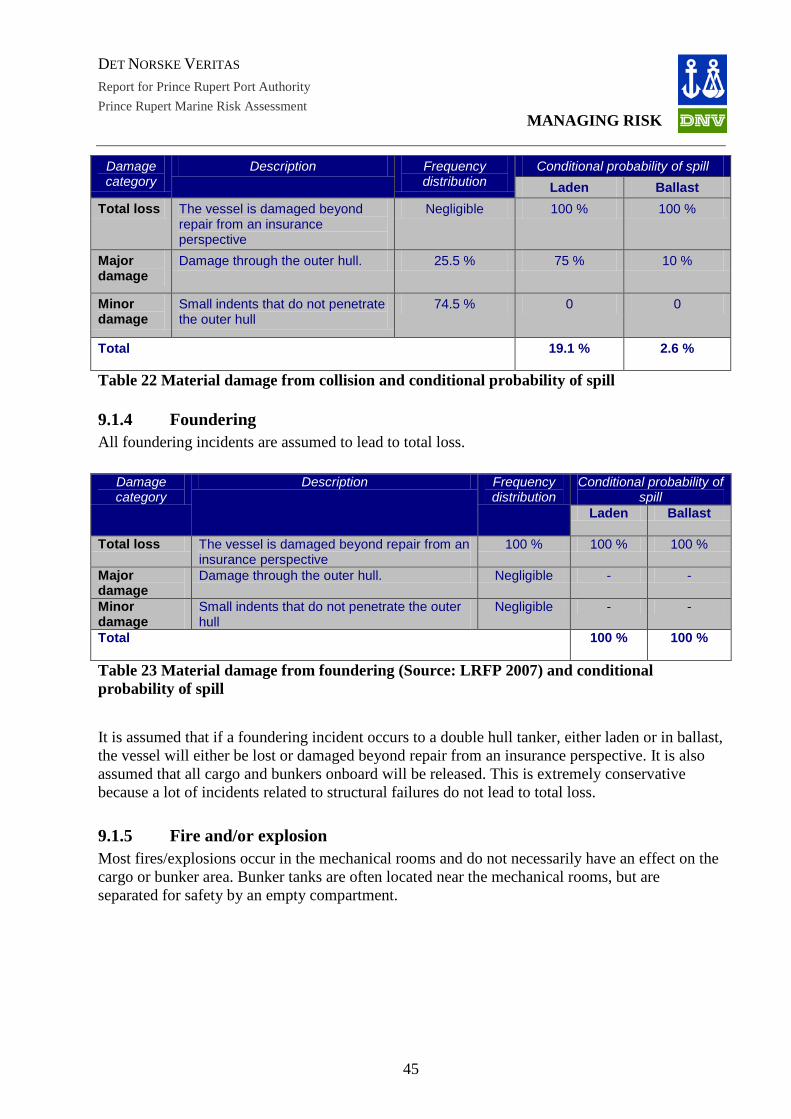
DET NORSKE VERITAS
Report for Prince Rupert Port Authority
MANAGING RISK Prince Rupert Marine Risk Assessment
Damage category
Description Frequency distribution
Conditional probability of spill Laden Ballast
Total loss The vessel is damaged beyond repair from an insurance perspective
Negligible 100 % 100 %
Major damage
Damage through the outer hull. 25.5 % 75 % 10 %
Minor damage
Small indents that do not penetrate the outer hull
74.5 % 0 0
Total 19.1 % 2.6 %
Table 22 Material damage from collision and conditional probability of spill
9.1.4 Foundering All foundering incidents are assumed to lead to total loss.
Damage category
Description Frequency distribution
Conditional probability of spill
Laden Ballast
Total loss The vessel is damaged beyond repair from an insurance perspective
100 % 100 % 100 %
Major damage
Damage through the outer hull. Negligible - -
Minor damage
Small indents that do not penetrate the outer hull
Negligible - -
Total 100 % 100 %
Table 23 Material damage from foundering (Source: LRFP 2007) and conditional probability of spill
It is assumed that if a foundering incident occurs to a double hull tanker, either laden or in ballast, the vessel will either be lost or damaged beyond repair from an insurance perspective. It is also assumed that all cargo and bunkers onboard will be released. This is extremely conservative because a lot of incidents related to structural failures do not lead to total loss.
9.1.5 Fire and/or explosion Most fires/explosions occur in the mechanical rooms and do not necessarily have an effect on the cargo or bunker area. Bunker tanks are often located near the mechanical rooms, but are separated for safety by an empty compartment.
45

DET NORSKE VERITAS
Report for Prince Rupert Port Authority
MANAGING RISK Prince Rupert Marine Risk Assessment
Damage category
Description Frequency distribution
Conditional probability of spill
Laden Ballast
Total loss The vessel is damaged beyond repair from an insurance perspective
2.8 % 100 % 100 %
Major damage Large fire, spread to cargo area. Typically 1 tank is breached
48.4 % 50 % 10 %
Minor damage Small fire, with limit consequences. 48.8 % 0 0
Total 27 % 7.6 %
Table 24 Material damage from fire/explosion (Source: LRFP 2007) and conditional probability of spill
9.2 Tanker fatality consequence assessment According to LRFP, only 4 fatalities have been reported for double hull tankers in 1990-2007. One of the accidents in question was a terrorist attack and has been included as war loss/hostilities given a fatality frequency of 1.2E-04 per vessel year.
The LRFP database only report fatalities caused by ship accidents, however, fatalities from occupational accidents also happens but has not been included in this report. Occupational accidents are defined as events affecting the crew without damaging the ship. They include falls, falling overboard, asphyxiation, electrocution, and being struck by moving objects, falling objects, mooring ropes and waves etc.
Accident type Fatalities/ vessel
year Fatalities/ person
year Collision
Contact
Foundering
Fire/explosion 2.2E-04 7.4E-06
Hull/Machinery/Equipment 1.5E-04 4.9E-06
War loss/Hostilities 7.4E-05 2.5E-06
Wrecked/Stranded
Miscellaneous
Total, excl. occup. accidents 4.4E-04 1.5E-05 Table 25 Annual fatality frequency for an oil tanker (Source: LRFP 2007) In average, one fatality is expected for every 2,200 ship years, or every 65,000 person years.
9.3 LNG release consequence assessment A DNV LNG Marine release Consequence Assessment study (Source: JSP, 2004) has been used as the main source for this chapter. The study was a Joint Sponsor Project (JSP) and included participants from several major industry players such as ExxonMobile, Marathon, Gaz de France, Shell, and TransCanada Pipelines.
46

DET NORSKE VERITAS
Report for Prince Rupert Port Authority
MANAGING RISK Prince Rupert Marine Risk Assessment
9.3.1 LNG Carrier Characteristics
For the purpose of this study, the following LNG carrier characteristics are applied:
Vessel type; Quatar Max (Q-max) LNG Carrier /Mark-III membrane design
Double Hull
Cargo tanks 5 independent tanks
Capacity: 266,000 cubic meters (9,400,000 cu ft),
Cargo Volume /Tank: 53,000 cubic meters
Gross Tonnage 162000 Tons
Summer DWT 125000 Tons
Beam 55 m
Depth 27 m
Draft 12 m
Freeboard 15 m
LOA 345 m Table 26 LNG characteristics
This size of these LNG Carriers is comparable to that of Very-Large Crude Carriers (VLCCs). Detailed explanation of the design of the LNG carriers assessed in this study can be found in Appendix 4.
9.3.2 Accident release scenarios
There are many possible outcomes from a release of hydrocarbon. In principle, only some are possible from any given release. This is related to what is often called the source term (the specific scenario defining a release) and what is a credible outcome. For example, a high pressure high temperature release of methane gas is quite different from a cold cryogenic release of methane liquid.
A release from an LNG carrier could lead to several serious hazardous outcomes. The discussion below indicates those phenomena believed to be relevant for LNG releases. DNV believes the primary phenomenon that should be modeled is shown in Figure 10. This describes the likely “phases” which will occur following a puncture of an LNG tank:
9.3.2.1 Outflow of non-pressurized LNG
LNG is stored in large membrane or spherical tanks at its atmospheric boiling point (approximately -162ºC). Any boil-off gas is collected, and in most ships, it is used for the ship’s power needs. Pressure relief valves are set at pressures to maintain a very low net positive pressure.
47

DET NORSKE VERITAS
Report for Prince Rupert Port Authority
MANAGING RISK Prince Rupert Marine Risk Assessment
Most spills from the storage tank will occur at atmospheric pressure plus any liquid head of LNG (i.e. the static liquid column above the point of release). The significance of this is that there is no pressure flashing of LNG to methane; phase change occurs due to very rapid heat transfer and boil-off.
In small spills of LNG discharged from height, much of the LNG will vaporize before reaching the water due to heat transfer with the air. For the very large spills considered here, air cannot transfer enough heat to vaporize much LNG so almost all the spill is likely to end up in a pool on the water surface. A special case relates to spills below the waterline. This is discussed in detail later, but DNV believes this will lead to a small positive pressure within the tank, sufficient to lift the relief valves but not sufficient to fail the tank’s pressure integrity.
9.3.2.2 Liquid Pool Formation
LNG spilled onto the water surface will simultaneously undergo several physical processes. These include pool formation, spread and boil-off.
Pool formation for cryogenic boiling liquids is a dynamic process balancing the LNG input rate, gravitational spread, surface tension effects, heat transfer and gas boil-off.
48
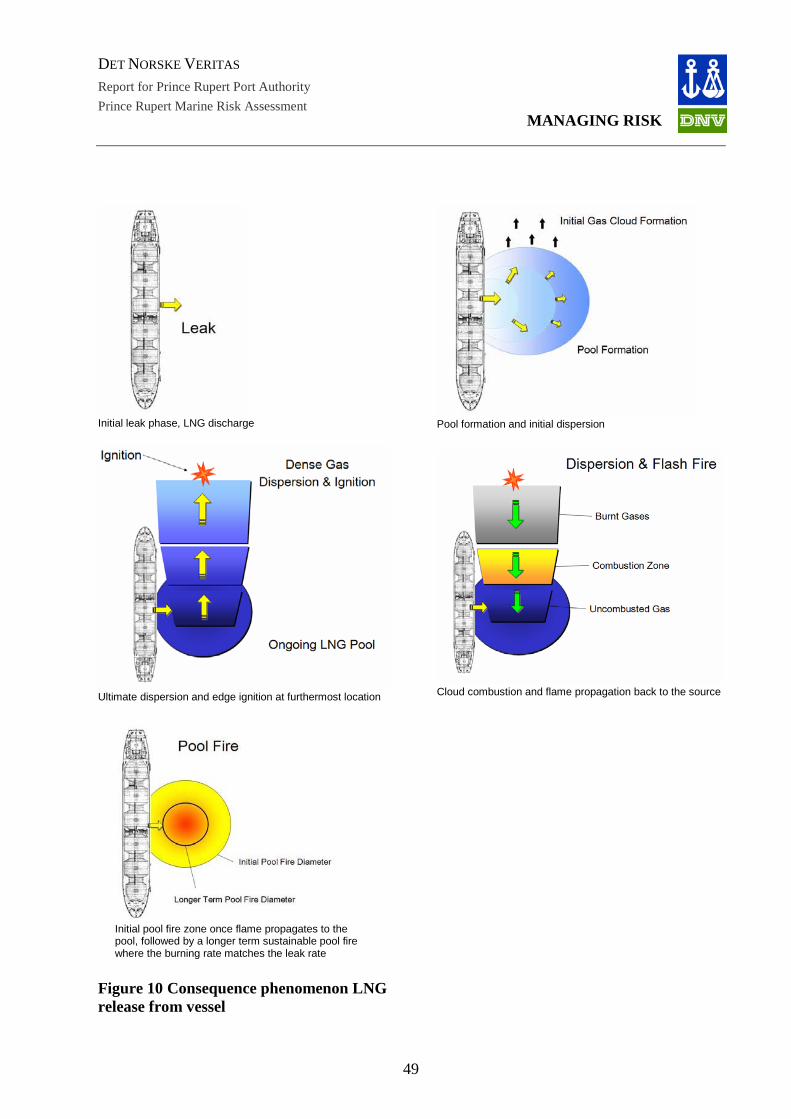
DET NORSKE VERITAS
Report for Prince Rupert Port Authority
MANAGING RISK Prince Rupert Marine Risk Assessment
Initial leak phase, LNG discharge
Pool formation and initial dispersion
Ultimate dispersion and edge ignition at furthermost location
Cloud combustion and flame propagation back to the source
Figure 10 Consequence phenomenon LNG release from vessel
Initial pool fire zone once flame propagates to the pool, followed by a longer term sustainable pool fire where the burning rate matches the leak rate
49
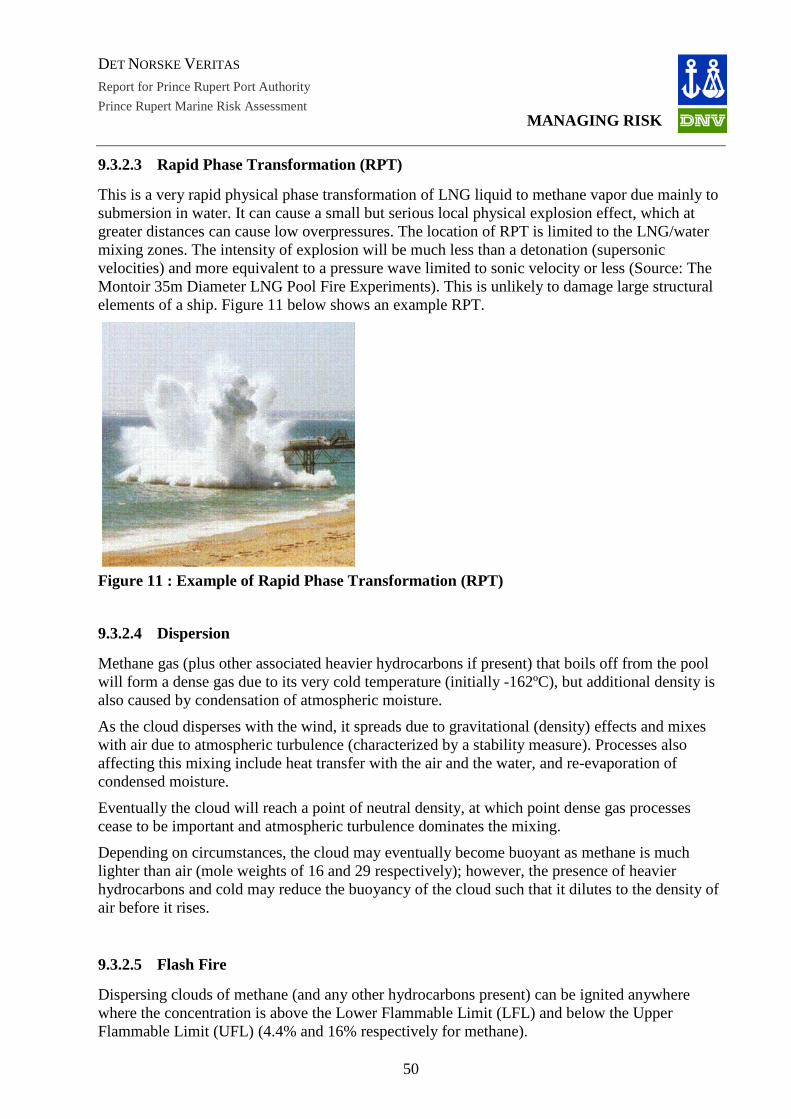
DET NORSKE VERITAS
Report for Prince Rupert Port Authority
MANAGING RISK Prince Rupert Marine Risk Assessment
9.3.2.3 Rapid Phase Transformation (RPT)
This is a very rapid physical phase transformation of LNG liquid to methane vapor due mainly to submersion in water. It can cause a small but serious local physical explosion effect, which at greater distances can cause low overpressures. The location of RPT is limited to the LNG/water mixing zones. The intensity of explosion will be much less than a detonation (supersonic velocities) and more equivalent to a pressure wave limited to sonic velocity or less (Source: The Montoir 35m Diameter LNG Pool Fire Experiments). This is unlikely to damage large structural elements of a ship. Figure 11 below shows an example RPT.
Figure 11 : Example of Rapid Phase Transformation (RPT)
9.3.2.4 Dispersion
Methane gas (plus other associated heavier hydrocarbons if present) that boils off from the pool will form a dense gas due to its very cold temperature (initially -162ºC), but additional density is also caused by condensation of atmospheric moisture.
As the cloud disperses with the wind, it spreads due to gravitational (density) effects and mixes with air due to atmospheric turbulence (characterized by a stability measure). Processes also affecting this mixing include heat transfer with the air and the water, and re-evaporation of condensed moisture.
Eventually the cloud will reach a point of neutral density, at which point dense gas processes cease to be important and atmospheric turbulence dominates the mixing.
Depending on circumstances, the cloud may eventually become buoyant as methane is much lighter than air (mole weights of 16 and 29 respectively); however, the presence of heavier hydrocarbons and cold may reduce the buoyancy of the cloud such that it dilutes to the density of air before it rises.
9.3.2.5 Flash Fire
Dispersing clouds of methane (and any other hydrocarbons present) can be ignited anywhere where the concentration is above the Lower Flammable Limit (LFL) and below the Upper Flammable Limit (UFL) (4.4% and 16% respectively for methane).
50
DET NORSKE VERITAS
Report for Prince Rupert Port Authority
MANAGING RISK Prince Rupert Marine Risk Assessment
The majority of clouds which are ignited do so at their edge as they disperse and meet a strong ignition source (e.g. open flame, internal combustion engine, sparks, etc). However, not all flammable clouds will ignite if an ignition source is not present.
An ignited cloud will “flash back” across all its flammable mass (i.e. that part within the flammable range – between the UFL and LFL). It will then burn at the UFL boundary until the entire hydrocarbon is consumed. This will almost always flash back to the source and ignite the pool. However, some reports indicate that cold methane vapor saturated with condensed moisture may be a relatively poor flammable material and some experiments report that LNG clouds can self-extinguish (Source: Radiation from Liquefied Gas Fires on Water, 1983). This work assumes all flammable clouds flash back to the source without extinguishing.
Flash fires zones move at different speeds through flammable clouds. Factors affecting this include the material flame speed, the concentration (maximum speed at stoichiometric concentrations, lower speeds at LFL and UFL), the temperature, condensed moisture, the degree of turbulence and the presence of congestion/objects that enhance turbulence. Many flash fires in uncongested areas move at relatively slow speeds, 10-20m/s, and some LNG flash fires have been reported as unable to progress against a 5m/s wind (Source: Radiation from Liquefied Gas Fires on Water, 1983). This low speed is likely due to the flame front occurring at the UFL where its speed would be lower. In order to generate a damaging overpressure, the flame front would need to accelerate to the order of 200m/s. In an uncongested situation such as a cloud over water, no such congestion exists.
Most flash fires will thus flash back to their source at relatively low speed and consume flammable material at a rate controlled by the availability of oxygen. The majority of thermal energy will be converted to heat combustion gases which will rise away from the cloud, but a significant fraction will also be radiated by the highly luminous flames. Many flash fires have occurred in industrial accidents in refineries and chemical plants and the impacts of these are very well modeled as the footprint of the LFL cloud extent. This is very serious for any person or small boat trapped within or immediately adjacent to the flammable cloud, but rarely are there any significant impacts beyond a few 10s of metres beyond the flammable envelope.
The flash fire when it reaches the evaporating spill of LNG will cause this to ignite and burn as a pool fire. These do generate significant thermal radiation, however large LNG fires will tend to be smoky and this smoke may absorb a substantial fraction of the thermal radiation and thus reduce that radiated outwards.
9.3.2.6 Fireball / BLEVE and Vapor Cloud Explosion
DNV has also evaluated mechanisms causing fireball, Boiling Liquid Expanding Vapor Explosion (BLEVE), or vapor cloud explosion. These types of events were concluded not to be expected for LNG carrier spills.
9.3.2.7 Conclusion on phenomena to model
DNV believes the following describes the key phases for modeling (see Figure 10).
Outflow of non-pressurized LNG DNV believes that there can be discharges of LNG above and below the waterline due to accidental or terrorism related threats (not assessed in this report).
51

DET NORSKE VERITAS
Report for Prince Rupert Port Authority
MANAGING RISK Prince Rupert Marine Risk Assessment
LNG pool formation DNV believes that this will lead to the formation of a large surface pool of rapidly boiling LNG.
Rapid phase transition Some cases of LNG spill will lead to a phenomenon called Rapid Phase Transition (RPT) which can cause small pressure impacts within a relatively limited range, but these will not be sufficient to cause long distance pressure impacts. They should also be insufficient in the space beside the vessel to lead to serious additional structural failure compared to the effect of the original event causing the leak.
Dense Vapor Dispersion The boiling pool of LNG will generate a vapor cloud of inherently buoyant but dense gas initially due to its cold temperature and condensation of atmospheric moisture. This cloud will disperse downwind. Lift-off due to buoyancy is theoretically possible, but may not occur before the cloud falls below its Lower Flammable Limit. Thus the cloud hugs the water surface for its entire flammable extent.
Flash Fire The flammable cloud can be ignited at its edge and cause a flash fire. In this case, DNV believes it will flash back to the source at relatively low speed (e.g. under 20 m/s) with no generation of overpressure nor sufficient combustion rate to cause a fireball. The main hazard, therefore, is to anyone or anything within, or adjacent to, the LFL boundary. People and objects a few 10s of meters outside of the flammable envelope should not experience any serious thermal impact.
Pool Fire The LNG pool will be ignited by the flash fire and burn until all the LNG is depleted (either in the pool or from the continuing leak point). It is likely that a thin pool due to gravitational spreading of the LNG spill will result. This means the fire may go out in some locations, but may spread to affect other areas (LNG pool fires on water are potentially mobile).
Other Consequence Types DNV did not identify any mechanism causing fireball, BLEVE, or vapor cloud explosion.
Thus, the serious hazard outcomes are associated with dispersion of methane vapor to its LFL. There can be edge ignition of the cloud and a flash fire event which is hazardous to everyone within, or close to, the flammable envelope. A pool fire will result around the point of leakage.
9.3.3 LNG cargo consequence conclusions This chapter contains a summary of the LNG cargo release consequence assessment of the accident stated in chapter 8, Frequency Assessment. The DNV study concludes the following potential consequences from potential incidents involving LNG carriers:
52

DET NORSKE VERITAS
Report for Prince Rupert Port Authority
MANAGING RISK Prince Rupert Marine Risk Assessment
Collision: • A bow to bow collision would have the greatest impact speed. However, this was not
considered credible as the last action of the master would be to try to avoid a collision by attempting to turn the ship.
• The worst case scenarios are likely to be a side impact into an LNG carrier by a large ship travelling at close to sea speed.
• The potential for loss of containment would also be influenced by the location of the impact. There is less variation in consequence for an impact to a membrane vessel for the length of the LNG tank. It was considered that in order to cause a breach of containment of the order of 250 mm to 1 m, it was necessary to have a rupture of approximately 3 m in the outer hull. Both puncture and bulk penetration holes are credible.
Grounding:
• The worst case grounding scenario is that the LNG carrier becomes stranded on the shore line and then breaks up under the action of waves and tide.
Fire and Explosion:
• No maximum credible fire on vessel event was defined.
9.3.4 LNG bunker consequence assessment
Statistics provided for oil tanker in ballast, chapter 9.1 is considered to be applicable for LNG bunker consequence for vessels both in laden and ballast condition.
53
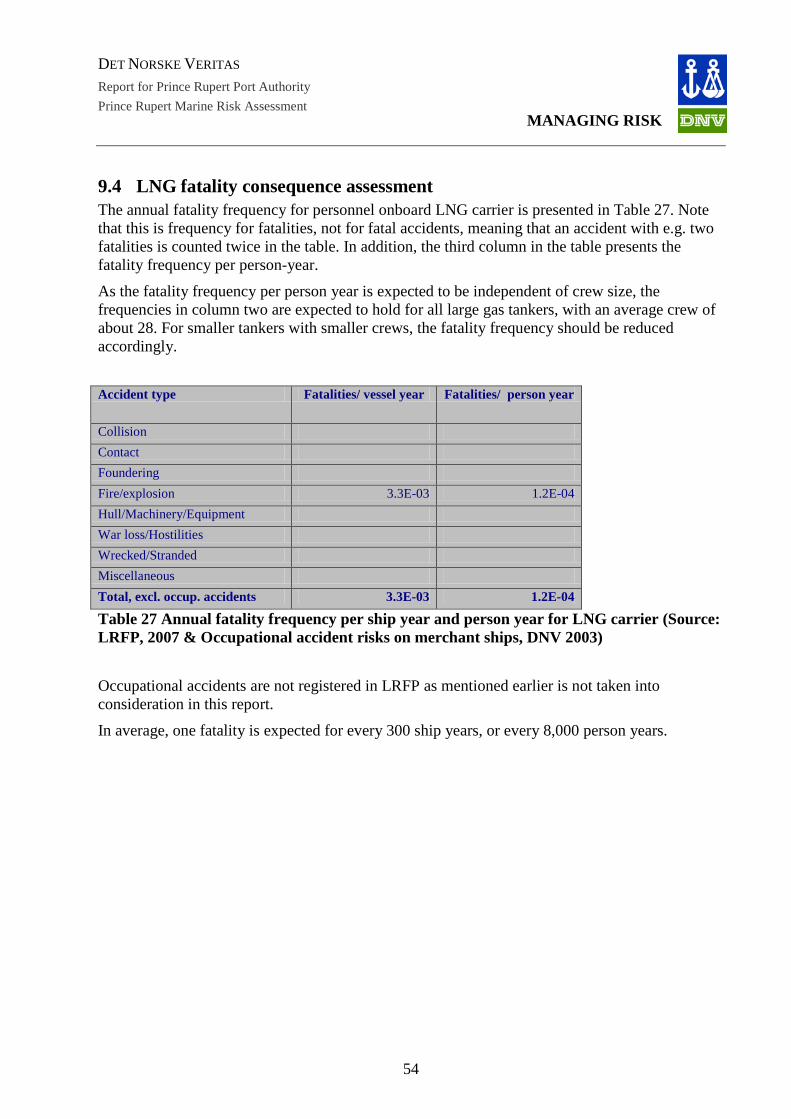
DET NORSKE VERITAS
Report for Prince Rupert Port Authority
MANAGING RISK Prince Rupert Marine Risk Assessment
9.4 LNG fatality consequence assessment The annual fatality frequency for personnel onboard LNG carrier is presented in Table 27. Note that this is frequency for fatalities, not for fatal accidents, meaning that an accident with e.g. two fatalities is counted twice in the table. In addition, the third column in the table presents the fatality frequency per person-year.
As the fatality frequency per person year is expected to be independent of crew size, the frequencies in column two are expected to hold for all large gas tankers, with an average crew of about 28. For smaller tankers with smaller crews, the fatality frequency should be reduced accordingly.
Accident type Fatalities/ vessel year Fatalities/ person year
Collision Contact Foundering Fire/explosion 3.3E-03 1.2E-04 Hull/Machinery/Equipment War loss/Hostilities Wrecked/Stranded Miscellaneous Total, excl. occup. accidents 3.3E-03 1.2E-04
Table 27 Annual fatality frequency per ship year and person year for LNG carrier (Source: LRFP, 2007 & Occupational accident risks on merchant ships, DNV 2003)
Occupational accidents are not registered in LRFP as mentioned earlier is not taken into consideration in this report.
In average, one fatality is expected for every 300 ship years, or every 8,000 person years.
54
DET NORSKE VERITAS
Report for Prince Rupert Port Authority
MANAGING RISK Prince Rupert Marine Risk Assessment
10 RISK EVALUATION In the following chapter the risks of an incident, spill and LNG release occurring during cargo transport to and from a Ridley Island terminal in Prince Rupert, are discussed.
It is important to note that the discussions in this chapter do not incorporate the risk mitigation measures proposed in chapter 11.
The discussion of risk has been divided into eight parts:
• Description and application of risk acceptance matrix
• Overall incident return periods with worldwide base frequencies
• Overall oil spill return periods
• Overall incident return periods with adjusted frequencies
• Overall oil spill return periods with adjusted frequencies
• Overall fatality return periods
• Risk discussion
• Qualitative risk scenario discussion
55
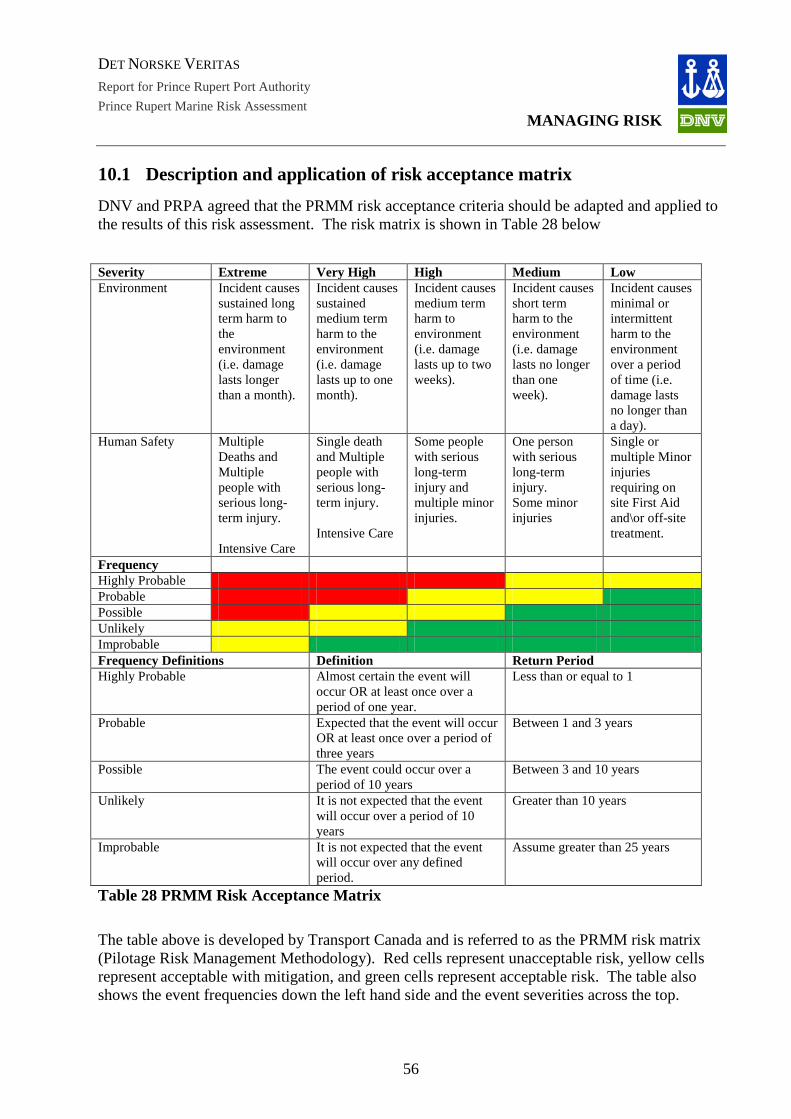
DET NORSKE VERITAS
Report for Prince Rupert Port Authority
MANAGING RISK Prince Rupert Marine Risk Assessment
10.1 Description and application of risk acceptance matrix DNV and PRPA agreed that the PRMM risk acceptance criteria should be adapted and applied to the results of this risk assessment. The risk matrix is shown in Table 28 below
Severity Extreme Very High High Medium Low Environment Incident causes
sustained long term harm to the environment (i.e. damage lasts longer than a month).
Incident causes sustained medium term harm to the environment (i.e. damage lasts up to one month).
Incident causes medium term harm to environment (i.e. damage lasts up to two weeks).
Incident causes short term harm to the environment (i.e. damage lasts no longer than one week).
Incident causes minimal or intermittent harm to the environment over a period of time (i.e. damage lasts no longer than a day).
Human Safety Multiple Deaths and Multiple people with serious long-term injury. Intensive Care
Single death and Multiple people with serious long-term injury. Intensive Care
Some people with serious long-term injury and multiple minor injuries.
One person with serious long-term injury. Some minor injuries
Single or multiple Minor injuries requiring on site First Aid and\or off-site treatment.
Frequency Highly Probable Probable Possible Unlikely Improbable Frequency Definitions Definition Return Period Highly Probable Almost certain the event will
occur OR at least once over a period of one year.
Less than or equal to 1
Probable Expected that the event will occur OR at least once over a period of three years
Between 1 and 3 years
Possible The event could occur over a period of 10 years
Between 3 and 10 years
Unlikely It is not expected that the event will occur over a period of 10 years
Greater than 10 years
Improbable It is not expected that the event will occur over any defined period.
Assume greater than 25 years
Table 28 PRMM Risk Acceptance Matrix The table above is developed by Transport Canada and is referred to as the PRMM risk matrix (Pilotage Risk Management Methodology). Red cells represent unacceptable risk, yellow cells represent acceptable with mitigation, and green cells represent acceptable risk. The table also shows the event frequencies down the left hand side and the event severities across the top.
56

DET NORSKE VERITAS
Report for Prince Rupert Port Authority
MANAGING RISK Prince Rupert Marine Risk Assessment
10.2 Overall base incident return periods Similar to the discussion in Chapter 8 the following chapter discusses return periods for incidents such as grounding and collision. In these cases incidents may or may not lead to a spill of cargo or bunker.
The return periods shown below are for an operation as it is today and therefore without any effect of the mitigation measures proposed in Chapter 11.
The figure below is calculated by summing up the world wide base frequencies, without any effect from local K factors, in Chapter 8 for each segment, and each incident type and then calculating the inverse to determine a return period.
Incident return periodsegment i = 1 / (Σ(Fi,j ∙ Xi ∙ n),
where Fi,j = frequency of incident type j in segment i (per NM),
Xi = number of NM sailing distance through segment i, and
ni = number of times the route through segment i is travelled per year
When using the above formula and translating the result into return periods the results are approximately 19. This means that if the conditions connected to Prince Rupert gateway would be considered as worldwide average an incident involving the proposed vessel can be expected one every 19th year.
Figure 12 Total incident return period without any effect from local conditions
The highest frequency of an incident occurring (lowest return period) is in Segment 1A. The reason for this is that this is the longest segment. As discussed before these frequencies are not adjusted from the world wide average at this stage. The only factor affecting the frequency of a segment is the length of it.
57
DET NORSKE VERITAS
Report for Prince Rupert Port Authority
MANAGING RISK Prince Rupert Marine Risk Assessment
10.3 Oil Spill base return periods In Chapter 8, worldwide incident and fleet data were used to determine base frequencies of tanker incidents per nautical mile.
In Chapter 9, consequences that could result from the incidents noted in Chapter 7 and 8 were discussed including the distribution of incidents likely to cause or not cause a spill in both laden and ballast tankers.
In this chapter, the distance sailed within each segment and the numbers of voyages per year are combined with the results from both Chapters 8 and 9 to calculate the risk of a spill of cargo or bunker.
To calculate the total annual incident frequency, the distance per segment is multiplied by the incident frequency per nautical mile for the each segment, which is then multiplied with the number of vessels travelling the segment per year to determine a total annual incident frequency.
So that a relative comparison can be made between routes and segments in this chapter, all risk calculations assume that 90% of the vessels will use the south route while 10% will use the north. The North Route has a total distance of 112.9 NM and the South route has a total distance of 112.9 NM. The return period for each segment can be seen in Figure 13 below.
The return periods are calculated by taking the inverse of the total annual incident frequency (1 divided by the total annual frequency). This is illustrated in the following formula:
Oil spill return periodsegment i = 1 / (Σ(Fi,j ∙ di,j) ∙ Xi ∙ n),
where Fi,j = frequency of accident type j in segment i (per NM),
di,j = conditional probability for oil spill given accident type j in segment i,
Xi = number of NM sailing distance through segment i, and
ni = number of times the route through segment i is travelled per year
When using this formula and translating it into oil spill return period the result is 176 years.
The frequencies used in this chapter utilize the conditional probabilities from Chapter 9.
The return period is simply another method of stating the frequency of an incident or spill along a given segment or route. Because the frequency is the number of events likely per year, based on historical information, a return period is the likely time (in years) between events based on historical data. This does not mean that an incident will not occur sooner or never occur at all.
It is also worth noting that as the frequencies per incident or route are summed, the number becomes larger. This in turn has the inverse effect on the return periods with the return periods growing smaller. The total frequency per route will always be greater than the annual frequency of an event or a segment and likewise the return period per route will always be smaller than the return period per event or per segment.
58
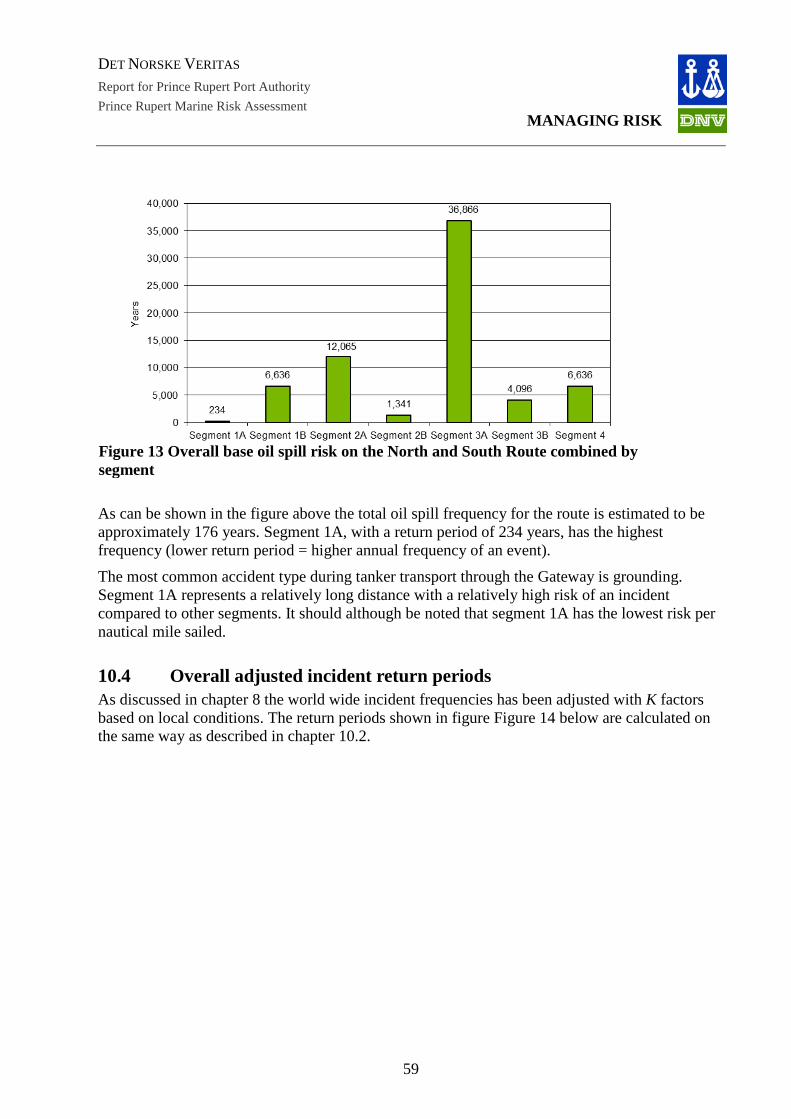
DET NORSKE VERITAS
Report for Prince Rupert Port Authority
MANAGING RISK Prince Rupert Marine Risk Assessment
As can be shown in the figure above the total oil spill frequency for the route is estimated to be approximately 176 years. Segment 1A, with a return period of 234 years, has the highest frequency (lower return period = higher annual frequency of an event).
The most common accident type during tanker transport through the Gateway is grounding. Segment 1A represents a relatively long distance with a relatively high risk of an incident compared to other segments. It should although be noted that segment 1A has the lowest risk per nautical mile sailed.
10.4 Overall adjusted incident return periods As discussed in chapter 8 the world wide incident frequencies has been adjusted with K factors based on local conditions. The return periods shown in figure Figure 14 below are calculated on the same way as described in chapter 10.2.
Figure 13 Overall base oil spill risk on the North and South Route combined by segment
59
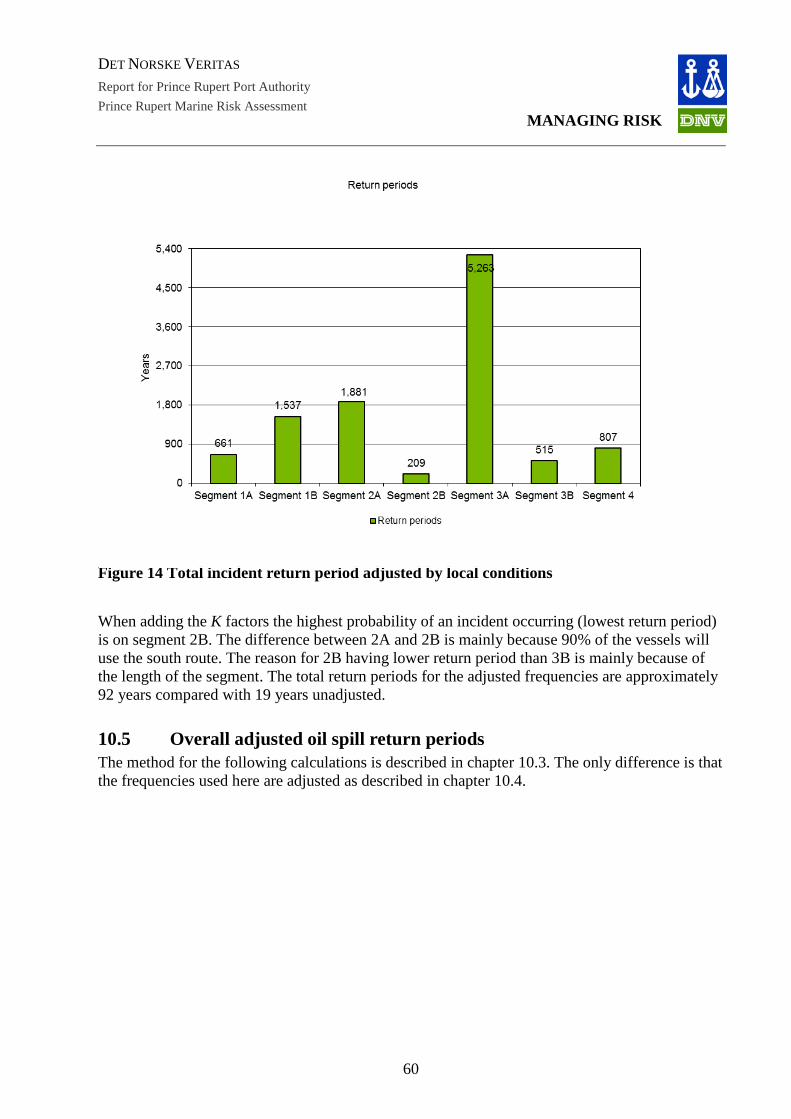
DET NORSKE VERITAS
Report for Prince Rupert Port Authority
MANAGING RISK Prince Rupert Marine Risk Assessment
Figure 14 Total incident return period adjusted by local conditions
When adding the K factors the highest probability of an incident occurring (lowest return period) is on segment 2B. The difference between 2A and 2B is mainly because 90% of the vessels will use the south route. The reason for 2B having lower return period than 3B is mainly because of the length of the segment. The total return periods for the adjusted frequencies are approximately 92 years compared with 19 years unadjusted.
10.5 Overall adjusted oil spill return periods The method for the following calculations is described in chapter 10.3. The only difference is that the frequencies used here are adjusted as described in chapter 10.4.
60

DET NORSKE VERITAS
Report for Prince Rupert Port Authority
MANAGING RISK Prince Rupert Marine Risk Assessment
Figure 15 Overall adjusted oil spill risk on the North and South Route combined by segment
As can be shown in Figure 15 above the total oil spill return period for the route is estimated to be approximately 780 years when using adjusted frequencies. Segment 2B with a return period of 1,804 years, has the highest frequency (lower return period = higher annual frequency of an event).
The dominant accident type during tanker transport through the Gateway is grounding. Segment 2B represents a relatively long distance with 90 % of the traffic with a relatively high risk of an incident compared to other segments.
10.6 Risk of Fatality As can be seen in chapter 9.2 and 9.4 the world wide statistics for fatalities onboard a tanker and an LNG carrier are:
Tanker, 4.4E-04, or expected for every 2,200 ship years
LNG Carrier, 3.3E-03or expected for every 300 ship years
This is then recalculated in the same ways as described in chapter 8 to get the frequency for the distance sailed to and from Ridley Island.
To be conservative we are in this report saying that a fatality caused by any incident type can be caused anywhere on the gateway. I.e. the frequency of a fatality because of a grounding will be the same per NM in segment 1A as in segment 3B even if the frequency of a grounding incident is more likely to happen in segment 3B than in 1A.
When adapting these numbers to the Prince Rupert Gateway it can be expected that one fatality can happen in average once every 876 year. This includes the introduction of 100 LNG carriers
61
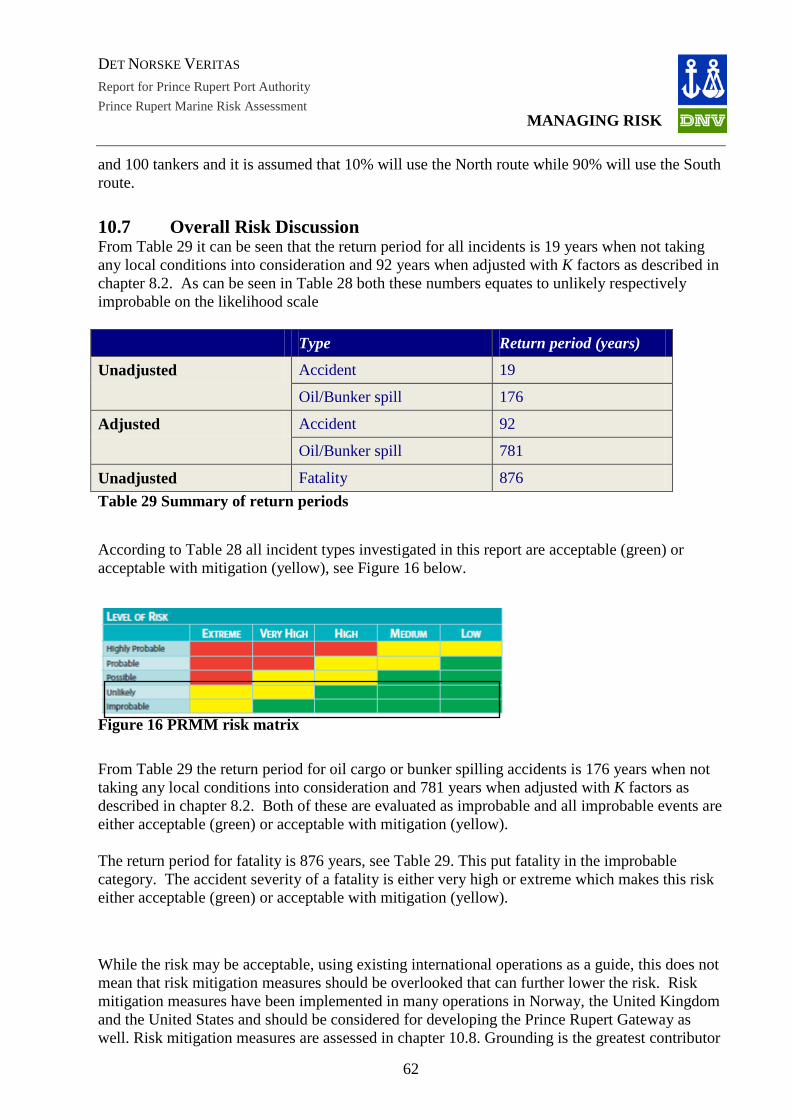
DET NORSKE VERITAS
Report for Prince Rupert Port Authority
MANAGING RISK Prince Rupert Marine Risk Assessment
and 100 tankers and it is assumed that 10% will use the North route while 90% will use the South route.
10.7 Overall Risk Discussion From Table 29 it can be seen that the return period for all incidents is 19 years when not taking any local conditions into consideration and 92 years when adjusted with K factors as described in chapter 8.2. As can be seen in Table 28 both these numbers equates to unlikely respectively improbable on the likelihood scale Type Return period (years)
Unadjusted Accident 19
Oil/Bunker spill 176
Adjusted Accident 92
Oil/Bunker spill 781
Unadjusted Fatality 876 Table 29 Summary of return periods
According to Table 28 all incident types investigated in this report are acceptable (green) or acceptable with mitigation (yellow), see Figure 16 below.
Figure 16 PRMM risk matrix From Table 29 the return period for oil cargo or bunker spilling accidents is 176 years when not taking any local conditions into consideration and 781 years when adjusted with K factors as described in chapter 8.2. Both of these are evaluated as improbable and all improbable events are either acceptable (green) or acceptable with mitigation (yellow). The return period for fatality is 876 years, see Table 29. This put fatality in the improbable category. The accident severity of a fatality is either very high or extreme which makes this risk either acceptable (green) or acceptable with mitigation (yellow). While the risk may be acceptable, using existing international operations as a guide, this does not mean that risk mitigation measures should be overlooked that can further lower the risk. Risk mitigation measures have been implemented in many operations in Norway, the United Kingdom and the United States and should be considered for developing the Prince Rupert Gateway as well. Risk mitigation measures are assessed in chapter 10.8. Grounding is the greatest contributor
62
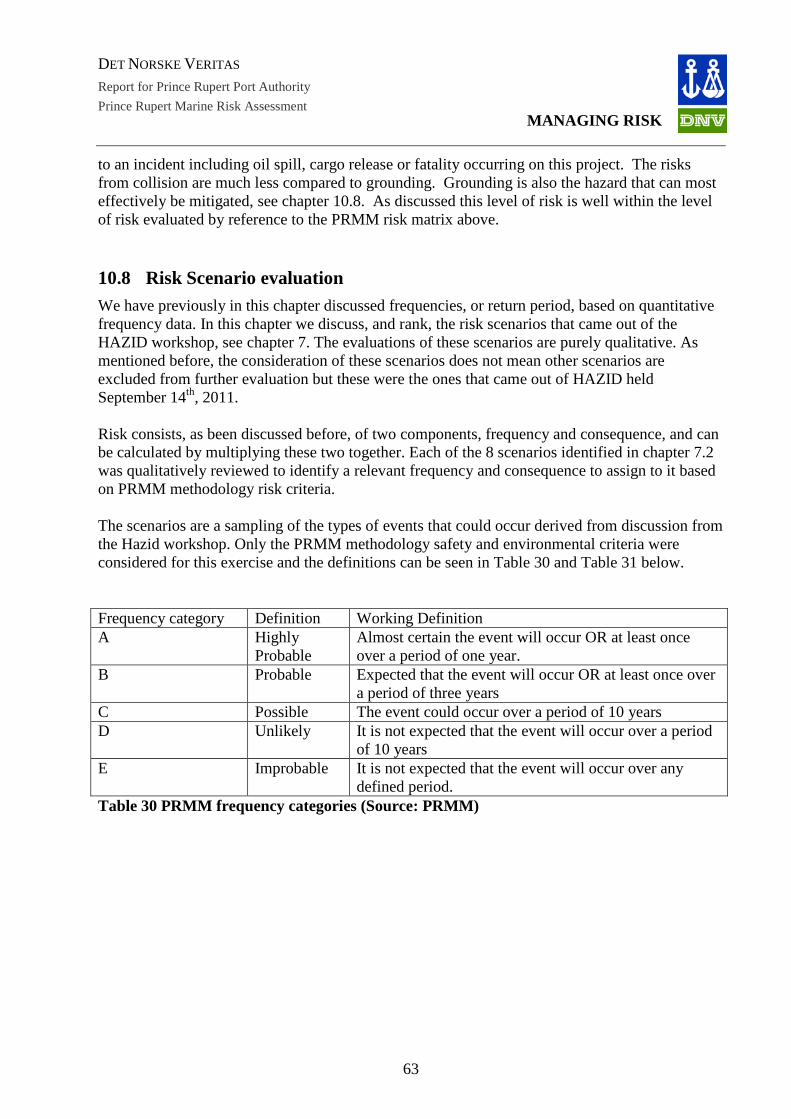
DET NORSKE VERITAS
Report for Prince Rupert Port Authority
MANAGING RISK Prince Rupert Marine Risk Assessment
to an incident including oil spill, cargo release or fatality occurring on this project. The risks from collision are much less compared to grounding. Grounding is also the hazard that can most effectively be mitigated, see chapter 10.8. As discussed this level of risk is well within the level of risk evaluated by reference to the PRMM risk matrix above.
10.8 Risk Scenario evaluation We have previously in this chapter discussed frequencies, or return period, based on quantitative frequency data. In this chapter we discuss, and rank, the risk scenarios that came out of the HAZID workshop, see chapter 7. The evaluations of these scenarios are purely qualitative. As mentioned before, the consideration of these scenarios does not mean other scenarios are excluded from further evaluation but these were the ones that came out of HAZID held September 14th, 2011. Risk consists, as been discussed before, of two components, frequency and consequence, and can be calculated by multiplying these two together. Each of the 8 scenarios identified in chapter 7.2 was qualitatively reviewed to identify a relevant frequency and consequence to assign to it based on PRMM methodology risk criteria. The scenarios are a sampling of the types of events that could occur derived from discussion from the Hazid workshop. Only the PRMM methodology safety and environmental criteria were considered for this exercise and the definitions can be seen in Table 30 and Table 31 below. Frequency category Definition Working Definition A Highly
Probable Almost certain the event will occur OR at least once over a period of one year.
B Probable Expected that the event will occur OR at least once over a period of three years
C Possible The event could occur over a period of 10 years D Unlikely It is not expected that the event will occur over a period
of 10 years E Improbable It is not expected that the event will occur over any
defined period. Table 30 PRMM frequency categories (Source: PRMM)
63

DET NORSKE VERITAS
Report for Prince Rupert Port Authority
MANAGING RISK Prince Rupert Marine Risk Assessment
Consequence category
Definition Working Definition
5 Extreme Saf. Multiple Deaths and Multiple people with serious long-term injury. Intensive Care Env. Incident causes sustained long term harm to the environment (i.e. damage lasts longer than a month).
4 Very High Saf. Single death and Multiple people with serious long-term injury. Intensive Care Env. Incident causes sustained medium term harm to the environment (i.e. damage lasts up to one month).
3 High Saf. Some people with serious long-term injury and multiple minor injuries. Env. Incident causes medium term harm to environment (i.e. damage lasts up to two weeks).
2 Medium Saf. One person with serious long-term injury. Some minor injuries Env. Incident causes short term harm to the environment (i.e. damage lasts no longer than one week).
1 Low Saf. Single or multiple Minor injuries requiring on site First Aid and\or off-site treatment. Env. Incident causes minimal or intermittent harm to the environment over a period of time (i.e. damage lasts no longer than a day).
Table 31 Consequence (Severity) categories in the PRMM Risk Matrix (Source: PRMM) For each scenario both the frequency and consequence (severity) for safety and environment were evaluated and then the highest risk from the two categories became the overall risk. Ranking of the consequences of the 8 scenarios, ranging from low to extreme as presented in Table 32, was conducted using a professional judgment based on a potential worse case credible outcome from the described situation and taken in consideration the consequence analysis completed in 9, and focusing only on human safety and environmental impact. Frequencies of the 8 scenarios from improbable to highly probable were assigned using professional judgment and conservatism using the results from the frequency analysis described in chapter 8. Again, for the risk matrix it was decided to use a conservative approach from the results reported. Level of Risk 5- Extreme 4- Very
High 3- High 2- Medium 1 - Low
A- Highly Probable B- Probable C- Possible D- Unlikely E- Improbable Table 32 PRMM risk levels (Source: PRMM)
64
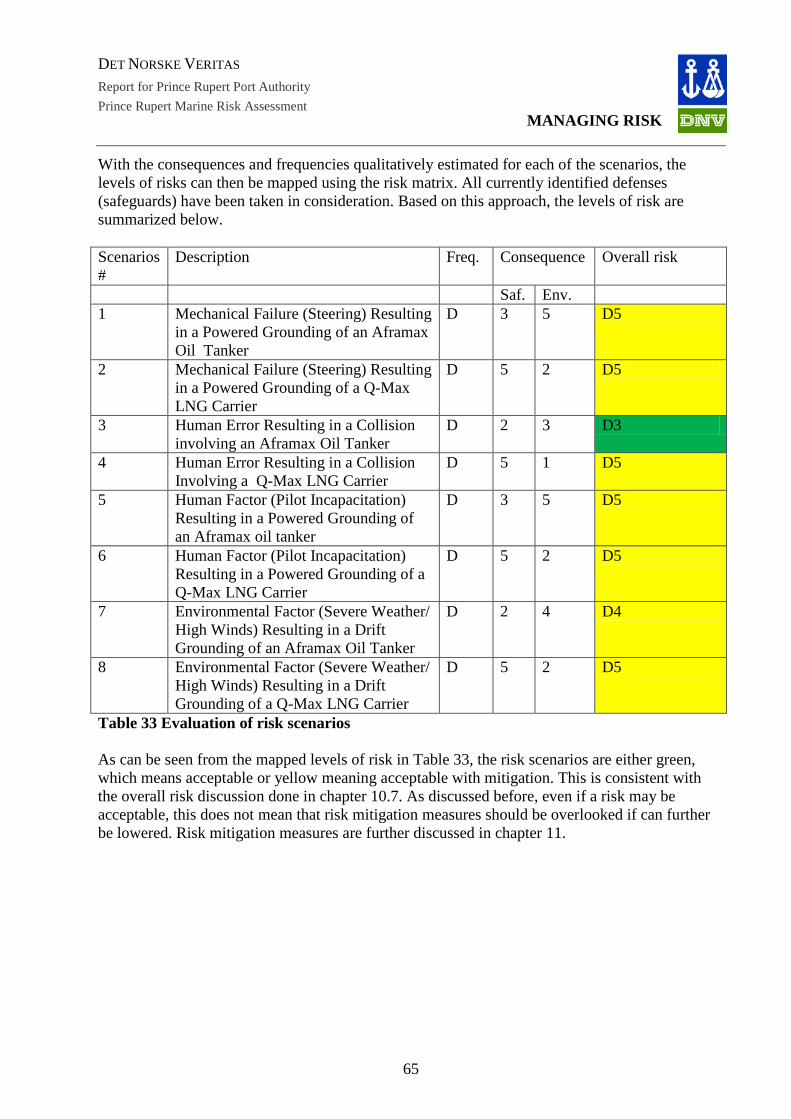
DET NORSKE VERITAS
Report for Prince Rupert Port Authority
MANAGING RISK Prince Rupert Marine Risk Assessment
With the consequences and frequencies qualitatively estimated for each of the scenarios, the levels of risks can then be mapped using the risk matrix. All currently identified defenses (safeguards) have been taken in consideration. Based on this approach, the levels of risk are summarized below. Scenarios #
Description Freq. Consequence Overall risk
Saf. Env. 1 Mechanical Failure (Steering) Resulting
in a Powered Grounding of an Aframax Oil Tanker
D 3 5 D5
2 Mechanical Failure (Steering) Resulting in a Powered Grounding of a Q-Max LNG Carrier
D 5 2 D5
3 Human Error Resulting in a Collision involving an Aframax Oil Tanker
D 2 3 D3
4 Human Error Resulting in a Collision Involving a Q-Max LNG Carrier
D 5 1 D5
5 Human Factor (Pilot Incapacitation) Resulting in a Powered Grounding of an Aframax oil tanker
D 3 5 D5
6 Human Factor (Pilot Incapacitation) Resulting in a Powered Grounding of a Q-Max LNG Carrier
D 5 2 D5
7 Environmental Factor (Severe Weather/ High Winds) Resulting in a Drift Grounding of an Aframax Oil Tanker
D 2 4 D4
8 Environmental Factor (Severe Weather/ High Winds) Resulting in a Drift Grounding of a Q-Max LNG Carrier
D 5 2 D5
Table 33 Evaluation of risk scenarios As can be seen from the mapped levels of risk in Table 33, the risk scenarios are either green, which means acceptable or yellow meaning acceptable with mitigation. This is consistent with the overall risk discussion done in chapter 10.7. As discussed before, even if a risk may be acceptable, this does not mean that risk mitigation measures should be overlooked if can further be lowered. Risk mitigation measures are further discussed in chapter 11.
65
DET NORSKE VERITAS
Report for Prince Rupert Port Authority
MANAGING RISK Prince Rupert Marine Risk Assessment
11 RISK MITIGATION MEASURES This chapter aim to discuss the current defenses in place today and suggestion for additional initiative that Prince Rupert Port Authority is suggested to further consider in order to lower the risk of an incident further.
11.1 Current Defenses The list below provides an overview over different defenses in place as implemented today:
• IMO manning requirements
• Competent trained crews
• Competent trained pilots
• Recreational boaters training on nav rules
• Safety regulations and standards
• Policies and procedures
• Communication and navigation equipment
• Redundant steering
• Double hull requirement for tankers systems
• Assist tugs based at the port
• Aids to navigation
• Charts
• MCTS
• CCG environmental response
• Western Canada Marine Response Corporation
These defenses have been identified and confirmed during the HAZID workshop discussed in chapter 7.1.
11.2 Suggested additional defenses Risk mitigation measures or defenses focus on either decreasing the frequency of the event or lessening the consequences of the event should it occur. For the most part this report focuses on frequency reduction measures. Many of the consequence mitigation measures are already built into tankers (e.g. double hulls).
The following risk mitigation measures have been chosen for PRPA to consider when introducing tankers and LNG carriers to the gateway. The recommendations for this project are based in large part on the knowledge gathered locally as discussed in Chapter 7.
1. The use of escort tugs or the availability of additional tug assistance
66

DET NORSKE VERITAS
Report for Prince Rupert Port Authority
MANAGING RISK Prince Rupert Marine Risk Assessment
2. Enhancement of navigational aids
3. Traffic separation scheme
4. Introduction of exclusion and/or security zones
11.2.1 Tug escort
Many reports have been written about the effect of an escort tug. The effectiveness of escort tug based on previous DNV studies (DNV 2002) is that an escort tug can have a risk reduction effect of up to 80% on grounding and approximately 5% on collisions. A tethered tug will have a somewhat higher risk reducing effect, especially for a drifting vessel.
DNV suggest that PRPA consider using tug escorts for the tankers, especially the ones leaving in laden conditions.
Together with the frequency reduction (preventing groundings and collisions from occurring altogether) the escort tug can also have a positive effect on reducing the consequence if an event of grounding or collision actually occurs.
An escort tug can reduce the consequences by reducing the speed at the time of impact thereby reducing the damage to the tanker and the volume of cargo or bunker spilled. The exact consequences in the case of a grounding or collision will depend on many parameters, such as wind and the type of sea bottom.
Tugs escorting the tanker in the case of a spill will be able to remain and assist the tanker during the oil spill response. It is suggested, therefore, that all escort tugs should carry a complement of oil spill response equipment. Providing the tanker is properly supported, available escort tugs might assist in the oil spill response.
11.2.2 Enhancement of navigational aids
There are some concerns over the upkeep of some of the navigational aids in the area. CCG have conducted a review and have made some recommendations and modifications.
The current navigational aids in the gateway have been installed for a long time ago and some of them need to be upgraded because they are built to old standards. If they are upgraded to comply with new standards they are expected to be more visible. It is recommended that the installation of additional navigational aids should be studied further, taking into consideration overall traffic and traffic patterns in the area.
11.2.3 Traffic separation scheme
In many coastal areas traffic separation schemes have been implemented in order to reduce the risk of collisions.
Many of the traffic separation schemes are only marked on charts and not physically with buoys or similar markers. The collision risk for the proposed tankers is assessed to be low. Therefore, the effect of implementing the traffic scheme would also be low, and the potential effect on oil spill risk very limited. However the traffic separation scheme would make it easier for small
67
DET NORSKE VERITAS
Report for Prince Rupert Port Authority
MANAGING RISK Prince Rupert Marine Risk Assessment
recreational crafts in the area to keep out of the way of passing larger vessels as they would know which side the tankers would transit.
Given the low cost of implementation and that traffic separation would have a positive effect for all traffic in the area. It is recommended that traffic separation should be assessed for the Prince Rupert Area.
11.2.4 Exclusion and security zones
Many ports in the world are today using so called exclusion and security zones. The definition of these zones as described in this chapter is:
Exclusion zone: “An exclusion zone is an area within defined limits which is prohibited for certain ships to keep them far enough offshore to give sufficient time to rescue a disabled ship from going ashore and to protect the coastline from any pollution caused by a casualty.“
Security Zone: “A security zone is a defined area, which for safety and environmental purposes access is limited to persons, ships or objects authorized by the Coast Guard. Such a zone may be stationary and described by fixed limits, or it may be described as an area around a ship or object in transit”
The application and scope of controlled zones for LNG vessels has been diverse in different jurisdictions depending on the calculated risk. One has only to look at ports such as Boston, USA and Barcelona, Spain to see the range of exclusion and security zone controls applied to LNG carriers and other traffic transiting and using LNG facilities and adjacent waterways. For example, in brief, the port of Boston restricts all other traffic movement in the area, closes overlying road bridges and adjusts flight paths for aircraft approaches to and from the nearby international airport. Additionally, the USCG provides, at cost, aerial and marine escort and surveillance throughout the harbour passage and port turnaround period of an LNG carrier at the Everett terminal. On the other hand, traffic movements in the port of Barcelona continue as normal regardless of the presence of an LNG carrier. It is recommended that PRPA further investigate the effect of installation of such safeguards as exclusion and security zones.
11.2.5 Other potential mitigation measures
In addition to what have been discussed earlier in this chapter a number of mitigation can be taken into consideration. Many of these measures will have a positive effect on not only tankers travelling to and from Prince Rupert, but all vessels travelling over the areas of the two routes. DNV proposes that further investigation of the effect of the following measures shall be done prior to introducing crude oil and LNG carriers in the area:
- Multi beam sounding work – identify possible critical areas and carry out sounding
- Operational weather parameters – e.g. max wind, max visibility, day time/night time operations
- Mooring buoys to eliminate any dragging of anchor
68

DET NORSKE VERITAS
Report for Prince Rupert Port Authority
MANAGING RISK Prince Rupert Marine Risk Assessment
11.3 Conclusion risk mitigation measure Grounding is the greatest contributor to an accident occurring on the proposed route as per day. The risks from collision are less compared to grounding. Grounding is also the hazard that can most effectively be mitigated. The use of appropriate placed and sized escort tug can decrease the frequency of accidents. As discussed above the risk reduction effect of a tug escort may be up to 80% for grounding and 5% for collision.
The other above mentioned risk mitigation measures has also been qualitatively evaluated. The risk reduction effect of these measures related to the introduction of Oil tankers and LNG carriers has been evaluated low to medium. Since these measures not only affect the introduction of oil tankers and LNG carriers it is recommended by DNV to further analyze these measures taking all traffic in the area in to consideration.
69
DET NORSKE VERITAS
Report for Prince Rupert Port Authority
MANAGING RISK Prince Rupert Marine Risk Assessment
12 COMMUNICATION PLAN Communication, both within the Authority as well as with the broader stakeholder groups, can be critical to successful implementation of the chosen risk control strategy. The sophistication of the Communication Plan depends on the number of stakeholders and the extent to which they are likely to be in agreement with the proposed actions.
Where there is a narrow range of stakeholders for which the impact will be less severe, the communication plan will be limited and the target groups will be few in number. In some cases, an announcement or delivery of the report can be done through regular channels with minimum effort. However, where the impact of the decision is greater and will impact a broader range of stakeholders, a more formal plan may be required. A successful communication plan will involve the following steps:
o Prioritize the stakeholder target groups for communication
o Identify the communication objectives for each group
o Specify the communication message for each group o Specify the timing or sequencing of the communications.
A variety of information contributes to a comprehensive communication plan, as shown in the outline below. This is a suggestion on what to include in a communication plan. PR may also want to include other elements, depending on the port authorities own requirements and the type of risk communication.
o Introduction
o Purpose of the plan
o Scope of the plan
o Background on the risk
What is the risk?
Who is affected by it?
o Authority
Under what authority (law or organizational mandate) is the risk being communicated?
o Purpose of the risk communication effort
o Specific objectives
o Audience Profile
o How audience information was gathered
o Key audience characteristics
o Risk Communication Strategies
o Evaluation Strategies
o Schedule and Resources
70
DET NORSKE VERITAS
Report for Prince Rupert Port Authority
MANAGING RISK Prince Rupert Marine Risk Assessment
o Detailed schedule that identifies tasks and people responsible for completing them
o Estimated budget
o Other resources to be used
o Internal Communication
o How progress will be documented
o Approvals needed/received
o Signoff Page
o Names, job titles, and signatures of key staff acknowledging that they have read and concur with the plan
The above suggestion should, as discussed above, just function as a starting point for PRPA. This needs to be developed further prior to communicating to the broader audience such as local communities, authorities and other external interest groups.
71
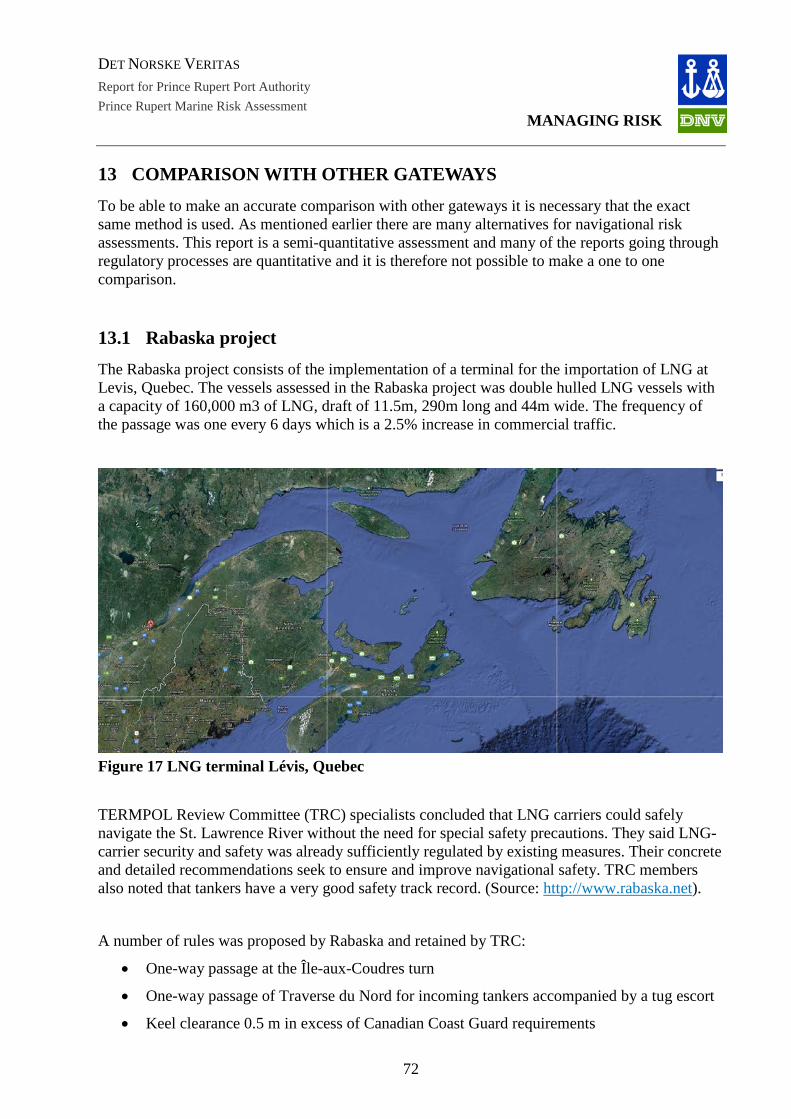
DET NORSKE VERITAS
Report for Prince Rupert Port Authority
MANAGING RISK Prince Rupert Marine Risk Assessment
13 COMPARISON WITH OTHER GATEWAYS To be able to make an accurate comparison with other gateways it is necessary that the exact same method is used. As mentioned earlier there are many alternatives for navigational risk assessments. This report is a semi-quantitative assessment and many of the reports going through regulatory processes are quantitative and it is therefore not possible to make a one to one comparison.
13.1 Rabaska project The Rabaska project consists of the implementation of a terminal for the importation of LNG at Levis, Quebec. The vessels assessed in the Rabaska project was double hulled LNG vessels with a capacity of 160,000 m3 of LNG, draft of 11.5m, 290m long and 44m wide. The frequency of the passage was one every 6 days which is a 2.5% increase in commercial traffic.
Figure 17 LNG terminal Lévis, Quebec
TERMPOL Review Committee (TRC) specialists concluded that LNG carriers could safely navigate the St. Lawrence River without the need for special safety precautions. They said LNG-carrier security and safety was already sufficiently regulated by existing measures. Their concrete and detailed recommendations seek to ensure and improve navigational safety. TRC members also noted that tankers have a very good safety track record. (Source: http://www.rabaska.net).
A number of rules was proposed by Rabaska and retained by TRC:
• One-way passage at the Île-aux-Coudres turn
• One-way passage of Traverse du Nord for incoming tankers accompanied by a tug escort
• Keel clearance 0.5 m in excess of Canadian Coast Guard requirements
72

DET NORSKE VERITAS
Report for Prince Rupert Port Authority
MANAGING RISK Prince Rupert Marine Risk Assessment
• A definition of “operational limits” based on the limiting wind speed, wave, and visibility conditions in which operations are possible (transit of the Traverse du Nord, maneuvers and unloading).
• Presence of a pilot on board while the tanker is upstream from Les Escoumins, including during unloading.
In addition, during winter, an ice advisor will board the tanker in Canadian waters to guide it through the ice downstream from Les Escoumins. (Source: http://www.rabaska.net).
13.2 North America west coast A number of marine vessel risk studies have been conducted in British Columbia. Most studies have been undertaken in southern British Columbia. Examples of studies are (Source: EnviroEmerg, 2008):
• 1972,"The West Coast Oil Threat In Perspective", Environment Canada prepared by Howard Paish and Associates
• McAllister, et al. 1978. Potential Pacific Coast Oil Ports: AComparative Environmental Risk Analysis, A Report by Fisheries and Environment Canada, Working Group on West Coast Deep water Oil Ports. Vancouver, BC.
• W.H. Wolferstan, 1980. Oil Tanker Traffic: Assessing the Risks to Southern Coast of British Columbia, APD Bulletin 9, BC Ministry of Environment. (Vol 1 and 2)
• D.F. Dickens, et al. 1990. Marine Oil Transportation Systems: Evaluation of Environmental Risk & Alternatives for Risk Reduction. Vol II. Prepared for the States/British Columbia Oil Spill Task Force.
• 1991. Risk Analysis of Tanker Traffic Movements within the Port of Vancouver. Prepared for the Vancouver Port Corporation (Vancouver) by Sandwell and subconsultant Bennett Environmental Consultants Ltd. and Seaconsult Marine Research Ltd.
• 1992. Canadian Coast Guard: Canadian Oil Spill Risk Criteria Definition and Application of Comparison of High Risk Locations. Prepared for Canadian Coast Guard, Marine Emergencies by AECL Research (Chalk River) in association with D.F. Dickins Associate (Vancouver)
• R. Allan and D.F Dickens, 1995. A Review of Escort, Rescue and Salvage Towing Capability in Canadian Waters. Prepared for the Canadian Council of Ministers of the Environment.
The intent of the studies is generally to guide marine transport decisions on accident prevention. For a particular coastal locale (harbour, strait, etc), marine safety decisions may pertain to vessel traffic separation routes, an area to be avoided, navigational aids, notice to mariners of risks and operational instructions, tug requirements, etc.
Because of different scopes of work, study objectives and methods of the various risk assessments it is hard to make an one to one comparison of the different risk levels related to different hazards. However, with implementing the suggested risk mitigation measures, presented in Chapter 11, DNV has not identified any reason why a PR terminal should have greater risks than other existing terminals in BC.
73

DET NORSKE VERITAS
Report for Prince Rupert Port Authority
MANAGING RISK Prince Rupert Marine Risk Assessment
13.3 The worldwide shipping scene During the last decade, approximately 172 oil spills have been registered world wide. With a world average spill frequency, a return period of 74 years would be expected (Source: Enbridge Northern Gateway 2010). Hence, the unadjusted risk with an estimated return period of 176 years for the transportation of LNG and crude to and from Prince Rupert is below world average.
In general the overall unmitigated risks calculated in this report are comparable to similar operations located in parts of the world with a geography like that of the west coast of British Columbia (e.g. Mongstad, Norway (DNV 2006).
13.4 Conclusion While the risk may be acceptable compared to existing international operations, this does not mean that risk mitigation measures that can further reduce risk should be overlooked. Risk mitigation measures have been implemented in many operations in Norway, the United Kingdom, the United States and Canada (e.g. Rabaska project) and should be considered for the PRPA as well. Risk mitigation measures are discussed in chapter 11.
74
DET NORSKE VERITAS
Report for Prince Rupert Port Authority
MANAGING RISK Prince Rupert Marine Risk Assessment
14 REFERENCES Alaska Marine Highway System, 2011
Alaska Marine Highway System Website: http://www.dot.state.ak.us/amhs/schedule_pdf.shtml
Description of Marine and Climatic Aspects of the Bulk Coal Shiploading Terminal (1981-02)
Report by Swan Wooster Engineering Inc. provided from the PRPA: Description of Marine and Climatic Aspects of the Bulk Coal Shiploading Terminal (1981-02)
DNV 2006 Totalrisikoanalyse, Statoil – Kårstø, DNV Report 2006 – 0340
CONFIDENTIAL
Enbridge, 2009 Technical Data Report MARINE SHIPPING QUANTITATIVE RISK ANALYSIS ENBRIDGE NORTHERN GATEWAY PROJECT
http://www.ceaa.gc.ca/050/documents_staticpost/cearref_21799/2559/marine_shipping.pdf
EnviroEmerg, 2008 Major Marine Vessel Casualty Risk and Response Preparednessin British Columbia
HAZID workshop In discussion with all stakeholders during HAZID Workshop, September 14th, 2011.
IHS Fairplay, 2011 IHS Fairplay register incident database and world fleet statistics
ITOPF, 2011 The International Tanker Owners Pollution Federation Limited,
www.itopf.com
JSP, 2004
LNG marine Release Consequence Assessment for Joint Sponsor project, July 2004, Project number 70004197, Det Norske Veritas (U.S.A.), Inc. (Hughes, Pitblado, Shaw)
LRFP 2007 Lloyd’s Register Fairplay Incident database and World Fleet Statistic
MCTS, 2011 MCTS Prince Rupert Website: http://www.ccg-gcc.gc.ca/e0003903
Mizner, 1983 Mizner, G.A., and J.A. Eyer, Radiation from Liquefied Gas Fires on Water, Comb. Sci.Techn. 35, pp. 33 (1983).
Nedelka, 1990 Nedelka, D., J. Moorhouse and R. F. Tucker, The Montoir 35m Diameter LNG Pool Fire Experiments, Proc. 9th Int. Conf. on LNG, Nice, 17-20 Oct. 1989, Publ. by Institute of Gas Technlogy, Chicago, Vol. 2, pp. III-3, 1-23 (1990).
PNCIMA, 2011 PNCIMA website: http://pncima.org/
Potash Terminal Project, Prince Rupert, 2011
Report by the Canadian Environmental Assessment Agency: Background information for the Initial federal Public Comment Period on the Canpotex Potash Terminal Project, Prince Rupert, BC (2011-09)
PRPA 2011 Presentation by the Prince Rupert Port Authority describing current and future plans for the PRPA: Welcome to North America’s Leading Edge (2011-09)
Port of Prince Rupert Website: http://www.rupertport.com/
Rabaska 2004 RABASKA, Projet de terminal méthanier, Processus d’examen TERMPOL Étude 3.15, Analyse des risques et méthodes visant à réduire les risques
Ridley Island Marine Safety Study, 1980
Report by Det Norske Veritas for the Alberta Economic Development: Ridley Island Marine Safety Study (1980-05)
Sailing Directions PAC205 Sailing Directions PAC205 published by Canadian Hydrographic Service: Inner Passage – Queen Charlotte Sound to Chatham Sound
75

DET NORSKE VERITAS
Report for Prince Rupert Port Authority
MANAGING RISK Prince Rupert Marine Risk Assessment
Sailing Directions PAC206 Sailing Directions PAC206 published by Canadian Hydrographic Service: Hecate Strait, Dixon Entrance, Portland Inlet and adjacent Waters and Queen Charlotte Islands
Services Chart No. 3002 Canada Hydrographic Services Chart No. 3002: Queen Charlotte Sound to Dixon Entrance
Services Chart No. 3802 Canada Hydrographic Services Chart No. 3802: Dixon Entrance
Services Chart No. 3957 Canada Hydrographic Services Chart No. 3957: Approaches to Prince Rupert Harbour
Services Chart No. 3985 Canada Hydrographic Services Chart No. 3985: Prince Rupert Harbour
Telecon discussion September 9th, 2011 with Terry Morgan,
Telecon discussion September 9th, 2011 with Terry Morgan, Canadian Coast Guard, regarding the update of the Navigational Aids in Prince Rupert Harbour, (including Triple Island to the Port of Prince Rupert, and Ridley Island) The report was completed in 2010.
The US EPA, 2011 The US EPA provides information on the Emissions Control Area in North America: http://www.epa.gov/nonroad/marine/ci/420f09001.htm
Tote, 2011 Tote website: http://www.totemocean.com/
Transport Canada oil pollution, 2011
Transport Canada oil pollution prevention website: http://www.tc.gc.ca/eng/marinesafety/oep-environment-tankers-menu-430.htm
76
DET NORSKE VERITAS
Report for Prince Rupert Port Authority
MANAGING RISK Prince Rupert Marine Risk Assessment
APPENDIX 1 - GLOBAL AND LOCAL INCIDENT DATA This chapter summarizes the information from the noted data sources in the following sub-chapters:
Global Trend in Maritime Shipping Safety (Source: IHS, LRFP)
Review of Global LNG and Oil Tanker Incidents (Source: LRFP)
Review of Incidents in Canadian Waters (Source: TSB)
Review of Incidents in the Study Area (Source: TSB)
The casualty data has been analyzed by DNV and historic casualty frequencies calculated.
Based on an analysis of the available incident data, a conclusion on the data to be used in the quantitative risk analysis is made.
Global Trend in Maritime Shipping Safety The number of total ship losses is generally considered the best indicator of the improved safety record of the shipping industry. In a total loss the ship in question sinks or is beyond repair and scrapped. The following ship types, similar to those in operation or planned for operating to and from one of the Prince Rupert port terminals, were selected to illustrate the decrease in total losses:
Oil tankers (including product tankers)
Liquid Natural Gas (LNG) Tankers
Container carriers (including general cargo)
Bulk carriers (including ore carriers)
Review of global LNG and Oil tanker incidents The following chapter reviews oil tanker incidents that have occurred globally. The information and data presented is based on statistics for the years 2000 to 2010 obtained from the Lloyd’s Register Fairplay Incident database and World Fleet Statistics (Source: IHS Fairplay Global Maritime Statistics 2011), and the International Tanker Owners Pollution Federation Ltd (Source: ITOPF 2009) which also included statistics up to 2008.
Overall global LNG and Oil tanker incidents
Incidents in this chapter are divided into three categories:
Minor damage - any event reported to LRFP and included in the database, not being categorized as major damage or total loss (defined below). The extent of reporting of such incidents will be incomplete and variable.
Major damage - breakdown resulting in the ship being towed or requiring assistance from ashore; flooding of any compartment; or structural, mechanical or electrical damage
77
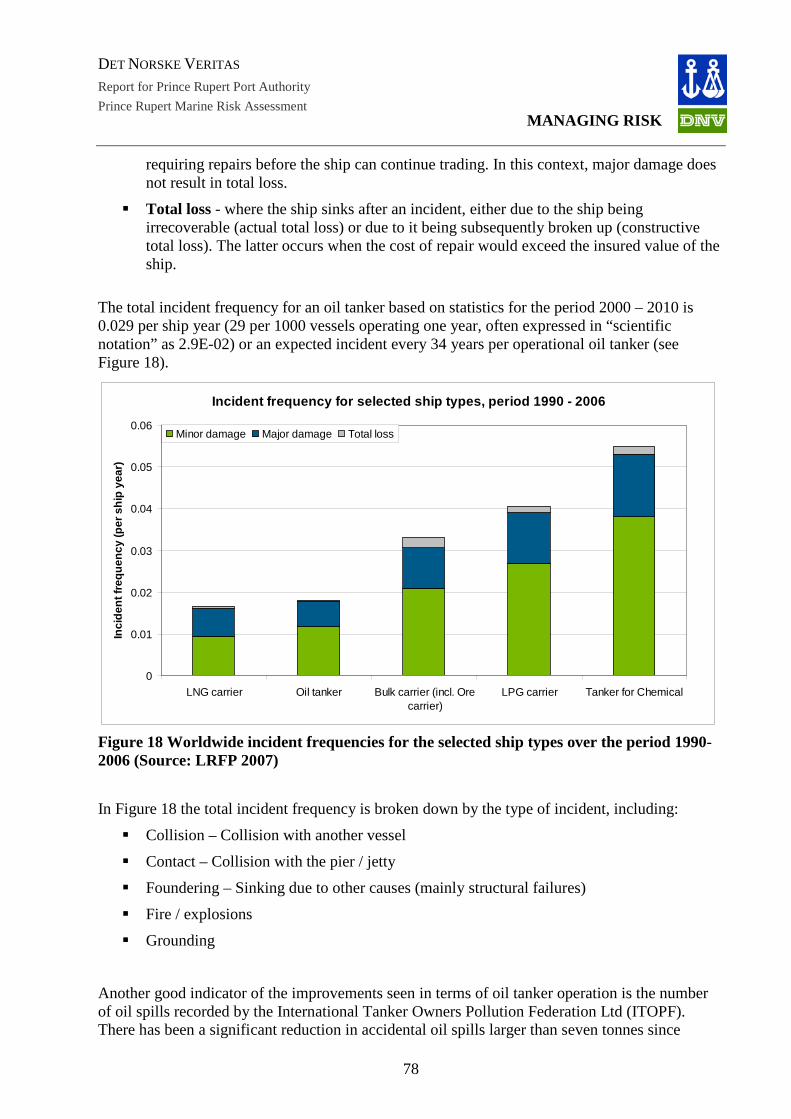
DET NORSKE VERITAS
Report for Prince Rupert Port Authority
MANAGING RISK Prince Rupert Marine Risk Assessment
requiring repairs before the ship can continue trading. In this context, major damage does not result in total loss.
Total loss - where the ship sinks after an incident, either due to the ship being irrecoverable (actual total loss) or due to it being subsequently broken up (constructive total loss). The latter occurs when the cost of repair would exceed the insured value of the ship.
The total incident frequency for an oil tanker based on statistics for the period 2000 – 2010 is 0.029 per ship year (29 per 1000 vessels operating one year, often expressed in “scientific notation” as 2.9E-02) or an expected incident every 34 years per operational oil tanker (see Figure 18).
Incident frequency for selected ship types, period 1990 - 2006
0
0.01
0.02
0.03
0.04
0.05
0.06
LNG carrier Oil tanker Bulk carrier (incl. Orecarrier)
LPG carrier Tanker for Chemical
Inci
dent
freq
uenc
y (p
er s
hip
year
)
Minor damage Major damage Total loss
Figure 18 Worldwide incident frequencies for the selected ship types over the period 1990-2006 (Source: LRFP 2007)
In Figure 18 the total incident frequency is broken down by the type of incident, including:
Collision – Collision with another vessel
Contact – Collision with the pier / jetty
Foundering – Sinking due to other causes (mainly structural failures)
Fire / explosions
Grounding
Another good indicator of the improvements seen in terms of oil tanker operation is the number of oil spills recorded by the International Tanker Owners Pollution Federation Ltd (ITOPF). There has been a significant reduction in accidental oil spills larger than seven tonnes since
78
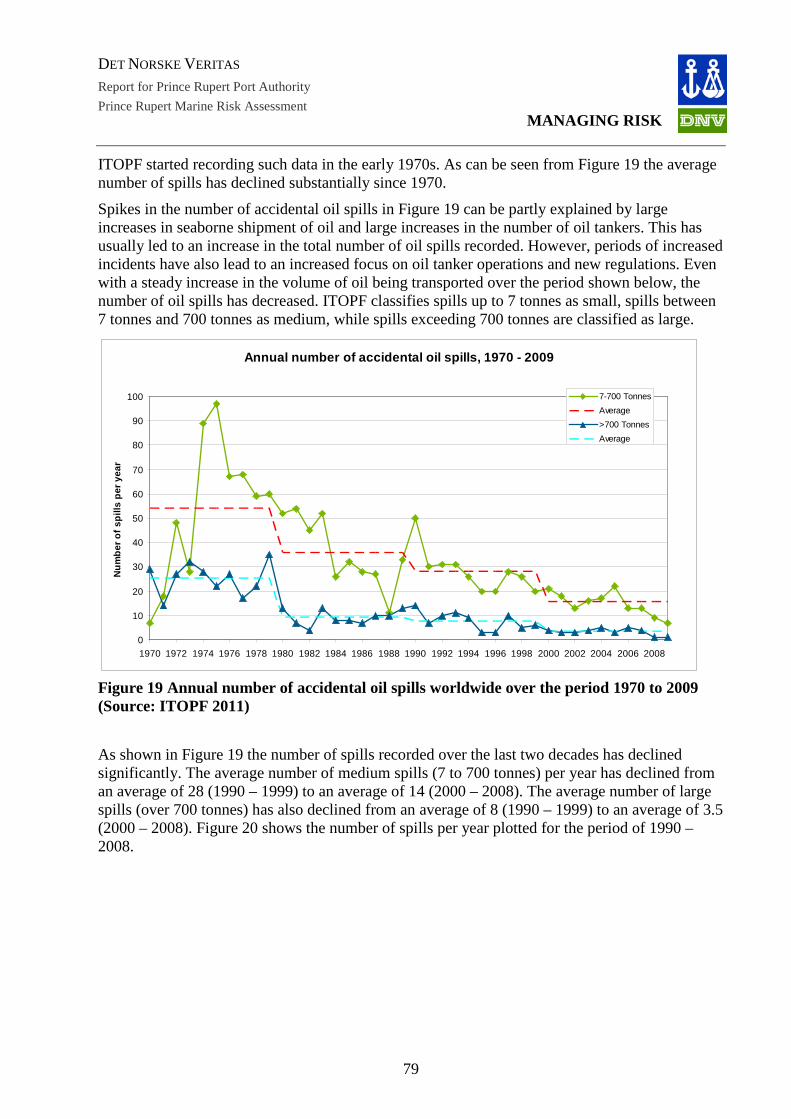
DET NORSKE VERITAS
Report for Prince Rupert Port Authority
MANAGING RISK Prince Rupert Marine Risk Assessment
ITOPF started recording such data in the early 1970s. As can be seen from Figure 19 the average number of spills has declined substantially since 1970.
Spikes in the number of accidental oil spills in Figure 19 can be partly explained by large increases in seaborne shipment of oil and large increases in the number of oil tankers. This has usually led to an increase in the total number of oil spills recorded. However, periods of increased incidents have also lead to an increased focus on oil tanker operations and new regulations. Even with a steady increase in the volume of oil being transported over the period shown below, the number of oil spills has decreased. ITOPF classifies spills up to 7 tonnes as small, spills between 7 tonnes and 700 tonnes as medium, while spills exceeding 700 tonnes are classified as large.
Annual number of accidental oil spills, 1970 - 2009
0
10
20
30
40
50
60
70
80
90
100
1970 1972 1974 1976 1978 1980 1982 1984 1986 1988 1990 1992 1994 1996 1998 2000 2002 2004 2006 2008
Num
ber o
f spi
lls p
er y
ear
7-700 Tonnes
Average
>700 Tonnes
Average
Figure 19 Annual number of accidental oil spills worldwide over the period 1970 to 2009 (Source: ITOPF 2011)
As shown in Figure 19 the number of spills recorded over the last two decades has declined significantly. The average number of medium spills (7 to 700 tonnes) per year has declined from an average of 28 (1990 – 1999) to an average of 14 (2000 – 2008). The average number of large spills (over 700 tonnes) has also declined from an average of 8 (1990 – 1999) to an average of 3.5 (2000 – 2008). Figure 20 shows the number of spills per year plotted for the period of 1990 – 2008.
79
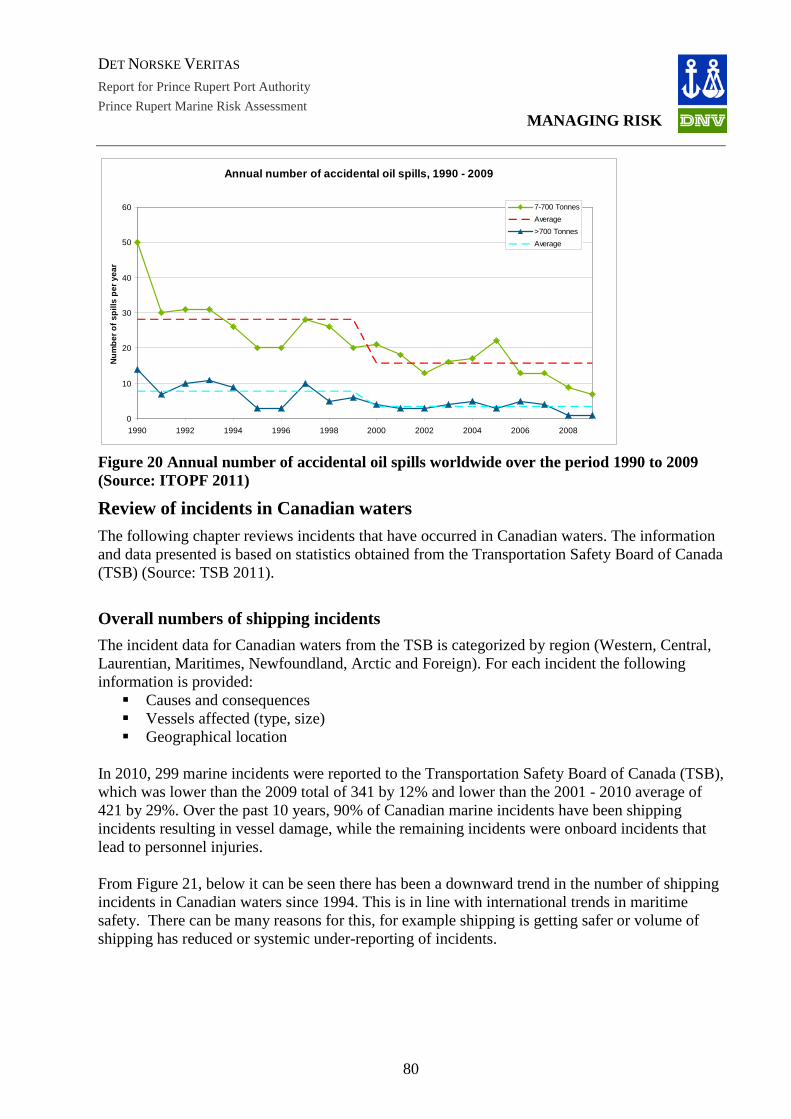
DET NORSKE VERITAS
Report for Prince Rupert Port Authority
MANAGING RISK Prince Rupert Marine Risk Assessment
Annual number of accidental oil spills, 1990 - 2009
0
10
20
30
40
50
60
1990 1992 1994 1996 1998 2000 2002 2004 2006 2008
Num
ber o
f spi
lls p
er y
ear
7-700 Tonnes
Average
>700 Tonnes
Average
Figure 20 Annual number of accidental oil spills worldwide over the period 1990 to 2009 (Source: ITOPF 2011)
Review of incidents in Canadian waters The following chapter reviews incidents that have occurred in Canadian waters. The information and data presented is based on statistics obtained from the Transportation Safety Board of Canada (TSB) (Source: TSB 2011).
Overall numbers of shipping incidents The incident data for Canadian waters from the TSB is categorized by region (Western, Central, Laurentian, Maritimes, Newfoundland, Arctic and Foreign). For each incident the following information is provided: Causes and consequences Vessels affected (type, size) Geographical location
In 2010, 299 marine incidents were reported to the Transportation Safety Board of Canada (TSB), which was lower than the 2009 total of 341 by 12% and lower than the 2001 - 2010 average of 421 by 29%. Over the past 10 years, 90% of Canadian marine incidents have been shipping incidents resulting in vessel damage, while the remaining incidents were onboard incidents that lead to personnel injuries. From Figure 21, below it can be seen there has been a downward trend in the number of shipping incidents in Canadian waters since 1994. This is in line with international trends in maritime safety. There can be many reasons for this, for example shipping is getting safer or volume of shipping has reduced or systemic under-reporting of incidents.
80

DET NORSKE VERITAS
Report for Prince Rupert Port Authority
MANAGING RISK Prince Rupert Marine Risk Assessment
Shipping incidents in Canadian waters, 1994-2010
0
100
200
300
400
500
600
700
800
900
1994 1996 1998 2000 2002 2004 2006 2008 2010
Num
ber o
f inc
iden
ts
Figure 21 Annual number of shipping incidents in Canadian waters over the period 1994 to 2010 (Source: TSB 2011)
Fatalities and injuries
Marine related fatalities and injuries are normally split into the following two categories: • Fatalities and injuries related to occupational (work related) incidents occurring during
normal ship operation • Fatalities and injuries related directly to shipping incidents (e.g. groundings and collisions).
Marine-related fatalities totaled 17 in 2010, Figure 22, up from the 2009 total of 13 but down from the 2005-2009 average of 19. Fishing vessel accidents accounted for 7 of the 11 shipping vessel fatalities in 2010.
Injuries in 2010 totaled 64, down from 68 in 2009 and the 2005-2009 average of 72. Fifty of the 64 injuries (48 of the 51 serious injuries) resulted from accidents aboard ship, and 11 of those (all serious) occurred aboard fishing vessels.
81
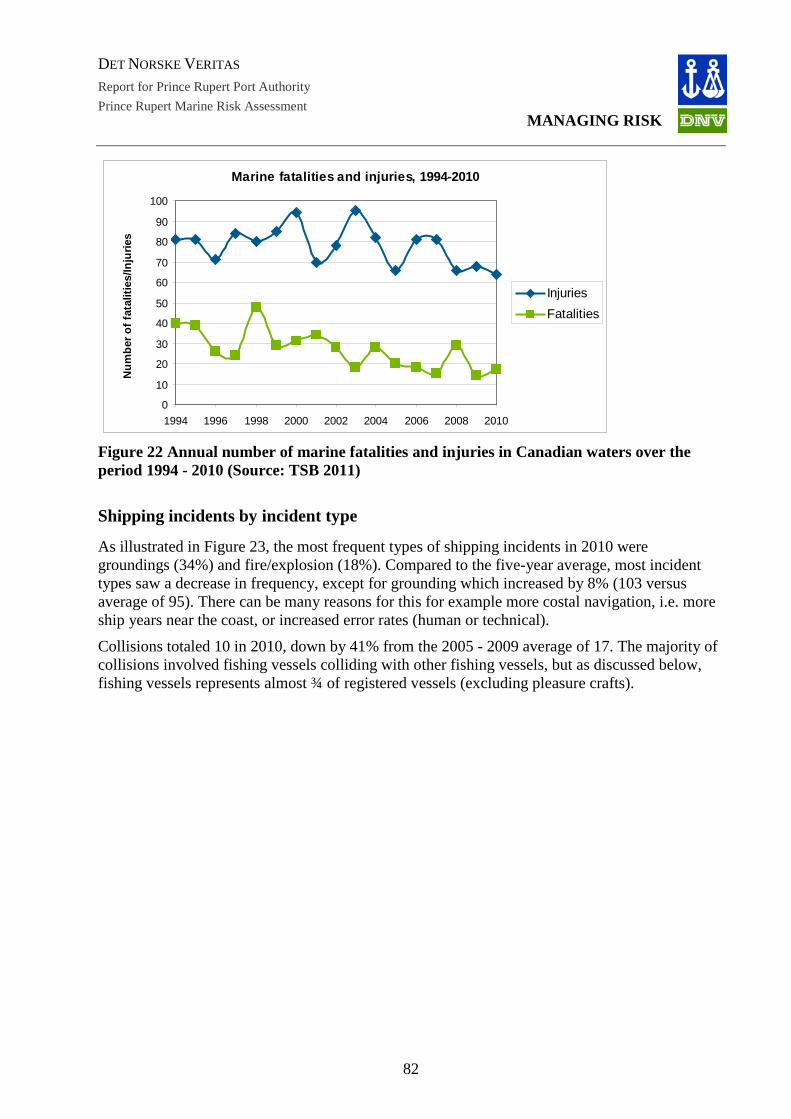
DET NORSKE VERITAS
Report for Prince Rupert Port Authority
MANAGING RISK Prince Rupert Marine Risk Assessment
Marine fatalities and injuries, 1994-2010
0
10
20
30
40
50
60
70
80
90
100
1994 1996 1998 2000 2002 2004 2006 2008 2010
Num
ber o
f fat
aliti
es/In
jurie
s
Injuries
Fatalities
Figure 22 Annual number of marine fatalities and injuries in Canadian waters over the period 1994 - 2010 (Source: TSB 2011)
Shipping incidents by incident type
As illustrated in Figure 23, the most frequent types of shipping incidents in 2010 were groundings (34%) and fire/explosion (18%). Compared to the five-year average, most incident types saw a decrease in frequency, except for grounding which increased by 8% (103 versus average of 95). There can be many reasons for this for example more costal navigation, i.e. more ship years near the coast, or increased error rates (human or technical).
Collisions totaled 10 in 2010, down by 41% from the 2005 - 2009 average of 17. The majority of collisions involved fishing vessels colliding with other fishing vessels, but as discussed below, fishing vessels represents almost ¾ of registered vessels (excluding pleasure crafts).
82

DET NORSKE VERITAS
Report for Prince Rupert Port Authority
MANAGING RISK Prince Rupert Marine Risk Assessment
Shipping incidents by accident type, 2003-2010
0
20
40
60
80
100
120
Co
llisi
on
Ca
psi
zin
g
Fo
un
de
rin
g/S
inki
ng
Fir
e/E
xplo
sio
n
Gro
un
din
g
Str
ikin
g
Ice
Da
ma
ge
Pro
pe
ller/
Ru
dd
er/
Str
uct
ura
l Da
ma
ge
Flo
od
ing
Oth
er
Num
ber o
f Inc
iden
ts
2005-2009 Average
2010
Figure 23 Number of shipping incidents in Canadian waters categorized by incident type for the period 2005 to 2010 (Source: TSB 2011)
Shipping incidents by vessel type
In 2010, there were 23 547 registered fishing vessels in Canada, representing 57% of all registered vessels excluding pleasure craft (Source: Transport Canada). Since 2001, 46% of the vessels involved in shipping accidents have been fishing vessels. In 2010, there were 136 fishing vessels involved in shipping accidents (Figure 24), compared to 140 in 2009 and the 2005-2009 average of 190. After fishing vessels, bulk carriers/OBO vessels (13%) and tugs/barges (13%) were involved most often in shipping accidents. Tanker vessels were the only vessel type with higher incident rate, 12, compared 2005 - 2009 average of 11.
Figure 24 shows the number of incidents per vessel type in Canadian waters
83
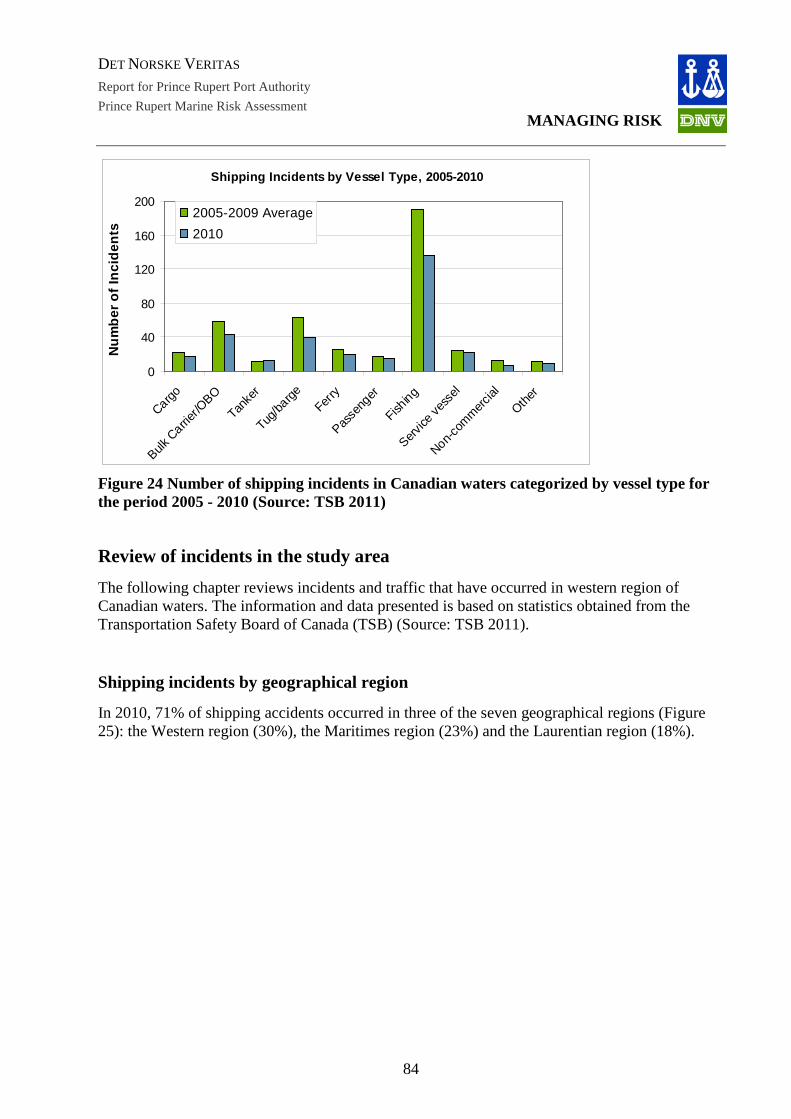
DET NORSKE VERITAS
Report for Prince Rupert Port Authority
MANAGING RISK Prince Rupert Marine Risk Assessment
Shipping Incidents by Vessel Type, 2005-2010
0
40
80
120
160
200
Cargo
Bulk C
arrier
/OBO
Tanke
r
Tug/b
arge
Ferry
Passe
nger
Fishing
Servic
e ve
ssel
Non-co
mm
ercia
l
Other
Num
ber o
f Inc
iden
ts
2005-2009 Average
2010
Figure 24 Number of shipping incidents in Canadian waters categorized by vessel type for the period 2005 - 2010 (Source: TSB 2011)
Review of incidents in the study area The following chapter reviews incidents and traffic that have occurred in western region of Canadian waters. The information and data presented is based on statistics obtained from the Transportation Safety Board of Canada (TSB) (Source: TSB 2011).
Shipping incidents by geographical region
In 2010, 71% of shipping accidents occurred in three of the seven geographical regions (Figure 25): the Western region (30%), the Maritimes region (23%) and the Laurentian region (18%).
84
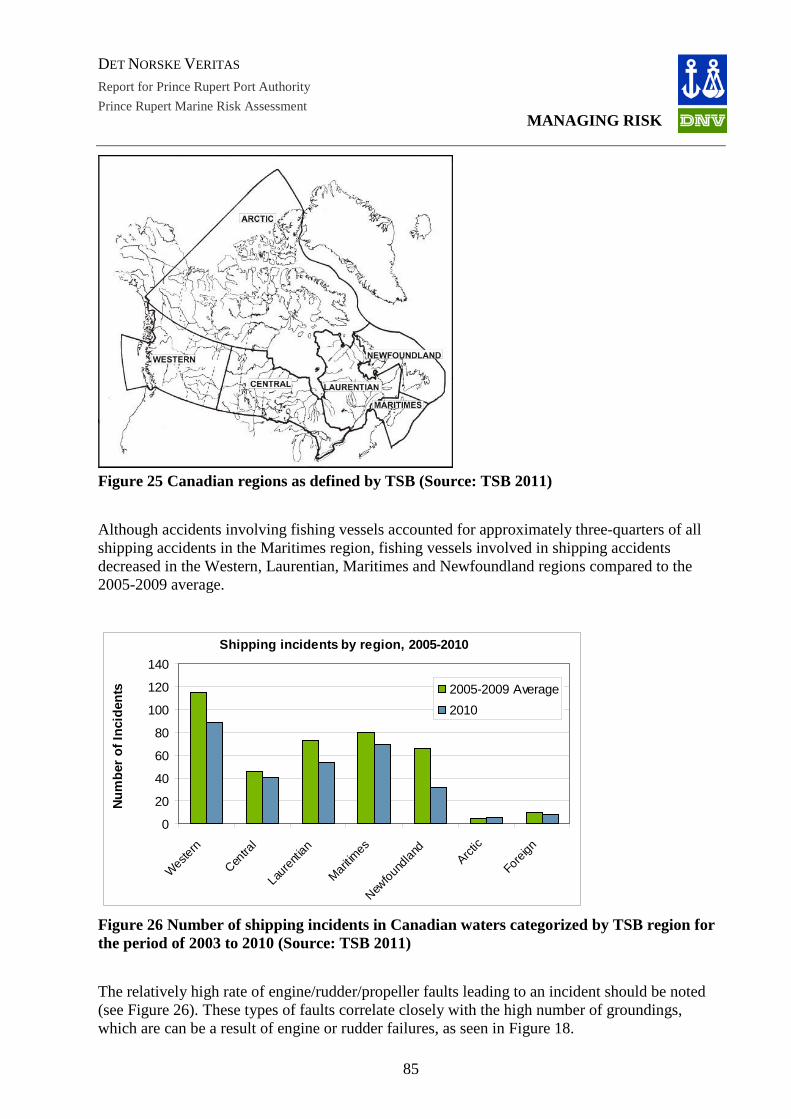
DET NORSKE VERITAS
Report for Prince Rupert Port Authority
MANAGING RISK Prince Rupert Marine Risk Assessment
Figure 25 Canadian regions as defined by TSB (Source: TSB 2011)
Although accidents involving fishing vessels accounted for approximately three-quarters of all shipping accidents in the Maritimes region, fishing vessels involved in shipping accidents decreased in the Western, Laurentian, Maritimes and Newfoundland regions compared to the 2005-2009 average.
Shipping incidents by region, 2005-2010
0
20
40
60
80
100
120
140
Wes
tern
Centra
l
Laur
entia
n
Mar
itimes
Newfo
undl
and
Arctic
Fore
ign
Num
ber o
f Inc
iden
ts 2005-2009 Average
2010
Figure 26 Number of shipping incidents in Canadian waters categorized by TSB region for the period of 2003 to 2010 (Source: TSB 2011)
The relatively high rate of engine/rudder/propeller faults leading to an incident should be noted (see Figure 26). These types of faults correlate closely with the high number of groundings, which are can be a result of engine or rudder failures, as seen in Figure 18.
85
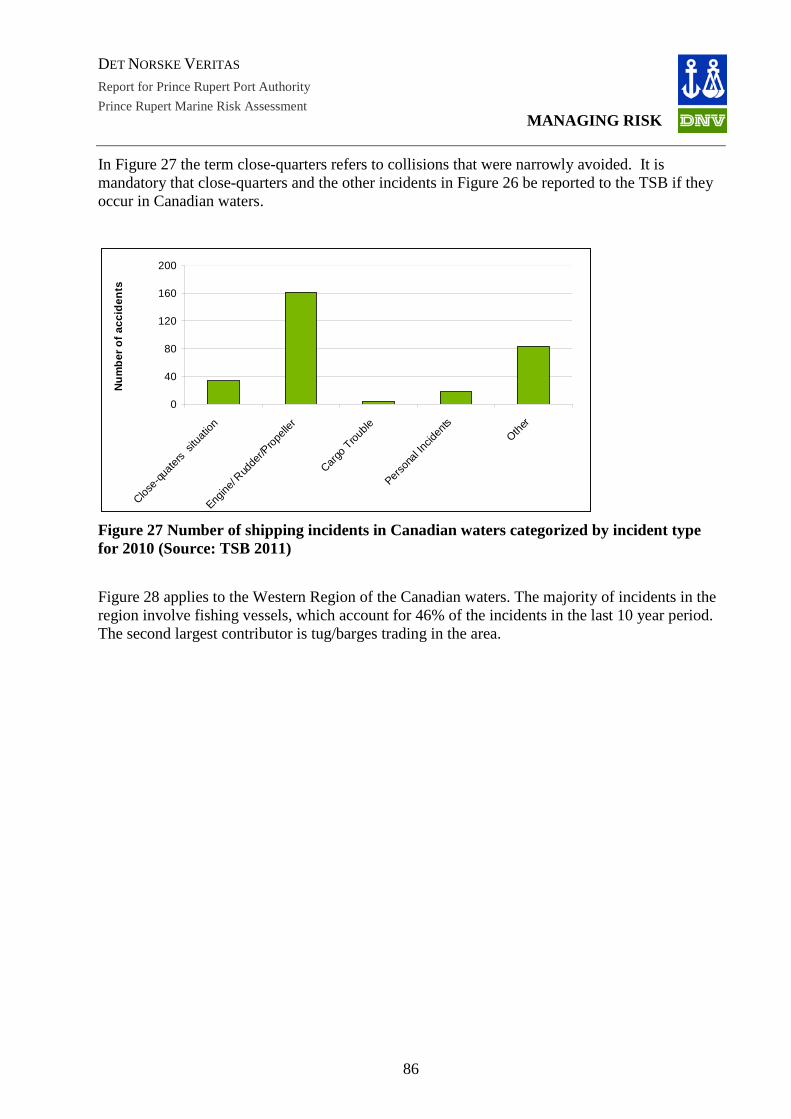
DET NORSKE VERITAS
Report for Prince Rupert Port Authority
MANAGING RISK Prince Rupert Marine Risk Assessment
In Figure 27 the term close-quarters refers to collisions that were narrowly avoided. It is mandatory that close-quarters and the other incidents in Figure 26 be reported to the TSB if they occur in Canadian waters.
0
40
80
120
160
200
Close-
quat
ers
situa
tion
Engine
/ Rud
der/P
rope
ller
Cargo
Tro
uble
Perso
nal In
ciden
tsOth
er
Num
ber o
f acc
iden
ts
Figure 27 Number of shipping incidents in Canadian waters categorized by incident type for 2010 (Source: TSB 2011)
Figure 28 applies to the Western Region of the Canadian waters. The majority of incidents in the region involve fishing vessels, which account for 46% of the incidents in the last 10 year period. The second largest contributor is tug/barges trading in the area.
86
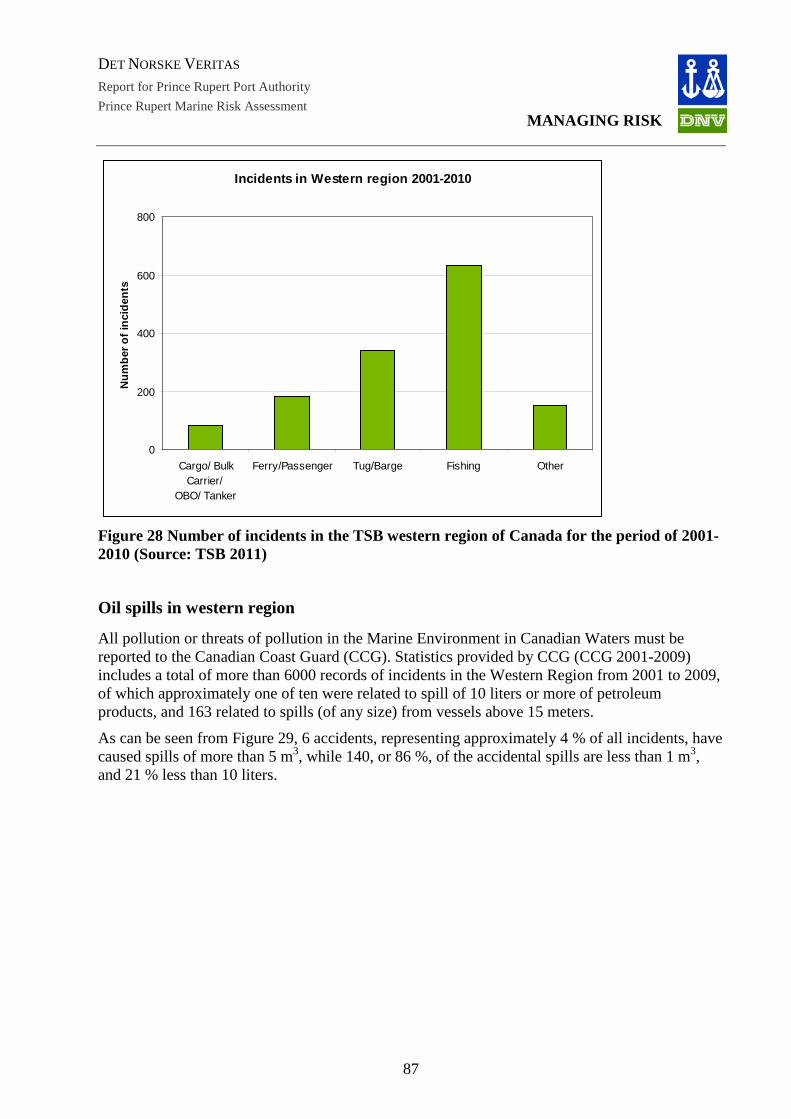
DET NORSKE VERITAS
Report for Prince Rupert Port Authority
MANAGING RISK Prince Rupert Marine Risk Assessment
Incidents in Western region 2001-2010
0
200
400
600
800
Cargo/ BulkCarrier/
OBO/ Tanker
Ferry/Passenger Tug/Barge Fishing Other
Num
ber o
f inc
iden
ts
Figure 28 Number of incidents in the TSB western region of Canada for the period of 2001-2010 (Source: TSB 2011)
Oil spills in western region
All pollution or threats of pollution in the Marine Environment in Canadian Waters must be reported to the Canadian Coast Guard (CCG). Statistics provided by CCG (CCG 2001-2009) includes a total of more than 6000 records of incidents in the Western Region from 2001 to 2009, of which approximately one of ten were related to spill of 10 liters or more of petroleum products, and 163 related to spills (of any size) from vessels above 15 meters.
As can be seen from Figure 29, 6 accidents, representing approximately 4 % of all incidents, have caused spills of more than 5 m3, while 140, or 86 %, of the accidental spills are less than 1 m3, and 21 % less than 10 liters.
87
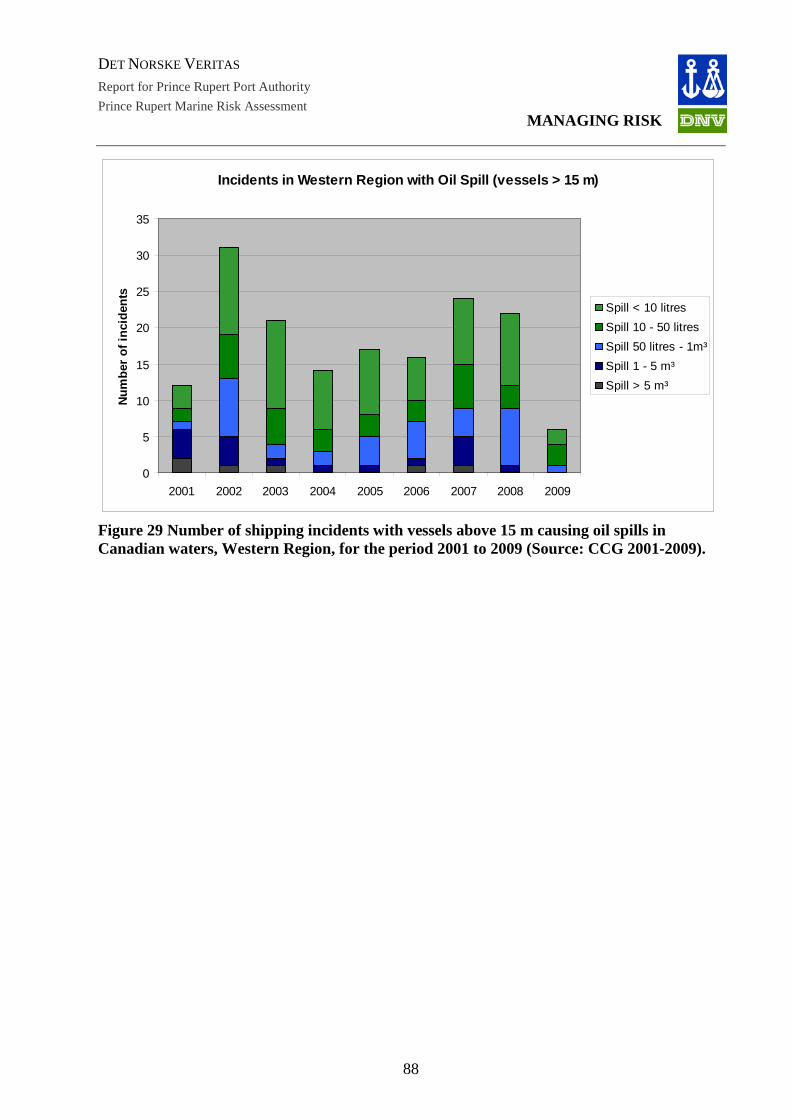
DET NORSKE VERITAS
Report for Prince Rupert Port Authority
MANAGING RISK Prince Rupert Marine Risk Assessment
Incidents in Western Region with Oil Spill (vessels > 15 m)
0
5
10
15
20
25
30
35
2001 2002 2003 2004 2005 2006 2007 2008 2009
Num
ber o
f inc
iden
ts
Spill < 10 litres
Spill 10 - 50 litres
Spill 50 litres - 1m³
Spill 1 - 5 m³
Spill > 5 m³
Figure 29 Number of shipping incidents with vessels above 15 m causing oil spills in Canadian waters, Western Region, for the period 2001 to 2009 (Source: CCG 2001-2009).
88
DET NORSKE VERITAS
Report for Prince Rupert Port Authority
MANAGING RISK Prince Rupert Marine Risk Assessment
APPENDIX 2 - RISK SCENARIOS The approach for the development of the risk scenarios for the Prince Rupert tanker study was based on the Transport Canada Pilotage Risk Assessment Methodology (PRMM).
The PRMM defines a risk Scenario as
“... a sequence of events potentially leading to an adverse consequence. The scenario must give consideration to the potential hazards as well as the current defenses and their effectiveness. “
The PRMM further indicates that:
“..... Each scenario will incorporate multiple hazards which, individually or collectively, have the potential to result in adverse consequences. Risk scenarios may be developed using a variety of means including: • Failure modes and effect analysis; • Review of historical data; • Using the experience of experts; • Fault tree analysis; or • Professional judgment (both internal and external).” For the purpose of this study, a review of historical data, the use of the experience from experts (from the HAZID) and professional judgment were applied to the development of the scenarios.
The PRMM further advises that each scenario is complemented by identification of current defense and potential outcomes.
“Once the pathway from the hazards to the adverse consequences is developed as a risk scenario, the statistical or other data required to support the frequency or severity estimations can be identified.”
Current defenses is defined as
“...physical or administrative measures to detect, reduce or prevent a potential adverse consequence. They can be designed to reduce the potential for an occurrence (e.g. navigational equipment) or to mitigate the adverse consequences resulting from an occurrence (e.g. oil spill containment equipment).”
Potential outcomes
“These could include collision, grounding, fire, flooding, personal injury, environmental damage or any number of other adverse consequences.” DNV identified 4 base scenarios that were applied to the two different type of vessels (Aframax oil tanker and Q-Max LNG carrier) resulting in eight risk scenarios. The 4 base scenarios are:
• Mechanical failure (Steering) resulting in a powered grounding
• Human error resulting in a collision
• Human factor resulting in a powered grounding (pilot incapacitation)
• Environmental factor resulting in a drift grounding (severe weather/ high winds)
89
DET NORSKE VERITAS
Report for Prince Rupert Port Authority
MANAGING RISK Prince Rupert Marine Risk Assessment
Scenario Number: 01 - Mechanical Failure (Steering) Resulting in a Powered Grounding of an Aframax Oil Tanker
Assumptions:
• 120K DWT Aframax Tanker loaded to capacity, 17.5 meters draft
• Assist tugs used during departure
• No escort tugs during the outbound transit
• Systems check conducted prior to departure all systems found satisfactory.
Scenario Description:
An outbound Aframax/Q-max vessel having completed loading operations of crude oil/LNG departs the Ridley Island (hypothetically) in route to an overseas destination. A tethered tug assists the vessel get underway and during its initial leg of the outbound journey, then it releases its line. The vessel transit is normal as it passes south of the Kinahan Islands. The vessel heading is 255 ° T, transiting at 15 knots when the pilots issues a command to begin altering the course to 260 ° following the deepwater channel south of Rachel Islands. The wheelman acknowledges the command, after several seconds the wheelman reports that the rudder is not responding and he will manually switch the secondary (redundant system) hydraulic system, confusion ensues as the pilot has trouble understanding the wheelman (due to language) and the master of the vessel attends to the issue and fails to explain the situation to the pilot. Meanwhile the pilot from experience recognizes the imminent casualty and orders a reduction of speed and anchors on standby as the vessel gets close to a critical change of direction point. The confusion delays the switching to the secondary system. By the time rudder control is restored the vessel reaches shallow ground south of the Kinahan islands and just north of Greentop. Its anchors are not deployed.
Hazards:
Hazards that can contribute to the scenario above include:
Natural Hazards
• Tides and currents
• Winds
• Restricted Channel
• Turns in channels
• Water Depth
• Rocky sea bottom
Physical Hazards – Man Made
• Other Marine Traffic
Human Hazards 90

DET NORSKE VERITAS
Report for Prince Rupert Port Authority
MANAGING RISK Prince Rupert Marine Risk Assessment
• Lack of Training / Qualifications
• Language barrier
Technical Hazards
• Mechanical Failure of steering control systems
• Mechanical failure of steering indication systems
• Failure of alarms systems
• Failure of communication systems
Economic Hazards
• Lack of maintenance, inspections due to budget
Current Defenses (Safeguards) For this scenario defenses include:
• IMO manning requirements
• Competent trained crews
• Competent trained pilots
• Safety regulations and standards
• Policies and procedures
• Communication and navigation equipment
• Redundant steering systems
• Double hull requirement for tankers
• Assist tugs based at the port
• Aids to navigation
• Charts
• MCTS
• CCG Environmental Response
• Western Canada Marine Response Corporation
Identify Potential Outcomes
• Human - Personnel injury from vessel running aground
• Property - None
• Vessel – Grounding with damage to the hull, damage to the rudder
• Environmental – Spill of cargo or bunker from damage to the fuel tanks and or double hull
• Reputation – Negative media reports against Operating Company, Pilots, Port Authority, Transport Canada, Canadian Coast Guard.
91
DET NORSKE VERITAS
Report for Prince Rupert Port Authority
MANAGING RISK Prince Rupert Marine Risk Assessment
Scenario Number: 02 - Mechanical Failure (Steering) Resulting in a Powered Grounding of a Q-Max LNG Carrier
Assumptions:
• 260,000 m3 Q-Max LNG carrier 345 m LOA, 55 m beam, 5 membrane tanks, loaded to capacity, 12 meters draft
• Assist tugs used during departure
• No escort tugs during the outbound transit
• Systems check conducted prior to departure all systems found satisfactory.
Scenario Description:
The scenario is for a Q-max tanker the rest is identical to the above scenario, see Scenario number 01.
Hazards:
Hazards that can contribute to the scenario above include:
Natural Hazards
• Tides and currents
• Winds
• Restricted Channel
• Turns in channels
• Water depth
• Rocky sea bottom
Physical Hazards – Man Made
• Other marine traffic
Human Hazards
• Lack of training / qualifications
• Language barrier
Technical Hazards
• Mechanical failure of steering control systems
• Mechanical failure of steering indication systems
• Failure of alarms systems
• Failure of communication systems
92
DET NORSKE VERITAS
Report for Prince Rupert Port Authority
MANAGING RISK Prince Rupert Marine Risk Assessment
• Vessel design, large exposed area
Economic Hazards
• Lack of maintenance, inspections due to budget
Current defenses (Safeguards)
• IMO manning requirements
• Competent trained crews
• Competent trained pilots
• Safety regulations and standards
• Policies and procedures
• Communication and navigation equipment
• Redundant steering systems
• Double hull requirement for tankers
• Assist tugs based at the port
• Aids to navigation
• Charts
• MCTS
Identify Potential Outcomes
• Human - Personnel injury from vessel running aground, personal injury or fatality from ignition of methane cloud
• Property – None
• Vessel – Damage to the Hull, damage to the rudder • Environmental – Spill of bunker from damage to the fuel tanks, release of methane (LNG)
into the marine environment. • Reputation – Negative media reports against Operating Company, Pilots, Port Authority,
Transport Canada, Canadian Coast Guard.
Scenario Number: 03 - Human Error Resulting in a Collision involving an Aframax Oil Tanker
Assumptions:
• 120K DWT Aframax Tanker loaded to capacity, 17.5 meters draft
• Nighttime operations
• Rainy weather
93

DET NORSKE VERITAS
Report for Prince Rupert Port Authority
MANAGING RISK Prince Rupert Marine Risk Assessment
• Assist tugs used during departure
• No escort tugs during the outbound transit
Scenario Description:
An outbound Aframax/Q-max vessel having completed loading operations departs the Ridley Island terminal (hypothetically) in route to an overseas destination. Vessel is traveling at night with light rain. A tethered tug assists the vessel get underway and during its initial leg of the outbound journey, then it releases its line. The vessel transit is normal as it passes south of the Kinahan Islands. The vessel heading is 255 ° T, transiting at 15 knots when the pilots issues a command to begin altering the course to 260 ° following the deep water channel south of Rachel Islands. The wheelman acknowledges the command, and successfully alters course as directed. Prior to the turn, the pilot observes on radar a vessel transiting northbound via the Malacca passage currently in a collision course. The master initiates contact with the vessel identified on AIS as a pleasure craft transiting at approximately 20 knots. The pilot’s attention is on negotiating the course alteration ensuring the vessel is on the right course. Master’s attempts to raise the pleasure craft are unsuccessful and both vessels continue in a collision course. Pilot orders reduction of speed to allow the pleasure craft to cross ahead and maintains course. Inexplicably the pleasure craft, a large yacht, alters course to starboard as to cross behind the vessel thus placing the vessels in an imminent collision course. The pilot maintains the vessel on course as is restricted by the waterway as it approaches the Rachel Islands. The yacht collides and glances off the stern of the vessel.
Hazards:
Hazards that can contribute to the scenario above include:
Natural Hazards
• Tides and currents
• Visibility
• Winds
• Restricted channel
• Turns in channels
• Water depth
• Rocky sea bottom
Physical Hazards – Man made
• Other marine traffic
Human Hazards
• Lack of training / qualifications
• Recreational boaters
94

DET NORSKE VERITAS
Report for Prince Rupert Port Authority
MANAGING RISK Prince Rupert Marine Risk Assessment
Technical Hazards
• Failure of communication systems
• Failure of navigation systems
Economic Hazards
• None
Current Defenses (Safeguards) For this scenario defenses include:
• Competent trained crews
• Competent trained pilots
• Recreational boater training of navigation rules
• Safety regulations and standards
• Policies and procedures
• Communication and navigation equipment
• Double hull requirement for tankers
• Aids to navigation
• Charts
• MCTS
• CCG environmental Response
• Western Canada Marine Response Corporation
Identify Potential Outcomes
• Human - Personnel injury from vessel collision, fatality from potential flooding, sinking
• Property - None
• Vessel – Damage to hull, flooding and sinking (pleasure craft)
• Environmental – Spill of bunker from damage to the fuel tank; spill of diesel from damage to pleasure craft fuel tanks
• Reputation – Negative media reports against Operating Company, Pilots, Port Authority, Transport Canada, Canadian Coast Guard.
95
DET NORSKE VERITAS
Report for Prince Rupert Port Authority
MANAGING RISK Prince Rupert Marine Risk Assessment
Scenario Number: 04 -Human Error Resulting in a Collision Involving a Q-Max LNG Carrier
Assumptions:
• 260,000 m3 Q-Max LNG carrier 345 m LOA, 55 m beam, 5 membrane tanks, loaded to capacity, 12 meters draft
• Nighttime operations
• Rainy weather
• Assist tugs used during departure
• No escort tugs during the outbound transit
14.1.1.2 Scenario Description:
The scenario is for a Q-max tanker the rest is identical to the above scenario, see scenario 03.
Hazards:
Hazards that can contribute to the scenario above include:
Natural Hazards
• Tides and currents
• Visibility
• Winds
• Restricted channel
• Turns in channels
• Water depth
• Rocky sea bottom
Physical Hazards – Man made
• Other marine traffic
Human Hazards
• Lack of training / qualifications
• Recreational boaters
Technical Hazards
• Failure of communication systems
• Failure of navigation systems
96
DET NORSKE VERITAS
Report for Prince Rupert Port Authority
MANAGING RISK Prince Rupert Marine Risk Assessment
Economic Hazards
• None
Current defenses (Safeguards) For this scenario defenses include:
• Competent trained crews
• Competent trained pilots
• Recreational boater training of navigation rules
• Safety regulations and standards
• Policies and procedures
• Communication and navigation equipment
• Double hull requirement for tankers
• Aids to navigation
• Charts
• MCTS
• CCG environmental Response
• Western Canada Marine Response Corporation
Identify Potential Outcomes
• Human - Personnel injury from vessel collision
• Property - None • Vessel – Damage to hull, flooding and sinking (pleasure craft) • Environmental – Spill of diesel from damage to pleasure craft fuel tanks
• Reputation – Negative media reports against Operating company, Pilots, Port Authority, Transport Canada, Canadian Coast Guard.
Scenario Number: 05 - Human Factor (Pilot Incapacitation) Resulting in a Powered Grounding of an Aframax oil tanker
Assumptions:
• 120K DWT Aframax Tanker loaded to capacity, 17.5 meters draft
• No escort tugs during the outbound transit
• Strong Winds
97
DET NORSKE VERITAS
Report for Prince Rupert Port Authority
MANAGING RISK Prince Rupert Marine Risk Assessment
Scenario Description:
An Aframax/Q-max vessel is outbound with a full load. The vessel heading is 310 ° T, following the deep water channel South of Rachael Islands transiting at 15 knots towards Triple Island pilots boarding area. Wheelman maintains course as per last pilot command. All seems normal as the vessel approaches the Rushton Islands. Then the wheelman and captain notice the vessel transit will take them very close to navigational aid Bell D72. Master calls upon the pilot who is sitting in a captain chair. The pilot is unresponsive and the master orders the engines slow as he tries to get a reaction from the pilot. The vessel runs aground in the vicinity of Rushton Island.
Hazards:
Hazards that can contribute to the scenario above include:
Natural Hazards
• Tides and currents
• Winds
• Restricted channel
• Water depth
• Rocky sea bottom
Physical Hazards – Man made
• None
Human Hazards
• Lack of training / qualifications
• Pilot’s health
Technical Hazards
• Depth sounding aid
Economic Hazards
• None
Current Defenses (Safeguards) For this scenario defenses include:
• Competent trained crews
• Competent trained pilots
• Safety regulations and standards
• Policies and procedures
• Communication and navigation equipment
• Double Hull requirement for tankers
• Assist tugs based at the port 98
DET NORSKE VERITAS
Report for Prince Rupert Port Authority
MANAGING RISK Prince Rupert Marine Risk Assessment
• Aids to navigation
• Charts
• MCTS
• CCG environmental Response
• Western Canada Marine Response Corporation
Identify Potential Outcomes
• Human - Personnel injury from vessel grounding
• Property - None
• Vessel – Grounding, damage to hull, damage to the rudder, vessel loss from structural failure
• Environmental – Spill of cargo or bunker from damage to the fuel tanks and or double hull
• Reputation – Negative media reports against Operating Company, Pilots, Port Authority, Transport Canada, Canadian Coast Guard.
Scenario Number: 06 - Human Factor (Pilot Incapacitation) Resulting in a Powered Grounding of a Q-Max LNG Carrier
Assumptions:
• 260,000 m3 Q-Max LNG carrier 345 m LOA, 55 m beam, 5 membrane tanks, loaded to capacity, 12 meters draft
• Strong winds
• No escort tugs during the outbound transit
Scenario Description:
The scenario is for a Q-max tanker the rest is identical to the above scenario, see scenario 03.
Hazards:
Hazards that can contribute to the scenario above include:
Natural Hazards
• Tides and currents
• Winds
• Restricted channel
• Water depth
• Rocky sea bottom
99

DET NORSKE VERITAS
Report for Prince Rupert Port Authority
MANAGING RISK Prince Rupert Marine Risk Assessment
Physical Hazards – Man made
• None
Human Hazards
• Lack of training / qualifications
• Pilot’s health
Technical Hazards
• Depth sounding aid
Economic Hazards
• None
Current defenses (Safeguards)
For this scenario defenses include:
• Competent trained crews
• Competent trained pilots
• Safety regulations and standards
• Policies and procedures
• Communication and navigation equipment
• Double hull requirement for tankers
• Assist tugs based at the port
• Aids to navigation
• Charts
• MCTS
• CCG environmental Response
• Western Canada Marine Response Corporation
Identify Potential Outcomes
• Human - Personnel injury from vessel grounding, personal injury or fatality from ignition of methane cloud
• Property - None
• Vessel – Grounding, damage to hull, damage to the rudder, vessel loss from structural failure
• Environmental – Spill of bunker from damage to the fuel tanks, release of methane (LNG) into the marine environment.
100

DET NORSKE VERITAS
Report for Prince Rupert Port Authority
MANAGING RISK Prince Rupert Marine Risk Assessment
• Reputation – Negative media reports against Operating Company, Pilots, Port Authority, Transport Canada, Canadian Coast Guard.
Scenario Number: 07 - Environmental Factor (Severe Weather/ High Winds) Resulting in a Drift Grounding of an Aframax Oil Tanker
Assumptions:
• 120K DWT Aframax Tanker loaded to capacity, 17.5 meters draft
• 150M LOA
• Strong Winds
• Sometime in January
• No pilot on board
Scenario Description:
An Aframax/Q-max vessel completed loading operations and has to move to anchorage X due to illness of the master. As required by port practices, the vessel maintains bridge watches, monitors channel 71, has engines ready for immediate maneuvering, in ballast and second anchor ready for letting go. MCTS issues a gale warning winds, strong winds are expected to occur in the PR area. Weather is described as strong gale out of the southeast, with heavy rain. The second officer reports the vessel is dragging anchor from the strong winds. The second anchor is let go and the engine is put at slow ahead, however due to excessive strain on the anchor chain, the starboard anchor chain snaps and is lost. The vessel begins a slow drift towards the Kinahan Islands dragging the port anchor. The vessel attempts to maintain control with full engine power, but her drift towards the Kinahan Islands continues and the second anchor is lost. After several minutes of drifting and numerous attempts to gain control of the vessel a moderate shock is felt as the vessel runs aground and the engine is stopped. The severe weather continued causing the vessel to continue impacting the ground. A crew member reports a strong smell of fuel.
Hazards:
Hazards that can contribute to the scenario above include:
Natural Hazards
• Tides and currents
• Gale strength winds
• Rocky sea bottom / islands
Physical Hazards – Man made
• None
Human Hazards
• Training / qualifications
Technical Hazards 101
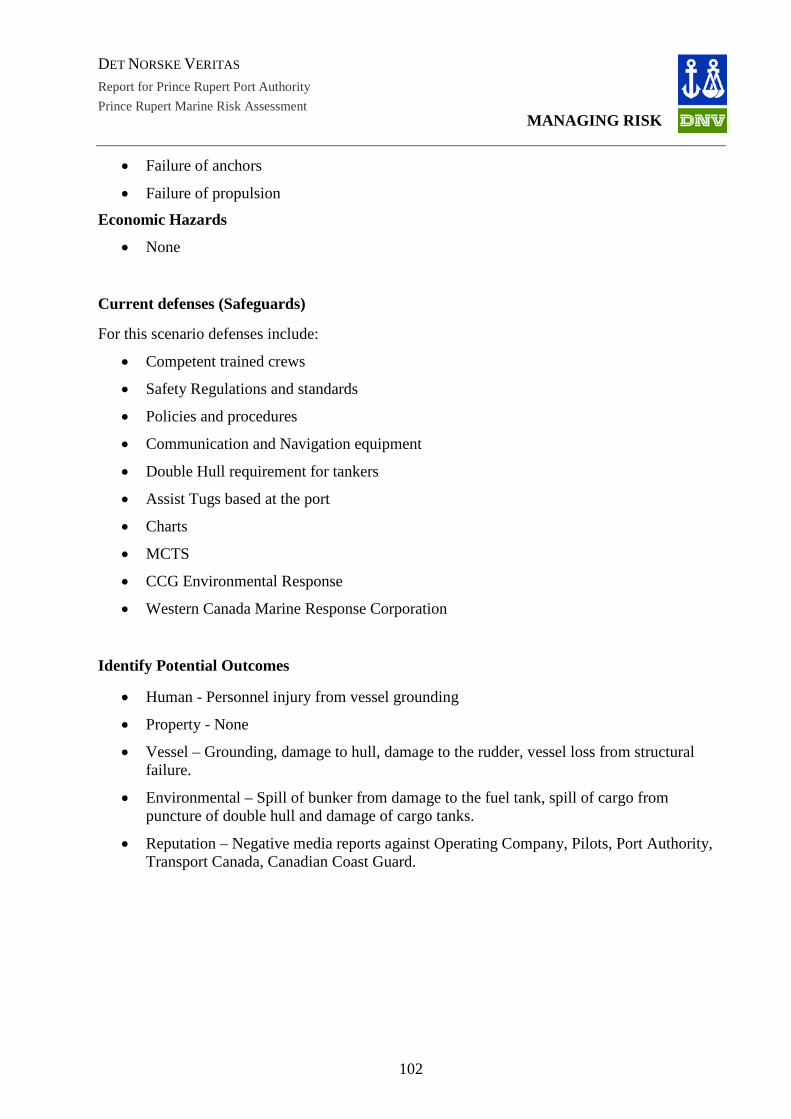
DET NORSKE VERITAS
Report for Prince Rupert Port Authority
MANAGING RISK Prince Rupert Marine Risk Assessment
• Failure of anchors
• Failure of propulsion
Economic Hazards
• None
Current defenses (Safeguards)
For this scenario defenses include:
• Competent trained crews
• Safety Regulations and standards
• Policies and procedures
• Communication and Navigation equipment
• Double Hull requirement for tankers
• Assist Tugs based at the port
• Charts
• MCTS
• CCG Environmental Response
• Western Canada Marine Response Corporation
Identify Potential Outcomes
• Human - Personnel injury from vessel grounding
• Property - None
• Vessel – Grounding, damage to hull, damage to the rudder, vessel loss from structural failure.
• Environmental – Spill of bunker from damage to the fuel tank, spill of cargo from puncture of double hull and damage of cargo tanks.
• Reputation – Negative media reports against Operating Company, Pilots, Port Authority, Transport Canada, Canadian Coast Guard.
102
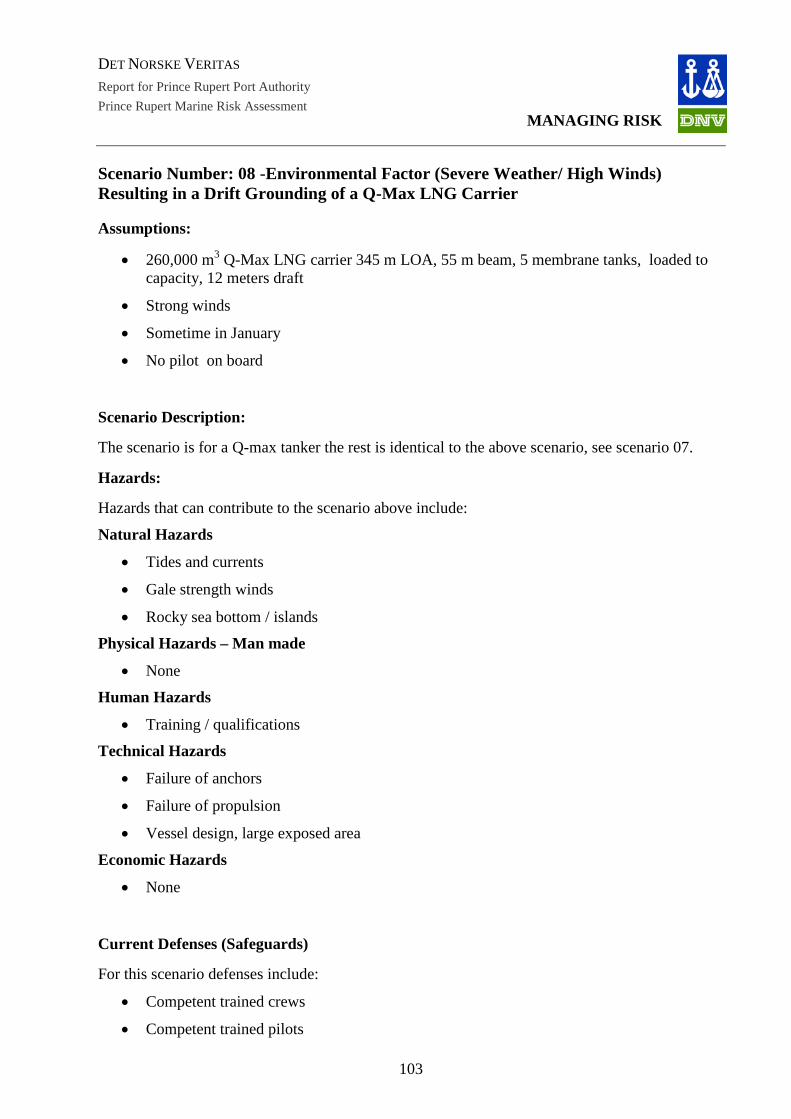
DET NORSKE VERITAS
Report for Prince Rupert Port Authority
MANAGING RISK Prince Rupert Marine Risk Assessment
Scenario Number: 08 -Environmental Factor (Severe Weather/ High Winds) Resulting in a Drift Grounding of a Q-Max LNG Carrier
Assumptions:
• 260,000 m3 Q-Max LNG carrier 345 m LOA, 55 m beam, 5 membrane tanks, loaded to capacity, 12 meters draft
• Strong winds
• Sometime in January
• No pilot on board
Scenario Description:
The scenario is for a Q-max tanker the rest is identical to the above scenario, see scenario 07.
Hazards:
Hazards that can contribute to the scenario above include:
Natural Hazards
• Tides and currents
• Gale strength winds
• Rocky sea bottom / islands
Physical Hazards – Man made
• None
Human Hazards
• Training / qualifications
Technical Hazards
• Failure of anchors
• Failure of propulsion
• Vessel design, large exposed area
Economic Hazards
• None
Current Defenses (Safeguards)
For this scenario defenses include:
• Competent trained crews
• Competent trained pilots
103
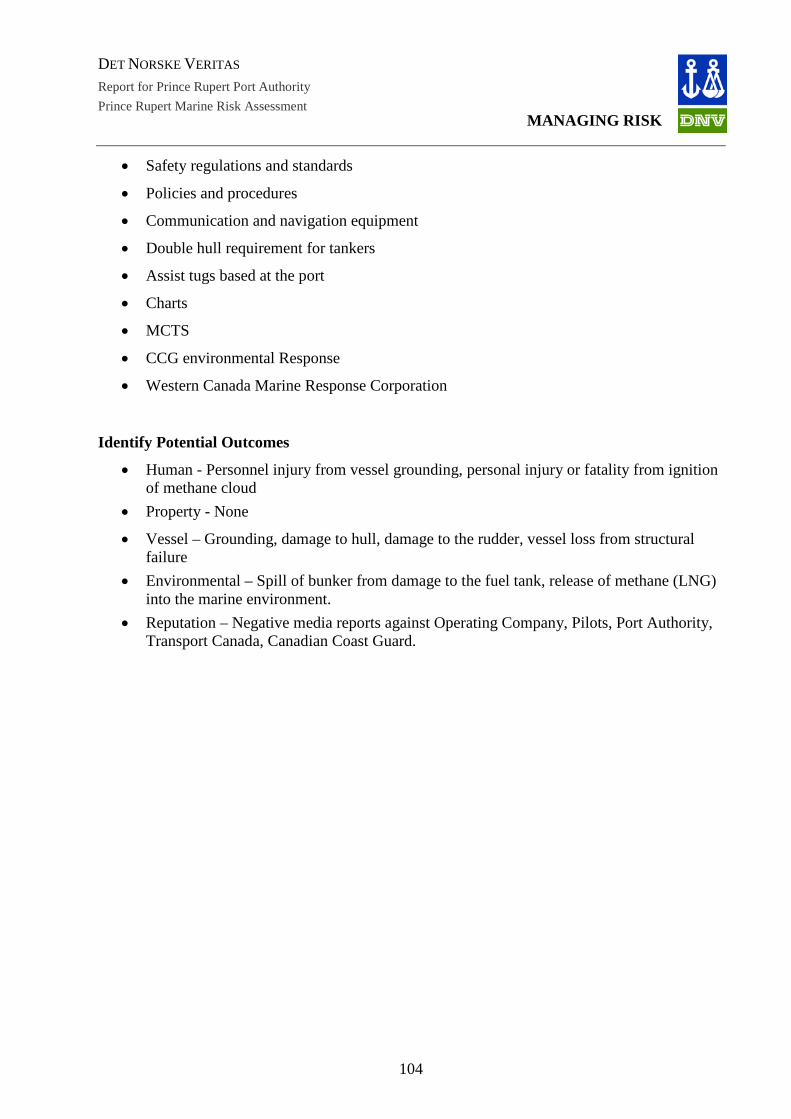
DET NORSKE VERITAS
Report for Prince Rupert Port Authority
MANAGING RISK Prince Rupert Marine Risk Assessment
• Safety regulations and standards
• Policies and procedures
• Communication and navigation equipment
• Double hull requirement for tankers
• Assist tugs based at the port
• Charts
• MCTS
• CCG environmental Response
• Western Canada Marine Response Corporation
Identify Potential Outcomes
• Human - Personnel injury from vessel grounding, personal injury or fatality from ignition of methane cloud
• Property - None
• Vessel – Grounding, damage to hull, damage to the rudder, vessel loss from structural failure
• Environmental – Spill of bunker from damage to the fuel tank, release of methane (LNG) into the marine environment.
• Reputation – Negative media reports against Operating Company, Pilots, Port Authority, Transport Canada, Canadian Coast Guard.
104
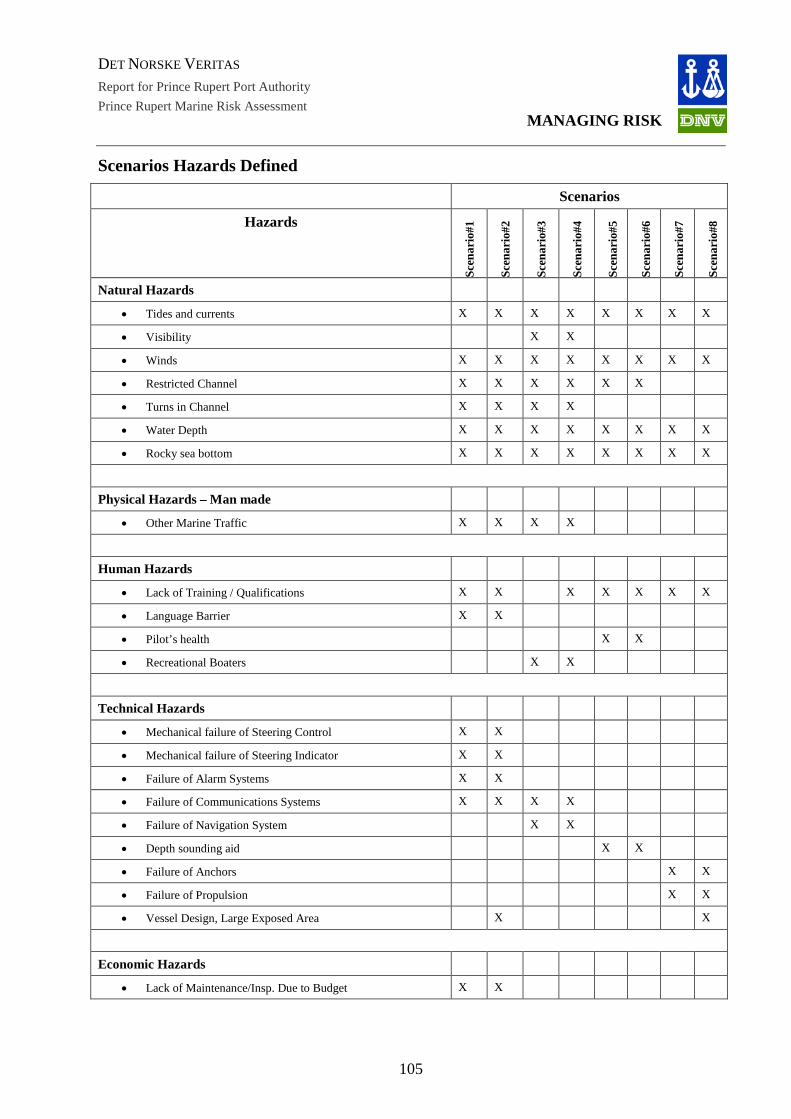
DET NORSKE VERITAS
Report for Prince Rupert Port Authority
MANAGING RISK Prince Rupert Marine Risk Assessment
Scenarios Hazards Defined Scenarios
Hazards
Scen
ario
#1
Scen
ario
#2
Scen
ario
#3
Scen
ario
#4
Scen
ario
#5
Scen
ario
#6
Scen
ario
#7
Scen
ario
#8
Natural Hazards
• Tides and currents X X X X X X X X
• Visibility X X
• Winds X X X X X X X X
• Restricted Channel X X X X X X
• Turns in Channel X X X X
• Water Depth X X X X X X X X
• Rocky sea bottom X X X X X X X X
Physical Hazards – Man made
• Other Marine Traffic X X X X
Human Hazards
• Lack of Training / Qualifications X X X X X X X
• Language Barrier X X
• Pilot’s health X X
• Recreational Boaters X X
Technical Hazards
• Mechanical failure of Steering Control X X
• Mechanical failure of Steering Indicator X X
• Failure of Alarm Systems X X
• Failure of Communications Systems X X X X
• Failure of Navigation System X X
• Depth sounding aid X X
• Failure of Anchors X X
• Failure of Propulsion X X
• Vessel Design, Large Exposed Area X X
Economic Hazards
• Lack of Maintenance/Insp. Due to Budget X X
105
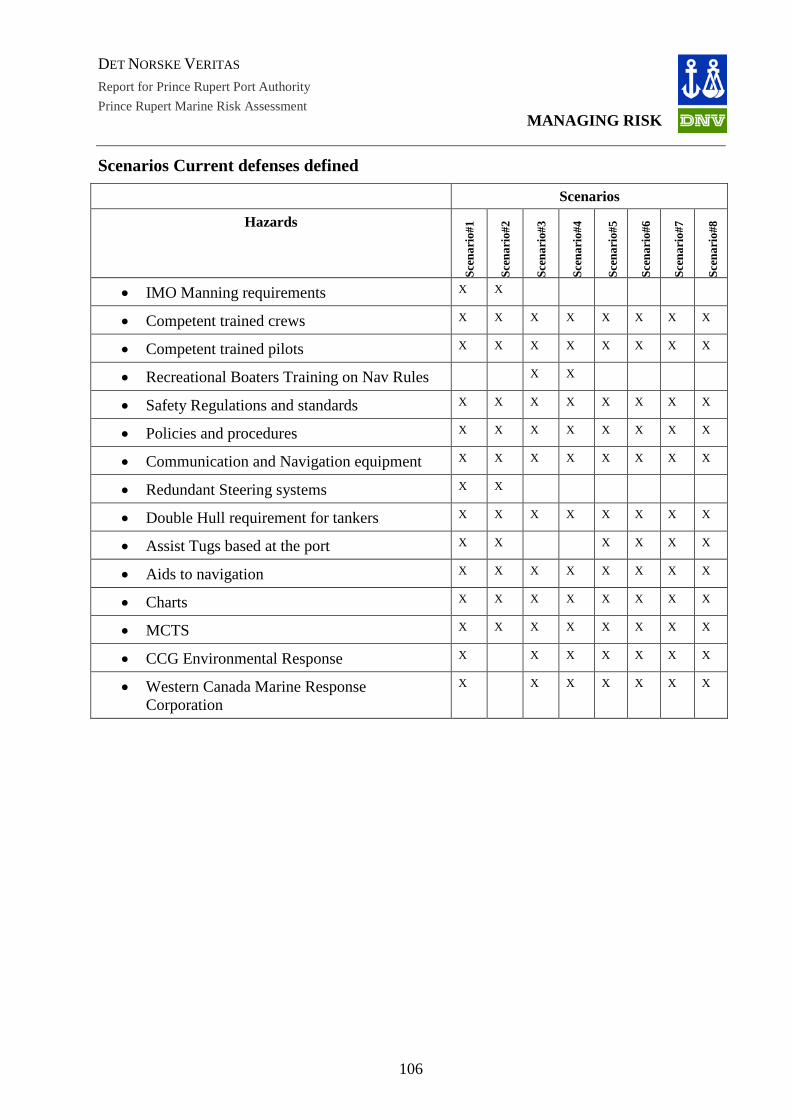
DET NORSKE VERITAS
Report for Prince Rupert Port Authority
MANAGING RISK Prince Rupert Marine Risk Assessment
Scenarios Current defenses defined Scenarios
Hazards
Scen
ario
#1
Scen
ario
#2
Scen
ario
#3
Scen
ario
#4
Scen
ario
#5
Scen
ario
#6
Scen
ario
#7
Scen
ario
#8
• IMO Manning requirements X X
• Competent trained crews X X X X X X X X
• Competent trained pilots X X X X X X X X
• Recreational Boaters Training on Nav Rules X X
• Safety Regulations and standards X X X X X X X X
• Policies and procedures X X X X X X X X
• Communication and Navigation equipment X X X X X X X X
• Redundant Steering systems X X
• Double Hull requirement for tankers X X X X X X X X
• Assist Tugs based at the port X X X X X X
• Aids to navigation X X X X X X X X
• Charts X X X X X X X X
• MCTS X X X X X X X X
• CCG Environmental Response X X X X X X X
• Western Canada Marine Response Corporation
X X X X X X X
106
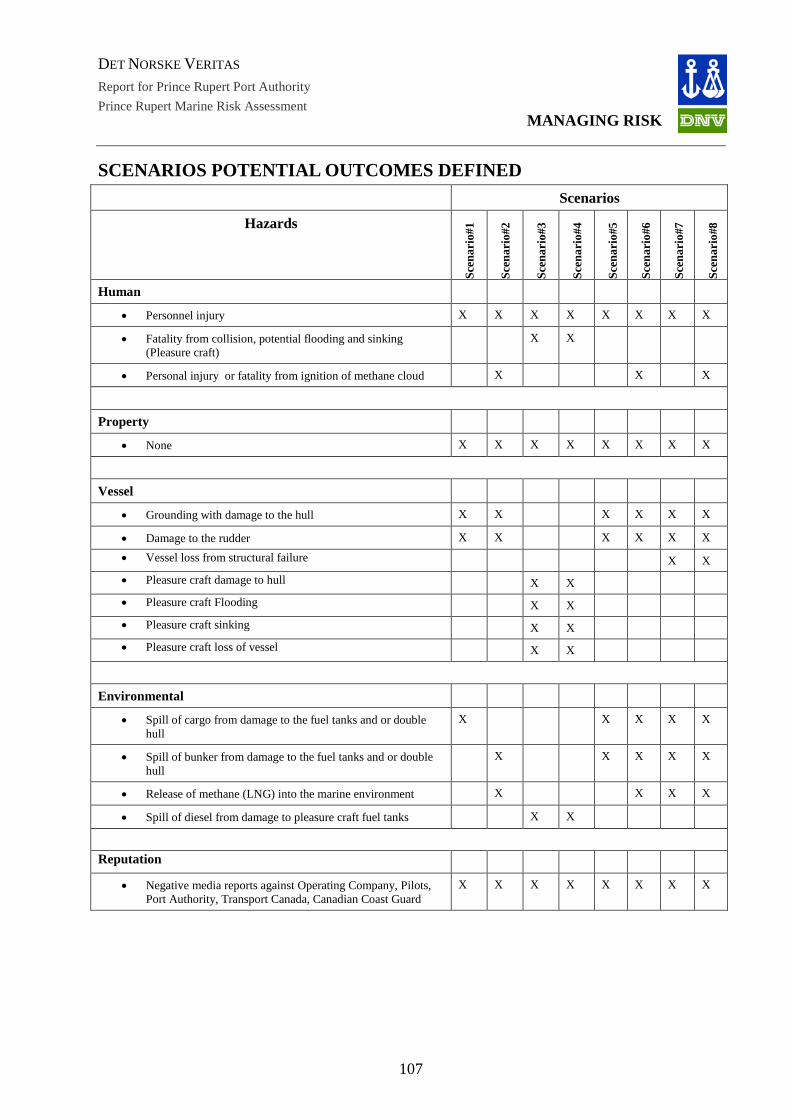
DET NORSKE VERITAS
Report for Prince Rupert Port Authority
MANAGING RISK Prince Rupert Marine Risk Assessment
SCENARIOS POTENTIAL OUTCOMES DEFINED Scenarios
Hazards
Scen
ario
#1
Scen
ario
#2
Scen
ario
#3
Scen
ario
#4
Scen
ario
#5
Scen
ario
#6
Scen
ario
#7
Scen
ario
#8
Human
• Personnel injury X X X X X X X X
• Fatality from collision, potential flooding and sinking (Pleasure craft)
X X
• Personal injury or fatality from ignition of methane cloud X X X
Property
• None X X X X X X X X
Vessel
• Grounding with damage to the hull X X X X X X
• Damage to the rudder X X X X X X
• Vessel loss from structural failure X X • Pleasure craft damage to hull X X • Pleasure craft Flooding X X • Pleasure craft sinking X X • Pleasure craft loss of vessel X X
Environmental
• Spill of cargo from damage to the fuel tanks and or double hull
X X X X X
• Spill of bunker from damage to the fuel tanks and or double hull
X X X X X
• Release of methane (LNG) into the marine environment X X X X
• Spill of diesel from damage to pleasure craft fuel tanks X X
Reputation
• Negative media reports against Operating Company, Pilots, Port Authority, Transport Canada, Canadian Coast Guard
X X X X X X X X
107
DET NORSKE VERITAS
Report for Prince Rupert Port Authority
MANAGING RISK Prince Rupert Marine Risk Assessment
APPENDIX 3 FREQUENCY ASSESSMENT
Vessel incident frequency data The incident frequency for transit to and from the terminal is based on the Lloyds Register Fairplay (LRFP) marine incident database. LRFP is generally considered as the most comprehensive incident database in the world recording incidents since 1978.
For the navigational risk assessment, statistics over the period 1990 – 2006 were utilized for vessel incidents during transit to and from the proposed terminal at Ridley Island, Prince Rupert. This is because vessels operating and incidents occurring after 1990 are considered to be more representative of modern tanker operation than what happened before 1990. In 2007, DNV did an oil & LNG carriers frequency study where statistics from the LRFP was extracted and analysed. These two reports presents the most accurate data and have therefore been used as basis for the worldwide frequencies in this study.
Incidents involving tankers of every size exceeding 10,000 gross registered tons are included. Few incidents have occurred off the BC coast and statistically valid incident frequencies could not be developed based on this small number of local events. Therefore, worldwide statistics must be used and scaled to the BC coast and Prince Rupert area. K factors are developed in chapter 8.2.
The frequency data derived from LRFP is considered to be valid for both oil & LNG carriers forecast to call at Ridley Island, Prince Rupert. Frequencies are influenced more by the specific shipping route than the type of tanker. The configuration and associated equipment for the different classes are not significantly different with regards to machinery / propulsion redundancy, navigational aids, thrusters function, etc.
Incidents in LRFP are divided into the following three damage categories:
Minor damage - any event reported to LRFP and included in the database, not being categorized as major damage or total loss.
Major damage - breakdown resulting in the ship being towed or requiring 3rd party assistance from ashore, or flooding of any compartment, or structural, mechanical or electrical damage requiring repairs before the ship can continue trading. In this context, major damage does not include total loss.
Total loss - where the ship ceases to exist after an incident, either due to it being irrecoverable (actual total loss) or due to it being subsequently broken up (constructive total loss). The latter occurs when the cost of repair would exceed the insured value of the ship.
Distance sailed by tankers & LNG carriers annually The typical tanker operating in the world is estimated to be at sea 65% of the year, with rest of the time spent in port or at anchor. This assumption is based on information from several tanker operators and industry experts.
108
DET NORSKE VERITAS
Report for Prince Rupert Port Authority
MANAGING RISK Prince Rupert Marine Risk Assessment
All three classes of tankers forecast to call at the terminal will have a design speed of approximately 15 knots (LRFP 2007) when sailing in open water. The actual speed at which tankers travel will be slower and will depends on factors such as weather (wind and waves), proximity to land and traffic, and whether the tanker is laden or in ballast. Therefore an average speed of 13 knots for a tanker at sea has been assumed. Based on the above assumptions a total sailed distance of 74,000 nm per year per tanker in operation has been calculated. It should be noted that the above discussion relates to typical world operations. In segments 3 and 4 in the assessment area leading to the Ridley island tankers will travel slower than this speed.
Distance sailed where Grounding, Collision and Foundering is a Hazard Of the 74,000 NM that a tanker is assumed to travel per annum, only a certain portion of that distance and time at sea will be in areas near land and in high traffic areas where the tanker will be at higher likelihood of certain incidents occurring. This chapter describes assumptions made on the distance travelled where certain hazards apply. These assumptions are based on information received by tanker operators and experienced tanker captains.
On average, tankers are assumed to sail in coastal areas where a powered grounding may occur 10% of the total time at sea (Source: RABASKA 2004). The assumption was based on a study of relevant vessels and their operating pattern.
A grounding incident may also occur when land is within drifting distance. On average, tankers are assumed to operate 15 % of the total time at sea in areas where a malfunction resulting in the vessel drifting might lead to grounding.
Collisions occur close to shore and in areas with heavy traffic (e.g. the English Channel). Therefore only a small portion of the distance tankers travel close to port is relevant to collision frequency and has been assessed by DNV (RABASKA 2004) to be about 20% of the distance travelled per year per tanker.
In the assessment of the likelihood of foundering it is assumed that 90% of the time tankers will be sailing in open seas where foundering can occur.
The frequencies from LRFP represent the average frequency of incidents for all tanker sizes in the worldwide trade. These base frequencies are divided by the appropriate sailing distance to provide a frequency per NM as described in subsequent chapters of this chapter.
Powered Grounding Powered grounding refers to when a ship with functioning mechanical and navigational equipment runs aground. This type of grounding is usually due to a navigator’s inability to follow the correct course. The reasons for such error can be misjudgment, lack of attention (situational awareness) or the navigator’s condition (illness, intoxication, etc.).
The powered grounding frequency is adjusted with respect to navigational route (number of course changes, distance to shore), operational measures (pilot) and navigational difficulty (visibility, markings, currents, traffic disturbance). The calculation is as shown in the formula below.
109
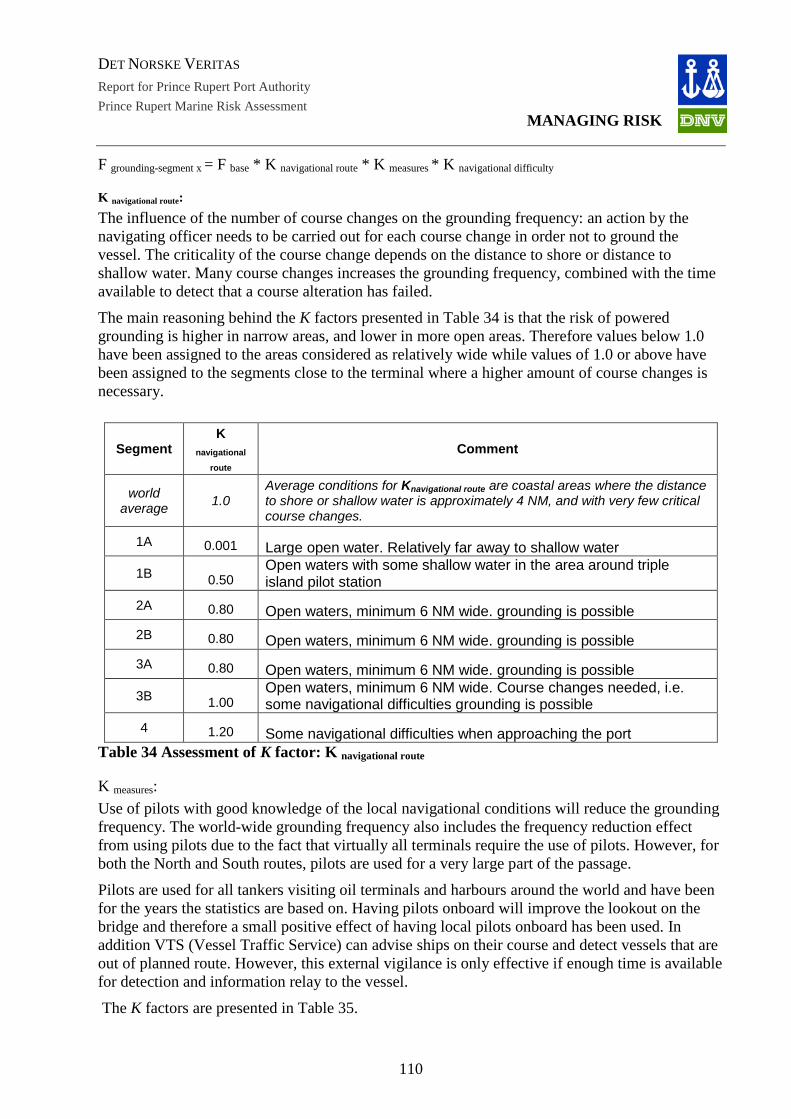
DET NORSKE VERITAS
Report for Prince Rupert Port Authority
MANAGING RISK Prince Rupert Marine Risk Assessment
F grounding-segment x = F base * K navigational route * K measures * K navigational difficulty
K navigational route: The influence of the number of course changes on the grounding frequency: an action by the navigating officer needs to be carried out for each course change in order not to ground the vessel. The criticality of the course change depends on the distance to shore or distance to shallow water. Many course changes increases the grounding frequency, combined with the time available to detect that a course alteration has failed.
The main reasoning behind the K factors presented in Table 34 is that the risk of powered grounding is higher in narrow areas, and lower in more open areas. Therefore values below 1.0 have been assigned to the areas considered as relatively wide while values of 1.0 or above have been assigned to the segments close to the terminal where a higher amount of course changes is necessary.
Segment K
navigational
route Comment
world average 1.0
Average conditions for Knavigational route are coastal areas where the distance to shore or shallow water is approximately 4 NM, and with very few critical course changes.
1A 0.001 Large open water. Relatively far away to shallow water
1B 0.50 Open waters with some shallow water in the area around triple island pilot station
2A 0.80 Open waters, minimum 6 NM wide. grounding is possible
2B 0.80 Open waters, minimum 6 NM wide. grounding is possible
3A 0.80 Open waters, minimum 6 NM wide. grounding is possible
3B 1.00 Open waters, minimum 6 NM wide. Course changes needed, i.e. some navigational difficulties grounding is possible
4 1.20 Some navigational difficulties when approaching the port Table 34 Assessment of K factor: K navigational route
K measures: Use of pilots with good knowledge of the local navigational conditions will reduce the grounding frequency. The world-wide grounding frequency also includes the frequency reduction effect from using pilots due to the fact that virtually all terminals require the use of pilots. However, for both the North and South routes, pilots are used for a very large part of the passage.
Pilots are used for all tankers visiting oil terminals and harbours around the world and have been for the years the statistics are based on. Having pilots onboard will improve the lookout on the bridge and therefore a small positive effect of having local pilots onboard has been used. In addition VTS (Vessel Traffic Service) can advise ships on their course and detect vessels that are out of planned route. However, this external vigilance is only effective if enough time is available for detection and information relay to the vessel.
The K factors are presented in Table 35.
110
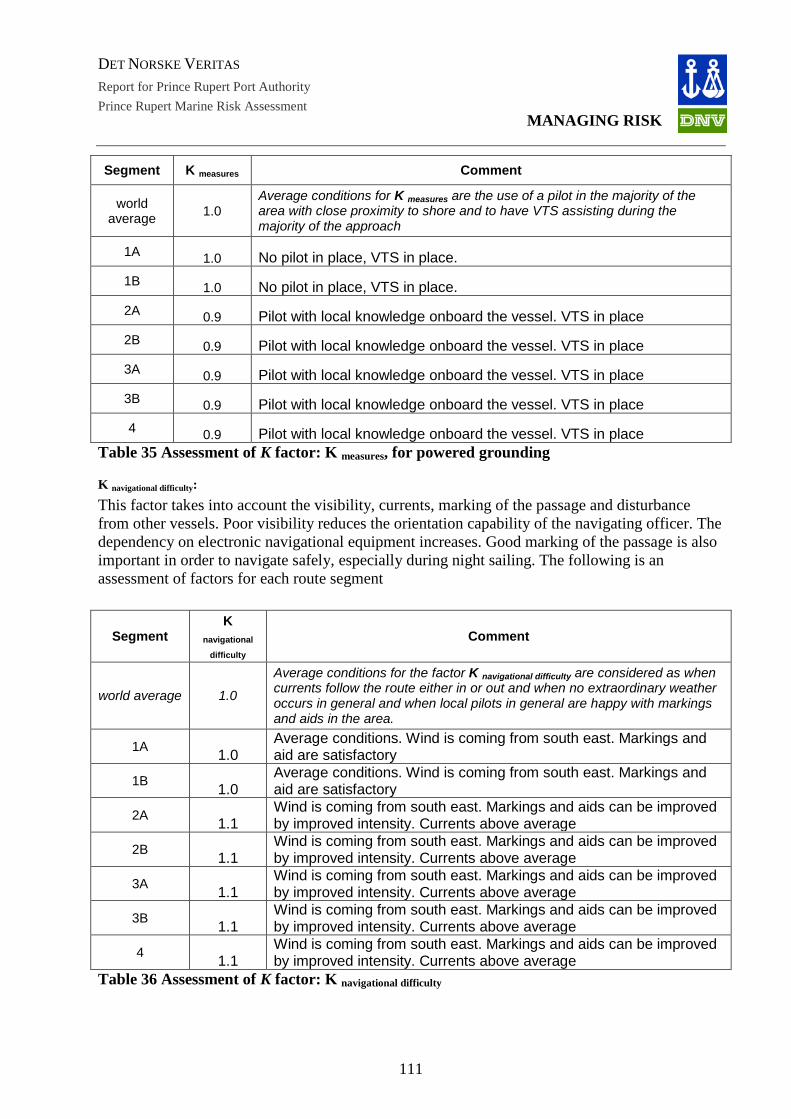
DET NORSKE VERITAS
Report for Prince Rupert Port Authority
MANAGING RISK Prince Rupert Marine Risk Assessment
Segment K measures Comment
world average
1.0 Average conditions for K measures are the use of a pilot in the majority of the area with close proximity to shore and to have VTS assisting during the majority of the approach
1A 1.0 No pilot in place, VTS in place.
1B 1.0 No pilot in place, VTS in place.
2A 0.9 Pilot with local knowledge onboard the vessel. VTS in place
2B 0.9 Pilot with local knowledge onboard the vessel. VTS in place
3A 0.9 Pilot with local knowledge onboard the vessel. VTS in place
3B 0.9 Pilot with local knowledge onboard the vessel. VTS in place
4 0.9 Pilot with local knowledge onboard the vessel. VTS in place Table 35 Assessment of K factor: K measures, for powered grounding K navigational difficulty: This factor takes into account the visibility, currents, marking of the passage and disturbance from other vessels. Poor visibility reduces the orientation capability of the navigating officer. The dependency on electronic navigational equipment increases. Good marking of the passage is also important in order to navigate safely, especially during night sailing. The following is an assessment of factors for each route segment
Segment K
navigational
difficulty Comment
world average 1.0
Average conditions for the factor K navigational difficulty are considered as when currents follow the route either in or out and when no extraordinary weather occurs in general and when local pilots in general are happy with markings and aids in the area.
1A 1.0
Average conditions. Wind is coming from south east. Markings and aid are satisfactory
1B 1.0
Average conditions. Wind is coming from south east. Markings and aid are satisfactory
2A 1.1
Wind is coming from south east. Markings and aids can be improved by improved intensity. Currents above average
2B 1.1
Wind is coming from south east. Markings and aids can be improved by improved intensity. Currents above average
3A 1.1
Wind is coming from south east. Markings and aids can be improved by improved intensity. Currents above average
3B 1.1
Wind is coming from south east. Markings and aids can be improved by improved intensity. Currents above average
4 1.1
Wind is coming from south east. Markings and aids can be improved by improved intensity. Currents above average
Table 36 Assessment of K factor: K navigational difficulty
111
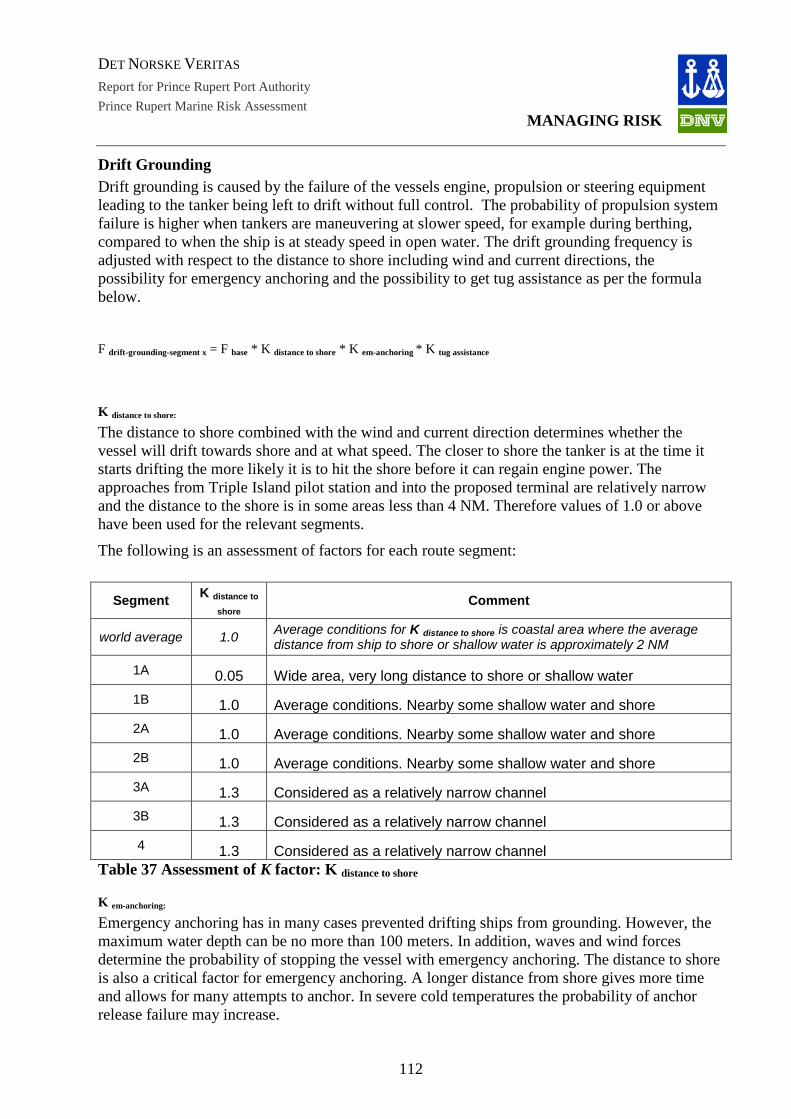
DET NORSKE VERITAS
Report for Prince Rupert Port Authority
MANAGING RISK Prince Rupert Marine Risk Assessment
Drift Grounding Drift grounding is caused by the failure of the vessels engine, propulsion or steering equipment leading to the tanker being left to drift without full control. The probability of propulsion system failure is higher when tankers are maneuvering at slower speed, for example during berthing, compared to when the ship is at steady speed in open water. The drift grounding frequency is adjusted with respect to the distance to shore including wind and current directions, the possibility for emergency anchoring and the possibility to get tug assistance as per the formula below.
F drift-grounding-segment x = F base * K distance to shore * K em-anchoring * K tug assistance
K distance to shore:
The distance to shore combined with the wind and current direction determines whether the vessel will drift towards shore and at what speed. The closer to shore the tanker is at the time it starts drifting the more likely it is to hit the shore before it can regain engine power. The approaches from Triple Island pilot station and into the proposed terminal are relatively narrow and the distance to the shore is in some areas less than 4 NM. Therefore values of 1.0 or above have been used for the relevant segments.
The following is an assessment of factors for each route segment:
Segment K distance to
shore Comment
world average 1.0 Average conditions for K distance to shore is coastal area where the average distance from ship to shore or shallow water is approximately 2 NM
1A 0.05 Wide area, very long distance to shore or shallow water
1B 1.0 Average conditions. Nearby some shallow water and shore
2A 1.0 Average conditions. Nearby some shallow water and shore
2B 1.0 Average conditions. Nearby some shallow water and shore
3A 1.3 Considered as a relatively narrow channel
3B 1.3 Considered as a relatively narrow channel
4 1.3 Considered as a relatively narrow channel Table 37 Assessment of K factor: K distance to shore
K em-anchoring: Emergency anchoring has in many cases prevented drifting ships from grounding. However, the maximum water depth can be no more than 100 meters. In addition, waves and wind forces determine the probability of stopping the vessel with emergency anchoring. The distance to shore is also a critical factor for emergency anchoring. A longer distance from shore gives more time and allows for many attempts to anchor. In severe cold temperatures the probability of anchor release failure may increase.
112

DET NORSKE VERITAS
Report for Prince Rupert Port Authority
MANAGING RISK Prince Rupert Marine Risk Assessment
The waters in the study area are deep (100 + meters) and the water depth increases rapidly with distance from shore. Therefore there are very few or no emergency anchoring possibilities in this area. Therefore, values of above 1.0 have been used.
The following assessment of the approach has been done:
Segment Kem-
anchoring Comment
world average 1.0 Average conditions for K em-anchoring failure is where possibilities for emergency
anchoring is possible at least 50% of the segment distance
1A 1.2
No possibilities of emergency anchoring because of water depth above 100m
1B 1.2
No possibilities of emergency anchoring because of water depth above 100m
2A 1.2
No possibilities of emergency anchoring because of water depth above 100m
2B 1.2
No possibilities of emergency anchoring because of water depth above 100m
3A 1.2
No possibilities of emergency anchoring because of water depth above 100m
3B 1.2
No possibilities emergency anchoring because of water depth above 100m
4 1.2
No possibilities of emergency anchoring because of water depth above 100m
Table 38 Assessment of K factor: K em-anchoring
K tug assistance: A tug can reduce the frequency of drift grounding if it has enough time to reach and take control of the vessel that lost its control. Tugs are available from Prince Rupert and the response time will depend on the distance from Prince Rupert to the drifting vessel.
The following assessment of the approach has been done:
Segment K tug assistance Comment
world average 1.0 Average conditions for K tug assistance is when a tug can come to assistance
within 1 hour after emergency call
1A 1.2 No tug close enough to be able to assist
1B 1.2 No tug close enough to be able to assist
2A 1.2 No tug close enough to be able to assist
2B 1.2 No tug close enough to be able to assist
3A 0.8 Tug available from Prince Rupert. Will be able to assist vessel in less
than 1 hour
3B 0.8 Tug available from Prince Rupert. Will be able to assist vessel in less
than 1 hour
4 0.5 Tug available from Prince Rupert. Will be able to assist vessel within a
very short time period Table 39 Assessment of K factor: K tug assistance
113
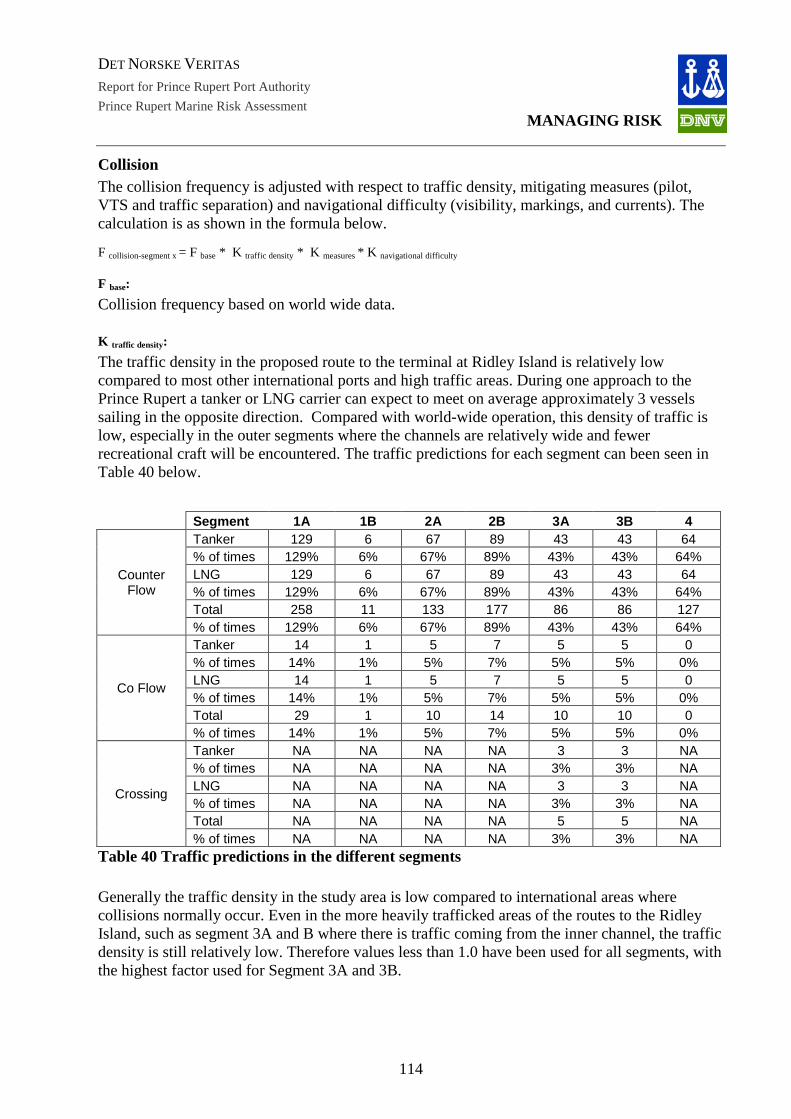
DET NORSKE VERITAS
Report for Prince Rupert Port Authority
MANAGING RISK Prince Rupert Marine Risk Assessment
Collision The collision frequency is adjusted with respect to traffic density, mitigating measures (pilot, VTS and traffic separation) and navigational difficulty (visibility, markings, and currents). The calculation is as shown in the formula below.
F collision-segment x = F base * K traffic density * K measures * K navigational difficulty
F base: Collision frequency based on world wide data.
K traffic density: The traffic density in the proposed route to the terminal at Ridley Island is relatively low compared to most other international ports and high traffic areas. During one approach to the Prince Rupert a tanker or LNG carrier can expect to meet on average approximately 3 vessels sailing in the opposite direction. Compared with world-wide operation, this density of traffic is low, especially in the outer segments where the channels are relatively wide and fewer recreational craft will be encountered. The traffic predictions for each segment can been seen in Table 40 below.
Segment 1A 1B 2A 2B 3A 3B 4
Counter Flow
Tanker 129 6 67 89 43 43 64 % of times 129% 6% 67% 89% 43% 43% 64% LNG 129 6 67 89 43 43 64 % of times 129% 6% 67% 89% 43% 43% 64% Total 258 11 133 177 86 86 127 % of times 129% 6% 67% 89% 43% 43% 64%
Co Flow
Tanker 14 1 5 7 5 5 0 % of times 14% 1% 5% 7% 5% 5% 0% LNG 14 1 5 7 5 5 0 % of times 14% 1% 5% 7% 5% 5% 0% Total 29 1 10 14 10 10 0 % of times 14% 1% 5% 7% 5% 5% 0%
Crossing
Tanker NA NA NA NA 3 3 NA % of times NA NA NA NA 3% 3% NA LNG NA NA NA NA 3 3 NA % of times NA NA NA NA 3% 3% NA Total NA NA NA NA 5 5 NA % of times NA NA NA NA 3% 3% NA
Table 40 Traffic predictions in the different segments Generally the traffic density in the study area is low compared to international areas where collisions normally occur. Even in the more heavily trafficked areas of the routes to the Ridley Island, such as segment 3A and B where there is traffic coming from the inner channel, the traffic density is still relatively low. Therefore values less than 1.0 have been used for all segments, with the highest factor used for Segment 3A and 3B.
114
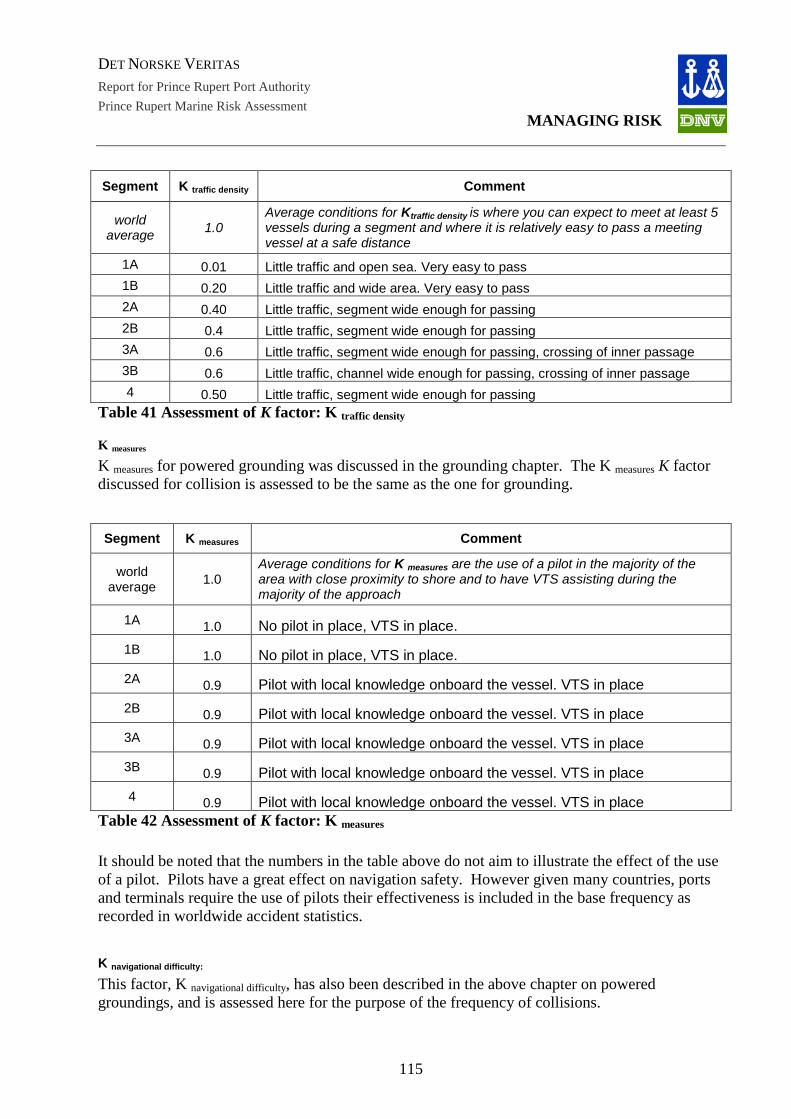
DET NORSKE VERITAS
Report for Prince Rupert Port Authority
MANAGING RISK Prince Rupert Marine Risk Assessment
Segment K traffic density Comment
world average 1.0
Average conditions for Ktraffic density is where you can expect to meet at least 5 vessels during a segment and where it is relatively easy to pass a meeting vessel at a safe distance
1A 0.01 Little traffic and open sea. Very easy to pass
1B 0.20 Little traffic and wide area. Very easy to pass
2A 0.40 Little traffic, segment wide enough for passing
2B 0.4 Little traffic, segment wide enough for passing
3A 0.6 Little traffic, segment wide enough for passing, crossing of inner passage
3B 0.6 Little traffic, channel wide enough for passing, crossing of inner passage
4 0.50 Little traffic, segment wide enough for passing Table 41 Assessment of K factor: K traffic density
K measures
K measures for powered grounding was discussed in the grounding chapter. The K measures K factor discussed for collision is assessed to be the same as the one for grounding.
Segment K measures Comment
world average
1.0 Average conditions for K measures are the use of a pilot in the majority of the area with close proximity to shore and to have VTS assisting during the majority of the approach
1A 1.0 No pilot in place, VTS in place.
1B 1.0 No pilot in place, VTS in place.
2A 0.9 Pilot with local knowledge onboard the vessel. VTS in place
2B 0.9 Pilot with local knowledge onboard the vessel. VTS in place
3A 0.9 Pilot with local knowledge onboard the vessel. VTS in place
3B 0.9 Pilot with local knowledge onboard the vessel. VTS in place
4 0.9 Pilot with local knowledge onboard the vessel. VTS in place Table 42 Assessment of K factor: K measures It should be noted that the numbers in the table above do not aim to illustrate the effect of the use of a pilot. Pilots have a great effect on navigation safety. However given many countries, ports and terminals require the use of pilots their effectiveness is included in the base frequency as recorded in worldwide accident statistics. K navigational difficulty:
This factor, K navigational difficulty, has also been described in the above chapter on powered groundings, and is assessed here for the purpose of the frequency of collisions.
115
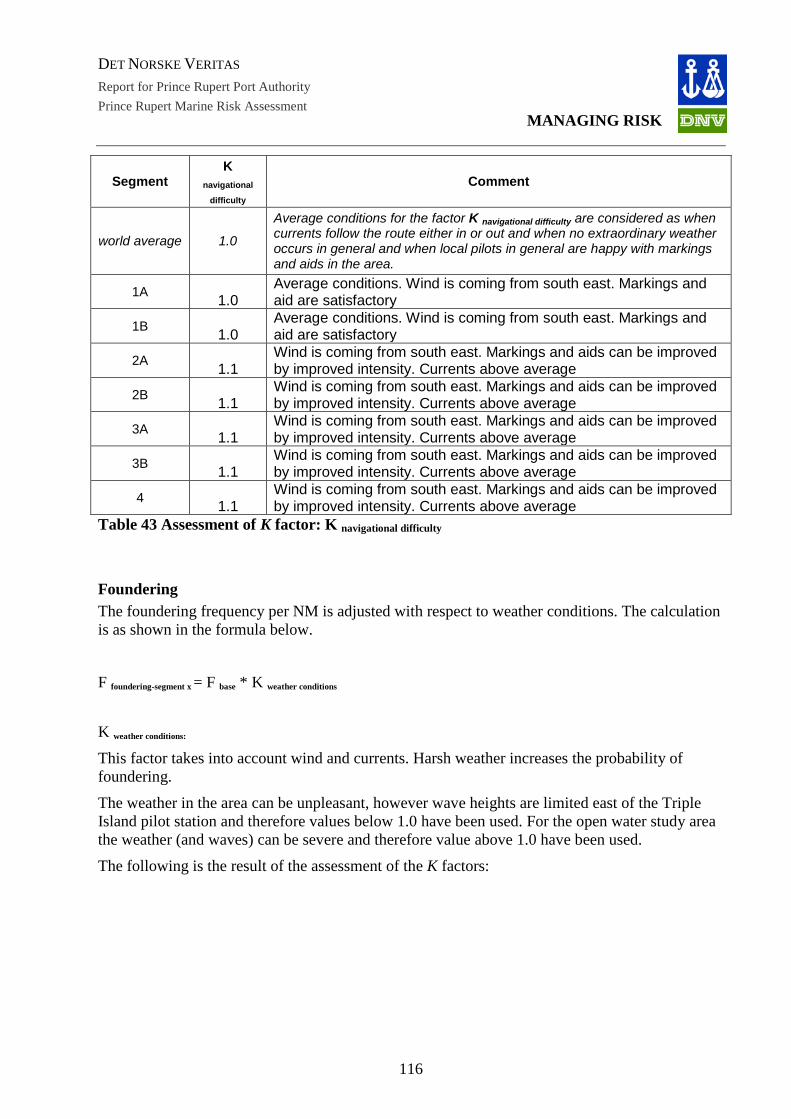
DET NORSKE VERITAS
Report for Prince Rupert Port Authority
MANAGING RISK Prince Rupert Marine Risk Assessment
Segment K
navigational
difficulty Comment
world average 1.0
Average conditions for the factor K navigational difficulty are considered as when currents follow the route either in or out and when no extraordinary weather occurs in general and when local pilots in general are happy with markings and aids in the area.
1A 1.0
Average conditions. Wind is coming from south east. Markings and aid are satisfactory
1B 1.0
Average conditions. Wind is coming from south east. Markings and aid are satisfactory
2A 1.1
Wind is coming from south east. Markings and aids can be improved by improved intensity. Currents above average
2B 1.1
Wind is coming from south east. Markings and aids can be improved by improved intensity. Currents above average
3A 1.1
Wind is coming from south east. Markings and aids can be improved by improved intensity. Currents above average
3B 1.1
Wind is coming from south east. Markings and aids can be improved by improved intensity. Currents above average
4 1.1
Wind is coming from south east. Markings and aids can be improved by improved intensity. Currents above average
Table 43 Assessment of K factor: K navigational difficulty
Foundering The foundering frequency per NM is adjusted with respect to weather conditions. The calculation is as shown in the formula below.
F foundering-segment x = F base * K weather conditions
K weather conditions:
This factor takes into account wind and currents. Harsh weather increases the probability of foundering.
The weather in the area can be unpleasant, however wave heights are limited east of the Triple Island pilot station and therefore values below 1.0 have been used. For the open water study area the weather (and waves) can be severe and therefore value above 1.0 have been used.
The following is the result of the assessment of the K factors:
116

DET NORSKE VERITAS
Report for Prince Rupert Port Authority
MANAGING RISK Prince Rupert Marine Risk Assessment
Segment K weather
conditions Comment
world average
1.0 Average condition for the factor K weather conditions is considered as when wind and waves follow the route either in or out and when no extraordinary weather occurs in general
1A 1.5 Hard weather conditions, open sea
1B 1 Average weather conditions, some what sheltered
2A 0.5 No excessive weather and no high waves
2B 0.5 No excessive weather and no high waves
3A 0.5 No excessive weather and no high waves
3B 0.5 No excessive weather and no high waves
4 0.01 No excessive weather and no high waves Table 44 Assessment of K factor: K weather conditions
117
DET NORSKE VERITAS
Report for Prince Rupert Port Authority
MANAGING RISK Prince Rupert Marine Risk Assessment
APPENDIX 4 - CONSEQUENCE ASSESSMENT
Grounding
Probability of Oil Spill The consequence to the vessel given grounding will depend on a number of factors, such as:
• type of hull
• type of seabed (rock or sand)
• vessel speed at time of impact
• environmental conditions (weather, wind, tidal range) The type of hull is assessed individually for each incident scenario. An oil leak will occur when both the inner and outer hull in a double hull tanker are breached,
The frequency distribution between minor damage, major damage and total loss, as recorded in LRFP, is shown in Table 45 The conditional probability of a spill, or the probability a spill results provided an incident has already occurred, is based on the discussion that follows.
Laden vessels Minor Damage It is assumed that minor damage will not lead to a spill.
Major Damage:
Double hull tankers of the sizes relevant for the approach to Prince Rupert will have at least two meters between inner and outer hull. Therefore higher impact energy is required to penetrate a cargo tank than for example a single hull tanker.
Alternative design concepts are allowed only when approved in principle by IMO MEPC to have equivalent or better predicted performance with regard to oil outflow in case of an accident compared to currently accepted designs.
The speed of the vessel, angle of grounding and shape of rock will influence the extent of damage to the tanker hull. For the purposes of this assessment it is assumed that 3 out of 4 of the grounding events causing major damage will have sufficient energy to penetrate a cargo or fuel oil tank, while 1 out of 4 major damage events may penetrate the outer hull but not a cargo or fuel oil tank. (Enbridge Northern Gateway, 2010)
Total Loss: It is assumed that when tankers in laden condition have a total loss, there will be a release from the cargo or bunker tanks.
Vessels in ballast Minor Damage:
It is assumed that minor damage will not lead to a spill of bunker oil.
118
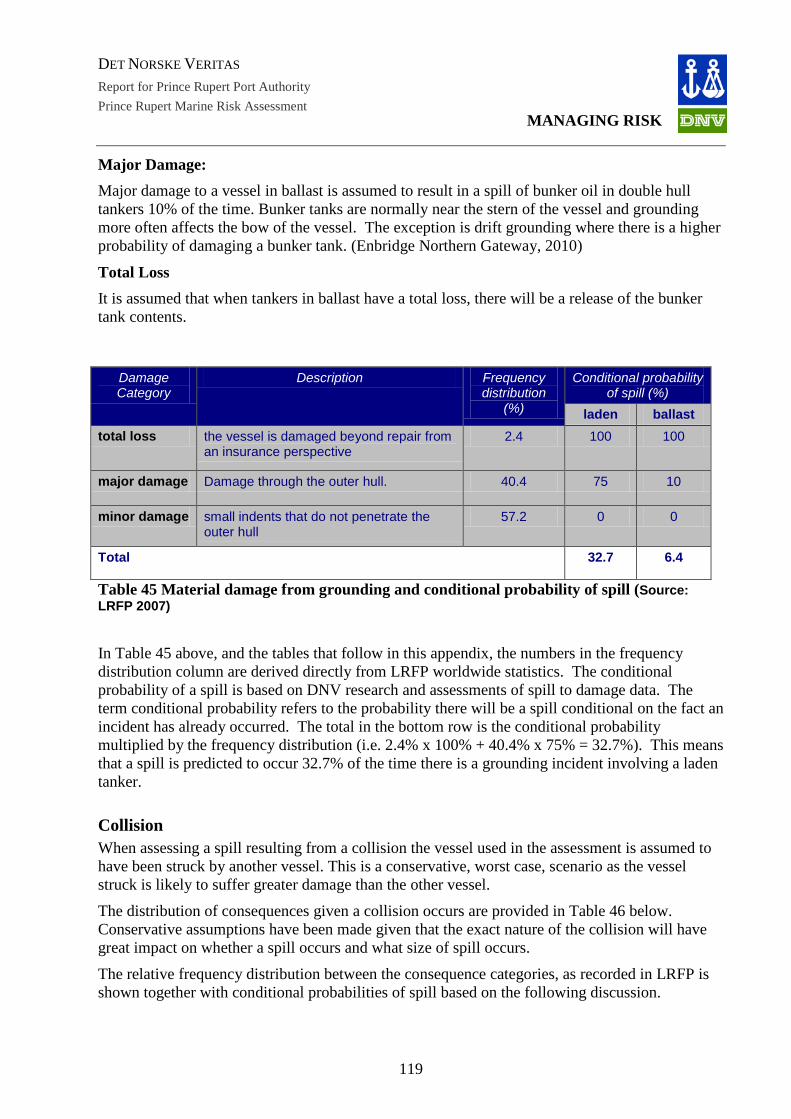
DET NORSKE VERITAS
Report for Prince Rupert Port Authority
MANAGING RISK Prince Rupert Marine Risk Assessment
Major Damage: Major damage to a vessel in ballast is assumed to result in a spill of bunker oil in double hull tankers 10% of the time. Bunker tanks are normally near the stern of the vessel and grounding more often affects the bow of the vessel. The exception is drift grounding where there is a higher probability of damaging a bunker tank. (Enbridge Northern Gateway, 2010)
Total Loss It is assumed that when tankers in ballast have a total loss, there will be a release of the bunker tank contents.
Damage Category
Description Frequency distribution
(%)
Conditional probability of spill (%)
laden ballast total loss the vessel is damaged beyond repair from
an insurance perspective 2.4 100 100
major damage Damage through the outer hull. 40.4 75 10
minor damage small indents that do not penetrate the outer hull
57.2 0 0
Total 32.7 6.4
Table 45 Material damage from grounding and conditional probability of spill (Source: LRFP 2007)
In Table 45 above, and the tables that follow in this appendix, the numbers in the frequency distribution column are derived directly from LRFP worldwide statistics. The conditional probability of a spill is based on DNV research and assessments of spill to damage data. The term conditional probability refers to the probability there will be a spill conditional on the fact an incident has already occurred. The total in the bottom row is the conditional probability multiplied by the frequency distribution (i.e. 2.4% x 100% + 40.4% x 75% = 32.7%). This means that a spill is predicted to occur 32.7% of the time there is a grounding incident involving a laden tanker.
Collision When assessing a spill resulting from a collision the vessel used in the assessment is assumed to have been struck by another vessel. This is a conservative, worst case, scenario as the vessel struck is likely to suffer greater damage than the other vessel.
The distribution of consequences given a collision occurs are provided in Table 46 below. Conservative assumptions have been made given that the exact nature of the collision will have great impact on whether a spill occurs and what size of spill occurs.
The relative frequency distribution between the consequence categories, as recorded in LRFP is shown together with conditional probabilities of spill based on the following discussion.
119
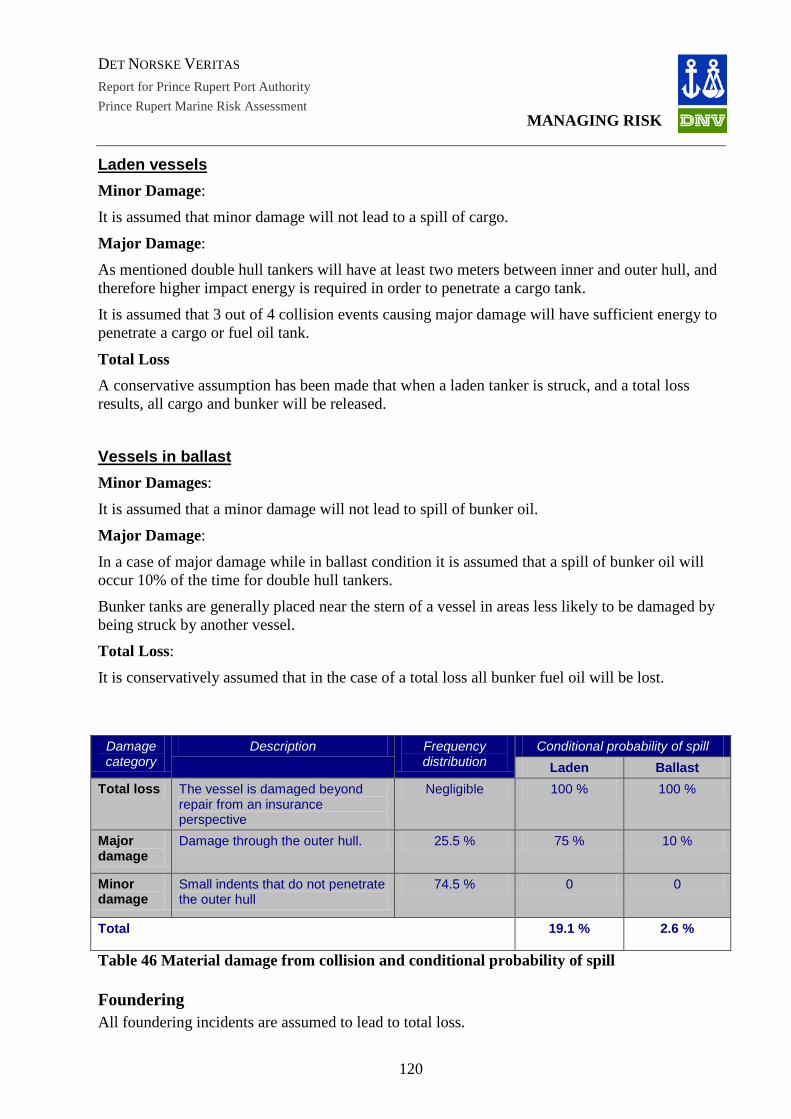
DET NORSKE VERITAS
Report for Prince Rupert Port Authority
MANAGING RISK Prince Rupert Marine Risk Assessment
Laden vessels Minor Damage:
It is assumed that minor damage will not lead to a spill of cargo.
Major Damage:
As mentioned double hull tankers will have at least two meters between inner and outer hull, and therefore higher impact energy is required in order to penetrate a cargo tank.
It is assumed that 3 out of 4 collision events causing major damage will have sufficient energy to penetrate a cargo or fuel oil tank.
Total Loss A conservative assumption has been made that when a laden tanker is struck, and a total loss results, all cargo and bunker will be released.
Vessels in ballast Minor Damages:
It is assumed that a minor damage will not lead to spill of bunker oil.
Major Damage:
In a case of major damage while in ballast condition it is assumed that a spill of bunker oil will occur 10% of the time for double hull tankers.
Bunker tanks are generally placed near the stern of a vessel in areas less likely to be damaged by being struck by another vessel.
Total Loss:
It is conservatively assumed that in the case of a total loss all bunker fuel oil will be lost.
Damage category
Description Frequency distribution
Conditional probability of spill Laden Ballast
Total loss The vessel is damaged beyond repair from an insurance perspective
Negligible 100 % 100 %
Major damage
Damage through the outer hull. 25.5 % 75 % 10 %
Minor damage
Small indents that do not penetrate the outer hull
74.5 % 0 0
Total 19.1 % 2.6 %
Table 46 Material damage from collision and conditional probability of spill
Foundering All foundering incidents are assumed to lead to total loss.
120
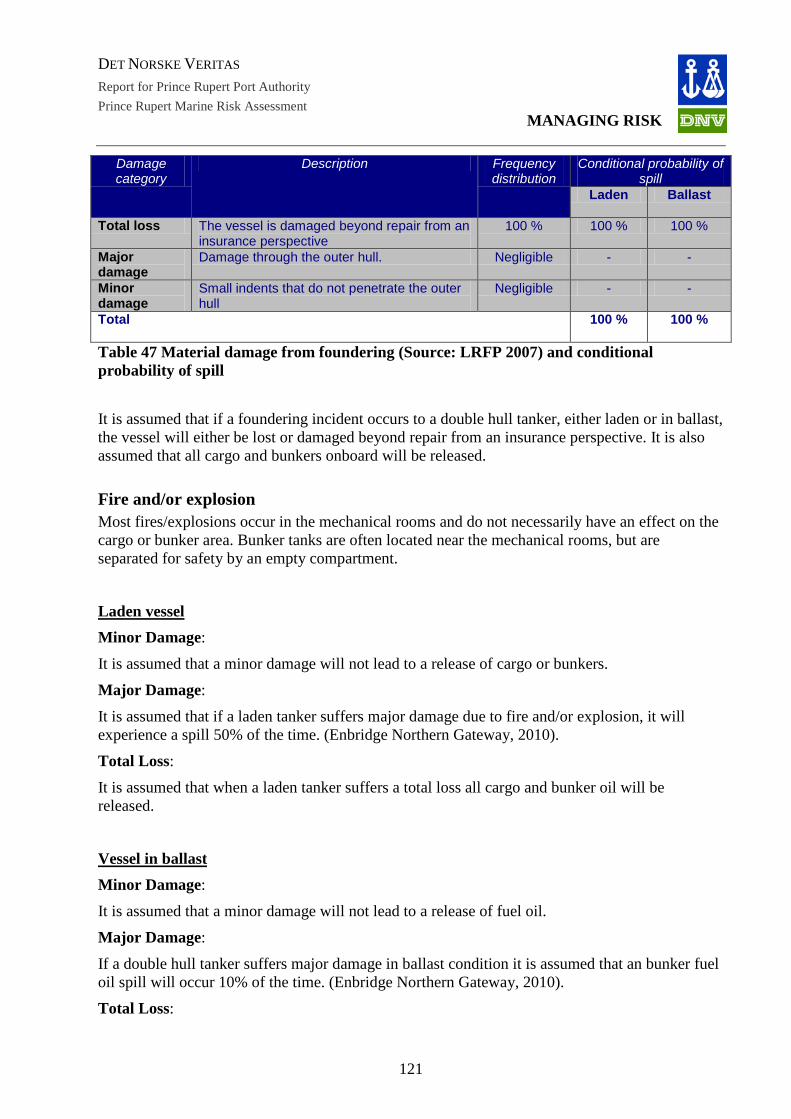
DET NORSKE VERITAS
Report for Prince Rupert Port Authority
MANAGING RISK Prince Rupert Marine Risk Assessment
Damage category
Description Frequency distribution
Conditional probability of spill
Laden Ballast
Total loss The vessel is damaged beyond repair from an insurance perspective
100 % 100 % 100 %
Major damage
Damage through the outer hull. Negligible - -
Minor damage
Small indents that do not penetrate the outer hull
Negligible - -
Total 100 % 100 %
Table 47 Material damage from foundering (Source: LRFP 2007) and conditional probability of spill
It is assumed that if a foundering incident occurs to a double hull tanker, either laden or in ballast, the vessel will either be lost or damaged beyond repair from an insurance perspective. It is also assumed that all cargo and bunkers onboard will be released.
Fire and/or explosion Most fires/explosions occur in the mechanical rooms and do not necessarily have an effect on the cargo or bunker area. Bunker tanks are often located near the mechanical rooms, but are separated for safety by an empty compartment.
Laden vessel Minor Damage:
It is assumed that a minor damage will not lead to a release of cargo or bunkers.
Major Damage:
It is assumed that if a laden tanker suffers major damage due to fire and/or explosion, it will experience a spill 50% of the time. (Enbridge Northern Gateway, 2010).
Total Loss:
It is assumed that when a laden tanker suffers a total loss all cargo and bunker oil will be released.
Vessel in ballast Minor Damage:
It is assumed that a minor damage will not lead to a release of fuel oil.
Major Damage:
If a double hull tanker suffers major damage in ballast condition it is assumed that an bunker fuel oil spill will occur 10% of the time. (Enbridge Northern Gateway, 2010).
Total Loss:
121
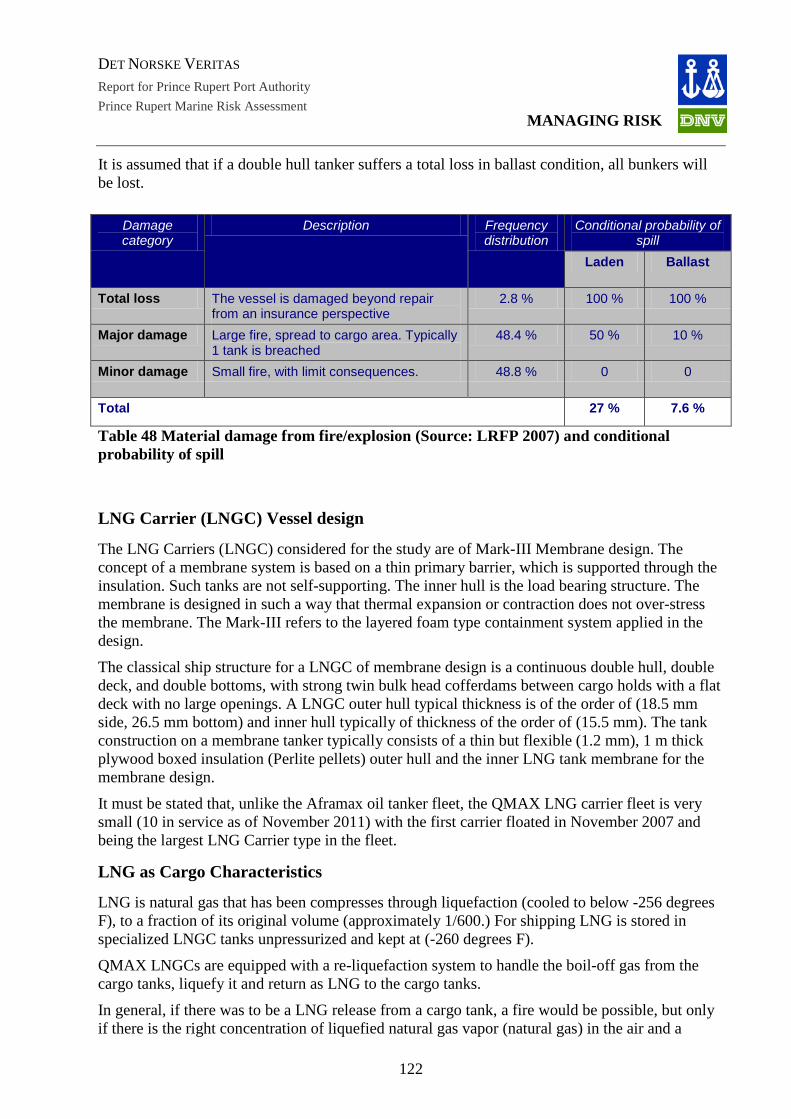
DET NORSKE VERITAS
Report for Prince Rupert Port Authority
MANAGING RISK Prince Rupert Marine Risk Assessment
It is assumed that if a double hull tanker suffers a total loss in ballast condition, all bunkers will be lost.
Damage category
Description Frequency distribution
Conditional probability of spill
Laden Ballast
Total loss The vessel is damaged beyond repair from an insurance perspective
2.8 % 100 % 100 %
Major damage Large fire, spread to cargo area. Typically 1 tank is breached
48.4 % 50 % 10 %
Minor damage Small fire, with limit consequences. 48.8 % 0 0
Total 27 % 7.6 %
Table 48 Material damage from fire/explosion (Source: LRFP 2007) and conditional probability of spill
LNG Carrier (LNGC) Vessel design
The LNG Carriers (LNGC) considered for the study are of Mark-III Membrane design. The concept of a membrane system is based on a thin primary barrier, which is supported through the insulation. Such tanks are not self-supporting. The inner hull is the load bearing structure. The membrane is designed in such a way that thermal expansion or contraction does not over-stress the membrane. The Mark-III refers to the layered foam type containment system applied in the design.
The classical ship structure for a LNGC of membrane design is a continuous double hull, double deck, and double bottoms, with strong twin bulk head cofferdams between cargo holds with a flat deck with no large openings. A LNGC outer hull typical thickness is of the order of (18.5 mm side, 26.5 mm bottom) and inner hull typically of thickness of the order of (15.5 mm). The tank construction on a membrane tanker typically consists of a thin but flexible (1.2 mm), 1 m thick plywood boxed insulation (Perlite pellets) outer hull and the inner LNG tank membrane for the membrane design.
It must be stated that, unlike the Aframax oil tanker fleet, the QMAX LNG carrier fleet is very small (10 in service as of November 2011) with the first carrier floated in November 2007 and being the largest LNG Carrier type in the fleet.
LNG as Cargo Characteristics
LNG is natural gas that has been compresses through liquefaction (cooled to below -256 degrees F), to a fraction of its original volume (approximately 1/600.) For shipping LNG is stored in specialized LNGC tanks unpressurized and kept at (-260 degrees F).
QMAX LNGCs are equipped with a re-liquefaction system to handle the boil-off gas from the cargo tanks, liquefy it and return as LNG to the cargo tanks.
In general, if there was to be a LNG release from a cargo tank, a fire would be possible, but only if there is the right concentration of liquefied natural gas vapor (natural gas) in the air and a
122
DET NORSKE VERITAS
Report for Prince Rupert Port Authority
MANAGING RISK Prince Rupert Marine Risk Assessment
source of ignition is present. Thus fire is not certain in the event of a marine incident and subsequent LNG spill. Explosions of released LNG are considered to be highly unlikely.
123

DET NORSKE VERITAS
Report for Prince Rupert Port Authority
MANAGING RISK Prince Rupert Marine Risk Assessment
Det Norske Veritas: Det Norske Veritas (DNV) is a leading, independent provider of services for managing risk with a global presence and a network of 300 offices in 100 different countries. DNV’s objective is to safeguard life, property and the environment. DNV assists its customers in managing risk by providing three categories of service: classification, certification and consultancy. Since establishment as an independent foundation in 1864, DNV has become an internationally recognised provider of technical and managerial consultancy services and one of the world’s leading classification societies. This means continuously developing new approaches to health, safety, quality and environmental management, so businesses can run smoothly in a world full of surprises.
Global impact for a safe and sustainable future:
Learn more on www.dnv.com
124
DET NORSKE VERITAS
Prince Rupert Marine Risk Assessment
General Frequency Assessment Report
Prince Rupert Port Authority
DET NORSKE VERITAS
Report for Prince Rupert Port Authority
MANAGING RISK Prince Rupert Marine Risk Assessment
2
Table of Contents
1 INTRODUCTION ............................................................................................................. 3
2 METHODOLOGY ............................................................................................................ 4
2.1 Assumptions ............................................................................................................... 5 2.1.1 Route .................................................................................................................... 5 2.1.2 Vessel data ........................................................................................................... 5
2.2 K factors ..................................................................................................................... 6
3 FREQUENCY ASSESSMENT ......................................................................................... 8
3.1 Incident severity ......................................................................................................... 8
3.2 Scenario 1: Baseline with no LNG carriers or additional oil tankers ....................... 10 3.2.1 Return periods for all incidents and ship types .................................................. 10 3.2.2 Return periods for ship types ............................................................................. 13 3.2.3 Return periods for incident types ....................................................................... 14
3.3 Scenario 2: Additional LNG carriers and additional tankers ................................... 15 3.3.1 Return periods for all incidents and ship types .................................................. 15 3.3.2 Return periods for ship types ............................................................................. 17 3.3.3 Return periods for incident types ....................................................................... 18
4 CONCLUSION ................................................................................................................ 19
APPENDIXES ........................................................................................................................ 21
DET NORSKE VERITAS
Report for Prince Rupert Port Authority
MANAGING RISK Prince Rupert Marine Risk Assessment
3
1 INTRODUCTION In this general frequency assessment project, risk has been identified for 5 ship types chosen as representative for the current and potential upcoming fleet approaching Port of Prince Rupert. This document summarises the most important results from the 5 ship types, in order to ease a comparison of the ship types and to see the total frequency of incidents that potentially can occur during the approach to the port.
The results are briefly summarised for the following accident frequencies: • per vessel type • per accident type • per severity
This general frequency assessment consists of a qualitative description of relevant data for the transit of different vessel types to and from the Prince Rupert (PR) marine terminal. The report includes data from the Prince Rupert Marine Risk assessment issued by DNV in February 2012 (Navigational Risk Assessment Report, DNV 2012) such as:
• route information • navigation systems • weather data • forecast vessel traffic • proposed ship specifications
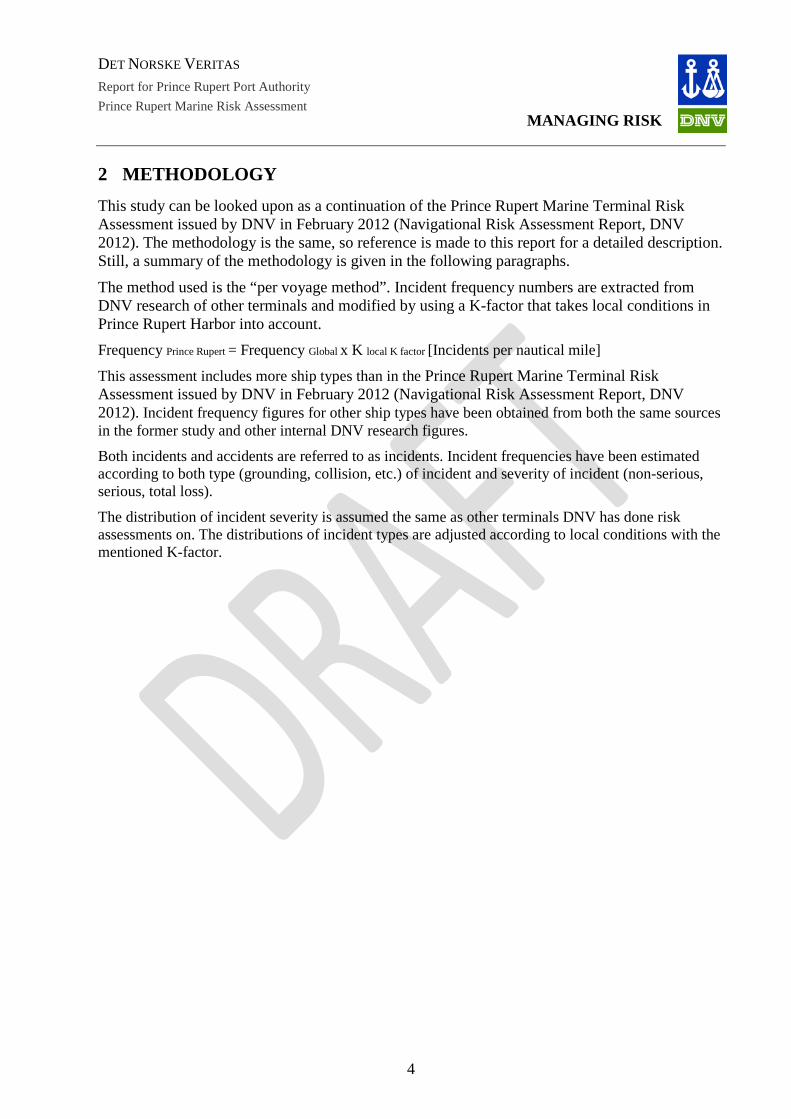
DET NORSKE VERITAS
Report for Prince Rupert Port Authority
MANAGING RISK Prince Rupert Marine Risk Assessment
4
2 METHODOLOGY This study can be looked upon as a continuation of the Prince Rupert Marine Terminal Risk Assessment issued by DNV in February 2012 (Navigational Risk Assessment Report, DNV 2012). The methodology is the same, so reference is made to this report for a detailed description. Still, a summary of the methodology is given in the following paragraphs.
The method used is the “per voyage method”. Incident frequency numbers are extracted from DNV research of other terminals and modified by using a K-factor that takes local conditions in Prince Rupert Harbor into account. Frequency Prince Rupert = Frequency Global x K local K factor [Incidents per nautical mile]
This assessment includes more ship types than in the Prince Rupert Marine Terminal Risk Assessment issued by DNV in February 2012 (Navigational Risk Assessment Report, DNV 2012). Incident frequency figures for other ship types have been obtained from both the same sources in the former study and other internal DNV research figures.
Both incidents and accidents are referred to as incidents. Incident frequencies have been estimated according to both type (grounding, collision, etc.) of incident and severity of incident (non-serious, serious, total loss).
The distribution of incident severity is assumed the same as other terminals DNV has done risk assessments on. The distributions of incident types are adjusted according to local conditions with the mentioned K-factor.
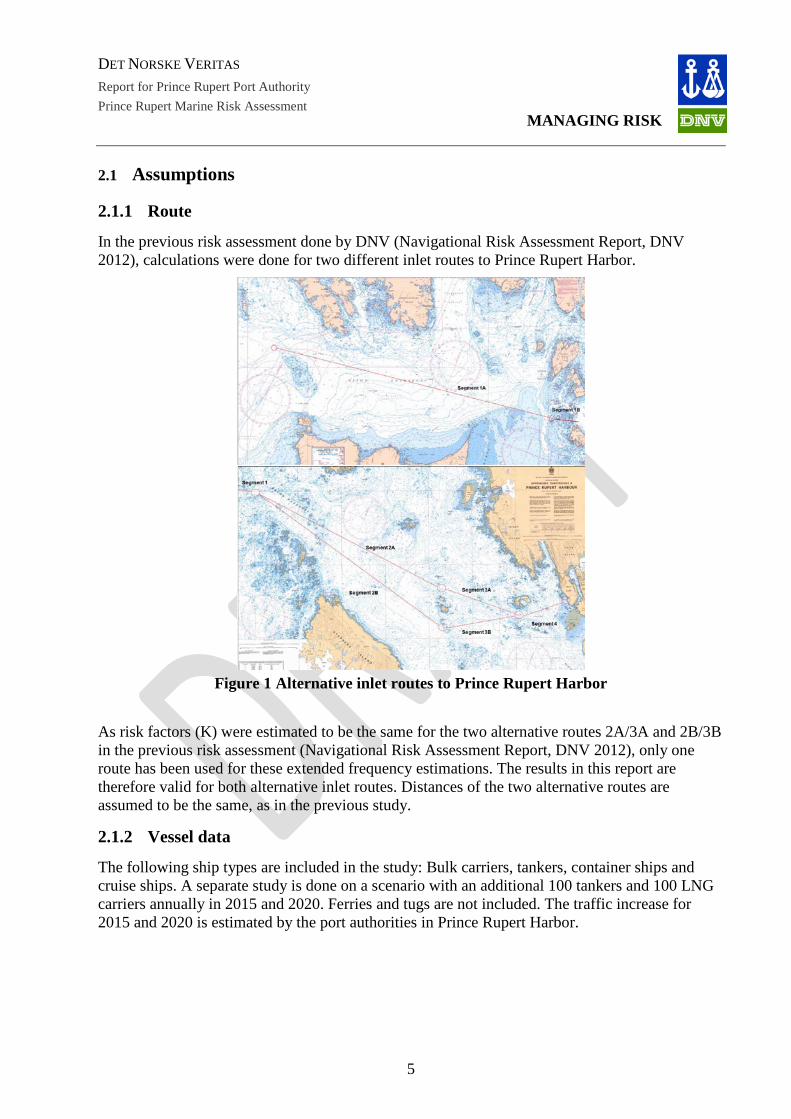
DET NORSKE VERITAS
Report for Prince Rupert Port Authority
MANAGING RISK Prince Rupert Marine Risk Assessment
5
2.1 Assumptions
2.1.1 Route
In the previous risk assessment done by DNV (Navigational Risk Assessment Report, DNV 2012), calculations were done for two different inlet routes to Prince Rupert Harbor.
Figure 1 Alternative inlet routes to Prince Rupert Harbor
As risk factors (K) were estimated to be the same for the two alternative routes 2A/3A and 2B/3B in the previous risk assessment (Navigational Risk Assessment Report, DNV 2012), only one route has been used for these extended frequency estimations. The results in this report are therefore valid for both alternative inlet routes. Distances of the two alternative routes are assumed to be the same, as in the previous study.
2.1.2 Vessel data
The following ship types are included in the study: Bulk carriers, tankers, container ships and cruise ships. A separate study is done on a scenario with an additional 100 tankers and 100 LNG carriers annually in 2015 and 2020. Ferries and tugs are not included. The traffic increase for 2015 and 2020 is estimated by the port authorities in Prince Rupert Harbor.
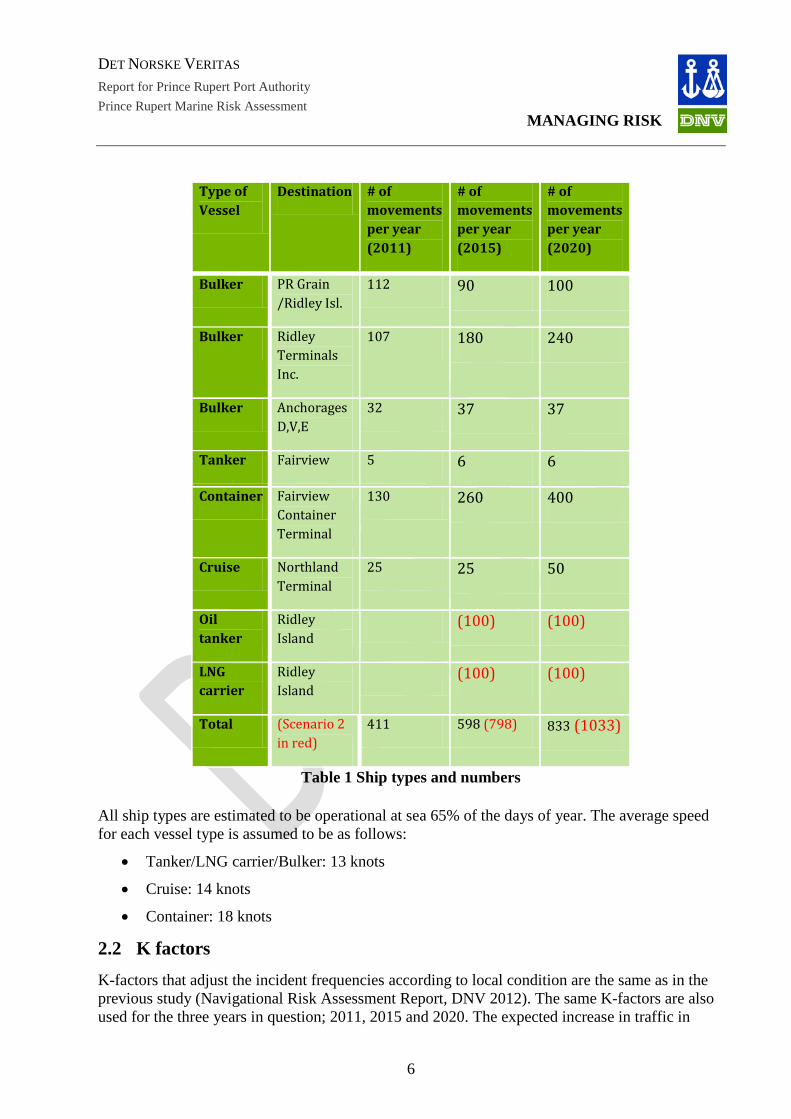
DET NORSKE VERITAS
Report for Prince Rupert Port Authority
MANAGING RISK Prince Rupert Marine Risk Assessment
6
Type of Vessel
Destination # of movements per year (2011)
# of movements per year (2015)
# of movements per year (2020)
Bulker PR Grain /Ridley Isl.
112 90 100
Bulker Ridley Terminals Inc.
107 180 240
Bulker Anchorages D,V,E
32 37 37
Tanker Fairview 5 6 6
Container Fairview Container Terminal
130 260 400
Cruise Northland Terminal
25 25 50
Oil tanker
Ridley Island
(100) (100)
LNG carrier
Ridley Island
(100) (100)
Total (Scenario 2 in red)
411 598 (798) 833 (1033)
Table 1 Ship types and numbers All ship types are estimated to be operational at sea 65% of the days of year. The average speed for each vessel type is assumed to be as follows:
• Tanker/LNG carrier/Bulker: 13 knots
• Cruise: 14 knots
• Container: 18 knots
2.2 K factors K-factors that adjust the incident frequencies according to local condition are the same as in the previous study (Navigational Risk Assessment Report, DNV 2012). The same K-factors are also used for the three years in question; 2011, 2015 and 2020. The expected increase in traffic in

DET NORSKE VERITAS
Report for Prince Rupert Port Authority
MANAGING RISK Prince Rupert Marine Risk Assessment
7
2015 and 2020 could potentially lead to an increased risk of collision; this has not been included in this assessment and the factor Ktraffic density remains constant in the study.
The K-factors take into account other factors like distance to shore, navigational difficulty and weather condition. These factors are assumed to be the same for all ship types in the assessment.
For a detailed description of the K-factors, reference is made to the Prince Rupert Marine Terminal Risk Assessment issued by DNV in February 2012 (Navigational Risk Assessment Report, DNV 2012).
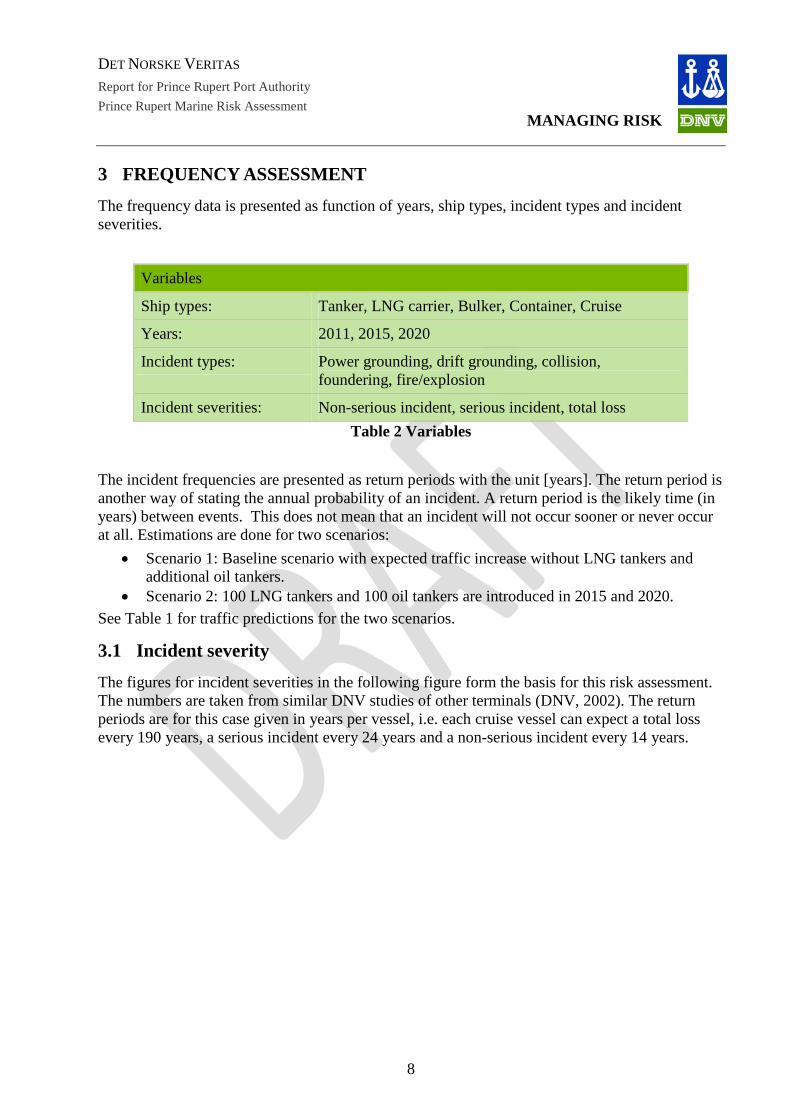
DET NORSKE VERITAS
Report for Prince Rupert Port Authority
MANAGING RISK Prince Rupert Marine Risk Assessment
8
3 FREQUENCY ASSESSMENT The frequency data is presented as function of years, ship types, incident types and incident severities.
Variables
Ship types: Tanker, LNG carrier, Bulker, Container, Cruise
Years: 2011, 2015, 2020
Incident types: Power grounding, drift grounding, collision, foundering, fire/explosion
Incident severities: Non-serious incident, serious incident, total loss Table 2 Variables
The incident frequencies are presented as return periods with the unit [years]. The return period is another way of stating the annual probability of an incident. A return period is the likely time (in years) between events. This does not mean that an incident will not occur sooner or never occur at all. Estimations are done for two scenarios:
• Scenario 1: Baseline scenario with expected traffic increase without LNG tankers and additional oil tankers.
• Scenario 2: 100 LNG tankers and 100 oil tankers are introduced in 2015 and 2020. See Table 1 for traffic predictions for the two scenarios.
3.1 Incident severity The figures for incident severities in the following figure form the basis for this risk assessment. The numbers are taken from similar DNV studies of other terminals (DNV, 2002). The return periods are for this case given in years per vessel, i.e. each cruise vessel can expect a total loss every 190 years, a serious incident every 24 years and a non-serious incident every 14 years.
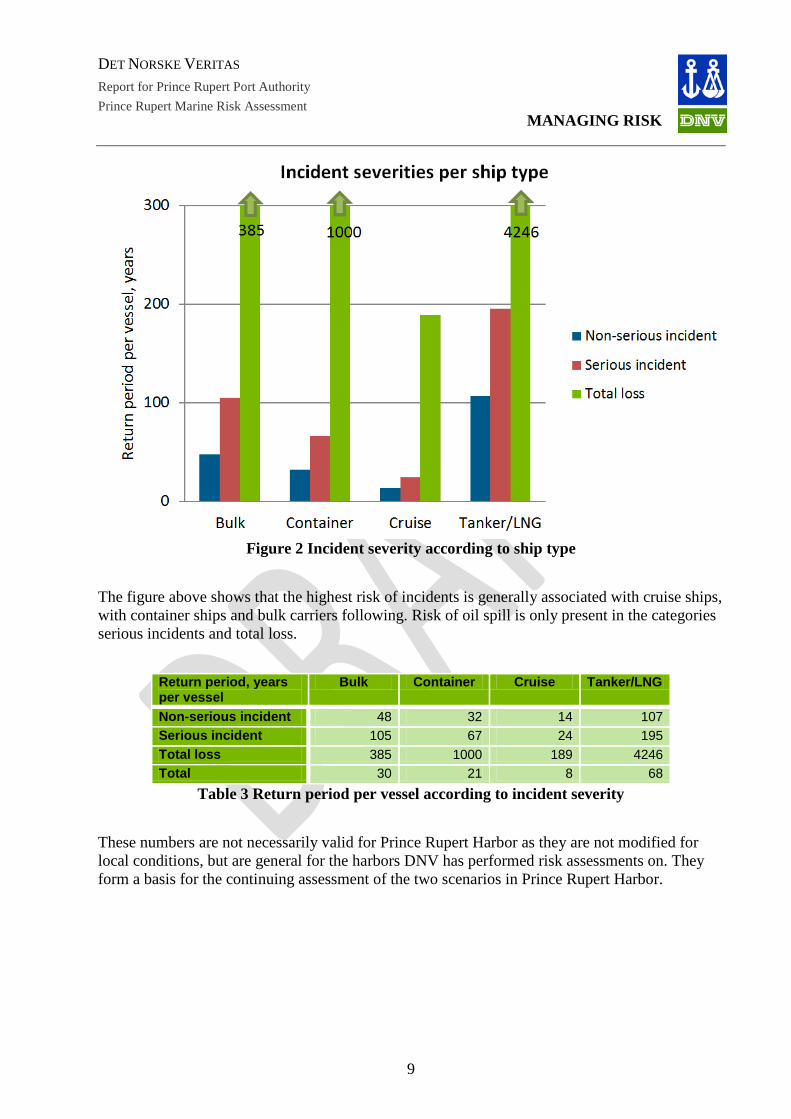
DET NORSKE VERITAS
Report for Prince Rupert Port Authority
MANAGING RISK Prince Rupert Marine Risk Assessment
9
Figure 2 Incident severity according to ship type
The figure above shows that the highest risk of incidents is generally associated with cruise ships, with container ships and bulk carriers following. Risk of oil spill is only present in the categories serious incidents and total loss.
Return period, years per vessel
Bulk Container Cruise Tanker/LNG
Non-serious incident 48 32 14 107
Serious incident 105 67 24 195
Total loss 385 1000 189 4246
Total 30 21 8 68
Table 3 Return period per vessel according to incident severity
These numbers are not necessarily valid for Prince Rupert Harbor as they are not modified for local conditions, but are general for the harbors DNV has performed risk assessments on. They form a basis for the continuing assessment of the two scenarios in Prince Rupert Harbor.
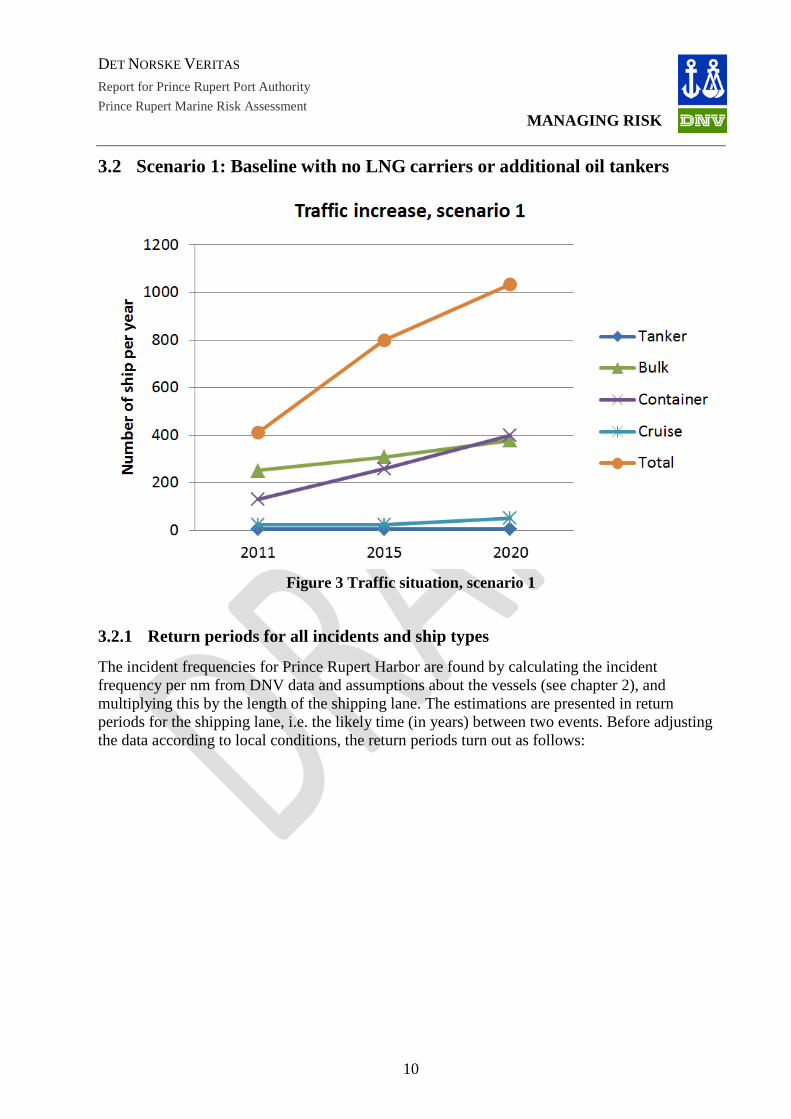
DET NORSKE VERITAS
Report for Prince Rupert Port Authority
MANAGING RISK Prince Rupert Marine Risk Assessment
10
3.2 Scenario 1: Baseline with no LNG carriers or additional oil tankers
Figure 3 Traffic situation, scenario 1
3.2.1 Return periods for all incidents and ship types
The incident frequencies for Prince Rupert Harbor are found by calculating the incident frequency per nm from DNV data and assumptions about the vessels (see chapter 2), and multiplying this by the length of the shipping lane. The estimations are presented in return periods for the shipping lane, i.e. the likely time (in years) between two events. Before adjusting the data according to local conditions, the return periods turn out as follows:

DET NORSKE VERITAS
Report for Prince Rupert Port Authority
MANAGING RISK Prince Rupert Marine Risk Assessment
11
Figure 4 Return periods, local conditions excluded
The figure shows how the return periods would be for Prince Rupert Harbor if the local conditions where the same as the worldwide average.
By qualitative assessment of the data for other harbors and adjusting it for local conditions using K-factors (see chapter 2.2), the return periods increase in comparison with the worldwide average data. Important factors here are the distance to shore and traffic density, to mention a couple, and is described in detail in the Prince Rupert Marine Terminal Risk Assessment issued by DNV in February 2012 (Navigational Risk Assessment Report, DNV 2012). From expecting incidents every 23 years in 2011, the return period decreases to an expected incident every 11 years in 2020. The reason is the expected traffic increase.

DET NORSKE VERITAS
Report for Prince Rupert Port Authority
MANAGING RISK Prince Rupert Marine Risk Assessment
12
Figure 5 Return periods, local conditions included, scenario 1
The following figure shows how the local conditions, qualitatively assessed by DNV, have an impact on the return period when compared to worldwide statistics where local conditions are not taken into account.
Figure 6 Effect of local conditions

DET NORSKE VERITAS
Report for Prince Rupert Port Authority
MANAGING RISK Prince Rupert Marine Risk Assessment
13
Average from
DNV data Modified for PR Harbor
2011 5 23
2015 3 16
2020 2 11
Table 4 Return periods, effect of local factors
3.2.2 Return periods for ship types
Bulk carriers and container ships stand out with the highest incident frequency and lowest return periods. Bulk carriers have the lowest return period in 2011. As the container ship traffic is expected to increase more than for bulkers, the container ships become the vessel type with the lowest associated return period in 2020. Tankers have a high return period due to the low traffic in this scenario (5 tankers in 2011, 6 tankers in 2015 and 2020).
Figure 7 Return periods per ship type, scenario 1, all incidents
Bulk Container Cruise Tanker Total
2011 43 81 128 3668 23
2015 35 40 128 3057 16
2020 28 26 64 3057 11
Table 5 Return periods per ship type, scenario 1, all incidents
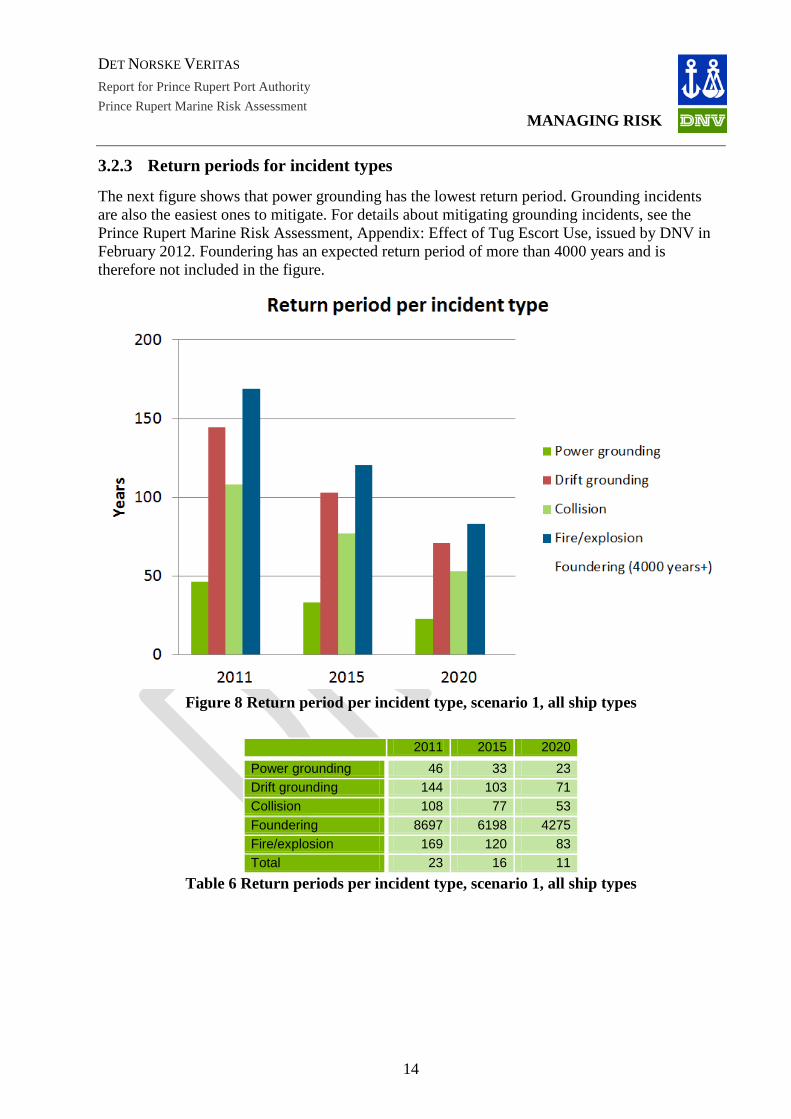
DET NORSKE VERITAS
Report for Prince Rupert Port Authority
MANAGING RISK Prince Rupert Marine Risk Assessment
14
3.2.3 Return periods for incident types
The next figure shows that power grounding has the lowest return period. Grounding incidents are also the easiest ones to mitigate. For details about mitigating grounding incidents, see the Prince Rupert Marine Risk Assessment, Appendix: Effect of Tug Escort Use, issued by DNV in February 2012. Foundering has an expected return period of more than 4000 years and is therefore not included in the figure.
Figure 8 Return period per incident type, scenario 1, all ship types
2011 2015 2020
Power grounding 46 33 23
Drift grounding 144 103 71
Collision 108 77 53
Foundering 8697 6198 4275
Fire/explosion 169 120 83
Total 23 16 11
Table 6 Return periods per incident type, scenario 1, all ship types
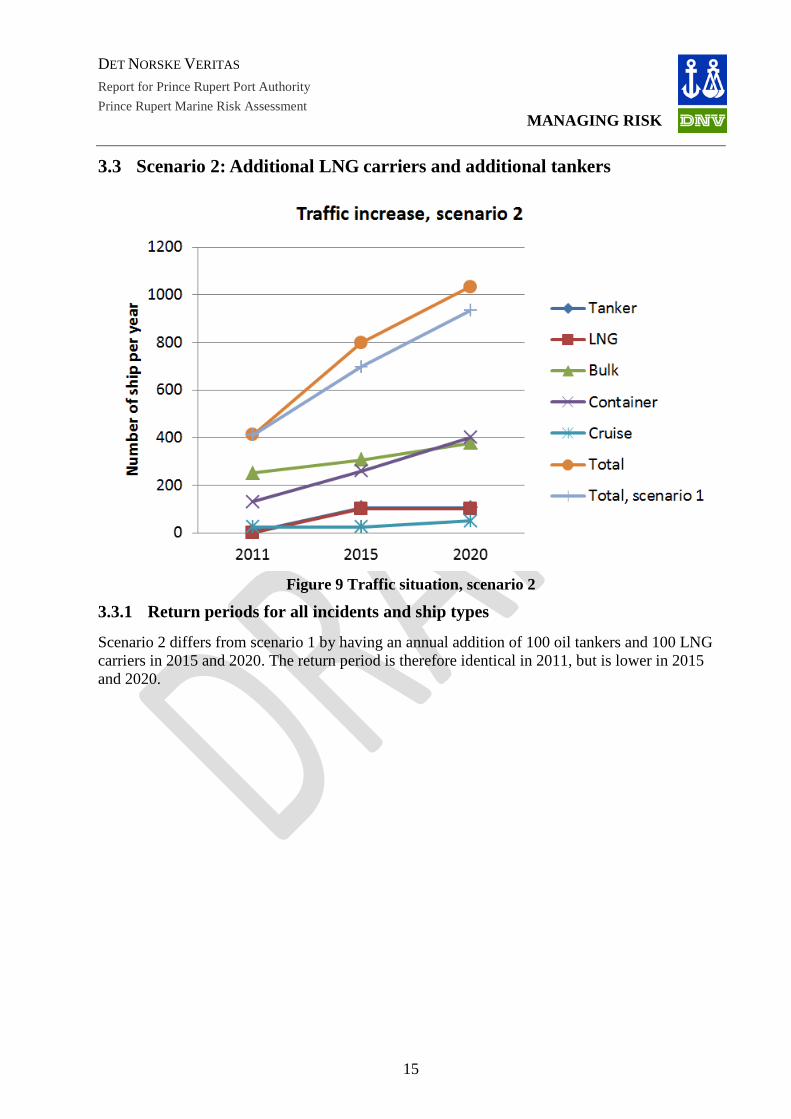
DET NORSKE VERITAS
Report for Prince Rupert Port Authority
MANAGING RISK Prince Rupert Marine Risk Assessment
15
3.3 Scenario 2: Additional LNG carriers and additional tankers
Figure 9 Traffic situation, scenario 2
3.3.1 Return periods for all incidents and ship types
Scenario 2 differs from scenario 1 by having an annual addition of 100 oil tankers and 100 LNG carriers in 2015 and 2020. The return period is therefore identical in 2011, but is lower in 2015 and 2020.
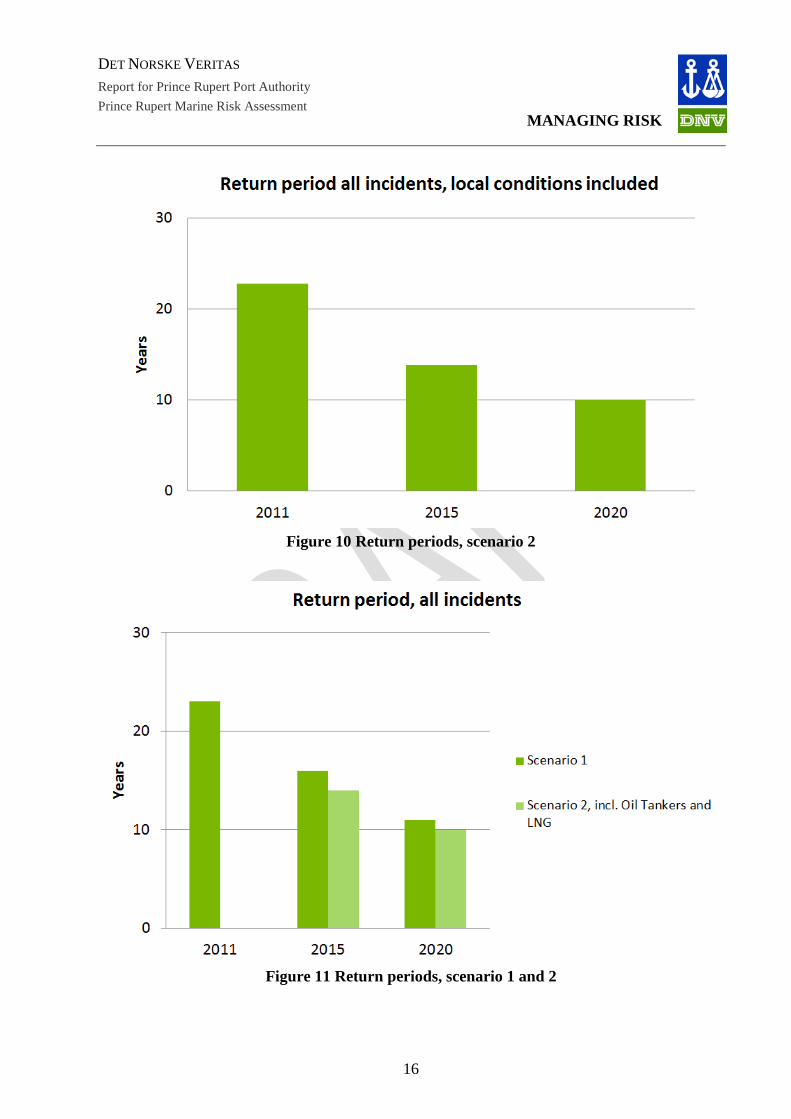
DET NORSKE VERITAS
Report for Prince Rupert Port Authority
MANAGING RISK Prince Rupert Marine Risk Assessment
16
Figure 10 Return periods, scenario 2
Figure 11 Return periods, scenario 1 and 2

DET NORSKE VERITAS
Report for Prince Rupert Port Authority
MANAGING RISK Prince Rupert Marine Risk Assessment
17
Scenario 1 Scenario 2
2011: 23 years 23 years
2015: 16 years 14 years
2020: 11 years 10 years Table 7 Return periods, all incidents, scenario 1 and 2
3.3.2 Return periods for ship types
Even with the increased traffic of oil tankers and LNG carriers, bulk carriers and container ships remain the vessel types with the lowest expected return period, as is shown in the following figure.
Table 8 Return period per ship type, scenario 2, all incidents
Bulk Container Cruise Tanker LNG Total
2011 43 81 128 3668 23
2015 35 40 128 173 183 14
2020 28 26 64 173 183 10
Table 9 Return periods per ship type, scenario 2, all incidents For a specific incident frequency assessment of the additional tankers and LNG carriers, reference is made to the Prince Rupert Marine Risk assessment issued by DNV in February 2012. (Navigational Risk Assessment Report, DNV 2012)
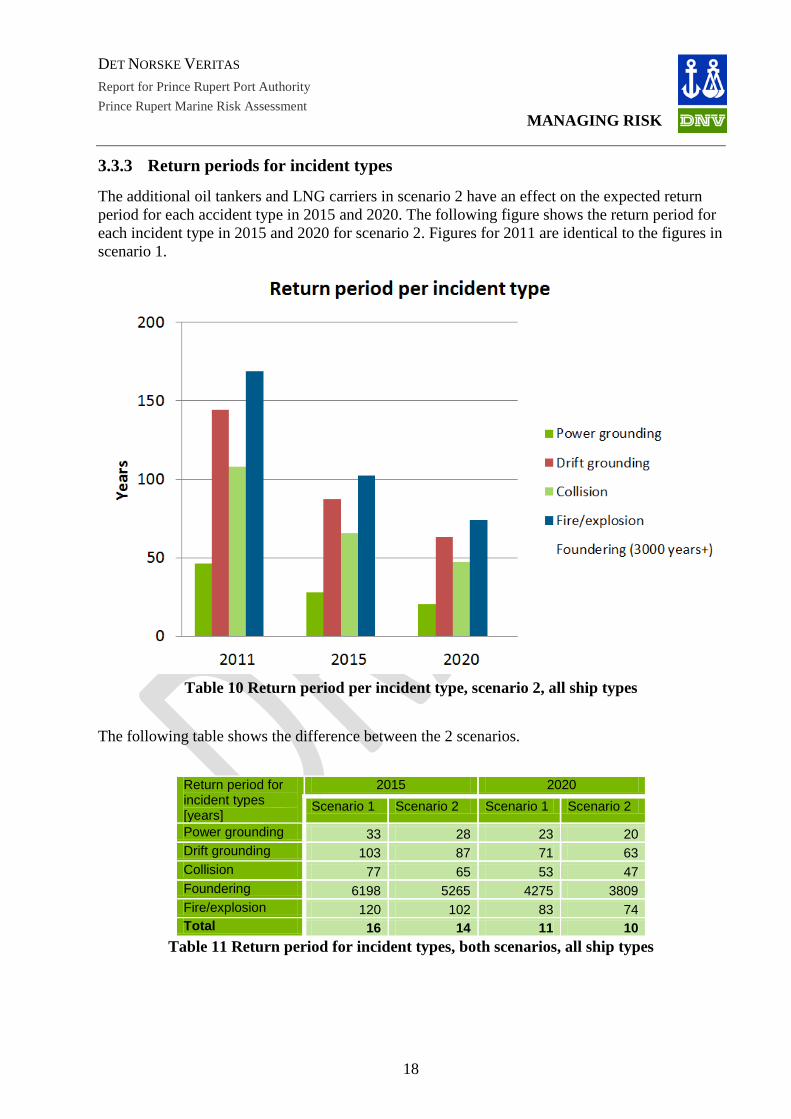
DET NORSKE VERITAS
Report for Prince Rupert Port Authority
MANAGING RISK Prince Rupert Marine Risk Assessment
18
3.3.3 Return periods for incident types
The additional oil tankers and LNG carriers in scenario 2 have an effect on the expected return period for each accident type in 2015 and 2020. The following figure shows the return period for each incident type in 2015 and 2020 for scenario 2. Figures for 2011 are identical to the figures in scenario 1.
Table 10 Return period per incident type, scenario 2, all ship types
The following table shows the difference between the 2 scenarios.
Return period for incident types [years]
2015 2020
Scenario 1 Scenario 2 Scenario 1 Scenario 2
Power grounding 33 28 23 20 Drift grounding 103 87 71 63 Collision 77 65 53 47 Foundering 6198 5265 4275 3809 Fire/explosion 120 102 83 74 Total 16 14 11 10
Table 11 Return period for incident types, both scenarios, all ship types
DET NORSKE VERITAS
Report for Prince Rupert Port Authority
MANAGING RISK Prince Rupert Marine Risk Assessment
19
4 CONCLUSION The marine incident frequency assessment is carried out for the transport of commercial vessels to and from port of Prince Rupert. The assessment is based on a today’s traffic of approximately 400 vessels to the different terminals and future scenarios for 2015 and 2020. The incidents have been quantified for four events that were evaluated in a semi-quantitative incident assessment. The four events are:
- Collision (One commercial vessel with another commercial vessel)
- Grounding
- Foundering
- Fire and explosion
The assessment has not been looking into incidents that can occur while the vessel is at berth or at anchorage.
Below the incident frequency of each event is evaluated based on the frequency assessment in chapter 3.
Collision
Collision is assessed to have a relatively low frequency. The frequency of a collision incident is in the order of approximately once every 100 year for today’s traffic including approximately 400 vessels annually. The main factors that make up the frequency are:
- Low traffic density in the Prince Rupert area with only 400 commercial port calls a year or in average 1.1 vessels per day.
- Few crossing vessels.
- The vessel’s sailing route is mainly far from shore.
Grounding
According to DNVs calculations the grounding risk is relatively high compared to the other incident types. The frequency of grounding incidents are in the order of 1 incident every 35 year. Powered grounding is the main contributor to this number with a frequency of 1 incident every 46 year while drift grounding has a frequency of once every 144 years for the 2011 traffic. The main factor that contributes to the frequency level is that there is a potential grounding risk along the whole sailing passage (112.9 nm) to the port (extremely low in segment 1). This gives a relatively high grounding frequency even when taken local conditions into account.
Foundering
Foundering has a very low frequency, both worldwide in general and in the approach to and from Prince Rupert. For the total frequency for the 400 commercial vessels that called Prince Rupert in 2011 it is calculated that a foundering incident has a frequency of once every 8697 years. It shall
DET NORSKE VERITAS
Report for Prince Rupert Port Authority
MANAGING RISK Prince Rupert Marine Risk Assessment
20
although be noticed that if a foundering incident occur the consequence will most likely be very severe.
Fire/Explosion
The frequency for fire/explosion is independent of local factors such as traffic and weather. Therefore the world wide average data has been used without any adjustment factors. The total frequency was calculated to once every 169 years for a fire/explosion incident.
Summary of frequency evaluation
According to DNVs calculations the total incident frequency for the approach to and from port of Prince Rupert is once every 23 years for the 2011 data including 411 commercial vessels. This number will increase with increasing traffic if no other mitigating actions are put into place.
The last couple of years Prince Rupert has experienced a number of incidents because of vessels dragging anchor. These types of incidents are not included in this assessment.
The frequency assessment has concluded that it is grounding that is the most probable incident for the marine operations. As concluded in the assessment issued by DNV in February 2012 (Navigational Risk Assessment Report, DNV 2012), grounding is the hazard that can most effectively be mitigated. The use of appropriate placed and sized escort tugs can decrease the frequency of incidents significantly.
This report is based on the semi-quantitative assessment Marine Risk assessment issued by DNV in February 2012 (Navigational Risk Assessment Report, DNV 2012). The objective of the report is to provide Prince Rupert Port Authority with a general frequency assessment of the current and future commercial vessels expected to call the port. The report has not individually assessed each ship type and the potential consequences of an incident. It is highly recommended that this is done prior to making decisions about developments in the port, such as:
• Traffic increase
• Introducing new cargo
• Introducing mitigating actions
• Etc.
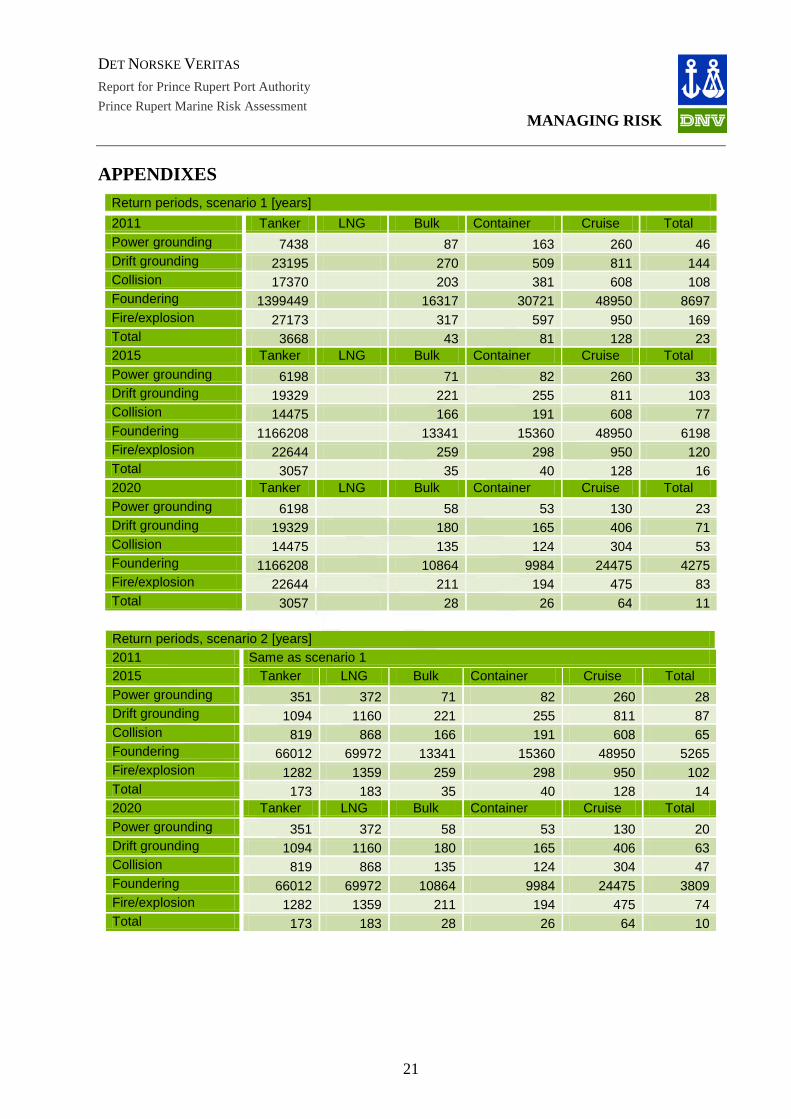
DET NORSKE VERITAS
Report for Prince Rupert Port Authority
MANAGING RISK Prince Rupert Marine Risk Assessment
21
APPENDIXES Return periods, scenario 1 [years]
2011 Tanker LNG Bulk Container Cruise Total
Power grounding 7438 87 163 260 46 Drift grounding 23195 270 509 811 144 Collision 17370 203 381 608 108 Foundering 1399449 16317 30721 48950 8697 Fire/explosion 27173 317 597 950 169 Total 3668 43 81 128 23 2015 Tanker LNG Bulk Container Cruise Total
Power grounding 6198 71 82 260 33 Drift grounding 19329 221 255 811 103 Collision 14475 166 191 608 77 Foundering 1166208 13341 15360 48950 6198 Fire/explosion 22644 259 298 950 120 Total 3057 35 40 128 16 2020 Tanker LNG Bulk Container Cruise Total
Power grounding 6198 58 53 130 23 Drift grounding 19329 180 165 406 71 Collision 14475 135 124 304 53 Foundering 1166208 10864 9984 24475 4275 Fire/explosion 22644 211 194 475 83 Total 3057 28 26 64 11 Return periods, scenario 2 [years]
2011 Same as scenario 1
2015 Tanker LNG Bulk Container Cruise Total
Power grounding 351 372 71 82 260 28 Drift grounding 1094 1160 221 255 811 87 Collision 819 868 166 191 608 65 Foundering 66012 69972 13341 15360 48950 5265 Fire/explosion 1282 1359 259 298 950 102 Total 173 183 35 40 128 14 2020 Tanker LNG Bulk Container Cruise Total
Power grounding 351 372 58 53 130 20 Drift grounding 1094 1160 180 165 406 63 Collision 819 868 135 124 304 47 Foundering 66012 69972 10864 9984 24475 3809 Fire/explosion 1282 1359 211 194 475 74 Total 173 183 28 26 64 10
DET NORSKE VERITAS
Report for Prince Rupert Port Authority
MANAGING RISK Prince Rupert Marine Risk Assessment
22
Det Norske Veritas: Det Norske Veritas (DNV) is a leading, independent provider of services for managing risk with a global presence and a network of 300 offices in 100 different countries. DNV’s objective is to safeguard life, property and the environment. DNV assists its customers in managing risk by providing three categories of service: classification, certification and consultancy. Since establishment as an independent foundation in 1864, DNV has become an internationally recognised provider of technical and managerial consultancy services and one of the world’s leading classification societies. This means continuously developing new approaches to health, safety, quality and environmental management, so businesses can run smoothly in a world full of surprises.
Global impact for a safe and sustainable future:
Learn more on www.dnv.com

DET NORSKE VERITAS
Prince Rupert Marine Risk Assessment
Appendix to: Navigational Risk Assessment Report
Effect of tug escort use
Prince Rupert Port Authority
DET NORSKE VERITAS
Report for Prince Rupert Port Authority
MANAGING RISK Prince Rupert Marine Risk Assessment
DNV Reg. No.: 13JIMVK-8 Revision No. 3 Date : 2012-03-16 Page i of i
Table of Contents
1 INTRODUCTION ............................................................................................................. 1
1.1 Assumptions ............................................................................................................... 1
1.2 Standard Tug Escort Manoeuvres .............................................................................. 2 1.2.1 Brake – Arrest ...................................................................................................... 2 1.2.2 Steer-Brake .......................................................................................................... 2 1.2.3 Steer ..................................................................................................................... 2 1.2.4 U-turn – Brake ..................................................................................................... 2
1.3 The effect of using tug escort ..................................................................................... 3
1.4 The lower frequency of accidents using tethered tug escort ...................................... 3
DET NORSKE VERITAS
Report for Prince Rupert Port Authority
MANAGING RISK Prince Rupert Marine Risk Assessment
1
1 INTRODUCTION This appendix presents an analysis of the use of escort tugs for the proposed tankers and LNG carriers on entry and departure to and from Port of Prince Rupert. The analysis focuses on the risk reducing effect they have with regard to accidents (grounding and collision). The risk-reducing effect of escorts is estimated based on previous analysis done by DNV.
1.1 Assumptions The following describes the assumptions on tug operation and requirements which must be met in order for the tug to have the full risk reducing effect. Should any of these requirements not be met the risk reduction effect would decrease accordingly.
Tankers and LNG carriers
• The strong point on the vessels must be dimensioned to take the static and dynamic forces from the escort tug based on size of tanker and the weather limitations.
• 2 officers (of which one can be the pilot) should be on watch while a tug is escorting to ensure both constant monitoring of the tanker navigation but also constant communication with the tug(s) escorting.
Tugs
• Tugs must be properly dimensioned to both the environmental conditions and the tankers to be escorted. The main dimensioning criteria should be:
• Wave height at point of tug connection
• Tug able to operate in weather on entire route
• Ensure tugs have sufficient pulling force to retard and / or steer the proposed vessels
Tug Escort
• Weather limitations based on tug capability should be defined and followed.
• The role and responsibility of the tug captain, tanker captain and pilot need to be clearly defined and communicated to all parties to prevent misunderstandings during operation.
• The approaching vessels captain should be made fully aware of the escort tug’s capabilities
• Definition of relevant emergency situations which should be included and described in the tug escort operational procedures.
Training
• Simulator training for pilots and escort tug crew to provide training for actual operation through the study area.
• Annual full scale drills in the Prince Rupert area involving a full size tanker and LNG vessels and tug to give pilots and tug crews hands on experience in an emergency situation under controlled conditions.
DET NORSKE VERITAS
Report for Prince Rupert Port Authority
MANAGING RISK Prince Rupert Marine Risk Assessment
2
1.2 Standard Tug Escort Manoeuvres The action taken by an escort tug boat will depend on instructions from the captain and pilot onboard the tanker and will vary with the position of the tanker and the nature of the unfolding incident. The four basic operations are briefly described below.
1.2.1 Brake – Arrest
This manoeuvre is carried out when the vessels wishes to slow as fast as possible and there is sufficient space in front of the vessel such that emergency steering is not required. A Direct Mode (DM) tug could slow down the tanker with its thrusters, or make an “indirect arrest” (the tug positions itself transversely at the stern with the thruster force 90 degrees to the advancing direction). This “indirect arrest” is not modelled in the analysis. An Indirect Mode (IM) tug reduces the speed of the tanker by use of a zigzag manoeuvre generating a drag force with the vessels hull, or by positioning itself in IM position at one side of the stern, generating drag with the tug hull only. The latter manoeuvre will also turn the tanker.
1.2.2 Steer-Brake
This manoeuvre is carried out in narrow waters. The intention is to steer the vessel on a safe course, and at the same time apply braking forces, keeping a safe distance from land, until it can be slowed down. The manoeuvre is only applicable for IM tugs.
1.2.3 Steer
This manoeuvre is carried out when there is a loss of steering or human failure on the tanker. The escort tug acts like the rudder of the ship and steers the tanker on a safe course. The manoeuvre is only applicable for indirect mode tugs.
1.2.4 U-turn – Brake
The manoeuvre is carried out when there is a rudder and / or machinery failure. The escort tug will turn the tanker 180º or more to avoid grounding.
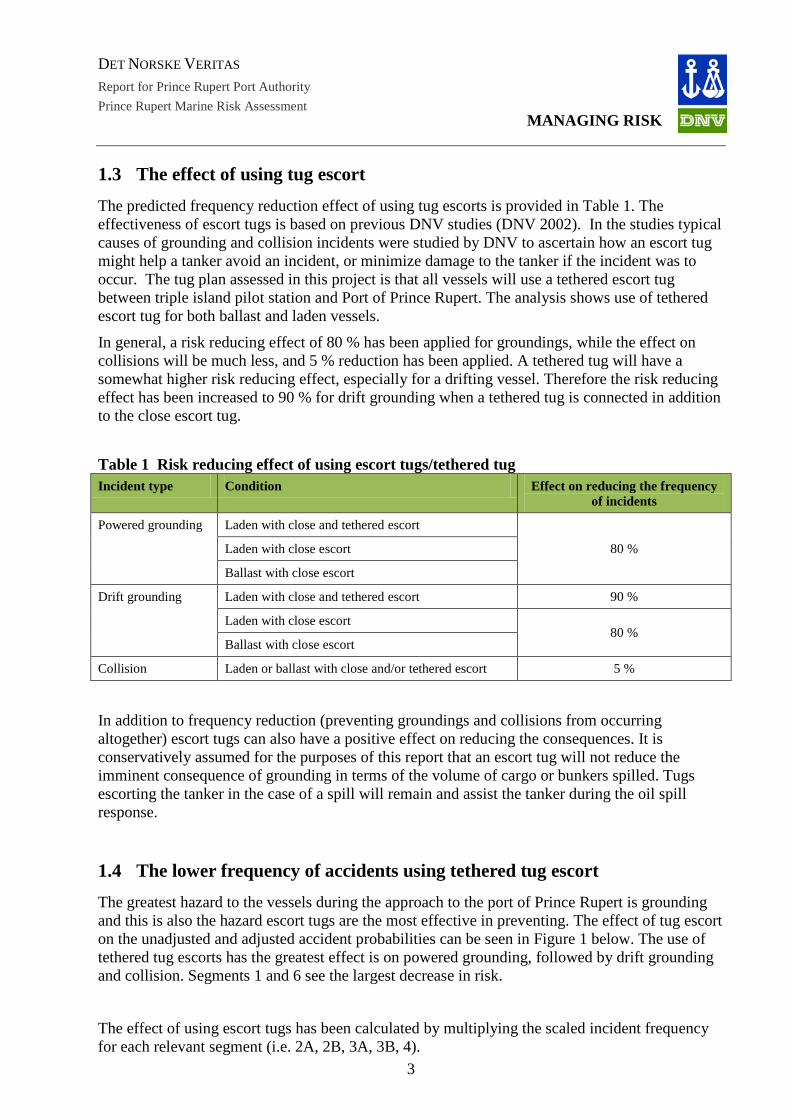
DET NORSKE VERITAS
Report for Prince Rupert Port Authority
MANAGING RISK Prince Rupert Marine Risk Assessment
3
1.3 The effect of using tug escort The predicted frequency reduction effect of using tug escorts is provided in Table 1. The effectiveness of escort tugs is based on previous DNV studies (DNV 2002). In the studies typical causes of grounding and collision incidents were studied by DNV to ascertain how an escort tug might help a tanker avoid an incident, or minimize damage to the tanker if the incident was to occur. The tug plan assessed in this project is that all vessels will use a tethered escort tug between triple island pilot station and Port of Prince Rupert. The analysis shows use of tethered escort tug for both ballast and laden vessels.
In general, a risk reducing effect of 80 % has been applied for groundings, while the effect on collisions will be much less, and 5 % reduction has been applied. A tethered tug will have a somewhat higher risk reducing effect, especially for a drifting vessel. Therefore the risk reducing effect has been increased to 90 % for drift grounding when a tethered tug is connected in addition to the close escort tug.
Table 1 Risk reducing effect of using escort tugs/tethered tug Incident type Condition Effect on reducing the frequency
of incidents
Powered grounding Laden with close and tethered escort
80 % Laden with close escort
Ballast with close escort
Drift grounding Laden with close and tethered escort 90 %
Laden with close escort 80 %
Ballast with close escort
Collision Laden or ballast with close and/or tethered escort 5 %
In addition to frequency reduction (preventing groundings and collisions from occurring altogether) escort tugs can also have a positive effect on reducing the consequences. It is conservatively assumed for the purposes of this report that an escort tug will not reduce the imminent consequence of grounding in terms of the volume of cargo or bunkers spilled. Tugs escorting the tanker in the case of a spill will remain and assist the tanker during the oil spill response.
1.4 The lower frequency of accidents using tethered tug escort The greatest hazard to the vessels during the approach to the port of Prince Rupert is grounding and this is also the hazard escort tugs are the most effective in preventing. The effect of tug escort on the unadjusted and adjusted accident probabilities can be seen in Figure 1 below. The use of tethered tug escorts has the greatest effect is on powered grounding, followed by drift grounding and collision. Segments 1 and 6 see the largest decrease in risk.
The effect of using escort tugs has been calculated by multiplying the scaled incident frequency for each relevant segment (i.e. 2A, 2B, 3A, 3B, 4).
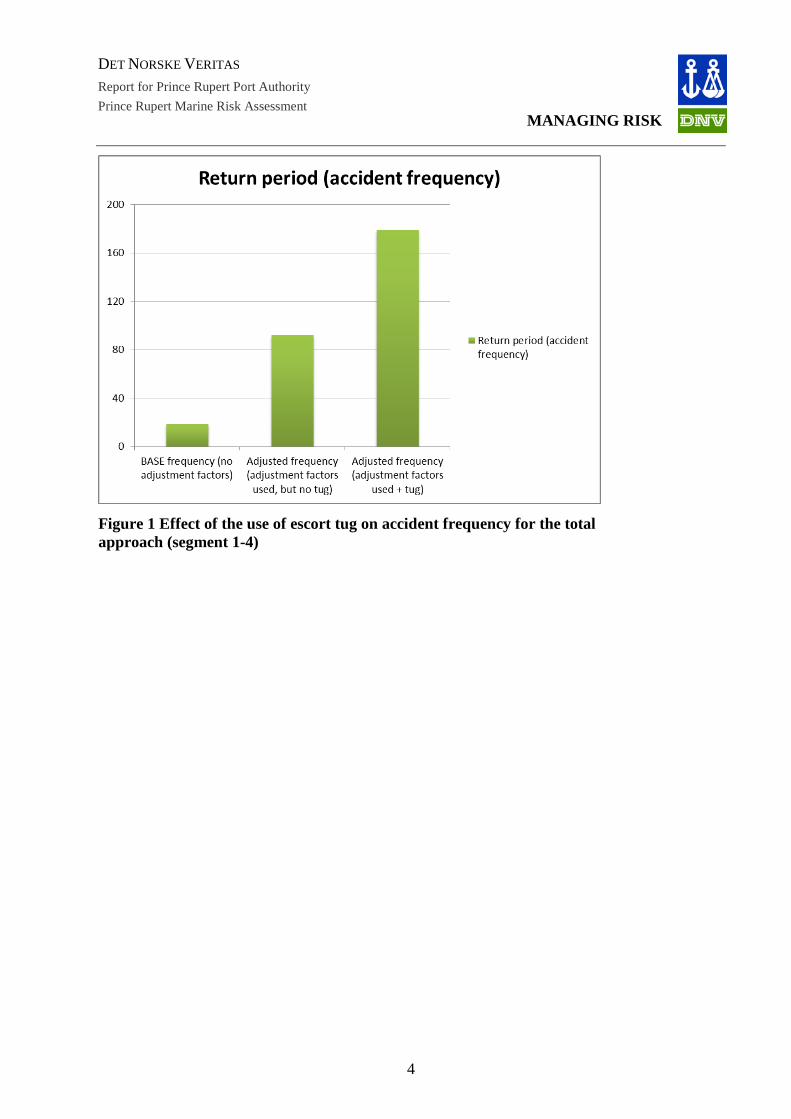
DET NORSKE VERITAS
Report for Prince Rupert Port Authority
MANAGING RISK Prince Rupert Marine Risk Assessment
4
Figure 1 Effect of the use of escort tug on accident frequency for the total approach (segment 1-4)
DET NORSKE VERITAS
Report for Prince Rupert Port Authority
MANAGING RISK Prince Rupert Marine Risk Assessment
5
Det Norske Veritas: Det Norske Veritas (DNV) is a leading, independent provider of services for managing risk with a global presence and a network of 300 offices in 100 different countries. DNV’s objective is to safeguard life, property and the environment. DNV assists its customers in managing risk by providing three categories of service: classification, certification and consultancy. Since establishment as an independent foundation in 1864, DNV has become an internationally recognised provider of technical and managerial consultancy services and one of the world’s leading classification societies. This means continuously developing new approaches to health, safety, quality and environmental management, so businesses can run smoothly in a world full of surprises.
Global impact for a safe and sustainable future:
Learn more on www.dnv.com