principles of pet/ct quality control and...
TRANSCRIPT

7/22/2014
1
1
Principles of PET/CT Quality Control and Calibration
S. Cheenu Kappadath, PhD, DABR, DABSNM
Department of Imaging Physics
The University of Texas MD Anderson Cancer Center, Houston, Texas
2
Educational Objectives
Review principles of PET and PET/CT imaging
Overview of PET performance testing
– NEMA NU-2 2001/2007 and ACR
PET/CT Image Quality and Artifacts
Recent advances in PET/CT
AAPM 2014 S. Cheenu Kappadath, PhD
3
Principles of PET Imaging
Positron decay physics
PET detectors design
PET Lines-of-Response and Sinograms
PET event types
– prompt, true, scatter, random
PET data processing
– normalization, attenuation, scatter, randoms
PET/CT
PET calibration and SUV
PET 2D/3D acquisitions
AAPM 2014 S. Cheenu Kappadath, PhD

7/22/2014
2
4
Positron Decay
AAPM 2014 S. Cheenu Kappadath, PhD
Nuclei with low a neutron-to-proton ratio converts a proton to a neutron via emission of positron (+)
p = n + + + ; AXZ = AYZ-1 + + +
Cyclotron (generator) for production of + emitters
Electron capture competes with positron decay AXZ = AYZ-1 + X-rays
– Branching Ratios
– 18F = 0.967
14N(p,)11C 16O(p,)13N 13C(p,n)13N 14N(d,n)15O
15N(p,n)15O 16O(p,pn)15O 18O(p,n)18F 20Ne(d,)18F
5
Annihilation Photons
Energy spectrum of + emission is continuous
+ range depends on energy – 18F: Emax = 0.64 MeV, Range ~1 mm
– 82Ru: Emax = 3.15 MeV, Range ~2 mm
+ annihilation results in simultaneous emission of
– Two 511 keV photons
– Emitted (nearly) 180 degrees apart
AAPM 2014 S. Cheenu Kappadath, PhD
+ -
g: 511 keV
g: 511 keV
6
Schematic of a PET scanner
AAPM 2014 S. Cheenu Kappadath, PhD
Nucleus
positron
electron
Annihilation
photon
Detector
Ring
Annihilation
photon

7/22/2014
3
7
PET detectors
AAPM 2014 S. Cheenu Kappadath, PhD
PET Detector Block
8
PET Detector Module and Rings
AAPM 2014 S. Cheenu Kappadath, PhD
http://www.nucmed.buffalo.edu PET Detector Block
PET Detector Module
9
PET Scanner – Covers Off
AAPM 2014 S. Cheenu Kappadath, PhD
7/22/2014
4
10
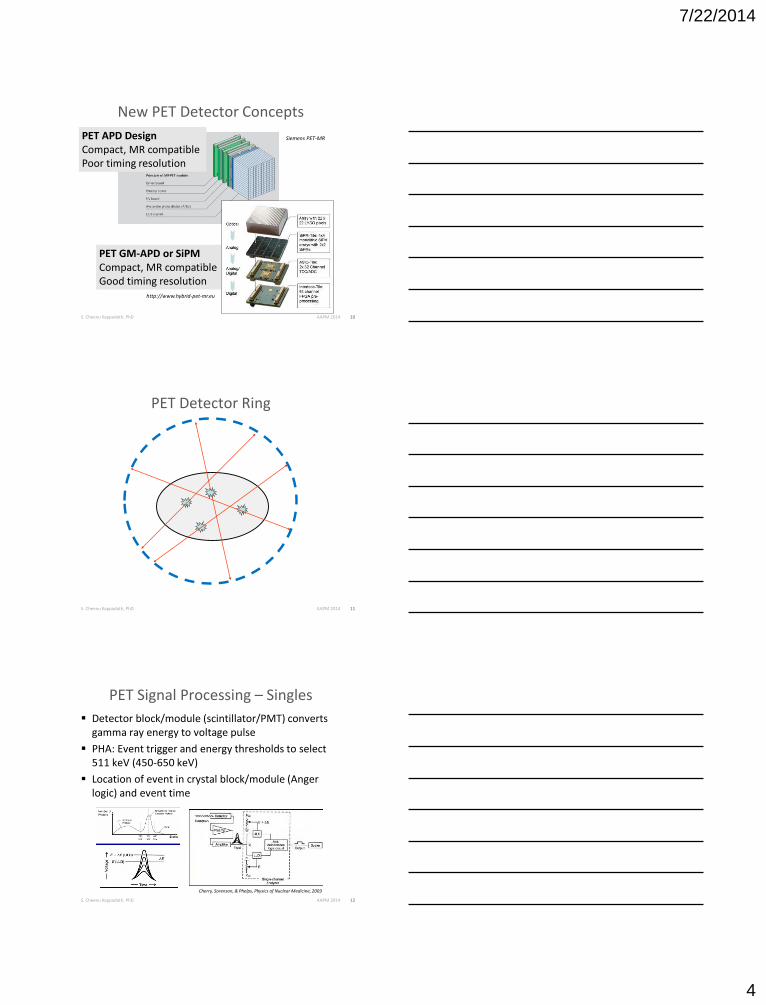
New PET Detector Concepts
AAPM 2014 S. Cheenu Kappadath, PhD
PET GM-APD or SiPM Compact, MR compatible Good timing resolution
PET APD Design Compact, MR compatible Poor timing resolution
Siemens PET-MR
http://www.hybrid-pet-mr.eu
11
PET Detector Ring
S. Cheenu Kappadath, PhD AAPM 2014
12
PET Signal Processing – Singles
Detector block/module (scintillator/PMT) converts gamma ray energy to voltage pulse
PHA: Event trigger and energy thresholds to select 511 keV (450-650 keV)
Location of event in crystal block/module (Anger logic) and event time
AAPM 2014 S. Cheenu Kappadath, PhD
Cherry, Sorenson, & Phelps, Physics of Nuclear Medicine, 2003
7/22/2014
5
13
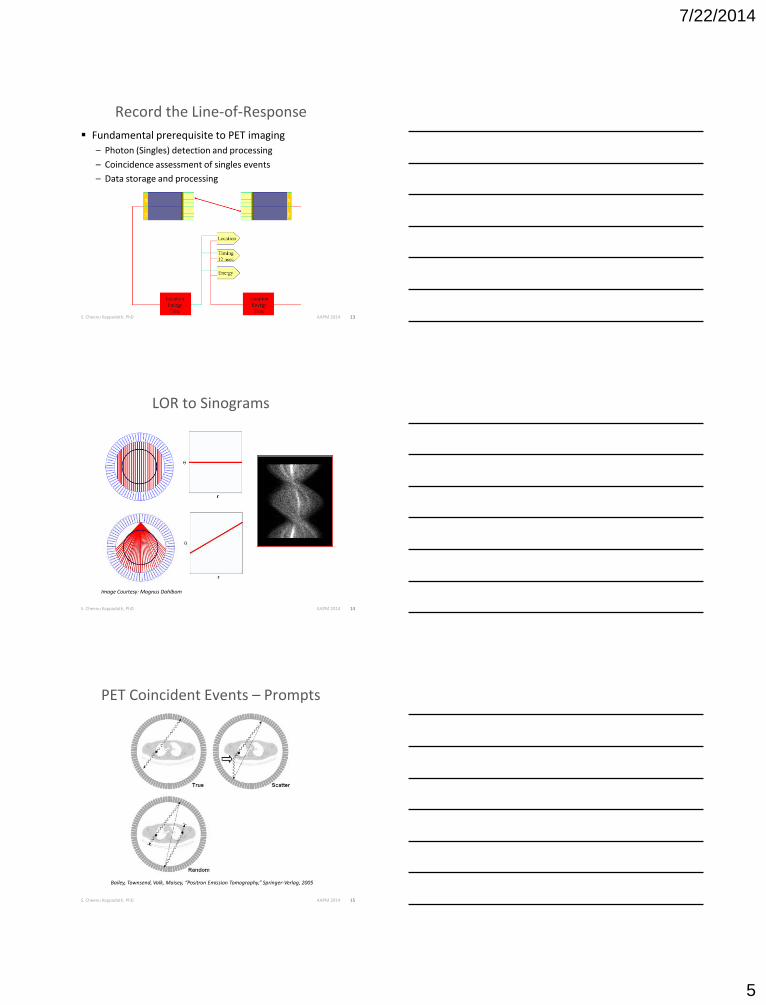
Record the Line-of-Response
Fundamental prerequisite to PET imaging
– Photon (Singles) detection and processing
– Coincidence assessment of singles events
– Data storage and processing
S. Cheenu Kappadath, PhD AAPM 2014
14
LOR to Sinograms
S. Cheenu Kappadath, PhD
Image Courtesy: Magnus Dahlbom
AAPM 2014
15
PET Coincident Events – Prompts
S. Cheenu Kappadath, PhD
Bailey, Townsend, Valk, Maisey, “Positron Emission Tomography,” Springer-Verlag, 2005
AAPM 2014

7/22/2014
6
16
PET data corrections
AAPM 2014 S. Cheenu Kappadath, PhD
Measured “True”
Measured Prompts
Correct Random
Normalize
Correct Geometry
Correct Scatter
Correct Attenuation
Correct Deadtime loss
FBP/IR reconstruction
Correct Axial Sensitivity
Scanner Calibration
PET image in kBq/mL
17
Randoms Correction
1) Randoms Rates from Singles Rates, R = 2t x S1 x S2 – Randoms are proportional to S2
– Statistically more accurate since S>>R
2) Randoms Rates from Delayed Prompts (Dt >> 10 ns) – Real-time subtraction
– Identical deadtime characteristics to Prompts channel
– Requires more memory and statistically less accurate
AAPM 2014 S. Cheenu Kappadath, PhD
Detector Detector
Constant
Fraction
Discriminator
Constant
Fraction
Discriminator
10 ns 10 ns
AND
Delay
>> 10ns
Delayed Prompts are Randoms Casey and Hoffman, 1986
18
Normalization (uniformity correction)
AAPM 2014 S. Cheenu Kappadath, PhD
Pre- Normalization
Post- Normalization
Normalization Sinogram
Image Courtesy: Osama Mawlawi
7/22/2014
7
19
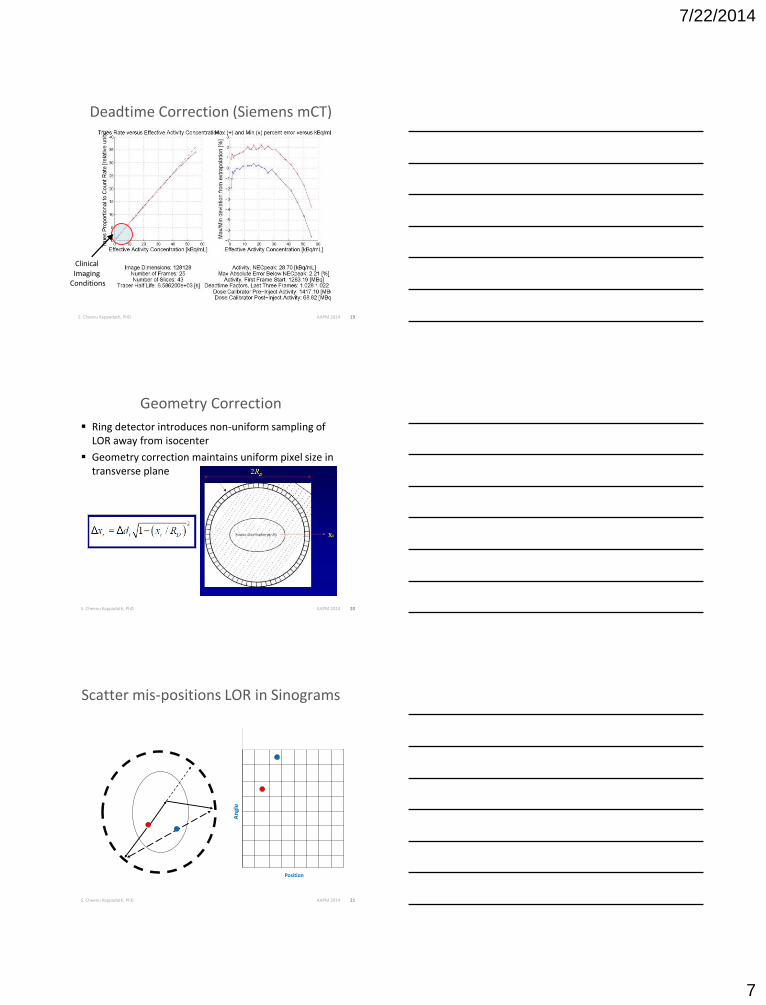
Deadtime Correction (Siemens mCT)
AAPM 2014 S. Cheenu Kappadath, PhD
Clinical Imaging
Conditions
20
Geometry Correction
Ring detector introduces non-uniform sampling of LOR away from isocenter
Geometry correction maintains uniform pixel size in transverse plane
AAPM 2014 S. Cheenu Kappadath, PhD
21
Scatter mis-positions LOR in Sinograms
AAPM 2014 S. Cheenu Kappadath, PhD
Position
An
gle
7/22/2014
8
22
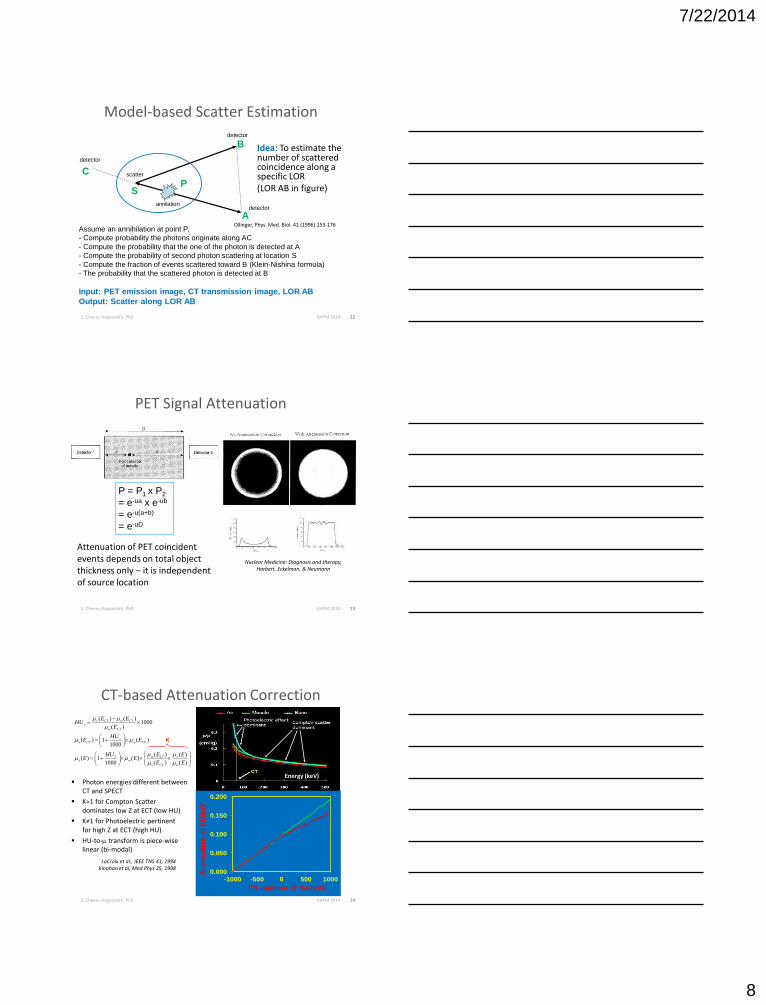
Model-based Scatter Estimation
AAPM 2014 S. Cheenu Kappadath, PhD
Idea: To estimate the number of scattered coincidence along a specific LOR (LOR AB in figure)
A
B
S
C
annilation
detector
detector
detector
scatter
P
Assume an annihilation at point P,
- Compute probability the photons originate along AC
- Compute the probability that the one of the photon is detected at A
- Compute the probability of second photon scattering at location S
- Compute the fraction of events scattered toward B (Klein-Nishina formula)
- The probability that the scattered photon is detected at B
Input: PET emission image, CT transmission image, LOR AB
Output: Scatter along LOR AB
Ollinger, Phys. Med. Biol. 41 (1996) 153-176
23
PET Signal Attenuation
AAPM 2014 S. Cheenu Kappadath, PhD
P = P1 x P2
= e-ua x e-ub
= e-u(a+b)
= e-uD
Nuclear Medicine: Diagnosis and therapy, Harbert, Eckelman, & Neumann
Attenuation of PET coincident events depends on total object thickness only – it is independent of source location
24
CT-based Attenuation Correction
AAPM 2014 S. Cheenu Kappadath, PhD
Photon energies different between CT and SPECT
K≈1 for Compton Scatter dominates low Z at ECT (low HU)
K≠1 for Photoelectric pertinent for high Z at ECT (high HU)
HU-to-m transform is piece-wise linear (bi-modal)
( ) ( )1000
( )
( ) 1 ( )1000
( ) ( )( ) 1 ( )
1000 ( ) ( )
x CT w CTx
w CT
xx CT w CT
x w CT xx w
x CT w
E EHU
E
HUE E
HU E EE E
E E
m m
m
m m
m mm m
m m
K
LaCroix et al., IEEE TNS 41, 1994 Kinahan et al, Med Phys 25, 1998
0.000
0.050
0.100
0.150
0.200
-1000 -500 0 500 1000
Att
en
ua
tio
n a
t 5
11k
eV
CT number @ 140kVp
Energy (keV)
7/22/2014
9
25
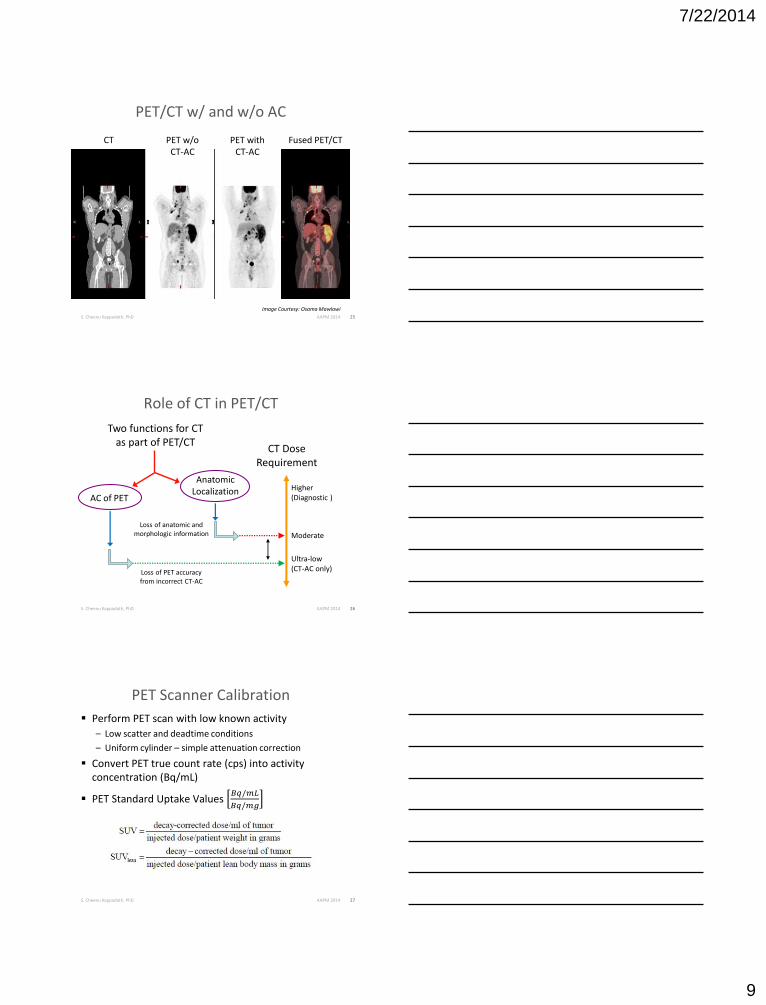
PET/CT w/ and w/o AC
AAPM 2014 S. Cheenu Kappadath, PhD
CT PET w/o CT-AC
PET with CT-AC
Fused PET/CT
Image Courtesy: Osama Mawlawi
26
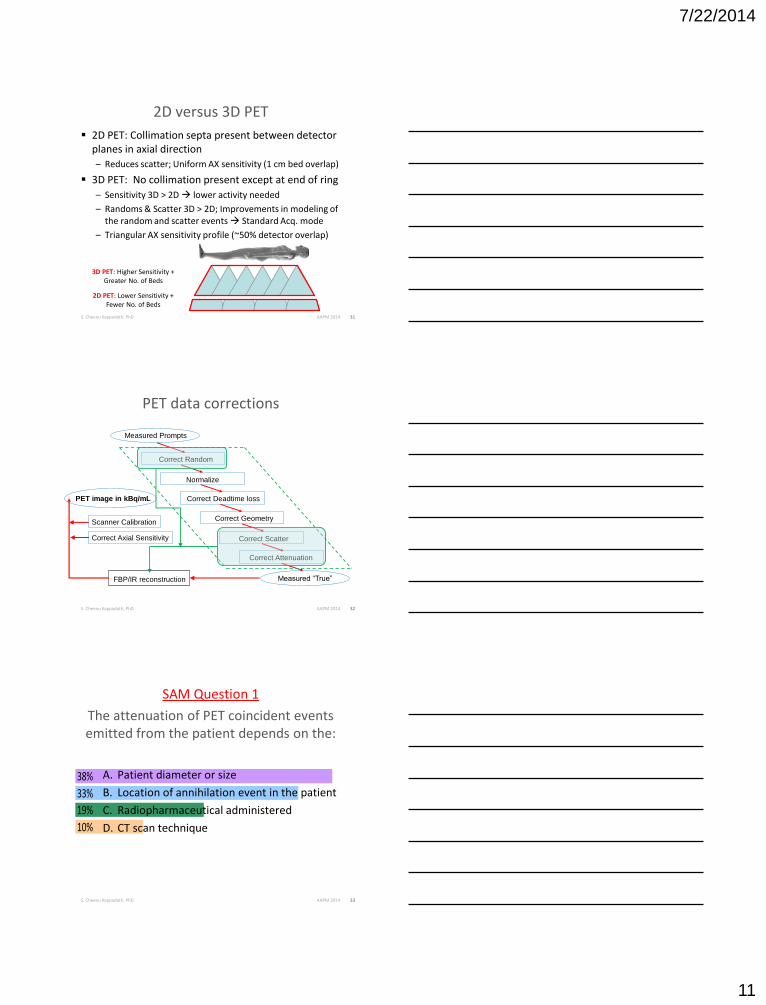
Role of CT in PET/CT
AAPM 2014 S. Cheenu Kappadath, PhD
Two functions for CT as part of PET/CT
AC of PET Higher (Diagnostic )
Ultra-low (CT-AC only)
CT Dose Requirement
Anatomic Localization
Loss of anatomic and morphologic information Moderate
Loss of PET accuracy from incorrect CT-AC
27
PET Scanner Calibration
Perform PET scan with low known activity
– Low scatter and deadtime conditions
– Uniform cylinder – simple attenuation correction
Convert PET true count rate (cps) into activity concentration (Bq/mL)
PET Standard Uptake Values 𝐵𝑞/𝑚𝐿
𝐵𝑞/𝑚𝑔
AAPM 2014 S. Cheenu Kappadath, PhD

7/22/2014
10
28
PET Calibration Phantoms
AAPM 2014 S. Cheenu Kappadath, PhD
NIST traceable F-18 STD “S” vial geometry
29
2D versus 3D PET
AAPM 2014 S. Cheenu Kappadath, PhD
Detector Center Plane D = 0; Planes = 1; Images = 16
Detector in-between Planes D = 1; Planes = 2; Images = 15 D = 2; Planes = 3; Images = 14 D = 3; Planes = 4; Images = 13
Cherry, Sorenson, & Phelps, Physics of Nuclear Medicine, 2003
30
PET Sensitivity NEMA (GE DRX)
AAPM 2014 S. Cheenu Kappadath, PhD
7/22/2014
11
31
2D versus 3D PET
2D PET: Collimation septa present between detector planes in axial direction
– Reduces scatter; Uniform AX sensitivity (1 cm bed overlap)
3D PET: No collimation present except at end of ring
– Sensitivity 3D > 2D lower activity needed
– Randoms & Scatter 3D > 2D; Improvements in modeling of the random and scatter events Standard Acq. mode
– Triangular AX sensitivity profile (~50% detector overlap)
AAPM 2014 S. Cheenu Kappadath, PhD
3D PET: Higher Sensitivity + Greater No. of Beds
2D PET: Lower Sensitivity + Fewer No. of Beds
32
PET data corrections
AAPM 2014 S. Cheenu Kappadath, PhD
Measured “True”
Measured Prompts
Correct Random
Normalize
Correct Geometry
Correct Scatter
Correct Attenuation
Correct Deadtime loss
FBP/IR reconstruction
Correct Axial Sensitivity
Scanner Calibration
PET image in kBq/mL
33
SAM Question 1
The attenuation of PET coincident events emitted from the patient depends on the:
AAPM 2014 S. Cheenu Kappadath, PhD
10%
19%
33%
38% A. Patient diameter or size
B. Location of annihilation event in the patient
C. Radiopharmaceutical administered
D. CT scan technique

7/22/2014
12
34
SAM Question 1: Answer
The attenuation of PET coincident events emitted from the patient depends on the:
A. Patient diameter or size
B. Location of annihilation event in the patient
C. Radiopharmaceutical administered
D. CT scan technique
Answer: A – Patient diameter or size
Reference: SR Cherry, JA Sorenson, ME Phelps, “Physics in Nuclear Medicine, 3rd Edition,” Saunders Elsevier, 2003
AAPM 2014 S. Cheenu Kappadath, PhD
35
SAM Question 2
The well counter calibration for a PET scanner is used to:
AAPM 2014 S. Cheenu Kappadath, PhD
8%
15%
23%
15% A. Correct for variations in image uniformity
B. Correct for variations in detector gains
C. Correct for differences in detector coincidence timing
D. Convert count rate (cps) to activity concentration (kBq/mL)
36
SAM Question 2: Answer
The well counter calibration for a PET scanner is used to:
A. Correct for variations in image uniformity
B. Correct for variations in detector gains
C. Correct for differences in detector coincidence timing
D. Convert count rate (cps) to activity concentration (kBq/mL)
Answer: D – Convert count rate (cps) to activity concentration (kBq/mL)
Reference: SR Meikle, RD Badawi, “Quantitative Techniques in PET,” in Positron Emission Tomography, eds. DL Bailey, DW Townsend, PE Valk, and MN Maisey, Springer-Verlag (London), 2005
AAPM 2014 S. Cheenu Kappadath, PhD
7/22/2014
13
37
PET NEMA NU2-01/07 (2D/3D)
NEMA Tests
Spatial Resolution
Sensitivity
Scatter Fraction/Count Rate Performance
Image Quality
Accuracy of correction for count losses and randoms
AAPM 2014 S. Cheenu Kappadath, PhD
Daube-Witherspoon M. et al JNM, 43(10) 1398-1409, 2002
38
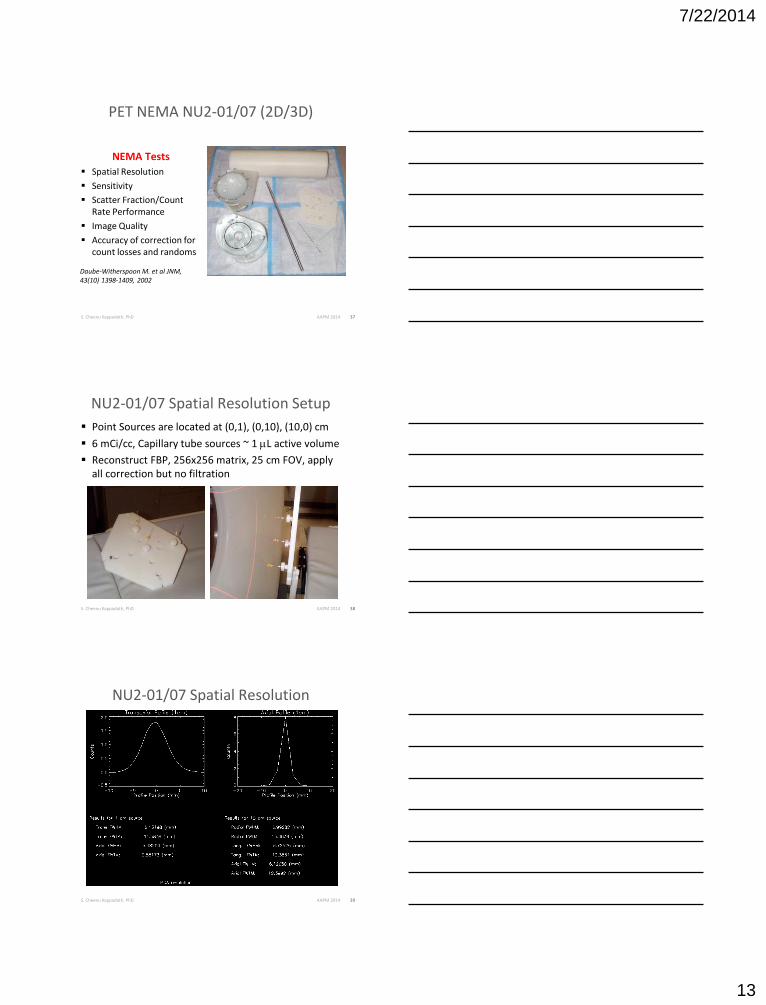
NU2-01/07 Spatial Resolution Setup
Point Sources are located at (0,1), (0,10), (10,0) cm
6 mCi/cc, Capillary tube sources ~ 1 mL active volume
Reconstruct FBP, 256x256 matrix, 25 cm FOV, apply all correction but no filtration
AAPM 2014 S. Cheenu Kappadath, PhD
39
NU2-01/07 Spatial Resolution
AAPM 2014 S. Cheenu Kappadath, PhD

7/22/2014
14
40
NU2-07 Spatial Resolution
AAPM 2014 S. Cheenu Kappadath, PhD
41
NU2-01/07 Sensitivity Setup
Detected coincidence count rate per unit activity in FOV
250 mCi in ~70 cm 2.4 mL line source 5 Aluminum Sleeves
Sensitivity measured with increasing amounts of attenuating material and extrapolated to no attenuation
AAPM 2014 S. Cheenu Kappadath, PhD
70 cm
Placed at isocenter
42
NU2-01/07 Sensitivity: 2D @ R=0
AAPM 2014 S. Cheenu Kappadath, PhD
7/22/2014
15
43
NU2-07 Sensitivity: 3D @ R=0
AAPM 2014 S. Cheenu Kappadath, PhD
44
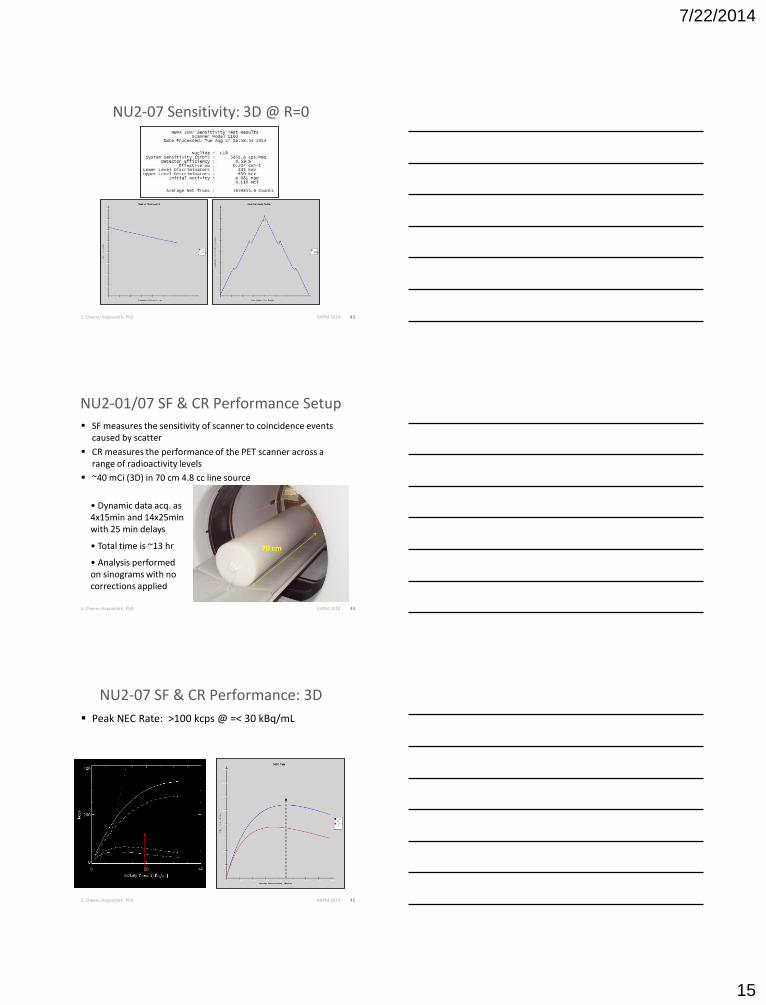
NU2-01/07 SF & CR Performance Setup
SF measures the sensitivity of scanner to coincidence events caused by scatter
CR measures the performance of the PET scanner across a range of radioactivity levels
~40 mCi (3D) in 70 cm 4.8 cc line source
AAPM 2014 S. Cheenu Kappadath, PhD
70 cm
• Dynamic data acq. as 4x15min and 14x25min with 25 min delays
• Total time is ~13 hr
• Analysis performed on sinograms with no corrections applied
45
NU2-07 SF & CR Performance: 3D
Peak NEC Rate: >100 kcps @ =< 30 kBq/mL
AAPM 2014 S. Cheenu Kappadath, PhD
7/22/2014
16
46
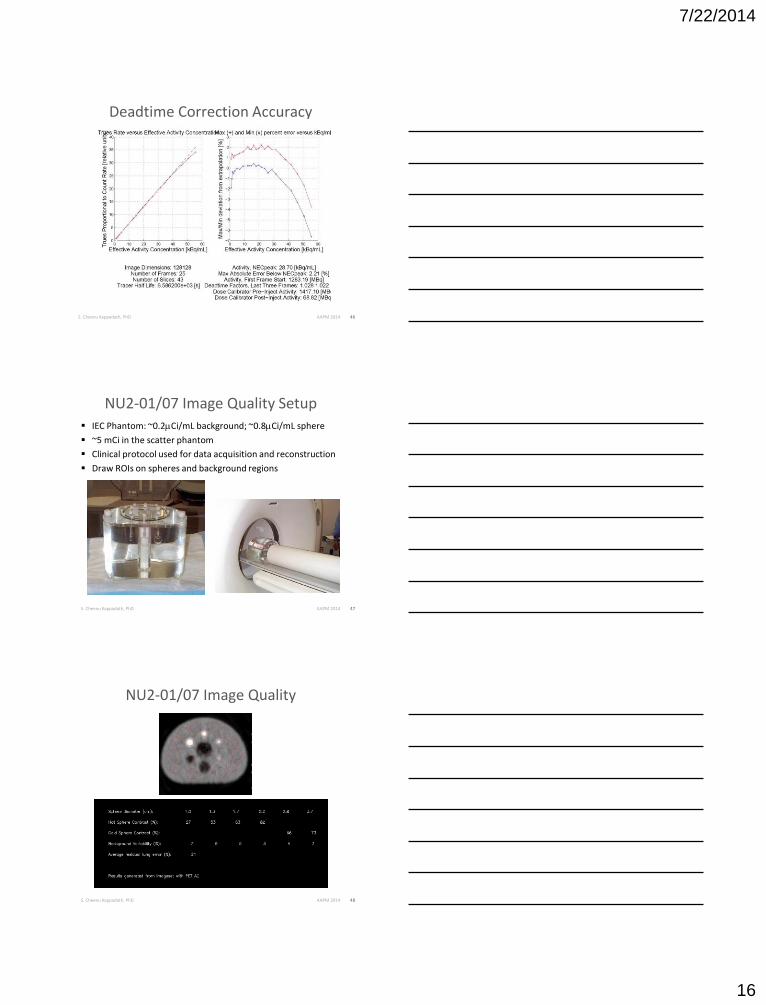
Deadtime Correction Accuracy
AAPM 2014 S. Cheenu Kappadath, PhD
47
NU2-01/07 Image Quality Setup
IEC Phantom: ~0.2mCi/mL background; ~0.8mCi/mL sphere
~5 mCi in the scatter phantom
Clinical protocol used for data acquisition and reconstruction
Draw ROIs on spheres and background regions
AAPM 2014 S. Cheenu Kappadath, PhD
48
NU2-01/07 Image Quality
AAPM 2014 S. Cheenu Kappadath, PhD

7/22/2014
17
49
PET ACR Image Quality
Specific instructions for phantom preparations
Clinical protocol used for data acquisition and reconstruction
Draw ROIs on cylinders and background regions
AAPM 2014 S. Cheenu Kappadath, PhD
Background Cylinders
50
PET ACR Phantom Images
1. Image contrast and quantitation – cylinder SUV
2. Uniformity and artifacts – uniform section
3. Spatial resolution – cold rods
AAPM 2014 S. Cheenu Kappadath, PhD
1 2 3
25, 16, 12, 8 mm 12.7, 11.1, 9.5, 7.9 mm
51
SBR: 10-to-1
0
400
800
1200
1600
2000
0 5 10 15 20 25 30 35 40 45
Iterations
Ba
ckg
rou
nd
Std
-De
v
Subsets 1
Subsets 3
Subsets 15
Subsets 21
Subsets 45
Subsets 63
S. Cheenu Kappadath, PhD
Iterative Reconstruction (18FDG PET/CT) Mean AC, SBR: 5-to-1, Sphere ID: 37 mm
0.60
0.65
0.70
0.75
0.80
0.85
0.90
0.95
1.00
0 5 10 15 20 25 30 35 40 45
Iterations
Re
lative
AC
(M
ea
su
red
/Tru
e)
Subsets 1
Subsets 3
Subsets 15
Subsets 21
Subsets 45
Subsets 63
Max AC, SBR: 5-to-1, Sphere ID: 37 mm
1.00
1.05
1.10
1.15
1.20
1.25
1.30
1.35
1.40
0 5 10 15 20 25 30 35 40 45
Iterations
Re
lative
AC
(M
ea
su
red
/Tru
e)
R. Boellaard, JNM 50, 11S-20S, 2009
Kappadath et al., IEEE-MIC , M26-220, 2007
SUV mean
SUV max
Image Noise
AAPM 2014

7/22/2014
18
52 S. Cheenu Kappadath, PhD
Partial Volume Effect
Arises from the effects of finite spatial resolution on the reconstructed PET activity distribution
– Smears the activity distribution
– Lower signal for object size smaller than 2s
Recovery coefficient versus object size The partial-volume effect
Cherry, Sorenson, & Phelps, Physics of Nuclear Medicine, 2003
AAPM 2014
53 S. Cheenu Kappadath, PhD
PET/CT: motion mis-registration
AAPM 2014
Image Courtesy: Osama Mawlawi
54
PET versus CT FOV registration
S. Cheenu Kappadath, PhD
Bailey, Townsend, Valk, and Maisey, “Positron Emission Tomography,” Springer-Verlag, 2005
AAPM 2014
7/22/2014
19
55 S. Cheenu Kappadath, PhD
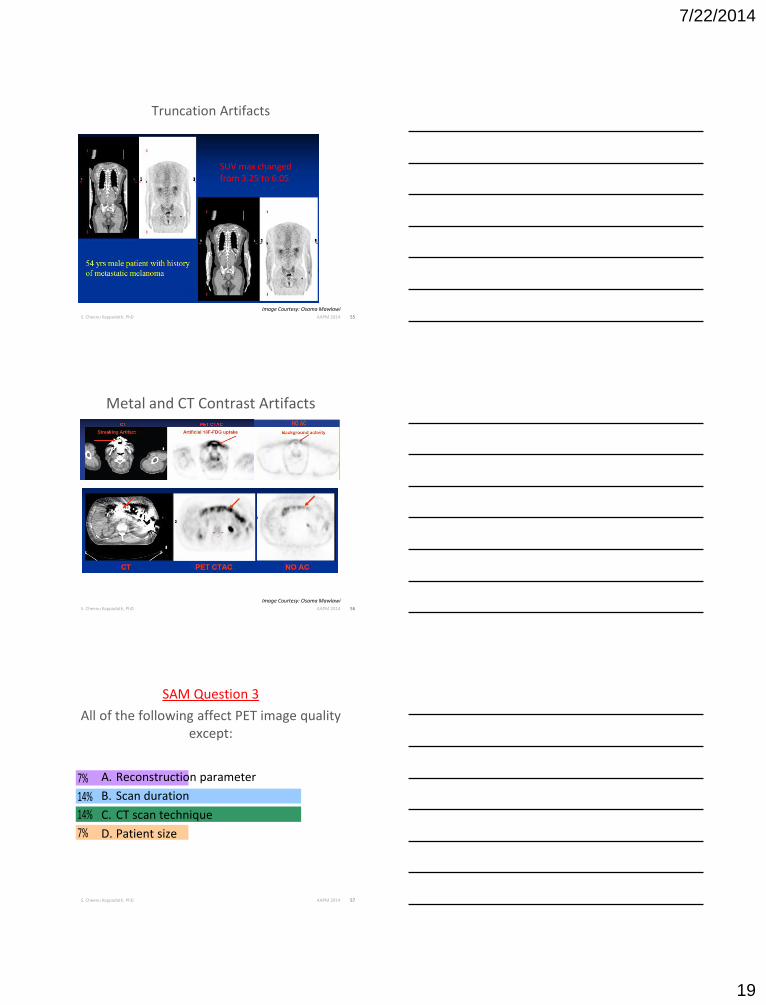
Truncation Artifacts
SUV max changed from 3.25 to 6.05
Image Courtesy: Osama Mawlawi
AAPM 2014
56 S. Cheenu Kappadath, PhD
Metal and CT Contrast Artifacts
AAPM 2014
Image Courtesy: Osama Mawlawi
57
SAM Question 3
All of the following affect PET image quality except:
AAPM 2014 S. Cheenu Kappadath, PhD
7%
14%
14%
7% A. Reconstruction parameter
B. Scan duration
C. CT scan technique
D. Patient size

7/22/2014
20
58
SAM Question 3: Answer
All of the following affect PET image quality except:
A. Reconstruction parameters
B. Scan duration
C. CT scan technique
D. Patient size
Answer: C – CT scan technique
Reference: O Mawlawi, SC Kappadath, T Pan, E Rohren, HA Macapinlac, “Factors affecting quantification in PET/CT imaging,” Current Medical Imaging Reviews 4, 34-45, 2008
AAPM 2014 S. Cheenu Kappadath, PhD
59
SAM Question 4
The minimum CT dose appropriate for PET/CT examinations are constrained by:
AAPM 2014 S. Cheenu Kappadath, PhD
7%
10%
14%
0% A. Accuracy of CT-based attenuation correction
B. Radiologist preference for CT image quality
C. Equalize the CT dose to the PET dose
D. Accuracy of PET scatter correction
60
SAM Question 4: Answer
The minimum CT dose appropriate for PET/CT examinations are constrained by:
A. Accuracy of CT-based attenuation correction
B. Radiologist preference for CT image quality
C. Equalize the CT dose to the PET dose
D. Accuracy of PET scatter correction
Answer: B – Radiologist preference for CT image quality
Reference: FH Fahey, MR Palmer, KJ Strauss, RE Zimmerman, RD Badawi, ST Treves, “Dosimetry and adequacy of CT-based attenuation correction for pediatric PET: Phantom study,” Radiology 243, 96–104, 2007
AAPM 2014 S. Cheenu Kappadath, PhD
7/22/2014
21
61
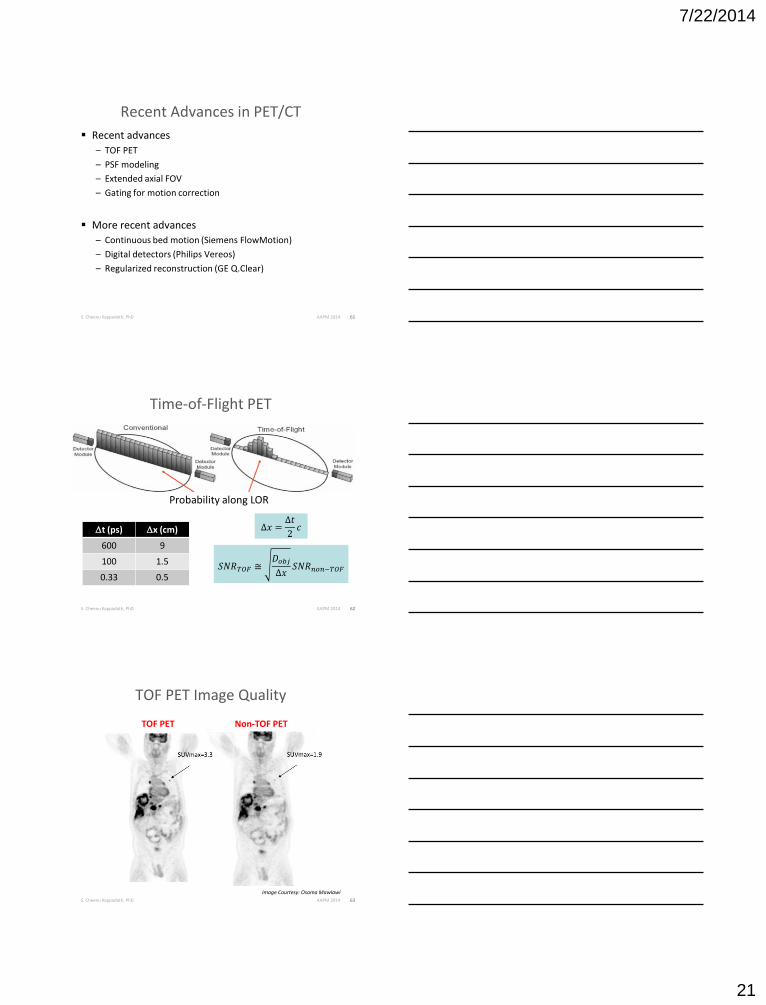
Recent Advances in PET/CT Recent advances
– TOF PET
– PSF modeling
– Extended axial FOV
– Gating for motion correction
More recent advances
– Continuous bed motion (Siemens FlowMotion)
– Digital detectors (Philips Vereos)
– Regularized reconstruction (GE Q.Clear)
AAPM 2014 S. Cheenu Kappadath, PhD
62
Time-of-Flight PET
S. Cheenu Kappadath, PhD
Probability along LOR
∆𝑥 =∆𝑡
2𝑐
𝑆𝑁𝑅𝑇𝑂𝐹 ≅𝐷𝑜𝑏𝑗∆𝑥
𝑆𝑁𝑅𝑛𝑜𝑛−𝑇𝑂𝐹
Dt (ps) Dx (cm)
600 9
100 1.5
0.33 0.5
AAPM 2014
63
TOF PET Image Quality
AAPM 2014 S. Cheenu Kappadath, PhD
Image Courtesy: Osama Mawlawi
TOF PET Non-TOF PET

7/22/2014
22
64
PSF Resolution Modeling
Goal is to improve image quality, contrast, and quantitative accuracy
SharpIR (GE)
TrueX (Siemens)
Phillips
AAPM 2014 S. Cheenu Kappadath, PhD
Lee et al., PMB 49, 2004
Pecking et al., Clin. Exp. Metastasis 29, 2012
w/o w/
w/o w/
65
Improvements in PET Image Quality
AAPM 2014 S. Cheenu Kappadath, PhD
66
Advantages of Extended Axial FOV
Fewer bed positions for same axial coverage
Increased sensitivity time/bed or counts/time
Net reduction in imaging time (or administered activity) for comparable image quality
AAPM 2014 S. Cheenu Kappadath, PhD
Sensitivity
FOV
Image courtesy: D Townsend

7/22/2014
23
67
SAM Question 5
The main advantage of a TOF PET scanner over a non-TOF PET scanner is:
AAPM 2014 S. Cheenu Kappadath, PhD
7%
7%
10%
10% A. Higher intrinsic spatial resolution
B. Higher image contrast-to-noise ratio (CNR)
C. Higher count-rate performance
D. Lower number of detector elements needed
68
SAM Question 5: Answer
The main advantage of a TOF PET scanner over a non-TOF PET scanner is:
A. Higher intrinsic spatial resolution
B. Higher image contrast-to-noise ratio (CNR)
C. Higher count rate performance
D. Lower number of detector elements needed
Answer: B – Higher image contrast-to-noise ratio (CNR)
Reference: M Conti, “Focus on time-of-flight PET: the benefits of improved time resolution,” EJNMMI 38, 1147-1157, 2011
AAPM 2014 S. Cheenu Kappadath, PhD
69
Gating and List Mode
Motion smears PET signal and reduced intensity
– PET is motion averaged therefore use (motion) average CT
Trigger to sort PET data into bins to correct for organ motion – cardiac or respiratory gating
AAPM 2014 S. Cheenu Kappadath, PhD
SUV = 5.0 SUV = 8.5 Image courtesy: Tinsu Pan

7/22/2014
24
Gated 4D PET and 4D CT Acquisition
time
7
3
4 5
6
8
3
4 5
6
7
Bin 8
8 2
Trigger
1
Bin 1
2
1
Trigger
• Prospective fixed forward time binning
• Single FOV Gated PET and Gated CT
• User defined number of bins and bin duration
• Images will be noisy unless acquired for longer durations Image Courtesy: Tinsu Pan
71
Motion Correction Software
Goal is to improve image quality, contrast, and quantitative accuracy – respiratory motion
Q.Freeze (GE): Phase-matched 4D PET/CT
Q.Static (GE) and HD.Chest (Siemens): Use PET data from end-expiration when motion is low
Other vendors also have 4D PET solutions
AAPM 2014 S. Cheenu Kappadath, PhD
image courtesy: Siemens
72
Continuous Bed Motion
One-Size-Fits-All Siemens FlowMotion
2’
2’
2’
2’
2’
2’
HD•Chest
0.8 mm/s
0.8 mm/s
0.5 mm/s
2.0 mm/s
Hi-R
ez
Hig
her
Sp
eed
AAPM 2014 S. Cheenu Kappadath, PhD
image courtesy: Siemens

7/22/2014
25
73
Continuous Bed Motion
Siemens FlowMotion mCT scanner
AAPM 2014 S. Cheenu Kappadath, PhD
image courtesy: Siemens
74
PSF TOF+PSF QC+PSF QC+TOF+PSF
77 years male with follicular lymphoma, 80 kg, 25 BMI, 9.4 mCi, 60 min post injection
Regularized Reconstruction – GE Q.Clear
AAPM 2014 S. Cheenu Kappadath, PhD
75
Fully Digital PET/CT – Philips Vereos
LYSO crystals + SiPM Fully digital detectors
– Fast and high sensitivity
TOF, PSF modeling, 4D capability
AAPM 2014 S. Cheenu Kappadath, PhD
image courtesy: Philips

7/22/2014
26
76
References
SR Cherry, JA Sorenson, ME Phelps, “Physics in Nuclear Medicine, 3rd Edition,” Saunders Elsevier, 2003
DL Bailey, DW Townsend, PE Valk, and MN Maisey, “Positron Emission Tomography,” Springer-Verlag (London), 2005
M Conti, “Focus on time-of-flight PET: the benefits of improved time resolution,” EJNMMI 38, 1147-1157, 2011
O Mawlawi, SC Kappadath, T Pan, E Rohren, HA Macapinlac, “Factors affecting quantification in PET/CT imaging,” Current Medical Imaging Reviews 4, 34-45, 2008
FH Fahey, MR Palmer, KJ Strauss, RE Zimmerman, RD Badawi, ST Treves, “Dosimetry and adequacy of CT-based attenuation correction for pediatric PET: Phantom study,” Radiology 243, 96–104, 2007
AAPM 2014 S. Cheenu Kappadath, PhD