priority areas for the conservation of south african …planet.botany.uwc.ac.za/nisl/conservation...
TRANSCRIPT

© 2001 Blackwell Science Ltd. http://www.blackwell-science.com/ddi
79
BIODIVERSITY RESEARCH
Diversity and Distributions
(2001)
7
, 79–95
Blackwell Science, Ltd
Priority areas for the conservation of South African vegetation: a coarse-filter approach
B. REYERS*
1
, D. H. K. FAIRBANKS
1,2
, A. S. VAN JAARSVELD
1,3
and M. THOMPSON
4 1
Conservation Planning Unit, Department of Zoology and Entomology, University of Pretoria, Pretoria, 0002, South Africa, *Correspondence. E-mail: [email protected],
2
Present address: Fitzpatrick Institute, University of Cape Town, Rondebosch, 7701, South Africa,
3
Centre for Environmental Studies, University of Pretoria, Pretoria, 0002, South Africa,
4
CSIR Division of Water,
Environment and Forestry Technology, PO Box 395, Pretoria, 0001, South Africa
Abstract.
South Africa has an important respons-ibility to global biodiversity conservation, but alargely inadequate conservation area network foraddressing this responsibility. This study employsa coarse-filter approach based on 68 potentialvegetation units to identify areas that are largelytransformed, degraded or impacted upon by road-effects. The assessment highlights broad vegeta-tion types that face high biodiversity lossescurrently or in the near future due to humanimpacts. Most vegetation types contain largetracts of natural vegetation, with little degrada-tion, transformation or impacts from road net-works. Regions in the grasslands, fynbos and
forest biomes are worst affected. Very few of thevegetation types are adequately protected accord-ing to the IUCN’s 10% protected area conserva-tion target, with the fynbos and savanna biomescontaining a few vegetation types that do achievethis arbitrary goal. This investigation identifiesareas where limited conservation resources shouldbe concentrated by identifying vegetation typeswith high levels of anthropogenic land use threatsand associated current and potential biodiversityloss.
Key words.
Coarse-filter, biodiversity conserva-tion, land-cover, vegetation types, road-effects.
INTRODUCTION
South Africa contains a wealth of biodiversitywithin its borders, unequalled by other temperateregions, earning a place in the top 25 mostbiodiverse nations (WCMC, 1992; ConservationInternational, 1998). In addition South Africaharbours the fifth highest number of plant spe-cies in the world, with the Cape Floristic Regionbeing recognized as one of the six floral kingdomsof the world. This region contains 8200 plantspecies, of which 5682, are endemic and has lostapproximately 30.3% of its primary vegetation(Fairbanks
et al
., 2000; Myers
et al
., 2000).Although its responsibility towards global
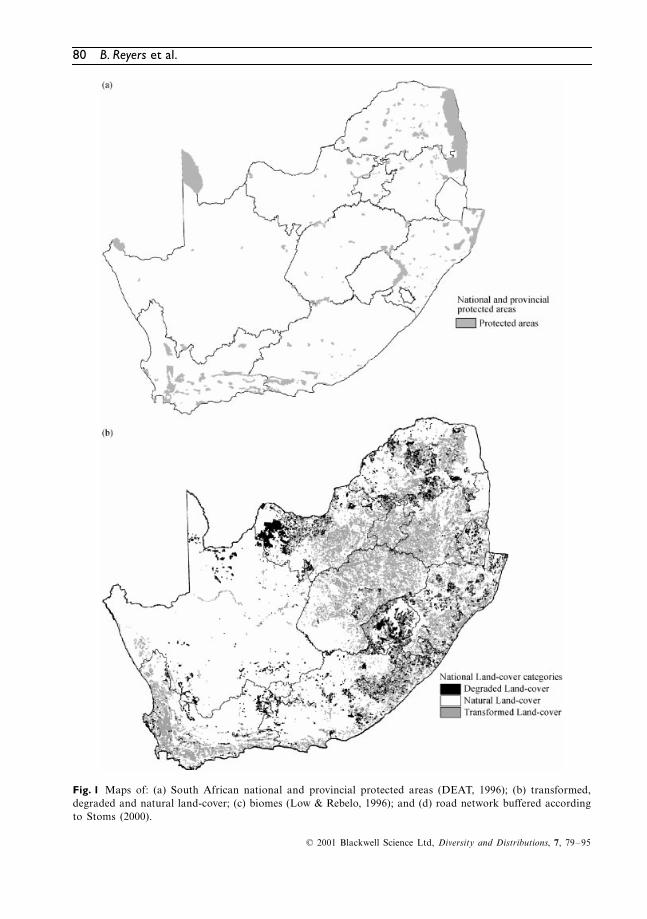
biodiversity conservation is large South Africa,with only 4.8% (DEAT, 1996) (Fig. 1a) of its
land surface under formal protection, falls farshort of the IUCN’s nominal recommendationof 10% protected area coverage. This coveragealso lags behind the 10% average attained by therest of subSaharan Africa, with Botswana reach-ing 18.5%, Mozambique 12.7% and Namibia12.4% (McNeely, 1994; WRI, 1994; Siegfried
et al.
, 1998). A moderately expanding humanpopulation (Central Statistical Survey, 1998) andassociated land transformation in South Africa(mainly urbanization, cultivation and afforestation(Hoffmann, 1997) ) leaves 79% of the countrycovered with natural woody and grassland vegeta-tion communities (Fig. 1b) (Fairbanks
et al
., 2000).Water bodies and wetlands cover less than 1%of the land surface area, with human land usesmaking up the remaining 20% (Fairbanks
et al
.,
DDI098.fm Page 79 Tuesday, May 29, 2001 9:37 AM
80
B. Reyers
et al.
© 2001 Blackwell Science Ltd,
Diversity and Distributions
,
7
, 79–95
Fig. 1 Maps of: (a) South African national and provincial protected areas (DEAT, 1996); (b) transformed,degraded and natural land-cover; (c) biomes (Low & Rebelo, 1996); and (d) road network buffered accordingto Stoms (2000).
DDI098.fm Page 80 Tuesday, May 29, 2001 9:37 AM

Conservation of South African vegetation
81
© 2001 Blackwell Science Ltd,
Diversity and Distributions
,
7
, 79–95
Fig. 1 continued.
DDI098.fm Page 81 Tuesday, May 29, 2001 9:37 AM

82
B. Reyers
et al.
© 2001 Blackwell Science Ltd,
Diversity and Distributions
,
7
, 79–95
2000). Fairbanks
et al
. (2000) demonstrate thatalong with the approximately 30% transforma-tion in the fynbos biome, the savanna and grass-land biomes are about 10% and 26% transformedand degraded by human land uses, respectively(Fig. 1c) (see also Thompson
et al.
, 2001). Inaddition to this there are a total of 1176 speciespresently recognized as threatened (WRI, 1994;van Jaarsveld, 2000). Thus with these valuableand often endemic biodiversity resources facingever-increasing threats from human-induced landtransformation, and mostly inadequate conserva-tion efforts to stem these threats, South Africa hasan obvious responsibility to do more towards theconservation of biodiversity (van Jaarsveld, 2000).
Most of South Africa’s existing protected areaswere proclaimed in an
ad hoc
fashion, usuallybecause they contained areas with high scenic ortourism potential, contained endemic diseasesand did not conflict with other forms of land use(Pringle, 1982; Pressey
et al.
, 1993; Freitag
et al.
,1996). Because this form of land allocation toconservation is highly inefficient and fails toeffectively conserve biodiversity, several tech-niques have been developed for the systematicselection of land with a high conservation value,i.e. with high levels of biodiversity and largeanthropogenic threats facing that biodiversity(for reviews see Williams, 1998; Margules &Pressey, 2000). However, these techniques requiredata on the distribution of biodiversity andthreats facing biodiversity in order to identifyareas important to conservation. Because the bio-diversity of a region can never be fully observedand inventoried, species distribution data areoften used as a surrogate or substitute measureof biodiversity. This form of data, however, hasa large number of shortcomings associated withit. These include inadequate taxonomical know-ledge of the groups employed, biased samplingefforts and lack of spatial congruency betweenareas of conservation importance to differenttaxa (van Jaarsveld
et al.
, 1998; Maddock & duPlessis, 1999; Fairbanks & Benn, 2000; Reyers
et al
., 2000).
Broad-scale biodiversity surrogates
In recent years, the focus for conservation hasshifted, with recommendations towards a moreholistic approach of protecting biodiversity in the
aggregate, the so-called ‘coarse-filter’ approach(Noss, 1987, 1990). This approach focuses onprotecting higher levels of the biodiversity hier-archy (e.g. land-classes and land-types) ratherthan species, assuming that these broad-scalebiodiversity surrogates represent the finer scaleaspects of biodiversity (Pressey & Logan, 1994;Pressey, 1994; Williams & Humphries, 1996;Wessels
et al.
, 1999; Fairbanks & Benn, 2000).However, as Pressey (1994) points out, the as-sumed relationship between environmental classesand species distribution and abundance is unclearand seldom investigated. In addition, certainspecies, especially rare species confined to smallpatches of habitat which are not recognized asdistinct environmental classes, may ‘fall throughthe coarse filter’ when using broad-scale environ-mental classes (Noss, 1983; Bedward
et al.
, 1992;Panzer & Schwartz, 1998). Despite the short-comings associated with a species-based approachto conservation planning, these higher orderbiodiversity surrogates may well fail to identifythe composition, configuration and quantity of ele-ments necessary for biodiversity retention, makingspecies data a necessary component of the con-servation planning process (Lambeck, 1997). Theshortcomings of species distribution data and thelimitations of environmental surrogate measures inthe selection of priority conservation areas suggestthat perhaps a combination of the two approachesin conservation planning may be advisable(Maddock & du Plessis, 1999).
At a national scale South Africa has a fewdatabases of broader surrogates for biodiversity,including
Acocks’ Veld Types
(Acocks, 1988) andthe more recent
Vegetation of South Africa, Lesothoand Swaziland
(Low & Rebelo, 1996; McDonald,1997). Acocks (1988) defined biological resourcesfrom a purely agricultural potential perspective,while Low & Rebelo (1996) looked at the defini-tion of these resources from a management andpotential use angle. These vegetation units weredefined as having: ‘… similar vegetation structure,sharing important plant species, and having sim-ilar ecological processes’. Thus, these are units thatwould have potentially occurred today were itnot for all the major human-made transforma-tions, e.g. agriculture and urbanization. Thereforethe Low & Rebelo (1996) vegetation map con-tains significant potential for acting as a broadscale surrogate of South African biodiversity
DDI098.fm Page 82 Tuesday, May 29, 2001 9:37 AM
Conservation of South African vegetation
83
© 2001 Blackwell Science Ltd,
Diversity and Distributions
,
7
, 79–95
and for identifying land important to biodiver-sity conservation.
METHODS
Current land-cover data
Before the Low & Rebelo (1996) map can be usedone has to differentiate between the potentialvegetation cover of regions (as defined by Low &Rebelo, 1996) and that which is in reality foundin the region. In other words, one needs anindication of current natural vegetation pattern,degree of transformation and amount of pro-tection afforded each vegetation type before onecan decide if it constitutes a conservation priority(Rebelo, 1997). As Low & Rebelo (1996) pointout: ‘there is little point in setting aside more ofa vegetation type with vast expanses in pristinecondition, while ignoring the last patches of atype which is not yet conserved’. Low & Rebelo(1996) provide some estimates of protection andtransformation data, however, as they admit:‘these are woefully incomplete’. Thus, some indica-tion of current land-cover (the suite of naturaland human-made features that cover the earth’simmediate surface) at a national scale is requiredfor effective land-use planning, sustainable resourcemanagement, environmental research and in thisinstance conservation planning (Rebelo, 1997;Fairbanks
et al
., 2000).To this end the advent of the National Land-
cover (NLC) database is of extreme relevance.This national database was derived using manualphoto-interpretation techniques from a series of1 : 250 000 scale geo-rectified hardcopy satelliteimagery maps, based on seasonally standardized,single date Landsat Thematic Mapper (TM)satellite imagery captured principally during theperiod 1994–95 (Fairbanks & Thompson, 1996).
It provides the first single standardized databaseof current land-cover information for the wholeof South Africa, Lesotho and Swaziland (Fair-banks
et al
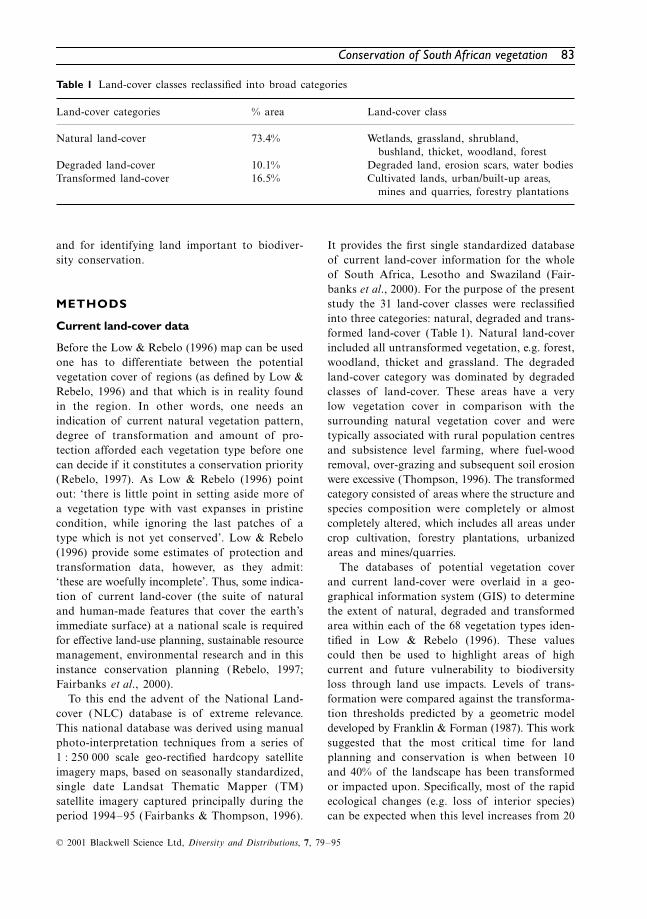
., 2000). For the purpose of the presentstudy the 31 land-cover classes were reclassifiedinto three categories: natural, degraded and trans-formed land-cover (Table 1). Natural land-coverincluded all untransformed vegetation, e.g. forest,woodland, thicket and grassland. The degradedland-cover category was dominated by degradedclasses of land-cover. These areas have a verylow vegetation cover in comparison with thesurrounding natural vegetation cover and weretypically associated with rural population centresand subsistence level farming, where fuel-woodremoval, over-grazing and subsequent soil erosionwere excessive (Thompson, 1996). The transformedcategory consisted of areas where the structure andspecies composition were completely or almostcompletely altered, which includes all areas undercrop cultivation, forestry plantations, urbanizedareas and mines/quarries.
The databases of potential vegetation coverand current land-cover were overlaid in a geo-graphical information system (GIS) to determinethe extent of natural, degraded and transformedarea within each of the 68 vegetation types iden-tified in Low & Rebelo (1996). These valuescould then be used to highlight areas of highcurrent and future vulnerability to biodiversityloss through land use impacts. Levels of trans-formation were compared against the transforma-tion thresholds predicted by a geometric modeldeveloped by Franklin & Forman (1987). This worksuggested that the most critical time for landplanning and conservation is when between 10and 40% of the landscape has been transformedor impacted upon. Specifically, most of the rapidecological changes (e.g. loss of interior species)can be expected when this level increases from 20
Table 1 Land-cover classes reclassified into broad categories
Land-cover categories % area Land-cover class
Natural land-cover 73.4% Wetlands, grassland, shrubland, bushland, thicket, woodland, forest
Degraded land-cover 10.1% Degraded land, erosion scars, water bodiesTransformed land-cover 16.5% Cultivated lands, urban/built-up areas,
mines and quarries, forestry plantations
DDI098.fm Page 83 Tuesday, May 29, 2001 9:37 AM

84
B. Reyers
et al.
© 2001 Blackwell Science Ltd,
Diversity and Distributions
,
7
, 79–95
to 40%. Regions showing greater than 40% lossof natural habitat have already undergone signific-ant ecological disruptions. Furthermore, the NLCdatabase could be used to identify the majorbroad categories of current threat (e.g. cultivation,forestry) facing the vegetation types. An addi-tional GIS layer of protected area coverage forthe country (DEAT, 1996) was also employed todetermine the extent of conservation areas existingwithin the vegetation types.
Patterns of roads
In addition to these land use threats, one of themost widespread forms of alteration of naturalhabitats and landscapes over the last century hasbeen the construction and maintenance of roads(Trombulak & Frissell, 2000). Road networksaffect landscapes and biodiversity in seven gen-eral ways: (1) increased mortality from road con-struction; (2) increased mortality from vehiclecollisions; (3) animal behaviour modification;(4) alteration of the physical environment; (5) altera-tion of the chemical environment; (6) spread ofexotic species and (7) increased alteration anduse of habitats by humans (from Trombulak &Frissell, 2000). These networks cover 0.9% ofBritain and 1.0% of the United States (Forman &Alexandra, 1998); however, the road-effect zone,the area over which significant ecological effectsextend outward from the road, is usually muchwider than the road and roadside. This roadeffect zone can thus provide an additional estim-ate of areas with a high vulnerability to bio-diversity loss through changing land uses andincreased human impacts.
Some evidence on the size of the road-effectzone is available from studies in Europe andNorth America. Reijnen
et al
. (1995) estimatedthat road-effect zones cover between 12 and 20%of the Netherlands, while Forman (2000) illus-trated that 19% of the United States is affectedecologically by roads and associated traffic. Theroad-effect zone for South Africa was determinedusing a similar method to that used by Stoms(2000), in which the spatial extent of road effectscan be used as an ecological indicator that directlyrepresents impacts on biodiversity. For this, theroad-effect zone was used as a measure of thearea potentially affected by roads. The affected dis-tances were estimated from the reviews mentioned
above, as well as from local studies (Milton &MacDonald, 1988). Therefore national routes andfreeways were assumed to affect biodiversity fora greater distance from the roadway (1 km oneach side) than farm roads (100 m, Table 2).
Road segments from the South African Sur-veyor General 1993 1 : 500 000 scale map seriesfiles (SA Surveyor General, 1993) were bufferedusing a standard GIS operation to the distancerelated to its class (Fig. 1d). Although the roads inprotected areas do have an impact on biodiversitywithin these areas, they were excluded from thisanalysis as by and large protected areas overwhel-mingly contribute to biodiversity conservation. Aroad-effect zone was calculated for the remaininguntransformed areas within each vegetation typeby summing the total area within the road effectzone surrounding roads in each vegetation type andconverting to a percentage of the total remaininguntransformed area in that vegetation type.
However, the road-effect zone used here doesnot consider the spatial pattern of roads. There-fore, although roads clearly have a significantimpact on many species, meaningful indicators ofroad-effects on landscapes await the attention oflandscape ecologists and other scientists (Forman,1998). As articulated by Stoms (2000), manyaspects of roads affect biodiversity: road width,traffic volume, traffic speed, vehicle miles travelled,road network structure or its spatial configura-tion, management of the right-of-way, noiselevels, light disturbance and chemical pollution.Most of these factors also vary over daily, weeklyand annual cycles, which may interfere with crit-ical behavioural periods such as breeding or
Table 2 Buffer widths assigned to road classes forcalculating road effect zone (after Stoms, 2000)
South African Surveyor General Description Buffer width (m)
National route 1000Freeway 1000Arterial 500Main 250Secondary (connecting
and magisterial roads)100
Other (rural road) 50Vehicular trail
(4-wheel drive route)25
DDI098.fm Page 84 Tuesday, May 29, 2001 9:37 AM

Conservation of South African vegetation
85
© 2001 Blackwell Science Ltd,
Diversity and Distributions
,
7
, 79–95
migration. As such, the road-effect zone can rep-resent only a first order approximation attemptto capture more of the multidimensional natureof road network effects.
RESULTS AND DISCUSSION
Vulnerability assessment of vegetation types
The majority of vegetation types of SouthAfrica are not largely degraded or transformed(Table 3). Of the 68 vegetation types, 61 contain
more than 50% natural vegetation cover with amedian value of 81.1% natural vegetation coveracross all vegetation types. The vegetation typesshow low levels of degradation with a medianvalue of 2.8%, with all but one (Afro MountainGrassland) being less than 20% degraded (Table 3).Only five of the vegetation types are more than50% transformed by anthropogenic land uses,with a median of 10% being transformed withinvegetation types.
Figure 2 provides a diagrammatic representationof the current levels of transformation, degradation
Table 3
Percentage of natural, degraded, transformed and protected area of each of the vegetation types, aswell as the percentage of each vegetation type exposed to road-effect zones
Code Vegetation type % natural % degraded % transformed % protected % road-effect
1 Coastal forest 89.3 1.2 9.3 (43) 1.3 (9.5) 6.52 Afromontane forest 67.9 2.9 29.2 (44)
16.1
(17.6) 6.43 Sand forest 72.3 15.6 5.8 (45)
46.7
(44.6) 1.74 Dune thicket 62.2 8.5 27.6 (25)
10.6
(14.5) 11.25 Valley thicket 72.1 13.0 14.8 (51) 1.5 (2.1) 6.16 Xeric succulent thicket 95.0 2.0 3.0 (51) 4.6 (8.0) 6.47 Mesic succulent thicket 78.5 7.0 14.5 (51) 4.0 (5.3) 14.28 Spekboom succulent thicket 93.1 4.2 2.6 (unknown) 1.2 (1.8) 4.99 Mopane hrubveld 100.0 0.0 0.0 (0)
100.0
(100.0) 0.010 Mopane bushveld 92.4 0.9 6.6 (8)
34.0
(38.3) 3.011 Soutpansberg arid
mountain bushveld83.8 10.2 6.0 (65)
10.1
(12.6) 4.3
12 Waterberg moist mountain bushveld
90.2 0.8 9.0 (28) 6.2 (8.6) 3.2
13 Lebombo arid mountain bushveld
90.2 0.1 9.1 (unknown)
37.1
(38.0) 1.0
14 Clay thorn bushveld 58.7 7.1 34.1 (60) 1.0 (0.9) 5.115 Subarid thorn bushveld 78.7 12.6 8.7 (unknown) 0.0 (0.2) 8.216 Eastern thorn bushveld 69.7 13.8 16.5 (unknown) 0.2 (0.5) 11.117 Sweet bushveld 78.3 12.0 9.5 (27) 1.8 (2.3) 4.518 Mixed bushveld 69.3 14.1 16.6 (60) 3.6 (3.1) 5.319 Mixed lowveld bushveld 70.4 9.9 19.8 (30)
22.5
(28.3) 3.120 Sweet lowveld bushveld 85.1 1.4 13.5 (30)
62.2
(67.3) 1.121 Sour lowveld bushveld 54.4 9.6 36.0 (76) 7.0 (9.7) 4.722 Subhumid lowveld bushveld 84.1 12.3 3.6 (36)
20.9
(21.5) 1.123 Coastal bushveld–grassland 43.5 15.9 39.8 (unknown)
13.5
(14.0) 5.924 Coast–hinterland bushveld 56.7 8.2 35.0 (87) 2.1 (3.6) 4.425 Natal central bushveld 72.2 9.9 18.0 (80) 1.3 (1.6) 7.226 Natal lowveld bushveld 72.5 11.9 15.6 (35)
14.1
(17.8) 5.327 Thorny Kalahari
dune bushveld83.5 0.0 0.0 (unknown)
99.6
(99.8) 0.0
28 Shrubby Kalahari dune bushveld
96.0 3.1 0.0 (55)
19.4
(19.5) 2.2
29 Karroid Kalahari bushveld 98.8 1.2 0.0 (55) 0.1 (0.1) 3.330 Kalahari plains
thorn bushveld73.6 18.9 7.1 (55) 0.5 (0.5) 3.9
31 Kalahari mountain bushveld 99.5 0.2 0.3 (25) 0.0 (0.0) 4.6
DDI098.fm Page 85 Tuesday, May 29, 2001 9:37 AM

86
B. Reyers
et al.
© 2001 Blackwell Science Ltd,
Diversity and Distributions
,
7
, 79–95
Code Vegetation type % natural % degraded % transformed % protected % road-effect
32 Kimberley thorn bushveld 76.1 4.4 19.5 (55) 1.8 (3.1) 6.833 Kalahari plateau bushveld 92.7 3.0 4.2 (55) 0.0 (0.0) 5.534 Rocky highveld grassland 66.3 0.1 33.6 (65) 0.8 (1.4) 10.235 Moist clay highveld
grassland68.2 0.4 31.4 (79) 0.0 (0.0) 11.3
36 Dry clay highveld grassland
34.9 0.1 65.1 (67) 0.0 (0.0) 9.0
37 Dry sandy highveld grassland
63.5 0.8 35.8 (65) 0.3 (0.3) 9.1
38 Moist sandy highveld grassland
67.6 0.7 31.6 (55) 0.0 (0.7) 9.4
39 Moist cool highveld grassland
60.4 1.6 38.0 (72) 0.7 (0.3) 9.6
40 Moist cold highveld grassland
46.8 11.3 41.8 (70) 0.8 (0.6) 6.7
41 Wet cold highveld grassland
88.0 2.4 9.7 (60) 9.4 (6.7) 4.1
42 Moist upland grassland 61.4 17.0 21.6 (60) 2.3 (2.5) 5.543 North-eastern
mountain grassland67.6 7.1 25.3 (45) 3.3 (7.4) 4.8
44 South-eastern mountain grassland
94.5 4.0 1.5 (32) 0.6 (0.3) 5.7
45 Afro mountain grassland 51.9 36.7 11.4 (32) 0.0 (0.0) 0.846 Alti mountain grassland 87.5 8.8 3.6 (32)
11.7
(12.5) 1.247 Short mistbelt grassland 38.5 4.6 56.9 (89) 0.9 (2.4) 7.648 Coastal grassland 81.7 5.1 12.9 (unknown) 0.1 (1.1) 7.049 Bushmanland Nama Karoo 99.7 0.2 0.1 (unknown) 0.0 (0.0) 3.450 Upper Nama Karoo 99.0 0.9 0.1 (unknown) 0.0 (0.0) 5.851 Orange River Nama Karoo 98.1 0.1 1.6 (unknown) 0.1 (1.5) 4.652 Eastern mixed Nama Karoo 94.9 1.8 3.3 (unknown) 1.6 (1.1) 7.453 Great Nama Karoo 99.1 0.8 0.2 (unknown) 0.7 (0.2) 5.454 Central lower Nama Karoo 90.2 9.0 0.8 (unknown) 0.1 (0.0) 6.055 Strandveld succulent Karoo 86.3 2.0 9.5 (24) 0.4 (0.4) 4.056 Upland succulent Karoo 97.1 0.7 1.7 (unknown) 4.2 (4.4) 4.457 Lowland succulent Karoo 94.2 2.6 3.2 (unknown) 0.9 (1.3) 3.958 Little succulent Karoo 89.0 2.6 8.4 (unknown) 3.2 (2.3) 7.759 North-western mountain
renosterveld94.0 0.0 6.0 (unknown) 0.0 (0.0) 3.0
60 Escarpment mountain renosterveld
98.9 0.3 0.8 (unknown) 0.0 (0.1) 2.4
61 Central mountain renosterveld
80.4 1.8 17.8 (11) 5.1 (3.6) 5.4
62 West coast renosterveld 9.0 1.1 89.8 (97) 0.7 (1.8) 8.163 South and south-west
coast renosterveld39.4 1.9 58.7 (32) 1.5 (1.4) 8.8
64 Mountain fynbos 88.5 0.7 10.8 (11)
26.4
(26.1) 2.965 Grassy fynbos 88.7 0.8 10.3 (3)
15.5
(16.1) 6.066 Laterite fynbos 64.8 1.1 34.1 (50) 0.0 (0.5) 8.667 Limestone fynbos 87.2 7.6 5.2 (40)
13.6
(13.8) 4.068 Sand plain fynbos 34.4 8.5 57.1 (50) 1.2 (1.1) 7.1
Values in brackets indicate estimates from Low & Rebelo (1996). Vegetation types with more than 10% protected area coverage are indicated in bold type.
Table 3
continued.
DDI098.fm Page 86 Tuesday, May 29, 2001 9:37 AM
Conservation of South African vegetation
87
© 2001 Blackwell Science Ltd,
Diversity and Distributions
,
7
, 79–95
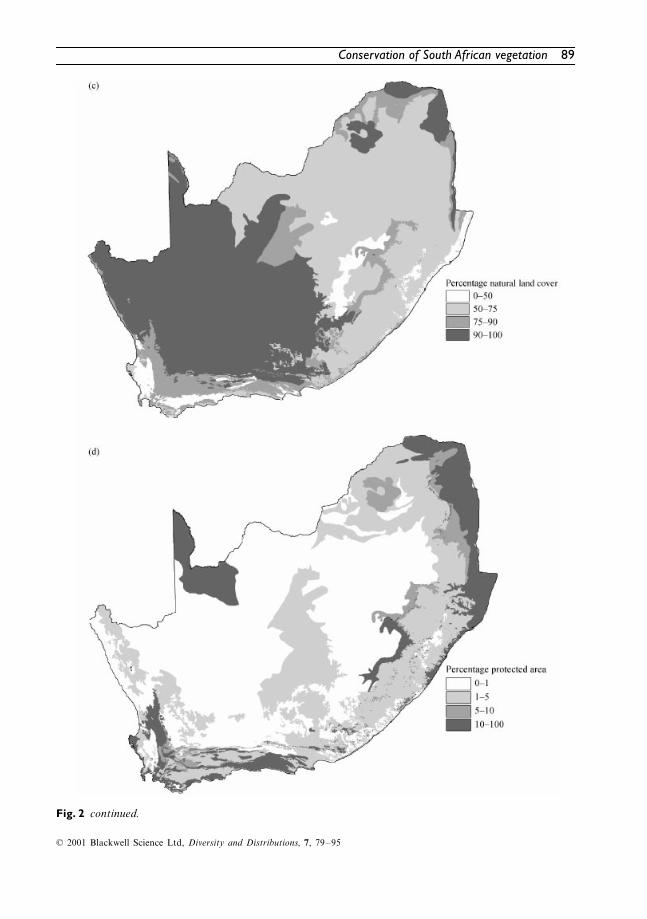
and protection across all vegetation types. Similarto the findings of the coarse-scale species-basedapproach used by Rebelo (1997), the grasslandsand fynbos have experienced the most trans-formation (see Fairbanks
et al
., 2000), with thecoastal indigenous forests having been subjectedto extensive transformation for its size (Fig. 2a,b).Although degradation levels are generally low, afew regions in the grasslands biome as well as afew in the savanna biome show the highest levelsof degradation, ranging from 10 to 36% of thevegetation extent (Fig. 2c).
The average amount of vegetation type cur-rently under protection is 9.6% (median value of1.5%) with only 18 vegetation types conformingto the IUCN’s nominal recommendation of 10%protected area coverage (Table 3). However, thiswell-cited protected area recommendation of 10%is widely criticized as too little to guarantee thepersistence of biodiversity within the region. Soulé& Sanjayan (1998) illustrate that up to 50% ofland area may be required to successfully repres-ent all biodiversity elements. Therefore, perhapseven these 18 supposedly well-protected vegeta-tion types are inadequately protected (Fig. 2d).
The road-effect zone impacts on an average of5.5% (with a median value of 6) of the remainingnatural land-cover in all vegetation types (Table 3).Five vegetation types (mesic succulent thicket,moist clay highveld grassland, dune thicket,eastern thorn bushveld, rocky highveld grass-land) contain between 10 and 14.2% road-effectzones (Table 3). The rest of the vegetation typeslie under this 10% level, with the MopaneShrubveld containing no road-effect due to thefact that it all falls entirely within the boundariesof the Kruger National Park (Table 3).
In Table 4 the areas within each vegetationtype that are transformed, degraded or exposedto road-effects are summed to provide an indica-tion of vegetation that has been disturbed oraffected by these human land uses. Types withlarge areas affected face a high risk of biodiver-sity loss due to a combination of extensivelydegraded and transformed areas with a largeroad network. The west coast renosterveld, sandplain fynbos, dry clay highveld grassland, southand south-west renosterveld, short mistbeltgrassland, coastal bushveld-grassland, moist coldhighveld grassland, sour lowveld bushveld, afromountain grassland, coast–hinterland bushveld,
moist cool highveld grassland, clay thorn bush-veld, dune thicket, moist upland grassland, drysandy highveld grassland, rocky highveld grass-land and laterite fynbos are all areas of concerndue to the fact that over 40% of their extent isimpacted upon by land use threats. This level ofland use impact corresponds with the thresholddetermined by Franklin & Forman (1987), indic-ating extreme ecological disruption within thesevegetation types.
All these vegetation types are also poorly pro-tected (Table 3), with the coastal bushveld–grassland and dune thicket being the only typesto reach the IUCN’s recommended 10% protectedarea coverage. However, as stated previously thislevel of protection is inadequate, especially in thecase of these two vegetation types where it wouldnot be sufficient to stem the biodiversity lossassociated with such high levels of land usechange. Of the 68 vegetation types 38 (56%) fallwithin the 10–40% category of land use impactdetermined by Franklin & Forman (1987) andare thus at a critical time for land use planningand conservation.
Table 5 provides a list of the land-cover typeswithin each of the top 10 priority conservationvegetation types drawn from Table 4. The Afromountain grassland and moist cold highveldgrassland contain large areas of degraded vegeta-tion. These same vegetation types, along withthe west coast renosterveld, sand plain fynbos,dry clay highveld grassland, south and south-west coast renosterveld, short mistbelt grassland,coastal bushveld–grassland, sour lowveld bushveldand coast–hinterland bushveld, contain extensiveareas of commercial, semicommercial and sub-sistence dryland cultivation (Table 5). The shortmistbelt grassland, coastal bushveld–grassland,sour lowveld bushveld and coast–hinterlandbushveld contain large areas of exotic forestryplantations and, with the exception of the sourlowveld bushveld, commercial sugarcane cultivation(Table 5). Of all these priority vegetation typesonly the coastal bushveld–grassland has morethan 10% protected area coverage at 13.5%, buthigh levels of degradation as well as high levelsof transformation still make it an area of concernalong its entire latitudinal distribution. The restof these top 10 priority vegetation types all fallbelow 5% protected area coverage (Table 3). Thisland use analysis is an example of a potential
DDI098.fm Page 87 Tuesday, May 29, 2001 9:37 AM

88
B. Reyers
et al.
© 2001 Blackwell Science Ltd,
Diversity and Distributions
,
7
, 79–95
Fig. 2 Diagrammatic representation of levels of percentage (a) transformed (b) degraded (c) natural and (d)protected vegetation cover within each of Low & Rebelo’s (1996) vegetation types.
DDI098.fm Page 88 Tuesday, May 29, 2001 9:37 AM
Conservation of South African vegetation
89
© 2001 Blackwell Science Ltd,
Diversity and Distributions
,
7
, 79–95
Fig. 2 continued.
DDI098.fm Page 89 Tuesday, May 29, 2001 9:37 AM

90
B. Reyers
et al.
© 2001 Blackwell Science Ltd,
Diversity and Distributions
,
7
, 79–95
Table 4
Percentage area of vegetation type exposed to the combined land-cover threatsof degradation, transformation and road effects
Code Vegetation type Affected area (%)
62 West coast renosterveld 92.368 Sand plain fynbos 69.536 Dry clay highveld grassland 67.863 South and south-west coast renosterveld 65.447 Short mistbelt grassland 64.823 Coastal bushveld–grassland 60.340 Moist cold highveld grassland 56.721 Sour lowveld bushveld 49.145 Afro mountain grassland 48.624 Coast–hinterland bushveld 47.039 Moist cool highveld grassland 45.814 Clay thorn bushveld 45.1
4 Dune thicket 43.942 Moist upland grassland 42.537 Dry sandy highveld grassland 42.334 Rocky highveld grassland 42.266 Laterite fynbos 40.835 Moist clay highveld grassland 39.638 Moist sandy highveld grassland 39.316 Eastern thorn bushveld 38.2
2 Afromontane forest 37.943 North-eastern mountain grassland 36.218 Mixed bushveld 34.8
7 Mesic succulent thicket 34.025 Natal central bushveld 33.3
5 Valley thicket 32.919 Mixed lowveld bushveld 32.026 Natal lowveld bushveld 31.632 Kimberley thorn bushveld 29.430 Kalahari plains thorn bushveld 29.015 Subarid thorn bushveld 28.061 Central mountain renosterveld 25.917 Sweet bushveld 25.248 Coastal grassland 23.8
3 Sand forest 22.811 Soutpansberg arid mountain bushveld 20.058 Little succulent Karoo 18.765 Grassy fynbos 17.967 Limestone fynbos 17.222 Subhumid lowveld bushveld 16.9
1 Coastal forest 16.841 Wet cold highveld grassland 16.220 Sweet lowveld bushveld 16.054 Central lower Nama Karoo 15.255 Strandveld succulent Karoo 15.164 Mountain fynbos 14.846 Alti mountain grassland 13.512 Waterberg moist mountain bushveld 12.933 Kalahari plateau bushveld 12.452 Eastern mixed Nama Karoo 12.3
DDI098.fm Page 90 Tuesday, May 29, 2001 9:37 AM

Conservation of South African vegetation
91
© 2001 Blackwell Science Ltd,
Diversity and Distributions
,
7
, 79–95
management tool for vulnerable areas, and is notlimited to these top 10 vegetation types. Othervegetation types, although not as affected asthese 10, are none the less also impacted upon byland use changes and should therefore also beconsidered and monitored in a conservation plan.Table 5 is an example of what can be done andsimilar analyses can be performed on all vegetationtypes in order to investigate the land use impactsand management parameters within each area.
The vegetation types listed at the bottom ofTable 4 are less impacted upon by land uses, andare generally better protected (Table 3), with theMopane shrubveld and thorny Kalahari dunebushveld including 100 and 99.6% protectedarea, respectively. These areas also contain ex-tensive tracts of natural vegetation ranging from83.5% for the thorny Kalahari dune bushveld to100% for the Mopane shrubveld (Table 3). This,however, does not preclude them from furtheranalysis and the tools developed in this studyhave a potential role to play in the monitoringand future management of these currently lessimpacted areas.
Comparison of vulnerability status
Low & Rebelo (1996) also provided an estimateof threat status of the vegetation types. This
included a measure of land transformed by agri-culture and other uses, based on ‘scant informa-tion for some of the Acocks Veld Types andshould be cautiously interpreted as a rough indexof habitat loss’ (Low & Rebelo, 1996). They alsoinclude an estimate of the proportion of eachvegetation type falling within conserved areas,based on an approximation of conservation areaboundaries which still require confirmation (Low& Rebelo, 1996). Following a similar methodo-logy to Thompson
et al
. (2001), we evaluatethese estimates from Low & Rebelo (1996) aswell as the calculations of protected and trans-formed land obtained from this study using theNational Land-cover database and the Depart-ment Environmental Affairs and Tourism (DEAT,1996) protected area database (Table 3). Top con-servation priority vegetation types identifiedbased on Low & Rebelo’s (1996) estimates oftransformed area in Table 3 highlight the westcoast renosterveld, short mistbelt grassland, coast–hinterland bushveld, Natal central bushveldand the moist clay highveld grassland as areasof conservation concern due to large areas trans-formed. The Mopane shrubveld, grassy fynbos,Mopane bushveld, central mountain renoster-veld and mountain fynbos are estimated to beareas of low priority for conservation as they arelittle transformed according to Low & Rebelo’s
Code Vegetation type Affected area (%)
8 Spekboom succulent thicket 11.86 Xeric succulent thicket 11.3
44 South-eastern mountain grassland 11.113 Lebombo arid mountain bushveld 10.310 Mopane bushveld 10.357 Lowland succulent Karoo 9.559 North-western mountain renosterveld 9.156 Upland succulent Karoo 6.850 Upper Nama Karoo 6.753 Great Nama Karoo 6.351 Orange River Nama Karoo 6.328 Shrubby Kalahari dune bushveld 5.231 Kalahari mountain bushveld 5.129 Karroid Kalahari bushveld 4.549 Bushmanland Nama Karoo 3.660 Escarpment mountain renosterveld 3.527 Thorny Kalahari dune bushveld 0.0
9 Mopane shrubveld 0.0
Table 4 continued.
DDI098.fm Page 91 Tuesday, May 29, 2001 9:37 AM

92
B. Reyers
et al.
© 2001 B
lackwell Science L
td,
Diversity and D
istributions
,
7
, 79–
95
Table 5
Description and percentage area coverage of land-cover threats facing conservation priority vegetation types
DescriptionWest coast renosterveld
Sand plain fynbos
Dry clay highveld grassland
South and south-west coast renosterveld
Short mistbelt grassland
Coastal bushveld–grassland
Moist cold highveld grassland
Sour lowveld bushveld
Afro mountain grassland
Coast–hinterland bushveld
Natural land-cover 9.01 34.64 34.89 39.87 39.32 43.56 46.85 54.44 51.92 56.87Water bodies 0.24 0.14 0.05 0.83 0.24 4.69 0.21 0.11 0.01 0.12Dongas and sheet erosion scars 0.00 0.05 0.00 0.00 0.00 0.00 0.09 0.00 0.00 0.00Degraded: forest and woodland 0.00 0.00 0.00 0.00 0.00 0.87 0.00 5.88 0.00 0.42Degraded: thicket and bushland (etc.) 0.11 0.63 0.00 0.00 0.61 7.50 0.02 3.12
36.65
4.77Degraded: unimproved grassland 0.00 0.00 0.00 0.00 3.73 2.82
11.02
0.49 0.00 2.93Degraded: shrubland and low fynbos 0.76 7.66 0.00 1.05 0.00 0.00 0.00 0.00 0.00 0.00 Cultivated: permanent–commercial
irrigated
11.70
5.20 0.00 1.77 0.03 0.00 0.00 1.55 0.00 0.01
Cultivated: permanent–commercial dryland
0.05 0.00 0.00 0.00 0.39 0.01 1.78 0.00 0.00 0.32
Cultivated: permanent–commercial sugarcane
0.00 0.00 0.00 0.00
10.79 15.39
0.00 0.34 0.00
8.91
Cultivated: temporary–commercial irrigated
0.15 2.78 0.02 2.17 1.67 0.02 0.05 2.55 0.00 0.23
Cultivated: temporary–commercial dryland
74.78 39.53 64.65 53.07
4.74 0.00
19.58
1.30 0.00 0.49
Cultivated: temporary–semicommercial/subsistence dryland
0.00 0.00 0.00 0.00 7.02
10.18 21.27 11.80 11.40 13.75
Forest plantations 0.60 4.88 0.00 0.31
30.86 9.31
0.06
15.29
0.00
9.11
Urban/built-up land: residential 1.59 7.11 0.36 0.78 0.83 3.10 0.79 1.30 0.01 1.98Urban/built-up land: residential
(small holdings: woodland)0.00 0.00 0.00 0.00 0.00 0.00 0.00 0.00 0.00 0.00
Urban/built-up land: residential (small holdings: bushland)
0.00 0.00 0.00 0.00 0.14 0.90 0.00 0.00 0.00 0.04
Urban/built-up land: residential (small holdings: shrubland)
0.45 1.03 0.00 0.02 0.00 0.00 0.00 0.00 0.00 0.00
Urban/built-up land: residential (small holdings: grassland)
0.00 0.00 0.00 0.00 0.00 0.00 0.04 0.00 0.00 0.15
Urban/built-up land: commercial 0.06 0.20 0.00 0.00 0.02 0.13 0.00 0.02 0.00 0.06Urban/built-up land:
industrial/transport0.03 0.56 0.02 0.07 0.00 0.33 0.01 0.01 0.00 0.15
Mines and quarries 0.07 0.00 0.01 0.00 0.00 0.06 0.00 0.03 0.01 0.02
Bold values indicate main land uses in the vegetation type.
DD
I098.fm P
age 92 Tuesday, M
ay 29, 2001 9:37 AM

Conservation of South African vegetation 93
© 2001 Blackwell Science Ltd, Diversity and Distributions, 7, 79–95
(1996) estimates (Table 3). Once again the areasof high threat are estimated by Low & Rebelo(1996) to be poorly protected with less than 4%of their surface area protected and those thatare low priorities are seen to be generally wellprotected.
As found in Thompson et al. (2001), there issome degree of similarity in the rank orders ofvegetation types according to threat status foundin this study (i.e. affected area) and in Low &Rebelo’s (1996) (i.e. areas estimated to be trans-formed) (rs = 0.55; P < 0.001). However, as Table 3illustrates, there are differences between theseestimates of transformation and protection fromLow & Rebelo (1996) and values generated inthis study. The Low & Rebelo (1996) estimatesfor land transformation and protection beingconsistently and significantly higher (paired t-testfor levels of transformation, t = 9.00, degrees offreedom = 49, P < 0.0001; paired t-test for levelsof protection, t = 3.8, degrees of freedom = 67,P < 0.01). This could however, be explained bythe fact that the estimates of transformation inLow & Rebelo (1996) included grazed areas,while the NLC transformation category does not(Thompson et al., 2001). The grazed areas(especially overgrazed area) are included in thedegraded category of the NLC database and assuch are included in the present study in themeasure of affected areas (Table 4).
CONCLUSION
South Africa, with its large biodiversity con-servation responsibility, faces the additionalproblems of limited resources for conservationas well as pressing land reform initiatives. Theland tenure system is a problem for conservationthroughout Africa and is now becoming anincreasingly demanding problem in South Africa.The almost total transfer of land in most regionsof South Africa, from government to privateownership, is possibly unique in the annals ofEuropean colonization. The state by the mid1930s had lost control over resources which incountries such as Australia or the United Stateswere retained by the authorities because of theirunsuitability for agriculture (Christopher, 1982).In effect the absence of state interest in landthrough a leasehold system has led to a strongdemand for land and an attempt to make a living
in areas highly unsuitable for the purposes offarming. Demand for land has further drivenland prices to levels far in excess of its value asan agricultural commodity.
Therefore the limited resources of availablegovernment land and funding need to be effici-ently applied in order to ensure effective con-servation as well as development opportunities.This investigation provides an important firstapproximation towards identifying areas wherethese limited resources should be concentrated byidentifying vegetation types with high levels ofcurrent and potential anthropogenic land use andinadequate conservation efforts in order to con-strain future spreading of transformation. AsRebelo (1997) points out, few vegetation units arespatially uniform in terms of species compositionand ecosystem processes, thus further studywithin these priority areas is required to identifyrepresentative conservation sites within thesetypes. Although Low & Rebelo (1996) providedrough estimates of areas considered to be facinghigh threats, the value of timely land-cover infor-mation on the decision making ability for plan-ning is evident from the present study. Theadvent of the National Land-cover database hasprovided a much-needed standardized dataset ofcurrent land-cover to significantly improve SouthAfrican land use and conservation planning.
Further issues relevant to the identification ofpriority conservation areas are the scale of con-servation priority setting, and the effects of globalclimate change on southern African vegetation.Rebelo (1997) points out that generally vegetationtypes shared with other neighbouring nationsare more adequately conserved than vegetationendemic to South Africa. Thus a classification ofvegetation types across political boundaries, aswell as international co-operation, are urgentrequirements for future priority setting. In addi-tion to this, future conservation strategies willhave to consider the effects of climate change onbiodiversity (Rutherford et al., 2000). Not muchis known on what these climate changes or theirbiological impacts will be, but recent work hashighlighted a general eastward shift in SouthAfrican species distributions as areas in SouthAfrica dry out and warm up (Rutherford et al.,2000; van Jaarsveld & Chown, 2000; van Jaars-veld et al., 2000). It has also been shown thatpremier flagship conservation areas in South Africa
DDI098.fm Page 93 Tuesday, May 29, 2001 9:37 AM
94 B. Reyers et al.
© 2001 Blackwell Science Ltd, Diversity and Distributions, 7, 79–95
are not likely to meet their conservation goalsdue to an inability to track climate induced species(especially vulnerable species) range shifts (vanJaarsveld et al., 2000). This is of obvious import-ance in any conservation-planning scenario.
In many respects ‘lines conquer’, and the SouthAfrican landscape is a testament to their power.Compasses and plumblines, more than a force ofarms, subdue landscapes and henceforth demar-cate control and change. If current developmentpolicies (i.e. Spatial Development Initiatives, un-structured land reform) continue without properequity towards conserving the most threatenedvegetation communities, in a few decades not onlywill the remaining ‘natural’ areas be gone, butthe people will be even poorer for it.
ACKNOWLEDGMENTS
We thank the Mellon Foundation, University ofPretoria, the National Research Foundation andthe South African Biodiversity Monitoring andAssessment Programme for financial assistance,as well as ESRI and GIMS® for GIS softwareand support. We thank Bob Pressey and ananonymous referee for their helpful commentson the MS.
REFERENCES
Acocks, P.H. (1988) Veld types of South Africa, 3rdedn. Memoirs of the Botanical Survey of SouthAfrica 57, 1–146.
Bedward, M., Pressey, R.L. & Keith, D.A. (1992) Anew approach for selecting fully representativereserve networks: addressing efficiency, reservedesign and land suitability with an iterative ana-lysis. Biological Conservation 62, 115–125.
Central Statistical Survey (1998) The People ofSouth Africa Population Census, 1996. Report no.1: 03–01–11. Central Statistical Survey, Pretoria.
Christopher, A.J. (1982) South Africa. LongmanPress, London.
Conservation International (1998) ConservationInternational lists the countries of megadiversityin the world. Http://www.conservation.org
Department of Environmental Affairs and Tourism(DEAT) (1996) National protected areas database.Department of Environmental Affairs and Tourism,Pretoria.
Fairbanks, D.H.K. & Benn, G.A. (2000) Identifyingregional landscapes for conservation planning: acase study from KwaZulu-Natal, South Africa.Landscape and Urban Planning 50, 1–19.
Fairbanks, D.H.K. & Thompson, M.W. (1996)Assessing land-cover map accuracy for the SouthAfrican land-cover database. South African Jour-nal of Science 92, 465–470.
Fairbanks, D.H.K., Thompson, M.W.M., Vink, D.E.,Newby, T.S., van den Berg, H.M. & Everard, D.A.(2000) The South African land-cover characteris-tics database: a synopsis of the landscape. SouthAfrican Journal of Science 96, 69–82.
Forman, R.T.T. (1998) Road ecology: a solution forthe giant embracing us. Landscape Ecology 13,iii–v.
Forman, R.T.T. (2000) Estimate of the area affectedecologically by the road system in the UnitedStates. Conservation Biology 14, 31–35.
Forman, R.T.T. & Alexandra, L.E. (1998) Roadsand their major ecological effects. Annual Reviewsof Ecology and Systematics 29, 207–231.
Franklin, J.F. & Forman, R.T.T. (1987) Creatinglandscape patterns by forest cutting: ecologicalconsequences and principles. Landscape Ecology1, 5–18.
Freitag, S., Nicholls, A.O. & van Jaarsveld, A.S.(1996) Nature reserve selection in the Transvaal,South Africa: what data should we be using? Bio-diversity and Conservation 5, 685–698.
Hoffmann, M.T. (1997) Human impacts on vegetation.Vegetation of Southern Africa (ed. by R.M. Cowling,D.M. Richardson and S.M. Pierce), pp. 507–534.Cambridge University Press, Cambridge.
Lambeck, R.J. (1997) Focal species a muti-speciesumbrella for nature conservation. Conservation Biology11, 849–856.
Low, A.B. & Rebelo, A.G. (1996) Vegetation mapof South Africa, Lesotho and Swaziland. Depart-ment of Environmental Affairs, Pretoria, SouthAfrica.
Maddock, A. & Du Plessis, M.A. (1999) Can speciesdata only be appropriately used to conservebiodiversity? Biodiversity and Conservation 8, 603–615.
Margules, C.R. & Pressey, R.L. (2000) Systematicconservation planning [Review]. Nature 405, 243–253.
McDonald, D.J. (1997) VEGMAP: a collaborativeproject for a new vegetation map of southern Africa.South African Journal of Science 93, 424–426.
McNeely, J.A. (1994) Protected areas for the 21stcentury: working to provide benefits to society.Biodiversity and Conservation 3, 390–405.
Milton, S.J. & MacDonald, I.A.W. (1988) Treedeaths near tar roads in the Northern Transvaal.South African Journal of Science 84, 164–165.
Myers, N., Mittermeier, R.A., Mittermeier, C.G., deFonesca, G.A.B. & Kent, J. (2000) Biodiversityhotspots for conservation priorities. Nature 403,853–858.
Noss, R.F. (1983) A regional landscape approach tomaintaining diversity. Bioscience 33, 700–706.
DDI098.fm Page 94 Tuesday, May 29, 2001 9:37 AM

Conservation of South African vegetation 95
© 2001 Blackwell Science Ltd, Diversity and Distributions, 7, 79–95
Noss, R.F. (1987) From plant communities to land-scapes in conservation inventories: a look at TheNature Conservancy (USA). Biological Conserva-tion 84, 223–234.
Noss, R.F. (1990) Indicators for monitoring biodiver-sity: a hierarchial approach. Conservation Biology4, 355–364.
Panzer, R. & Schwartz, M.W. (1998) Effectivenessof a vegetation-based approach to insect conserva-tion. Conservation Biology 12, 693–702.
Pressey, R.L. (1994) Land classifications are neces-sary for conservation planning but what do theytell us about fauna. Future of the Fauna of West-ern New South Wales (ed. by D. Lunney, S. Hand,P. Reed and D. Butcher), pp. 31–41. The RoyalZoological Society of New South Wales, Mosman,Australia.
Pressey, R.L., Humphries, C.J., Margules, C.R.,Vane-Wright, R.I. & Williams, P.H. (1993) Bey-ond opportunism: key principles for systematicreserve selection. Trends in Ecology and Evolution8, 124–128.
Pressey, R.L. & Logan, V.S. (1994) Level of geo-graphic subdivision and its effects on assessmentsof reserve coverage: a review of regional studies.Conservation Biology 8, 1037–1046.
Pringle, J. (1982) The conservationists and the killers.T.V. Bulpin and Books of Africa, Cape Town.
Rebelo, A.G. (1997) Conservation. Vegetation ofSouthern Africa (ed. by R.M. Cowling, D.M.Richardson and S.M. Pierce), pp. 571–590. Cam-bridge University Press, Cambridge.
Reijen, R., Foppen, R., Ter Braak, C. & Thissen, J.(1995) The effects of car traffic on breeding birdpopulations in woodland. III. Reduction of den-sity in relation to the proximity of main roads.Journal of Applied Ecology 32, 187–202.
Reyers, B., van Jaarsveld, A.S. & Kruger, M. (2000)Complementarity as a biodiversity indicator strat-egy. Proceedings of the Royal Society of London:B 267, 505–513.
Rutherford, M.C., Powrie, L.W. & Schulze, R.E.(2000) Climate change in conservation areas ofSouth Africa and its potential impact on floristiccomposition: a first assessment. Diversity and Dis-tributions 5, 253–262.
Siegfried, W.R., Benn, G.A. & Gelderblom, C.M.(1998) Regional assessment and conservationimplications of landscape characteristics of Africannational parks. Biological Conservation 84, 131–140.
Soulé, M.E. & Sanjayan, M.A. (1998) Conservationtargets: do they help? Science 279, 2060–2061.
South African Surveyor General (1993) 1 : 500 000scale road network. Department of Land Affairs,Cape Town, South Africa.
Stoms, D.M. (2000) GAP management status andregional indicators of threats to biodiversity.Landscape Ecology 15, 21–33.
Thompson, M. (1996) The standard land-cover clas-sification scheme for remote-sensing application inSouth Africa. South African Journal of Science 92,34–42.
Thompson, M., Vink, E.R., Fairbanks, D.H.K.,Balance, A. & Shackelton, C.M. (2001) Com-parison of extent and transformation of SouthAfrica’s woodland biome from two national data-bases. South African Journal of Science, in press.
Trombulak, S.C. & Frissell, C.A. (2000) Review ofecological effects of roads on terrestrial andaquatic communities. Conservation Biology 14,18–30.
Van Jaarsveld, A.S. (2000) Biodiversity: conservingthe building blocks of environmental health. Thesustainability challenge for Southern Africa (ed. byJ. Whitman), pp. 265–290. Macmillan Press Ltd,London.
Van Jaarsveld, A.S. & Chown, S.L. (2000) Climatechange and its impacts in South Africa. Trends inEcology and Evolution 16, 13–14.
Van Jaarsveld, A.S., Chown, S.L., Erasmus, B.F.N.,Kshatriya, M. & Wessels, K.J. (2000) Vulnerab-ility and adaptation assessment of South Africananimal taxa to climate change. Report to theDepartment of Environmental Affairs and Tour-ism, Pretoria, South Africa.
Van Jaarsveld, A.S., Freitag, S., Chown, S.L.,Muller, C., Koch, S., Hull, H., Bellamy, C.,Krüger, M., Endrödy-Younga, S., Mansell, M.W.& Scholtz, C.H. (1998) Biodiversity assessmentsand conservation strategies. Science 279, 2106–2108.
Wessels, K.J., Freitag, S. & van Jaarsveld, A.S.(1999) The use of land facets as biodiversity sur-rogates during reserve selection at a local scale.Biological Conservation 89, 21–38.
WCMC (1992) Development of a National Bio-diversity Index: a discussion paper prepared byWorld Conservation Monitoring Centre. Reporton the WCMC, 15 September, 1992.
Williams, P.H. (1998) Key sites for conservation:area selection methods for biodiversity. Conserva-tion in a changing world: integrating processes intopriorities for action (ed. by G.M. Mace, A. Balm-ford and J.R. Ginsberg), pp. 211–249. CambridgeUniversity Press, Cambridge.
Williams, P.H. & Humphries, C.J. (1996) Comparingcharacter diversity among biotas. Biodiversity: a bio-logy of numbers and difference (ed. by K.J. Gaston),pp. 54–76. Blackwell Science, Oxford.
WRI (1994) World resources 1994–95. Oxford Uni-versity Press, Oxford, UK.
DDI098.fm Page 95 Tuesday, May 29, 2001 9:37 AM