private equity in the global economy: evidence on industry
TRANSCRIPT
Private Equity in the Global Economy:
Evidence on Industry Spillovers
Serdar Aldatmaz
A dissertation submitted to the faculty of the University of North Carolina at Chapel Hill in
partial fulfillment of the requirements for the degree of Doctor of Philosophy in Business
Administration (Finance) in the Department of Finance of the Kenan-Flagler Business
School.
Chapel Hill
2013
Approved by:
Gregory W. Brown
Paolo Fulghieri
Christian T. Lundblad
Paige Ouimet
David T. Robinson

ii
© 2013
Serdar Aldatmaz
ALL RIGHTS RESERVED

iii
Abstract
SERDAR ALDATMAZ: Private Equity in the Global Economy: Evidence on Industry
Spillovers.
(Under the Direction of Greg W. Brown)
Using a novel dataset on global private equity investments in 19 industries across 48
countries, I find that following private equity investments employment, profitability, and
labor productivity increase for publicly listed companies in the same country and industry.
This suggests that positive externalities created by private equity firms are absorbed by other
companies within the same industry. These effects are more pronounced in country-industries
with higher levels of competition, where it is more likely that the competitive pressure from
private equity-backed targets forces industry peers to improve. Furthermore, the results are
concentrated in countries with moderate levels of innovative capacities, which are shown to
be the best absorbers of productivity spillovers in studies on spillovers from foreign direct
investments. I further find that capital expenditures of public firms also grow faster
subsequent to private equity investments. On the financial side, I provide evidence that
industry stock market returns increase after the industry receives venture capital, while
buyout investments lead to higher debt levels within the industry.

iv
To my wonderful wife-to-be, Merve, without whose love, support, and patience I could not
have done this…

v
Acknowledgements
I am greatly indebted for the guidance and support of my advisor Greg Brown. I am
also grateful to Chris Lundblad, Paige Ouimet, David Robinson, and Paolo Fulghieri for their
advice and support. I thank Anil Shivdasani, Morten Sorensen, Tim Jenkinson, Robert
Harris, Yiorgos Allayannis, Merih Sevilir, Inessa Love, Geoffrey Tate, Nick Gantchev, Pab
Jotikasthira, and Diego Garcia for useful comments and discussions. I also thank the
conference participants at the Global Private Investing Conference. Finally, I would like to
thank UNC's Institute for Private Capital, the UAI Foundation, and the Private Equity
Research Consortium for their support of this project, as well as The Burgiss Group for their
help with the private equity data used in this study.

vi
Table of Contents
List of Tables .................................................................................................... vii
List of Figures .................................................................................................. viii
1. Introduction .................................................................................................... 1
2. Background .................................................................................................... 9
3. Data and Methodology ................................................................................ 15
3.1 Data ........................................................................................................ 15
3.2 Empirical Strategy ................................................................................. 21
4. Results .......................................................................................................... 25
4.1 Private Equity and the Real Economy ................................................... 25
4.2 Spillovers across Countries and Industries ............................................ 36
4.3 Private Equity and the Financial Economy ........................................... 41
4.4 Robustness Checks ................................................................................ 45
5. Conclusion ................................................................................................... 49
Bibliography ...................................................................................................... 73

vii
List of Tables
Table 1. Private Equity Investments around the Globe ................................................53
Table 2. Private Equity Investments across Industries .................................................59
Table 3. Descriptive Statistics .......................................................................................60
Table 4. Univariate Comparisons ..................................................................................61
Table 5. Private Equity and the Real Economy ............................................................63
Table 6. Buyout versus Venture Capital .......................................................................64
Table 7. Private Equity and Investment ........................................................................65
Table 8. Industry Spillovers from Private Equity and Legal Strength ..........................66
Table 9. Industry Spillovers from Private Equity and Innovative Capacity .................67
Table 10. Industry Spillovers from Private Equity and Competitiveness .......................68
Table 11. Private Equity and the Financial Economy .....................................................69
Table 12. Data Sources and Variable Definitions ...........................................................70

viii
List of Figures
Figure 1. Global Private Equity Capital Invested ...........................................................72
Figure 2. U.S. and U.K.’s Share of Global Private Equity Capital ................................73
Figure 3. Private Equity and Foreign Direct Investment Inflows ..................................74

1. Introduction
Most of the existing studies on private equity find evidence for increased firm performance
following the transactions (Cumming et al. 2007, Kaplan and Stromberg 2009). Given all of
the research and publicity about private equity investments, it is surprising that little evidence
is available to determine whether they have on net a positive or negative impact on the
industries they invest in. Building on the idea of knowledge spillovers introduced by
Marshall (1890), a large literature in economics has examined how technological
advancements and productivity gains at some companies in an industry spill over onto the
other companies within the same industry.1 Similarly, the impact of private equity capital
may not be limited to the companies receiving investment; it might create positive and
negative externalities that have implications for the industry as a whole. Hence, how overall
industry dynamics change following private equity investments is an important question that
needs to be answered to properly frame the broader debate concerning private equity's role
for the economy.
Using a novel dataset on actual private equity investments between 1990 and 2011, this
paper explores the dynamic relationship between private equity capital and broad industry
growth. Focusing on how aggregate industry measures of publicly listed companies change
following a private equity capital investment into an industry, I am able to measure the
1 In a review of studies related to spillovers from multinational corporations onto local companies, Blomstrom
and Kokko (1998) conclude that technology and productivity spillovers take place within an industry as companies compete and directly interact with each other or knowledge is transferred through employees. Caves (1971), Blomstrom and Persson (1983), Bolmstrom (1986), Blomstrom and Wolff (1994), Kokko (1994), Kokko (1996), and Javorcik (2004) are examples of studies providing evidence for the existence of productivity spillovers from foreign multi nationals into domestic companies.

2
spillovers from target companies that receive actual private equity capital to the publicly
listed companies within the same industry.
Jensen (1989) argues that private equity is the superior business model when compared to
public equity as it provides a better alignment of incentives between owners and managers as
well as a more efficient management of resources. Following Jensen, many papers that study
the impact of private equity transactions on the target companies provide evidence for the
positive impacts on firm-level performance. However, the popular press, labor unions, and
policy makers remain concerned about the private equity industry's business model in terms
of its impact on the real economy.2 As such, how private equity investments affect industry
performance is a question that is of great importance not only to academic researchers but
also to practitioners and policy makers. On one hand, with the entrance of private equity
investments into an industry, firms not receiving investments could be forced to improve
efficiency by utilizing the new technologies and practices to compete with the more efficient
private equity-backed firms.3 Thus, there are potential industry-wide externalities from the
competitive pressure introduced by private equity. If companies are capable of absorbing the
spillovers from private-equity backed firms, the industry overall might experience
performance gains. On the other hand, if the companies that do not receive private equity
investment cannot keep up with the new technologies and the competitive pressure, the
2 Reports by the Financial Services Authority (2006) and the Service Employees International Union (2007)
discuss concerns about private equity and its implications for the economy. 3 Local companies either imitate the new technologies and practices introduced by private equity firms at their
portfolio companies, or are forced to come up with more efficient methods themselves to respond to the increased level of competition within the industry.

3
efficiency gains at the investment-receiving companies might drive demand away from their
competitors.4 Hence, the pressure might negatively affect the rest of the industry.
5
As a motivating example, consider the buyout of the Hertz Corporation. The company
was bought out by a group of private equity firms in 2005 and its performance significantly
improved following the transaction. After the buyout of Hertz, the two main competitors in
the same industry, Avis Budget and Dollar Thrifty, also implemented new strategies to
increase efficiency, which most likely were triggered by the competitive pressure from the
more efficient private equity-backed Hertz. Indeed, over the two years following the buyout
of Hertz, profitability and productivity both increased for Avis Budget and Dollar Thrifty.6
Similarly, using a large sample of global private equity investments, I study if there are
productivity spillovers from private equity investments onto the public companies within the
same country and industry. I indeed find that private equity capital invested in an industry
leads to higher employment growth, profitability growth, and labor productivity growth
within the public firms in the same domestic industry: on average, a one standard deviation
increase in the amount of private equity capital invested (adjusted by industry sales) leads to
a 0.8% increase in employment growth, 1.3% increase in labor productivity growth, and
2.6% increase in profitability growth.
Given the different structures of buyout and venture capital transactions, I also compare
how the impact of private equity on the performance of public firms is different after buyout
4 Aitken and Harrison (1999), for example, find that the entrance of more efficient foreign companies
negatively impacts the performance of local firms because they attract customers away from domestic firms. Djankov and Hoekman (2000), Feinberg and Majumdar (2001), and Kathuria (2002) are other examples of studies providing evidence for negative impacts of spillovers from foreign direct investments. 5 Even if the competitive pressure drives the most inefficient companies out of the market, that might still be
beneficiary for the economy as a whole in the long-run where private equity-backed firms act as catalysts of a constructive destruction process. 6 See Section 2.2 for a more detailed discussion of the buyout of Hertz Corporation.
4
versus venture capital investments. My findings indicate that buyout investments lead to
spillovers through financial engineering creating higher leverage and stronger governance,
while venture capital investments create positive industry-wide externalities through the
introduction of new technologies and innovation.
While it is generally a challenge in private equity studies to pin down which way the
direction of causality goes due to the potential endogeneity of private equity investments, the
implementation of the panel VAR to some extent mitigates the problem of reverse causality.7
I find no evidence that past values of employment growth, profitability growth, or labor
productivity growth are associated with the amount of private equity capital invested in an
industry. Thus, I am able to identify a causal link from private equity to the real economy to
the extent that private equity investments are exogenous after incorporating all the
information about how the industry did in the past. While this finding excludes reverse
causality stemming from past values of industry performance affecting private equity
investments, there might be other time-varying8 unobservables that are driving the findings.
Notably, one could argue that private equity companies have superior foresight and time their
investments based on their expectations about the industry prospects going forward. It would
admittedly be impossible to perfectly control for expectations and fully exclude the
alternative explanation of market timing. However, although no single finding would be
7 The ordering of the variables in the VAR model is important as it determines which variable affects the other
variables contemporaneously and with a lag, or only with a lag. In the analysis throughout, I assume that private equity capital affects the industry variables both contemporaneously and with a lag, while it is impacted only with a lag. A caveat to this is, if private equity companies observe industry performance and quickly time their investment within the same year, the VAR where private equity capital is the first variable in the system will not capture this. However, all the results in the paper stay the same when the ordering of the variables is changed. 8 The panel VAR estimation allows for country-industry and time fixed effects, so any time-invariant
heterogeneity is controlled for in the specifications.

5
conclusive by itself, the evidence provided throughout the paper, including the different
findings for buyout versus venture capital as well as the cross-sectional findings, altogether
are indicative of a causal relationship where private equity investments lead to spillovers.9
Next, I explore the dynamic relationship between industry-wide investment among the
public firms and private equity, and find that higher levels of private equity capital lead to
higher growth in industry-wide capital expenditures suggesting that private equity companies
not only contribute to short-term performance advancement but can also facilitate long-run
growth through more real investment at the industry-level.10
Lastly, I focus on two financial variables: industry-wide net debt growth and stock
market returns. I find that net debt of the industry also grows faster following buyout capital
investments into the industry suggesting that the financial structures introduced by private
equity companies at the portfolio companies in buyout transactions also spill over onto the
other companies in the industry leading to increased levels of leverage. Furthermore, while
there is no evidence for private equity capital chasing returns, i.e. past values of industry
returns are not related to the level of private equity capital invested, overall stock market
returns increase following venture capital investments indicating that spillovers of
operational improvements have implications for firm values as well.
The dataset used in the paper is provided by The Burgiss Group and is unique in its
detailed coverage of private equity investments at the global level. The data are aggregated
using actual fund investments, both buyout and venture capital, in portfolio companies. It
9 See Section 5.6 for a discussion of the alternative market-timing hypothesis in greater detail.
10
More investment will lead to future growth if the investments have positive net present values. Assuming the increased investment is made in new technologies that lead to higher efficiency; it will facilitate long-run growth.

6
covers a total private equity capital of $1.3 trillion invested in 48 countries across 19
industries from 1990 to 2011 and is the first dataset providing actual dollars of invested
private equity capital at the industry level across a large number of countries.11
While the existing evidence on private equity has been mostly on U.S. and European
data, studying global investments in a cross-country setting is important for two reasons.
First, while private equity has been largely a U.S.- and U.K.-only phenomenon pre-1990, the
share across the two countries out of the total amount of global private equity capital invested
has come down to around 60% in 2011; in other words, 40% of the total global private equity
capital is now being invested in countries other than the U.S. and the U.K. Abolishment of
entry barriers for foreign capital coupled with high growth potentials in developing countries
are most likely the main reasons behind this trend. Despite the fact that private equity has
become a global asset class, there is very little evidence on how private equity impacts
performance globally due to lack of good research quality data at the global level.
Second, the cross-section of countries allows me to study the different impacts of private
equity in countries and industries with different characteristics, which provides evidence
consistent with a causal effect of private equity on industry spillovers. Both the implications
of the private equity business model and how well the spillovers are absorbed within an
industry might be different depending on the institutional environment as well as the level of
technological advancement in a country. Strong legal institutions are necessary for private
equity companies to better implement the governance structures that make their portfolio
companies more efficient (Cumming and Walz 2009). As such, I predict and find that the
positive effects of private equity investments on the public companies within the same
11
Harris, Jenkinson, and Kaplan (2012) also use private equity fund flow data supplied by The Burgiss Group in their study of private equity fund performance.

7
industry are concentrated in countries with a stronger legal environment, measured by the
quality of legal institutions and intellectual property rights.12
For spillovers from new technologies to be more effective, the companies that do not
receive investment should be in need of new technologies, i.e. they should possess fewer
technological skills. At the same time, some level of existing technological skills is needed
for the spillovers to be absorbed. In line with this, the existing evidence on spillovers from
foreign direct investments (FDI) shows that productivity spillovers are strongest for
companies in countries with moderate levels of technological advancement.13
Lastly, I also explore how the results differ depending on the level of competition within
a country-industry. Spillovers resulting from the competitive pressure coming from the more
efficient private equity-backed companies are expected to be stronger in country-industries
that are more competitive, where the pressure would be highest. Indeed, I find that the
positive impact of private equity investments are more pronounced in country-industries with
higher levels of competition. These cross-sectional results altogether provide support for a
causal effect of private equity investments on industry spillovers as alternative stories such as
market timing would not predict these cross-sectional differences.
This paper contributes to several literatures in finance and economics. First, providing
evidence on the positive impact of private equity capital on industry performance at the
global level, it contributes to the large body of studies that examine how company
12
The protection of intellectual property rights is particularly important as it impacts how extensive the private equity companies would introduce new technologies at their portfolio companies. Mansfield (1994) finds that technology spillovers are weakest in countries with weak intellectual property protection. 13
Kokko (1994) and Kokko et al. (1996) are examples of studies that find that moderate technology levels lead to highest spillovers from FDI.} Similarly, I also find that the spillover effects from private equity investments are not present for countries that have very high or very low innovative capacities. The positive spillover results are concentrated in countries with moderate levels of innovative capacities.

8
performance changes post private equity transactions (Kaplan 1989, Cao and Lerner 2009,
Davis et al. 2009). With the evidence for positive spillover effects at the industry-level, the
paper supports and complements the existing firm-level evidence. Second, it contributes to
the existing spillover literature by exploring spillover of management practices, knowledge,
and technology from private equity-backed companies to the public companies within the
same industry. It provides evidence for a different channel for spillovers other than
multinational corporations, the most discussed channel in the literature.14
Lastly, it also
contributes to the large literature of finance and growth that examines the link between
financial development and economic growth of countries. Existing studies look at how the
development of a country's public and credit markets affects output growth by providing a
better allocation of capital (King and Levine 1993, Levine 2004). I explore the impact of a
different financial asset class, private equity, and show that its entrance into an industry also
enhances industry growth by creating positive externalities within the industry.
The remainder of the paper is organized as follows. The next chapter further discusses the
related literatures and how the paper fits in, together with a real example of industry
spillovers after a private equity transaction. Chapter 3 introduces the data and presents some
descriptive analysis, as well as outlines the empirical strategy, the panel VAR approach.
Chapter 4 presents the empirical results, and Chapter 5 concludes.
14
This is an important contribution as 'the degree to which other modes of international business (besides traditional inward FDI) generate appropriate spillover benefits for the host country is an exceedingly important policy issue for which there is a disappointing amount of evidence.' (Blomstrom et al. 1999, p.15).

2. Background
According to Kaplan and Stromberg (2009), private equity companies improve their portfolio
companies using practices that can be summarized under three main headings: financial
engineering, governance engineering and operational engineering. Financial and governance
engineering refer to the structure of ownership and financing implemented at these
transactions that lead to better monitoring and incentive alignment to overcome agency
problems at the portfolio companies, while operational engineering refers to management
practices that large and experienced private equity firms use to improve operational
efficiencies of their portfolio companies. Firm-level performance after private equity
transactions has been examined extensively in the existing literature in studies looking at
transactions in the U.S., the U.K. or European Union countries.
In his seminal work, Kaplan (1989) tracks large management buyouts of publicly held
companies and finds evidence for improved operating performance at these companies as
well as increased market values. Similarly, Muscarella and Vetsuypens (1990) study reverse
leveraged buyouts (LBO), and find that profitability at target companies increase following
the transactions. More recently, Davis et al. (2009) show that U.S. firms receiving a private
equity investment experience higher subsequent productivity growth. Complementing the
existing evidence on operating performance, Cao and Lerner (2009) provide evidence for
superior stock market performance for reverse LBOs. Studying a sample of private equity-
backed companies in Western Europe, Acharya et al. (2009) also find evidence for
performance gains from private equity. Besides the implications of private equity for

10
operating and stock market performance, its impact on employment receives the most
attention from the press, and labor unions.
Private equity companies are typically blamed for sacrificing jobs for short-term
profits. In one of the most detailed studies on this issue, Davis et al. (2011) examine
establishment-level job creation and destruction at U.S. establishments using data from the
U.S. Census Bureau. They find that private equity-backed companies have higher job
destruction at existing establishments, but at the same time higher job creation at new
establishments. Their conclusion is that the net impact of private equity transactions on
employment is very moderate. Similarly, Popov and Roosenboom (2008) find that venture
capital leads to higher new business creation in their study of 21 European countries over the
period 1998 - 2008.
Most of the existing studies on private equity transactions have found evidence for
superior subsequent performance at the firm-level. However, it is still unknown how private
equity transactions affect the other firms, which do not receive private equity capital, within
the same country-industry. In this paper, I study the performance of all the public companies
within a country-industry as a whole in an attempt to capture the spillovers from target
companies to the rest of the industry.
There is a large-established literature that has provided evidence for the existence of
productivity spillovers.15
For example, several studies on different countries, including Caves
(1974) on Australia, Globerman (1979) on Canada, and Blomstrom and Persson (1983) on
15
The idea of spillovers was first introduced by Marshall (1890) in the form of knowledge spillovers among firms, and then improved by Arrow (1962), and Romer (1986). Later, Glaeser et al. (1992) put the ideas together and defined the Marshall-Arrow-Romer (MAR) model of knowledge spillovers, which argues that knowledge is industry specific and spills over within an industry once its created.

11
Mexico, have shown positive spillover effects from FDI to domestic industries (see
Blomstrom and Kokko, 1998 for a review). Similarly, Bernstein and Nadiri (1989) provide
evidence for research and development spillovers within an industry and find that overall
costs in an industry decline following improvements in technology as knowledge expands to
externality-receiving firms. On the other hand, Aitken and Harrison (1999) find that the
entrance of foreign companies negatively impacts the performance of local firms because
they attract customers away from domestic firms raising questions about the existence of
positive spillover effects.
Similar to FDI, private equity firms also introduce new technologies, know-how and
managerial expertise to the industry through their portfolio companies. These new practices
would then potentially spill over within the industry through different channels16
and lead to
industry-wide efficiency gains. As such, studying the impact of private equity on overall
industry dynamics is of first order importance to answer broader questions about private
equity and its implications for the economy.
This paper is closest to the recent study by Bernstein et al. (2012). In their study of 26
OECD countries between 1991 and 2007, they find that industries which had at least one
private equity transaction in the past five years grow faster in terms of employment and
productivity. They, however, do not find evidence for differences between industries with
high versus low amounts of private equity capital. There are several significant differences
between this paper and theirs. First, they look at the overall industry performance following a
private equity transaction, including the companies receiving private equity capital and
16
One channel of spillovers is that the other firms copy the best practices and new technologies of the private equity-backed firms. It could also be the case that they are forced to come up with their own practices and technologies to become more efficient in order to keep up with the competitive pressure from the more efficient private equity-backed firms.

12
others, while I focus on aggregate industry measures of publicly listed companies only. This
allows me to more clearly identify the spillover effects from private equity-backed
companies to companies that do not receive private equity capital within the same industry.
Second, their measure of private equity is the existence of any private equity transaction in an
industry, whereas I look at actual dollars of private equity capital invested. Lastly, they study
a sample of OECD countries between 1991 and 2007, while I study 48 countries, including
both developed and developing nations. This allows me to provide the first evidence on the
impact of private equity investments in developing nations and also allows me to compare
how the spillover effects are different for countries and country-industries with different
characteristics, which also provides support for a causal effect.
The buyout of the car rental company Hertz was one of the biggest buyout
transactions in history. The company was acquired for $14 billion by a private equity
consortium consisting of the Carlyle group, Merrill Lynch's investment arm, and Clayton
Dubilier & Rice at the end of 2005. After the buyout, significant changes were made at the
company to cut costs and improve operational efficiency. For example, before the buyout
once a car was dropped off at a rental location, it was being cleaned and refueled at different
work stations, which the new management realized was creating too much idle time and
decreasing operational efficiency. To increase efficiency, cleaning stations were moved to
where the cars are being refueled resulting in a doubling of the number of cars that could be
processed every hour. In additional to operational changes, the private equity group also
changed the governance structure of the company and started to more closely monitor the
management.17
Shortly after the buyout, the private equity group filed for an initial public
17
The New York Times article "Is Private Equity Giving Hertz a Boost?" published on September 23, 2007 discusses the Hertz buyout and talks about the operational changes at Hertz following the buyout.

13
offering for Hertz. This quick move raised concerns about the intentions of the private equity
companies backing Hertz, and critics argued that market-timing drove their decision. They
were criticized for being focused on short-term profits for their own sake rather than
operational improvements at the company that would facilitate future growth. Despite all
these critics, the company was taken public at a value of $17 billion suggesting that the
improvements made by the private equity group lead to a 21% increase in firm value.18
During the same time period, Avis Budget and Dollar Thrifty, the two biggest
competitors of Hertz, experienced significant performance gains after Hertz was bought out
by the private equity consortium. For example, in 2006 Avis Budget introduced a process
improvement initiative called "Performance Excellence", designed to make vehicle rental
processes more efficient, cut costs, and enhance the customer rental experience. Similarly,
Dollar Thrifty announced the implementation of several cost-saving initiatives, including
information technology outsourcing as well as more investment into improvement of existing
IT systems to increase efficiency. These efforts are most likely a response to the competitive
pressure from Hertz, suggesting the existence of spillovers from competitive pressure. In
fact, profit margins increased by 10% and 7%, while labor productivity, measured by sales
per employee, also increased by 5% and 6% at Avis Budget and Dollar Thrifty, respectively,
from 2006 to 2007. During the same period, employment did not change at these companies.
This specific example suggests that practices and technologies causing efficiency
gains at a private equity-backed company might spill over onto other companies within the
same industry over a very short period of time due to the competitive pressure, and lead to
overall performance gains at the firms that do not receive private equity capital. Hence, the
18
Bloomberg Businessweek article "Buy It, Strip It, Then Flip It" published on August 6, 2006 discusses the IPO decision of the private equity group shortly after buying out Hertz Corporation.

14
rest of the paper tries to answer if this is indeed the case on a study of 48 countries and 19
industries between 1990 – 2011

3. Data and Methodology
3.1 Data
The private equity investment data comes from The Burgiss Group (Burgiss), a software
company providing record keeping and performance analysis services to the largest
institutional investors in the private equity universe. The major advantage of this dataset over
others is that Burgiss sources its data exclusively from limited partners, as opposed to general
partners (GP); so, the typical biases associated with GP-sourced datasets are not present.19
Recently, Harris, Jenkinson and Kaplan (2012) use Burgiss data and compare the existing
evidence on fund performance found using other commercially available private equity
datasets to the evidence from Burgiss. For detailed information about Burgiss and its
coverage of the private equity universe, see Harris et al. (2012) and Brown et al. (2011).20
The specific Burgiss data used in this paper has actual dollar amounts of private
equity capital invested globally, including both buyout and venture capital, at the country-
industry-year level over the period 1990 - 2011. The data cover over 77 countries and
provide aggregated company level private equity capital invested at the industry level based
on the Industry Classification Benchmark (ICB). So, an example of a unit of observation
19
GP-sourced databases on private equity have significant biases as GPs might strategically stop reporting. Burgiss sources its data entirely from LPs, and data are cross-checked across different investors in the same fund, which leads to a high level of integrity and completeness. 20
One caveat that should be taken into account about the Burgiss data is that it might be biased towards large institutional investors, which is a shared feature with the other datasets. However, investments from the large institutional investors make up a very large portion of the total private equity capital raised around the world.

16
used in the analysis would be the $ amount of private equity capital invested in India in the
technology industry in 2000. This is the first dataset having actual dollar amounts of private
equity capital invested at this level of detail globally. As the dataset is unique and novel in its
coverage of private equity investments around the globe, some simple descriptive analysis is
to follow.
Table 1 presents the distribution of private equity capital invested globally among 48
countries in the sample between 1990 – 2011. Panel A ranks the countries based on the total
dollar amount of private equity capital received, with amounts in million U.S. dollars and
inflation adjusted to 2011. Column 1 shows that the U.S. and the U.K. have received the
highest amount of private equity capital over the time period. While venture capital makes up
about 25% of total capital invested in the U.S., its share is less than 10% for the U.K.
Developed European countries are also among the countries receiving large amounts of
investments. Similar to the U.K., more than 90% of the total amount of capital received is
buyout capital in these European countries. Another important observation to note is that
China and India rank 3rd and 7th, receiving more than $37 billion and $23 billion of private
equity investment, respectively. About 30% of the total amount of capital invested is venture
capital in China, whereas venture capital makes up 17% of the investments in India.
In Panel B, countries are ranked by the total amount of private equity capital received as a
percentage of their GDP.21
U.S. and U.K. are again on top of the list. Sweden and Denmark
rank 3rd and 4th while they were ranked only 9th and 14th in Panel A, so they actually
received a large amount of capital when compared to the size of their economies. Ireland,
Israel, Bulgaria, Singapore and Czech Republic also rank high based on the GDP adjusted
21
The ratio is calculated separately for each year between 1990 and 2011, and then the average is reported for each country.

17
numbers. China and India, on the other hand, go down the list due to their large economies.
Lastly, Panel C presents countries ranked by the amount of private equity capital received as
a percentage of a country's FDI inflow. U.S. is again on top of the list followed by Denmark,
Germany, and South Korea. India ranks 8th, while China ranks much lower due to the large
amount of FDI flowing into China. Figure 3 presents the time-series of the ratio of global
private equity investments to global FDI inflows. It showcases the increasing importance of
private equity investments as another source of international capital flows indicating the
importance of studying global private equity investments as a channel for productivity
spillovers. Overall, Table 1 shows that private equity has become global, and although U.S.,
U.K., and other big European countries are still big hubs for private equity investments,
emerging economies such as China, India, and Brazil also get a large portion of the total
private equity capital invested globally.
Table 2 provides the industry distribution of total private equity, buyout and venture
capital invested globally between 1990 -- 2011. The technology sector received the highest
amount of capital, followed by industrial goods and services, and health care. The technology
sector received more venture capital than buyout ($133 billion versus $124 billion), while a
very big portion of private equity capital invested in industrial goods and services is buyout
(only 7% of total invested capital is venture capital). The health care sector received $168
billion of private equity capital in total, with 40% of it being venture capital. In almost all the
other sectors, buyout capital makes up more than 90\% of the investments with the exception
of telecommunications where the share of venture capital is around 20%. Overall, Table 2
exhibits that venture capital went more into R&D intensive sectors such as technology and
health care, while buyout capital dominated most of the other sectors.

18
The data on industry performance variables come from Datastream's Global Equity
Indices that provides accounting as well as market price data for different industries in 53
countries classified based on Industry Classification Benchmark (ICB), a classification
scheme categorizing over 70,000 companies and 75,000 securities worldwide. The industry-
wide measures are calculated using data from financial statements of a sample of publicly
listed companies whose stocks cover a minimum 75% of the total market capitalization in
every country-industry each year. The private equity investment data is matched to the
industry performance data at the country-industry-year level using the ICB classification.
Additional country-level variables used in the analysis come from World Bank's World
Development Indicators (WDI), which are then matched to the other data by country and
year. Country-level data on legal environment, namely quality of institutions and intellectual
property rights, and level of innovative capacity come from World Economic Forum's Global
Competitiveness Index database. The final matched dataset has around 11,000 country-
industry-year observations covering 48 countries and 19 industries.
Table 3 presents summary statistics for the industry- and country-level variables.
Variable definitions are provided in Table A1. Over the sample period, industry-wide
employment grew at 7% on average, while median employment growth is 2.4%. Labor
productivity on average grows at 7%. These seem like high numbers for industry-wide
employment and productivity growth, but note that the sample includes developing
economies where industries can grow much more rapidly than mature economies like the
U.S. Average (median) net profit margin growth is 0.8% (0.15%) for the sample. The
average (median) growth for industry returns (annual change in the value of industry stock
return index) is about 10% (12%). Panel B presents summary statistics for the country-level

19
variables. Average (median) GDP growth is 2.2% (2.5%) in the sample. Public market is a
measure of the liquidity of a country's stock markets, measured as the total value of stocks
traded as a percentage of GDP. The average (median) value of stocks traded is 48% (22%) of
GDP for the sample. Similarly, credit market is a proxy for the credit market development of
a country, measured by the total amount of credit given to the private sector as a percentage
of GDP. Private sector credit is on average 80% of a country's GDP in the sample.
The goal of this paper is to identify the impact of private equity investments on
industry level employment growth, productivity growth, and profitability growth to identify
spillovers from private equity-backed companies to the rest of the industry. In Table 4, I
compare average and median employment growth, profitability growth and productivity
growth, along with some other variables, in subsamples of country-industry-years. Columns
1 and 2 of Panel A present mean (median) values for the subsamples created based on a
private equity indicator which takes the value of 1 at time t if the country-industry received
capital in that year, and 0 otherwise. Column 3 presents p-values for the mean (median)
difference between these subsamples from a t-test (Wilcoxon rank-sum test). Average
employment growth and profitability growth are both higher in country-industries with a
private equity investment, while average labor productivity growth is higher in the subsample
of country-industries that did not receive any private equity capital. The negative association
with productivity growth might reflect that private equity companies choose less productive
country-industries to invest where there is more room to grow. The average growth in capital
expenditures, net debt and industry returns are not significantly different among the
subsamples. Furthermore, countries that received private equity capital seem to have more
developed stock and credit markets, while having slower GDP growth on average. These

20
country characteristics suggest that private equity capital flows more into developed
countries, which typically have slower output growth and more developed financial markets.
This is consistent with the U.S. and U.K. receiving high amounts of capital and might be due
to the availability of better exit opportunities for the private equity companies in those
countries.
Next, I limit the sample to country-industry-years with positive amounts of private
equity capital invested, and compare means among subsamples of high versus low
investments. Results are presented in Columns 4, 5 and 6 in a similar fashion. Several of the
results are similar to the earlier comparison. Country-industries that received higher amounts
of private equity capital have faster growth in employment and profitability on average at the
time of investment, and the differences are larger in magnitude. Capital expenditure growth
is not statistically different among the subsamples, as in the earlier comparison. Some results
however are different from the conclusions drawn from the comparison of country-industries
with and without any investment. Labor productivity grows faster for country-industries
receiving higher amounts of investments, but the difference is not statistically significant.
Industries that receive higher amounts of private equity capital have higher industry returns,
and debt growth.
Overall a couple of conclusions can be made from the univariate comparisons.
Industries that receive private equity capital have higher employment and profitability
growth than industries that did not, and among the industries that received investment, the
ones with higher amounts of capital experience faster growth. Labor productivity growth
seems to be lower in industries with private equity investments, but among the industries
with private equity investments, there is no statistically significant difference. Industry stock

21
returns seem not to matter as for whether there is any private equity investment or not,
however among the industries with private equity investments, more capital is associated
with higher stock returns at time of investment.
These results suggest a positive relationship with the level of private equity capital invested
in an industry and employment growth as well as profitability growth and industry stock
returns. The relationship of private equity with productivity growth, on the other hand, seems
to be ambiguous.
Although these results are suggestive, it is very hard to make any conclusions about
the actual relationship between private equity and industry performance given the potential
endogeneity stemming from reverse causality: the decision of private equity companies to
invest in a specific industry in a specific country is most likely endogenous. So, even though
a multivariate analysis would allow to include additional controls, naive OLS regressions
would also be limited to determine the impact of private equity on industry performance.
Considering the endogeneity, a natural experiment or a good outside instrument for
the amount of private equity capital would be the ideal case to identify the causal impact of
private equity on industry dynamics. Unfortunately, neither natural experiments nor good
instruments are easy to come up with in this circumstance. Thus, in the absence of these I
make use of the time-series component of my data, and in an attempt to unravel the direction
of causality, I apply a Vector Auto-Regression (VAR) model on the panel of country-
industry-years. Next section discusses the panel VAR approach.
3.2 Empirical Strategy

22
A VAR is a system consisting of N linear equations with N variables where each variable is
explained by its own lagged values together with the current and past values of the remaining
N - 1 variables in the system. After being introduced by Sims (1980), it has been widely used
to explain the dynamic behavior of multivariate economic and financial time-series. The
main advantage of this estimation methodology is that it treats all the variables in the system
as endogenous which leads to a better identification of the dynamic relationships between the
variables in the system. In the absence of exogenous instruments, a VAR estimation is useful
to deal with endogeneity as it uses lagged values of the variables as instruments.
Although the VAR approach is long-established, it has not been widely used on panel data
until recently. Love and Zicchino (2006) apply a VAR model on firm-level panel data from
36 countries in their study of the dynamic investment behavior of firms in an attempt to
isolate the impact of financial factors from fundamental factors that affect firm investment. I
follow their empirical methodology and apply a VAR on the panel of country-industry data
from 48 countries in the period of 1990 - 2011. In addition to utilizing the time-series
component of the data treating the variables in the system as endogenous, the panel VAR
also allows for unobserved individual heterogeneity by including country-industry fixed
effects in the estimation. More specifically, following Love and Zicchino (2006), I estimate a
panel VAR system of the following form:
, (1)
where
Xci,t : a three or four variable vector consisting of industry-level variables together with a
measure of private equity capital invested
μci : country-industry fixed effects

23
τt : time fixed effects.
Country-industry fixed effects are included to control for any unobserved time-
invariant individual heterogeneity in the variables. In a single model specification, fixed
effects may be removed by demeaning all the variables in the model at the individual
observation level, which would be country-industry in this case. However, in this type of
VAR specification, where all variables are instrumented by their lagged values, fixed effects
when introduced by demeaning would be correlated with the regressors violating the
exclusion restriction of the instruments. To overcome this problem, I apply a forward-mean
differencing, also known as the “Helmert” procedure (Arellano and Bover, 1995), where only
the forward-mean for every country-industry-year is removed. After the Helmert
transformation, the model is then estimated using a system GMM where lagged values of the
regressors are used as instruments. The specification also includes time-fixed effects to
remove the effect of global macro shocks that might affect all the variables in the system.
In a VAR specification, the ordering of the variables in the estimation does matter.
The assumption is that every variable in the system affects the subsequent variables both
contemporaneously and with a lag, while later variables affect the previous ones only with a
lag. In other words, variables that appear earlier in the ordering are assumed to be more
endogenous. In the estimations throughout the paper, I assume that private equity capital
invested affects the industry variables both contemporaneously and with a lag, while it is
impacted only with a lag.22
The goal of the panel VAR methodology is to identify the direction of causality
between private equity capital invested in an industry and industry growth in terms of
22
This assumption may not always hold; however, I repeat all the analysis with different orderings of the variables and all the results stay the same, and are available upon request.

24
employment, productivity, and profitability. It should be noted that as the industry measures
are aggregated from publicly listed companies in an industry, the effect that will be identified
would be a measure of spillovers from private equity-backed companies to the rest of the
industry.

4. Results
In this section, I estimate a panel VAR as in equation 1, where the X vector includes the
amount of private equity capital invested in an industry adjusted by industry sales, industry-
wide employment growth, profitability growth and labor productivity growth. I am trying to
identify what the impact of private equity capital is on the growth in employment,
productivity and profitability of the public firms in an industry in an attempt to measure
technology and productivity spillovers from private equity backed-companies to the rest of
the industry.
4.1 Private Equity and the Real Economy
4.1.1 Private Equity, Employment, Productivity and Profitability
Most likely, employment, labor productivity and profitability are jointly determined in an
industry, and private equity companies observe past performance of an industry when
deciding whether or not they should make an investment. As such, all the variables are
endogenous. The VAR model allows me to cleanly identify the direction of causality
between my variable of interest, private equity capital invested, and the other variables in the
system to the extent that the amount of private equity capital invested in a country-industry is
exogenous after controlling for lagged values of industry performance in that country. If the
private equity companies bring in new technologies and management practices that lead to
improvements at the target companies, and the rest of the companies within the same

26
industry absorb the resulting spillovers, we should observe a positive impact on industry
prospects. Whether one should be concerned about reverse causality or not depends on if
private equity capital invested is related to the past values of industry performance variables
or not.23
Table 5 presents the results of the panel VAR estimation. The coefficients are from
the system GMM estimation where all the variables at time t are regressed on their own lag
together with the lags of the other variables in the model.24
The first column shows how the
amount of private equity capital invested at time t is affected by employment growth,
profitability growth and productivity growth at time t-1. All the coefficients are statistically
insignificant with the exception of the variable's own lag, suggesting that private equity
capital invested is not affected by how the industry did a year ago in terms of employment,
profitability, and labor productivity growth, after controlling for the amount of capital
invested at time t-1 and removing country-industry, and time fixed effects. The significant
coefficient on the amount of private equity capital at time t-1 suggests that private equity
capital is persistent, which is not surprising given the fact that private equity investments are
typically completed in rounds.
The second column presents the results from the part of the estimation where the
dependent variable is employment growth. Employment growth at time t is significantly
affected by productivity growth, and profitability growth at time t-1. After an industry
23
Reverse causality might also be stemming from private equity companies' predictions about the industry prospects. However, the cross-sectional evidence presented in Section 5.4 is consistent with a causal effect of private equity on industry spillovers, while an explanation of superior foresight would not have the same cross-sectional predictions. 24
Although the paper provides results with a one-year lag VAR only, results do not change when estimating VARs with two- or three-year lags. Existing statistical tests for the optimal number of lags cannot be applied to panel data. However, a likelihood ratio test between models with one, two and three lags indicates that the models with two or three lags do not fit significantly better than the model with one lag. Furthermore, Cochrane (2005) suggests that economic theory does not say much about the orders of autoregression terms, and short order auto-regressions should be used to approximate for processes.

27
experiences faster growth in profitability and higher productivity, it also grows faster in
terms of employment subsequently. The main variable of interest for the purpose of this
paper is private equity capital invested. It indeed also has a significant and positive
coefficient: industries that receive more private equity capital experience faster employment
growth following the investment. As there are country-industry fixed effects in the
estimation, any unobserved time-invariant heterogeneity is removed. Basically, this result
says that on average employment in a country-industry grows faster following a private
equity capital investment compared to the level of employment growth in the same country-
industry in a year with no or limited private equity investment. Recall that employment
growth is total employment growth of the public companies, which most likely do not
receive private equity investment, in the industry. As such, note that the effect being
measured is the spillover effect. As the private equity-backed companies become more
efficient, the other companies within the same industry are also forced to improve their
operations as well in order to be able to compete, and hence they create more jobs resulting
faster growth in industry-wide employment.
The third column shows how labor productivity changes following a private equity
investment into the industry controlling for changes in employment and profitability together
with the growth in labor productivity from the previous year. Lagged employment and
profitability growth are not statistically significant. The coefficient on the amount of private
equity capital invested, however, is again positive and significant at 1% showing that overall
industry productivity grows faster following the flow of private equity capital into a part of
the industry. So, not only employment, but also labor productivity grows faster subsequent to
private equity companies investing in an industry. As in the example of the Hertz buyout,

28
private equity companies introduce practices and technologies that increase operational
efficiency of their portfolio companies, and these efficiency gains spill over within the whole
industry leading to higher productivity in the rest of the industry as well.
Lastly, I look at how profitability changes. While the second and third columns have
shown the positive impact of private equity on labor productivity and employment growth,
they did not provide any evidence about the cost effectiveness of these improvements in an
industry. The higher growth in labor productivity suggests an increase in sales, but does not
show that this increase in sales is captured by higher profits. For example, if sales per
employee increases because employees put more work hours and are therefore being
compensated more aggressively, or more sales are reached through the use of advanced
technologies that are very costly to implement; profits may deteriorate as a result, which in
turn may lead to lower firm values. As such, it is important to see how profitability changes
as a response to the private equity investment within the industry.
The fourth column presents these results. While neither lagged employment growth
nor lagged productivity growth are significant after removing fixed effects and controlling
for lagged profitability growth, the amount of private equity capital has again a positive and
statistically significant coefficient: after an industry receives private equity investment,
profitability grows faster in comparison to years with no or low private equity capital.25
25
One might be concerned that profit margins increase due to a reduction in sales as profitability is measured as net profits over sales. However, I find that sales growth increases as well indicating that the increase in profitability results from higher sales and lower costs. Section 5.5 shows that buyout transactions lead to higher leverage levels within the industry suggesting that tax benefits from higher leverage is another factor leading to higher profitability.
29
This result indicates that the gains in productivity and growth in employment are also
reflected in profits.26
Overall, the results in Table 5 show that following private equity investments into an
industry, public companies within the same industry that do not receive investment
experience higher employment, productivity and profitability. These results suggest that after
some companies in an industry receive private equity investment and become more efficient,
other companies within the same industry are also forced to improve. This might be resulting
from the competitive pressure from the private-equity backed companies as well as from
copying of the best practices implemented by the private equity companies. Although not
perfect, the panel VAR method controls for reverse causality to the extent that private equity
companies make their decisions about investing in a particular industry based on what
happened in the industry in the past. Past industry performance is not related to the amount of
private equity capital invested into the industry suggesting a causal effect where private
equity investments lead to spillovers within industries.
One caveat should be noted about these results. Although I provide evidence for
overall gains across the public companies within an industry, there is no direct evidence on
firm-level performance. However, the reported results indicate that private equity
investments create positive externalities within an industry. As such, the gains at the rest of
the industry suggest that private-equity backing leads to efficiency gains at the target
26
It is hard to tell if the spillover effects documented here are small or large since there is no benchmark to compare them to. However, they are comparable in magnitude to the effects found in Bernstein et al. (2012), the only other study looking at industry-level changes. It should be noted that their industry measures include the companies that actually receive private equity investment as well, while I am only looking at changes in public companies within the same industry. Hence, one would expect their results to be larger in magnitude. However, they do not observe the amount of actual capital invested and use only an indicator variable for the existence of any private equity transaction, which makes it harder to compare their results to the magnitudes documented here.

30
company first, which then are also absorbed by the other companies within the same
industry. Hence, this is consistent with the existing literature that has shown that private
equity leads to performance gains at the target companies. Kaplan (1989) and recently Guo et
al. (2011) both have shown that profitability increases after buyouts. Furthermore,
Lichtenberg and Siegel (1990) and Davis et al. (2009) provided evidence for productivity
gains following buyouts. The higher growth in industry-level productivity and profitability
confirm the findings of the aforementioned studies.27
These findings also complement the
large body of studies that have provided evidence for positive spillovers from foreign owned
companies onto local industries (Blomstrom and Kokko, 1998). Given the increased share of
private equity investments when compared to FDI as shown in Figure 3, it is important for
policy makers to consider private equity investments as an alternative source of productivity
and technology spillovers. Additionally, spillover effects within an industry and how the
overall industry, rather than an individual company, fares from private equity investments
should be taken into account when assessing the impact of private equity on the real
economy, and making policy decisions about promoting or limiting private equity capital.
4.1.2 Buyout versus Venture Capital
While the previous section has shown that private equity capital leads to performance gains
within the industry it is invested in, it did not differentiate between the two main asset classes
of private equity, buyout and venture capital. A buyout transaction is where the private equity
27
The existing evidence on firm-level performance gains range from 10% to 40% depending on the study and the measure of operating performance used. The economic magnitudes of the positive effects presented here are significantly smaller than firm-level effects, which is plausible given that what is being captured here are spillover effects only. The effects become larger when looking at a two- or three-year window, but are still significantly smaller than the documented firm-level effects.

31
firm typically acquires a target firm by purchasing all of the outstanding equity, often with a
significant amount of debt financing. The typical buyout transaction is financed with 60 to
90% debt (Kaplan and Stromberg, 2009). Leveraged buyouts first appeared in early 1980s,
almost disappeared in 1990s, but then reemerged in mid-2000s. Although buyouts are
typically criticized for loading up the target companies with leverage, as well as cutting jobs
and capital expenditures in an attempt to cut costs and increase profits, the existing evidence
shows that they make their targets more efficient. Higher levels of debt, and better incentive
structures put pressure on the managers to perform better; and together with stronger
corporate governance, buyouts lead to efficiency gains.
On the other hand, a typical venture capital transaction is an investment into a young
and new company without acquiring majority control. Venture capital investments typically
provide financing for small businesses that otherwise cannot get financing due to high
informational asymmetries. As such, venture capital prevents young companies from having
to forgo positive investment opportunities. Additionally, venture capital investments are
typically associated with an increase in the target company's innovative potential by allowing
for more research and development investments. Kortum and Lerner (2000) provide evidence
that venture capital investments indeed spur innovation, and this result is replicated in many
other studies using U.S. and European data.28
Given the very different structures of these two transactions, they might also differ in
terms of their impact on industry dynamics. To explore if buyout and venture capital have
different impacts on industry dynamics, I repeat the panel VAR analysis from Table 5, but
separately for buyout and venture capital. Panel A and Panel B of Table 6 present the results
with buyout and venture capital, respectively. The results in Panel A indicate that the earlier
28
For example, Popov and Roosenboom (2012).

32
results about the impact of total private equity capital invested on industry employment and
profitability are replicated when using buyout capital only. So, buyout capital invested in an
industry leads to higher employment and profitability growth. I do not find any evidence in
line with the critics arguing that buyout transactions lead to job cuts, at least at the industry
level. As for productivity, I do not find evidence for faster growth after buyout transactions.
This suggests that buyout transactions lead to improvements in profitability through cutting
costs and financial engineering, but their impact on labor productivity is not significant.29
Panel B presents the results with venture capital. The first thing to note is that the coefficient
on lagged private equity is larger for venture capital suggesting that venture capital is more
persistent than buyout investments. The impact of venture capital invested on employment
growth and profitability growth is not statistically different from zero. So, unlike buyouts, I
do not find evidence for profitability gains or faster employment growth resulting from
venture capital investments into an industry. Industry-level labor productivity, on the other
hand, grows significantly faster following a venture capital investment. The finding that
profitability does not increase following venture capital investments, despite the significant
increase in productivity, might be due to costly investments in new technologies that lead to
higher innovation. The result that venture capital does not lead to higher employment might
be the result of a crowding out effect. Companies receiving venture capital create new
technologies, which initially might crowd out the existing businesses and lead to employment
declines. So, while new businesses are created, employment at existing businesses might
decline at the same time mitigating the positive effect on overall industry employment, at
least in a one-year window.
29
This could be interpreted as buyouts leading to higher profits by cutting costs, but not through increases in sales. This would be consistent with buyouts adding value through financial engineering, where high levels of leverage lead to tax benefits as well as discipline managers with the pressure of making interest payments.

33
Venture capitalists typically make investments into small companies that are very
research and development intensive and have high growth opportunities, but cannot get
financing through other means as they are small and young. In that sense, venture capital
investments are more aimed to eliminate financing constraints of the target companies.
Therefore, in the short-term there are no employment or profitability spillovers onto the rest
of the industry. Nonetheless, if venture capital leads to innovation and productivity
spillovers, it in the longer-term should also lead to higher profitability and employment
growth. In untabulated panel VAR's with 2- and 3-year lags I find that it is indeed the case.
The amount of venture capital invested at time t-2 and t-3 leads to higher employment
growth as well as higher profitability at time t. This supports the argument that venture
capital facilitates innovation of new technologies that lead to productivity spillovers, but are
not immediately reflected in higher profits or employment. However, in the longer-term both
profitability and employment grow faster following venture capital investments in an
industry.30
To summarize, while buyout investments can quickly lead to an increase in profits by
utilizing financial engineering skills, a longer time is needed for the increased productivity to
be reflected in higher profits and employment growth after venture capital investments. The
lack of significant productivity spillovers from buyouts suggests that the operational and
financial improvements introduced by private equity companies in buyout transactions are
more focused at reducing costs and increasing profits, but do not necessarily lead to higher
sales growth. The large impact of venture capital on productivity growth is consistent with
30
The effect of twice-lagged venture capital invested on profitability growth is larger in magnitude than the effect of lagged buyout capital invested. While a one standard deviation increase in lagged buyout invested leads to a 1.8% increase in profitability growth, a one standard deviation increase in twice-lagged venture capital invested leads to a 6% increase in profitability growth.

34
the existing evidence on venture capital that has shown a positive relationship between
venture capital and subsequent innovation (Kortum and Lerner, 2000; Mollica and Zingales,
2007). It is also consistent with the recent study of Gonzales-Uribe (2012), which shows that
venture capitalists spur innovation through a better diffusion of knowledge. Furthermore, the
larger effect on industry productivity might also be related to the absorptive capacity of the
industries receiving venture capital investment. Venture capital investments are made more
into high R&D industries, which are shown to better absorb spillovers due to higher levels of
technical knowledge and human capital in the FDI spillovers literature (Kogut and Chang,
1991).
4.1.3 Private Equity and Investment
Some of the existing studies have found that private equity companies lead to a reduction in
capital expenditures at the portfolio companies (Kaplan 1989). While this might cut costs and
increase profitability in the short-run, it raises concerns about future cash-flows being
sacrificed for short-term operational gains. While it is an important concern, studies looking
at stock market performance of private equity-backed companies that are taken public
provide evidence for superior returns, which indirectly suggests that long-run prospects are
not hurt. In line with this argument, I estimate a panel VAR similar to Love and Zicchino
(2006) to examine how industry-level investment is affected by private equity. Indeed, I put
growth in free cash flow, growth in capital expenditures, growth in market-to-book, and the
private equity measure into the same system of equations to detect the dynamic relationship
between industry-level investment and private equity. Free cash flow is included to control

35
for the sensitivity of investment to the availability of internal financing, while market-to-
book is used as a proxy for investment opportunities.
Table 7 presents the results. The first column shows that the amount of private equity
capital is not related to past values of cash flow, capital expenditure, and market-to-book
growth, while the result about the persistence of private equity capital still holds. The second
column shows that growth in free cash flows at time t is not related to private equity
investments and capital expenditures at time t-1 after controlling for cash flow growth at time
t-1 together with country-industry and year fixed effects.
The result on the impact of private equity capital on industry investment is provided
in the third column. As expected, I find that capital expenditures grow faster following
private equity investments within an industry. This finding suggests that technology
spillovers resulting from private equity companies lead to faster growth in capital
expenditures at externality-receiving firms. To keep up with the new technologies and
efficiency gains at the private equity-backed firms, the rest of the industry increases capital
expenditures which would potentially lead to overall industry growth in the long-run. As
expected, lagged cash flow growth is also found to be positively related to capital
expenditure growth suggesting that availability of internal financing facilitates investment as
found in earlier studies about cash-flow sensitivity of investment. Furthermore, capital
expenditure growth is also related to past values of market-to-book showing that investment
increases in response to higher investment opportunities.
Despite the existing evidence on the negative impact of private equity on capital
expenditures at the firm-level, I find that capital expenditures increase subsequent to private
equity investments. This finding is important as it suggests that even if capital expenditures
36
are cut at target companies for cost reduction purposes, other companies within the same
industry increase capital expenditures to compete with the private equity-backed firms. As
such, the increased level of investment in the industry will facilitate overall industry growth.
This finding also supports the study by Harford and Kolasinski (2012), which finds that
private equity transactions do not lead to underinvestment at the target companies, as well as
Lerner et al. (2008) which provides evidence on increased portfolio company patent
productivity as an example of long-run investment after buyout transactions.
4.2 Spillovers across Countries and Industries
The results so far suggest that there are productivity spillovers from private equity-backed
companies in an industry to the public firms within the same industry. How much
improvement private equity companies provide for their portfolio companies and how well
the resulting positive externalities in turn are absorbed by the other firms within the same
industry might be different depending on the characteristics of the country as well as the
industry. In this section, I explore the cross-section of countries and industries to investigate
where the spillovers from private equity-backed companies are most effective.
4.2.1 Spillovers from Private Equity Conditional on Legal Strength
Starting with the seminal work of La Porta et al. (1998) that studies the interaction of law and
finance, many studies have examined the relationship between the legal environment,
financial development and growth of a country. Regarding private equity investments, Lerner
and Schoar (2005) have shown that the legal origin and level of law enforcement affect the
type and value of private equity transactions. One could argue that in countries with a weaker

37
legal endowment, private equity companies can add value by mitigating contractual
shortcomings with private contracting; however, the study by Balcarcel et al. (2012) show
that reliability in the legal environment limits the flow of private equity capital into countries
with less developed legal systems at the first place. So, although private equity might be
more beneficial to countries with weaker legal institutions, the weak legal environment
discourages private equity investment.31
Governance engineering is one of the main channels
private equity companies add value at the portfolio companies. Cumming and Walz (2009)
find that private equity companies have higher returns in countries with stronger legal
conditions and conclude that external corporate governance mechanisms are necessary for
private equity companies to implement more efficient governance structures at the firm level.
Furthermore, Blomstrom and Kokko (1998) discuss that efficient regulations and institutions
in a country might lead to higher spillovers from multinational corporations onto local
companies, but they also note that there is not enough evidence to make a clear conclusion
about the issue. In one of the fewer studies on this, Mansfield (1994) finds that the strength
of a country's intellectual property protection has a significant effect on FDI flows as well as
on the extent of technology transferred from U.S. firms to their foreign affiliates. This would
suggest that the implementation of new technologies and practices might be stronger in
countries with stronger intellectual property rights.
Based on these arguments, I predict that the positive impacts documented earlier
should be more pronounced in countries with stronger legal institutions as well as better
intellectual property protection. To find out if it is indeed the case and examine how the legal
31
More importantly, a weak legal environment would limit the implementation of technologies and practices that add value at the portfolio companies and lead to spillovers onto the other companies within the same industry.

38
environment impacts the effectiveness of private equity companies' impact on industry
dynamics, I explore the cross-section of countries by applying the panel VAR on subsamples.
I create subsamples based on a measure of the quality of legal institutions, and a measure of
intellectual property rights from the global competitiveness index created by the World
Economic Forum.32
The results are presented in Table 8.33
Panel A-B and C-D present the results for
countries with weak versus strong institutional quality and intellectual property rights,
respectively. The results show that the effects are more pronounced for the subsamples of
countries with stronger legal institutions and intellectual property rights. This indicates the
importance of a country's legal environment for private equity companies to facilitate
efficiency gains at their portfolio companies and create spillovers within the industry.
4.2.2 Spillovers from Private Equity Conditional on Innovative Capacity
Once positive externalities are created within an industry, it is also very important whether
the local companies are going to be capable of absorbing the spillovers. The long-established
literature on convergence in development economics argues that less developed economies
will grow faster since they have less diminishing returns to capital, and in the long-run, they
will catch-up with developed economies (Barro, 1997).34
In line with the catching-up theory,
countries, where initial inefficiencies are higher and skills are in shorter supply, would be in
32
Institutional quality index combines information on the judicial efficiency, law enforcement, corruption, investor protection, and reporting standards in a country. 33
For brevity, I only present the results for the private equity variable (the first row from Table 5); however, the estimation is identical to the earlier panel VAR. All the other results are identical: none of the industry variables at time t-1 are related to the amount of private equity capital invested at time t mitigating concerns about reverse causality. 34
For example, Blomstrom and Wolff (1994) show that the entrance of U.S. corporations into Mexico leads to a convergence in productivity levels of local Mexican firms and U.S. firms.

39
greater need of the practices and technologies introduced by the private equity companies.
Hence, industries in countries with lower technology levels might benefit more from the
entrance of private equity capital. On the other hand, productivity spillovers might not take
place in countries where starting technology levels are too low, because such companies
might be unable to provide a competitive response to private equity-backed companies, and
private equity may lead to a crowding out of existing firms. Several studies have provided
evidence on this issue suggesting that a very high level of technological gap between the
home country of multinational corporations and the host country indeed lead to smaller
spillover effects. For example, Kokko et al. (1996) find that spillovers are only absorbed by
companies that have moderate technology gaps with foreign firms.35
To study the spillovers from private equity investments in countries with different
levels of technological advancement levels, I repeat the panel VAR in subsamples of
countries created based on a measure of innovative capacity. The innovative capacity score
comes from the global competitiveness index created by the World Economic Forum.
Table 9 presents the results. Panel A and B present the results for the subsamples of
countries with very low and very high innovative capacity scores, respectively. Panel C
presents the results for the rest of the countries, which have moderate levels of innovative
capacities. As predicted, the positive impacts of private equity investments on industry
growth are only present for the countries with moderate levels of innovative capacities. There
is no statistically significant relationship between the private equity capital invested and
industry growth for countries with the highest or lowest levels of innovative capacities. These
results are consistent with the existing evidence showing that spillovers cannot be absorbed if
35
Haddad and Harrison (1991), Cantwell (1989), and Kokko (1994) also find similar results.
40
the companies are too far away from the technological level introduced by the foreign
companies.36
4.2.3 Spillovers from Private Equity Conditional on Competitiveness
Lastly, I explore the cross-section of country-industries based on the level of competition
within a country-industry. The results so far have shown that private equity investments in an
industry lead to higher profitability, employment and productivity at the public companies
within the same industry. The spillovers onto the other companies might result from copying
of best practices and technologies as well as from the competitive pressure coming from the
more efficient private equity-backed companies. Hence, the level of competition in the
industry might affect the extent of spillovers. As in the example of the Hertz buyout, the
spillover effects are expected to be higher in competitive industries, where the efficiency
gains at a private equity-backed company would put a high pressure on the other companies
to become more efficient as well. I investigate this in Table 10. It presents the main panel
VAR results on subsamples of country-industries with high versus low levels of competition.
Industry-level gross margins are used as a proxy for the level of competition with the idea
that higher margins can be charged in less competitive industries. The positive impacts on
employment, productivity and profitability are concentrated in country-industries with higher
levels of competition suggesting that the competitive pressure within an industry is indeed an
important factor leading to spillovers.
Overall, the cross-sectional findings in this section indicate that the positive impacts
of private equity capital on industry dynamics are limited to a group of countries and
36
The results are identical when I use technological readiness score from the global competitiveness index as the proxy for the absorptive capacity of a country.

41
industries with specific characteristics. Two main conclusions can be made from the cross-
country analysis. First, stronger legal institutions are needed for the positive spillovers to be
created by the private equity companies. Second, the spillover effects are most effective in
countries with moderate levels of technological development as these countries are not only
still in need of the new practices and technologies introduced by the private equity
companies, but also have the sufficient level of starting technological development that
enables them to absorb the spillovers. I also investigate if the level of competition has an
impact on the effect of spillovers and find that the positive impacts of private equity
investments are concentrated in more competitive country-industries suggesting that the
competitive pressure is an important channel for spillovers.
Besides providing evidence consistent with the existing literature on spillovers, the
results in this section also provide support for a causal effect of private equity investments on
industry dynamics. All the cross-sectional results are consistent with the argument that
private equity companies lead to positive externalities and spillovers within the industry,
which are reflected in higher employment, profitability and productivity growth. It is hard to
come up with other explanations that would have the same predictions about the results for
the cross-section of countries and industries, other than the causal link from private equity
investments to industry spillovers.
4.3 Private Equity and the Financial Economy
The analysis so far has focused on how the real side of the economy is affected by private
equity exploring changes in industry dynamics subsequent to private equity investments. In
this section, I study the impact of private equity capital on two financial variables: leverage

42
and stock returns. In buyout transactions, private equity companies typically buy their target
companies with high levels of debt, which might lead to higher financial distress costs and
bankruptcy.37
On the other hand, higher leverage can also be a source of value creation at the
target companies by providing better incentives for management as well as tax benefits.
Jenkinson and Stucke (2011) find that leveraged buyouts generate significant value by higher
tax shields. Similarly, Guo et al. (2011) argue that about 30% of returns of private equity
transactions are due to the tax benefits of higher leverage. Thus, it is important to examine
the implication of buyout capital for the overall debt level of an industry.
Additionally, the evidence so far has provided evidence for industry-wide
performance improvements following private equity investments. However, it is not shown
what the implications are for share values. If these improvements are reflected in investor
beliefs, we should observe a positive association between industry returns and the amount of
private equity capital invested. A line of the private equity literature has provided evidence
that private equity companies chase returns, i.e. they invest into industries/companies that
recently had high stock market returns. Hence, the same concerns about identifying which
way the direction of causality goes between private equity capital invested and stock market
returns still applies.
I estimate a panel VAR model with the amount of private equity invested, growth in
industry-wide debt, and growth in the value of industry return index to examine the dynamic
relationship between private equity and the two financial variables. Table 11 presents the
results of the estimation of the system with GMM. Panel A and B have the results for buyout
37
The existing evidence on this issue is mixed. Andrade and Kaplan (1998) find that 23% of large public to private transactions defaulted during the 1980s. Kaplan and Stromberg (2009), on the other hand, find that the average default rate of leveraged buyouts is lower than the average default rate for all U.S. corporate bond issuers.

43
and venture capital, respectively. The first columns of Panel A (B) show that the amount of
buyout (venture) capital invested at time t is not related to debt growth at time t-1. The
insignificant coefficient on lagged industry returns in the first columns of both panels
contradicts the existing evidence that private equity companies chase returns and eliminates
concerns about reverse causality.
The second column in Panel A shows that buyout capital leads to higher growth in
industry-wide debt and concerns about reverse causality are again eliminated as per the first
column. This result is not surprising given the fact that private equity companies finance
buyout transactions with high levels of debt. High levels of debt at the private equity-backed
companies force the other companies in the industry to lever up as well, and hence industry-
wide debt grows faster following the private equity investment.38
Although higher debt levels
would create value through tax shields, it is hard to make any arguments about the overall
impact without having information on the risk associated with financial distress and
bankruptcy at the industry. However, assuming that adverse effects of bankruptcy costs
would be reflected in stock prices, looking at stock returns would be suggestive. The third
column in Panel A indeed shows that buyout investments in an industry lead to lower stock
values. This result indicates that the increased debt levels in the industry are not welcomed
by the investors leading to lower valuations.39
The second column of Panel B shows that
38
Another interpretation of the increase in debt levels could be that the inflow of private equity capital into an country-industry is correlated with other capital flows, which would make debt financing cheaper and lead to higher debt within the industry. However, that would suggest the same increase after venture capital transactions as well, which is not the case as Panel B shows. 39
This is surprising given the earlier results about industry-wide improvements in real performance. To see if/when the gains in operating performance are reflected in stock values, I repeat the panel VAR with 2- and 3-year lags. Stock values are also negatively impacted by the amount of buyout capital invested at time t-2, while they are positively related to the amount of buyout capital at time t-3. This suggests that investors initially dislike the inflow of buyout capital into the industry, which leads to lower stock values; however, the improvements in operating performance are later reflected in higher stock values.
44
there is no significant relationship between the amount of venture capital invested, and
industry debt. The third column of Panel B, however, shows that there is a positive impact of
venture capital on industry stock returns suggesting that investors positively respond to the
entrance of venture capital into an industry. This result shows that the productivity spillovers
from private equity-backed companies to the other companies within the same industry also
have implications on firm value, for the case of venture capital. However, it should be noted
that I am looking at raw, not risk-adjusted, returns. If venture capital investments make the
industry riskier, the increased returns might be the result of investors requiring higher returns
for increased levels of risk.40
Hence, the return result should be interpreted with caution.
Overall, two conclusions can be drawn from the results in this section. First, the high
debt levels of private equity backed-companies in buyout transactions lead to an increase in
debt levels in the industry as a whole. Assuming the increase in leverage moves the industries
closer towards the optimal capital structure, this might be one of the channels that private
equity companies add operational value. However, the negative relationship between buyout
capital invested and stock returns suggests an adverse implication for share values. Second,
the positive externalities created by the private equity companies in an industry do not only
increase productivity, employment and profitability for public companies within the same
industry, but also lead to higher stock values in the case of venture capital investments.
Higher stock values indicate that the practices private equity companies implement to
increase profits do not necessarily sacrifice long-term firm values. This finding expands the
existing studies which have found evidence for superior stock market performance at private
equity-backed companies that are taken public again (Cao and Lerner 2009) by providing
40
Bernstein et al. (2012) provide evidence that industries with private equity transactions are not more exposed to aggregate shocks.

45
evidence that the value implications are not limited to the company receiving the investment,
but also spill over within the industry.41
4.4 Robustness Checks
One concern about the findings of the paper would be a market-timing argument. One could
argue that private equity companies have informational advantages and superior foresight
about an industry's prospects. In that case, they would invest in a specific country-industry
that they predict would grow, and that might be driving the results documented in this paper.
The panel VAR controls for this to the extent that the expectations of the private equity
companies about the industry growth are shaped by how the industry did in the past.
However, it would be impossible to fully exclude an information story where the private
equity companies have foresight and enter into an industry based on superior information as
their expectations may not be perfectly correlated with the industry performance in the past.
Nevertheless, the discussion in this section suggests that market-timing cannot be the only
driver of the findings of the paper. First, it is not very clear how the private equity companies
would have perfect foresight about an industry during the time of entry. It is plausible to
think that the informational advantage of the private equity companies would be stronger
during exits, when compared to the timing of entry, as they have been at the specific portfolio
company for a longer period.42
41
As a robustness check, I repeat the analysis in this section on Asian countries only, since private equity companies typically acquire minority stakes in those countries due to strict regulations. Indeed, the results are quite different. I find that there is no significant effect on industry debt growth, which indicates that the minority stake buyouts are not highly levered as regular buyouts. Consistent with that, I do not find that stock returns are lower; they indeed are higher after private equity investments in Asia. 42
The average holding period of a portfolio company is typically 4-5years.

46
However, existing evidence suggests that private equity companies are not timing the market
even when exiting a portfolio company (Ball et al. 2011). Given that there is very little
evidence of timing for exists, it is even harder to think that they are perfectly timing the
market when entering into an industry, which is when their informational advantages should
be smaller.
Second, suppose that they can perfectly time the market and invest into an industry
when they think the industry is going to do well. This is consistent with the documented
faster growth in employment, profitability and productivity. However, if they have superior
foresight and are able to time the market industry stock returns also should be higher
following their investments. The results in Table 11, nevertheless, show that stock returns are
lower subsequent to buyout capital being invested in an industry. This is inconsistent with a
market timing explanation, which would predict the market returns to go up if they were able
to perfectly time the market.
Third, the cross-sectional findings presented in Section 5.4 are all consistent with
spillover effects from private equity-backed companies to the publicly listed firms within the
same industry, while they are not with a market-timing explanation. I provide evidence that
the results are concentrated in countries with a stronger legal environment and moderate
levels of technological capacity, as well as in industries with a higher level of competition. It
is hard to come up with these cross-sectional predictions when considering a market-timing
hypothesis. Why would the private equity companies have informational advantages in
countries with better legal institutions and be able to time the market, whereas they cannot do
the same in other counties? If anything, it would be more plausible to think that informational
advantages of the private equity companies should be stronger in countries with weaker legal

47
institutions where informational asymmetries are higher. This would predict that the positive
effects should be more pronounced in countries with a weaker legal environment, while I
find the opposite. Furthermore, the technological capacity result is also consistent with
spillovers being most effective in places, where there is both some need for technological
advancement and also some level of existing technological advancement that provides the
capacity to absorb. It is again hard to think why private equity companies would be able to
time the market in countries with a moderate level of technological capacity, but not in
others. Lastly, spillovers are predicted to be stronger in more competitive industries as the
competitive pressure from the more efficient private equity-backed companies forces the
other companies to become more efficient as well. This is indeed what the results in Table 10
present and it is again hard to explain why market timing would work for competitive
country-industries, but not for others. While none of the above explanations would alone be
sufficient to fully exclude a market timing hypothesis, when put together they support a
causal effect where private equity investments lead to spillovers resulting in superior industry
performance.
One of the shortcomings of the Burgiss data is that its coverage is relatively weak
before 1995 (Brown et al. 2012). So, one might be concerned that those years might bias the
results in the paper. Nonetheless, all the results are identical when years before 1995, after
which Burgiss' coverage is more comprehensive, are dropped from the sample.
The results are also robust to a different aggregation of the industry level. When industry
measures and private equity investments are aggregated at a broader level, which results in 9
industries instead of 19, the results stay the same. This provides further support that market

48
timing is not the only driver of the results as it is less plausible to think that private equity
companies are able to have perfect foresight for industries that are defined more broadly.
Another concern might be that the spillovers cannot take place within a year, although the
Hertz example showcases that they indeed can happen over a short period of time. To address
this, I repeat the analysis in the paper using VAR's with two- and three-year lags. The main
results do not change and the strongest effect is indeed in the first year following the private
equity investment.43
As the U.S. and the U.K. receive a large portion of private equity capital invested, one
might be concerned that the results in the paper are driven by these two countries only.
Nevertheless, when I repeat all the analysis excluding the U.S. and the U.K., I find that all
the main results stay the same.
Lastly, the results are also robust to using different specifications instead of the VAR.
Results are very similar when single equations with the industry growth variables as the
dependent variable are separately estimated using pooled OLS. When estimating models with
OLS, I also include a measure of exogenous growth opportunities, similar to Bekaert et al.
2007, to control for the private equity companies' expectations about the country-industry's
prospects. The measure is the world-wide price earnings ratio for an industry, which should
capture growth options, including expectations about the future, for a specific industry in a
country. The results stay the same when this measure is included in the specifications.
43
It should also be noted that a 1-year VAR will still have responses past 1 year by nature of how the systems are autoregressive, i.e. shocks will continue to propagate.
5. Conclusion
Private equity investments have risen dramatically during the last two decades as Figure 1
shows; not only in developed countries but in developing countries as well. While
researchers have explored how private equity firms impact their portfolio companies, it is
surprising that there is no evidence on the implications of private equity for the economy as a
whole. The well-established spillover literature in economics provides evidence that
productivity spillovers exist within industries (Blomstrom and Kokko, 1998), which I take as
the motivation to explore spillovers from private equity-backed companies to the rest of the
industry. Using a novel dataset on global private equity investments in 19 industries across
48 countries, I study the impact of private equity on industry dynamics. By focusing on
aggregate industry measures of publicly listed companies, I am able to identify the
productivity spillovers from private equity-backed companies to the other companies within
the same industry.
The first part of the paper looks at the real economy. I find that employment growth,
profitability growth, and labor productivity growth all increase across the public companies
in an industry following private equity investments. Additionally, I find that industry-level
capital expenditures grow faster as well. Considering the endogeneity of the decision of
private equity companies to invest into a specific industry, I apply a panel VAR. While
treating all the variables in the system as endogenous, the model also allows for fixed effects
to control for individual heterogeneity at the country-industry level. Concerns about reverse
causality, stemming from past industry performance affecting private equity investments, are
eliminated as I do not find evidence that past values of industry dynamics are significantly

50
related to the amount of private equity capital a country-industry receives. The
improvements in industry-level performance documented in this paper are consistent with an
interpretation that the companies receiving private equity capital become more efficient and
put pressure on the other companies within the same industry, which leads to overall
performance gains among the public companies within the industry. As such, while providing
novel evidence on industry spillovers from private equity onto industries, my findings are
also consistent with the existing evidence on the impact of private equity on firm-level
performance, which finds both profitability (Kaplan 1989, Smith 1990, Guo et al. 2011) and
productivity (Lichtenberg and Siegel 1990, Davis et al. 2009) increases following buyout
transactions. The finding that capital expenditures also increase suggests that private equity
owners do not sacrifice long-term value for short-term profits, which is consistent with the
results in Harford and Kolasinski (2012).
Next, I examine how the effects of private equity on industry dynamics are different
in the cross-section of countries and industries. I find that the impacts on industry growth are
more pronounced in the subsample of countries with stronger institutions and intellectual
property rights suggesting that private equity companies need a strong legal environment to
be able to implement governance practices that lead to more efficient portfolio companies. I
also find that the positive effects are concentrated in countries with moderate levels of
innovative capacities. Countries with very high or very low levels of innovative capacities do
not experience the spillovers from private equity investments as a very high level of
innovative capacity means that there is less need for new technologies, whereas a very low
level means that the technological gap is so big that spillovers cannot be absorbed. These
results are largely consistent with the literature that examines spillovers from foreign direct

51
investments onto local industries and finds that companies with moderate levels of
technological advancement are better absorbers of productivity spillovers (Khogut and Chang
1991, Kokko 1994, Kokko et al. 1996). The spillover effects are also found to be
concentrated in country-industries with higher levels of competition. Overall, the cross-
sectional results further indicate a causal effect where private equity investments lead to
higher industry growth through spillovers, because it is hard to come up with alternative
explanations that have similar cross-sectional predictions.
Lastly, I investigate what the implications of private equity are for the financial
economy. I find that debt levels increase in industries that recently received private equity
capital, which suggests that financial structures used by the private equity firms also spill
over within the industry causing other firms to lever up. This indicates that a more efficient
capital structure is one of the main channels through which private equity firms add value at
their portfolio companies. This is consistent with studies that have shown evidence for large
gains from tax shields (Jenkinson and Stucke, 2011) as well as studies that have found that
higher debt levels reduce agency problems and prevent overinvestment (Harford and
Kolasinski, 2012). Additionally, I provide evidence that venture capital leads to higher
industry stock returns suggesting that the spillovers from venture capital to the other firms
within the same industry also lead to higher firm values.
The findings of the paper are important as they provide evidence on the impact of
private equity on industry dynamics, rather than individual companies, which is an
unexplored area. The private equity industry has been criticized, especially by the popular
press and labor unions, regarding their impact on the companies they invest in. By providing
evidence on the positive externalities created by private equity investments within an

52
industry using a sample including both developed and developing countries, this paper
presents a more complete picture about the implications of private equity for the global
economy. In a time when the recent global financial crisis pushed policy makers to more
closely look at financial institutions, including the private equity industry, this paper presents
evidence for policy makers that are trying to decide whether to limit or promote private
equity capital. Future research on this issue will more clearly show what the specific
channels of spillovers from private equity are and how policy makers should react to enhance
the positive impacts of private equity investments globally.
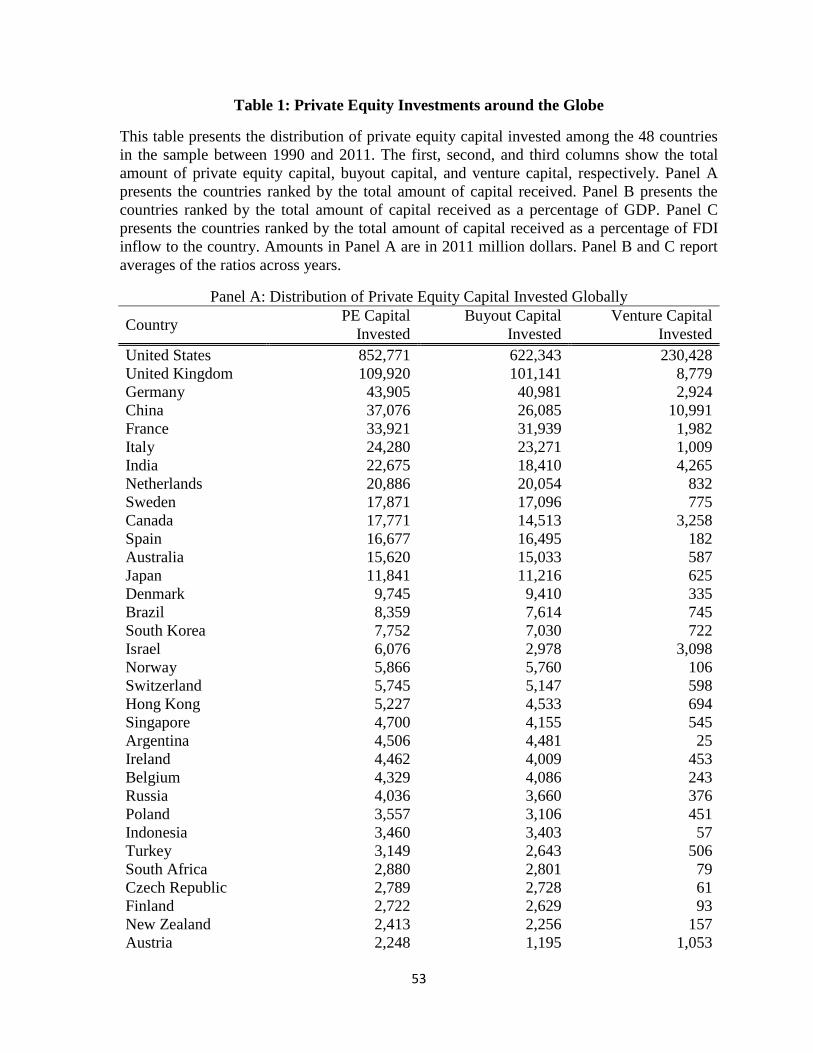
53
Table 1: Private Equity Investments around the Globe
This table presents the distribution of private equity capital invested among the 48 countries
in the sample between 1990 and 2011. The first, second, and third columns show the total
amount of private equity capital, buyout capital, and venture capital, respectively. Panel A
presents the countries ranked by the total amount of capital received. Panel B presents the
countries ranked by the total amount of capital received as a percentage of GDP. Panel C
presents the countries ranked by the total amount of capital received as a percentage of FDI
inflow to the country. Amounts in Panel A are in 2011 million dollars. Panel B and C report
averages of the ratios across years.
Panel A: Distribution of Private Equity Capital Invested Globally
Country PE Capital
Invested
Buyout Capital
Invested
Venture Capital
Invested
United States 852,771 622,343 230,428
United Kingdom 109,920 101,141 8,779
Germany 43,905 40,981 2,924
China 37,076 26,085 10,991
France 33,921 31,939 1,982
Italy 24,280 23,271 1,009
India 22,675 18,410 4,265
Netherlands 20,886 20,054 832
Sweden 17,871 17,096 775
Canada 17,771 14,513 3,258
Spain 16,677 16,495 182
Australia 15,620 15,033 587
Japan 11,841 11,216 625
Denmark 9,745 9,410 335
Brazil 8,359 7,614 745
South Korea 7,752 7,030 722
Israel 6,076 2,978 3,098
Norway 5,866 5,760 106
Switzerland 5,745 5,147 598
Hong Kong 5,227 4,533 694
Singapore 4,700 4,155 545
Argentina 4,506 4,481 25
Ireland 4,462 4,009 453
Belgium 4,329 4,086 243
Russia 4,036 3,660 376
Poland 3,557 3,106 451
Indonesia 3,460 3,403 57
Turkey 3,149 2,643 506
South Africa 2,880 2,801 79
Czech Republic 2,789 2,728 61
Finland 2,722 2,629 93
New Zealand 2,413 2,256 157
Austria 2,248 1,195 1,053
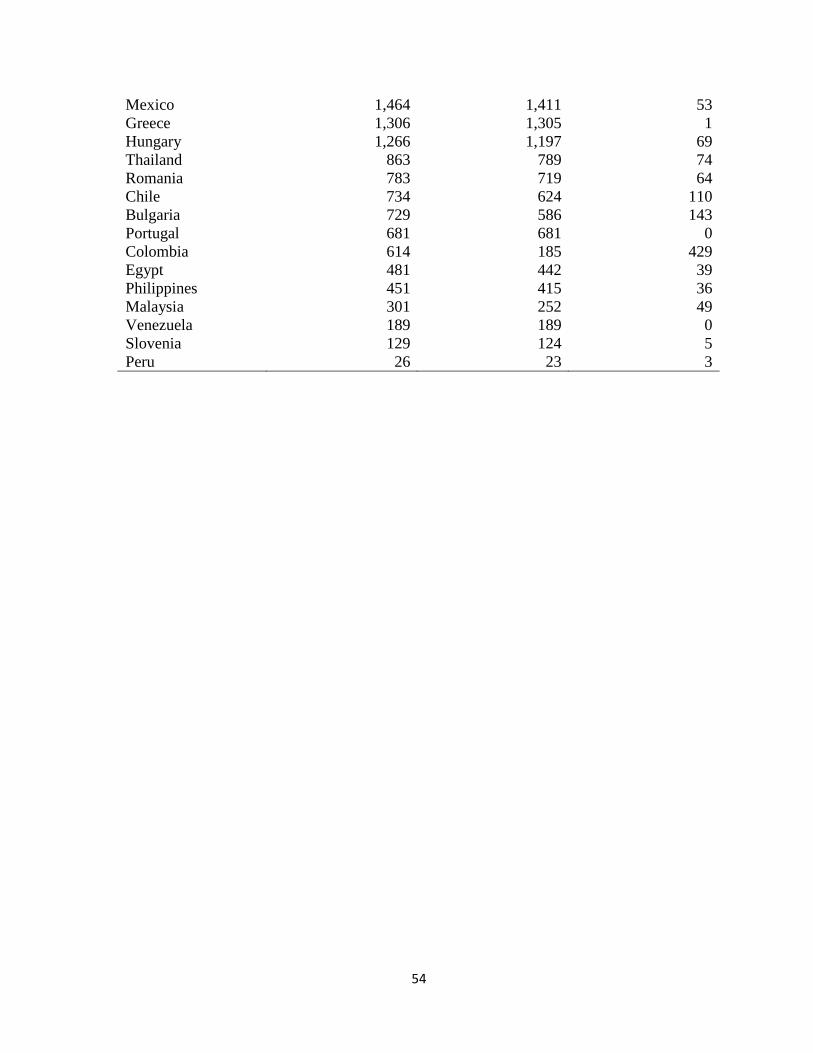
54
Mexico 1,464 1,411 53
Greece 1,306 1,305 1
Hungary 1,266 1,197 69
Thailand 863 789 74
Romania 783 719 64
Chile 734 624 110
Bulgaria 729 586 143
Portugal 681 681 0
Colombia 614 185 429
Egypt 481 442 39
Philippines 451 415 36
Malaysia 301 252 49
Venezuela 189 189 0
Slovenia 129 124 5
Peru 26 23 3

55
Panel B: Private Equity Capital Received as a % of GDP
Country PE Capital
as a % of GDP
Buyout Capital
as a % of GDP
Venture Capital
as a % of GDP
United States 0.360% 0.262% 0.098%
United Kingdom 0.299% 0.274% 0.025%
Sweden 0.278% 0.266% 0.012%
Denmark 0.257% 0.248% 0.009%
Netherlands 0.224% 0.215% 0.009%
Ireland 0.185% 0.139% 0.046%
Israel 0.185% 0.088% 0.096%
Bulgaria 0.177% 0.142% 0.035%
Singapore 0.171% 0.148% 0.023%
Czech Republic 0.161% 0.157% 0.004%
New Zealand 0.142% 0.139% 0.003%
Norway 0.138% 0.136% 0.002%
Australia 0.134% 0.128% 0.006%
India 0.129% 0.106% 0.023%
Spain 0.109% 0.108% 0.001%
Hong Kong 0.107% 0.093% 0.014%
France 0.106% 0.100% 0.006%
Canada 0.100% 0.081% 0.019%
Hungary 0.100% 0.094% 0.006%
Germany 0.100% 0.093% 0.007%
Italy 0.095% 0.091% 0.004%
Switzerland 0.094% 0.084% 0.010%
Finland 0.088% 0.085% 0.003%
Belgium 0.078% 0.074% 0.004%
South Africa 0.077% 0.075% 0.002%
Poland 0.071% 0.060% 0.011%
Argentina 0.071% 0.070% 0.001%
Romania 0.069% 0.061% 0.008%
China 0.064% 0.045% 0.019%
Indonesia 0.062% 0.061% 0.001%
South Korea 0.053% 0.048% 0.005%
Austria 0.048% 0.026% 0.022%
Brazil 0.046% 0.042% 0.004%
Russia 0.045% 0.041% 0.004%
Turkey 0.039% 0.033% 0.006%
Greece 0.038% 0.038% 0.000%
Chile 0.036% 0.032% 0.004%
Thailand 0.027% 0.024% 0.003%
Portugal 0.025% 0.025% 0.000%
Slovenia 0.023% 0.022% 0.001%
Philippines 0.023% 0.021% 0.002%
Colombia 0.019% 0.006% 0.013%
Egypt 0.015% 0.014% 0.001%

56
Malaysia 0.013% 0.010% 0.003%
Mexico 0.011% 0.011% 0.000%
Japan 0.011% 0.010% 0.001%
Venezuela 0.007% 0.007% 0.000%
Peru 0.002% 0.002% 0.000%

57
Panel C: Private Equity Capital Received as a % FDI Inflow
Country PE Capital
as a % of FDI
Buyout Capital
as a % of FDI
Venture Capital
as % of FDI
United States 22.88% 16.61% 6.27%
Denmark 12.53% 12.19% 0.34%
Germany 10.42% 9.05% 1.37%
South Korea 9.91% 9.28% 0.63%
Netherlands 7.69% 7.59% 0.10%
Finland 6.93% 6.87% 0.06%
United Kingdom 6.63% 6.03% 0.60%
India 5.35% 4.55% 0.80%
Israel 5.21% 2.33% 2.88%
South Africa 5.00% 4.93% 0.07%
Greece 4.84% 4.84% 0.00%
Italy 4.78% 4.48% 0.30%
Sweden 4.66% 4.40% 0.26%
Norway 4.03% 3.95% 0.08%
Indonesia 3.64% 2.35% 0.99%
New Zealand 3.00% 2.94% 0.06%
Argentina 3.00% 2.96% 0.04%
Czech Republic 2.97% 2.88% 0.09%
Japan 2.95% 2.76% 0.19%
Spain 2.56% 2.52% 0.04%
France 2.53% 2.35% 0.18%
Canada 2.30% 1.80% 0.50%
Australia 2.26% 2.14% 0.12%
Philippines 2.09% 1.98% 0.11%
Switzerland 1.90% 1.73% 0.17%
Austria 1.21% 0.60% 0.61%
Portugal 1.21% 1.21% 0.00%
Singapore 1.20% 1.04% 0.16%
Poland 1.18% 0.85% 0.33%
Turkey 1.10% 0.88% 0.22%
China 1.10% 0.79% 0.31%
Brazil 1.05% 0.96% 0.09%
Romania 1.02% 0.83% 0.19%
Bulgaria 1.00% 0.74% 0.26%
Ireland 0.95% 0.80% 0.15%
Thailand 0.68% 0.59% 0.09%
Hungary 0.67% 0.64% 0.03%
Hong Kong 0.59% 0.50% 0.09%
Russia 0.54% 0.53% 0.01%
Slovenia 0.51% 0.48% 0.03%
Belgium 0.42% 0.40% 0.02%
Mexico 0.39% 0.37% 0.02%
Malaysia 0.38% 0.31% 0.07%

58
Chile 0.37% 0.34% 0.03%
Venezuela 0.33% 0.33% 0.00%
Egypt 0.30% 0.27% 0.03%
Colombia 0.11% 0.11% 0.00%
Peru 0.03% 0.02% 0.01%

59
Table 2: Private Equity Investments across Industries
This table presents the industry distribution of total private equity capital invested globally
between 1990 and 2011. Industry classifications are at Industry Classification Benchmark’s
super-sector level. Column 1 reports values for total private equity, Column 2 for buyout, and
Column 3 for venture capital. Amounts are in 2011 billion dollars, and provide the total
amount of capital invested into a specific industry over the sample period.
1 2 3
Industry
PE Capital
Invested
($bn)
Buyout Capital
Invested
($bn)
Venture Capital
Invested
($bn)
Technology 258.57 124.78 133.78
Industrial Goods & Services 188.49 173.99 14.50
Health Care 168.30 104.22 64.07
Retail 120.82 106.93 13.89
Media 102.06 94.01 8.04
Financial Services 78.78 69.85 8.93
Travel & Leisure 65.32 62.99 2.33
Telecommunications 64.95 51.92 13.03
Personal & HH Goods 53.90 50.76 3.14
Food & Beverage 33.83 32.13 1.70
Oil & Gas 32.13 27.16 4.98
Insurance 27.39 26.32 1.08
Chemicals 26.91 25.74 1.16
Construction & Materials 25.70 24.34 1.36
Real Estate 21.76 20.37 1.39
Utilities 20.96 19.04 1.92
Automobiles & Parts 19.29 17.69 1.60
Banks 17.08 15.79 1.29
Basic Resources 11.63 11.04 0.59

60
Table 3: Descriptive Statistics
This table presents summary statistics for the industry and country-level variables in Panel A
and B, respectively. Variable definitions are in Table 12. Private equity, buyout, and venture
capital invested are measured as a percentage of industry sales. Private equity, buyout, and
venture capital invested with a plus provide summary statistics for the PE variables excluding
the country-industry-years with no investment. Growth variables are measured as log
differences. Industry growth variables are winsorized at the bottom and top 5% of the
distribution. Summary statistics are in percentages.
Panel A: Industry-level
Variable N Mean Median Std. Dev.
PE Capital Invested 11,764 0.97 0.00 7.06
Buyout Capital Invested 11,764 0.77 0.00 5.94
Venture Capital Invested 11,764 0.20 0.00 2.98
PE Capital Invested+ 4,071 2.81 0.23 11.79
Buyout Capital Invested+ 3,579 2.54 0.24 10.56
Venture Capital Invested+ 1,994 1.72 0.13 8.50
Employment Growth 11,764 7.07 2.44 16.24
Profit Margin Growth 11,764 0.77 0.15 47.86
Productivity Growth 11,764 6.55 7.09 20.95
CAPEX Growth 10,459 9.86 7.61 38.39
Industry Returns 10,514 9.81 12.19 21.43
Debt Growth 9,052 14.05 9.42 34.54
Panel B: Country-level
Variable N Mean Median Std. Dev.
GDP Growth 1,004 2.23 2.53 3.79
Stocks Traded to GDP 975 47.95 22.49 71.35
Private Credit to GDP 983 80.72 76.48 52.03

61
Table 4: Univariate Comparisons
This table shows that public companies in country-industries with more private equity
investments on average have higher growth. The table presents mean (median) comparisons.
Columns 1 and 2 present means (medians), and Column 3 presents p-values for the
difference in means (medians) using a t-test (Wilcoxon rank-sum test) in both Panels. Panel
A compares means (medians) of country-industry-years with and without private equity
capital. Panel B compares means (medians) for country-industry-years with high versus low
amounts of private equity capital among the country-industry-years with non-zero private
equity investments. Employment growth is the log difference in industry-level employment
for public firms between time t and t-1. Profit margin growth is the log difference in
industry-level net profits over sales for public firms between time t and t-1. Productivity
growth is the log difference in industry-level sales per employee for public firms between
time t and t-1. CAPEX growth is the log difference in industry-level capital expenditures for
public firms between time t and t-1. Industry returns is the log difference in the value of the
industry stock return index between time t and t-1. Debt growth is the log difference in
industry-level net debt for public firms between time t and t-1. Stocks traded to GDP is the
total value of stocks traded in the country as a percentage of GDP. Private credit to GDP is
the total credit in the country as a percentage of GDP.
Panel A: PE versus NON-PE Country-Industries-Years
1 2 3
Variable PE NON-PE
P-Value
Mean (Median)
Difference
Employment Growth (%) 7.55 (3.78) 6.81 (1.69) 0.02 (0.00)
Profit Margin Growth (%) 1.74 (0.97) 0.26 (0.00) 0.09 (0.07)
Productivity Growth (%) 6.09 (6.28) 6.80 (7.59) 0.08 (0.01)
CAPEX Growth (%) 9.22 (7.94) 10.20 (11.66) 0.30 (0.92)
Industry Returns (%) 9.54 (13.00) 9.96 (11.66) 0.50 (0.88)
Debt Growth (%) 14.01 (8.95) 14.07 (9.74) 0.95 (0.98)
GDP Growth (%) 2.05 (2.01) 2.23 (2.34) 0.01 (0.00)
Stocks Traded to GDP (%) 101.99 (75.47) 46.46 (25.53) 0.00 (0.00)
Private Credit to GDP (%) 117.44 (113.19) 86.72 (82.91) 0.00 (0.00)
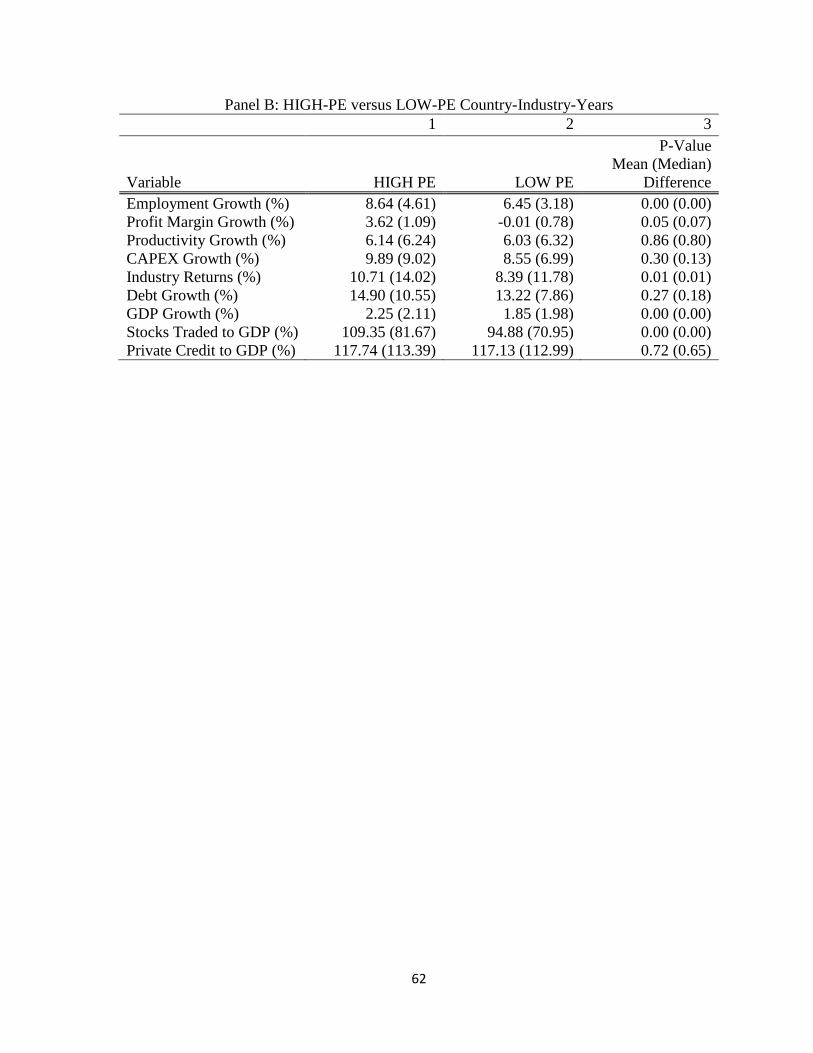
62
Panel B: HIGH-PE versus LOW-PE Country-Industry-Years
1 2 3
Variable HIGH PE LOW PE
P-Value
Mean (Median)
Difference
Employment Growth (%) 8.64 (4.61) 6.45 (3.18) 0.00 (0.00)
Profit Margin Growth (%) 3.62 (1.09) -0.01 (0.78) 0.05 (0.07)
Productivity Growth (%) 6.14 (6.24) 6.03 (6.32) 0.86 (0.80)
CAPEX Growth (%) 9.89 (9.02) 8.55 (6.99) 0.30 (0.13)
Industry Returns (%) 10.71 (14.02) 8.39 (11.78) 0.01 (0.01)
Debt Growth (%) 14.90 (10.55) 13.22 (7.86) 0.27 (0.18)
GDP Growth (%) 2.25 (2.11) 1.85 (1.98) 0.00 (0.00)
Stocks Traded to GDP (%) 109.35 (81.67) 94.88 (70.95) 0.00 (0.00)
Private Credit to GDP (%) 117.74 (113.39) 117.13 (112.99) 0.72 (0.65)

63
Table 5: Private Equity and the Real Economy
This table presents the results of the panel VAR estimation of equation 1 from Section 4,
where the X vector consists of the private equity capital invested, industry-level employment
growth, labor productivity growth and profitability growth. The system is estimated with
system GMM. Variable definitions are in Table 12. Country-industry and time fixed effects
are included in the estimation as defined in Section 4. Reported numbers show the
coefficients of regressing the column variables on the lags of the row variables.
Heteroskedasticity adjusted standard errors are in parentheses. *, ** and *** denote
statistical significance at 10%, 5% and 1% respectively.
PE Capital
Invested
Employment
Growth
Productivity
Growth
Profitability
Growth
PE Capital Invested (t-1) 0.1564**
(0.0668)
0.1186**
(0.5507)
0.1770***
(0.0566)
0.3731**
(0.1404)
Employment Growth (t-1) 0.0021
(0.0027)
0.1308***
(0.0132)
-0.0070
(0.0163)
-0.0484
(0.0424)
Productivity Growth (t-1) 0.0012
(0.0021)
0.0657***
(0.0097)
-0.0534***
(0.0129)
-0.0196
(0.0328)
Profitability Growth (t-1) -0.0002
(0.0007)
0.0062**
(0.0027)
0.0027
(0.0035)
-0.2282***
(0.0116)
N Obs. 10,284

64
Table 6: Buyout versus Venture Capital
This table repeats the estimation presented in Table 5, separately for buyout and venture
capital. Panel A and B present the results for buyout and venture capital, respectively.
Variable definitions are in Table A2. Country-industry and time fixed effects are included in
the estimation as defined in Section 4. Reported numbers show the coefficients of regressing
the column variables on the lags of the row variables. Heteroskedasticity adjusted standard
errors are in parentheses. *, ** and *** denote statistical significance at 10%, 5% and 1%
respectively.
Panel A: Buyout
Buyout
Capital
Invested
Employment
Growth
Productivity
Growth
Profitability
Growth
Buyout Capital Invested (t-1) 0.1551*
(0.0876)
0.1149**
(0.0518)
0.0647
(0.0746)
0.3139*
(0.1864)
Employment Growth (t-1) 0.0007
(0.0026)
0.1309***
(0.0132)
-0.0066
(0.0163)
-0.1480
(0.1424)
Productivity Growth (t-1) -0.0003
(0.0021)
0.0657***
(0.0097)
-0.0535***
(0.0129)
-0.0197
(0.0328)
Profitability Growth (t-1) -0.0003
(0.0007)
0.0062**
(0.0027)
0.0027
(0.0035)
-0.2281***
(0.0116)
N Obs. 10,284
Panel B: Venture Capital
Venture
Capital
Invested
Employment
Growth
Productivity
Growth
Profitability
Growth
Venture Capital Invested (t-1) 0.2341**
(0.1171)
0.0605
(0.1409)
0.6887***
(0.1940)
0.5416
(0.7421)
Employment Growth (t-1) 0.0013
(0.0010)
0.1312***
(0.0132)
-0.0070
(0.0163)
-0.1476
(0.1424)
Productivity Growth (t-1) 0.0006
(0.0007)
0.0655***
(0.0097)
-0.0535***
(0.0128)
-0.0200
(0.0329)
Profitability Growth (t-1) 0.0000
(0.0002)
0.0061**
(0.0027)
0.0025
(0.0035)
-0.2283***
(0.0116)
N Obs. 10,284

65
Table 7: Private Equity and Investment
This table presents the results of the four-variable panel VAR estimation with GMM, where
the X vector consists of private equity capital invested, industry-level cash flow growth,
capital expenditures growth and market-to-book growth, similar to Love and Zicchino 2006.
Variable definitions are in Table 12. Country-industry and time fixed effects are included in
the estimation as defined in Section 4. Reported numbers show the coefficients of regressing
the column variables on the lags of the row variables. Heteroskedasticity adjusted standard
errors are in parentheses. *, ** and *** denote statistical significance at 10%, 5% and 1%
respectively.
PE Capital
Invested
Cash Flow
Growth
Capex
Growth
Market-to
book Growth
PE Capital Invested (t-1) 0.1821**
(0.0905)
0.4868
(0.7008)
0.5975**
(0.2666)
0.1429
(0.0927)
Cash Flow Growth (t-1) -0.0004
(0.0005)
-0.2926***
(0.0168)
0.0056**
(0.0025)
0.0036**
(0.0016)
Capex Growth (t-1) -0.0007
(0.0012)
0.0455
(0.0354)
-0.0764***
(0.0138)
-0.0124
(0.0104)
Market-to-book Growth (t-1) 0.0007
(0.0032)
-0.0173
(0.0832)
0.1827***
(0.0310)
-0.0819***
(0.0135)
N Obs. 7,871

66
Table 8: Spillovers from Private Equity and Legal Strength
This table repeats the analysis presented in Table 5 for subsamples of countries created based
on the level of legal strength, and reports the coefficients on the PE variable only. Panel A
and B present the results for the subsamples of countries with weak versus strong legal
institutions, respectively. Panel C and D present the results for the subsamples of countries
with weak versus strong intellectual property rights, respectively. The coefficients for the
private equity variable are presented only, but the estimation is identical to the panel VAR in
Table 5. Variable definitions are in Table 12. Country-industry and time fixed effects are
included in the estimation as defined in Section 4. Reported numbers show the coefficients of
regressing the column variables on the lags of the row variables. Heteroskedasticity adjusted
standard errors are in parentheses. *, ** and *** denote statistical significance at 10%, 5%
and 1% respectively.
Panel A: Low Institutional Quality
PE Capital
Invested
Employment
Growth
Productivity
Growth
Profitability
Growth
PE Capital Invested (t-1) 0.1309**
(0.0513)
0.1250
(0.0896)
0.1135
(0.1041)
-0.0023
(0.3177)
N Obs. 5,023
Panel B: High Institutional Quality
PE Capital
Invested
Employment
Growth
Productivity
Growth
Profitability
Growth
PE Capital Invested (t-1) 0.2826*
(0.1556)
0.1044*
(0.0631)
0.2524*
(0.1481)
0.8514***
(0.3239)
N Obs. 5,261
Panel C: Weak Intellectual Property Rights
PE Capital
Invested
Employment
Growth
Productivity
Growth
Profitability
Growth
PE Capital Invested (t-1) 0.1294*
(0.0715)
0.1224
(0.0899)
0.1192
(0.1041)
-0.0167
(0.3178)
N Obs. 4,897
Panel D: Strong Intellectual Property Rights
PE Capital
Invested
Employment
Growth
Productivity
Growth
Profitability
Growth
PE Capital Invested (t-1) 0.2795*
(0.1649)
0.1061
(0.0827)
0.2472*
(0.1379)
0.8658**
(0.4234)
N Obs. 5,387

67
Table 9: Spillovers from Private Equity and Innovative Capacity
This table repeats the analysis presented in Table 5 for three subsamples of countries created
based on a measure innovative capacity, and reports the coefficients on the PE variable only.
Panel A, B and C present the results for the subsamples of countries with lowest, highest and
moderate levels of innovative capacity. The subsample of countries with the lowest (highest)
innovative capacity includes the countries in the bottom (top) 25th
percentile. The subsample
of countries with moderate innovative capacity includes the countries that are in between the
25th
and 75th
percentile of the distribution. The coefficients for the private equity variable are
presented only, but the estimation is identical to the panel VAR in Table 5. Variable
definitions are in Table 12. Country-industry and time fixed effects are included in the
estimation as defined in Section 4. Reported numbers show the coefficients of regressing the
column variables on the lags of the row variables. Heteroskedasticity adjusted standard errors
are in parentheses. *, ** and *** denote statistical significance at 10%, 5% and 1%
respectively.
Panel A: Lowest Innovative Capacity
PE Capital
Invested
Employment
Growth
Productivity
Growth
Profitability
Growth
PE Capital Invested (t-1) 0.1527*
(0.1321)
0.0637
(0.0780)
0.0698
(0.1027)
-0.2876
(0.2999)
N Obs. 2,567
Panel B: Highest Innovative Capacity
PE Capital
Invested
Employment
Growth
Productivity
Growth
Profitability
Growth
PE Capital Invested (t-1) 0.1569*
(0.0829)
0.0922
(0.1274)
0.1188
(0.1436)
0.2157
(0.5260)
N Obs. 2,839
Panel C: Moderate Innovative Capacity
PE Capital
Invested
Employment
Growth
Productivity
Growth
Profitability
Growth
PE Capital Invested (t-1) 0.1051**
(0.0483)
0.1557*
(0.0908)
0.2505**
(0.1228)
0.8306**
(0.3763)
N Obs. 5,357

68
Table 10: Spillovers from Private Equity and Competitiveness
This table repeats the analysis presented in Table 5 for subsamples of countries created based
on the level of competition, and reports the coefficients on the PE variable only. Panel A and
B present the results for the subsamples of countries with low versus high levels of
competition, measured by the industry-level gross margins, respectively. Low (high)
competition country-industries have gross margins below (above) the median of the sample
distribution. The coefficients for the private equity variable are presented only, but the
estimation is identical to the panel VAR in Table 5. Variable definitions are in Table 12.
Country-industry and time fixed effects are included in the estimation as defined in Section
4. Reported numbers show the coefficients of regressing the column variables on the lag of
the row variable. Heteroskedasticity adjusted standard errors are in parentheses. *, ** and
*** denote statistical significance at 10%, 5% and 1% respectively.
Panel A: Low Competition
PE Capital
Invested
Employment
Growth
Productivity
Growth
Profitability
Growth
PE Capital Invested (t-1) 0.3257**
(0.1353)
0.0944
(0.1203)
-0.0241
(0.1121)
0.3246
(0.3376)
N Obs. 4,349
Panel B: High Competition
PE Capital
Invested
Employment
Growth
Productivity
Growth
Profitability
Growth
PE Capital Invested (t-1) 0.2570*
(0.1516)
0.1121*
(0.0621)
0.4932**
(0.2159)
0.6936**
(0.3056)
N Obs. 4,416

69
Table 11: Private Equity and the Financial Economy
This table presents the results of the panel VAR estimation of equation 1 from Section 4
separately for buyout and venture capital, where the X vector consists of private equity
capital invested, industry-level debt growth, and industry returns. The system is estimated
with system GMM. Panel A and B present the results for buyout and venture capital,
respectively. Variable definitions are in Table 12. Country-industry and time fixed effects are
included in the estimation as defined in Section 4. Reported numbers show the coefficients of
regressing the column variables on the lags of the row variables. Heteroskedasticity adjusted
standard errors are in parentheses. *, ** and *** denote statistical significance at 10%, 5%
and 1% respectively.
Panel A: Buyout
Buyout
Capital
Invested
Debt
Growth
Industry
Returns
Buyout Capital Invested (t-1) 0.1225***
(0.0416)
0.4538**
(0.1961)
-0.2641**
(0.1083)
Debt Growth (t-1) 0.0003
(0.0006)
-0.0187*
(0.0111)
-0.0149**
(0.0068)
Industry Returns (t-1) 0.0016
(0.0015)
-0.0112
(0.0186)
0.0182**
(0.0092)
N Obs. 7,756
Panel B: Venture Capital
Venture
Capital
Invested
Debt
Growth
Industry
Returns
Venture Capital Invested (t-1) 0.6184***
(0.2274)
0.5005
(0.7940)
1.5314***
(0.4660)
Debt Growth (t-1) -0.0002
(0.0002)
-0.0186*
(0.0111)
-0.0149**
(0.0068)
Industry Returns (t-1) 0.0004
(0.0004)
-0.0120
(0.0186)
0.0186**
(0.0093)
N Obs. 7,756

70
Table 12: Data Sources and Variable Definitions
This table provides descriptions of data sources and variable definitions used in the paper.
Panel A defines the data sources, and Panel B presents the variable definitions with the data
source for the variable in parenthesis.
Data Sources
Burgiss The Burgiss Group is a software company that provides data
record keeping and performance analysis services to the largest
institutional investors in the private equity universe. Burgiss data
is aggregated at the industry-level using actual fund investments
into portfolio companies.
Datastream Datastream’s Global Equity Indices provide industry indices
aggregated from financial statements of publicly listed
companies across 53 countries and 170 sectors worldwide.
World Development
Indicators (WDI)
The development indicators are from World Bank’s primary
database. It presents the most current and accurate global
development data available, and includes national, regional and
global estimates.
World Economic Forum’s
Global Competitiveness
Index (GCI)
GCI assesses the competitiveness landscape of 144 economies,
providing insight into the drivers of their productivity and
prosperity. It provides different indices on a country’s legal
environment, as well as financial and technological
development.
Variable Definitions
PE Capital Invested $ Amount of private equity capital invested, normalized by
industry sales, and logged. (BURGISS)
Buyout Capital Invested $ Amount of buyout capital invested, normalized by industry
sales, and logged. (BURGISS)
Venture Capital Invested $ Amount of venture capital invested, normalized by industry
sales, and logged. (BURGISS)
Employment Growth Log difference in industry employment between time t and t-1.
(DATASTREAM)
Profitability Growth Log difference in industry profit margins, net profit over sales,
between time t and t-1. (DATASTREAM)
Labor Productivity
Growth
Log difference in industry sales per employee between time t
and t-1. (DATASTREAM)
CAPEX Growth Log difference in industry capital expenditures between time t
and t-1. Capital expenditures include, but are not limited to,
additions to property, plant and equipment as well as
investments in machinery and equipment.
Cash Flow Growth Log difference in industry free cash flow between time t and t-1.
Free cash flow is the sum of funds from operations, funds
from/used for other operating activities and extraordinary items.
Industry Returns Log difference in the value of the industry return index retrieved
from DataStream Global Equity Indices between time t and t-1.
(DATASTREAM)

71
Debt Growth Log difference in industry debt, total debt net of cash and cash
equivalents, between time t and t-1. (DATASTREAM)
Market-to-book Growth Log difference in the price-to-book index of an industry between
time t and t-1. (DATASTREAM)
Stocks Traded to GDP Total value of stocks traded over GDP. (WDI)
Private Credit to GDP Total amount of private credit over GDP. (WDI)
Institutional Quality
Score
Measures the institutional quality of a country. It is a
combination of scores on legal institutions, property rights,
investor protection as well as judicial efficiency. (GCI)
Intellectual Property
Rights
Measures the strength of intellectual property protection in a
country. (GCI)
Innovative Capacity Measures a country’s capacity to innovate and adapt to new
technologies. (GCI)

72
Figure 1: Global Private Equity Capital Invested
This figure plots the total amount of private equity capital invested in 48 countries between
1990 and 2011. The solid line plots the total of buyout and venture capital. The dotted line
plots buyout capital and the dashed line plots venture capital. Amounts are in 2011 billion
dollars.
0
50
100
150
200
1990 1992 1994 1996 1998 2000 2002 2004 2006 2008 2010
$bn
PE
Buyout
Venture

73
Figure 2: U.S. and U.K.’s Share of Global Private Equity Capital
This figure plots the share across the U.S. and U.K. out of the total amount of global private
equity capital invested between 1990 and 2011. The solid line plots their share out of the
total of buyout and venture capital invested. The dotted line plots their share out of buyout
capital and the dashed line plots their share out of venture capital.
50
75
100
1990 1992 1994 1996 1998 2000 2002 2004 2006 2008 2010
%
PE
Buyout
Venture
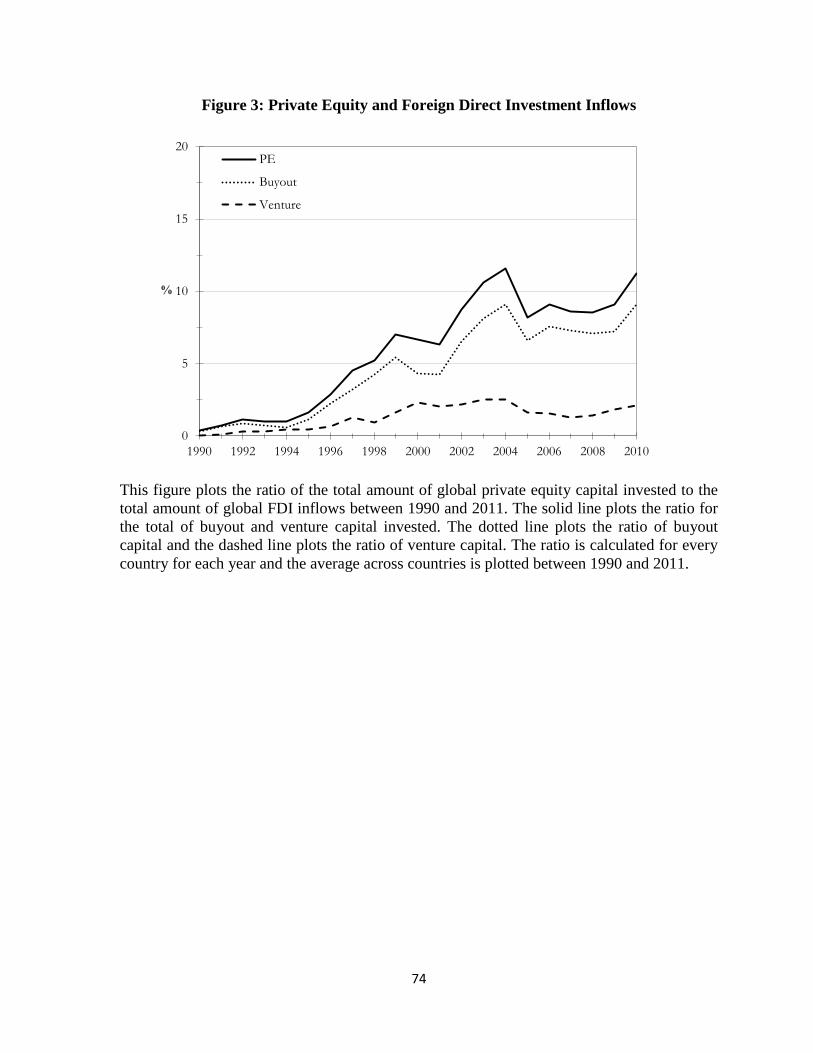
74
Figure 3: Private Equity and Foreign Direct Investment Inflows
This figure plots the ratio of the total amount of global private equity capital invested to the
total amount of global FDI inflows between 1990 and 2011. The solid line plots the ratio for
the total of buyout and venture capital invested. The dotted line plots the ratio of buyout
capital and the dashed line plots the ratio of venture capital. The ratio is calculated for every
country for each year and the average across countries is plotted between 1990 and 2011.
0
5
10
15
20
1990 1992 1994 1996 1998 2000 2002 2004 2006 2008 2010
%
PE
Buyout
Venture

75
Bibliography
Acharya, Viral V., Oliver Gottschalg, Moritz Hahn, and Conor Kehoe, 2012, Corporate
Governance and Value Creation: Evidence from Private Equity, Review of Financial
Studies, forthcoming.
Aitken, Brian J., and Ann E. Harrison, 1999, Do Domestic Firms Benefit from Direct Foreign
Investment? Evidence from Venezuela, American Economic Review 89, 605-618.
Arellano, Manuel, and Olympia Bover, 1995, Another Look at the Instrumental Variable
Estimation of Error Component Models, Journal of Econometrics 68, 29-51.
Arrow, Kenneth J., 1962, The Economic Implications of Learning by Doing, Review of
Economic Studies 29, 155-173.
Andrade, Gregor, and Steven N. Kaplan, 1998, How Costly is Financial (Not Economic)
Distress? Evidence from Highly Leveraged Transactions that Became Distressed,
Journal of Finance 53, 1443-1493.
Balcarcel, Ana, Mike Hertzel, and Laura A. Lindsay, 2012, Contracting Frictions and Cross-
Border Capital Flows: Evidence from Venture Capital, Working Paper.
Ball, Eric, Hsin Hui Chiu, and Richard Smith, 2011, Can VCs Time the Market? An Analysis
of Exit Choice for Venture-backed Firms, Review of Financial Studies 24, 3105-3138.
Barro, Robert J., 1991, Economic Growth in a Cross-Section of Countries, Quarterly Journal
of Economics 106, 408-443.
Bekaert, Geert, Campbell R. Harvey, Christian Lundblad, and Stephan Siegel, 2007, Global
Growth Opportunities and Market Integration, Journal of Finance 62, 1081-1137.
Bernstein, Jeffrey I., Ishaq M. Nadiri, 1989, Research and Development and Intraindustry
Spillovers: An Empirical Application of Dynamic Duality, Review of Economic
Studies 56, 249-269.
Bernstein, Shai, Josh Lerner, Morten Sorensen, and Per Stromberg, 2012, Private Equity and
Industry Performance, Working Paper.
Blomstrom, Magnus, 1986, Foreign Investment and Productive Efficiency: The Case of
Mexico, Journal of Industrial Economics 35, 97-110.
Blomstrom, Magnus, Steven Globerman, and Ari Kokko, 1999, The Determinants of Host
Country Spillovers from Foreign Direct Investment: Review and Synthesis of the
Literature, Working Paper.

76
Blomstrom, Magnus, and Ari Kokko, 1998, Multinational Corporations and Spillovers,
Journal of Economic Surveys 12, 247-277.
Blomstrom, Magnus, and Hakan Persson, 1983, Foreign Investment and Spillover Efficiency
in an Underdeveloped Economy: Evidence from the Mexican Manufacturing
Industry, World Development 11, 493-503.
Blomstrom, Magnus, and Edward N. Wolff, 1994, Multinational Corporations and
Productivity Convergence in Mexico, Convergence of Productivity: Cross-national
Studies and Historical Evidence, Oxford and New York: Oxford University Press,
243-259.
Brown, Greg, Robert S. Harris, Tim Jenkinson, Steven N. Kaplan, Ruediger Stucke, 2011,
How Big is the Private Equity Universe?, UNC Kenan Flagler Business School,
Presentation to UNC Private Equity Conference, October 14, 2011.
Cantwell, John, 1989, Technological Innovation and Multinational Corporations, Oxford:
Basil Blackwell.
Cao, Jerry, and Josh Lerner, 2009, The Performance of Reverse-Leveraged Buyouts, Journal
of Financial Economics 91, 139-157.
Caves, Richard ,1974, Multinational Firms, Competition and Productivity in the Host
Country, Economica 41, 176-193.
Cochrane, John H., 2005, Time Series for Macroeconomics and Finance, Chicago: University
of Chicago.
Cumming , Douglas J., and Uwe Walz, 2009, Private Equity Returns and Disclosure Around
the World, Journal of International Business Studies 41, 727-754.
Cumming, Douglas J., Mike Wright, and Donald S. Siegel, 2007, Private Equity, Leveraged
Buyouts and Governance, Journal of Corporate Finance 13, 439-460.
Davis, Steven J., John C. Haltiwanger, Ron S. Jarmin, Josh Lerner, and Javier Miranda,
2009, Private Equity, Jobs, and Productivity, Working Paper.
Davis, Steven J., John C. Haltiwanger, Ron S. Jarmin, Josh Lerner, and Javier Miranda,
2011, Private Equity and Employment, Working Paper.
Demirguc-Kunt, Asli, and Ross Levine, 1996, Stock Market Development and Financial
Intermediaries: Stylized Facts, World Bank Economic Review 10, 291-321.
Djankov, Simeon, and Bernard Hoekman, 2000, Foreign Investment and Productivity
Growth in Czech Enterprises, The World Bank Economic Review 14, 49-64.

77
Feinberg, Susan E., and Sumit K. Majumdar, 2001, Technology Spillovers from Foreign
Direct Investment in the Indian Pharmaceutical Industry, Journal of International
Business Studies 32, 423-437.
Financial Services Authority, 2006, Private Equity: A Discussion of Risk and Regulatory
Engagement, London: Financial Services Authority.
Glaeser, Edward L., Hedi Kallal, Jose A. Scheinkman, and Andrei Shleifer, 1992, Growth in
Cities, Journal of Political Economy 100, 1126-1152.
Globerman, S., 1979, Foreign Direct Investment and `Spillover' Efficiency Benefits in
Canadian Manufacturing Industries, Canadian Journal of Economics 12, 42-56.
Gonzalez-Uribe, Juanita, 2012, Venture Capital and the Diffusion of Knowledge, Working
Paper.
Guo, Shourun, Edith S. Hotchkiss, and Weihong Song, 2011, Do Buyouts (Still) Create
Value?, Journal of Finance 66, 479-517.
Haddad, Mona, and Ann E. Harrison, 1993, Are There Positive Spillovers From Direct
Foreign Investment? Evidence From Panel Data for Morocco, Journal of
Development Economics 42, 51-74.
Harford, Jarrad, and Adam C. Kolasinski, 2012, Do Private Equity Sponsors Sacrifice Long-
Term Value for Short-Term Profit? Evidence from a Comprehensive Sample of Large
Buyouts and Exit Outcomes, Working Paper.
Harris, Robert S., Tim Jenkinson, and Steven N. Kaplan, 2012, Private Equity Performance:
What Do We Know?, Working Paper.
Henry, David, Emily Thornton, and David Kiley, August 6, 2006, Buy It, Strip It, Then Flip
it, Bloomberg Businessweek, from http://www.businessweek.com.
Javorcik, Beata S., 2004, Does Foreign Direct Investment Increase the Productivity of
Domestic Firms? In Search of Spillovers Through Backward Linkages, American
Economic Review 94, 605-627.
Jenkinson, Tim, Rudiger Stucke, 2011, Who Benefits from the Leverage in LBOs?, Working
Paper.
Jensen, Michael, 1989, Eclipse of the Public Corporation, Harvard Business Review 67, 61-
74.
Kaplan, Steven N., 1989, The Effects of Management Buyouts on Operating Performance
and Value, Journal of Financial Economics 24, 217-254.

78
Kaplan, Steven N., and Per Stromberg, 2009, Leveraged Buyouts and Private Equity, Journal
of Economic Perspectives 23, 121-146.
Kathuria, Vinish, 2002, Liberalisation, FDI, and Productivity Spillovers – An Analysis of
Indian Manufacturing Firms, Oxford Economic Papers 54, 688-718.
King, Robert G., and Ross Levine, 1993, Finance and Growth: Schumpeter Might Be Right,
The Quarterly Journal of Economics 108, 717-737.
Kokko, Ari, 1994, Technology, Market Characteristics, and Spillovers, Journal of
Development Economics 43, 279-293.
Kokko, Ari, 1996, Productivity Spillovers from Competition between Local Firms and
Foreign Affiliates, Journal of International Development 8, 517-530.
Kogut, Bruce, and Sea Jin Chang, 1991, Technological Capabilities and Japanese Foreign
Direct Investment in the United States, Review of Economics and Statistics 73, 401-
413.
Kortum, Samuel S., Josh Lerner, 2000, Assessing the Contribution of Venture Capital to
Innovation, RAND Journal of Economics 31, 674-692.
La Porta, Rafael, Florencio Lopez-de-Silanes, Andrei Shleifer, and Robert W. Vishny, Law
and Finance, Journal of Political Economy 106, 1113-1155.
Lerner, Josh, and Antoinette Schoar, 2005, Does Legal Enforcement Affect Financial
Transactions? The Contractual Channel in Private Equity, The Quarterly Journal of
Economics 120, 223-246.
Lerner, Josh, Morten Sorensen, and Per Stromberg, 2009, Private Equity and Long-Run
Investment: The Case of Innovation, Working Paper.
Levine, Ross, 2004, Finance and Growth: Theory and Evidence, NBER Working Paper.
Love, Inessa, and Lea Zicchino, 2006, Financial Development and Dynamic Investment
Behavior: Evidence from Panel VAR, The Quarterly Review of Economics and
Finance 46, 190-210.
Mansfield, Edwin, 1994, Intellectual Property Protection, Foreign Direct Investment and
Technology Transfer, IFC Discussion Paper.
Marshall, Alfred, 1890, Principles of Economics, London: Macmillan.
Mollica, M., and Luigi Zingales, 2007, The Impact of Venture Capital on Innovation and the
Creation of New Businesses, Working Paper.

79
Muscarella, Chris J., and Michael R.Vetsuypens, 1990, Efficiency and Organizational
Structure: A Study of Reverse LBOs, Journal of Finance 45, 1389-1413.
Popov, Alexander, and Peter Roosenboom, 2008, On the Real Effects of Private Equity
Investment: Evidence from New Business Creation, Working Paper.
Popov, Alexander, and Peter Roosenboom, 2012, Venture Capital and Patented Innovation:
Evidence from Europe, Economic Policy 27, 447-482.
Romer, Paul M., 1986, Increasing Returns and Long-Run Growth, Journal of Political
Economy 94, 1002-1037.
Sims, Christopher, 1980, Macroeconomics and Reality, Econometrica 48, 1-48.
Sorkin, Andrew R., 2007, September 23, Is Private Equity Giving Hertz a Boost?, New York
Times, from http://www.nytimes.com/2007/09/23/business.
Service Employees International Union, 2007, Behind the Buyouts: Inside the World of
Private Equity, Washington: SEUI.
Safieddine, Assam and Sheridan Titman, 1999, Leverage and Corporate Performance:
Evidence from Unsuccessful Takeovers, Journal of Finance 54, 547-580