probabilistic analysis of a large-scale urban traffic sensor data set jon hutchins, alexander ihler,...
Post on 22-Dec-2015
216 views
TRANSCRIPT
Probabilistic Analysis of a Large-Scale Urban Traffic Sensor Data Set
Jon Hutchins, Alexander Ihler, and Padhraic SmythDepartment of Computer Science
University of California, Irvine
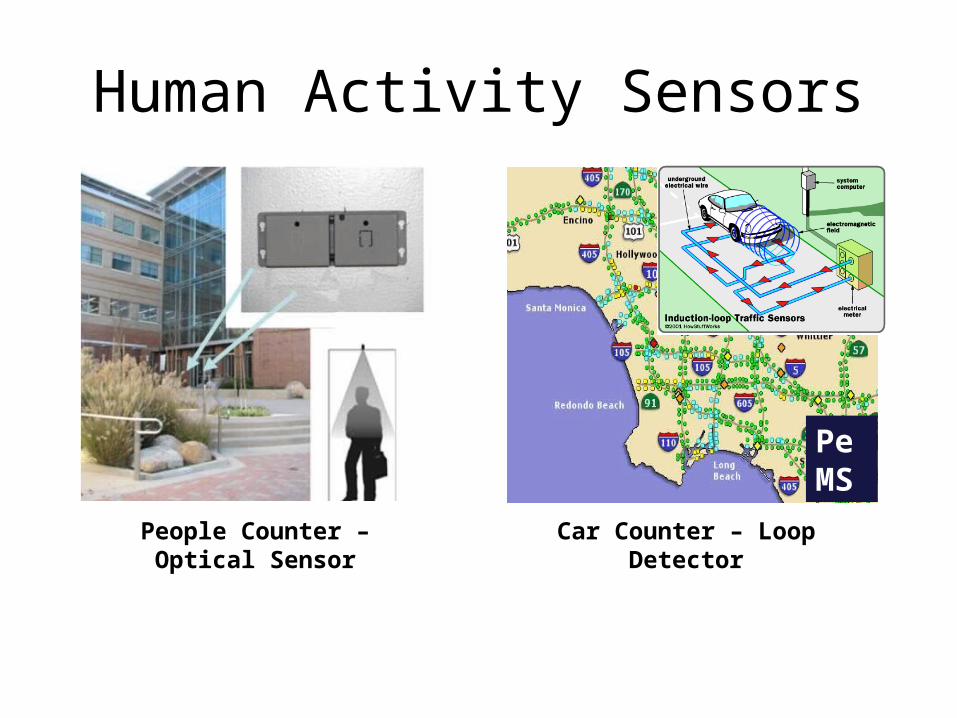
People Counter – Optical Sensor
Car Counter – Loop Detector
Human Activity Sensors
PeMS
Outline• Modeling human count data• Scale-Up challenges• Fault-tolerant model• Urban Analysis
Outline• Modeling human count data• Scale-Up challenges• Fault-tolerant model• Urban Analysis
Outline• Modeling human count data• Scale-Up challenges• Fault-tolerant model• Urban Analysis
Outline• Modeling human count data• Scale-Up challenges• Fault-tolerant model• Urban Analysis
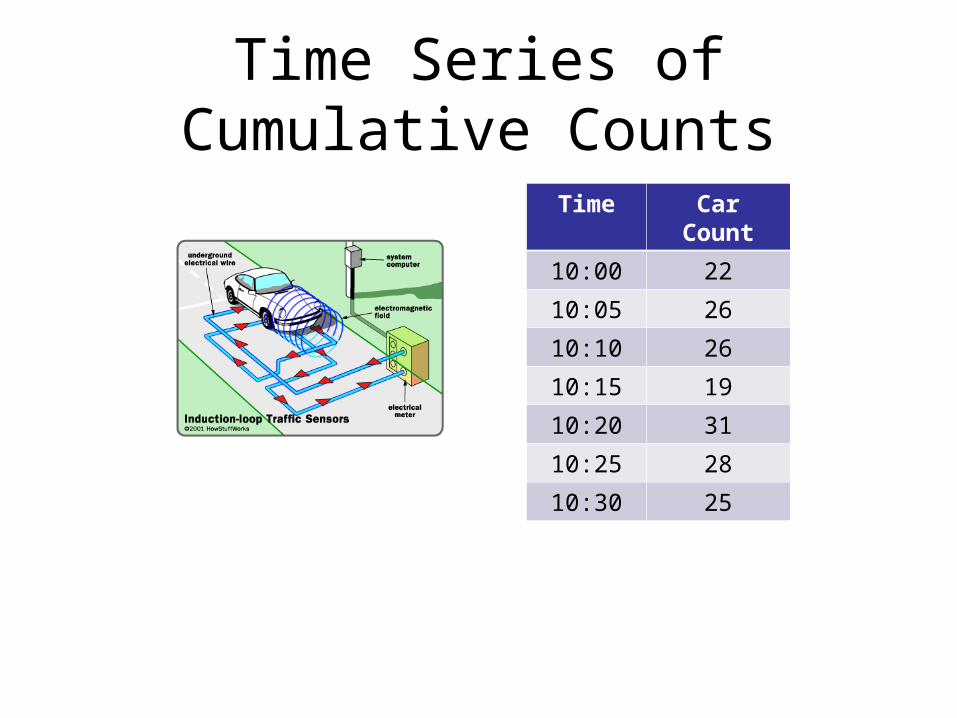
Time Series of Cumulative Counts
Time Car Count
10:00 22
10:05 26
10:10 26
10:15 19
10:20 31
10:25 28
10:30 25
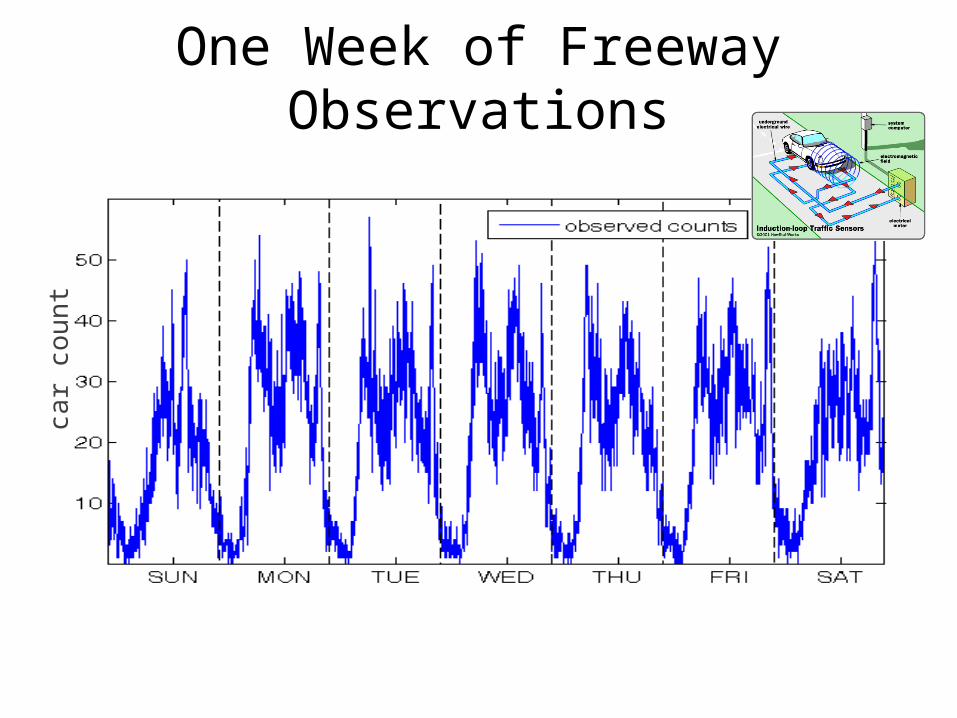
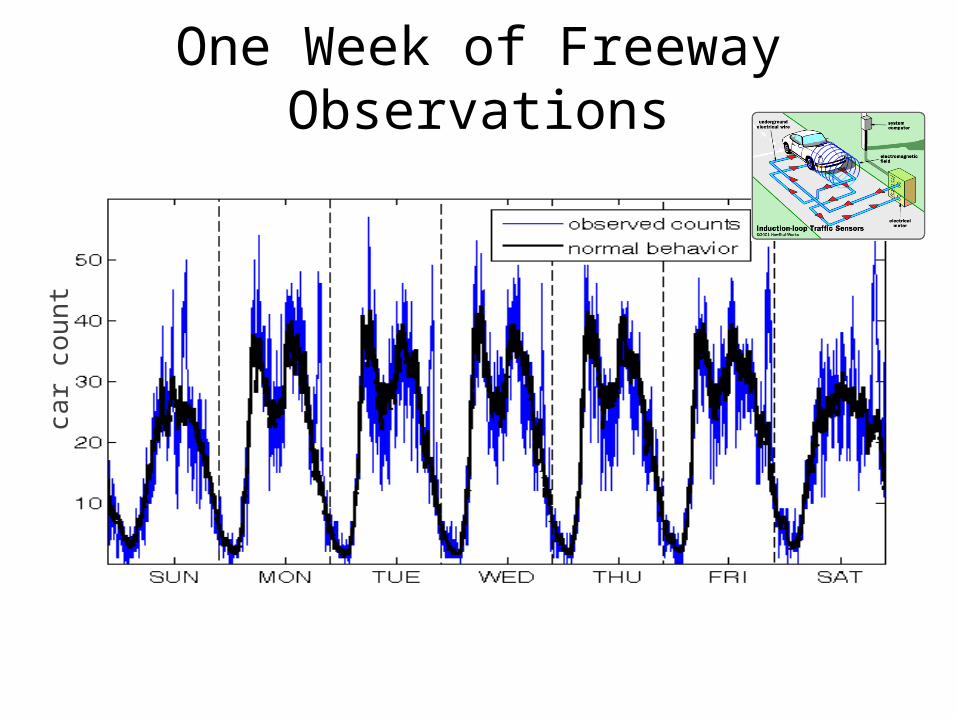
One Week of Freeway Observationsca
r co
un
t
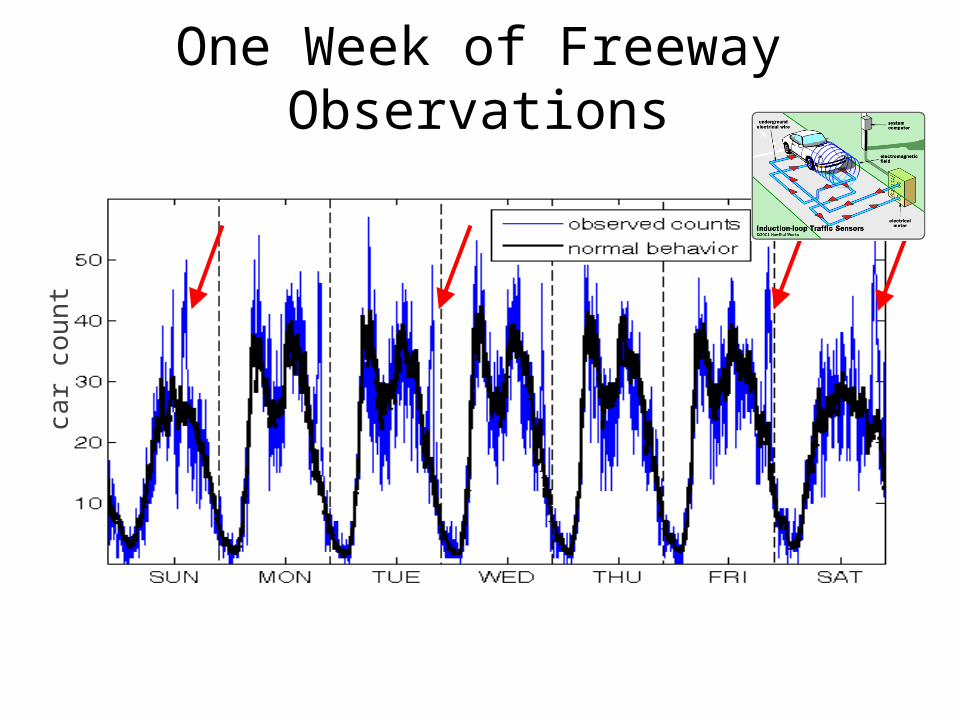
One Week of Freeway Observationsca
r co
un
t
One Week of Freeway Observationsca
r co
un
t
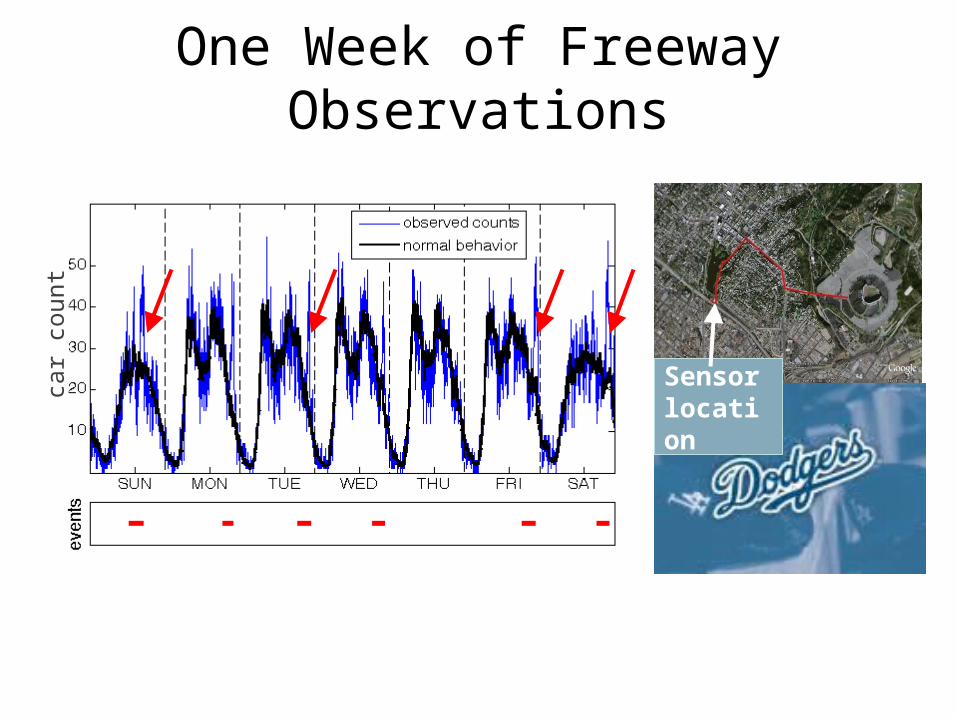
Sensor location
car
coun
tOne Week of Freeway Observations
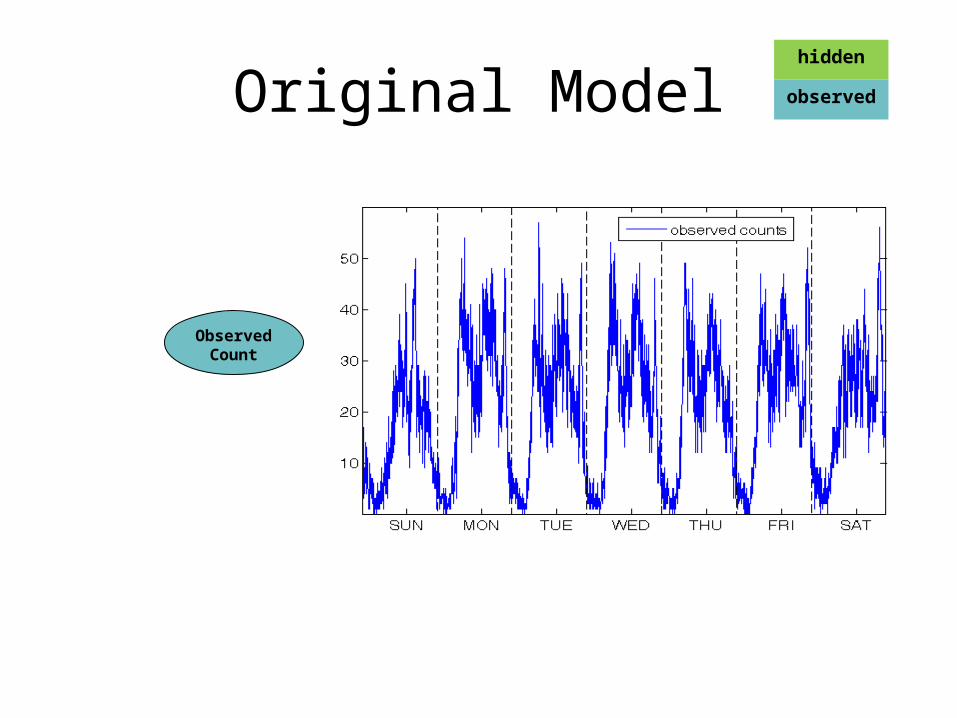
Original Modelhidden
observed
ObservedCount
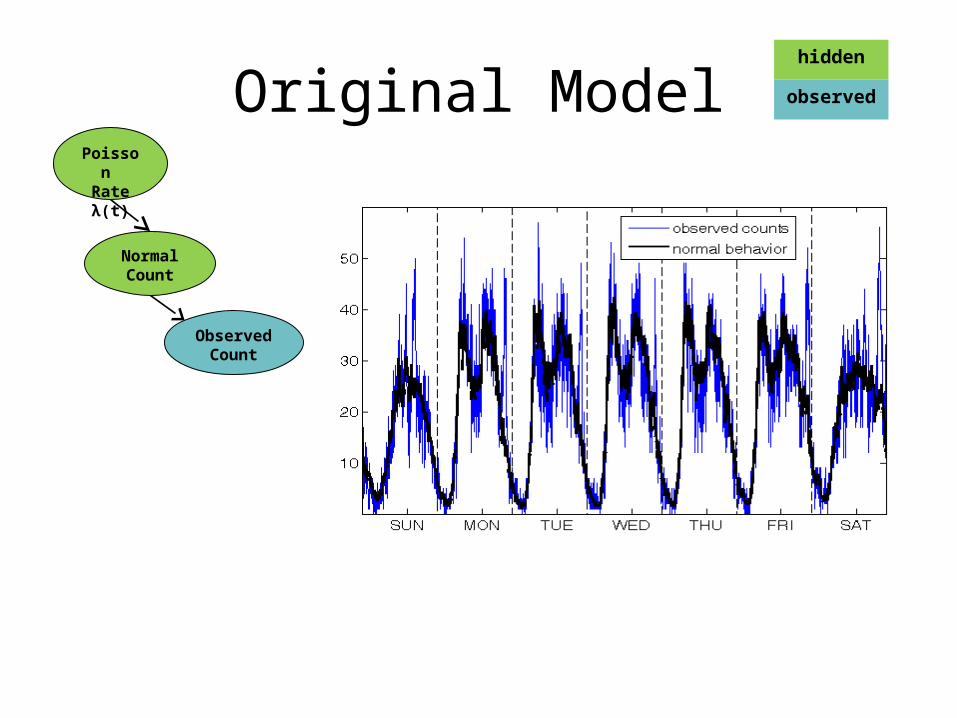
Original Modelhidden
observed
ObservedCount
NormalCount
Poisson Rate λ(t)
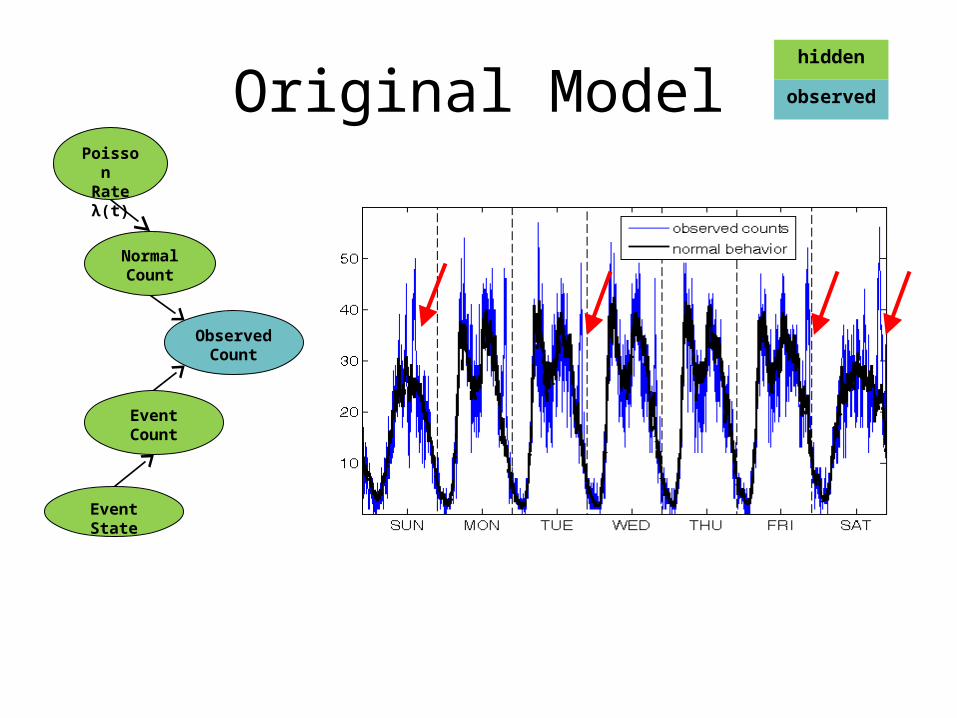
Original Modelhidden
observed
ObservedCount
NormalCount
Poisson Rate λ(t)
Event State
EventCount
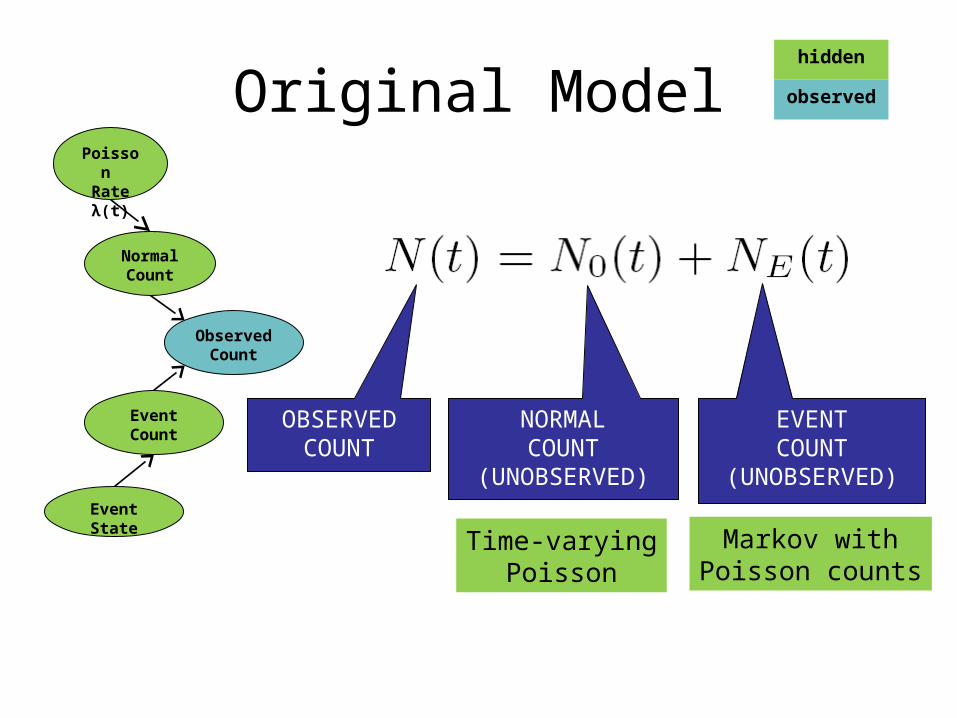
Original Modelhidden
observed
ObservedCount
NormalCount
Poisson Rate λ(t)
Event State
EventCount
OBSERVEDCOUNT
NORMALCOUNT
(UNOBSERVED)
EVENTCOUNT
(UNOBSERVED)
Time-varyingPoisson
Markov withPoisson counts

Original Modelhidden
observed
ObservedCount
NormalCount
Poisson Rate λ(t)
Event State
EventCount
OBSERVEDCOUNT
NORMALCOUNT
(UNOBSERVED)
EVENTCOUNT
(UNOBSERVED)
Time-varyingPoisson
Markov withPoisson counts
Markov Modulated Poisson Process (MMPP) e.g., see Scott (1998)
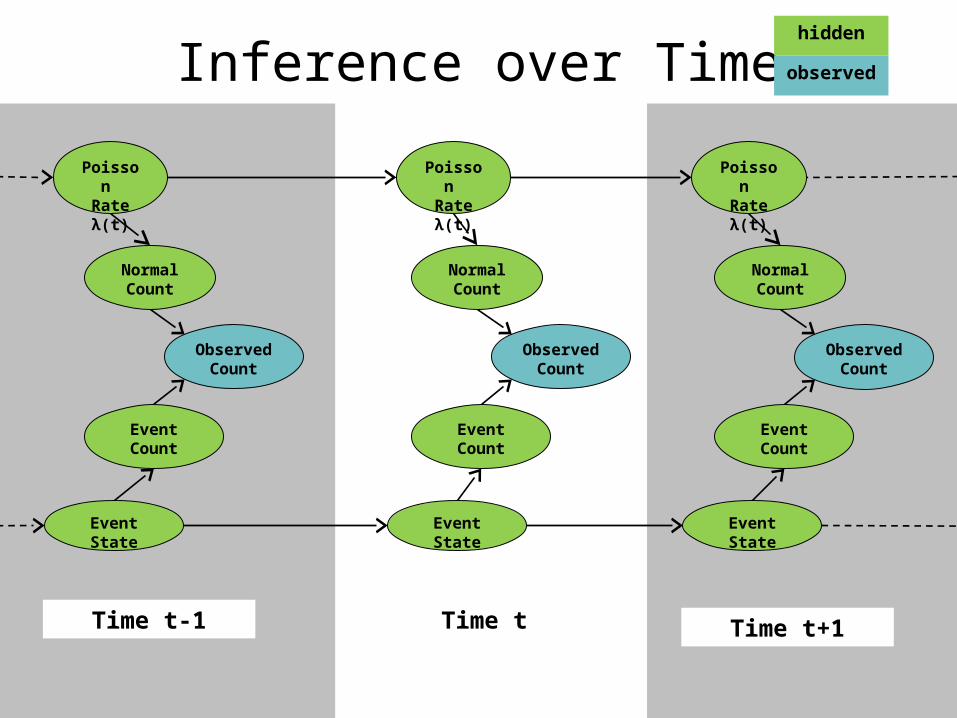
Time t+1
Event StateEvent State Event State
ObservedCount
ObservedCount
ObservedCount
EventCount
EventCount
EventCount
Poisson Rate λ(t)
NormalCount
NormalCount
NormalCount
Poisson Rate λ(t)
Poisson Rate λ(t)
Time t-1 Time t
Inference over Timehidden
observed
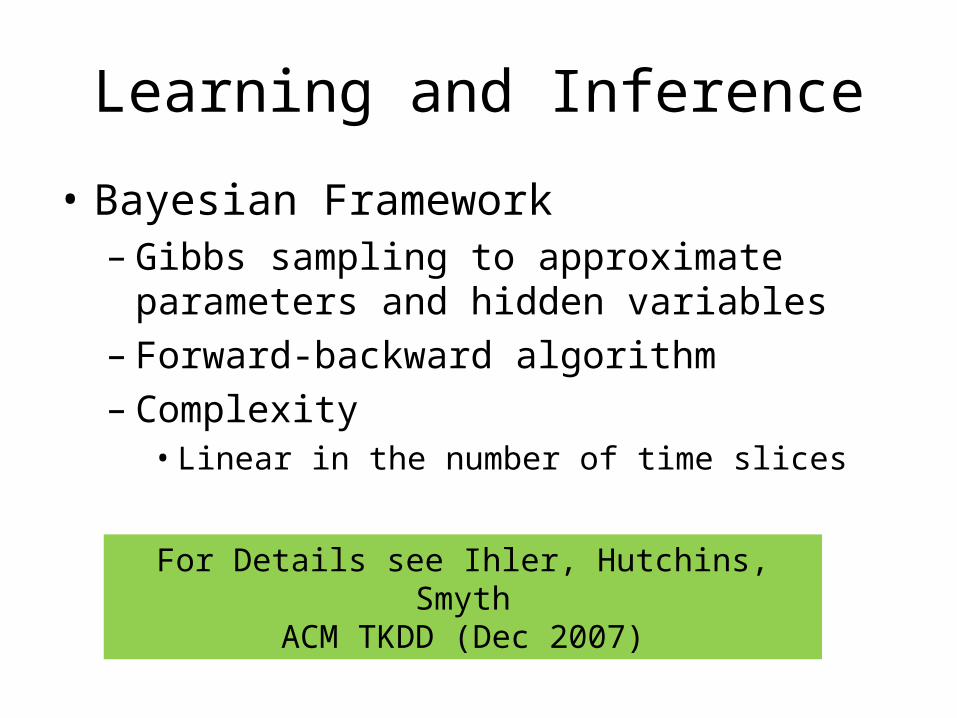
Learning and Inference
• Bayesian Framework– Gibbs sampling to approximate parameters and
hidden variables– Forward-backward algorithm– Complexity
• Linear in the number of time slices
For Details see Ihler, Hutchins, SmythACM TKDD (Dec 2007)
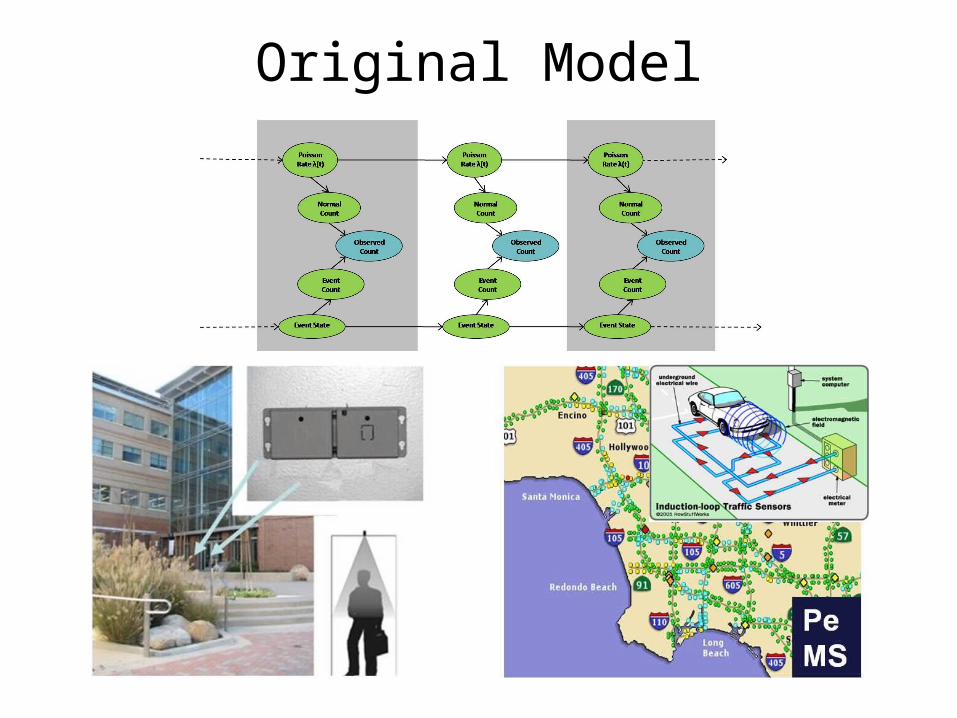
Original Model
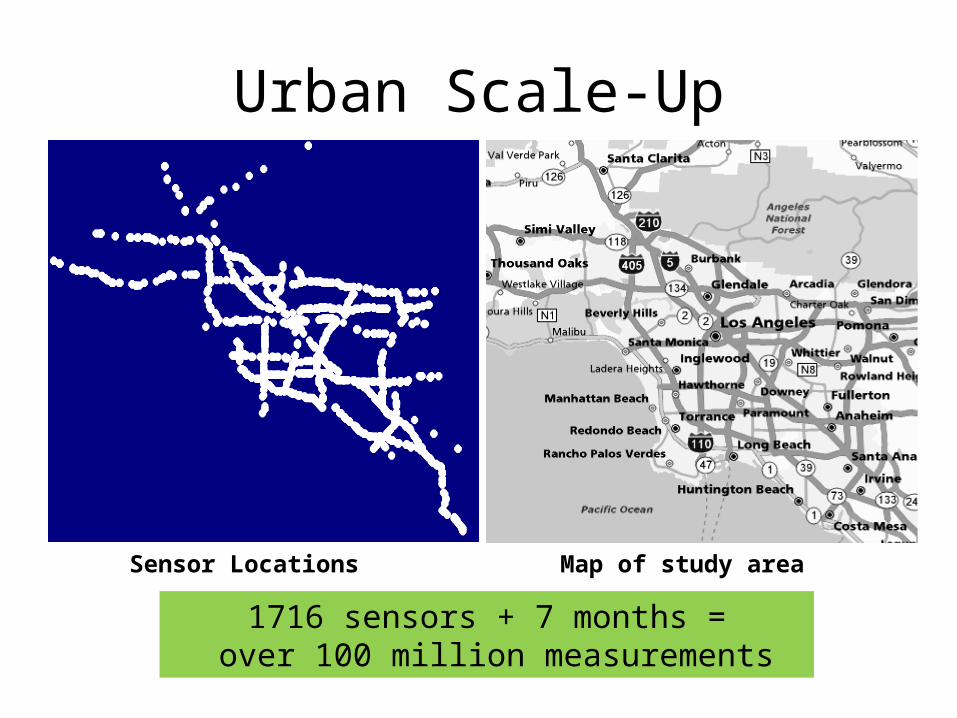
Urban Scale-Up
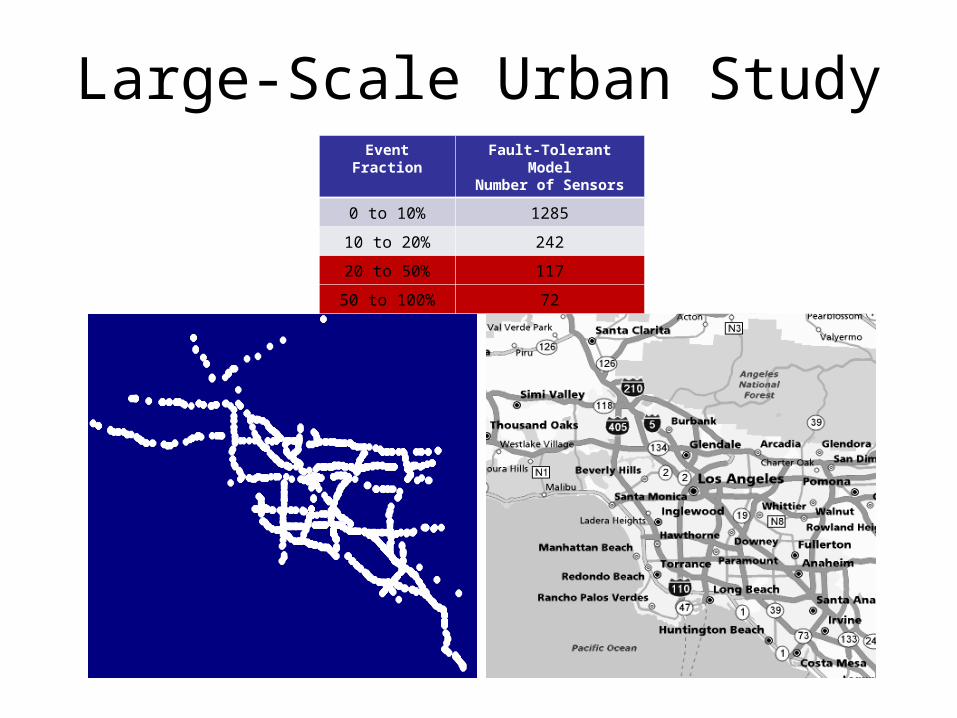
Sensor Locations Map of study area
1716 sensors + 7 months = over 100 million measurements
-119.2 -119 -118.8 -118.6 -118.4 -118.2 -118 -117.8 -117.6 -117.433.2
33.4
33.6
33.8
34
34.2
34.4
34.6
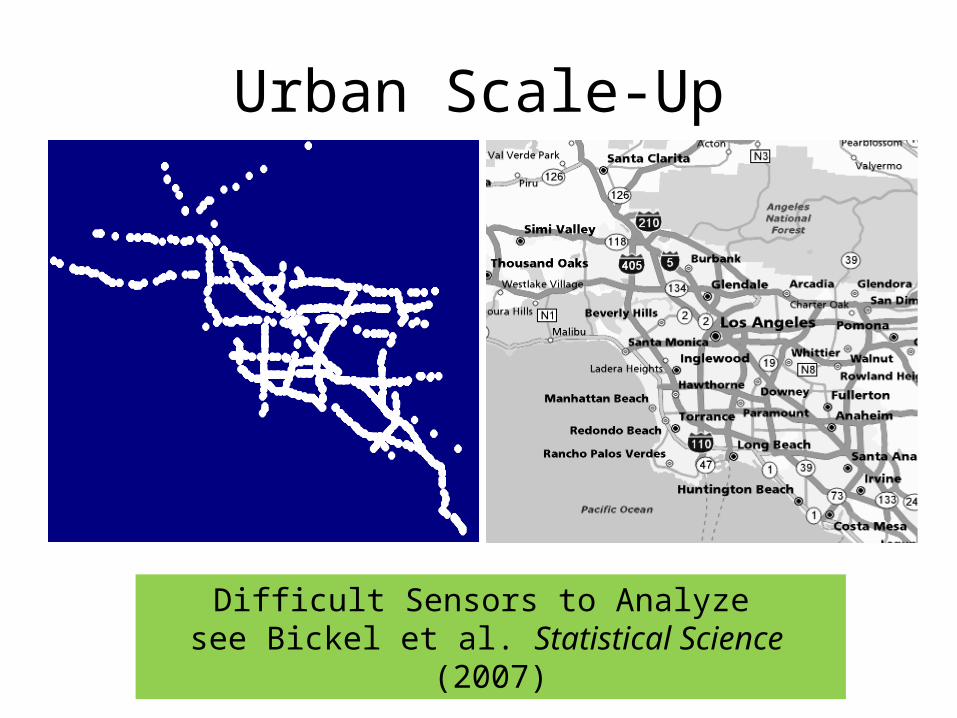
Urban Scale-Up
Difficult Sensors to Analyze see Bickel et al. Statistical Science (2007)
-119.2 -119 -118.8 -118.6 -118.4 -118.2 -118 -117.8 -117.6 -117.433.2
33.4
33.6
33.8
34
34.2
34.4
34.6
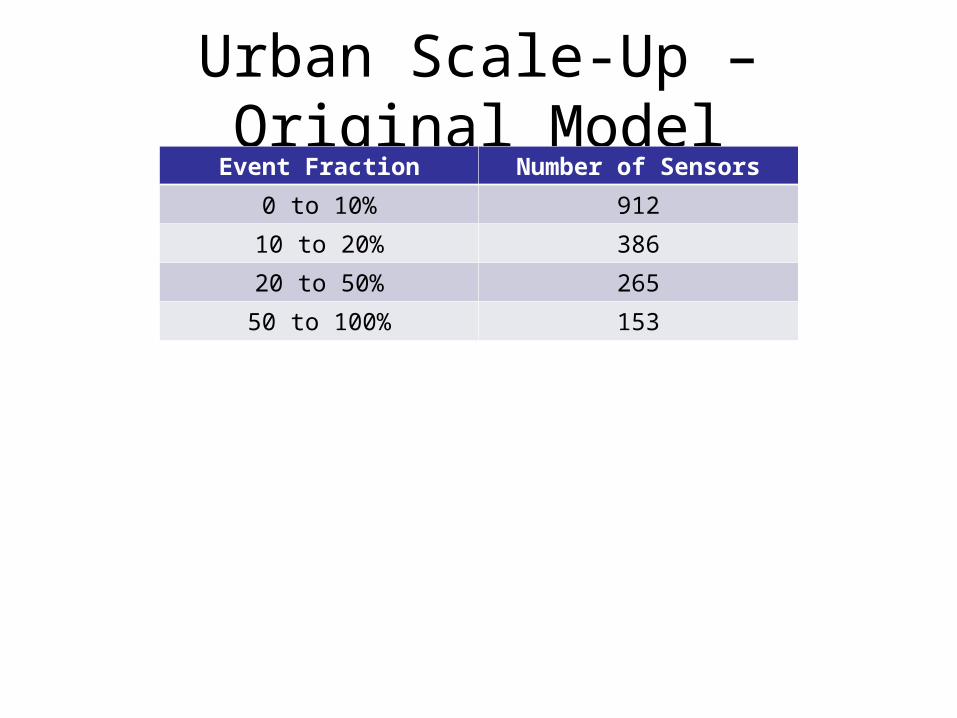
Urban Scale-Up – Original ModelEvent Fraction Number of Sensors
0 to 10% 912
10 to 20% 386
20 to 50% 265
50 to 100% 153
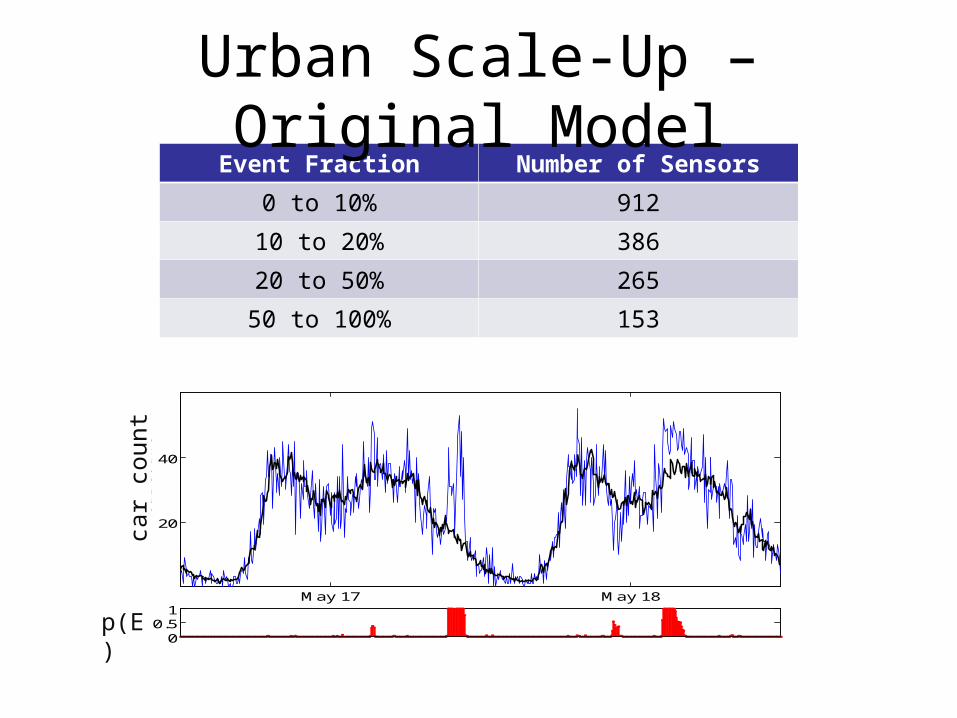
Event Fraction Number of Sensors
0 to 10% 912
10 to 20% 386
20 to 50% 265
50 to 100% 153
May 17 May 18
20
40
car
count
00.5
1p(E)
events
time
car
coun
t
p(E)
Urban Scale-Up – Original Model
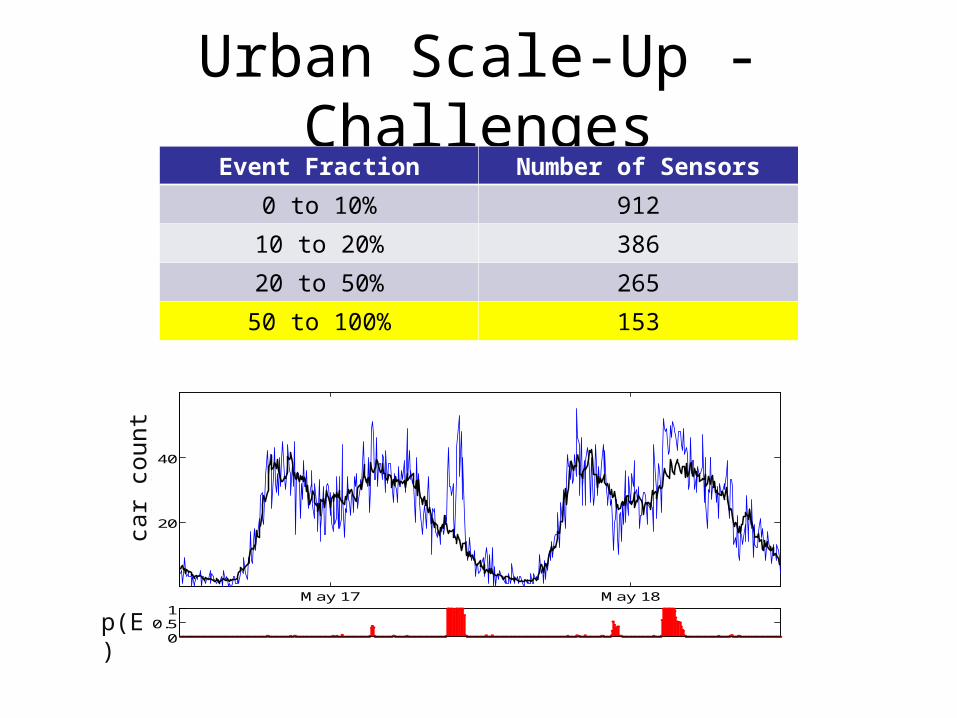
Urban Scale-Up - ChallengesEvent Fraction Number of Sensors
0 to 10% 912
10 to 20% 386
20 to 50% 265
50 to 100% 153
May 17 May 18
20
40
car
count
00.5
1p(E)
events
time
car
coun
t
p(E)
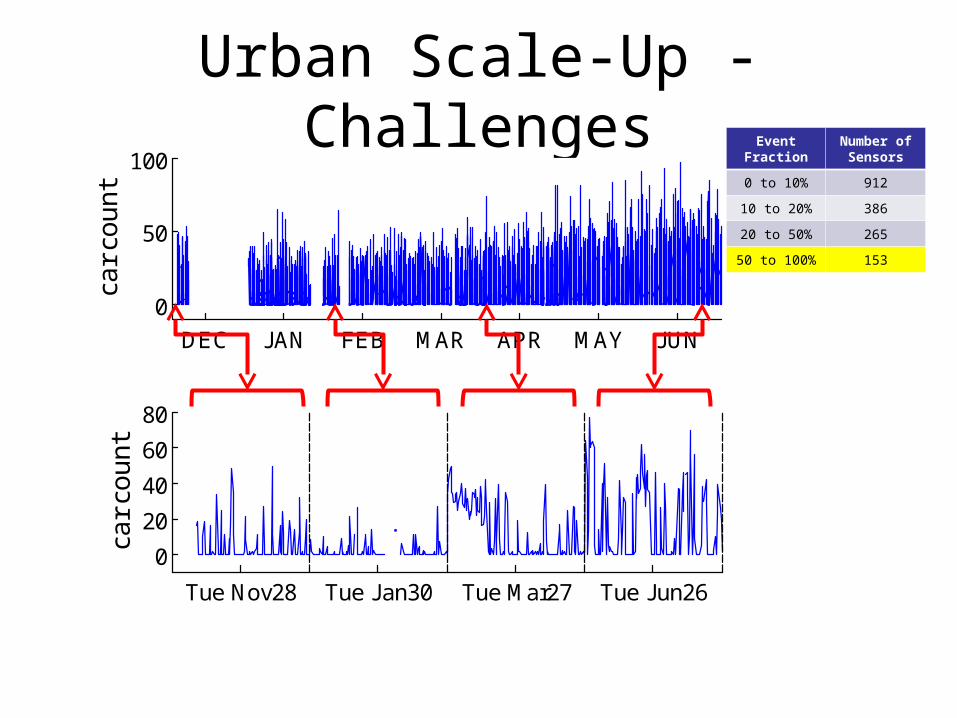
Urban Scale-Up - ChallengesEvent Fraction Number of
Sensors
0 to 10% 912
10 to 20% 386
20 to 50% 265
50 to 100% 153
DEC JAN FEB MAR APR MAY JUN
0
50
100
car
cou
nt
Tue Nov28 Tue Jan30 Tue Mar27 Tue Jun26
0
20
40
60
80
car
cou
nt
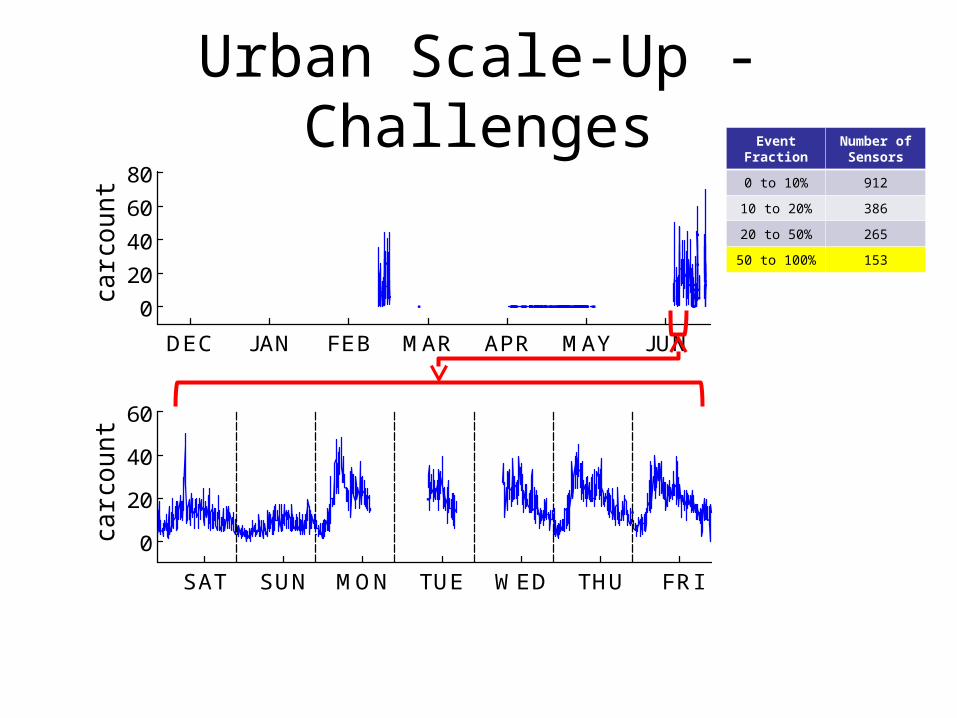
Urban Scale-Up - ChallengesEvent Fraction Number of
Sensors
0 to 10% 912
10 to 20% 386
20 to 50% 265
50 to 100% 153
DEC JAN FEB MAR APR MAY JUN
0
20
40
60
80
ca
r co
un
t
SAT SUN MON TUE WED THU FRI
0
20
40
60
ca
r co
un
t
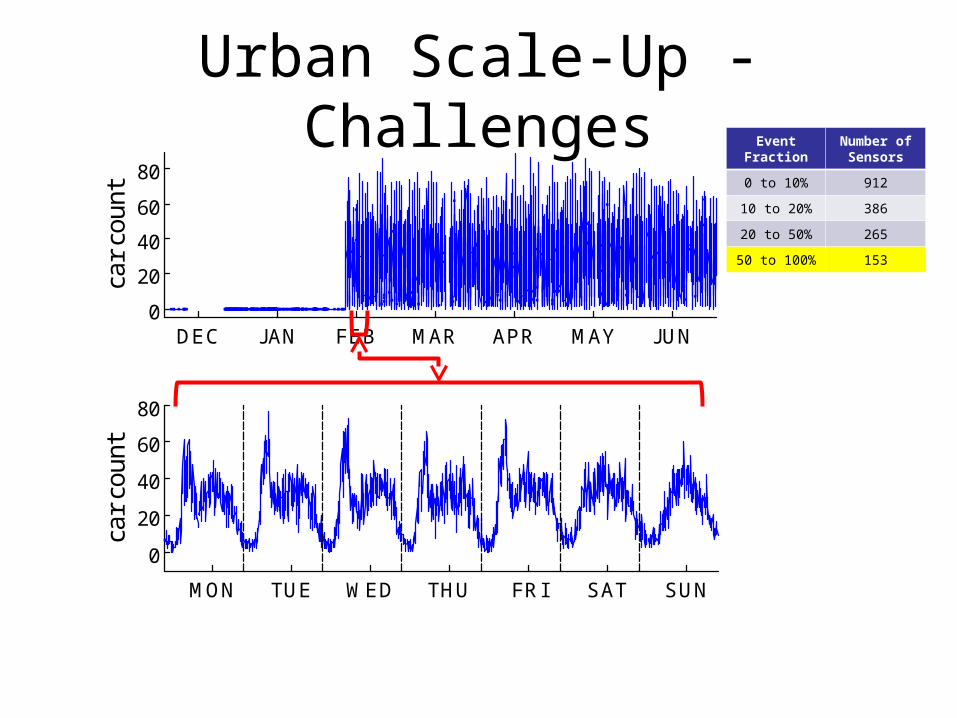
DEC JAN FEB MAR APR MAY JUN0
20
40
60
80
car
coun
t
MON TUE WED THU FRI SAT SUN
0
20
40
60
80
car
coun
tUrban Scale-Up - Challenges
Event Fraction Number of Sensors
0 to 10% 912
10 to 20% 386
20 to 50% 265
50 to 100% 153
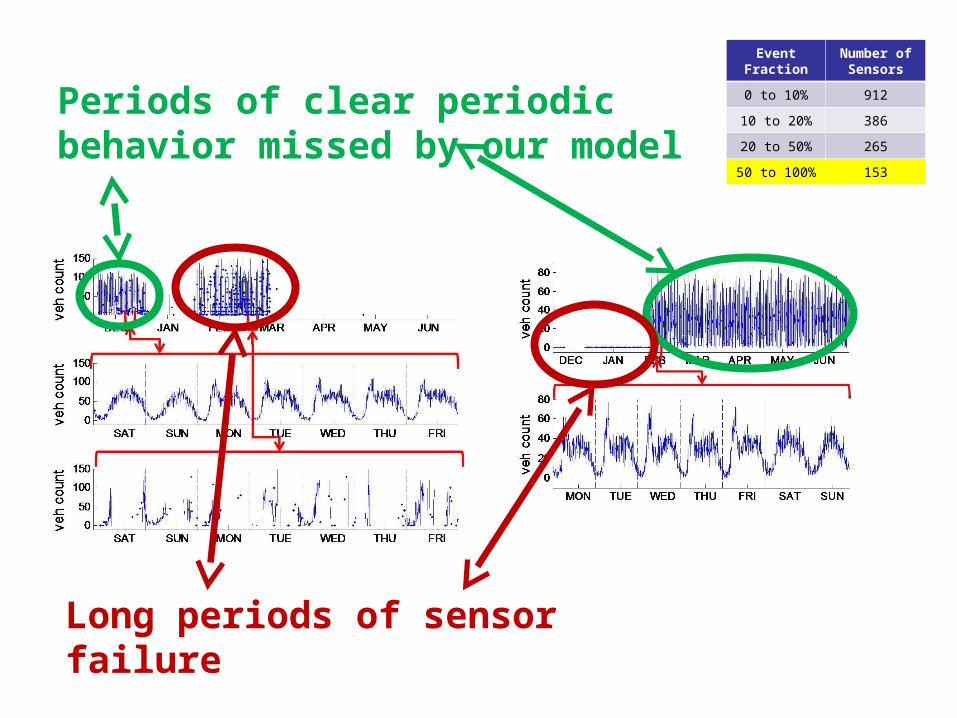
Event Fraction Number of Sensors
0 to 10% 912
10 to 20% 386
20 to 50% 265
50 to 100% 153
Periods of clear periodic behavior missed by our model
Long periods of sensor failure
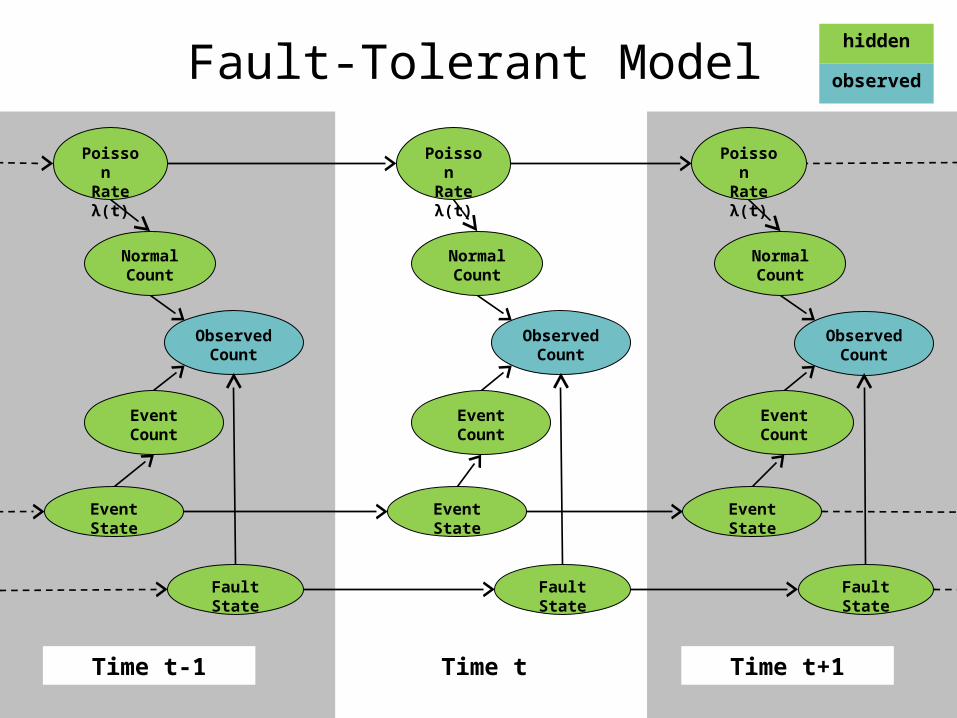
Time t+1
Event StateEvent State Event State
ObservedCount
ObservedCount
ObservedCount
EventCount
EventCount
EventCount
Poisson Rate λ(t)
NormalCount
NormalCount
NormalCount
hidden
observed
Poisson Rate λ(t)
Poisson Rate λ(t)
Time t-1 Time t
Original Model
Fault StateFault State Fault State
Fault-Tolerant Model
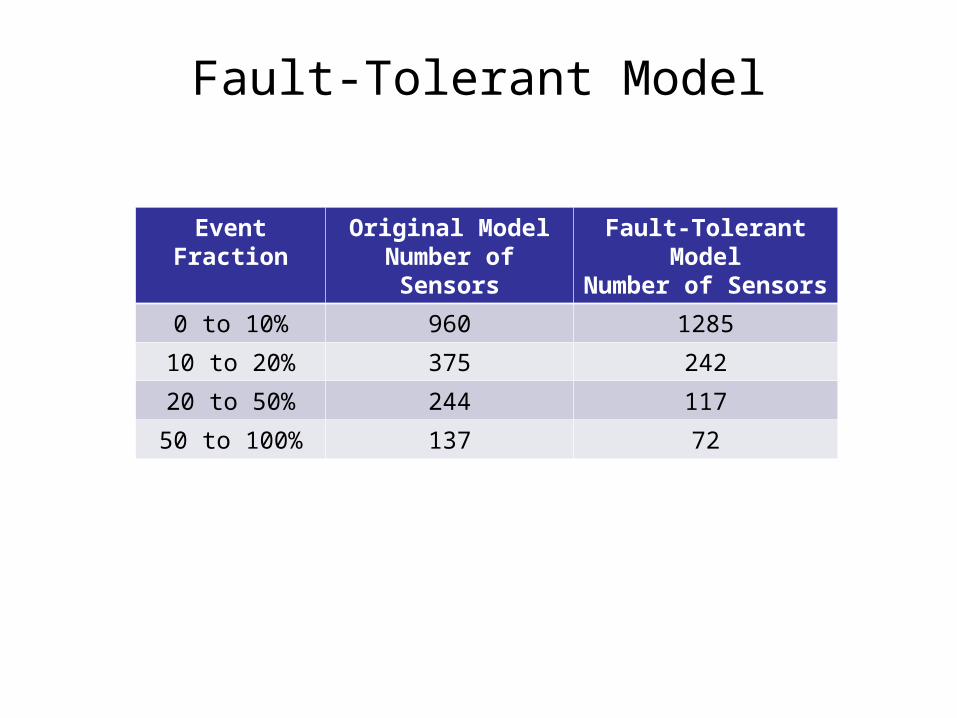
Event Fraction Original ModelNumber of Sensors
Fault-Tolerant ModelNumber of Sensors
0 to 10% 960 1285
10 to 20% 375 242
20 to 50% 244 117
50 to 100% 137 72
Fault-Tolerant Model
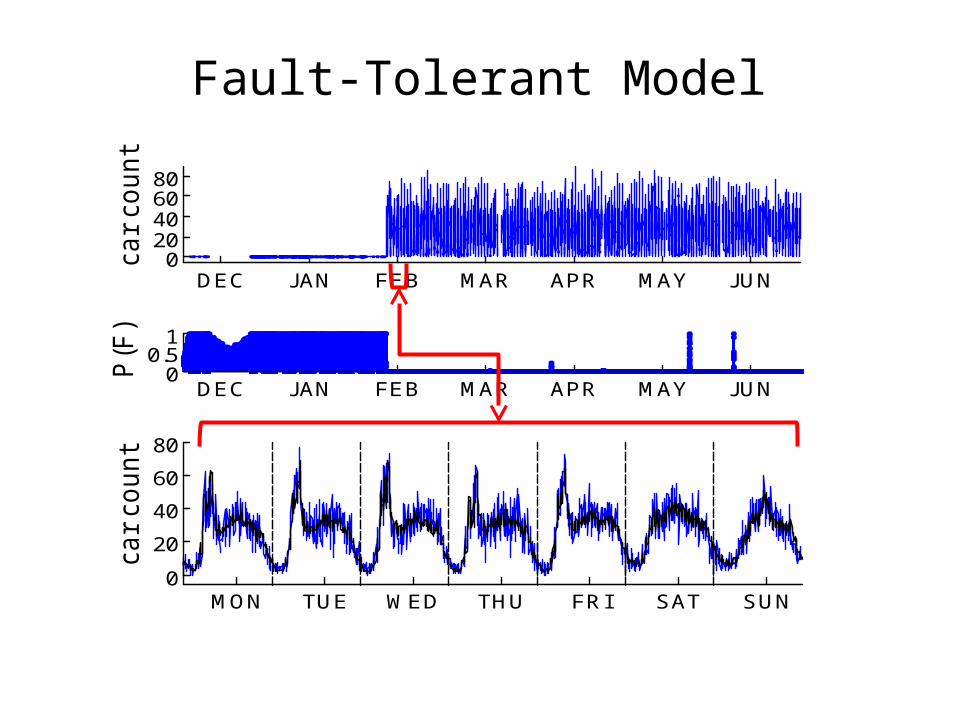
Fault-Tolerant Model
DEC JAN FEB MAR APR MAY JUN0
20406080
car
count
DEC JAN FEB MAR APR MAY JUN0
0.51
P(F
)
MON TUE WED THU FRI SAT SUN0
20
40
60
80
car
count
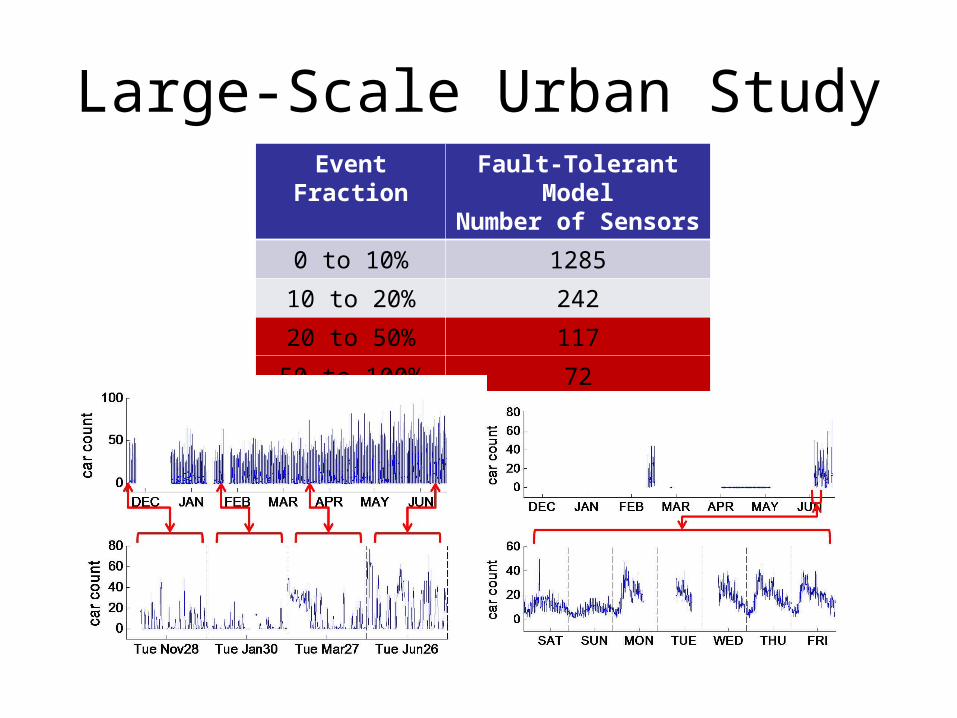
Large-Scale Urban StudyEvent Fraction Fault-Tolerant Model
Number of Sensors
0 to 10% 1285
10 to 20% 242
20 to 50% 117
50 to 100% 72
Large-Scale Urban StudyEvent Fraction Fault-Tolerant Model
Number of Sensors
0 to 10% 1285
10 to 20% 242
20 to 50% 117
50 to 100% 72
-119.2 -119 -118.8 -118.6 -118.4 -118.2 -118 -117.8 -117.6 -117.433.2
33.4
33.6
33.8
34
34.2
34.4
34.6
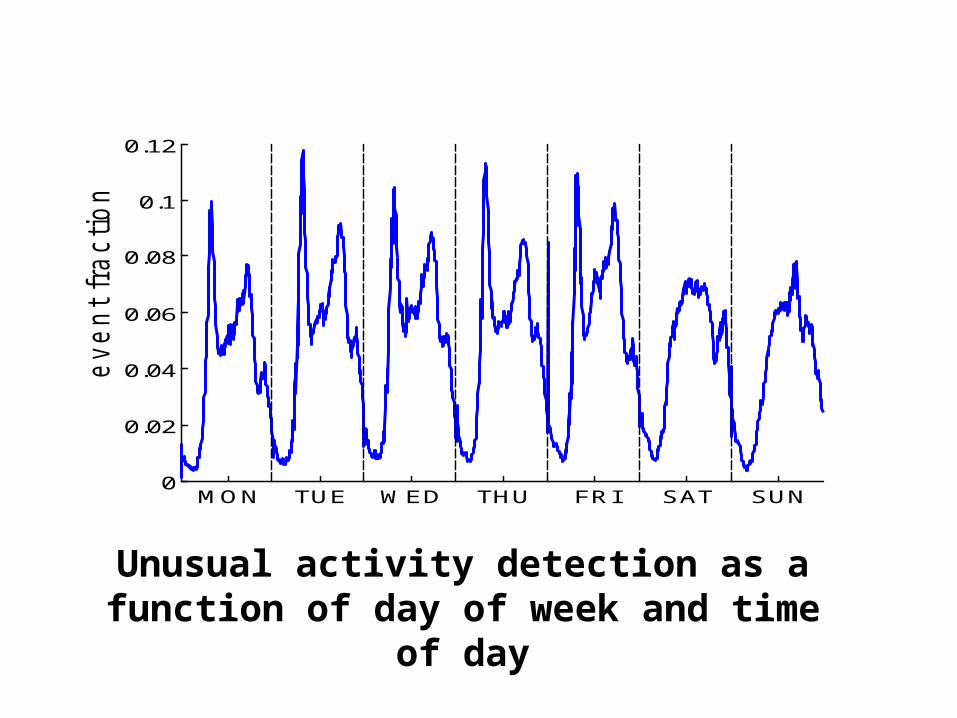
Unusual activity detection as a function of day of week and time of day
MON TUE WED THU FRI SAT SUN0
0.02
0.04
0.06
0.08
0.1
0.12
eve
nt
fra
ctio
n
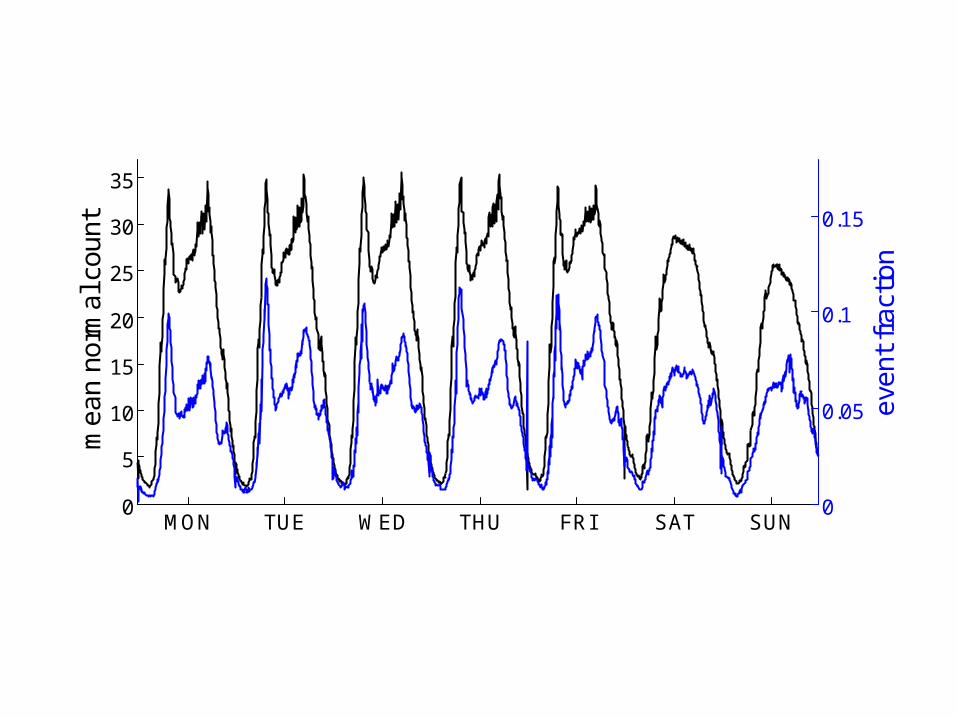
MON TUE WED THU FRI SAT SUN0
5
10
15
20
25
30
35
mea
n no
rmal
cou
nt
0
0.05
0.1
0.15
even
t fr
actio
n
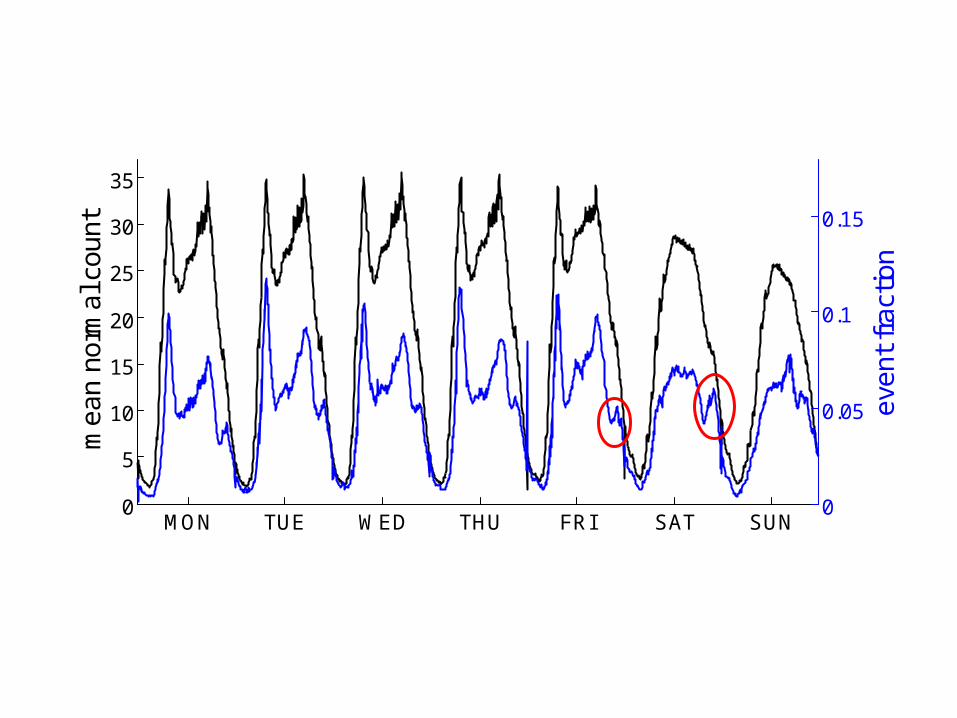
MON TUE WED THU FRI SAT SUN0
5
10
15
20
25
30
35
mea
n no
rmal
cou
nt
0
0.05
0.1
0.15
even
t fr
actio
n
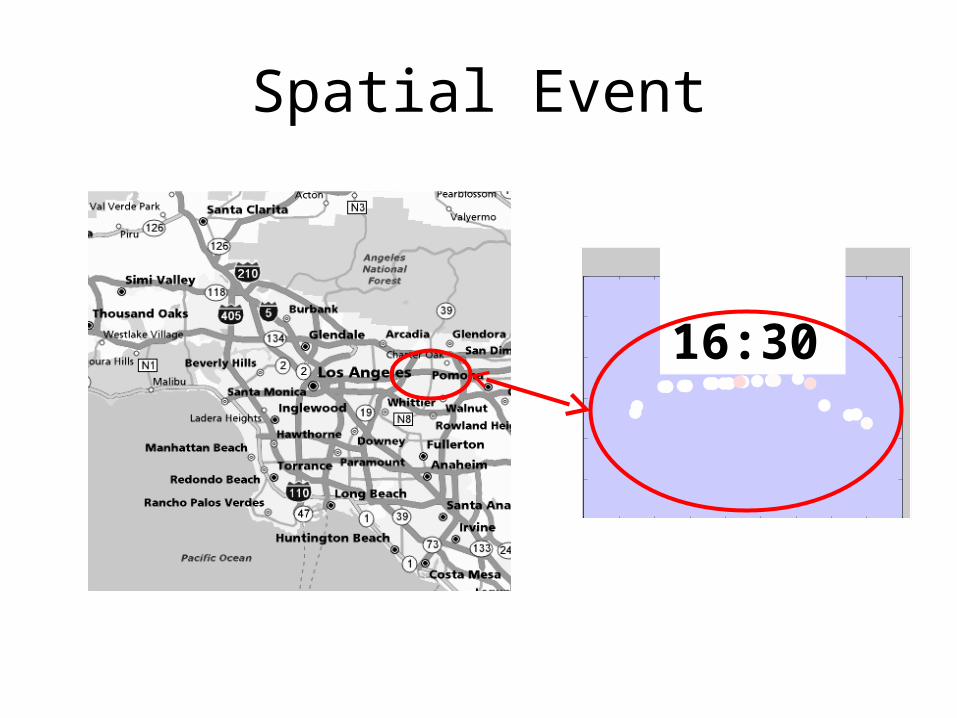
16:30
Spatial Event
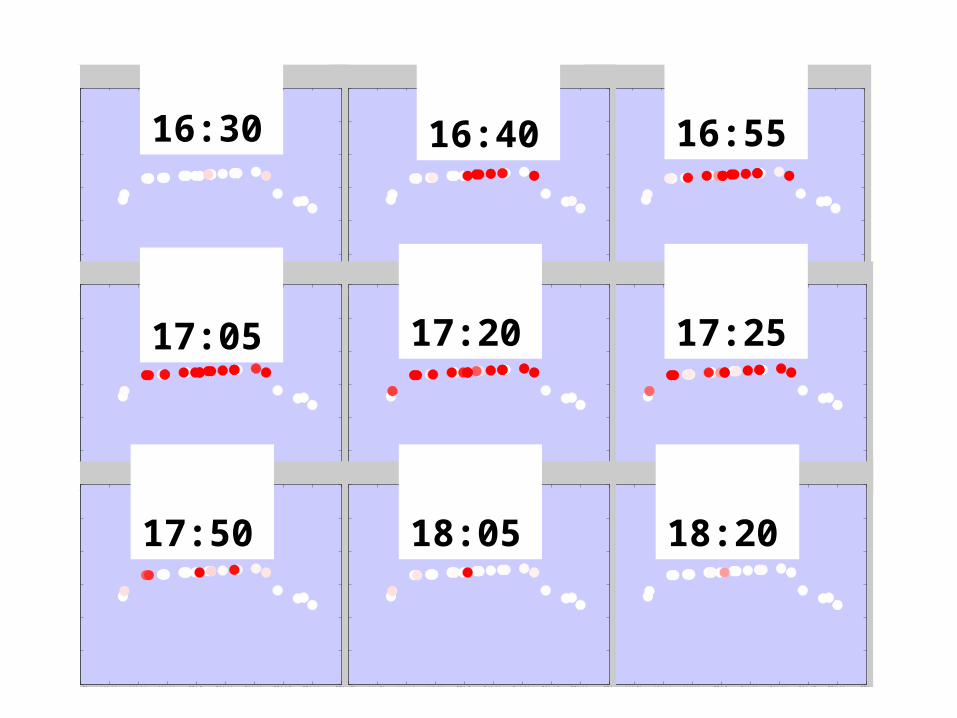
16:30 16:40 16:55
17:05 17:20 17:25
17:50 18:05 18:20
6:00 12:00 18:000
10
20
30
40
me
an
no
rma
l co
un
t
Monday
6:00 12:00 18:000
10
20
30
40
me
an
no
rma
l co
un
t
MondayTuesday
6:00 12:00 18:000
10
20
30
40
me
an
no
rma
l co
un
t
MondayTuesdayWednesdayThursdayFriday
6:00 12:00 18:000
5
10
15
20
25
30
35
me
an
no
rma
l co
un
t
MondayTuesdayWednesdayThursdayFriday
6:00 12:00 18:000
10
20
30
40
me
an
no
rma
l co
un
t
MondayTuesdayWednesdayThursdayFriday
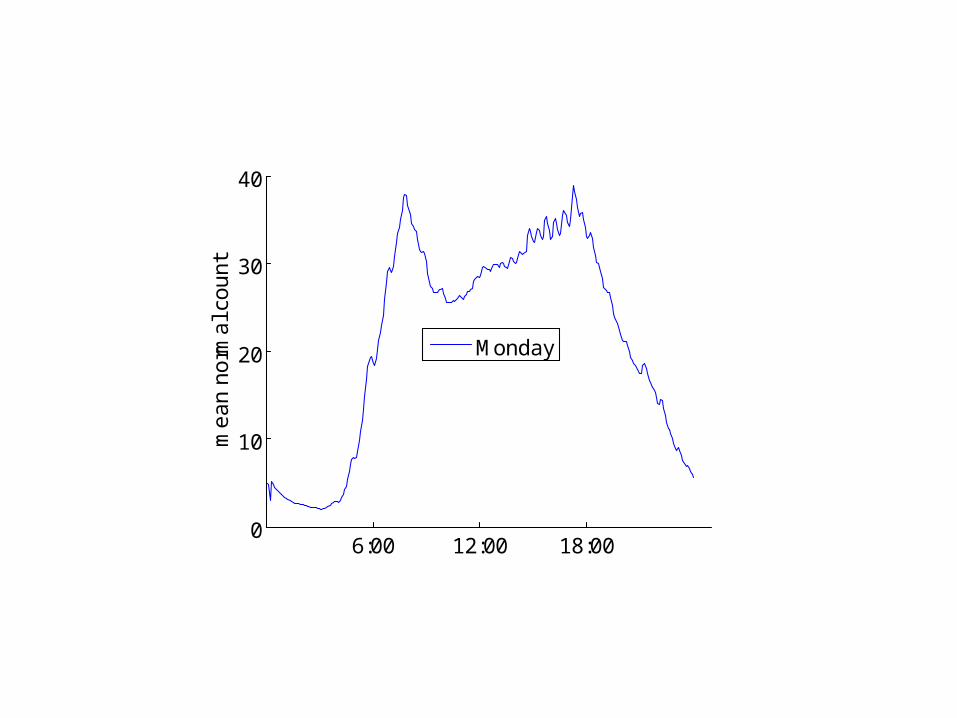
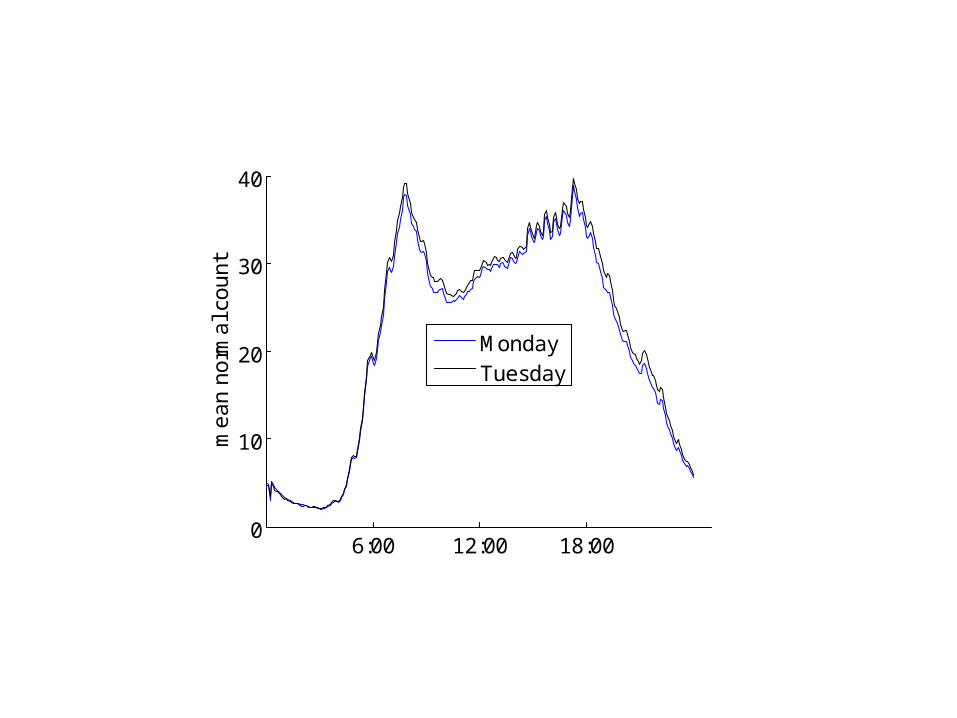
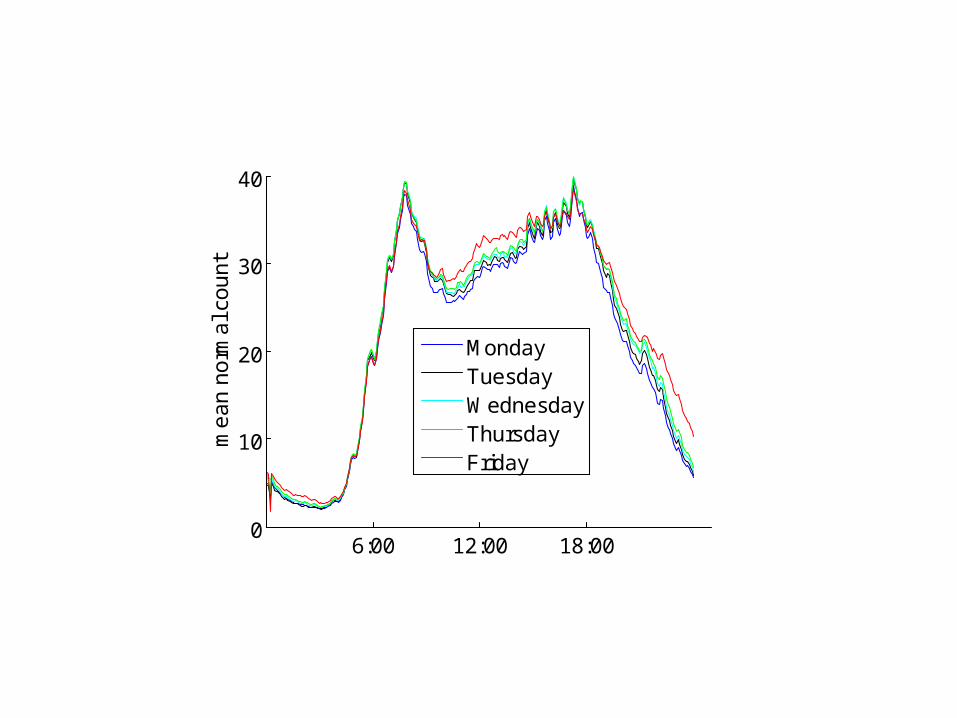
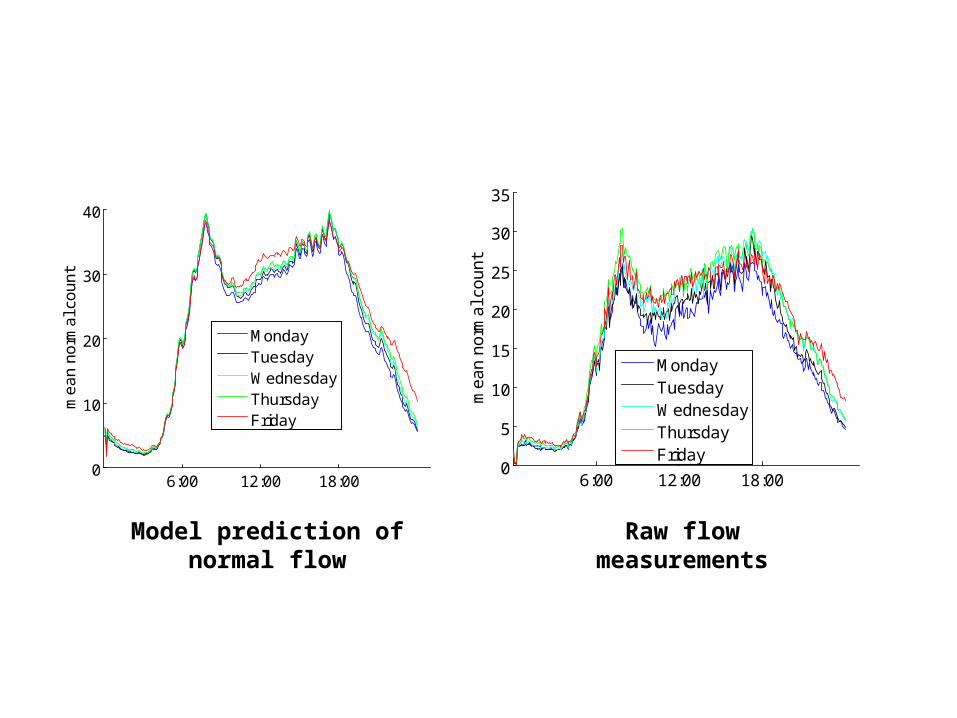
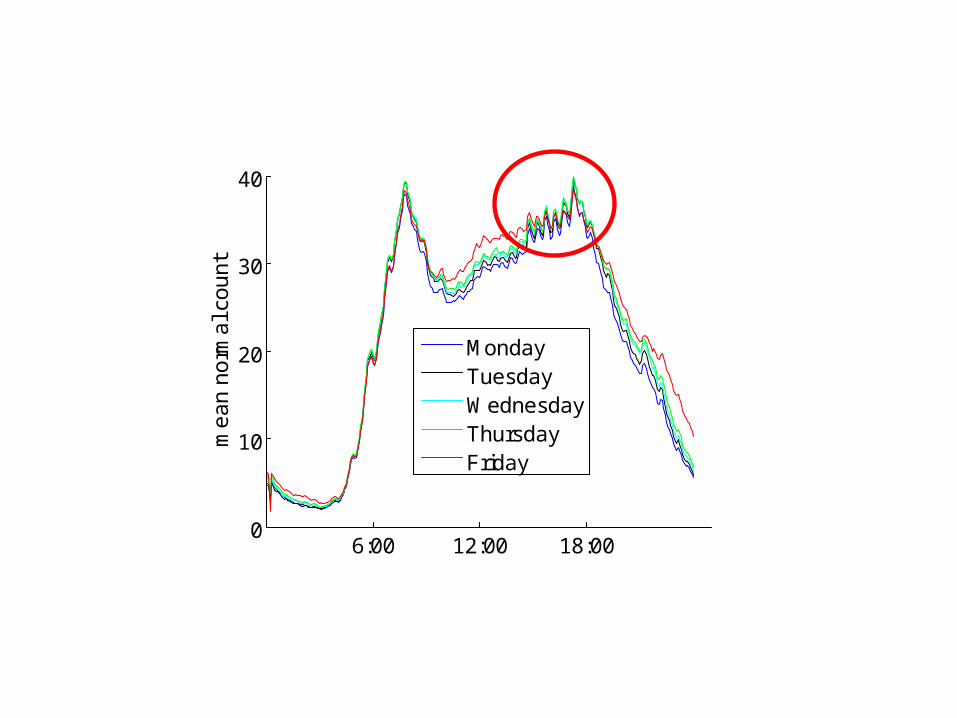
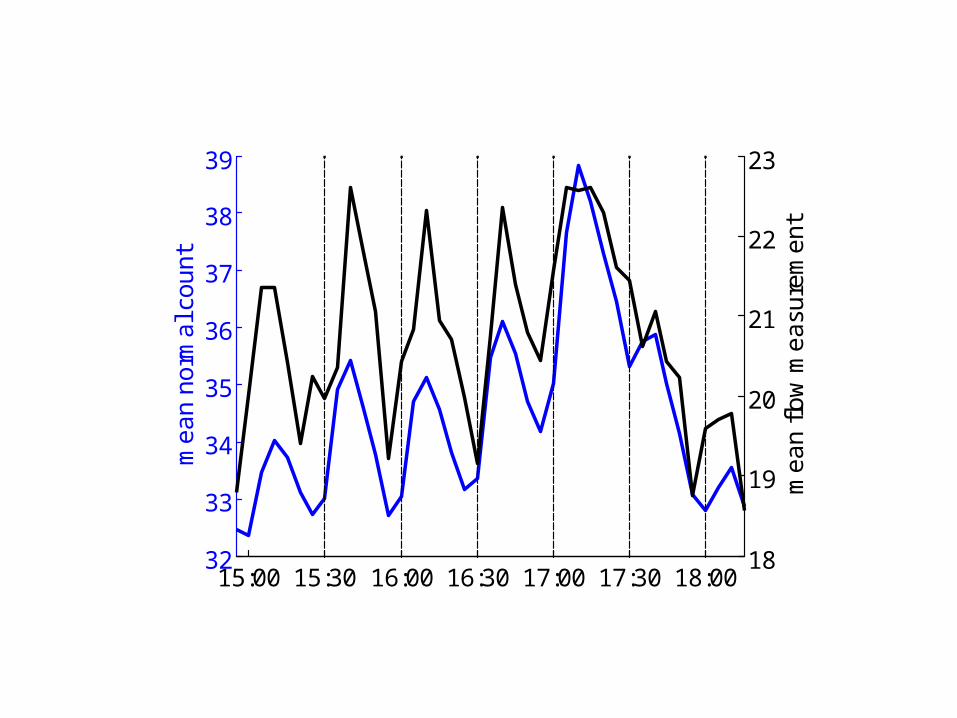
Model prediction of normal flow
Raw flow measurements
6:00 12:00 18:000
10
20
30
40
me
an
no
rma
l co
un
t
MondayTuesdayWednesdayThursdayFriday
32
33
34
35
36
37
38
39m
ea
n n
orm
al c
ou
nt
15:00 15:30 16:00 16:30 17:00 17:30 18:0018
19
20
21
22
23
me
an
flo
w m
ea
sure
me
nt

6:00 12:00 18:000
5
10
15
20
25
30
35
me
an
no
rma
l co
un
t
MondayTuesdayWednesdayThursdayFriday
6:00 12:00 18:000
10
20
30
40
me
an
no
rma
l co
un
t
MondayTuesdayWednesdayThursdayFriday
Model prediction of normal flow
Raw flow measurements
Conclusions• Extended our earlier work to add a fault-tolerant
component• Our new model automatically learned normal and
anomalous behavior for over 1700 sensors and 100 million measurements
• This approach has made possible analysis of a large-scale urban traffic sensor data set that was previously considered beyond analysis