product trends in life insurance - aktuaris.or.id - recent product trends_pai 2017... · milliman...
TRANSCRIPT

Product Trends in Life Insurance
PAI Congress 2017
David Kong & Gita Himawan
26 October 2017

Agenda
2
1
2
3
4
Current product landscape in Indonesia
What could we expect going forward?
Implications to actuaries
How can actuaries prepare?
5 Q&A

1 Current product landscape in Indonesia

Source: AAJI
Overview of life insurance marketWeighted new business (NB) premium (IDR billion)
-
5,000
10,000
15,000
20,000
25,000
30,000
35,000
2009 2010 2011 2012 2013 2014 2015 2016
4
Sustained expansion of the life insurance market, with a compound annual growth rate weighted new business premium of 14%, in the period from 2009 to 2016.
Investment-linked products continue to be the most popular product category, although sales have grown at a slower pace in recent years than traditional products
Bancassurance poised to overtake agency
49%
48%
45%
39%
33%
31%
33%
38%
12%
13%
13%
14%
5%
5%
7%
5%
0% 20% 40% 60% 80% 100%
2013
2014
2015
2016
Agency Bancassurance DM/TM
Employee Benefit Micro Insurance Others
Distribution mix (based on weighted new business premium)Product mix (based on weighted new business premium)
19%
18%
20%
23%
22%
22%
23%
22%
59%
59%
57%
55%
0% 20% 40% 60% 80% 100%
2013
2014
2015
2016
Individual Group Unit Linked

Recent observations on products
5
Variations of Unit-linked
Focus on yields
Seeking guarantees
More medical
coverage

Variations of Unit-linked
6
Front End Load
• Deemed to be prioritising protection as compared to investment
• Very low allocation to investments, can be as low as 0% in the first year
• Typically sold through agents
Hybrid
• Balanced allocation between protection and investment.
• Medium to moderate allocation to investments
• Charges are typically applied for withdrawals
• Typically sold through bancassurance channel
Back End Load
• Deemed to be prioritising investment through 100% allocation to investments in the first year (typically), while still receiving protection benefits
• Charges are typically applied for withdrawals
• Typically sold through bancassurance channel
– Emergence of back-end loaded unit-linked and hybrid unit-linked variants to cater to different market segments

Focus on yields still prominent
7
Policyholder return which are typically higher than time deposits offered at
banks (can be guaranteed)
Protection benefits:
- Death due to accidents
- Total permanent disability
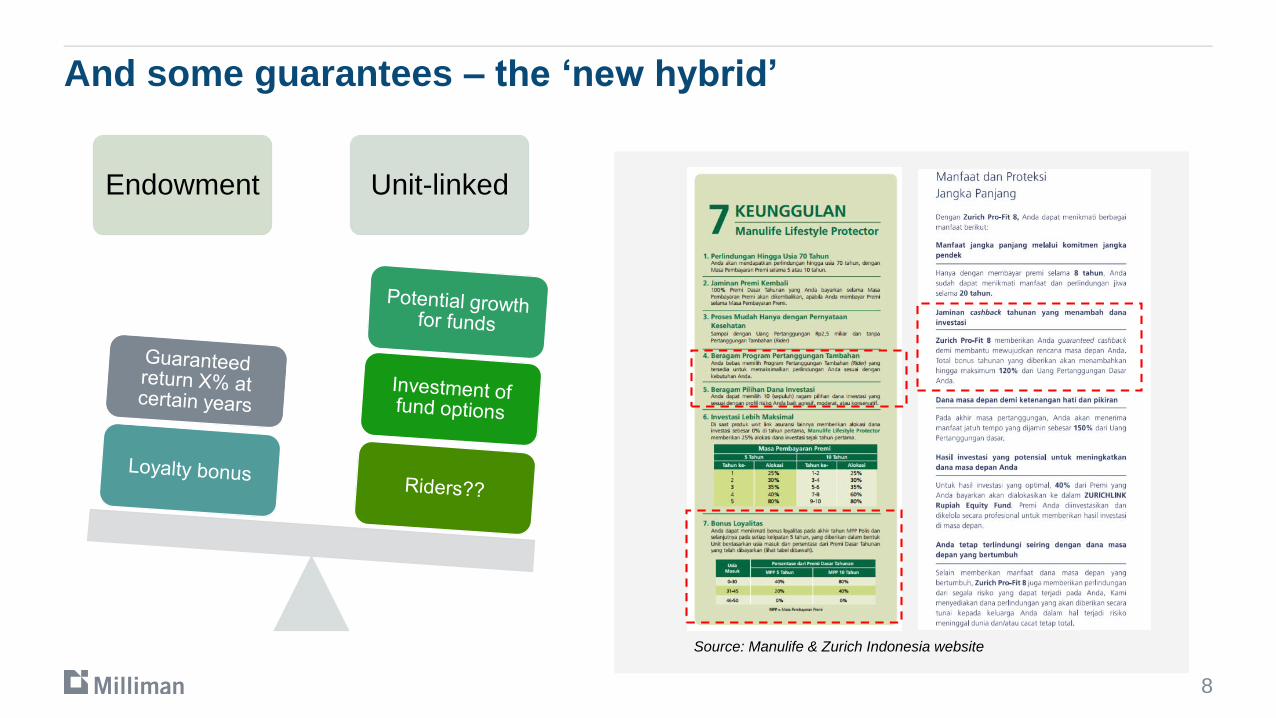
And some guarantees – the ‘new hybrid’
8
Endowment Unit-linked
Source: Manulife & Zurich Indonesia website

More medical coverage
9
Medical benefits
Critical illness – a numbers
game
Hospital & Surgical benefits
Cashless or as-charged
Mostly attached to
Unit-linked as riders
International coverage (can
be used in multiple
countries, especially Singapore, Malaysia, Indonesia)

2 What could we expect going forward?

Demand for higher yields and guarantees to continue
11
– Central bank started cutting benchmark interest rates
– Inflation rates and deposit rates are also showing signs of decreasing since 2014.
– Policyholders are expected to continue looking for higher yields and guarantees
Source: investing.com & inflation.eu
0.00%
2.00%
4.00%
6.00%
8.00%
10.00%
Dec-10 Dec-11 Dec-12 Dec-13 Dec-14 Dec-15 Dec-16
Indonesia 10-year Government yields and inflation rates
10-Year Inflation

Demand for more protection
12
– Medical costs & protection gap is increasing
Source: Aon Global Medical Reports
Source: Swiss Re 2015 Asia Pacific Mortality Protection Gap Report
0.0%
2.0%
4.0%
6.0%
8.0%
10.0%
12.0%
Indonesia Asia Average
Net annual medical inflation rate
2013 2017

Past
Present
Future
Demand for faster point-of-sale closing
13
• Need for fast closing, accurate underwriting and pricing – a role for actuaries?
• Also with more online pricing info available, consumers will want more ‘value for money’
• Hot off the press: Baidu (a China-based web services provider) acquired a pan-China insurance agency license to offer products online
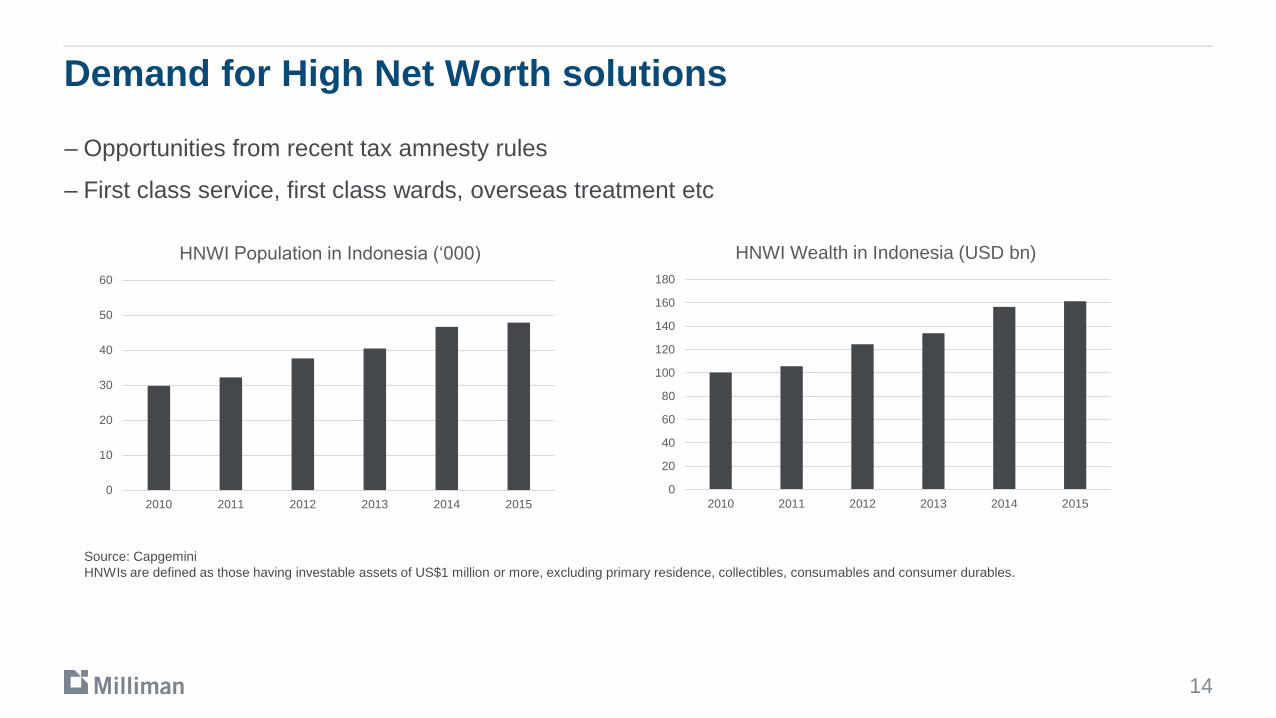
Demand for High Net Worth solutions
14
– Opportunities from recent tax amnesty rules
– First class service, first class wards, overseas treatment etc
0
10
20
30
40
50
60
2010 2011 2012 2013 2014 2015
HNWI Population in Indonesia (‘000)
Source: Capgemini
HNWIs are defined as those having investable assets of US$1 million or more, excluding primary residence, collectibles, consumables and consumer durables.
0
20
40
60
80
100
120
140
160
180
2010 2011 2012 2013 2014 2015
HNWI Wealth in Indonesia (USD bn)

Syariah compliant products
15
Slow but steady growth since
2011.
Large Muslim population at 207.2 million (87% of the population)
combined with expected good
GDP growth rate indicates future
growth potential.
Low penetration rate signifies
potential growth opportunities,
particularly within Takaful
Efforts by the regulators, Takaful
players and the Syariah council to develop market
awareness
Spin-off requirements
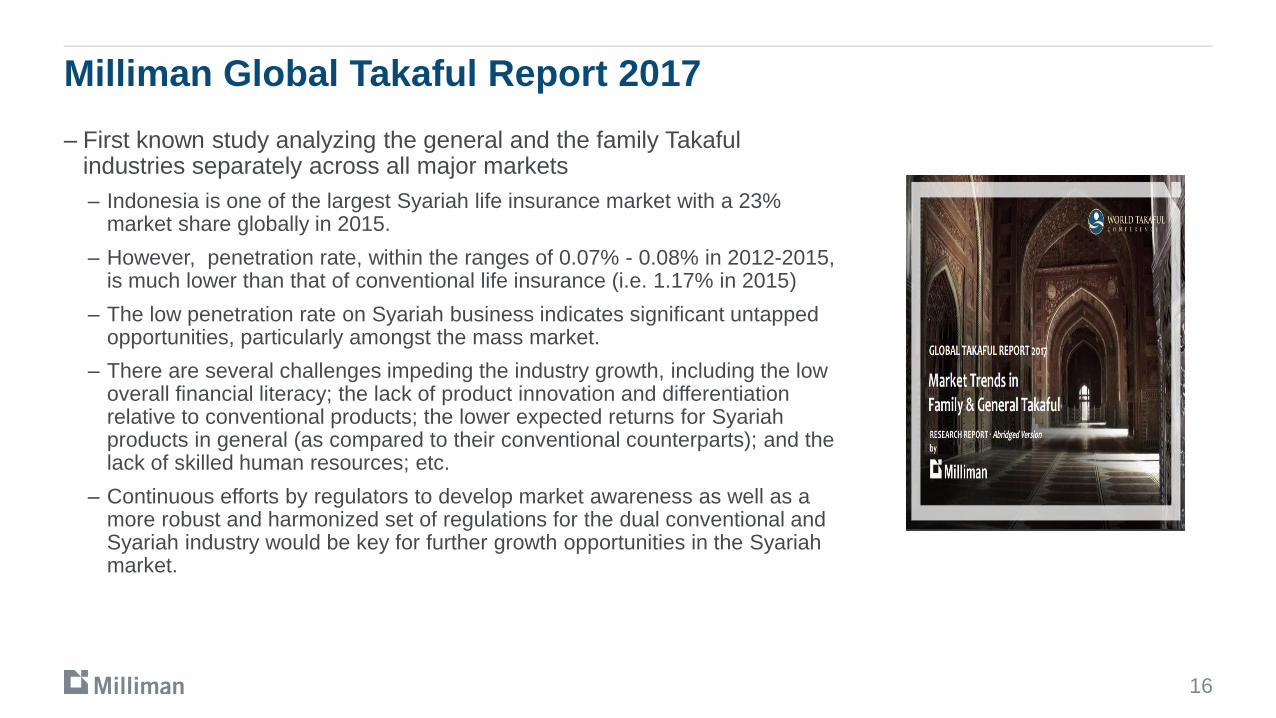
Milliman Global Takaful Report 2017
16
– First known study analyzing the general and the family Takaful industries separately across all major markets
– Indonesia is one of the largest Syariah life insurance market with a 23% market share globally in 2015.
– However, penetration rate, within the ranges of 0.07% - 0.08% in 2012-2015, is much lower than that of conventional life insurance (i.e. 1.17% in 2015)
– The low penetration rate on Syariah business indicates significant untapped opportunities, particularly amongst the mass market.
– There are several challenges impeding the industry growth, including the low overall financial literacy; the lack of product innovation and differentiation relative to conventional products; the lower expected returns for Syariahproducts in general (as compared to their conventional counterparts); and the lack of skilled human resources; etc.
– Continuous efforts by regulators to develop market awareness as well as a more robust and harmonized set of regulations for the dual conventional and Syariah industry would be key for further growth opportunities in the Syariahmarket.

Scope for retirement products?
17
– Only a small proportion of workers that have set aside a portion of their income for future savings
– Current regulations do not allow retirees to receive lump sums Provides opportunities for companies to innovate and offer new pension products, including Syariah-compliant products to tap into the majority Muslim market.
– Some of the operators are still small in size and might not be ready to bear the risks from pension products which have long-term liabilities
– Beware of mismatching or concentration risk, which will further increase capital requirements

Scope for retirement products?
18
Source: Prudential Corporation Asia East Asia Retirement Survey 2015 – Indonesia Report
Indonesians are anxious about their retirement security
Indonesians are divided about who should be
responsible for retirement income.
Indonesians thinks retirement age should be raised and workers should be encourage/required
to save more for retirement

3 Implications to actuaries

Expectation for actuaries
20
Customers
Better coverage
Cheaper price
Shareholders
Highly ‘sellable’ product
Sustainable profits
Regulators
Capital and reserving adequacy
Policyholder protection

In reality…
21
Sellable products might not be profitable
Not all products are ‘RBC-friendly’
Companies might have different risk appetite
Actual not equal to expected
New / emerging risks to consider
Are there any one-size-fits-all
products?

4 How can actuaries prepare?
Actuaries leading the future
23
Possible roles for actuaries (not exhaustive)
– Product pricing
– Understanding nature of product risks
– Setting appropriate assumptions
– Post-launch monitoring
– Risk & capital management
– Leveraging on existing regulatory requirements: Risk based supervision, financial projection
– Taking it to another level

Product pricing – understanding risk
24
– Understanding product risks
– Holistic view: product level; dependencies on other products
– Positioning of each products against risk appetite of the company
• Risk A
• Risk B
Unit-linked
• Risk C
• Risk D
Whole Life
• Risk E
• Risk F
Term
• Risk G
• Risk H
Medical
• Risk I
• Risk J
Endowment

Product pricing – setting assumptions
25
– Setting appropriate pricing assumption
– Analysis of historical experience
–Accurate and reliable data is required
–Extracting insights on policyholder behavior using data analytics
– Benchmarking of product assumptions
ExpensesPersistency / Lapse rates
Investment returnMortality and
Morbidity
Reinsurance Inflation rate
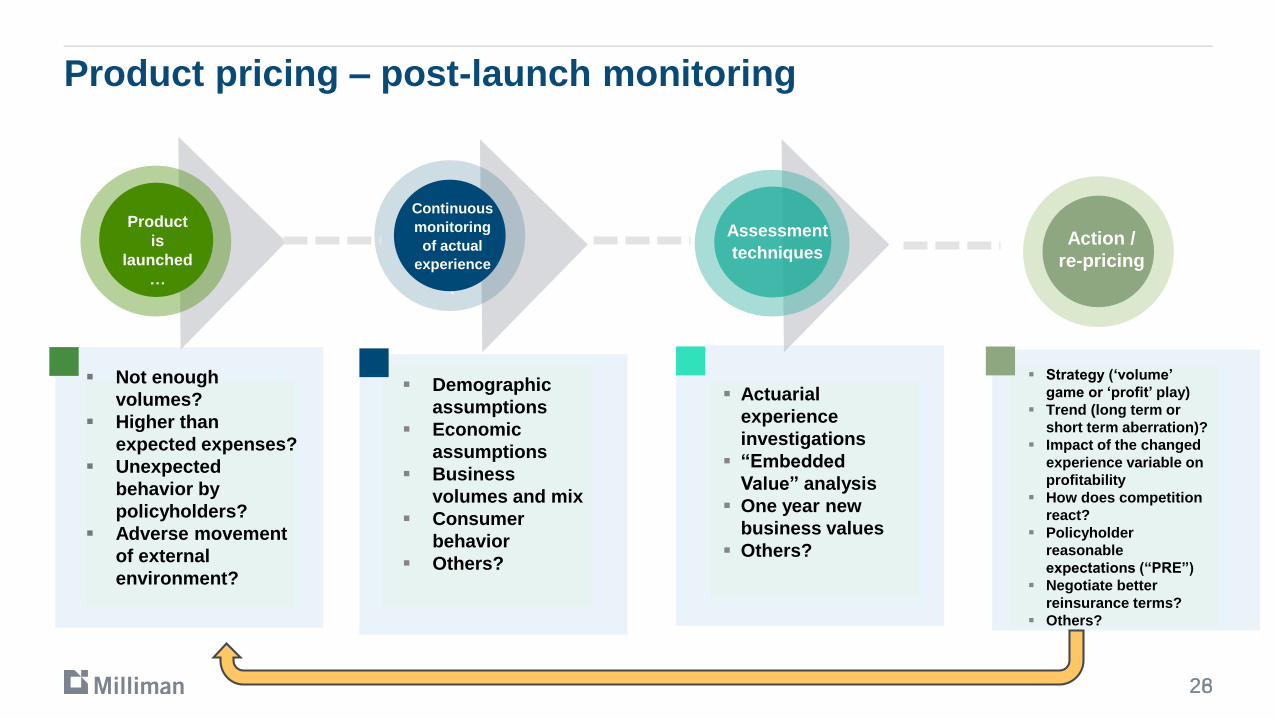
Product pricing – post-launch monitoring
2628
Product
is
launched
…
Continuous
monitoring
of actual
experience
`
Assessment
techniques
Not enough
volumes?
Higher than
expected expenses?
Unexpected
behavior by
policyholders?
Adverse movement
of external
environment?
Demographic
assumptions
Economic
assumptions
Business
volumes and mix
Consumer
behavior
Others?
Actuarial
experience
investigations
“Embedded
Value” analysis
One year new
business values
Others?
Continuous
monitoring
of actual
experience
Strategy (‘volume’
game or ‘profit’ play)
Trend (long term or
short term aberration)?
Impact of the changed
experience variable on
profitability
How does competition
react?
Policyholder
reasonable
expectations (“PRE”)
Negotiate better
reinsurance terms?
Others?
Action /
re-pricing

Risk & Capital: Risk based supervision
27
– OJK Regulation 10/POJK.05/2014
Sets out the method to be adopted when assessing and reporting
the level of risk that the company is exposed to.
General principles of the risk assessment are it must be risk based,
consider materiality of risks and must cover all areas of risk.
Companies are obliged to submit result of risk assessment to the
regulator at least once a year.
OJK has listed the key areas of risk that companies should base
their assessment on.
Based on the risk level attained, insurers are required to devise
appropriate follow-up action plans to improve its risk management
practices going forward.
Key PointsRisk Level Assessment of Insurance & Reinsurance Companies
Strategy
Operational
Asset &
Liability
Insurance
Management
Governance
Support Fund
Inherent Risk
Management
& Control
Net Risk
Overall Risk
Value
Inherent risksare measured separately
allowing for risk management and controls in place, which are then aggregated to give the overall risk level of the
business.
The risk assessment is
simplistic and focuses on
qualitative aspects rather than quantitative.

Risk & Capital: Financial projections
28
– Regulation PER-10/BL/2012
– Actuary Report should contain financial projections (Profit and Loss statements and Balance Sheets) for the next five years.
– The financial projections should include a base scenario, an optimistic scenario and a pessimistic scenario that includes the impact of the following pessimistic assumptions
– financial crisis;
– inflation higher than expected;
– catastrophic loss events;
– lower investment returns;
– lower new business volumes;
– increase in discontinuance rates; and
– increase in claims

Risk & Capital: Internal Target Capital Levels
29
Surplus capital
Internal Target Level Requirement
Total Capital Available
Operational Risk
Insurance Risk
Market Risk
Liquidity Risk
Credit Risk
100% Required Capital
At least 20% Required Capital
Indonesian RBC Framework
– Companies are required to now determine internal target capital level commensurate to their risk profile

Risk & Capital: Taking it to another level
30
Risk Appetite
Risk Identification
and classification
Risk Quantification
Monitoring, Reporting on Management Information
• Define the risk appetite of the Company• Choose key global indicators for measurement of risk
appetite and set minimum levels for these indicators • Select the adverse scenarios• Select an appropriate time horizon
• Develop a system of limits based on readily observable KPIs• “Source of risk” limits• “Source of exposure” limits
• Design MI dashboard to reflect the system of limits
• Develop models capable of evaluating the global indicators• Calculate the global indicators as outlined in the risk appetite
statement• Current situation (central scenario) and stress scenarios
• Calculate risk limits and generate MI reporting templates
• Develop a list of risks to which the Company is exposed
• Construct a risk register : Evaluate & classify each risk
• Construct a risk inventory : Owner of risk, sources of exposure

Risk & Capital: Taking it to another level
31
Pre-selected risks suitable with
company’s risk profile
Determine financial impact
of each risk
Determine diversification
impact between risks (if applicable)
1 2 3
Minimum RBC= 130%
Minimum RBC= 130%
Minimum RBC= 130%
Stress 1: Increase mortality
Stress 2: Shift in Risk free yield
Stress 3: Decrease in equity value
Stress 4: Increase in lapse
Total financial impact of risks
(after diversification)
Total financial impact of risks
(before diversification)
Internal Target Capital Level
Note: Example from Malaysia ICAAP framework

Risk & Capital: Taking it to another level
32
Current solvency significantly above target capital level
80% 100% 120% 130% 150%
150%: Management capital level in normal market conditions
130%: Capital buffer in stressed market conditions
120%: Regulatory intervention point
- Various capital levels defined, along with specific trigger events and management actions

Risk & Capital: Phases in risk management
33
Applic
ations
Te
ch
niq
ue
s
ALM
Scenario
analysis
Risk
evolution:
cladistics
Business
Continuity
Plans
Risk
registers
Risk
CultureRisk
interdependencies
Economic
Capital
Regulatory
Capital
ORSA
Resilience
& learning
Predictive
Analytics
Governance – 3
lines of defense
Risk
processes
and policies
Risk
Appetite
Loss
collection
System
dynamics:
Cognitive
mapping
Sensitivity
Analysis
Stress
testing
Causal
driver
identification
Reverse
stress
testingRisk
indicators Risk integration:
Bayesian Networks
Audit &
compliance
Behavioural
information
NetworksRoot cause
analysis
Strategic
decisions
Increased recognition of complexity prediction to explanation

Risk & Capital: Back to the basics
34
– Risk and capital management framework are NOT about:
– Just addressing the guidelines (ticking the boxes)
– Creating a very complex process – output not fully understood
– Designing a complex mathematical model
– Creating a huge report – key messages unclear
– But are about
– Better risk awareness
– Understanding the overall solvency needs of the company
– Increased alignment between risk appetite and strategy
– More insightful decision making
– Improved capital efficiency

5 Q&A

36
Any questions?
Disclaimer: This presentation is intended solely for informational purposes and presents information of a general nature. It is not intended to guide or determine any
specific individual situation and persons should consult qualified professionals before taking specific actions. Neither the presenters, nor the presenters’ employer, shall
have any responsibility or liability to any person or entity with respect to damages alleged to have been caused directly or indirectly by the content of this presentation.
David KongFSA, FSAS, FASM
Consulting Actuary
T: +65 6327 2306
Gita HimawanASA
Associate Actuary
T: +62 21 2553 2599 ext 109