productivity and scheduling of intermodal terminals in a
TRANSCRIPT

Article for the hEART 2014 conference
Productivity and Scheduling ofIntermodal Terminals in a Railroad
Network Context
René Schönemann∗
August 15, 2014
This paper investigates the productivity of intermodal transhipment ter-minals under the consideration of influences from the railway network.Whereas the maximum turnover of a terminal is usually stated in loadingunits handled per year, its real productivity depends on external influencessuch as the train timetable, the service quality of the railway network it isconnected to, or internal process flows. Using event-based simulation meth-ods, the study shows a network-oriented rail yard scheduling approach thatinvestigates the transport flow in intermodal transshipment terminals.
1 Motivation
The transshipment capacity of intermodal hubs is usually measured sep-arated from influences of the railroad network using terminal simulationtools, cf. e.g. (Carteni and De Luca, 2009). Also railway yard operationsare usually simulated in isolation using specific microscopic software tools,
∗Technische Universität Berlin, Chair of Railway Track and Operations,[email protected]
1
Dra
ft
cf. e.g. Nash and Hürlimann (2004). To the best of my knowledge, a com-bination of both, logistics and railroad simulation methods that evaluatethe productivity of intermodal hubs have not been studied until today ona microscopic level. The analysis presented here aims to combine both. Itshows how the integrated analysis can optimise the hub as a whole andidentify overall bottlenecks.By studying the operations of several European freight hubs it has been
found that there are numerous factors that are limiting their theoreticallycalculated capacity when loading to and from rail. A preliminary anal-ysis of railway-based process and operation flows came to the conclusionthat processes between the intermediaries of a transport chains are poorlyadjusted.Consequently, the productivity of the rail yard and therewith the produc-
tivity of the whole transshipment hub decreases. Uncoordinated transportflows and thus disruptions and delays in cargo forwarding have a negativeeffect on the transport times and on the productivity of railway facilitiesin hubs (long dwell times for trains, tracks blocked with unproductive pro-cesses). The identified problems are eminent for larger, highly utilised hubssuch as container terminals in seaports.
1.1 Transport and Process Flows in Logistics Hubs
Logistics hubs are nodes in a network where traffic flows merge and trans-port chains, means of transport and markets are connected. Logistics hubsare also the locations where transport flows break. High efforts for coordi-nation and many involved actors lower the theoretically calculated capacitywhen loading to and from rail. For the purpose of this paper, a logisticshub is understood as a conjunction of at least one transport system witha transshipment system as illustrated in Figure 1.In detail it comprises:
• Railway node: For example a marshalling yard where railway opera-tions such as shunting is carried out
• Transshipment System: Loading and unloading facilities such as sid-ings under gantry cranes
• Further Transport Node: If the hub connects two or more transportsystems, they would be joined adjacent to the transshipment system.
2
Dra
ft

Logistics Hub
Railway NodeRailway Node Transhipment System
Transhipment System
Rail / Road / Sea Node
Rail / Road / Sea Node
RailwayNetwork
Figure 1: Logic distinction of elements in a logistics hub
Trains arriving from the railway network follow a timetable. Also trans-shipment systems, such as larger container terminals, use management poli-cies to schedule train loading processes (Schönemann and Gille, 2009). Incontrast, the railway node operations are carried out without a real sched-ule on an operational level. This is also known as the improvised opera-tion or random schedule (Marinov and Viegas, 2011). Deviations from thetimetable have consequently a negative effect on the transport times andon the productivity of railway facilities in hubs. With its improvised policy,the railway node between the rail network and the transhipment systembecomes the weakest member of the transport chain where it suffers frominfluences from the external rail network and the transshipment terminal.
1.2 Present Rail Yard Scheduling Approach
The planning of railway capacity utilisation at intermodal terminals is car-ried out using simple methods. Strategic and tactical planning horizonsdevelop schedules determining the track occupation on a daily or weeklybasis. The results are track occupation plans exemplarily shown in Fig-ure 2. These plans are prepared manually or with the help of spreadsheetsoftware. Although, for small terminals with limited numbers of trains nospecial software is required, the downsides of this macroscopic planningapproach become evident: Often, only one train per day is scheduled ona track. The rough plan includes large amounts of slack time. Moreover,the effective time consumption of single processes is unknown in this roughplan and rescheduling is carried out an operational basis. This leads tolarge amounts of idle time for infrastructure and machine utilisation.
3
Dra
ft

Figure 2: Exemplary track occupation plan for a small intermodal terminal with four loading tracks (24hour scheme)
4
Dra
ft

Apparently, there is a high potential of creating more efficient schedulesthat allow reducing the dwell time of freight wagons in the terminal. Todetermine this, a more detailed process analysis is required. A possibleapproach is presented in the following sections.
2 Methodology
In a first step, process durations have been measured in terminals of theport of Hamburg, Frankfurt (Oder) and Bologna. Whereas the port ofHamburg covers a complex and highly utilised railway infrastructure serv-ing several rail-sea transshipment terminals, the two other locations serveas rail-road terminals that are suitable for demonstrating the methodologyof the analysis.Own measurements and data from IT systems were used to elaborate
durations for railway-specific operations such as shunting or wagon breaktests, and for logistics operations such as cargo inspection or transshipment.Relations between processed were identified to determine process structuresand flows.The data were used to develop distribution functions to be incorporated
in a microscopic simulation. Distribution functions were developed for hub-internal processes such as dwell times of container trains in specific tracks orthe transshipment of loading units. Also, a train delay function describingthe deviation of incoming trains from their timetable was developed tomodel external influences to the hub schedule.The result of this methodology is a combined railways and transship-
ment hub model implemented using the event-based simulation environ-ment Simul8. For the most detailed results it was favourable to implementa microscopic modelling approach which allows separating the node intoits single components. The components of the node are thought of as inter-connected queuing systems that interact and influence each other, so thatthe global impact of freight train operations in a rail network context iscaptured.
5
Dra
ft

3 Modelling Approach
The capacity of railway infrastructures can be measured analytically usingthe UIC Code 406 compression method (International Union of Railways(UIC), 2004). The method should allow the user “to carry out capac-ity calculations - following common definitions, criteria and methodologiesfrom an international standpoint - for lines/nodes or corridors” (Interna-tional Union of Railways (UIC), 2004) by using a standardised compressionmethod. During the compression, the blocking time stairways of timetablehave to be shifted together as close as possible. This allows calculating theoccupancy rate as the difference between the evaluated time period andthe time which is elapsed by the blocking times of the existing train paths.Finally, the occupancy rate has to be compared with limit values predictedin UIC Code 406 (c.f. Lindner, 2011).Even though the UIC Code 406 method enables the planner to determine
line capacities quite well, it cannot be applied for node capacity research.Lindner applies the method on railway stations and explains “why the oc-cupancy rate cannot provide a significant parameter for node station ca-pacity”. To determine a railway node’s productivity it is rather required todetermine the capacity utilisation of its assets, e.g. the length of occupancyof tracks or the transshipment time per train under the crane.Microscopic railway simulation tools provide good help when analysing
railway infrastructures. Logistics processes, however, cannot be mappedby them. But, the tools provide valuable data that can be used as inputparameters in further research. In this paper, the mapping for railway-related and logistics processes is carried out using the event-based simu-lation environment Simul8 (Concannon, 2003) which permits recognisingrelationships between processes, their durations and infrastructure occu-pation times. Some of its simulation parameters could be gained frommicroscopic railway simulations beforehand.The model of a road-to-rail intermodal terminal has been set up in the
simulation environment as illustrated in Figure 3. It consists of a smallmarshalling yard of four formation tracks and two loading tracks for cargotransshipment. The model performs railway operations such as shuntingor train making and loading/unloading processes. The formation tracksperform processes such as train inspection, brake test etc. One shunting
6
Dra
ft

Figure 3: A simple intermodal terminal in Simul8 with two loading tracks and a small marshalling yard offour formation tracks
locomotive operates at the modelled yard. Its operational properties anddriving dynamics were taken from a prior microscopic railway simulationof the marshalling yard. The transshipment processes at the loading tracksare operated by reach stackers.As illustrated in Figure 3, the railway infrastructure in a terminal is
usually divided into two parts:
Formation Tracks: These tracks hold incoming and outgoing trains. Theyare used for specific processes such as coupling of wagons, brake test, orinspection of freight.
Loading Tracks: The tracks are located in the terminal itself and usedfor loading and unloading freight wagons. Specific equipment such as reachstackers or container crane are used for the transshipment processes.
4 Analysis and Computational Results
4.1 Process Sequencing in Rail Yards
The various processes a train has to pass through are interconnected andsubject to the process control. The simulation environment allows to regard
7
Dra
ft
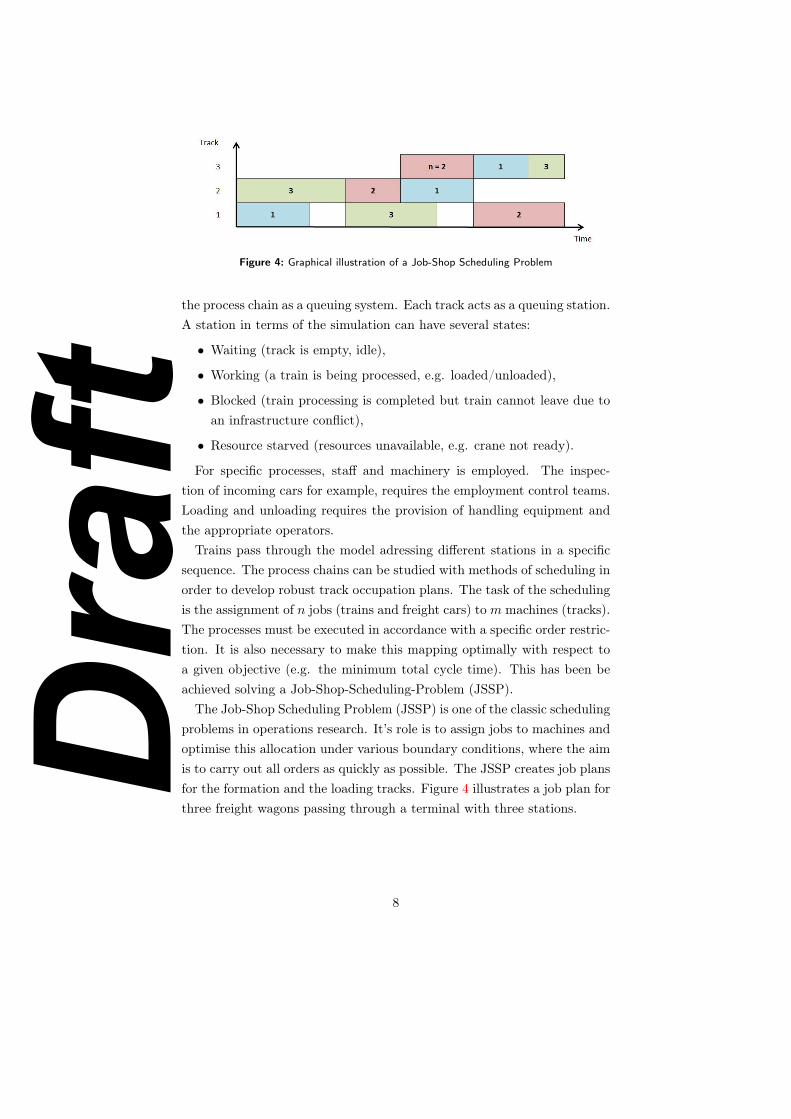
Figure 4: Graphical illustration of a Job-Shop Scheduling Problem
the process chain as a queuing system. Each track acts as a queuing station.A station in terms of the simulation can have several states:
• Waiting (track is empty, idle),
• Working (a train is being processed, e.g. loaded/unloaded),
• Blocked (train processing is completed but train cannot leave due toan infrastructure conflict),
• Resource starved (resources unavailable, e.g. crane not ready).
For specific processes, staff and machinery is employed. The inspec-tion of incoming cars for example, requires the employment control teams.Loading and unloading requires the provision of handling equipment andthe appropriate operators.Trains pass through the model adressing different stations in a specific
sequence. The process chains can be studied with methods of scheduling inorder to develop robust track occupation plans. The task of the schedulingis the assignment of n jobs (trains and freight cars) tom machines (tracks).The processes must be executed in accordance with a specific order restric-tion. It is also necessary to make this mapping optimally with respect toa given objective (e.g. the minimum total cycle time). This has been beachieved solving a Job-Shop-Scheduling-Problem (JSSP).The Job-Shop Scheduling Problem (JSSP) is one of the classic scheduling
problems in operations research. It’s role is to assign jobs to machines andoptimise this allocation under various boundary conditions, where the aimis to carry out all orders as quickly as possible. The JSSP creates job plansfor the formation and the loading tracks. Figure 4 illustrates a job plan forthree freight wagons passing through a terminal with three stations.
8
Dra
ft

4.2 Theoretic Capacity and Marginal Efficiency
Simul8 uses dynamic discrete simulation building a queuing system tomodel flows of processes. The model allows any conclusions on the through-put behaviour of the stations, possible bottlenecks, and handling strategies.Each element of the model can be understood as a station i ∈ I of a
queuing system. The service rates µi for each station i have been deter-mined by empirical studies and are expressed as distribution functions foreach station. Another crucial variable is the arrival rate λ which representsthe intermediate arrival time where trains are entering the system.In the initial simulation scenario λ and µi are kept constant in order
to determine the theoretic throughput capacity of the overall hub system.It can be expressed as the service time of the whole system s. In furtherscenarios stochastic impacts are introduced to determine the impact ofdisturbances on the hub’s productivity.In order to determine the hub’s overall maximum capacity and the effects
of overload, a first simulation is run using deterministic (fixed) service rateson all stations. The arrival rate λ = 1
Eiwith Ei = const (stochastically
independent and equally distributed) was stepwise decreased during severalsimulation runs in the interval 180 ≥ Ei ≥ 60 min. As a measure of qualitythe average time of trains in the system t̄ = 1
n
∑Tn, with n ∈ N as the
set of all trains and Tn as the overall time of train n in the system, wasmonitored.Figure 5 illustrates the results of the simulation: When the intermediate
arrival time λ is low, t̄ is stable on a low level. When rising λ, more trainsarrive at the hub per time period. Thus, t̄ increases at a certain pointdue to hub-internal congestion effects, which can still be caught and donot cause congestion phenomena outwards. If one increases λ further sothat λ > t̄, trains pile up in front of the hub (Average Time in Queue >0 in Figure 5). Now t̄ rises to a higher but constant level. Consequently,overload does not only lead to congestion phenomena on railway networkstructures outside the terminal. Also internal blockades occur that resultin slower processing of trains through the hub. The throughput time oftrains or wagons (and cargo) through the hub increases.
9
Dra
ft

Figure 5: Determination of the terminal’s performance limit: Congestion appears at the terminal entrancewhen the arrival rate is high (green line). Overload results in an overall slower processing and has a negativeeffect on the train handling time.
4.3 Detection of Bottlenecks
While the previous section investigated the hub as a whole, it is useful toexamine the performance of single stations in detail to discover bottlenecks.Figure 6 illustrates the utilisation of a loading track in the model subjectto the arrival rate λ. The utilisation of the track increases with λ (greenline). Simultaneously, the idle time decreases (blue line). In the left graphthe utilisation rate remains at about 45% but resource starvations arise(yellow line). In these cases it was identified that no reach stacker wasavailable while trains were waiting to be served. By employing an addi-tional reach stacker, it was possible to raise the utilisation rate of the trackand reducing the resource starvations (right graph of Figure 6). However,now blockades (red line) occur which indicate a bottleneck on another in-frastructure element of the hub. It can be solved by analysing other hubelements.
10
Dra
ft

●●●●●●●●●●●●●
●
●●●
●●●●
●
●
●
0
20
40
60
80
20406080100120140160180200220240Interarrival Time [min]
Sha
res
in %
Loading Processes
● Waiting %
Working %
Blocked %
Resource Starved %
●●●●●●●●
●●●●●●●●
●●●●●
●
●
●
0
20
40
60
80
20406080100120140160180200220240Interarrival Time [min]
Sha
res
in %
Loading Processes
● Waiting %
Working %
Blocked %
Resource Starved %
Figure 6: Utilisation analysis of a loading track. Left: Resource starvations occur because tranship-ment facilities are not ready. Productivity is low. Right: Increasing transhipment capacity allows higherproductivity but causes another bottleneck elsewhere.
5 Stochastic Effects and their Impact on the
Network
5.1 Process Duration Uncertainty
In section 4 the service rate µi and the arrival rate λ were fixed to an averagevalue for each station i. An initial job schedule with twelve trains callingthe hub was created. Train arrivals were distributed equally over time andprocessing durations at the stations were constant. In this ideal processflow scenario (see Figure 7) idle time could be minimised and occupancyconflicts be avoided. The result illustrates the best (theoretic) job schedulefor the simulation model.The best possible utilisation of handling equipment is rarely feasible and
not very realistic. In order to examine stochastic effects and their impactsin the hub’s productivity, distribution functions are used in the furtherexamination. Distribution functions were computed from observations atintermodal terminals for all stations of the simulation accordingly. Thisenables to analyse hub-internal process deviations and their impacts onthe transport chain. Figure 8 shows exemplarily the distribution functionused for the operations of loading tracks.
11
Dra
ft

SIMUL8 TimeView Report 0:00 0:40 1:20 2:00 2:40 3:20 4:00 4:40 5:20 6:00 6:40 7:20 8:00 8:40 9:20 10:00 10:40 11:20 12:00 12:40 13:20 14:00 14:40 15:20 16:00 16:40 17:20 18:00 18:40 19:20 20:00 20:40 21:20 22:00 22:40
Formation 1
Formation 2
Formation 3
Formation 4
Loading 1
Loading 2
Shunting
Reach Stacker
Network Queue
Figure 7: Occupation plan for all tracks in the first simulation scenario, λ ≈ 0.72 train arrivals per hour.
100 200 300 400 500
Distribution of service times at loading tracks
Dwell time [min]
Den
sity
100 200 300 400 500
0.00
00.
002
0.00
40.
006
f(x)Density
Figure 8: Distribution function of train service times in loading tracks
12
Dra
ft

SIMUL8 TimeView Report 0:00 0:40 1:20 2:00 2:40 3:20 4:00 4:40 5:20 6:00 6:40 7:20 8:00 8:40 9:20 10:00 10:40 11:20 12:00 12:40 13:20 14:00 14:40 15:20 16:00 16:40 17:20 18:00 18:40 19:20 20:00 20:40 21:20 22:00 22:40
Formation 1
Formation 2
Formation 3
Formation 4
Loading 1
Loading 2
Shunting
Reach Stacker
Network Queue
Figure 9: Occupation plan for all tracks in the last simulation scenario, λ ≈ 0.25 train arrivals per hour.
Stochastic data were inserted stepwise to create different scenarios. Thelast scenario, considering the most stochastic effects, is shown in Figure 9.Apparently, numerous track allocation conflicts (red blocks) occur. Thus,the processing time of the 12 planned trains raised from about 17 hours(initial scenario of Figure 7) to about 22 hours. Delayed trains generatefurther delays in the rail yard but have also an impact on the machineryand crew planning.In order to avoid such allocation conflicts, process delays need to be
incorporated in the schedules. The usual way, the integration of buffertimes, but again leads to an extension of the train dwell time. It is thereforeof particular interest to predict the reliability for the proposed schedulesin advance to minimise the time buffers required.Carey (1999) proposes an ex ante method using probabilities of delays
as a measure of reliability. The method has been developed for schedulesin public transport but can be transferred to freight transport schedules.Therein, the probability that a train t arrives or departs at a regardedstation after its scheduled time mt is given by
∫mt
−∞ dτ .For more in-depth information on this topic, please refer to the original
paper. At this point it shall be only noted that the probabilities calculatedby this method can be incorporated in the simulation model and thusenable the creation of reliable schedules.
13
Dra
ft

0.000
0.003
0.006
0.009
−140−90−40 10 60 11016021026031036041046051056061066071076081086091096010101060Deviation from Planned Arrival Time [min]
dens
ity
Figure 10: Sample of freight train arrival deviations on a network cross-section.
5.2 Train Arrival Uncertainty
Train arrival uncertainty is one of the most important constraints to plan-ning effectiveness in container terminals, especially in operational (short-term) planning. In mixed railway networks, where freight trains havea lower priority than passenger trains, deviation from the timetable areprevalent. Late as well as early arrivals up to several hours, as shown inthe sample of Figure 10, are possible.Likewise to the process duration uncertainty, the delays of arriving trains
were integrated as stochastic effects to the simulation model. This wasrealised using the achievements of (Wendler and Naehrig, 2004), where theauthors describe a method for the statistical analysis of train delay data.The reliable estimation of train arrival times is the key for successful
scheduling in intermodal terminals. An increase in terminal productivitycan be achieved by using methods of rescheduling at the operational levelwhen the estimated time of arrival (ETA) for a train is known.The current provision of ETA is not reliable due to unexpected circum-
stances in freight train forwarding. However, there are some approachesdeveloping to predict the ETA and to use these information in intermodal
14
Dra
ft

terminals and other freight nodes. Based on the findings so far, the conceptis currently being further developed by the author.
6 Summary
Intermodal transshipment hubs cannot perform their maximum capacityutilisation due to effects of internal and external disturbances on the processflows. The presented approach allows identifying influences of process flowdisturbances on individual elements of the hub and the detection of bottle-necks within the hub. Congested situations result in slower throughput oftrains through the node but also reduce effective available infrastructurecapacity.Identifying the infrastructure allocation conflicts is carried out by mi-
croscopic event-based simulation and the definition of appropriate trainschedules replacing the currently used improvised random schedule. Thesenew schedules are de-congested by introducing reliable buffer times basedof delay probabilities. Another strong impact on the schedule feasibilityhave delayed train arrivals. They can be tackled by an efficient reschedul-ing algorithm combined with methods for the reliable calculation of theestimated time of train arrival (ETA) for incoming trains.
References
Malachy Carey. Ex ante heuristic measures of schedule reliability. Trans-portation Research Part B: Methodological, 33(7):473–494, 1999. ISSN01912615. doi: 10.1016/S0191-2615(99)00002-8.
Armando Carteni and Stefano De Luca. Simulation of a container terminalthrough a discrete event approach: literature review and guidelines forapplication. In Association for European Transport, editor, EuropeanTransport Conference, 2009.
Kieran Concannon. Simulation modeling with SIMUL8. Visual8 Corp.,Mississauga and Ont., 2003. ISBN 0-9734285-0-3.
International Union of Railways (UIC). UIC-Code 406: Capacity. Paris,2004. ISBN 2-7461-0802-X.
15
Dra
ft

Tobias Lindner. Applicability of the analytical UIC Code 406 compressionmethod for evaluating line and station capacity. Journal of Rail Trans-port Planning & Management, 1(1):49–57, 2011. ISSN 22109706. doi:10.1016/j.jrtpm.2011.09.002.
Marin V. Marinov and José M. Viegas. A mesoscopic simulation modellingmethodology for analyzing and evaluating freight train operations in arail network. Simulation Modelling Practice and Theory, 19(1):516–539,2011. ISSN 1569190X. doi: 10.1016/j.simpat.2010.08.009.
Andrew Nash and Daniel Hürlimann. Railroad simulation using Open-Track. In John J. Allan, editor, Computers in railways IX. WIT Press,Southampton and England and Boston, 2004. ISBN 1-85312-715-9.
René Schönemann and Andreas Gille. Kapazitätsreserven und Betrieb-sabwicklung bei der Hafenbahn Hamburg nach Umstellung auf dieFahrplanfenster-Strategie Slotmanagement (unpublished), 2009.
Ekkehard Wendler and Michael Naehrig. Statistische Auswertung von Ver-spätungsdaten. In Verband Deutscher Eisenbahn-Ingenieure e.V., editor,Eisenbahningenieurkalender, pages 321–331. Tetzlaff - Verlag, Hamburg,2004.
16
Dra
ft