productivity measurement town cape of university
TRANSCRIPT

Univers
ity of
Cap
e Tow
n
. ,, -- ·----.---~------
I ~
i
PRODUCTIVITY MEASUREMENT
IN MANUFACiUR!NG
T •. J. BINGLE
JANUARY, 1991
Submitted to the University of Cape Town
in partial fulfillment of the requirements
for the degree of Master in Industrial
Administration
I
J { I
j ;. ·~
r::---,, /· ~·

Univers
ity of
Cap
e Tow
n
The copyright of this thesis vests in the author. No quotation from it or information derived from it is to be published without full acknowledgement of the source. The thesis is to be used for private study or non-commercial research purposes only.
Published by the University of Cape Town (UCT) in terms of the non-exclusive license granted to UCT by the author.

Univers
ity of
Cap
e Tow
n
iv
CONTENTS
LIST OF FIGURES
ABSTRACT
CHAPTER 1: INTRODUCTION
1.1 OBJECTIVES
PART 1
1.2 STRUCTURE OF THE DISSERTATION
1.3 SCOPE AND LIMITATIONS OF THIS DOCUMENT
CHAPTER 2: THE PRODUCTIVITY CONCEPT
2.1 INTRODUCTION
2.2 THE PRODUCTION PROBLEM
2.3 TECHNICAL EFFICIENCY AND PRODUCTIVITY
2.4 MONEY-VALUED EFFICIENCY AND PRODUCTIVITY
2.5 EFFECTIVENESS AND PRODUCTIVITY
2.6 CONCLUSION
CHAPTER 3: THE PRODUCTIVITY MEASUREMENT CONCEPT
3.1 INTRODUCTION
3.2 CAUSALITY AND PRODUCTIVITY MEASUREMENT
3.3 PARTIAL AND TOTAL MEASUREMENT
3.4 OPERATIONAL DEFINITIONS
3.4.1 Classification of Variables
3.4.2 Ambiguities
3.5 APPROACHES TO PRODUCTIVITY MEASUREMENT
3.5.1 Measurement Models
3.6 CONCLUSION
Page
ix
x
1
1
2
5
6
6
7
8
9
12
16
17
17
18
19
20
2'21
22
23
24
31

Univers
ity of
Cap
e Tow
n
CHAPTER 4: SCALING
4.1 INTRODUCTION
4.2 LEVELS OF MEASUREMENT
4.2.1 Nominal Scales
4.2.2 Ordinal Scales
4.2.3 Interval Scales
4.2.4 Ratio Scales
4.3 SCALING CONSTRAINTS
v
4.3.1 The Principle of Equivalents
4.3.2 Constant Monetary Value
4.4 CONCLUSION
CHAPTER 5: PRINCIPLES OF PRODUCTIVITY MEASUREMENT
5.1 INTRODUCTION
5.2 ORGANIZATIONAL STRUCTURING
5.3 THE OUTPUT CONCEPT
5.3~1 Total Output For the "Total Company" Level
of Measurement
5.3.2 Subsystem Output - Operational Production
Units
5.3.3 Output - The Utilization Concept
5.4 THE INPUT CONCEPT·
5.4.1 Labour Input
5.4.2 Capital Input
5.4.3 Materials and Intermediate Input
5.5 CONCLUSION
Page
32
32
33
33
34
35
37
37
37
38
40
42
42
44
45
45
47
47
49
50
51
56
56

Univers
ity of
Cap
e Tow
n
vi
CHAPTER 6: PRACTICAL PREPARATION FOR MEASUREMENT
6.1 INTRODUCTION
6.2 CHOOSING THE CORRECT APPROACH
6.3 CONCLUSION
PART 2
CHAPTER 7: PRODUCTIVITY MEASUREMENT ON TOTAL COMPANY
LEVEL
7.1 INTRODUCTION
7.2 SPECIFIC PRODUCTIVITY OBJECTIVES
7.3 THE TARGET COMPANY INCOME STATEMENT FORMAT
7.4 INCOME STATEMENT ISSUES
7.5 A PRODUCTIVITY STATEMENT FOR THE TARGET COMPANY
7.5.1 Editing Data
7.5.2 Format Design
7.6 THE PRODUCTIVITY CONCEPT OPERATIONALLY DEFINED
7.7 CALCULATIONS
7.7.1 Calculating Output
7.7.2 Calculating Input
7.7.3 Calculating the Productivity Index
7.7.4 Introducing Ne1rz Input Components
7.7.5 Profit Movement
7.8 INTERPRETING THE RESULTS
7.8.1 A General Interpretation
7.8.2 Interpretation in terms of Objectives
7.9 CONCLUSION
Page
57
57
57
66
67
67
68
68
69
71
71
72
75
76
76
78
80
82
83
84
84
84
87

Univers
ity of
Cap
e Tow
n
vii
CHAPTER 8: PRODUCTIVITY MEASUREMENT ON WORK STATION
LEVEL
8.1 INTRODUCTION
8.2 APPLYING THE MODEL DEVELOPMENT CRITERIA
8.2.1 Setting up a Measurement Profile Sheet
8.3 MODELLING THE WORK STUDY APPROACH
8.3.1 Theoretical Framework for Measurement
8.3.2 Situational Examples
8.3.3 Materials Utilization
8.4 CONCLUSION
CHAPTER 9: PERFORMANCE MEASUREMENT AT WORK STATION
LEVEL
9.1 INTRODUCTION
9.2 LABOUR UTILIZATION
9.2.1 Industrial Engineering Approach
- Time Standard
9.2.2 Industrial Engineering Approach
- Economic Standard
9. 2. 3 Inde>: Approach - Partial Measurement
9.3 MODELLING THE MATRIX APPROACH
9.3.1 Steps in Drawing up a Matrix
9.4 SPECIFIC PRODUCT QUALITY
9.5 CONCLUSION
Page
88
88
89
90
92
93
95
104
105
11216
11216
107
107
110
112
113
115
119
119

Univers
ity of
Cap
e Tow
n
viii
Page
CHAPTER 10: CONCLUSION - COMMENT AND RECOMMENDATIONS 121
10.1 INTRODUCTION 121
10.2 IMPEDIMENTS TO DETERMINING MEASUREMENT BENEFITS 122
10.3 TOTAL PRODUCTIVITY MEASUREMENT - CURRENT SITUATION 123
10.4 IMPROVEMENTS IN MANUFACTURING 124
10.4.1 Efficiency 124
10.4.2 Other Benefits 125
10.5 RECOMMENDATIONS 127
REFERENCES 129
BOOKS 129
JOURNALS 131
APPENDICES
A 'Brands are Assets' 132 - 136
B Internal Report 137 148
c Organizational Chart 149 150
D Income Statement <April> 151 153
E Income Statement <May> 154 - 156
F Productivity Statement (2 Periods> 157 161
G Sales Trends 162 - 163
H Efficiency Reports 164 168
I Effectiveness Report 169 170
J Labour Productivity Report 171 172
*

Univers
ity of
Cap
e Tow
n
ix
FIGURES
FIGURE 2.1. : CLASSIFYING TECHNICAL EFFICIENCY AND MONEY-VALUED EFFICIENCY IN THE PRODUCTIVITY EQUATION
FIGURE 2.2. MONEY-VALUED EFFICIENCY AND PROFIT <REALST MODEL>
TABLE 3.1. : VALUE-ADDED CONCEPT APPLIED TO
Page
11
12
PARTIAL PRODUCTIVITY MEASUREMENT 27
TABLE 4.1. : DISTORTION DERIVING PHYSICAL VALUE FROM MONETARY VALUE 39
~IGURE 5.1. : ELEMENTARY SYSTEMS MODEL 43
~IGURE 5.2. VENN DIAGRAM - MEASUREMENT TECHNIQUES <APPROACHES> OVERLAPS 44
FIGURE
TABLE
TABLE
TABLE
7.5.
7.6.
7.7.
: COMPOSITION OF LABOUR TIME
: TOTAL OUTPUT - EXTRACT FROM APPENDIX F
: LABOUR INPUT - EXTRACT FROM APPENDIX F
: MATERIALS INPUT - EXTRACT FROM APPENDIX F
FIGURE 8.1. : LEVELS OF RECOGNISED ORGANIZATIONAL
48
76
78
81
AGGREGATION 90
FIGURE 8.2. : DIAGRAMMATIC REPRESENTATION OF STANDARDS DETERMINED IN THE PRODUCTION DEPARTMENT 94
FIGURE 8.3. : PRODUCTION CONTROL CHART 96
FIGURE 8.4. : EFFICIENCY CALCULATION - EXAMPLE 101
FIGURE 8.5. EFFECTIVENESS CALCULATION - EXAMPLE 103 )
FIGURE 9.1. LABOUR PRODUCTIVITY REPORT 108
FIGURE 9.2. PERFORMANCE MATRIX - EXAMPLE 114

Univers
ity of
Cap
e Tow
n
x
ABSTRACT
Productivity measurement modelling cannot be the province of
the expert only. Lower levels of management, and production
foremen in particular, must become actively involved in the
process.
Active involvement embraces more than just a basic knowledge
of the different measurement models available. It requires
understanding of the concepts involved, so as to enable
participation in the development of measures pertinent to the
everchanging priorities in an own manufacturing situation.
For productivity to be improved, applied measurement must
first succeed on the factory floor.
This dissertation attempts to explore productivity
measurement theory and lifting out those aspects which are
important to manufacturing operations. The discussion of
theory culminates in a list of criteria which can be applied
to the development of any productivity measurement system.
All the key concepts are demonstrated by way of example.
Having established a theoretical base, the criteria are then
applied to the development of three productivity measurement
systems for a specific food manufacturing company.
Univers
ity of
Cap
e Tow
n
xi
The measurement methods relate to the Total Productivity
Measurement, Industrial Engineering and Performance Matrix
concepts - each applied to different organizational levels
within the company.
The intent is not prove or demonstrate any relationship
between productivity improvement and the introduction of
measurement. It is the study of productivity measurement per
se, which is at issue. Since introducing measurement however,
there has been a noticable improvement in the effectiveness
of certain sections within the organization.
commented on.
*
This matter is

Univers
ity of
Cap
e Tow
n PART 1
The theory of productivity measurement as it would apply
in a manufacturing environment.

Univers
ity of
Cap
e Tow
n
1
CHAPTER 1
INTRODUCTION
1.1 OBJECTIVES
The productivity concept is something everybody understands.
It is also something which many find difficult to measure and
apply. Productivity proper, as theoretically defined, is a
most difficult measure to apply in practice.
To overcome some of these difficulties, a multitude of
performance measures can be introduced which are relatively
simple to apply. On the strength of the results so obtained,
certain assumptions can be made regarding productivity in the
organization.
To improve productivity requires commitment from those
seeking to benefit by it. Commitment can be achieved by
understanding the dynamic character of productivity
measurement. This understanding requires a knowledge of the
basic measurement principles involved, the different
techniques.of measurement and some knowledge of the
organization for which a system is to be developed.
Univers
ity of
Cap
e Tow
n
2
The objective of this dissertation is twofold. Firstly, to
present the theoretical basis for productivity measurement,
the aim being to improve the operational manager's
understanding of the productivity concept and its
implementation. Secondly, to develop a productivity
measurement framework for a food processing company.
1.2 STRUCTURE OF THE DISSERTATION
The dissertation is composed of two parts. Part one relates
to the theory of productivity measurement. The aim as
mentioned, is to establish a theoretical framework on which
specific measurement models can be built. In part two, three
measurement systems are developed for application in the
target company.
In part one, chapter 2, the productivity concept, with
specific reference to efficiency and effectiveness, is
discussed. A concept, referred to as money-valued efficiency,
is also introduced to be later applied in one of the
measurement models in part two of the dissertation.
In chapter 3, under the heading of the productivity
measurement concept, various issues are raised. One of these
issues relates to the importance of the operational
definition in a measurement situation. In the latter part of

Univers
ity of
Cap
e Tow
n
3
this chapter a distinction is d~awn between various selected
theoretical measurement models, which may possibly be of use
in an industrial company.
Chapter 4 is dedicated to scaling. In the first half, the
theoretical nature and principles for developing measurement
scales are investigated. Thereafter constraints, as
applicable to productivity measurement scaling, are
highlighted and include the use of equivalents.
Chapter 5 is titled: "Principles of Productivity
Measurement". The content essentially relates systems design
to the concepts "output" and "input" with an in-depth
discussion as to how these entities should be constituted.
Special attention is given to the methods applied in
calculating capital input.
Chapter 6 is in effect an introduction to part two of the
dissertation. Although the discussion is based on the
criteria which guide the choice of measurement models, the
emphasis is on providing a practical method to prepare for
measurement; i.e., when confronted by a situation where a
measurement system has to be designed, how should the
challenge be met ?
In chapter 7, the beginning of part two, a measurement model
is developed and applied to the target company on the level
of the total company. Data obtained from the company's

Univers
ity of
Cap
e Tow
n
4
financial statements is utilized for this purpose. Various
pitfalls encountered during the system's development phase
are also itemized and discussed.
In chapter 8 a measurement method is applied to lower levels
of organizational aggregation. A specific work station in the
target company is selected to illustrate the measurement
method utilized.
In chapter 9 the system developed in the previous chapter is
expanded to include measurement on a higher level of
organizational aggregation. In the target company, section
level (one level higher than the work station) measurement is
seen as the key element to productivity improvement in the
company. It is therefore important to develop a combined
indicator of productivity in the various sections.
issue is addressed here.
This
Chapter 10 concludes the dissertation with comment regarding
difficulties and successes experienced during the different
development phases. Where applicable, recommendations have
been made to improve the various systems and their
application.

Univers
ity of
Cap
e Tow
n
5
1.3 SCOPE AND LIMITATION OF THIS DOCUMENT
Although the theory contained in part one of the·dissertation
would be helpful to anyone wishing to apply measurement in an
industrial setting, it is so structured as to fit the
perceived needs of managers in the target company.
Notwithstanding frequent reference to "organizational levels"
in the dissertation, measurement is applied to the so-called
"unit of analysis". Each unit constitutes a system or
"measurement packet". The measurement principles which guide
systems development on each particular level in the
organization tend to be similar - the only difference being
the content. Therefore, where there are numerous similar
units of analysis such as work stations, it is deemed
sufficient to illustrate each method by way of one practical
example only - as is done in part two of the dissertation.
To do otherwise would only introduce new sets of data,
without adding anything to the knowledge.
The development of the measurement system is ongoing and ever
changing in content. Principle therefore, is the important
issue. The rest is logic.
*

Univers
ity of
Cap
e Tow
n
6
CHAPTER 2
THE PRODUCTIVITY CONCEPT
2.1 INTRODUCTION
The central theme of economic science is the allocation of
scarce resources. Economic principle dictates that man is in
a continuous search for ways to obtain the greatest possible
satisfaction of his needs with limited resources. To
understand the productivity concept is to accept this
principle.
The basic productivity concept is defined as " •• the
relationship of outputs to inputs". And that is all it is.
Measuring productivity is not limited to the output/input
ratio. In fact, various constraints may prohibit meaningful
measurement using this format. The alternative is to measure
identified factors which regulate output and/or input, and
then to make assumptions as to their possible effect on the
productivity ratio. "Constraints" refer to practical
limitations in the measurement of the different variables in
the productivity equation.
Univers
ity of
Cap
e Tow
n
7
2.2 THE PRODUCTION PROBLEM
The productivity concept finds practical reason in
production. Production is defined as " any process which
converts or transforms a commodity or commodities into a
different commodity" [Lancaster p. 59]. It is not only the
making of physical things, but their transport, storage and
selling, as well as the rendering of services.
All these activities lead to ''added economic value" of
commodities for which somebody in the system has to pay. A
business undertaking therefore takes cognisance of the
economic value issues, ~s part of the productivity
measurement problem. To do this, assuming a given type and
quantity of output, productivity can for instance be improved
by utilizing less of any one physical input without
increasing any other physical input. I.e., technical
efficiency is improved. Or productivity may be improved by
using less of one physical input and more, but not relatively
more, of another physical input. This relativity is
determined by attaching economic value to the various inputs.
Technical efficiency is therefore not the only issue. Unit
price and hence related total cost will dictate which input
is more efficient.
Traditional productivity measurement methods concentrate on
the efficient and effective utilization of resources [Sumanth
p. 31] - which in a sense encompass both the quantitative
and qualitative aspects demonstrated above. Given a

Univers
ity of
Cap
e Tow
n
8
strategic <and systems development> emphasis however,
productivity measurement should be concerned with more than a
static measure of resource input in relation to output. The
factors which influence and direct efficiency and
effectiveness should also be considered for measurement. How
to measure these factors and relate their influence directly
on productivity is a problem. Chapter 4 addresses this
issue.
Firstly, in this chapter, the meanings of efficiency and
effectiveness, as basic indicators of productivity are
discussed.
2.3 TECHNICAL EFFICIENCY AND PRODUCTIVITY
An objective of production is to meet the demands of the
market at the lowest possible cost. This can be interpreted
to mean that all things being equal, production must
endeavour to achieve a given physical output with the lowest
possible physical input [Radel pp. 2-4]. The efficiency
concept being input related, this in effect means improving
the degree of technical efficiency with which resources are
consumed.
Whereas productivity is defined as the ratio of output to
input, technical efficiency is defined as a ratio between the
expected consumption level of a physical resource<s>, and the
actual physical resource(s) consumed. To illustrate the

Univers
ity of
Cap
e Tow
n
9
difference between the concepts: if on a single resource
input, the expected consumption is 5 physical units, and the
actual consumption is also 5 units, then the state of
efficiency is 1. If output in the productivity ratio is 5
units, then productivity is rated as 1. A state of
inefficiency will exist if, on input, consumption increases
to say 7 units. Assuming no increase in output, productivity
is now rated 5/7 = 0.7.
productivity.
As efficiency decreases, so does
If production tons output is measured in terms of man-day
input in a process where other resources are also involved
(as there are bound to be>, the measure being considered, is
that of the productivity of labour. It is not a measure of
the technical efficiency with which labour itself is being
utilized, since the output is not the sole result of the
labour input (see causality in chapter 3>. Output is also
influenced by other factors not related to the labour input.
At best, the productivity ratio result will only be an
i~dicator of the technical efficiency with which labour is
applied.
2.4 MONEY-VALUED EFFICIENCY AND PRODUCTIVITY
In our economic system, production is organized within
undertakings which compete in the market. An undertaking's
objective in the long run is to optimize profits [Radel p.
4J. From an input perspective, this means controlling total
cost.

Univers
ity of
Cap
e Tow
n
1~
The production unit will endeavour to realise the given
physical output at the lowest possible total cost, whilst
maintaining quality standards. Price (cost) implies a wider
definition of efficiency. <It also implies that there are at
least two operational definitions for the productivity
concept}.
Money-valued efficiency can be tjefined as a ratio between the
intended total cost of a resource and the actual total cost
incurred.
Suboptimization in the use of resources <technical
efficiency> may result because of price considerations. To
illus~rate the principles involved: In figure 2.1, output can
be defined as quantity x unit price, say 12 tons x R200 =
R2400, and input as quantity x unit price, say 12 tons x R60
= R720. The productivity rating on the technical approach is
12/12 = 1. On the money-valued approach, productivity is
rated R2400/R720 = 3.3. Assume that the unit price of the
input decreases to R30. Technical efficiency will remain the
same, but money-valued efficiency will improve CR720/R360} by
100%. If the money valued scale is accepted, the productivity
will also inprove by 100%.
Difficulties with the money-valued approach are that if the
different variables <quantity and unit price> are not
separated at data source, it is difficult to determine the
cause of a change in productivity of the money-valued kind.

Univers
ity of
Cap
e Tow
n
-
-
~
:.___
OUTPUT
INPUT
I. MONEY VALUE PRODUCTIVITY
"'
=
i = !
J !
I i I
! I !
i I
11
OUTPUT
QUANTITY
INPUT
QUANTITY
• TECHNICAL PRODUCTIVITY
I I :
xi : I I l
I I I I I i i I I x: I I I
! ! i
I 1
OUTPUT
UNIT PRICE
INPUT
UNIT PRICE
• PRICE RECOVERY
Figure 2.1: Classifying Technical Efficiency and Money-valued Efficiency in the Productivity Equation.
I i
I J
I i
I J
I
With the single labour resource example used in para 2.3, the
productivity of labour, i.e., tons output/(man-days x unit
price), now becomes a measure <indicator) of the degree of
money-valued efficiency with which labour is applied.
The professed benefit of making use of the money-valued
efficiency and productivity concepts is that productivity can
be directly related to profit in an undertaking, as does the
Total Productivity Measurement Model of the American
Productivity Center <REALST MODEL>. [Mason pp. 14-16].
Refer to figure 2.2 which is self-explanatory.
--

Univers
ity of
Cap
e Tow
n
12
CHANGE CHANGE CHANGE IN ......... IN ........... IN
OUTPUT REVENUE OUTPUT QUANTITY UNIT PRICE
... .-- ---.-.. .. .. CHANGE CHANGE CHANGE CHANGE
IN IN IN IN MONEY-VALUED ..... TECHNICAL ......... PROFIT ............ PRICE PRODUCTIVITY PRODUCTIVITY RECOVERY
... ... • • • CHANGE CHANGE CHANGE
IN IN IN TECHNICAL ......... COST .......... INPUT EFFICIENCY UNIT PRICE
----·------·-
figure 2.2: Money-Valued Productivity and Profit (REALST MODEL}. --·----·----·- Adapted from Parsons J.1 Productivity Profits and Prices.
National Productivity Institute, Pretoria, 19841 p. 6.
EFFECTIVENESS AND PRODUCTIVITY
In theory, an undertaking will negotiate lowest unit cost
prices for the different resource inputs, assuming acceptable
quality. If not done, potential technical efficiency gains
would be squandered only to the benefit of the supplier. In
the same vein, the undertaking will not necessarily pass on
technical efficiency gains to the customer in the form of
lower selling prices. Convincing the customer to pay more
(and thus add more value to the undertaking's profits> can be
an indication of the effectiveness with which an undertaking
conducts its business. This in turn is an indication of
productivity in a subjective sort of way.
Univers
ity of
Cap
e Tow
n
13
It is stated that effectiveness as an indicator of
productivity is output orientated, as described above.
But, there seems to be no universal agreement to what the
term effectiveness means in either a theoretical or a
practical sense. How it is defined, reflects adherence to one
of two general approaches, namely the goal appro~ch and the
systems approach (Gibson p. 35).
The goal approach is akin to the method of management by
objectives. The degree of accomplishment indicates the degree
of effectiveness. Not only is output an entity to be
measured, so too is input. Any other factor which is thought
to indirectly influence productivity may also be isolated and
targeted for effectiveness measurement. In each case, the
level of performance to be accomplished will depend on the
perception that the people setting the objectives have of the
factor's impact on productivity - without their really
knowing the magnitude of the influence.
Within the context of the go~l approach, there are basically
two criteria by which effectiveness can be measured. These
criteria refer specifically to the variables contained in a
productivity ratio;
1. Production: can be either quantitative or qualitative
output. It includes performance measures such as units
produced, rand sales, clients visited, and so forth
<compared to a target of course ~}.

Univers
ity of
Cap
e Tow
n
14
2. Efficiency: Input measurement relating to either time,
physical quantities or monetary value. Example: output
expected to be delivered per hour divided by actual output
delivered per hour - say for a machine where output
translates into input, etc. Different writers attach the
same meaning to the efficiency and productivity concepts.
Productivity as explained, differs from ef~iciency. An
effectiveness measure of productivity can include a string
of ratios such as units produced/labour hours utilized,
km/litres of fuel, etc.
In contrast to the goal approach, the systems approach
centres on people's behaviour <be it an individual worker,
manager or group} as being the motivating factor to
effectiveness. To cite an example: The "inputs" of behaviour
are "causes" that arise from the work-place. The cause can be
a directive from a manager to a worker, or group of workers,
to perform a certain task. The input is then acted upon by
the individual's <or group's) mental and psychological
processes to produce a certain outcome. The outcome preferred
is compliance with the directive, but depending on the state
of the individual s processes, the outcome could be
non-compliance.
The goal .and systems approach differ in the sense that the
former is concerned with intangible (and sometimes undefined)
factors which influence the attainment of a goal.

Univers
ity of
Cap
e Tow
n
15
Three criteria are cited against which effectiveness (of
intangibles} can be measured;
1. Satisfaction: The degree of success in meeting the
psychological needs of stakeholders in the organization,
be they employees, customers, suppliers or shareholders.
Only those "satisfaction factors" which promote
productivity or efficiency are of interest. Quality of
work life is an example of a "satisfaction" factor.
2. Adaptiveness: The extent to which the organization can and
does respond to internal and external changes. An
unacceptable level of work stoppages on a production line
may indicate an inability of the firm to adapt.
5. Development: The ability of the organization to increase
its capacity to deal with environmental demands. Training
is an example.
Effectiveness as a concept, stands apart from the efficiency
concept. For practical measurement purposes, the attainment
of an effectiveness level should be based on <stated}
expected targets. The absence of objectives would mean that
effectiveness cannot be measured.

Univers
ity of
Cap
e Tow
n
? ' ~-b CONCLUSION
16
Productivity is not a measure of either efficiency or
effectiveness, but rather the result of both. Productivity as
a measure, can be seen to indicate a state of efficiency
and/or effectiveness - just as the efficiency and/or
effectiveness measure can be seen to indicate a state of
productivity. As will be seen in chapter 3, this is also
true for the measurement of any other factor which has either
a direct or an indirect influence on the productivity ratio.
*

Univers
ity of
Cap
e Tow
n
17
CHAPTER 3
THE PRODUCTIVITY MEASUREMENT CONCEPT
3.1 INTRODUCTION
Contemporary writ~rs on industrial productivity measurement
are moving away from the traditional notion that productivity
is to be expressed only in terms of either technical
efficiency, or the physical output over physical input ratio.
This development derives, in the first instance, from the
difficulties being experienced in bringing together a
reliable data base on a consistent basis, for comparatative
measurement. Secondly, as productivity measurement moves out
of the manufacturing environment, other factor relationships
{involving mainly intangibles} are being evolved which h~ve
• proved to affect overall business performance. The emphasis
is quite clearly toward the measurement of so-called
productivity indicators or key productivity factors.
Ideally, a productivity measure should present a single
quantitative result, indicating either a deterioration or an
improvement in productivity. To achieve this, different
factor scales have to be combined into one common measure.

Univers
ity of
Cap
e Tow
n
18
To evaluate the risks involved in developing a measurement
system requires an understanding of current productivity
measurement trends and the concept of scaling. Trends are
discussed in this chapter and scaling in chapter 4.
3.2 CAUSALITY AND PRODUCTIVlTY MEASUREMENT
It is common practice to measure productivity performance in
terms of some resource or other. Inevitably, the question is
raised as to how much causal relationship there is between
the resource <input) in question and output, and between
resources and other societal variables. There is obviously
interaction. Mills [p. 51213] makes the point: "In
general .••• it is most useful to measure output with reference
to the input of human effort (or any other resource) ••• But
we must r-ecognise that the effectiveness of this effort
var-ies not only with the intensity and skill of the human
factor, but also with the number, quality of tools employed,
the amount of power utilized, the nature of the productive
organization, and other features of the productive process."
He conludes: "Causality may be shared in many ways not
necessarily observable from ~roductivity ratios."
Illustrated above is a basic feature of the productivity
(par-ti al> rati ci. \
The measured change of the ratio does not
necessarily represent an improvement in efficiency of the
specific resource. The change is a function of the combined
effect of many factors. It is therefore advisable to obtain a

Univers
ity of
Cap
e Tow
n
19
''total" measure which includes all input quantities combined
into a single denominator. If then, an increase (or decrease)
of one input impacts negatively <or positively> on any other
variable in the equation, this will be balanced out in the
single indicator result.
3.3 PARTIAL AND TOTAL MEASUREMENT
The productivity of a single resource is referred to as a
Partial Productivity Measurement. If by estimation, all the
so-called production factors (labour, capital, materials and
intermediate resources> are included in the measure <relative
to an output>, it is traditionally called Total Productivity
Measurement. This terminology is somewhat ambiguous. Not
all possible inputs and outputs can ever be represented in
the productivity equation. It is only "total" in terms of a
specific operational definition (see below). A more suitable
term to describe the "total" concept is multi-factor
measurement, with the operational definition describing just
how inclusive the concept is.
The productivity measure is a relative concept in terms of
the output/input ratio. Productivity cannot be taken to mean
an absolute quantity. It is a meaningless measure if the
result is not compared with the productivity performance of
either: (1) a comparable period or, (2) another comparable
production unit or, <3) with a scientifically determined
standard.

Univers
ity of
Cap
e Tow
n
20
There are, as mentioned, also other indicator measures of
productivity - commonly called "surrogate" measures. Any
factor having an influence on productivity may be measured.
Example~ of such factors are sales levels, be they physical
quantities or total monetary sales value. Or it may be the
level of absenteeism. Or the hygiene in a factory. There are
many considered factors. All these "loose" factors can be
combined into a performance matrix in which is derived a
single dimensionless number as measure of performance or
"total indicator of productivity". A practical example
utilizing this method of measurement is illustrated in
chapter 9.
3.4 OPERATIONAL DEFINITIONS
3.4.1 Classification of Variables
Distinguishing between the theoretical definition of the
productivity concept presented, and the operational
definition required, is not always emphasized in literature.
The latter has to be developed, and will differ in scope,
content and construction in each particular measurement
situation [Lundberg pp. 58-63]. In practice productivity
measurement is built on the operational concept.
,,

Univers
ity of
Cap
e Tow
n
21
Normally the theoretical definition of productivity is
presented in terms of other concepts which are supposedly
already understood - such as "output" and "input". Both these
concepts may have many meanings, depending on the
perspective, which will include such considerations as the
availability of data, purpose of the measure and even the
audience. The practical difficulties of productivity
measurement system design, as it relates to the operational
definition, revolve around three decidable issues:
1. Identification: of the variables which constitute output
and input. For example, an operational definition for
output could be based on physical product units sold,
together with utilities embodied in the sale, a utility
being something such as "service level". To sensibly
analyse the results of such a combined concept, requires a
precise definition of the class of product. For the
qualitative variable, a detailed description or
instruction for collecting and recording data is
necessary.
Although the above is a somewhat exaggerated example of an
operational definition for "output", the process is not
much easier wh~n only quantitative variables on recognised
scales <tons, man-days, etc.) are involved. To overcome
the difficulties of scale combination, use is made of a
common denominating scale such as a monetary value scale
<see belm-.s}.
2. Scaling: All the identified variables have to be scored,
each on a different scale.

Univers
ity of
Cap
e Tow
n
22
3. Combining: The results obtained on each scale then have to
be combined on a single scale if the intention is to
present an integ~ated output measure.
The same principles would also apply in the case of input.
3.4.2 Ambiguities
3.4.2.1 Reliability
An operational definition can be considered to be a detailed
set of instructions on how to classify the primary variables
<outputs and inputs) unambiguously. This statement has two
meanings. For a quantitative variable it means selecting data
categories. What for example is meant by "units sold" - cash
sales and/or credit sales ? For a qualitative variable it
means developing a new scale of measurement and tying in
value readings <see chapter 4}. There m~y be.several
operational definitions (different rating forms}, which have
equal status, and are being used, but with no agreement as to
preference. Each one may be valid in its own right, but
uncompatible for comparison. Whatever the case, each
procedure must be sufficiently precise, so that any other
person using it can achieve the same results.
reliable measure.
3.4.2.2 Validity
It makes for a
When defining data into an operational format, the risk
exists that theoretical concept validity may be destroyed. A
question always arises as to whether an operational
definition presented, really measures that which was intended

Univers
ity of
Cap
e Tow
n
23
by the theoretical definition. It is argued [Northrop pp.
85-88] that there is ultimately no method of associating the
two kinds of definitions other than by convention or common
agreement. The perceived confusion that surrounds
productivity measurement is a case in point. For example, who
is to say that the money-valued productivity concept, as
explained within the context of activities conducted by a
business undertaking <chapter 2>, is not valid? There are
most certainly many economists <macro-economics) who will
frown on such interpretation. It is said that such practice
is inflationary and to the detriment of living standards.
From a macro-economic perspective it is certainly true, but
not so from the vantage point of the single business
undertaking. Society - i.e. the political and economic
systems - should carry the responsibility for inflation.
This is the developmental nature of productivity measurement.
3.5 APPROACHES TO PRODUCTIVITY MEASUREMENT
Different approaches, each with different models are
presented in literature as guideline examples for measuring
productivity in manufacturing undertakings. In consideration
of the management task and the specific objective for which a
measured result is to be used, certain approaches may be
discarded as inappropriate. Even then, the models which
remain, individually~ cannot be presented as a definitive

Univers
ity of
Cap
e Tow
n
24
solution to the productivity measurement challenge in the
business undertaking (and more specifically in
manufacturing).
3.5.1 Measurement Models
How productivity should best be measured in manufacturing is
still an open debate. The many measurement models developed
over the years have obviously improved the situation, but at
the same time, confused manufacturing management. The
manufacturing company's dilemma stems, so it would seem,
partly from an inability to discriminate between the
different approaches available, and to extract that which is
pertinent to its own situation. The different approaches with
comment are presented in summarized form:
3. 5. 1. 1 The Index Approach: also referred to as the "macro-
economic-orientated" approach, is associated with economists
using measurement conventions adopted at macro- economic
level. This approach can also be considered to be »accounting
system-orientated", in so far that it relies on existing
financial accounting data as the basis for calculation. It
utilizes the classical productivity ratio to measure
productivity gains and losses. In all the models under this
approach the so-called "constant monetary value rule"
applies. This means that physical quantities for input and
output variables are derived from monetary values reported on
the financial statements. To do this, current monetary values
normally have to be deflated.

Univers
ity of
Cap
e Tow
n
25
Important models presented under this approach are those of:
a) Kendrick and Creamer who developed the concepts "Total
Productivity", and "Partial Productivity". The measured
result in this model (a few models actually) is derived
from financial statement monetary values by way of base
year constant unit pricing. The technical dimension of
productivity is at issue. Except for intermediate inputs
(see chapter 5) which are omitted from the model, the
traditional resources <labour, capital and materials> are
thus featured.
b) Craig and Harris who refined the concepts of output and
input by including all cost-based inputs and exploiting
the concept of equivalent monetary value. A comparison of
ratio results over time is made by utilizing price indices
to achieve constant monetary value in succeeding periods.
c) The American Productivity Center Model which makes use of
unit monetary value on both the output and input side,
which as an output/input ratio is separately defined as
the so-called price recovery factor. This "factor" is
attached to the technical productivity ratio which
exhibits physical output/input quantities. From the
combination of these two elements, technical productivity
is related to profitability (see adapted REALST MODEL in
chapter 2).
Theoretically this is an ideal "total" measurement model.
Unfortunately the results become less reliable and
application more difficult as more input elements are
included in the equation.

Univers
ity of
Cap
e Tow
n
26
This approach is also supported by the National
Productivity Institute of South Africa.
[refer Productivity SA, vol 14, no 1, Feb. 1988 & vol 13,
no 3, June 1987]
d) The Davis Model of Total Factor Productivity Measurement
which adjusts output in the standard ratio calculation to
represent the so-called value-added principle.
This requires further explanation. In partial productivity
mea~urement as per any of the index approach methods
{which is monetary scale based - see above>, it is
considered necessary to adjust output. The total output
value is adjusted downwards by the combined value of all
those inputs not featured in the partial measurement.
The principal argument is that total income (output) of an
undertaking (or of a commodity, department etc.) is a
function of the total cost (inputs) plus mark-up. That
is, the cost of materials, labour, allocated capital
depreciation, overhead and profit are taken into account.
The concept is illustrated in table 3.1:
Assume that the output and input values for two periods
are as indicated. In period 2 the cost price of the raw
material, drops from R100/ton to R50/ton. The total
output value in period 2 is affected by this decrease in
input - because it is assumed that the mark-up (or profit)
will be maintained whilst lowering selling prices. All
other input costs remain the same in period 1.

Univers
ity of
Cap
e Tow
n
27
Although labour is still delivering the same output in
physical terms, the monetary scale indicates a substantial
decline in labour productivity. Subtracting the two raw
material values from the respective total values, R23800
changes to R3800, and R13800 to R3800.
INPUT: Raw Materials
Lnbour
Depreciation+ Overheads
Mark-Up
OUTPUT: Income
PARTIAL PRODUCTIVITY RATIO (LABOUR); UNADJUSTED OUTPUT VALUE
PARTIAL PRODUCTIVITY RATIO (LABOUR); ADJUSTED OUTPUT VALUE
PERIOD 1
TOTAL VALUE (CURRENT PRICES)
R20000
R 800
R 1000
R 2000
R23800 ·················································
23800/800 = 30
3800/8001
= 5
PERIOD 2
TOTAL VALUE (CURRENT PRICES)
R10000
R 800
R 1000
R 2000
*R13800 ·················································
13800/800 = 17
3800/800 :a 5
*Due to reduction in unit selmlg prices
Table 3.1 : Value Added Concept applied to Partial Productivity Measurement
On recalculating labour productivity with the adjusted
monetary figures, the ratios now reflect the figure 38
instead of 238 for the first period, and 38 instead of 138
for the second period. This is more representative of the
actual facts.
/

Univers
ity of
Cap
e Tow
n
28
Had the change in raw materials gone to profit (as it is
bound to>, then subtracting this from output, will serve
no purpose for measuring partial productivity. As such
the value-added concept is rather outdated for application
in a micro-economic or industrial setting.
The value-added concept should not be confused with
causality. Its application does not cancel the effects on
productivity of other factors, already gained or lost.
e) Sumanth presents a model emphasizing the product as a unit
of analysis (as opposed to the production process in the
other models>. He directly relates the separate partial
productivities which are relatively easy to determine, to
the total productivity measurement.
A noticeable difficulty with all these index models is the
different definitions which are given to capital input.
There seems to be no agreement on how this should be
measured. Neither d.oes any of the models present any credible
argument as to what the capital input format should be (see
chapter 5 for methods to calculate capital input).
The word "index approach" should not be confused with the
concept of indexing. Other approaches may, and do, make use
of the indexing concept.
3.5.1.2 The Utility Approach: This approach supports the
"performance indicators" or "surrogate measures" concept.
Measures vary from being a single operational ratio through
to a combination of ratios combined in the so-called
Objectives Matrix Model [Riggs & Felix pp. 82-92].

Univers
ity of
Cap
e Tow
n
29
The pretext for using this approach is that management
assumes ''to know" which factors are important to productivity
improvement. With this approach the ''cause" rather than the
"effect'' for productivity movement, as perceived by
management, is addressed <see chapter 9).
3.5.1.3 The Industrial Engineering Approach: In this
approach time study data is used to determine a measure for
output. Terms such as work study and work content are
synonymous with this approach. Although there is one example
[Greenberg p. 22] where total plant level measurement is
attempted with this approach, it is applied most extensively
on work station level. The emphasis is on time standards,
i.e. measuring the output of a production line, a team or an
individual worker in terms of time. The level of productivity
is taken to be the calculated variance from a predetermined
standard. A benefit of this approach is that it can isolate
and report the cause of a deviation in efficiency.
3.5.1.4 The Financial-Ratios Approach: Within the context of
company productivity measurement there is still argument
whether profit constitutes output <it might be so for the
investor). Ratios associated with this approach are inventory
turn, debtor days, etc .• At best these and other similar
financial ratios can be classed as effectiveness performance
indicators.

Univers
ity of
Cap
e Tow
n
30
3.5.1.5 Unit Costing Approach: This approach is conceptually
no different from the industrial engineering approach, except
that by making use of stan~ard costing methods, a
monetary-valued standard, instead of a time standard is used
to compare efficiency.
3.5.1.6 The Production Function Approach: This is an area of
study not considered practical for use in the manufacturing
environment. It is used more in economic studies where some
general mathematical model is developed for output as a
function of input factors. This is not to be confused with
symbolic expressions utilized in the other measurement models
(such as those of Sumanth> to express certain relationships.
Although not covering all the existing approaches to
productivity measurement, the above-mentioned models
constitute what is believed to be the major categories
applicable to manufacturing. Scientific and technical
journals contain many derivatives based on the above
approaches. Examples in these journals are situation
specific, and deviate from any one of the above models only
in the manner in which the operational definitions are
presented.

Univers
ity of
Cap
e Tow
n
31
3.6 CONCLUSION
Operational management often has to improvise for lack of
data, and in the process omit essential features required to
maintain theoretical definition validity. It is for this
reason ·important to distinguish, from the outset, the
different dimensions of productivity measurement, and to
apply these in a rational way to each appropriate operation.
*

Univers
ity of
Cap
e Tow
n
32
CHAPTER 4
SCALING
4.1 INTRODUCTION
A productivity variable is normally described by an
observable set of characteristics. A characteristic may be
either a quantity or a quality. The variable value therefore,
may be either quantitative or qualitative.
Numbers are assigned to each of the characteristics according
to certain rules - meaning some consistent, logical and valid
matching process between the characteristic and some scale.
To do this, either an existing scale is used, or, as is
necessary when measuring qualitative productivity factors,
new scales have to be created.
In this chapter the theoretical nature and principles for the
development of measurement scales are ~nvestigated. It is
fundamental to understanding the limitations which may apply
when developing any measurement system.

Univers
ity of
Cap
e Tow
n
33
4.2 LEVELS OF MEASUREMENT
The measurement concept relates to certain categorization
procedures or levels. Particular mathematical operations
and/or different analytical <statistical) techniques can,
where appropriate, be performed only at the scale level on
which observations are made. The principles relating to
scaling are summarised below. There are four scale
categories: nominal, ordinal, interval, and ratio [Krantz
chap 1-3J[Senders chap 2J[Blal6ck chap lJ.
4.2.1 Nominal Scales
Many qualitative factors <variables) which affect
productivity have no natural measures <e.g., how is the
quality of work life measured?>. New measures have to be
developed. Such a process starts at the nominal scale level,
where variables are classified with respect to certain
characteristics. Categories are thus created, (e.g.,
something is "good" or ''bad."). The aim is to create
categories that are as homogeneous as possible compared with
differences between categories. As long as th~ categories are
exhaustive {include all cases) and mutually exclusive
~nonoverlappin~), minimal conditions exist which is necessary
for the application of statistical procedures. This is the
lowest level of measurement. No attempt i~ made to size the
categories or to make comparisons in a measurement sense.

Univers
ity of
Cap
e Tow
n
34
Numbers may be arbitrary used to label the different
categories, but they cannot be used for normal arithmetical
operations (addition, subtraction, etc.).
The importance of an operational definition (of performance)
as discussed in the previous chapter is clearly demonstrated.
It is not likely that any two people, let alone two
undertakings, will support the same operational definition
describing a certain productivity variable. For instance, a
"good" quality of work life in one undertaking will differ
considerably from a "good" life in another. The
characteristics describing "good" must be unambiguous. More
so, if frequent measurement is to be made over time using the
same scale.
4.2.2 Ordinal Scales
Often, a new scale can be created on which variables can be
grouped and ordered. For example, two departments in an
undertaking may wish to be compared as to their overall
output. "Output" in this case is undefined in the sense that
several unlike characteristics are grouped subjectively to
represent the output concept. A scale can be set up on which
4 is 'excellent·, 3 i~ 'good", 2 is 'fair' and 1 is 'poor·.
Each number identifies a different performance category or
level of performance. A scale value of 4 would indicate a
higher level of performance than a value of 3, and so on. On
the scale 11 4)3 11,
11 3>2" and "2>1". But the intervals between
the units are not equal and the difference in performance
bett.-Jeen, say a "good" and "fair" performance in the one

Univers
ity of
Cap
e Tow
n
35
department is probably not the same as the pifference in
between a "fair" and "poor" performance in the other
department. Because of the interval inequality, the basic
mathematical operations of subtraction, addition,
multiplication and division are once again not permissible.
A number of tehniques are used to develop an ordinal scale
for qualitative factors. The Nominal Group Technique and the
Delphi Method are mentioned in literature. [Sink chap 4J.
4.2.3 Interval Scales
For productivity analysis, the preferred lowest level of
measurement is a physical unit of measurement agreed upon as
a common standard which is replicable. In other' wo_rds, a unit
of measurement in which the interval differences are constant
throughout the scale.
An interval scale provides a relative measure of magnitude.
A drawback is that its zero-point'is arbitrarily chosen. For
this reason a person cannot say that 70 degrees Farenheit is
twice as hot as 35 degrees Farenheit. The difference betw'een
these temperatures is however the same as that between 105
and 70 degrees Farenheit~
Riggs & West [pp. 484-290] mention various procedures
designed to yield interval scales for qualitative
productivity variables. The first method is based on a
standardized rating form. Depending on the variable being
measured, attributes are attached to a numbered scale

Univers
ity of
Cap
e Tow
n
36
describing each level of performance as a different standard.
Resulting values are collectively taken as a representative
measure of performance (as indicator of productivity>.
A more reliable procedure, designed to yield an interval
scale is based on utility theory. Used extensively in
performance measurement, it rates qualitative and
quantitative variables together by making use of so-called
dimensionless numbers. For each variable an upper and lower
limit is fixed. For a qualitative variable it is done by
visualizing the perfect outcome as 10, and the worst possible
outcome as zero. Consider factory hygiene. To rate this
variable one can use a role model of the "cleanest factory
ever seen". Such a subjettive standard would rate 10. The
dirtiest would rate a zero. Preferably each numbered level
will list a number of attributes so as to ensure consistency
Qf measure.
To rate a quantitative variable on a dimensionless scale a
similar procedure is followed. Rejects for instance can be
rated by scaling the lowest reject level ever recorded as 10.
A zero number is obtained by using the highest level ever
recorded. The intervals between 0 and 10 can be divided on a
proportional basis. An example illustrating this method is
discussed in chapter 9.
The benefit of making use of these so-called dimensionless
numbers (or scales> is that variables (or criteria> may be
directly compared. The numerical reading obtained for each
variable can be added to reflect a single indicator of

Univers
ity of
Cap
e Tow
n
37
performance. In productivity measurement this method of
combining variables goes under the names Multicriteria
Performance/Productivity Measurement Technique and Objectives
Matrix Procedure.
4.2.4 Ratio Scales
A ratio scale is an interval scale with an absolute-zero
point. The number "0" represents complete absence of the
characteristic being measured. On this level all mathematical
operations are allowable. [Evart pp. 12-14]. An example of
a ratio scale is the rands-and-cents scale for measuring
constant monetary value. Mass and distance are also ratio
scales. Although the ratio scale is a "perfect" scale, its
use in productivity measurement is limited in the sense that
different ratio scales are not necessarily compatible. How
for instance are man-hours added to tons of raw material? It
could be done by making use. of a third common denominating
scale - if one is available.
4.3 SCALING CONSTRAINTS
Where certain outputs or inputs are valued on a physical
scale (man-days, machine-hours, tons of material, etc.>, the
different scales will be incompatible for combined
productivity measurement.

Univers
ity of
Cap
e Tow
n
38
4.3.1 The Principle of Equivalents
To overcome the problem of incompatibility any one ratio
scale common to all the different physical scales can be
utilized to obtain equivalence. Normally a monetary scale is
used. This creates a problem in that the monetary scale is
considered value variable over time, which makes it an
interval scale, unsuitable for maintaining equivalence.
If money-valued productivity is being measured the current
value monetary scale is adequate. Technical productivity
however is based on physical quantities, which means that,
given a monetary value, physical value has to be derived.
4.3.2 Constant Monetary Value - derived physical value
As per the REALST model illustrated in chapter 2, if unit
prices rise, total value will rise even if nothing else
changes. Technical productivity indices will show an unreal
increase unrelated to the physical dimension if the total
monetary values are used in deriving physical value. This
problem is demonstratred in table 4.1:
Comparing the productivity ratios developed on the monetary
scale over the two periods 238 (11900/50> and 404 <20200/50),
and those on the physical scales 2 (100/50> and 2 (100/50),
the bias using the monetary scale values can be considerable.
Total output above is R11900 (100 x Rll9) for the base
period, and R20200 (100x R200) for period 2. To achieve an

Univers
ity of
Cap
e Tow
n
39
equivalent value on output in the second period, physical
output <100) is multiplied by the unit price of the base
period <R119>. The example also demonstrates the principle
of "value \l'lei ghi ng".
PHYSICAL TONS OUTPUT
UNIT SELLING PRICE
TOTAL MONETARY VALUED OUTPUT
PHYSICAL LABOUR INPUT
PARTIAL PRODUCTIVITY -ON MONETARY SCALE - ON PHYSICAL SCALE
PERIOD 1
100
R 119
R11900
so
RATIO
11900/SO 100/SO
PERIOD 2
100
R200
R20200
so
RATIO
20200/SO 100/50
Table 4. 1. : Distortion deriving Physical Value from Monetary Value
INDEX
170 100
In practice the manner in which data is presented, is
somewhat different. Unit prices are not always separately
available. As a result, the method of weighing to achieve
constant monetary value cannot be utilized. The alternative
is to apply total monetary value deflation. To do this, the
company must have a price index available which reflects the
price changes of its mix of outputs and inputs. National
indices, such as the Consumer Price Index will probably not
be suitable for this purpose. The procedure is to select a
Univers
ity of
Cap
e Tow
n
40
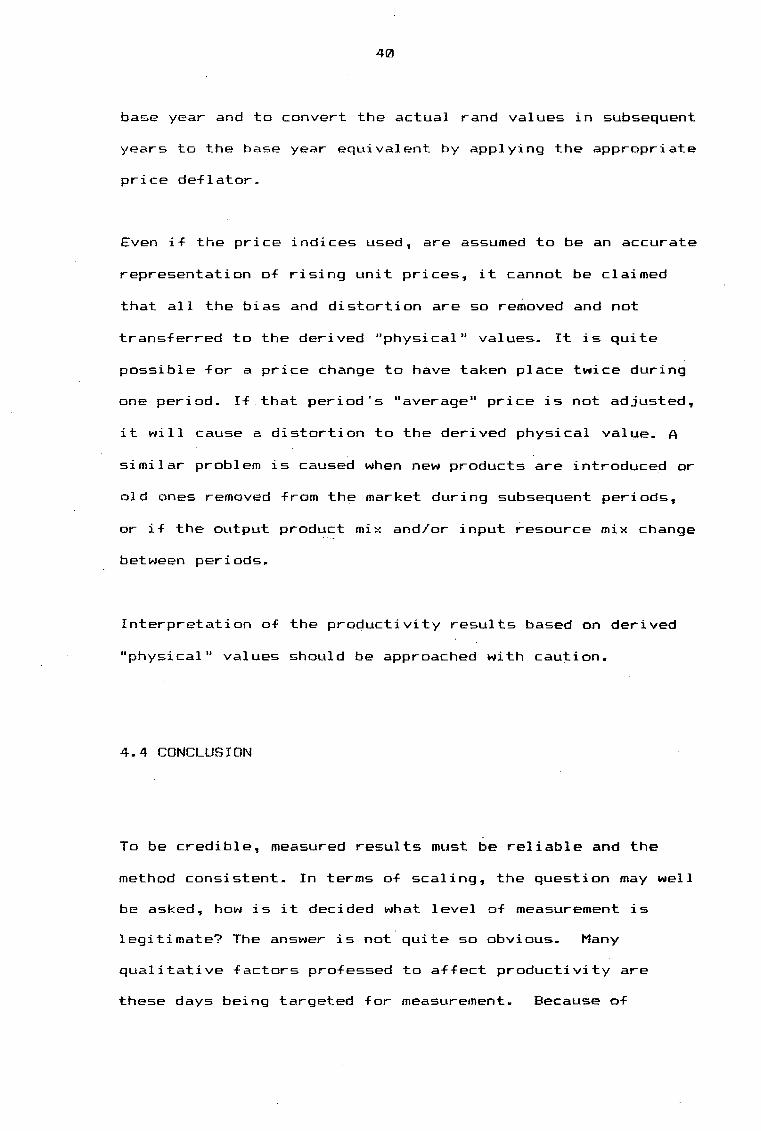
base year and to convert the actual rand values in subsequent
years to the base year equivalent by applying the appropriate
price deflator.
Even if the price indices used, are assumed to be an accurate
representation of rising unit prices, it cannot be claimed
that all the bias and distortion are so removed and not
transferred to the derived "physical" values. It is quite
possible for a price change to have taken place twice during
one period. If that period's "average" price is not adjusted,
it will cause a distortion to the derived physical value. A
similar problem is caused when new products are introduced or
old ones removed from the market during subsequent periods,
or if the output product mix and/or input resource mix change
between periods.
Interpretation of the productivity results based on derived
"physical" values should be approached with caution.
4.4 CONCLUSION
To be credible, measured results must be reliable and the
method consistent. In terms of scaling, the question may well
be asked, how is it decided what level of measurement is
legitimate? The answer is not quite so obvious. Many
qualitative factors professed to affect productivity are
these days being targeted for measurement. Because of

Univers
ity of
Cap
e Tow
n
scaling limitations these qualitative input variables cannot
be directly tied to output in a me~surement sense, i.e. in a
single equation.
To overcome this problem there are three practical remedies.
Making use of the ratio format, one must either break down
the index into separate dimensions of partial productivity so
as to admit ratio level of measurement, or "force" an
interval scale on the data by making decisions on the
relative weightings of each dimension and the equivalence
involved.
A second alternative is to make use of so-called formal
indicators of productivity, i.e. measuring for efficiency and
effectiveness on a partial basis.
A third remedy is to combine different indicators
("surrogate" measures}, using dimensionless numbers in a
matrix. The result so obtained, is a performance measure
from which certain assumptions can be made as regards
productive behaviour.
*

Univers
ity of
Cap
e Tow
n
42
CHAPTER 5
PRINCIPLES OF PRODUCTIVITY MEASUREMENT
5.1 INTRODUCTION
An undertaking <company> is a unique organizational system
comprising many interrelated subsystems. In terms of
production such a system uses labour, capital, materials
and/or other inputs to produce or add value to output.
[Gallop pp. 351.
Each subsystem is a complete system in its own right. The
definition (scope) of the system will delineate its output
and input. A system may refer to the total company, a
manufacturing plant, a production line, a work group, a work
station or an individual. Or it may be one of many
functional departments such as engineering, marketing and so
forth, or a combination of any of the above and some more.
The subsystem concept is an ideal tool to structure clear-cut
measurement packages, since by definition: " a system is
nothing more than a collection of components <inputs>
interacting as a process to achieve a specified objective
<output) •• " [Bedworth pp. 14-191. The relationship of these
elements is depicted in figure 5.1.

Univers
ity of
Cap
e Tow
n
.43
r Feedback +--~I
[i ~ Conversion
IN-PUT --------- ---------Process
·[OUTPUT I
Labour Capital Material Other
't Data
Figure 5. 1 Elementary Systems Model
Tangible & Intangible
Product
't Data/Inf or ma ti on
Inferred by definition is that the boundaries of a system
enclose all components which directly interact. These may
include outputs from other systems which become an input to
the target system. [Matthews pp.57-69].
Theoretically, any of the productivity measurement approaches
(methods} mentioned in chapter 3, can be applied within any
systems combination mentioned above. Depending on the
specific measurement objective, a comprehensive measurement
system can be of a "coupled" or "de-coupled" design nature.
This enables independent and overlapping measurement ·<more
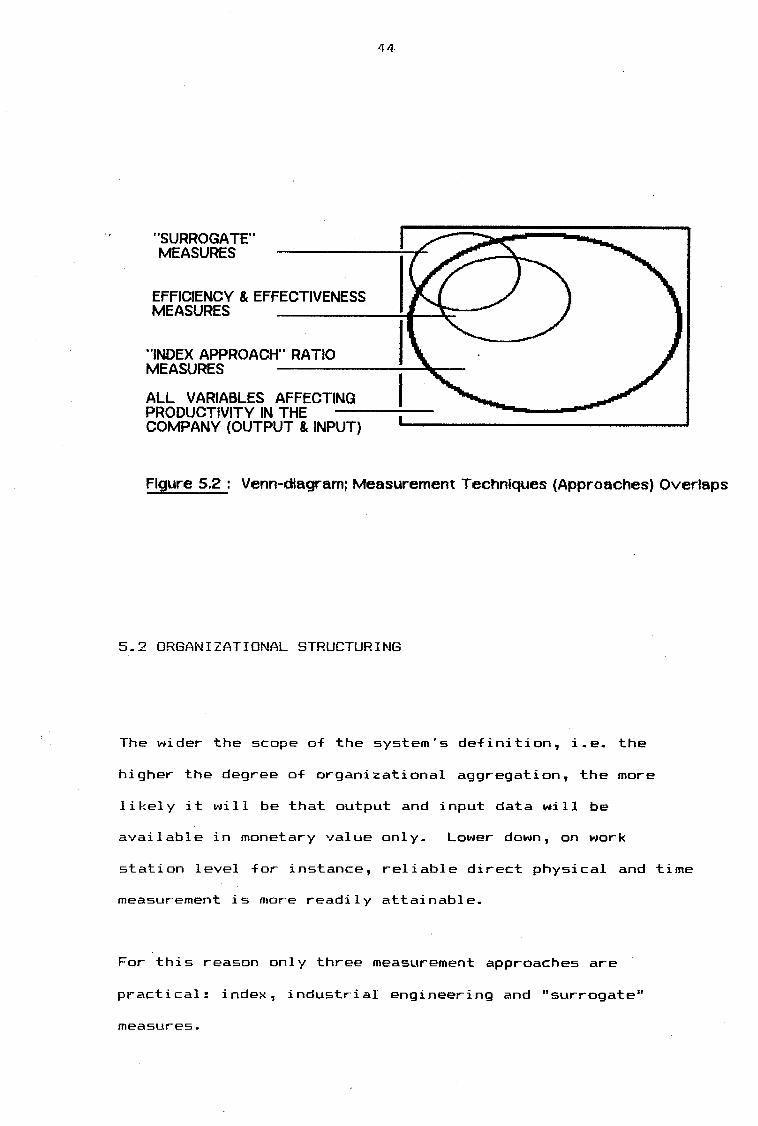
than one method} to be applied. Figure 5.2 depicts what is
meant by "overlapping".
Univers
ity of
Cap
e Tow
n
"SURROGATE" MEASURES
EFFICIENCY & EFFECTIVENESS MEASURES .
''INDEX APPROACH'' RATIO MEASURES
ALL VARIABLES AFFECTING
44
PRODUCTIVITY IN THE -----COMPANY (OUTPUT & INPUT) ---------------------------
Figure 5.2: Venn-dlagramj Measurement Techniques {Approaches) Overlaps
5.2 ORGANIZATIONAL STRUCTURING
The wider the scope of the system's definition, i.e. the
higher the degree of organizational aggregation, the more
likely it will be that output and input data will be
available in monetary value only. Lower down, on work
station level for instance, reliable direct physical and time
measurement is more readily attainable.
For this reason only three measurement approaches are
practical: index, industrial engineering and "surrogate"
measures.

Univers
ity of
Cap
e Tow
n
45
The theory of multi-factor <total> productivity measurement
<Index approach) on the level of the company is well
developed. There are various risks to the application, not
the least of which is data reliability. In this regard the
financial recording and reporting system plays a crucial
role.
Work station or production process data recording and
reporting for productivity measurement is not as a rule a
financial function. Independent time standard or physical
unit measures are utilized to determine the degree of
technical efficiency for each subsystem.
There are many other organizational levels (or subsystems) to
be considered for measurement. A host of surrogate measures,
operational ratios and the like, which serve as "indicators"
of productivity can be applied. All the measures mentioned
are considered complementary. Used in parallel combination,
they will diminish the problems commonly associated with
productivity measurement (for "problems" see chapter 6}.
5.3 THE OUTPUT CONCEPT
5.3.1 Total Output - For the "Total Company" Level of
Measurement
The system or unit of analysis here is the total company.
Output can be defined in either a technical or money-valued
sense. Normally, output is taken to mean a tangible or

Univers
ity of
Cap
e Tow
n
46
physical commodity. Hence it has to be decided whether the
operational definition of output must be based on sales or
production. [Siegel p. 16]. Writers differ on the concept
definition of output. Physical output is not the only issue,
they say. " .•• Productivity growth is a measure of economic
performance •• " [Gollop p.571.
These sentiments are also expressed by Takeuchi [p. 53]:
"A production-orientated concept of output poses several
problems, even for the manufacturer. Take the
manufacturer of a television set as an example. What
comes out of the factory may be a fangible product, but
certain services are added to the factory output in the
form of packaging, warranty, customer instructions,
financing, delivery arrangements, and so forth. These
services are additional values embodied in the
product •..•.• to say that the manufacturer's output
consists solely of tangible products is, therefore, too
simplistic ••• ".
The same theme or line of reasoning is of late being
expressed in technical literature related to marketing.
Appendix A - Brands are Assets}.
<See
An interpretation of the views of people like Takeuchi, is
that intangibles ~hould be measured as monetary "value added''
in addition to the tangible <physical) value of output. How
this ''added value" concept is to be handled in terms of
measurement, is unclear. To accommodate the concept, an

Univers
ity of
Cap
e Tow
n
47
argument can be made for money-valued productivity. A
practical measurement method regarding this issue is
demostrated in chapter 7.
5.3.2 Subsystem Output - Operational Production Units
Operationally, subsystems can be either vertically or
horizontally integrated into the total company system. The
operational unit can be a system in its own right. If a
operational unit (a work station, a production process, a
manufacturing plant, or whatever> produces a physical product
(final or. intermediate>, the output definition can be defined
according to the guidelines mentioned above. Data will
probably be available in physical format i.e. kilograms,
number of packages etc., and need not be derived from a
monetary scale.
5.3.3 Output - The Utilization Concept
Utilization is defined as the degree to which the resources
committed to a process are actually converted into output.
The concept is rooted in work study and can be applied to any
physical resource being utilized. As appropriate, utilization
can be accurately measured in terms of time or quantity. It
is an indicator of efficiency.
The concept is illustrated by way of example as follows:

Univers
ity of
Cap
e Tow
n
48
TOTAL MAN-HOURS AVAILABLE
IDLE OPERATING
TIME LOST
BY WORKER I BY MANAGEMENT REWORK PRODUCTIVE
WORK
PRODUCTIVE
Figure 5.3: Composition of Labour Time Adapted from Humprey & Halse p. 19 and Van Niekerk p. 22
As per figure 5.3, "total man-hours available" is the
official working time for which the employees are paid. It
can also be taken to be the total time allowed for a job.
The ,total period can be broken down into time spent idle and
time spent at work. Idle time is made up of time lost by
workers themselves or by management. Extra work is defined
as rework and/or other unnecessary work done by the worker.
The balance of the time is used for productive work.
Efficiency is calculated as productive time over total
man-hours available.
' Making use of this technique requires that a theoretical
"output" standard be established. Actual output achieved is
compared to standard, and efficiency calculated. This concept
is more fully illustrated by way of a practical example in
chapter 8.

Univers
ity of
Cap
e Tow
n
49
5.4 THE INPUT CONCEPT
An input can be described as any factor which affects a
related output. The operational definition should indicate
whether a specific variable be ~lassified as an output or
input. Example: product quality can be seen to be an input to
sales. It can also be seen to be an output if, for instance,
the input is training, undertaken to improve workmanship.
Instead of trying to fit "product quality" into the
productivity ratio, it can be measured separately as an
independent entity ("surrogate" measure}. In other words, it
is measured either as an input or an output. From the
singular result obtained, concl usi ans can be made in ,terms of
its effect on productiveness. If quality deteriorates on
whatever scale measured, it can be assumed that productivity
will also deteriorate. This assumption is amply supported by
research results.
Referring specifically to the "total company" level of
measurement, an input can be brought directly into the
productivity equation by way of the financial statements.
Inclusion will of course depend on the ability to identify
and scale the input variable. Using the index method, input
types are normally classified under the headings: labour,
capital, material and intermediate. Intermediate inputs are
other cost items, not included in the other categories, where
"cost" has the same meaning as in the income statement.

Univers
ity of
Cap
e Tow
n
5121
5.4.1 Labour input
The physical measure of labour is man-hours. Depending on the
operational definition, labour can be the man-hours expended
by all people engaged in the production of an output, without
differentiation as to the different classes of labour, i.e.
one man-hour of unskilled labour has the same value as one
man-hour of skilled labour. Provided there are no major
proportional changes in the labour mix between measured
periods, such a measure is considered adequate. The ideal
preferred, considering economic interest~ is to weigh the
hours according to some pattern of labour composition, be it
by skill, compensation or other factor. The choice as to how
to categorize labour input is left to the individual
undertaking. There is no prescription except for consistency
of application.
5.4.2 Capital input
Capital input rates as the most controversial aspect of
productivity measurement on the level of the company. The
"quantity" of capital is not so intuitively obvious a notion
as the "quantity" of labour [Siegel p. 19]. Capital can be
theoretically defined in many ways. Useful though, is to
divide total capital <as per balance sheet) into fixed and
working capital. Given this classification, fixed capital is
the category of greatest interest.

Univers
ity of
Cap
e Tow
n
51
FiHed capital comprises elements such as equipment,
machinery, buildings and land. Literature makes mention of
four basic methods to measure this input.
pp. 71-73]:
(Riggs & Felix
5.4.2.1 Depreciation value method
Depreciated book value is taken as an approximation of fixed
capital consumed. It is estimated directly from the
accounting records. For consecutive period measurement, input
is taken to be the monetary depreciation charges. Since the
depreciation values are normally arrived at only after due
consideration of tax benefit write-offs in the first year of
operation, the reliability of the concept is suspect. The
inflation factor impact is as a rule not considered when
deriving "physical" input [Sumanth p. 161]
5.4.2.2 Lease value method
The rental price or lease value approach visualizes capital
assets as being leased [Graig & Harris p. 24]. To calculate
usage values, current purchase prices are deflated to base
year values. The base year value is then multiplied by an
annuity factor, set to recover the invested capital over the
expected life of the asset and the desired return (for the
imaginary lessor). This rental cost is then the input value
for the year.
Example: If the real-rand value of a machine is R50000, its
life 6 years and the expected rate of return 20% , then the
annual "rental" cost (input> is calculated as:

Univers
ity of
Cap
e Tow
n
Value of fixed capital
input for company
5.4.2.3 Annual cost method
52
=
Sum of annuity values for
each asset, calculated
on base year cost, pro
ductive life, and cost
of capital.
= R50000 x capital recovery
factor 20/.. over
6 years.
= R50000 >: 0. 30071 •
= R15flt35.
Similar to the lease value method, a "consumption" plus
return on capital percentage is charged against real-rand
capital stock to obtain annual capital input.· The
"consumption" rate is determined by estimating the useful,
and not book life of an asset. If the useful life is
estimated at 6 years for instance, an asset will loose 16.7/..
of its value annually, which is then the "depreciation" rate.
In addition a return rate of 20% can be allowed, depending on
the average estimated cost of capital. Annual capital input
is calculated by multiplying the real-rand gross investment
by 36.7 percent.

Univers
ity of
Cap
e Tow
n
Example:
Value of fixed capital = Depreciated value of asset x
i~put in company (depreciation rate +
return rate).
= R5ClUZt00 >: < 0. 16 7 + f2l. 20) •
= R18350.
Additions·to fixed capital, where the scope of measurement is
wider than just one asset as in the example, will be deflated
with an appropriate price index to a base year value.
5.4.2.4 Perpetual Capital Inventory method
Not tied to the financial accounts, a separate control is
introduced for capital asset inventory values. An asset's
annual consumption is estimated to establish a schedule of
depreciation based on actual use, not tax life. The estimated
consumption can be calculated as a fixed amount by dividing
purchase value, deflated to base year value, by the estimated
actual life. Each year the portion of an asset's worth that
is "consumed", is then dropped from an updated inventory. For
instance, if the estimated useful life of an asset worth
R50000 in the base period is 6 years, then consumption is
R8333 per year:

Univers
ity of
Cap
e Tow
n
Value of fixed Capital
input
54
Gross value inventory in
base period - updated
capital inventory value.
Where updated inventory value is: Gross value base period
consumption in
previous periods, and
therefore, inventory end year 1 = R50000 R8333 = R47667.
year 2 R5000IZI R16666 = R33334.
and so forth.
Other parameters can be used to estimate "comsumption". If
it is estimated that the machine may be utilized less later
in its useful life, or require more maintenance, consumption
values can be loaded in the earlier periods.
5.4.2.5 Concluding Remarks on Capital Input
It should be remembered that the input element of the
productivity ratio referred to, is supposed to be measured in
physical units. Given the difficulties, should capital really
be considered for inclusion in the productivity equation?
Most examples using index models either ignore capital as an
input, or apply methods of measurement which seem to be of
little assistance to operational management.
Nevertheless, the following measurement method is suggested:
Working capital may be captured in the income statement as
the interest payable on net working capital. If interest is
received, it becomes an output or "positive" input. Different
interest rates can be categorized as input sub-categories of

Univers
ity of
Cap
e Tow
n
== ,J..J
working capital. Physical value can be derived on a defl~ted
monetat-y-val ue !Jasi s. In other- words, the amount of money
value received in interest is deflated to base year value.
For fixed capital, alternative methods to thbse mentioned
above, are difficult to develop and introduce, given that the
company's accounting practices normally force the issue.
Each of the methods presented, carries risks. Since all the
methods go out from a recorded rand-value base, some methods
may overstate value if the derived "physical" write-off is
too large too soon, or understate value if straight financial
depreciation methods are used to value capital usage.
However, fi}:ed capital can be considered in use twenty-four
hours a day. Input can be calculated using this basis which
is more or less the same as that for the depreciation method.
Input is "uncontrollable" once the company has committed
itself. In a sense the level of capital productivity will
depend on market sales demand and not on how production
conducts its operation.
On lower levels of aggregation, fixed capital input can be
measured in terms of machine hours or utilization, separate
from financial considerations.

Univers
ity of
Cap
e Tow
n
56
5.4.3 MATERIALS AND INTERMEDIATE INPUT
All other inputs besides labour and capital are classified as
either materials <raw materials and packaging) or
intermediate goods and services. The latter being things
consumed in the process of producing output. Included are
energy, operating supplies, and other purchased services.
Goods purchased into stock can in most cases be accurately
adjusted ta show actual physical usage. The other
money-valued inputs are deflated to base year prices so as to
derive an imaginary physical value.
5.5 CONCLUSION
Except for the productivity ratio concept, there are no other
fixed principles. Inclusion of a variable in the equation
will depend on the operational definition and the ability to
scale such variable. The traditional format <index approach>
of productivity measurement has many practical limitations.
For this reason "surrogate" measures are utilized provided
that there is an obvious and predictable relationship
' between the behaviour of the surrogate measure and
productivity.
*

Univers
ity of
Cap
e Tow
n
57
CHAPTER 6
PRACTICAL PREPARATION FOR MEASUREMENT
6.1 INTRODUCTION
For each situation, a measurement system has to be built up
from scratch. The theoretical models presented in literature
serve only as conceptual ~rameworks around which particular
conditions. Operationally defined concepts will differ in
each particular instance. The need for direction as to where
one should start with the measurement process, is seen to be
a problem.
6.2 CHOOSING THE CORRECT APPROACH
The ultimate measure of a system's success will be whether it
achieves the objectives for which it was developed. Certain
criteria are common to choosing an appropriate productivity
measurement approach and identifying individual measures
[Seung-ii et al. pp. 555-560]. In this chapter these
criteria are identified and discussed. This is in

Univers
ity of
Cap
e Tow
n
58
preparation for the design and development, in part 2 of this
dissertation, of a measurement system for the target company.
Ev.lei SS pp. 11-16J[Guion pp. 37-38J[Kerlinger pp. 71-75].
These criteria are:
Criterion 1. Unit of analysis: To refer to "levels in the
organization" as being the focus of measurement can be
confusing. Measurement should be applied to a "unit of
analysis" instead. The idea is to divide the company into
independent "measur-ement packets". There are potentially as
many units of analysis as there are activities in the
company. Only certain organizational units though, are
targeted for measurement. In the target company these units
are:
1> The total company <as one system>
2> Sections (or work station groupings) within the
different responsibility centres
3) Individual work stations. <See Appendix C for the
organizational chart}
The definition of each unit may be narrow or wide, i.e.
starting from an individual person or one machine and
progressing up to the whole company. Whatever the choice,
the unit should fit in with the formal organizational
structure, i.e. clarity as to accountability.
Criterion 2. Purpose of measure: in terms of what management
wants to achieve. Are the measurements to be improvement
(show "cause") or control (show "effect") orientated? For

Univers
ity of
Cap
e Tow
n
59
each unit of analysis, specific objectives should focus the
direction that measurement should take. Examples of such
objectives ar-e:
-to serve as psychological stimulus toward better
performance by management, supervisors and/or workers.
-to determine which major factors in the organization
<system) influence productivity.
-to assist proper planning and business forecasting.
-to appraise, by means of before-and-after productivity
comparisons, the efficiency of remedial actions.
-to establish realistic hiring and training schedules.
-to improve work routine and plant layout.
-to improve timing on equipment and process change
decisions.
-to assist buy or make decisions.
-to detect changes in output in respect of alternative
inputs, in order to correct undesirable action, and to
exploit desirable methods and techniques.
-to control the extent to which individuals, work groups
and, in general, operational units are efficient and/or
effective.
-to adjust operational work loads.
-to contr-ol costs by me.ans of targets for r-eject production
and for unit requirement of labour, capital, energy and
materials.
-to facilitate wage and bonus payments.
-to direct budgeting.
[Van Niekerk p. 13. Also Siegel p. 35]
Univers
ity of
Cap
e Tow
n
6121
The list is not exhaustive, but illustrates the point that
situational needs will differ_
For the target company there is an overriding goal: The
system must, as part 01
f total company strategy, faci 1 i tate
and strengthen a movement toward a decentralization of
tactical decision making to the middle and lower management
levels in the organization. <See internal report in Appendix
B.>
Operationally, the underlying goal to be striven for through
measurement on the level of the total company, is that it
will afford a measure of control. On a section level, the
goal is to promote team work. On work station level it is to
promote worker motivation. Hard objectives, specific to each
unit of analysis for which measures are developed, are given
in part 2.
Criterion 3. Type of Data: This criterion has two sides.
Firstly, how detailed is the existing data base, and does it
tie in with the units of analysis targeted for measurement?
Secondly, what detail is required, and on which scale is it
to be measured?
In the target firm, a two-tier information system is
maintained. The first tier comprises the normal integrated
finanacial or mariagement accounting system, consisting of a
balance sheet and income statement. The income statement is
of a mixed classification with some elements.of a trading
statement and manufacturing statement for the firm as a

Univers
ity of
Cap
e Tow
n
61
whole, as well as information in the form of manufacturing
statements for three production departments (called
responsibility centres). Costs are debited or allocated
directly to all the responsibility centres. The format is
scheduled in Appendix D.
Second-tier data originates in the manufacturing department,
and is generated in the work stations by means of production
control charts. The system contains mainly non-monetary
machine utilization and other data for the exclusive use of
the manufacturing department. Labour time measurement is
determined by incorporating data taken off the clock cards
located in each reponsibility centre. The clock card system
is administered by the personnel department who supplies
information to both the financial department and
manufacturing operations for further manipulation.
Criterion 4. Concentration: refers to the degree to which
the measurement administration is to be centralized or
decentralized. The organizational structure has to be
considered.
Notwithstanding the organizational structure, the reliability
of measure is most important. Reliability is the extent to
which repeated measurement produces the same ~esult. Errors
in the measurement process should either be consistent over
time or minimized. A measurement process can have the
following types of error:

Univers
ity of
Cap
e Tow
n
62
1} Variable scaling: which refers to the inherent qualities
of the scale itself. Utilizing a nominal or interval
scale for instance can cause difficulties. Error can be
minimized by ensuring thorough operational definition of
concepts, write-up and scoring.
2>0missions: are a function of operating procedures error.
In the case of the total productivity measurement model
in chapter 7 for instance, reliability will depend on the
quality of data supply from the financial function.
Consequently this model is best administered on a
centralized basis. Omission and incorrect recording can,
on work station level, also be a problem. Data recording
forms design should enable easy write-up.
3)Misclassification: is when certain entities are
incorrectly allocated or omitted. For instance, where an
input is recorded under a resource heading not intended.
Criterion 5. Time Frame: has to do with the time scale of
system introduction and operation. Performance measures
("surrogate measures"> can be introduced reasonably early.
The data required can normally be generated on a routine
basis on work station level. The nature of such measures are
mostly non-financial. Real productivity measures
{output/input> on the other hand, require a very high level
of commitment and cooperation from all the people in the
organization to be effective.
consuming.
This process is time
In the target company the measur~ment needs fall within both
categories.

Univers
ity of
Cap
e Tow
n
63
Criterion 6. Comprehension Level: refers to the user profile,
i.e. the audience for whose use the results are intended.
Whatever the measure, the content must be comprehensible to
the users. Given the need for worker participation in the
decision making process (identified as specific objective in
chapter 8 on work station level measurement), certain
reporting difficulties have to be overcome. Abstract ratio
manipulations are not suited to shop-floor understanding and
discussion. A rule is to present results as simplistically
and graphically as possible.
Criterion 7. Reporting Time cycle: refers to how often result
reports should be made available - daily, weekly, monthly or
yearly. With productivity or performance measurement,
feedback time is of the essence.
Financial function based measurement systems nor~ally lack
time versatility. Administratively, data should be
manipulated as near as possible to the source so as to limit
information feedback time.
Criterion 8. Performance Criteria: To manage productivity
effectively, the array of measures should also include key
factors which affect productivity. In addition to the
productivity ratio and measures of efficiency and
effectiveness, there are "key productivity factors'' [Geyser
PP· 7-17J,.which unconciously affect productivity. Examples
are factors such as absenteeism, quality, working conditions,
etc. Each unit of analysis will have a unique set of factors
to consider.

Univers
ity of
Cap
e Tow
n
64
Criterion 9. Single Indicator: For each unit of analysis, the
measurement system must allow for the different individual
measures to be combined into a single numerical indicator of
productivity or performance. Only the Total Productivity
Measurement Method (Index) is capable of measuring
productivity proper, where all the partial productivities can
either be reflected separately or combined into a single
indicator. The results of all the other measurement methods
such as the Industrial Engineering method and other
"surrogate measures" are "factor" measuring devices. The
numerical results obtained are indicators of productivity.
By making use of the Matrix Method, the results can also be
presented as a single indicator.
Criterion 10. Controllability: The activities measured should
be controllable by the responsible person. For example, the
measure of machine efficiency is not necessarily a reflection
of the efficiency of the labour resource operating the
machine.
Criterion 11. Inclusiveness: The numerical results of
productivity measurement obtained should ideally include all
the measurable variables associated with the cause of
performance. However, the measures decided upon will depend
on many operational considerations. The systems design
therefore, should be concerned with supplying answers only to
what is required. In ~roductivity measurement there is more
than one way of measuring what is essentially the same thing.
If a so-called surrogate measure will ~uffice, then it can be

Univers
ity of
Cap
e Tow
n
65
used instead of the more complex measure. The problem with
surrogate measures though, is that they fragment the
measuring process. The system is therefore not integrated to
the point where a "total effect" reading can be made.
Consequently, a person is not always certain what effect
improvement in one area has on the productivity in another.
Criterion 12. Quantifiability: This criterion refers to the
ability to identify and scale the factors which affect
productivity. It may also refer to the combining of different
scales. Much of this issue is covered in chapter 3 and
requires no further comment.
Criterion 13. Validity of Measure: Finally, but perhaps the
mos~ important, is the issue of validity. It refers to the
extent which the formulated measure is measuring that which
it is supposed to do. When the physical output over physical
input is presented, there can be no controversy. If the
operational definition calls for physical value to be derived
from a given monetary value, there still can be no
controversy. If efficiency is being measured, its linear
relationship to productivity is also normally accepted. The
problem arises when a surrogate measure is taken as an
indicator of productivity, as the conclusions can be
disputed. It is up to management to evaluate the importance
to productivity of such a measure. Operationally, the only
logical way to justify a surrogate measure, is to treat it as
a measure of effectiveness.

Univers
ity of
Cap
e Tow
n
66
6.3 CONCLUSION
Each measurement situation has its own idiosyncrasies. The
criteria however, reflect common issues which have to be
considered before embarking on productivity systems
development.
Given the units of analysis selected and the theoretical
characteristics of the different models discussed thus far,
three models will be developed namely:
1> the Total Productivity Measurement Method <Index) for
the company as a whole
2) a Dimensionless Number Matrix which combines various
surrogate measures of performance for different
sections, and
3) the Industrial Engineering Approach to measure
efficiencies and effectiveness within the work
stations.
*

Univers
ity of
Cap
e Tow
n
PART 2
Productivity measurement models for a manufacturing
company.
The target company is involved in the milling, packing
and marketing of grain products.

Univers
ity of
Cap
e Tow
n
67
CHAPTER 7
PRODUCTIVITY MEASUREMENT ON TOTAL COMPANY LEVEL
7.1 INTRODUCTION
In the target company the only re-occurring and consistent
source of data which relates total income <output> to total
cost (input>, and from which can be developed a total company
productivity measurement model, is the financial statements.
The ideal data format and detail required, were presented in
figure 2.1 CREALST>, chapter 2. Depending on the available
data detail, several variants of the total productivity
measurement method (or index model> may be applied.
Application in a practical sense, is guided by a specific
operational definition of the productivity concept. Whether
total monetary values are utilized to derive physical outputs
and inputs, or monetary value is to be inclu~ed in the
productivity concept - by implication the issues of
reliability and validaty will feature prominently.

Univers
ity of
Cap
e Tow
n
68
7.2 SPECIFIC PRODUCTIVITY MEASUREMENT OBJECTIVES
Specific objectives relating to productivity on company level
measurement are the following:
1. To provide an analytical productivity audit of
company performance.
2. To facilitate productivity control of non-physical
transactions (functional services>.
3. To assist with the setting of productivity
objectives for planning purposes in terms of
money-valued efficiency and effectiveness.
The use of the information emanating from the model, is
primarily to aid top management in operational decision
making.
7.3 THE TARGET COMPANY INCOME STATEMENT FORMAT
Income statements for two periods of a food manufacturing
enterprise are presented in the Appendix section. In Appendix
D, the statement for April (period 1} is presented, and in
Appendix E, the statement for May (period 2).
Apart from the total monetary value being stated, th~
statements include a horizontal classification which breaks
down the total monetary value for allocation to the various
middle management responsibility centres. The column

Univers
ity of
Cap
e Tow
n
69
classification does not necessarily signify importance within
the organization's authoritative hierarchy.
organizational chart in Appendix C.
7.4 INCOME STATEMENT ISSUES
See the
On company level performance measurement, the operational
definitions of both the productivity concept and other
productivity variables will be decisively influenced by the
financial data presented.
The reliability of data taken from financial statements
should as a rule be questioned. What is seen as perfectly
correct procedures in financial measurement, may not be
acceptable for productivity measurement. Agreement has to be
reached on the manner and consistency of financial reporting
practice. Areas of concern may relate to the following:
1) Consistencv: as to book entry. If the purchase of a
resource is' booked in a period other than the one
intended, this may reflect as an unrealistic decrease or
increase of productivity in a particular period. Also
consistency as to the allocation of costs and income to
the same accounts over time.
2> Stock taking: The level of accuracy which, apart from the
count, involves issues such as classification and
relationship between the costing <FIFO, etc.) and stock
turn on raw materials and packaging materials.

Univers
ity of
Cap
e Tow
n
70
3) Profit Provision~ These exist in most industrial
organizations. If profit provisions are debited between
periods to any account in an inconsistent manner (i.e.
not declared to users of productivity information>, it
will render productivity measurements unreliable. As this
is a major distortion factor if not handled correctly, it
is essential to get agreement from the financial
functionaries that profit provisions be debited to one
account consistently. Normal operating provisions, i.e.
late receipts of invoices, etc., should be handled in a
manner which contributes to consistency, as in point 1
above.
4) Pricing policy: On the output side, selling price lists of
the target company are adjusted only once per year. Price
levels are traded off from the list price and recorded
separately as either promotions or di~counts, whichever is
applicable. This practice simplifies productivity
measurement since the unit price element can be considered
stable on the output side, with discount being treated as
an input in the same way as raw materials for instance.
The measurement model to be developed, utilizes indices to
indicate either an increase or decrease in productivity. To
illustrate the adopted principles on which measurement is
based, only two measurement periods, or two consecutive
months, were chosen for demonstration.
Money values are not adjusted for time elapse. For each
accounting entry the responsibility centres are totalled to
column 11. <See Apendix D & E>. Vertically, income and costs

Univers
ity of
Cap
e Tow
n
71
are classified in typical financial manner. Additional
information, not normally included in an income statement, is
for an inventory adjustment of finished products, which
reflects production (line 2) as opposed to sales (line 1>.
The terminology "variable e>:penses" and "fixed e>:penses" (on
lines 14 and 25>, may confuse as it is not meant to describe
literally the characteristics of the costs. The "fixed
expenses" are not in all cases fixed. A mor-e appropriate
description would be "overhead expenses". Interpretation of
the rest of the information contained in the two income
statements is conventional.
7.5 A PRODUCTIVITY STATEMENT FOR THE TARGET COMPANY
Once the issues regarding financial write-up have been
resolved, a specific productivity statement format has to be
drawn up. The process involves editing out certain financial
elements not required in terms of a specific productivity
measurement objective.
7.5.1 Editing Data
The editing task involves making a decision as to which
output (income) or input (cost) elements are to be included
in the productivity statement. Measuring total productivity
does not mean having to measure each variable or factor. The
contribution of an omitted input component, if included in

Univers
ity of
Cap
e Tow
n
72
the income statement, but not the productivity statement, is
automatically captured in the equation through the principle
of causality. A variable consciously omitted from the
productivity statement, need not invalidate the measured
result in so far as other inputs are concerned. A practical
example of omittance, in a multi-factor <total> measurement
type system, being reportedly successfully applied, is that
of ESCOM [Cooper pp. 12-17]. In their model only key,
physical measurable input factors are taken into the
equation. A prerequisite for omitting an element is that the
same condition be maintained in subsequent productivity
statements {consistency over time).
For the target company, all income statement items are
included in the productivity statement so as to relate profit
to the performance of the different input elements.
7.5.2 Format Design
With editing complete, the remaining elements are rearranged
to bring together the different output (income) elements and
then the input (cost> elements into chosen categories. If a
traditional category mode is implemented, input can be
divided into the four resource categories already mentioned.
The statement format chosen for the target company is
represented in tables 7.5 through to 7.14 in Appendix F.
Normally the tables are combined into one statement. For
purposes of discussion however, the different categories are
presented separately.

Univers
ity of
Cap
e Tow
n
73
The basis for the input group classification used here, rests
on careful discussion with senior management as to the
preferred combination of elements. The intention is to bring
together input elements more or less similar in nature, and
to group together resource input elements which correspond to
the managerial responsibilities of different members of
senior management <the document being intended for use at top
management· level only).
Table 7.5: includes all the elements of output which,
referring to column 2, are the monetary value of production
of the three responsibility centres responsible for the total
physical production. On a month to month basis, production
output is considered more closely tied to input than is sales
output. Some proportion of sales is drawn from inventories
from a previous period's production input.
Table 7.6: includes all the elements considered to be related
to the labour input.
Table 7.7: represents elements related to the raw material
and packaging material input.
Table 7.8: includes depreciation and interest, representing
capital input. As was indicated in chapter 5, there is little
guidance or agreement as to how capital input should be
calculated.
In this model, fixed capital usage is taken to be the
recorded depreciation. Working capital (net) usage is
interest paid. Both these resources are treated no
differently from .any of tl1e other inputs. If, because of
financial (tax) considerations, more fixed value is written
off in one period than in another, then a higher depreciation
Univers
ity of
Cap
e Tow
n
74
value is taken as an increased input. The same principle
applies in the case of interest. Interest is seen as a
service input consumed by the company.
Rather than capitalize a fixed asset and depreciate, the
company may decide to write off the amount of purchase to
operational expense. Because this model includes all inputs
<which are financially recorded>, it means that a write-off
will be captured somewhere in one of the other input
categories. Should write-offs occur to, say, the factory
maintenance account, then it is suggested that a "non
operational" maintenance account be opened for such purposes.
This entry can be classed with the capital elements in the
productivity statement so as to reflect the trade-off.
is one of the issues whose handling is to be decided
beforehand.
This
Tables 7.9 to 7.13: Traditionally, all elements which are not
at home in either the labour, materials or capital categories
are grouped as so-called intermediate inputs. In this model
four sub-categories have been chosen on the basis of top
managerial responsibility. The categories are: materials
handling, marketing support services, production support
services and administration support services.
Table 7.14: contains the various column totals of the
productivity statement.
Profit provision is grouped with the profit entry on line 90
<table 7.14) of the productivity statement. This provision is
not considered to be either an input or an output. As with
profit, it is the result of the overall company activity and
is considered an output of another unit of analysis

Univers
ity of
Cap
e Tow
n
75
(shareholders). If at a later stage it is decided to bring
the provision back into the operational accounts to cover a
real expense, then only will it feature in the company s
productivity equation. While a provision is being
entertained, its effect on total productivity is
theoretically channelled through the interest input. The
provision entry is a credit balance on the balance sheet
which affects working capital and therefore interest <the
interest charge is captured on the income statement).
7.6 THE PRODUCTIVITY CONCEPT OPERATIONALLY DEFINED
The write-up conventions and design decisions stated above,
are part of the operational definition. The formulation of
the productivity concept in this model corresponds to the
money-valued productivity concept argued in chapter 2. The
concept combines both the physical and monetary values into a
single indicator of performance in an effort to answer to the
measurement objectives stated in para. 7.2.
An overview of the concept calculations are: Recorded output
tonnage in the base period is taken to be the physical
component for both output and input. By dividing this
quantity into the total monetary value of any line item on
the productivity statement a ''unit price" per ton is
extracted for each item. The unit price as per line item is
transferred as a constant to all succeeding periods. Making

Univers
ity of
Cap
e Tow
n
76
use of the constant "unit price" and total monetary value, an
"imaginary" physical value is derived for each subsequent
period. A detailed explanation follows.
7.7 CALCULATIONS
Refer to the productivity statement in appendix F.
7.7.1 Calculating output
The output calculations for period 1 <April) in table 7.5 are
reflected in columns 2, 3 & 4, and for period'2 <May) in
columns 5, 6 & 7.
2 3 4 5 b 7 8 9
Apri 1 Apri 1 : Apri 1 : : Hay : May May i: PRODUC: Profit TOTAL OUTPUT : Current : Tons : Derivrd : : Current iEquiva. :constant : lTIVITYiHovement I Line
:Total Value: :Unit Pri[e:Totai Value: Tons :Unit Pri[eilndex : :Ref.
!Rand) --------------- ----------- -------- ---------:!----------- -------- ---------
:Product Group 1: 4767658 1859 25b4.b4 :: :Product Group 2: 2260224 : 2616 : 864.00 : l :Product Group 3: 1026207 : 1253 : 819.00 : :
4649648 1895730 : 11 !0i70 :
11 II
11 11
11 II
:--------------- ----------- -------- ---------: :----------- -------- ---------:: :Total output 8054(189 : 5728 : 1406.09 : : 7656148 : 5445 : 1406.09 : :
=============== =========== ======== =========::=========== ======== =========:: : 5431 1409.71 --Actual May Month
Table 7.5: Extract from Productivity Statement: Total Output. --------- (see Appendix Fl
1 2 3
4

Univers
ity of
Cap
e Tow
n
77
The total monetary value of physical production of the three
product groups (col. 2, lines 1, 2 & 3) is derived by
adjusting gross sales value by finished goods inventory; that
is, gross sales minus opening stock plus closing stock. Tons
of goods produced (col. 3, lines 1, 2 & 3), are calculated in
a similar manner.
For April, which is the base period, total output value
<R8054089 in col. 2, line 4) is the sum of the total outputs
<gross production) of all three product groups. Total
physical output quantity is represented by the total tonnage
(5728 tons in col. 3, line 4). Total average unit price
<R1406.09 in col. 4, line 4), is derived by dividing the
total tonnage quantity into total monetary value, i.e.
R8054089/5728 = R1406.09.
Total output for period 2 <May> is calculated by taking unit
price to be the same as for April, i.e. R 1406. 1219. By
dividing R1406.09 into the total production, revenue <R7656148
in col. = ,_J' line 4) of May, an equiv~lent tonnage (5445 tons
in col. 6, line 4) is derived.
Price adjustments are made annually at the beginning of
October. Equivalent output therefore, in this case more or
less equals real physical output. The difference between the
derived "imaginary" or- equivalent, and real total average
physical output <see col. 6, line 4 and below line 4>, can be
ascribed to a slight product mix change from one month to the
next. Referring to the production output data of the three
product groups listed in Appendix G, it is noted that over a

Univers
ity of
Cap
e Tow
n
78
period o~ R year, output o~ the three groups ramajned more or
less proportionally stable. This obviously minimizes
distortion when including input quantities into the
productivity equation, i.e. working with the total average
output as cipposed to the individual outputs. Total
"imaginat-y" output as defined in period 2, thus carries a
slight bias due almost totally to product mix change.
7.7.2 Calculating Input
7.7.2.1 Deriving Input Quantities for Period 1
In table 7.6, column 2 reflects the total monetary cost
values for each labour input as transferred and edited from
the April income statement <base period).
'i .. 3 4 5 6 7 g 9
April April : April : : May : Hay May : lPRODUC: Profit LABOUR INPUT : Current : Tons : Derivrd : : Current iEquiva. :Constant : :Til/ITYiNovement iline
:Total Value: :Unit Price I Total Value: Tons :Unit Price: Index : :Ref.
--------------- ----------- -------- ---------::----------- -------- ---------: :-----~:---------: :Salaries R241, 166 5728 R42.10 II R234,029 5559 R42.10 IJ 98 (R4,779): 5 11 11
: ~Jag es P.280,194 5728 R48.92 11 R261,987 5355 P.48.92 JJ 102 R4 1363 I 6 11 11 I
: Motor Cars R16,615 5728 P.2.90 II R16 1242 5601 R2.90 11 97 (R448): 7 JI II
:staff costs R104 )72 5728 P.18.20 JI R95,731 5260 R18.20 11 104 R3,389 8 11 11
: Staff recrui te P.215 5728 R0.04 11 RO (I R0.04 , , P.204 9 II 11
: Staff training R15,733 5728 R2.75 I I R5,432 1975 R2.75 11 276 R9,524 10 11 11
iProt. Cloth. R3 1 121 5728 R0.54 11 R2,865 5306 R0.54 11 103 R102 11 11 II
: Canteen R3,256 5728 R0.57 11 R2, 134 3744 R0.57 11 145 R961 12 11 11
!--------------- ---~------- -------- ---------::----------- -------- ---------: :------ ---------~ lLABOUR I R664 1572 I 45824 I Rl4.50 11 R618,420 I 42650 I R14.50 11 102 I Rl3 1316 I 13 I I I 11 I I 11 ' ' :--------------- ----------- -------- -----~---::----------- --~----- ---------: :------ ---------:
Tabie 7.6: Extract from Productivity Statement: labour input. --------- (see Appendix Fi

Univers
ity of
Cap
e Tow
n
79
In column 3, an imaginary physical input quantity for period
1 is derived. All the input elements, no matter their
particular physical scale (defined or undefined} are
converted to a scale equal (individually} to the total output
tonnage of period 1.
The physical quantity for salaries in period 1 (col. 3, line
5) for example is taken to be 5728 "imaginary" physical
units. The argument is that for the base period, to deliver
an output of 5728 physical units, it requires an input of
5728 imaginary physical salary units. The average unit cost
price for salaries is derived by dividing the imaginary units
into total cost, i.e. R241166/5728 = R42.10. The same
calculation principles apply to other inputs in period 1.
7.7.2.2 Deriving Equivalent Input Quantities for Period 2
Again using the salary input to illustrate: The average unit
cost price from period 1 <R42.10> is tranferred to period 2
(col. 7, line 5). By dividing the average unit cost price
into the total cost (col. 5, line 5>, an equivalent or
"imaginar·:.1" input quantity (5559 in col. 6, line 5) is
derived for period 2.
As the formulation in period 2 stands, some monetary value
<unit cost price change) may possibly have been translated
into the "imaginary" physical scale if real (but unknown>
unit prices have changed. This means that the difference
between the "imaginary" quantity in period 1 <5728) and

Univers
ity of
Cap
e Tow
n
80
period 2 <5559) is a function of more physical units having
been consumed, as well as possibly a change in unit price
being translated into the 5559 in period 2. These arguments
essentially reflect the difference between "physical"
quantity in this model and other models.
If the intention is to obtain equivalence in the sense of
derived real physical quantities, the total monetary value
first has to be deflated with the appropriate pr·ice index.
7.7.3 Calculating the Productivity Index
Given the productivity statement format, productivity as
operationally defined, can be calculated on three
multi-factor levels of input aggregation: The first is on a
single account level, i.e. salaries, protective clothing etc.
The second is on a grouped basis, i.e. labour input, capital
input, production support services etc. The third is on an
all factor "total" input basis.
Notwithstanding the level of aggregation, the formula for
calculating productivity is the same in each case. The
results of the two periods' productivity ratios are not
included in the productivity statement. These calculations
are done automatically to culminate as a period change index
in column 8. Each index (per input category> is calculated by
first determining the productivity ratio of period 1, and
then dividing that into the productivity ratio of period 2.
To illustrate, using the packing materials input element on
line 18 of table 7.7:
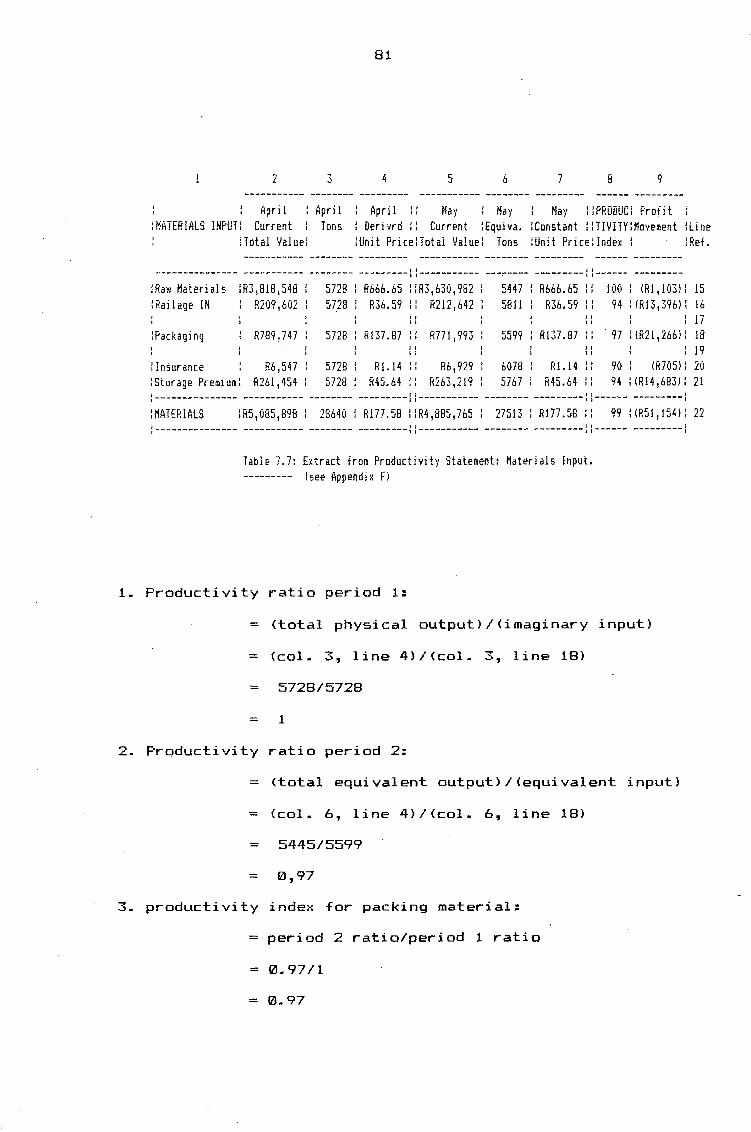
Univers
ity of
Cap
e Tow
n
81
2 3 4 5 6 7 8 9
April : April : : May : May May : :PRODUC: Profit April :MATERIALS INPUT: Current
:Total Value: Tons : Derivrd : : Current lEquiva. :Constant : :TIVITYlMovement lline
:Unit Price:Totai Value: Tons :Unit Price:index : :Ref.
I I JI --------------- ----------- -------- ---------. ,----------- ---~---- ---------, ,------ ---------: Ra~i Materials : R3, 818, 548 5728 R666.65 : : R3, 630 I 982 5447 R666.65 11 10(1 I iRl, 103): 15 11 I
:Rail age IN R209,602 5728 R36.59 11 R212,642 5811 R36.59 11 94 :rn13,396): 16 11 11
II 11 17 I I 11
: Packaging R789,747 5728 Rl37.87 11 R771 1993 5599 Rl37.87 11 . 97 l(R21,266li 18 11 11
11 II 19 ll 11
: Insurance Rb,547 5728 Rl.14 11 Rb,929 6078 Rl.14 11 90 (R705): 20 11 11
:Storage Premium: R261 1 454 5728 R45.64 11 R263,219 5767 R45.64 11 94 :rn14,6B3J: 21 11 11
:--------------- ----------- -------- ---------i:----------- -------- ---------: :------ ---------: :MATERIALS :R5,085,898 : 28640 : R177.58 llR4,885,765 : 27513 : R177.58 :: 99 : IR51,154l: 22
----------- -------- ---------::----------- -------- ---------: :------ ---------:
Table 7.7: Extract from Productivity Statement: Materials input. --------- (see Appendix Fl
1. Productivity ratio period 1:
= <total physical output)/(imaginary input)
= {col. 3, line 4)/{col. 3, line 18)
= 5728/5728
= 1
2. Productivity ratio period 2:
= <total equivalent output)/(equivalent input)
= (col. 6, line 4)/(col. 6, line 18)
= 5445/5599
= 0., 97
3. productivity index for packing material:
= period 2 ratio/period 1 ratio
= 121.97/1
= Cll. 97

Univers
ity of
Cap
e Tow
n
82
Calculating the partial productivity for an input group such
as materials for instance, the same procedure is followed as
above. Referring to table 7.7, the productivity index for
materials is .99 or 99 (col. 9,line 22>, meaning a
deterioration of 1/. in productivity for that particular
group. The rest of the index readings are self-explanatory.
Total productivity for the company improved by 1% as
reflected in column B,line 88 - See Appendix F.
7.7.4 Introducing New Input Components
As the model stands, a debit balance in the income statement
of any subsequent period will automatically be taken up in
the productivity statement. The more detailed the account
classification in the base period, the less is the risk of a
misallocation of input elements in succeeding periods. It is
possible to create a new account <or input} heading,
representing an input of a kind no~ reflected in the base
period, in a subsequent period. The total monetary value of
such an entry can be reflected in column 5 in the normal
manner, without a unit cost price being stated or equivalent
quantity calculated. No element index calculation is done
<since it has no base period comparison). The total monetary
value will nevertheless be taken into the group total
<labour, materials etc.). The group's average unit price, to
which the new entry is allocated will remain unchanged. The
reason for this is to determine the money-valued productivity
shift relative to the base period of the resource grouping
being measured. The same principle applies in the case of a

Univers
ity of
Cap
e Tow
n
83
cost element having been separately debited in the base
per·iod, and nr:n" r··t::-f.lecting a nil balance in a subsequent
period.
7.7.5 Profit Movement
Column 9 is an indicator of the change in profit for period 2
brought about by the change in productivity for each line
i tern.
For example, the decrease in productivity of 2% on salaries
<line 6 in table 7.6) sacrificed R4779 in profits for period
2. The loss or gain on each line is calculated as follows:
Change in profit = (Qty. change in output - Qty change in
input> x total cost period 1
=<col 6, line 4)/(col 3, line 4>-<col 6,
line 5}/(col 3, line5} x <col 2, line 5)
= ((5445/5728)-(5559/5728)) <241166)
= R4779
Note that the profit on the income statement and the profit on the
productivity statement differ to the extent that the latter is
based on production figures and not sales.

Univers
ity of
Cap
e Tow
n
84
7.8 INTERPRETING THE RESULTS
7.8.1 A General intepretation
The logic for calculating ''imaginary" equivalent quantities
in period 2 is sound if the nature of the content is known to
the person doing the analysis. Since output for the two
periods have remained more or less the same, a shift in the
productivity index is to be interpreted as: either a change
in technical efficiency and/or a shift in current unit cost
price and/or a shift in the input mix (per line item).
7.8.2 Interpretation in terms of objectives
7.8.2.1 "Provide an analytical productivity audit of company
performance", was the first objective to be achieved. The
operational definition of the productivity concept has been
established as being of a money-valued dimension. An
improvement in the'index indicates that, given the three
possible reasons for a shift in productivity (see above), a
positive combined result, i.e. the trade-off, was positive
in terms of what management paid for and how it applied the
resource. By including more input elements into th~ same
equation, the trade-off among the input elements as a
combined measure is also displayed.

Univers
ity of
Cap
e Tow
n
85
For the month of May (period 2}, it was independently
established that there are twenty seven elements of which the
respective unit input prices did not change. In monetary
terms this represents an amount of R6703688 <May> or 97% of
all input. In other words, for virtually 100% of the inputs
the money-valued productivity index and the physical
productivity index are the same concept. By ''no input unit
price change'', is meant that, had the same input purchased in
May been bought in April, the price would have been the same.
The values in column 6 can therefore be seen to represent
real physical quantities in instances similar to the above.
However, such interpretation.should be cautiously considered
since the "input mix" factor is still present and can,
depending on the output product mix, vary to such an extent
as to render such a supposition invalid.
7.8.2.2 "Facilitate productivity control of non-physical
transactions" was the second objective to be achieved.
Services are in many instances supplied to the company on a
quoted price basis where it is difficult to determine the
true value of such service to the company. Say, for example
an additional fork lift has to be hired in period 2 <line
33). Various input-output combinations may result (nine in
fact>, of which only two are discussed to demonstrate the
analytical approach:
1> an increase in input with no incr~ase in output. In this
example using period 2 as being some future period, it
means that a R1000 hire cost would increase input by 581
equivalent units. Given an estimate of 5445 equivalent
output units, productivity of the resource may deteriorate
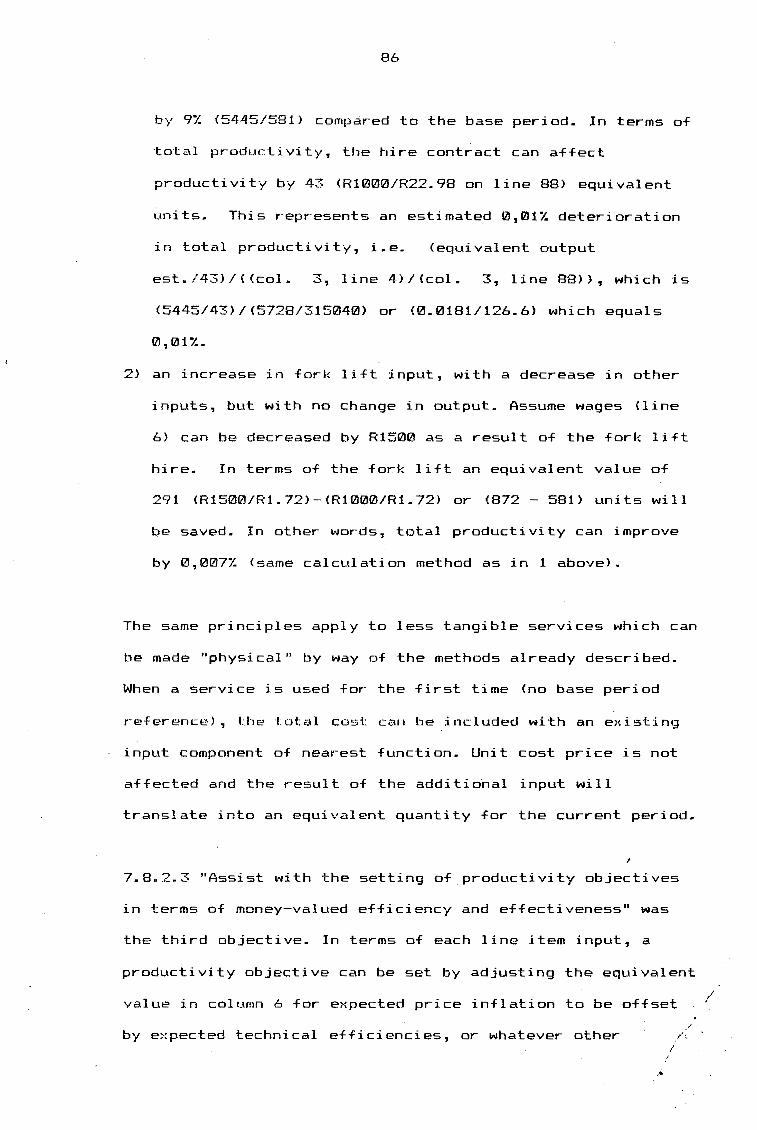
Univers
ity of
Cap
e Tow
n
86
by 9% <5445/581> compared to the base period. In terms of
total productivity, the hire contract can affect
productivity by 43 <R1000/R22.98 on line 88> equivalent
units. This represents an estimated 0,01/. deterioration
in total productivity, i.e. (equivalent output
est. /43) I< <col. 3, line 4}/(col. 3, line 88>>, which is
(5445/43)/(5728/315040} or (0.0181/126.6) which equals
0,01%.
2) an increase in fork lift input, with a decrease in other
inputs, but with no change in output. Assume wages Cline
6} can be decreased by R1500 as a result of the fork lift
hire. In terms of the fork lift an equivalent value of
291 <R1500/R1.72>-<R1000/R1.72> or <872 - 581) units will
be saved. In other words, total productivity can improve
by 0,007% <same calculation method as in 1 above}.
The same principles apply to less tangible services which can
be made "physical" by ~·Jay of the methods already described.
When a service is used for the first time (no base period
r-eference) , U1e total cost can be included with an e)d s·ti ng
input component of nearest function. Unit cost price is not
affected and the result of the additional input will
translate into an equivalent quantity for the current period.
7.8.2.3 "Assist with the setting of productivity objectives
in terms of money-valued efficiency and effectiveness" was
the third objective. In terms of each line item input, a
productivity objective can be set by adjusting the equivalent
value in column 6 for expected price inflation to be offset
by expected technical efficiencies, or whatever other
...
/
/ /:
I

Univers
ity of
Cap
e Tow
n
87
condition is expected. The manager responsible for a specific
group of inputs ~hus has a flexible choice for achieving the
stated objective. The input objective should obviously be set
relative t6 the same period's output as well as the base
period's productivity. The input objective therefore is not a
static number, but will have to fluctuate. In fact, the index
percentage increase or decrease will be the objective.
Expected fluctuation in utilization, as determined by output,
will need to be taken into consideration when determining the
equivalent input quantities. If physical output is cyclical,
and monthly productivity comparisons are made, it might be
wise to introduce a moving base period arrangement, whereby
the current period measurement is compared to a base period,
one year previously, i.e. May 1990 (base>, May 1991
{Current).
7.9 CONCLUSION
The validity of the operational concept definition can be argued.
By applying deflation techniques to stabilise monetary value,
technical productivity can be derived. If done, the question then
is: How accurate is the result?
The aim is not to detail the causes of a shift in productivity.
No generalist model on this level of measurement can do that. The
aim is to monitor the effects or perfo·rmance of acti vi ti es in the
company - in terms of the output/input concept.
Univers
ity of
Cap
e Tow
n
88
CHAPTER 8
PRODUCTIVITY MEASUREMENT ON WORK STATION LEVEL
8.1 INTRODUCTION
The need for performance measurement on a work station and
section level in the company was prompted by problems
experienced on an industrial relations front. A major issue
was worker <and management> motivation and commitment. A
strategic decision was taken to improve the organizational
structure by delineating more clearly areas of accountability
and tactical operational decision making; thus repositioning
the foreman into a strong leadership role.
To support the strategic endeavour, which admits controlled
i-Jorker participation, the mechanics of the measurement system
had to facilitate accurate and speedy performance information
feedback. The project included the establishment of physical
facilities to promote a team spirit in each section. Several
"libraries" (group meeting areas) were established in the
various sections to assist formal communication on tactical
operational planning and measured performance feedback.

Univers
ity of
Cap
e Tow
n
89
Measuring productivity on lower levels in the organizational
industrial engineering approach, whereby the efficiency of
each resource utilized, is measured. Or the "performance
indicator" approach, which measures the performance of
identified productivity factors, i.e. effectiveness.
This chapter reflects the broad framework and examples of how
the measurement challenge was handled on a section and work
station level.
8.2 APPLYING THE MODEL DEVELOPMENT CRITERIA
Developing a measurement system starts off by drawing up a
measurement profile fact sheet, based on the criteria stated
in chapter 6. If, for whatever reason or constraint~
measurement on a lowest level of aggregation <work station)
is found to be impractical, the level of aggregation can be
moved up. Figure 8.1 reflects the different levels of
recognised organizational aggregration.
8.2.1 Setting up a Measurement Profile Fact Sheet
Any suitable visual format can be selected for the fact
sheet. It should nevertheless contain at least three broad
categories of information: Firstly, information relating to
the situational conditions within the unit of analysis

Univers
ity of
Cap
e Tow
n
91Zl
selected. Secondly, existing const~aints relative to each
condition identified. And thirdly, possible solutions to the
constraints.
COMPANY
DEPARTMENT
RESPONSIBILITY CENTRE
SECTION
WORK STATION
Figure 8. 1.: Levels of Recognised Organizational · Aggregation in the Target Company
Situational Conditions: Having identified the unit of
analysis, the first step is to connect all the relevant
subsystems to the unit of analysis. A second step is to
stipulate the purpose of the measurement as it relates to the
unit of analysis. The third step is to define and list the
performance criteria considered appropriate and necessary to
serve the purpose of measurement. Fourthly, establish the
availability of the type of data required, for the unit of
analysis, as well as on lower subsystem level. Step five is

Univers
ity of
Cap
e Tow
n
91
to determine the availability and reporting cycle of each
data (and/or information) type, i.e. daily, weekly and/or
monthly. Step six is to determine feasibility and preference
to integrating the system to a higher level of organizational
aggregation. At this stage it also has to be decided whether
the measurement system can be internally managed or if
outside administrative resources would be required. Step
seven is to define, precisely, the user profile. The final
step is to identify possible measurement modelling
approaches, i.e. index, objectives matrix, industrial
engineering, or any other.
Since the criteria are interdependent, step selection need
not necessarilly follow the same sequence as above.
Constraints: A constraint may be identified in any of the
criterion areas stipulated above. For example: The user
profile may indicate illiteracy in a certain section, which
means that pictorial reporting of results may have to be
considered to improve comprehensibility. It may also mean
that meter reading instead of data "write up" is required for
data collection at work station level; or that a specific
training program should first be instituted. A constraint
will be relative and situational, applicable only to the
specific unit of analysis.
Solutions: They may be long term and/or short term and of a
nature not foreseen when the intention to measure was first
mooted. The process of scheduling longer term solutions is
best handled by phasing objectives. For immediate action, the
Univers
ity of
Cap
e Tow
n
92
focus should be on aspects pertaining to the "ability to
measure". The approach should be positive and energetic with
a view to start the measurement process without delay. A
compromise situation will most probably arise, given the
totality of constraint~. In such situations the versatility
of the measurement system, becomes all important.
It should be obvious that every individually identified unit
of analysis will have its "own" profile. For each a fact
sheet can be drawn up.
In the work that follows the packaging section of the
responsibility centre (product group 1) containing work
stations 33, 34 and 35 <see Appendix C>, will be used to
illustrate the measurement techniques and principles utilized
on this level of organizational aggregation in the company.
8. 3 MODELLING THE liJORI< STUDY APPROACH
Two of the work stations (33 & 34> covered by the intended
measurement, each consists of a series of machines in a
continuous flow production mode. Each series, with five
operators/workers on each process, is defined as a work
station. The third l>'JOrk stati.on <35} also consists of a
series of interconnected machines, but the process is
utilized intermittently on a batch production basis. One
foreman oversees all three stations. Another seven workers
service all the machines with packaging material handling,

Univers
ity of
Cap
e Tow
n
93
palletizing packed product, general cleaning and relief
duties. Although acti~ity-wise, each bank of machines (work
station> operates independently, 33 & 34 feed on raw material
off the same process further up the line (another ,section
with its own foreman). Work station 35 is connected to yet
another process and packs a variety of derivative products.
All the processes are machine driven, but under operator
control. Work in progress can be stored either immediately
before or after each of the processes mentioned.
8. 3. 1 Theoretical frame\l'Jork for measurement
Applying the so-called industrial engineering approach of
productivity measurement, involves work study techniques to
establish work standards. Supportive to the concept of work
study are the techniques of method study and work
measurement. The former is aimed at the development and
application of more efficient methods to ensure optimal
utilization of resources. The latter is aimed at
establishing time standards against whi~h the performance of
work can be measured.
The interest here is not method study. Method study comes
into its own during productivity improvement and operator
training. These needs will be identified by the measurement
process.
Work measurement can be direct or indirect. Direct
:;1easurement consists of stop watch measurement and activity
sampling. Indirect work measurement can be an estimate and/or

Univers
ity of
Cap
e Tow
n
94
acceptance of standards supplied by someone else, such as the
supplier of a machine. The establishment of work standards
can be taken in a wider context than that of quantitative
standards, to include financial standards which bring the
process into the sphere of a standard costing system.
Figure 8.2 clarifies:
Work Standards
Flnanclal standards
Matertal usage st~ds <staodard mateml usage 1.
per produotion batch}
Time OI' performance standards for laboLr am! or machines
material prioe standards
Standard hourly rates labour, machines & overheads
2.
3.
Cost Standards
standard production cost uM i.e. standard mat. cost
• 1x3 st aodard lab. cost = 2x 4
Standard mach. cost = 2x4
Staodard overh. = 2x4
Figure 8.2. : Diagrammatic representation of standards --"'---- determined in the production department a".d how they
are utilized in the calculation of standard unit costs. Source: De Bruin, J.W.A. S.A Chartered Accountant p. 140
Work station performance is measured in terms of machine
efficiency and process effectiveness based on quantitative
standards (see figures 8.4 & 8.5).
Univers
ity of
Cap
e Tow
n
95
8.3.2 Situational Examples
All the examples relate to work station 33, but the same
principles apply to the other work stations (manufacturing).
8.3.2.1 Machine Efficiency (work station 33}
The first performance measure is machine efficiency.
Efficiency is derived from the utilization concept.
8.3.2.1.1 Machine Utilization - Data collection
The recording of production data originates in the work
station and is done on a continuous basis throughout the
working day. See production control chart in figure 8.3.
Data is recorded in the following categories:
Production start and stop times: The period in between is
seen as time "in control'' of the operator.
times are determined by shift management.
Start and stop
Units produced: are meter measured, whereby the finished
products (in retail units of 500gm> coming off the production
line is recorded. These quantities are translated into
wholesale pack sizes and reconciled with receipts in the
warehouse <the next process or work station).

Univers
ity of
Cap
e Tow
n
96
wonl(ST/\TION l.D. :_.?~-------·-DAILY- WORKSTATION PRODUCTION RECORD
/o10N _ /3.9.qo DA Y--------------DATE---------------
TIME WlllTE 'l'ICJ<Ei" I w1:.1rn-rrs DOWNTIME TIME /COUNTER
NUMBER 1 2: 3 4 5 6 ------
STOP -----
5.00 µ..___
4.30
4.00 lJ.·oO SI./ I fl GI\/.~
3.30 3.3o C 1.-l: A "11/\/C, IS m. CU:11N1NC, -3.00 3.Js l.fS7t:,o SOS' SP(;, S"oc. S°()t,i. sos ~or 2:.30 3f?/Zo <IJtg !.f~'t i.i&f t/ so~ Sb3 :5ll:S 2:.00. 34-780 So.3 S()l.J. SOLi- Sos So!> 5"03 1.30 313_ :Lo 5o<J. SOl;.. sos- 'i'lt m 44g 1.00 30920 if~ LJf?C) 4-q3 l/qy.... 5oz. <;oi.J.. 3om. Ll/ IVL-1-1
~ ----1 2:.30 :Vl.4-2o SD?> S'Ol/- Soll- .ror r10 Sii
e----- --NOON /.;J ·lo 2312Q_ So(, SO(, SOI so3 S0.3 !;Ot}.
11.30 ZCJl/-3o ~lo soi S°02- ~11s 'iro<f S°Ot"
1 1.00 172/D 'A6 ~o-a ~d.3 S°c!! ~Olf 5CX/.----10.30 !S910 l.f9S So3 S11~ S(){, S"o6 t;c)r ,_ 10.00 !S810 So3 Sot ~d\l. S"a"1 ~1-l/~ 'i1f 3o l'YJ. Tc4 9.30 13 2.10 500 'SOCf -~'2. soz. S"t-2 .. ~--- ,,. -9.00 lo !SO S0.3 SOI ,_ S"o"l SOii- -;'0<1- [;Cu}
8.30 7839 Sol Sl:IO So:z 401 .roi !7D3 b rn. Ul/brJNli/C ,_ --8.00 ~bOO Soo $6~ ~00 !:°DI S()/ 50~ ,_ --,_
$ /'YI. I Alli/£ IC. .51?TJJN'g 7:30 ;2. /00 So; Soi S°c:.O .r°OJ ~oz '50/
START 7-oO 0 DATE CODE: c:Jf,
PRODUCT OPENING WHOLESALE .. AFTER - .. AFTER - CLOSING TRANSFER DESCRIPTION STOCK UNITS METER METER STOCK TO
~ JCKET /METER LOADING REJECTS WAREHOUSE
WHOLESALE CASES CASES NI CASES N!CASES CASES CASES
'I- 0 0 Zl/-X Sro9 /9(jG · /o7uN. 1906 ----- ·r- .. -===:=:==--
PACKING MATERIAL LOSSES
C~:oJ SACHETS Kg
I 3. 7.S] INNERS Kg
I J.3 J OUTER CASES
'-t,tcA~S--)
·-__//
TIME SUMMARY
MINUTES
PAID TIME ,-S"l70=1 TOT AL D/ TIME [_--y~~
MANAGER TIME [ __ ~!
PAID REST [2~s ]· MACHINE 1 io J
Completed by: ....... 1.,.......................... Date:.::'.:'..:~.::'.:'. .... Time: ... ~.:~~ ............. ..
E"J..9-~.!::~-~:-~·; Production Control Cl1art

Univers
ity of
Cap
e Tow
n
97
Quality check weights: Sample weights are recorded on a
continuous sample basis.
Downtime: Any ''stoppage" on the packing line la~ting longer
than 4 minutes is recorded together with reasons by the
\
operators. If the work station is non-operational for the
day, this is recorded as being due to manager's scheduling.
See figure 8.3. For normal stoppages, a timer sets off a
warning hooter after 4 minutes of stoppage on the production
line. The reasons for downtime are recorded on the
production chart and summarised in the right-hand bottom
corner. Any downtime not recorded, will automatically be
captured in the efficiency calculation.
8.3.2.1.2 Operational Definitions - Standard Output and
Actual output
Refer to figure 8.4, which summarizes the elements to be
discussed. Also see in Appendix H an example of an actual
report relating to the efficiency calculations of all the
packing operations <wo~k stations) in the company.
The standard output levels of each work station is formulated
to suit the circumstances. For work station 33 there are two
standard output definitions. The one refers to the output to
be accounted for by the operators on the work station, i.e.
time between the shift start and stop times as determined by
the manager. The other definition is for those periods of
Univers
ity of
Cap
e Tow
n
98
the available total time (i.e. time paid for in terms of
shift wages>, not utilized by the operators due to
instruction from the manager.
Total machine capacity available: is the total potential
standard output. It is the paid time of the shift~ converted
to physical capacity, multiplied by 80% of the maximum
potential throughput capacity of the slowest machine on the
line. "Maximum potential" is the manufacturer's
specification. Normal paid time is a standard nine hours per
day. Overtime hours~ if paid for, are included in the
standard output definition. The departmental manager is
accountable for recording this time.
In the example (figure 8.4), total s~andard output is
calculated as 540 minutes multiplied by 140 units/minute,
multiplied by a machine rating factor 0.80; giving total
standard output as 60480 retail units p~r <this) working day
for the work station.
Machine capacity to the operator: is the capacity available
to the operator. It is the time between the shift start and
shift stop. If the foreman or manager instructs the operator
to stop earlier in the day, for the labour to be utilized
elsewhere, the time (in equivalent physical units> is
subtracted from the total capacity available to calculate
"machine capacity to operator", or capacity available. to the
operators. In the example, operator's capacity available is
calculated as 60480 - 3360 = 57120 units. The manager

Univers
ity of
Cap
e Tow
n
99
instructed the operation to be stopped 30 minutes before full
time, resulting in a loss of
3360 units.
capacity of 30 x 140 x 0.80 =
Total machine capacity utilized: This is recorded from the
production control chart (diagram 8.3) as 45760 units minus
the rejects of 107 units. Therefore actual output is 45653
units.
From the production chart, time losses are converted into
equivalent units. The foreman of the section then summarizes
the time losses on the production chart. The chart is
delivered to the production planning clerk who enters the
data on computer to print a report as in Appendix H. The
time losses are calculated as follows (refer to figure 8.4}:
Calculated total capac~ty losses: This is the difference
between total capacity available and total capacity utilized,
that is, 60480 - 45653 = 14827.
To manager's scheduling: is the recorded equivalent capacity
lost through instruction from the manager or foreman to halt
production 30 minutes before standard paid time, i.e.
140 x 0.80 = 3360, as per the control chart.
30 x
To operators' handling: is the total time in equivalent
units, lost by the operator Cs>. This is calculated by
subtracting the manager's scheduling loss from the total
calculated capacity losses as defined above. The 11467 units
are made up as follows - from the control chart:
Operator losses:
Rejects = 107 units.

Univers
ity of
Cap
e Tow
n
1 IZIQJ
Hest pi:~r-.iocl = SIZI minutes x 140 x lll.8121 = 336121. This period
is automatically subtracted as a loss. If the personnel on
the work station are able to find an innovative way to
stagger their lunch break, this time may be scored to
improve their efficiency.
Cleaning period = 15 minutes x 140 x 0.80 = 1680. These
are units lost through stopping to clean the machine line.
Machine idle periods = 20 minutes x 140 x 121.80 = 2240.
These are attributable to machine stoppages <longer than 4
minutes per incident}.
The total "operator" stoppages on the line as recorded on the
production chart add up to 7389 equivalent units lost. The
check balance under the heading "to operator's handling"
gives 11467 units. This means that 4080 units were not
declared on the control chart by the operator. This amount is
added in under "undeclared operator loss" to balance the
efficiency statement.
Material waste: to inner packaging and outer cartons is not
part of the machine efficiency calculation. Although included
as part of the data gathering on the production control
chart, it is an indicator of processing efficiency <in terms
of material losses}. The percentage loss recorded for both
the inners and outers is based on the "total machine capacity
utilized", i.e 45760 units. Inners are recorded in kilogram
mass and converted in the computer program <Appendix H> to
retail units. For the outer carton calculations the 45760 is
converted into outer units as per the production chart which
gives a base of 1906 cartons.

Univers
ity of
Cap
e Tow
n
101
Efficiency Reading Work station No. 33
Total machine capacity available:
Total machine capacity utilized:
Calculated total capacity losses:
To manager's scheduling:
To operator's handling:
Machine capacity to operator:
Operator losses; Total:
Rejects:
Rest:
Cleaning:
Machine:
Undeclared operator loss:
Operator's capacity utilized:
Material Waste -Inners:
-Outers:
Base units
60480
45653
14827
3360
11467
57120
11467
107
3360
1680
2240
41218121
45653
112
13
Figure 8.4: Efficiency calculation example
Percentage
100.00 'l.
75.48 %
24.52 'X.
5.56 'l.
18.96 'l.
100.00 'l.
20.00 'l.
0.19 'l.
5.88 /..
2.94 'l.
3.92 I.
7.14 %
79.92 'l..
0.24 %
0.1217 %

Univers
ity of
Cap
e Tow
n
•
1lZl2
8.3.2.1.3 Efficiency Operationally Defined.
In terms of overall machine (and labour} efficiency on this
particular work station, the efficiency reading is 75.48%
- refer to right-hand column in figure 8.4. Given the stated
objective, namely worker commitment this is not considered
the most important indicator. The efficiency reading that
the operators will be watching is 79.92/. as indicated under
the "operator's capacity utilized" heading.
contr-ol.
This they can
The for-mat of machine utilization reporting as used here
closely matches the engineering format or work study approach
demonstrated in chapter 5.
8.3.2.2 Work station Effectiveness
Effectiveness standards relating to different performance
factors have been adopted. For this work station it is agreed
that:
Cleaning time should not exceed an equivalent output of more
than 5% of "operator's capacity available"., i.e. paid time
minus manager scheduled time multiplied by the output rate
per minute multiplied by the machine rate setting factor.
For the particular production day., the target is calculated
as: (540 - 3QI} x 140 x 0.80 x 0.05 = 2856 equival~nt units.
Machine, Undeclared & Operator Rest Losses should not exceed
10% of "total capacity utilized", i.e. 45653 x 0.10 = 4565
equivalent units.

Univers
ity of
Cap
e Tow
n
103
Rejects should not exceed 0.8% of total units processed
<"total capacity utilized">, i.e. 45653 x 0.01218 = 365.
Packaging Wastage should not exceed 121.5 'l. of total processed
on inners <"total capacity utilized">, i.e. 45653 x 121.01215 =
228 equivalent units, and 0.2% on outer cartons, i.e. 191216 x
0.002 = 4 equivalent units.
Figure 8.5 summarizes the equivalent target unit comparisons
with the actual levels recorded. Appendix I contains the
actual weekly effectiveness report <derived from the weekly
efficiency report - Appendix H> presented as feedback to the
work station.
Effectiveness Reading Work station No. 7~
....>..'.>
Target Actual Better/(worse}
Cleaning 2856 1680 1176
Machine/Undecl/Rest 4565 9680 (5115}
Rejects 365 107 258
Wastage inners (packaging) 228 112 116
Wastage outers <packaging) 4 13 (9)
Total Team Effectiveness 8018 11592 (3574) (44. 5%)
Figure 8.5: Effectiveness calculation example

Univers
ity of
Cap
e Tow
n
1!Zl4
According to the example, the actual total effectiveness
losses exceed the target by 3574 equivalent units.
effectiveness is running 44.5% below target.
That is,
In line with the goal expressed at the beginning, regarding
formal communication and feedback, the efficiency and
effectiveness results are graphed for discussion and display
in the library area on a daily basis.
8.3.3 Materials Utilization
Two major categories of material are involved, namely
processed raw material and packaging. As already stated, it
is difficult to record raw material yield on a daily basis
according to the above method, given the nature of raw
material and the vast bulk amounts in process at any given
time. Raw material stock is taken at the end of each month
and usage calculated for financial purposes. Incidentally,
this information indicates satisfactory yield which
diminishes the need for daily or even weekly measurement.
Should monthly measurement reveal a deterioration, a higher
frequency could be reinstated.
Packaging material wastage is recorded on the production
control chart for which a target is set to measure
effectiveness. Physical inventory checks are taken weekly for
purposes related to the master production schedule. The fact
that suppliers of packaging material have agreed to credit
all packaging wastage in full, has resulted in this element

Univers
ity of
Cap
e Tow
n
105
carrying a low priority in measurement. The measurements
taken on a work station level are considered adequate for
motivational purposes.
8.4 CONCLUSION
The company has identified 53 work stations in the
manufacturing department. In certain instances, such as
factory maintenance, a work station may consist of a team of
two people - the artisan and his assistant. In another, it
consists of one operator and an integrated bank of 30
machines. In each instance the same industrial engineering
measurement approach principles, relating to efficiency and
effectiveness, are being progressively instituted and
applied. All measurements are of a quantitative nature. In
keeping with the measurement objective stated at the
beginning of this chapter (worker motivation and commitment>,
any activity which cannot be reported on, on at lea~t a
weekly basis, is not taken up into work station measurement.
The efficiency with which any resource in any work station is
being utilized, can potentially be measured. Where it is not
feasibly practical to measure efficiency, the focus can be on
effectiveness. Alternatively the work station can be
incorporated into a larger unit of analysis where other forms
of productivity measurement are possible.
*

Univers
ity of
Cap
e Tow
n
106
CHAPTER 9
PERFORMANCE MEASUREMENT ON SECTION LEVEL
9.1 INTRODUCTION
Comprehensive and independent work station measurement is not
always feasible. Without losing sight of the measurement
objectives, the unit of analysis then needs to be expanded to
include more than one work station. That is, the unit of
analysis has to be redefined. In terms of the organizational
structure, it means one step up to section level.
Circumstances will dictate which resource measures are better
suited to section level measurement as opposed to measurement
on work station level. Refer to the criteria in chapter 6.
This chapter is an extension of chapter 8. The principles
regarding section level measurement as applied in the target
firm are explained. The focus is firstly on labour
productivity measurement. Thereafter application of the
Objectives Matrix Measurement Method is demonstrated.

Univers
ity of
Cap
e Tow
n
107
9.2 LABOUR UTILIZATION
From the productivity statement presented in Appendix F, it
can be seen that labour is a major expense. Notwithstanding
its importance, it is not feasible to measure labour
utilization on work station level. Labour mobility between
work stations in each responsibility centre is one reason for
this constraint. On section level however, it is possible to
isolate and measure three dimensions of productivity on
labour.
Of the three dimensions of measurement, two are based on the
Industrial Engineering Approach. The other one is a partial
productivity measurement, based on the Index Approach.
Figure 9.1 is an extract from Appendix J. The latter is the
actual complete labour productivity report, published weekly
in the company. The table's content is utilized to explain
the measurement concepts involved. The data relates to the
packing section (section No. 12> of Product Group No. 1.
a responsibility centre identified in the organizational
chart.
9.2.1 Industrial Engineering Approach - Time Standard.
A weekly standard (quota> of total work hours required is

Univers
ity of
Cap
e Tow
n
108
RESPONS.CENTRE: : Product Grp. 1:
SECTION:
l*Hoursf. Normal :1Worked* Overtime I
I
Total :Equivalent Han-week:
Packing Section
1691l 22
1712 37
:------------------- -------------l*Valuet Normal P.8,230 : *Pai df Over ti me R!42
Bonus Misc.
Company Contrib. Rl,646 Sid leave R75
Annual Leave R672 Total RliJ, 765
:--------~----~----- ------~------l Casual Hours 34 :Equivalent Man-week: 1 :casual Value 170 ------------------- -------------
:All Nan-week 38 :All Value R10,935 ================================= :------------------- -------------
I I
I I
I I
I I
:Man-week : : Index 0.90 :
: ---------.---------- -------------:Value :Index
l Output - Tons
0.99 :
432 : :------------------- -------------:Output/Man-week :cost:R/ton
:Absentee Rate
11 : R25.31 l
0.591.:
line Ref.
1 2 3 4
5 6 7 8 9
18 11 12
13 14 15
16 17
18
19
20
21 22
23
Figure 9.1 : Labour Productivity Report.
!Extract see APPENDIX Jl

Univers
ity of
Cap
e Tow
n
1 '219
allotted to each section. This quota is determined as part of
the annual budget exercise. Labour hours allotted are taken
to be constant through the year, the logic being that machine
capacity is able to handle seasonality. Should the machines
be under utilized, the labour cost remains constant. Given
the methods to be applied in measuring productivity, the hour
allotment issue is relatively unimportant. Nevertheless, for
each section a weekly, man-day and monetary value quota is
set. The first week then serves as base period standard.
Standard output: A total of 1940 <not shown on report)
man-hours were allocated in the packing section. This
includes over-time hours. The total hour-s have the same
meaning as "total man hours available'', demonstrated in
Figur-e chapter 5.
Actual Output: Is taken from the clock cards through a
computerized program for each department. Actual hours
include:
-Ordinary time worked by permanent employees (1690 hours line
1>, plus
-Overtime worked by permanent employees <22 hours line 2>,
plus
-Casual labour (34 hours line 13)
Movement of permanent employees between sections and
departments are accounted for by means of a system called
"the green card". A Foreman is permitted "to sell" labour on
a day to day basis to another foreman (in another section> on
condition that the "buyer's" section is debited with the
hours.

Univers
ity of
Cap
e Tow
n
110
Efficiency is calculated as:
Efficiency <utilization) reading
Section No. 12
Standard Output available
Act~al Output utilized
Difference
Hours
1940
1746
194
Percentage
100.00 %
90.00 /.
Efficiency for the week improved by 10.00/. as reflected by
the man-day index reporting of 0.90 on line 18 in figure 9.1.
No effectiveness target is set in this dimension.
9.2.2 Industrial Engineering Approach - Economic Standard.
In this dimension the scope of output measurement is expanded
to include the monetary value of elements not captured in the
time dimension.
Standard Output: The economic value of each unit of labour
includes all costs connected to each head count. That is,
ordinary hours multiplied by the specific estimated wage rate
plus overtime plus bonusses <pre-determined} plus so-called
company contributions (pension fund, etc.> plus an annual
leave provision. There is no provision for sick leave.
total monetary amount for section 12 is given as R11045 -
hidden and not reflected in the report.
Actual Output: The following is recorded:
-monetary-valued ordinary hours payment to permanent
employees <R8230 on line 5)
The

Univers
ity of
Cap
e Tow
n
111
-monetary-valued overtime for permanent employees <R142 on
line 6)
-annual leave pay <R672 on line 11}
-all bonusses and employer contributions <R1646 on lines 7 to
9}
-all sick pay <R75 on line 10}
~Payments to casuals <R170 on line 15)
According to the report:
Economic Efficiency (utilization) reading
Section No. 12
Value
Standard economic output available: R11045
Total economic output utilized: R10935
Recorded economic gain: R 11121
Sick Leave: R 75
Undecla..-ed: R 35
Percentage
100.00 %
99.00 %
0.99 %
0.67 %
0.33 %
Economic Efficiency as recorded, is running at 1% better than
the "break-even" standar-d in the report, i.e efficiency
reported on line 19 of figure 9.1 has improved by 1.00% this
week compared to the standard.
set in this dimension.
No effectiveness standard is

Univers
ity of
Cap
e Tow
n
112
9.2.3 Index Approach - Partial Productivity measurement
Physical output of the section is recorded in the
conventional manner, i.e. the throughput of physical material
handled during the week. Partial input is recorded as either
the man-hours committed to the process in the section, or as
the monetary-valued input for the same week.
Referring to line 20 of figure 9.1, output for section 12 is
recorded as 432 tons. To calculate efficiency:
Technical Efficiency = Output/Physical Input (average
man-days/week).
= contents line 20/contents line16
432/38
= 11 which is the productivity ratio.
The result may be indexed on a base period. In practice, each
week's ratio is calculated by the section foreman. The result
is then graphed (for 52 weeks) in the library area of each
section.
Economic efficiency can be calculated in a similar manner to
technical efficiency. An operational ratio of total cost
input/tons output \line 22) was found to be better understood
by the workers, and is utilized as an "indicator" measure of
economic efficiency - as defined in chapter 2.
In Appendix J it should be noted that output quantities are
recorded in each section, except for sections in the
engineering maintenance function. A totally separate
computerized measurement system, has been introduced in this
section. Time standards are set for each job, based on
information on the job request card. An estimate of job
Univers
ity of
Cap
e Tow
n
113
duration is done by the responsible foreman. Actual time
then taken by the tradesman to complete the job is noted and
compared with the estimate so as to achieve an efficiency
reading. The time noted by the tradesman is reconciled with
the time recorded on his weekly wages clock card.
9.3 MODELLING THE MATRIX APPROACH
In the company most of the productivity management focus is
on the different sections. It is felt that failure to secure
a sound productivity management practice on this level, will
negate any desired improvement anywhere else in the company.
The improvement process is dynamic. Should the objectives
change, the measurements should be reformulated where
necessary.
To accomodate this very important requirement, the
"Objectives Matrix'' method promoted by Riggs and Felix [1983,
pp. 222-234], is utilized. The method is versatile enough to
accommodate any productivity measure or factor (quantitative
/
or qualitative>. Furthermore it combines all into one single
indicator of performance. These include measures taken on
work station level.
The packing section (no. 12} of Product Group No. 1, as a
responsibility centre, is again used to illustrate the
various principles related to the developing of the matrix
method of measurement. The selection of specific performance
criteria is done in collaboration with the staff in the

Univers
ity of
Cap
e Tow
n
LINE. REF.
1.
2,
3.
4.
5.
6.
114
PERFORMANCE MATRIX SECTION NO:.J.i?:........... WEEK NO:J.?. .... • .......
PERFORMANCE CRITERIA
MEASUREMENT RATIO
ACTUAL MEASUREMENT
2 3 4 S B 7 8 9 ' '
1 0 ?; 93__. --~-1___":?_ _ _:_£~ ~-:t l ~ ~~- ~ ;( ~- ~ ~1__ ~qg
9 g<t~CJI_ gt:t-CfL_ 2!_'~4-_ d,1-~~ ?.!_:?:~ ).i_:_<J..t_:S..:.~-1. 90·~-7-1---
7. 7 f!; .... PERFOREMANCE
8, 6
9,
10.
11,
12.
13,
14.
18.
SCORE q q.
0
CURRENT TOT AL PERFORMANCE INDICATOR !_ __ ~!~~-=\
.lhuu/1/9 4Ab«cr /'/la I , /(/ RESPONSIBILITY CENTRE NAME.,,,,,,,,,,,,,,,,,,,,,,,,,,,,,,,,,,,,,,,,,,,,,,,,, ................. ,,.COMPLETED BY.,,.,,,,,,,,,,,,,,,,, DATE: .................. ..
Figure~.2_.: Performance Matrix (example}
Univers
ity of
Cap
e Tow
n
I
115
various sections. An example of a completed performance
matrix is given in figure 9.2. It 1s used in the explanation
of the steps to be followed when developing a matrix set-up.
9.3.1 Steps in Drawing Up a Matrix
9.3.1.1 Selecting Performance Criteria <line ref. 1): The
productivity measurment fact sheet mentioned in chapter 7
will indicate which performance criteria can be accommodated
in each section and work station - based on data availability
and other practicalities. The range of criteria applied is
further expanded in consultation with each section team.
Criteria selected for the section team under discussion are:
1. Weekly efficiency rating: work stations 33, 34, 35.
2. Weekly effectiveness rating: work stations 33, 34, 35.
3. Section labour productivity.
4. Hygiene audit count.
For 1 & 2 above, see Appendix H and Appendix I respectively.
The basis for selecting certain criteria, apart from reliable
data sourcing, is to select factors which are perceived to
have the greatest influence on a section's productivity, or
which is considered to be a problem issue. The factors
chosen, must relate to activities controllable by the team.
No more than seven performance criteria are permitted so as
not to confuse, and to achieve some degree of focus on the
important issues. The foreman of each section is responsible
for writing up and graphing the results in the library area
at stipulated times.

Univers
ity of
Cap
e Tow
n
116
Note: The "hygiene audit count" listed above and not yet
explained, is based on a hygiene inspection carried out each
' month by two foremen from another section together with the
operational director of the company. A questionnaire listing
100 inspection points is judged for cleanliness on a 1-6 item
scale. The score of all inspection points are totalled to
give a mark out of 600.
9.3.1.2 Determining the Measurement Format for Each
Performance Criterion (line ref. 2): A criterion may be
recorded as a physical quantity , a ratio or a percentage.
The scale level should not be below interval classification.
9.3.1.3 Establishing Performance Scales <line ref. 4 to 14):
In the matrix itself, a utility performance scale (also
termed a dimensionless scale) is introduced which runs from 0
to 10, thus giving eleven levels of accomplishment for each
criterion. All possible results to be expected from each
criterion are allocated into each column in the body of the
utility scale level, on the following basis:
Utility scale level 0 should be the lowest expected result
possible for the criterion on the actual measurement scale in
use.
Utility scale level 4 is taken to be the operating results
that represent the current average performance for each
criter-ion.
Utility scale 10 should be a realistic estimate of a
challenging result that can be attained over the next two
years, given the same resource base for each criterion.

Univers
ity of
Cap
e Tow
n
117
The intervals are developed on a linear scale in the
following manner (Refer to the work station no.33's "machine
efficiency ratio" performance criterion in Figure 9.2.J:
The highest expected result is given as 92%. This is entered
opposite the matrix utility scale level 10.
The average performance of (more or less} 79% is entered
opposite the matrix utility scale level 4.
To calculate the interval spacings between levels 10 and 4,
the difference 92 - 79 = 13 is calculated and divided by the
6 steps between 10 and 4 to give the interval range for each
step 13/6 = 2.2 (approximately 2}. In setting the minimum
and maximum reading on each level, the readings should be
mutually exclusive.
The lowest expected result is given as 40%. This is entered
opposite the matrix utility scale level 0. To calculate the
interval spacing between levels 4 and 0, the difference 79
40 = 39 is divided by the 4 steps between 4 and 0 to yield an
interval range of 39/4 = 9,8 (approximately 10).
9.3.1.4 Departmental Manager's Rating (line ref. 16}.
Management is responsible for assigning an importance
weighting to each criterion. Through this exercise,
management emphasizes which criteria are more important than
others. To apply weighting, a 100 points are distributed
between the listed criteria of the section. In figure 9.2 the
departmental manager has decided to apply the weights as
indicated.
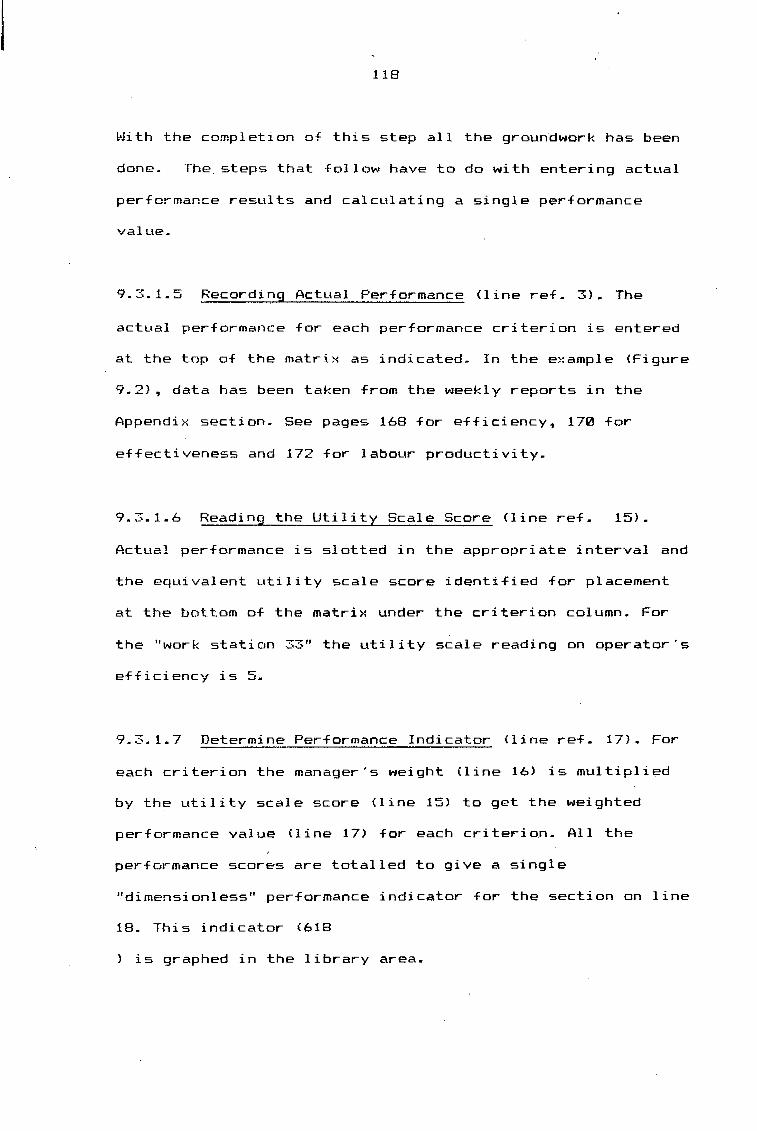
Univers
ity of
Cap
e Tow
n
118
With the completion of this step all the grou~dwork has been
done. The steps that follow have to do with entering actual
performance results and calculating a single performance
value.
9.3.1.5 Recording Actual Performance (line ref. 3). The
actual performance for each performance criterion is entered
at the top of the matrix as indicated. In the example <Figure
9.2}, data has been taken from the weekly reports in the
Appendix section. See pages 168 for efficiency, 170 for
effectiveness and 172 for labour productivity.
9.3.1.6 Reading the Utility Scale Score Cline ref. 15).
Actual performance is slotted in the appropriate interval and
the equivalent utility scale score identified for placement
at the bottom of the matrix under the criterion column. For
the "work station the utility scale reading on operator's
efficiency is 5.
9.3.1.7 Determine Performance Indicator (line ref. 17}. For
each criterion the manager's weight (line 16) is multiplied
by the utility scale score <line 15) to get the weighted
performance value <line 17) for each criterion. All the
performance scores are totalled to give a single
"dimensionless" performance indicator for the section on line
18. This indicator (618
is graphed in the library area.

Univers
ity of
Cap
e Tow
n
119
9.4 SPECIFIC PRODUCT QUALITY
Specific quality standards, which have to be monitored by the
operators, are stipulated for each work station. In theory
the degree of conformance to these standards is taken to be
one of many indicators of the level of effectiveness of the
work station. In work station No.33, conformance to quality
standards will be under control, if the daily average pack
mass does not deviate more than 1% from the standard mass
(500gm). Mass is monitored on a continuous sample basis from
the production control chart. The workers are presently going
through a learning process. More sophisticated statistical
methods based on quality control charting are being
maintained in other work stations where process control is
more important than in the packing sections. In the packing
sections, the scope of quality factors will be extended as
circumstances allow. The work station's daily average packet
mass is recorded separately in graph format in the library
area.
9.5 CONCLUSION
In the target company the manufacturing department has seven
responsibility centres. The responsibility centres in turn
consist of seventeen sections altogether. It is therefore
important that within each section, data is collected with
the active participation of the foremen and of the workers

Univers
ity of
Cap
e Tow
n
themselves.
important.
120
Feedback of results on an routine basis is most
To this end a dedicated administrative person (on
computer) assists to speed data manipulation and reporting.
In introducing th~ system as set out above, it was found that
interest from the side of the workers was best maintained if
reporting was regular and consistent. A weekly time frame, as
opposed to daily reporting was also found to be more
beneficial. The fact that workers have indicated that they
prefer a formal feedback before commencing the following
period's work, is taken to indicate heightened interest and
commitment to the job.
*

Univers
ity of
Cap
e Tow
n
121
CHAPTER 10
CONCLUSION - COMMENT AND RECOMMENDATIONS
10.1 INTRODUCTION
The introduction of a measurement system can be harmful to
the morale in a company. A system's design should fit the
organizational structure of the company. If it does fit, and
if the structure is practical, people will perform. The
nature of the structure is important and should be in harmony
with the style of management in the company.
Measurement is only one of many factors contributing to
productivity in the company. Its role should be to focus
people's attention on those activities which contribute to
productivity improvement. If its application is so intended,
measurement becomes a strategic issue. It is within this
context, that the benefits which have been derived by the
introduction of the specific measurement systems, are
commented on below.

Univers
ity of
Cap
e Tow
n
122
10.2 IMPEDIMENTS TO DETERMINING MEASUREMENT BENEFITS
A year prior to measurement, the manufacturing organization
was restructured to its present form. Coupled with this,
tactical decision making responsibility was encouraged on the
lower levels of management. Tactical decisions were to be
based on the dictates of a simple, but effective production
planning system.
During that same year, the company recorded a 54% increase in
profit before tax, thereby reversing a downward trend evident
over the previous three years.
One outstanding reason for the downward trend in previous
years was that, notwithstanding adequate capacity, production
was unable to cope with peak season demand. The
production/delivery lag was 6 weeks. Within two months of
restructuring, this time was reduced to 13 days. Since
introducing productivity measurement this time was further
reduced to the current position of 5 days, i.e. delivery to
any depot in the Republic within 5 days of receiving the
order.
Many other aspects of productivity have also improved since
measurement was introduced nine months ago. It is however
difficult to say exactly how much of the improvement was due
to measurement alone.

Univers
ity of
Cap
e Tow
n
123
The measurement system is not as yet fully established in all
the responsibility centres. Some sections still have to
establish library areas for instance. Performance measures
have been introduced in all the responsibility centres, but
are not yet summarized in a matrix for regular feedback to
the work force in all the sections.
10.3 TOTAL PRODUCTIVITY MEASUREMENT - CURRENT SITUATION
From a usage perspective, the Total Measurement Model has not
been successfully introduced. The potential users are still
inclined to fall back on the financial statements for
discussion and decision making. There are apparently three
reasons for this:
1} The financial statements compare actual performance to
current budget and to those of previous years. The
productivity statement does not carry this information.
2) Top management is more comfortable with the financial
concepts and ratios in dealing with their peers.
3) The introduction of productivity statements has led to
the financial function drastically improving the
reliability of financial reporting. Committed and
outstanding cost concepts have now been pinned down to
such an extent that new operating procedures and
financial systems operation have been introduced to
accurately determine actual costs. The "provisions"
reporting principles promoted in the productivity
statement have also been adopted in financial reports.

Univers
ity of
Cap
e Tow
n
124
To date the productivity statement has been written up
independently. Given the size of the company, the next step
should be to integrate the system with the financial one
through automatic computer manipulation. Automation will
ensure the effortless building of an historical data base for
forecasting and planning purposes.
10.4 IMPROVEMENTS IN MANUFACTURING
Since introducing measurement, performance indicators have
recorded a gradual improvement in ef~iciencies. At the same
time middle and lower management have reacted positively,
improving other aspects of operations.
10.4.1 Efficiency
In every work station, without exception, "operator's
capacity utilized" (see diagram 8.5) has improved since April
199121. On work station no. 33 for instance, the efficiency
reading which started at 69% , currently <September> stands
at 89/.. Capacity lost as a result of "manager's scheduling"
at first decreased. As demand levelled off toward the end of
the peak season, it increased again. This trend is
interpreted as meaning that the same physical production is
being attained in less time, leaving spare time. The
assumption is supported by the improved results on

Univers
ity of
Cap
e Tow
n
125
"operator's capacity utilized"; i.e. "manager's sheduling"
has improved, and the increase is not a result of poor
planning - on the contrary.
The results of the productivity measurements taken from the
schedules such as the one presented in Appendix J, indicate
no noticable change in labour productivity. This result does
not mean that labour productivity is stagnant. The problem is
that the operational definition of output is incomplete. It
only covers physical output with respect to work station
production. The labour is obviously at times being utilized
on other jobs (see "managers scheduling"> of which the output
cannot be recorded, such as housekee~ing chores.
The kind of information obtained from the measurements no
doubt gives the answers required and which is understood by
lower management. The application of graphics adequately
reflects trends which are understood by the majority in the
work force.
10.4.2 Other Benefits
There has been changes in management practice and worker
attitudes which can be ascribed to measurement. The
activities noted below are all connected to measurement in
some ~'\lay:
1) Whereas managers· were office bound before, they are now
spending much more time on the factory floor.
Univers
ity of
Cap
e Tow
n
126
Consequently, processes which have been in operation for
many years are being simplified. So far this year more
than 75 tons of redundant equipment have been removed
from the factory floor to storage. Middle and lower
management are making time available to take an active
lead in getting things done. Examples are the spray
painting of older machines, obtaining outside quotes to
refurbish certain machines, etc. This is being done
within the parameters of their budgets.
2) Factory floor space has increased by approxmately 10% as
a result of the actions taken above. This means easier
cleaning and higher scores on the hygiene audit.
3) In the past, operators were not inclined to do any
maintenance on their machines. That situation has also
changed completely. In the one packing section, for
instance, a small "workshop" area has been set aside for
certain machine spares and tools to be kept. This has
resulted in less machine downtime and improved
"operator's capacity utilized".
4) Workers are much more willing to do different jobs. Not
so long ago it was considered 11 \l'Jorker exploitation" if a
worker ~·Jas asked to do another job. There is a much
higher incidence of "green card hiring". The sections
"hiring out" labour are gaining through man-hour savings,
which is reported on the labour productivity schedule
<Appendix J).

Univers
ity of
Cap
e Tow
n
127
5} Materials management has improved. Whereas packing
material shortages was a constant problem two years ago
it is unheard of today. The packing material stock
holding in terms of mass, has on a monthly basis
decreased by 7%, compared to the previous year.
6) Over the past 18 months, manpower headcount in the
manufacturing department has been reduced by 13%. During
the same period absenteeism has dropped from 6% to 4%.
7) There is a greater willingness on the side of production
staff to try new ideas. During the past seven years the
company has only launhced 2 minor new products, which was
done in 1989. Now, two major launches are planned for
1991. Production management apparently feel more
comfortable and in control of their situation, given the
performance measures introduced.
10.5 RECOMMENDATIONS
The introduction of the total productivity measurement system
was premature. The fact that many of the recommendations
suggested under "income statement issues", discussed in
chapter 7, have been adopted by the company, is seen as a
step closer to acceptance of the productivity statement
concept.
In retrospect however, the total measurement system should
only have been introduced after the successful introduction
of the matrix system in the manufacturing department. The

Univers
ity of
Cap
e Tow
n
I
12El
benefits obtained from such a system are immediate, and they
open the way for acceptance of the much more involved and
difficult task of total productivity measurement. If the
exercise had to be repeated, total measurement would be
targeted at responsibility centre level, with the emphasis on
partial measurement with the objective to improve operational
decision making through improved control. Thereafter the
system can be expanded into other areas to include the whole
company.
With regard to the measurement system introduced on section
and work station level, the results thus far have surpassed
all expectations. It is too early to recommend any changes to
the system, except to say that in the introductory phase,
section management requires a lot of moral support from' top
management until the whole process of information collection
and feedback has become routine.
*

Univers
ity of
Cap
e Tow
n
129
REFERENCES .
BOOKS:
Bedworth, D,D.: Industrial Systems <Planning, Analysis & Design). Irwin, Illinois,1973.
Blalock, H.M. : Social Statistics. Tokyo, 1979.
McGraw-Hill Kogakusha,Ltd.,
Craig, C.E. and Harris, C.R.: Total Productivity Measurement at the Firm Level. Sloan Management Review, Vol 14, No. 3, 1973.
Davis, H.S. : Productivity Accounting. Philadelphia, The Wharton School, Univ. Pennsylvania, 1978.
Evart, Ford, Yuan Lin.: Applied Managerial Statistics. Rinehart and Winston, Inc., New York, 1974.
Holt,
Gallop, F. M.: Growth Accounting in an Open Economy: Studies in Productivity Analysis - Measurement and Modelling Issues. Kluwer Nijhoff Publishing, Boston, 1983.
Gibson, J. L. & Ivancevich, J. M. & Donnelly, J. H.: Organizations: Behaviour, Structure, Processes. Business Publications, Plano Texas, 1985.
Greenberg, L.: A Practical Guide to Productivity Measurement. BNA Books, Washington D.C., 1973.
Gold, B.: Productivity, Technology and Capital. Books, Toronto, 1979.
Lexington
Guion, R. M.: Personnel Testing. Mc Graw-Hill, New York,- 1965.
Harmon, R. L. and Peterson, L. D.: Reinventing the Factory. Free Press, New York, 1990.
Humphrey, J. and Halse, F.: Profit from Productivity. Juta & Co, Ltd., Cape Town, 1986.

Univers
ity of
Cap
e Tow
n
130
Kendrick, J. W. and Creamer, D.: Measuring Company Productivity: Handbook with Case Studies. Studies in Business Economics, No 89, National Conference Board, New York, 1965.
Kerlinger, F. N.: Foundations of Behavioral Research. Holt Rhinehard and Winston, New York, 1973.
Krantz, D. H. & Luce, R. D. & Suppes, P. & Tversky, A.: Foundations of Measurement. Academic Press, New York, 1971.
Lancaster, K.: Introduction to Modern Micro Economics. Rand McNally & Co., Chicago, 1969.
Langhout, J.: Analysis and Interpretation of Financial Statements. South African Universities Press, Cape Town, 1987.
Lundberg, G. A.: Foundations of Sociology, 1939.
McMillan, New York,
Mali, P.: Improving Total Productivity: MBO Strategies for Business, Government and Not-for-Profit Organizations. Wiley & Sons, New York, 1978.
Matthews, D. Q.: The Design of the Management Information System. Auerback Publishers Inc., New York, 1971.
Mills, F. C.: Statistical Methods. Henry Holt, New York, 1955.
Northrop, F. S. C. : The Logic of the Sciences and Humanities. Mc Millan, New York, 1947.
Radel F and Reyjnders H.J.J.: Inleiding tot die Bedryfsekonomie. J. L. van Schaik, Pretoria, 1971.
Riggs, J. L. and Felix, G. H.: Productivity by Objectives. McGraw-Hill, New York, 1984.
Riggs J. L. and West, T. M.: Engineering Economics. McGraw-Hill, New York, 1986.
Senders, V. L.: Measurement and Statistics. Press, New York, 1958.
Oxford University
Siegel, I. H.: Productivity Measurement at the Firm Level: A Brief Survey. Studies in Productivity Analysis: Measuring and Modelling Issues. Kluwer Nijhoff Publishing, Boston, 1983.

Univers
ity of
Cap
e Tow
n
131
Sink, D, S.: Productivity Management: Evaluation, Control and Improvement. 1985.
Planning, Measurement, Wiley & Sons, New York,
Spiegel, M. R.: Theory and Problems of Statistics. Publishing Co. New York, 1961.
Sch a um
Sumanth, D. J.: Productivity Engineering and Management. McGraw-Hill, New York, 1984.
Takeuchi, H.: Productivity Measurement at the Firm Level: An Application within Food Retailing. Studies in Productivity Analysis: Measuring and Modelling Issues. Kluwer Nijhoff Publishing, Boston, 1983.
Van Niekerk, W.P.: Productivity and Work Study. Butterworth, Durban, 1978.
\
Weiss, R. S.: Statistics in Social Research. 1968
JOURNALS:
Cooper, C.: Measure of Success. Productivity SA, vol 16, no 4, August/September 1990.
Geyser, G. J.: Productivity Improvement. Productivity SA, vol3, no 1, February 1986.
Mason, 1987.
R.: Money Talk. Productivity SA, vol 13, no 7 .....) , June
Seung-ii, S. : Productivity Measurement: A Situational Approach. Ineternational Industrial Engineering CGnference Proceedings, 1988. Refer NPI.

Univers
ity of
Cap
e Tow
n
132
APPENDIX A
'BRANDS ARE ASSETS'

Univers
ity of
Cap
e Tow
n
:'.i \ : ;· .. j ··:-.-'
' '
i ~ . ' ' 'J ' ' \ ' l ...... ;I, I I '. ·~·'·-·· .: . ! } '_:-. .. ,
I I The Smarter Generation i
·rlH: ch:dlcngin1.:, l'h:111,~i11g, dyn:-1111ic, rlll'hulcnr, s,1meri111t.:s hl:wildcring rnarketing world makes 11s uneasy, 1mcn111((1nahk. <.'\Tl1 (llnfuscd. Snmc say we sho11kl get: h:1d: 1<1 basics. N,>1 '"'old basics. 'I/./ c need I'll idl'.nri(y ;md pr:1criCL' new hasics.
M;Hket: glohnlisa1:i1111, :1gc11cy concentration :111d rl:rnil p<lbris:Hi1n1 h:WL' changed rhc 111:1rkcring l:1nd:a::1pl:.Wl1t'll rhc 1n:1rk<:r rl1:1111:":;, 111arkt.:ting must change. Tlw c<in:>urncr is rlw 1ilti111:1l'L' :1rhircr n(
succc:ss. The nc1•1 cn11s1111wr i;: 1111>rl· "1r1his1 i1':11<'d, 11"'"'' "'"1,-i1 i1"" 111<1r1· .'il·lt..·l:t ivc. :11hl 111l 11'l' .·•l l'\'i il·:d 1 l\;111
l'Vl:r hc(nrc. For rlw firsr 1·i llll' i11 ilw hisr.,rv, ,r
rill'. world, 50% u( rlw 11'!\rld's .
'"hn!\l-:1gc pnpul:11i"'" i.; l'l11'llllcd i11 >t:h11ol. For rhc i'irs1 1i111'' i11 hisl<>ry l1<df t:hc children of thl' 111orld .l1:1vc' rhc np1'or;·uniry I'\• learn rhc h:1sic skills for rurning d:1rkm·:;s inm light. l"\u1, cduc.u·illn is 111«m· than jusr sdhioling. \X'lwn scholll ends, hulJWll'ork l'nds and k:"1rni11g hcgins. This generation has :1cccss to, and is exposed rn, more i111'l1rn1ariun ahll111
·.·. :'.",• ...
133
'l 'l1 is i~~~.1~·::;-~~~~~";:·:.:~~·---·"'J Digest is based on Larry I
Light's speech at the sixth ~ annual Reader's Digest Mar
keting Seminar in Canada. Larry Light, President &
CEO, Arcature Corporation, Stamford, Connecticut, is a
PhD whose strategic planning and marketing management abilities have won him an international reputation in business and in academia.
everything. They he;1r mmc, sec more, experience more than ever before. lncrc:1sed cduc:1t:ill11 :md
increased :iccess to inform:·H:ion :1rc basic, fundamcnt«d, pcrv<1sivc developments ;1ffecting Sl.lC iny, polirics, and business worldwide.
Smarter people live srnarrcr. As cd11catinn goes up, the pcn:c:nragl'. "r working women goes up. Smarrcr women work for a raise in pay and also for a raise in praise.
As educ:it:ion gncs up, family si:cc gill's down. /\s \:duc:11'ion )!lil'.S 1q1,
occupational staws changes frnm industrial t:n service, frnn; lirrin1~ things ro rhinking thi111~s. f1'<1111
11111sck ro 111l·1n:il, i'ro111 p11shillJ.: .«ll'l·I Ill pushi11g 1wnl·ils.
Sm:iner people I ivc sm:trrl:r :ind lunger. They w:i11t ro livl: hcrrcr. Tlwy nre mnrc self conscious :111<1 mnre conscious of rhci r physic: ii selves. The Sm:1rter <..3encrnrion h:is :1 passinn for fitness. Tlwy want to kcl good and lnok gllocl. They :ire hc:ili:h conscious. They :ire fitness conscious.
They don't: wanr sl'at:11s symhils thnt: say what snobs they arc. They wanr those thm· say how sman rhcy arc. To rhc Smarter Ccncr:Hion,
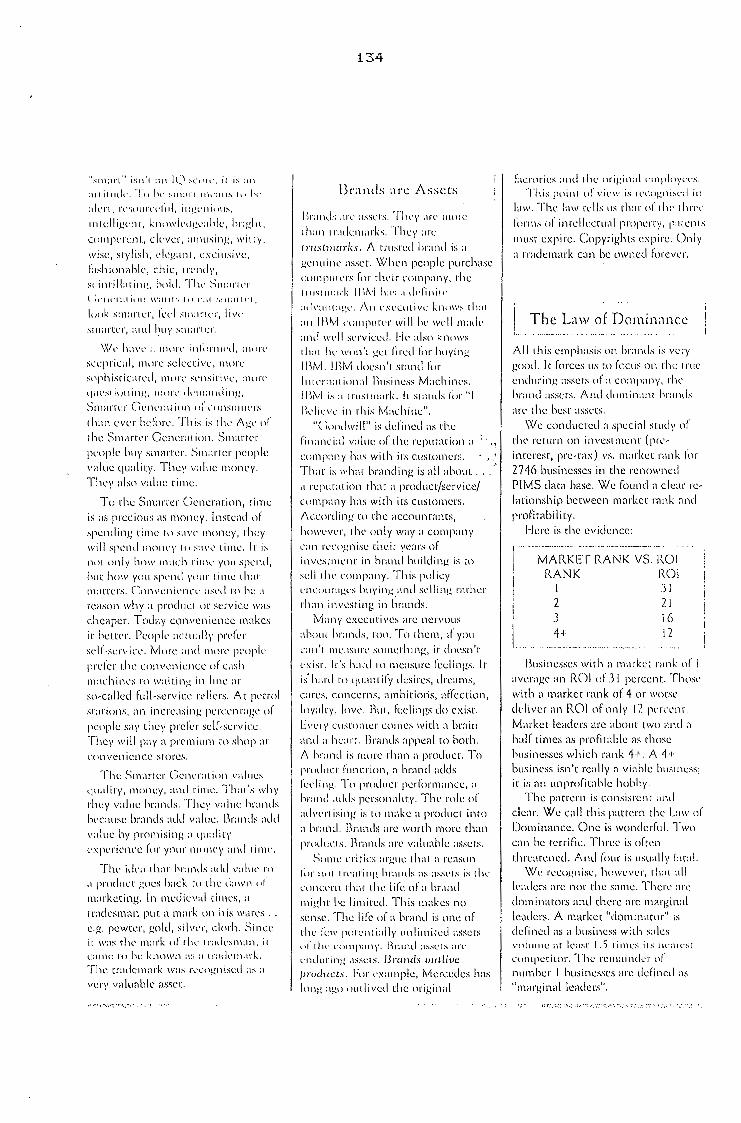
Univers
ity of
Cap
e Tow
n
'\1\Ltrt '' i~;11'1 :11t I\~) >1:1'1"1', i1 is :11\
:111i111dl·. 'T11 h1· ·"111:1111n1·:111:--11i111·
:111. . .'J'\ 1 1'1'.'itll11'Ct.'1°1d 1 i1l)~t·11i1111~,
i111cllig<'1ll, k11<llvlcd1~<·:1hlc, hrigh1, u11111wrcn1., ckvcr, ;111ll!si111!,. witty, wise, st:ylish, l'icg:1111, cxcl11sil'c, fr1shion:1hlc, chic, 1rc11dy, sci11rilL1ri11.1:. h11J,I. Th,· S111:1r11·r ( :1·111·r:11 i1111 \\'1111h 111 1·;11 :.111;1111·1,
l()()k s1n:1rtcr, (l'l'I s111;1nn, livl' s111;1rt:cr, :md huy ~111:11'11;r.
\\/,· 11:1\'l' :I lll<ll"l' i11l;ll'llll'tl, llllll'<' sccpricd, mmc sclcnivl', Ill< H"l' st 'l'h isricircd, Ill< ire· St'llsi ri "'" 111l11T q1ws1 iq11i11g, 11H1rl· 1l1·111;111di111~ 1 Sm<1rrl'.r Ccnl'r:1t it 111 ',( ,., 111s11111ns tli:in cvn hcforc. 'This is rhc Ag,· o(
rhc Smarter Gener: it it ll1. Slll:irrcr P<'t1plc buy smmrcr. Sm:1rrcr people \'aluc qu:dit:y. Tlwy v:duc money. Th,·y :dsn v:d11t: rime.
To t:hc Sm:1rrcr Ce11cr:11:inn, rim<: is :is precious as money. lnsrc:1d nf ·'J'l'.llding time r.' s:11'l' 11111ncy, rhcy will s11cnd mnn,·y Ill s:11•c• rime. Ir is 1Hll only hnll' 1nlll:h ri111v y1H1 .~pend, hut h()IV )'Ull Si'll'lld \'< llll' tillll' t h:il ll\:1rrcrs. C:nnvcnicncl' 11S<·d rn ht: :1 re<ison why :1 prod11cr ur service was che<iper. Tod<1y convenience mnkes ir hcu:n. Pc()pk :1ct1.1:1lly prefer self-s.:rvicl'. lvl1>l'l: :111d lll<ll'l' pl'()l)lc ['ITfcr t:hc cnnvc11ic11cc ()f c:1sl1 m:1chi1ws ro w:iit:ing in line :ir so-called full-servict' rl'llers. Ar pct:rol sr:1riuns, :in incre:1sin1~ perccnr:igc of' 11c:nplc say they prch:r sclf-sen•iu.;. They will p:iy a premium ro shop :11
Ct 1nve11 icncc srnres.
The Srn:1rrcr Cc11n:1ri<>11 v:1l11cs qt1:1liry, nH111ey, ;ind rime. Th;11'.~ why rhcy value hr:inds. 'They v:duc hr:i11ds lwc:iusc br:inds add v:due. nr:1nds :1dd v:duc by promising :1 qu:dit\' l'Xpniencc (or yrnir 111<11H:y :ind ri11H'.
The it!c:i rh:H hr:inds :1dd v:il11c r<> :i 1inid11cr gtics h:1ck ru rhv d:iw11 .,j'
m:irketing. In nwdicv:d t:illll'S, a rr:1cksnrnn put. a mark tlll his wares .. e.g. pewter, gold, silvL·r, clorh. Since i1 w:1s rlw rn:ll'k of rlw rr:it!,·srn:111, i1 ,::1111c rn lw knnwn :1:; :1 1r:1<!.-111:1rk. The tr:1dc:lll:1rk w:is r<'t.:<>gniscd :1s :1 very valuable asse1:.
134
B r;1 nds ;UT Assets
I 'ir:i11<.ls :ir,· :issns. Tlil'y :11T 111urc 1 h:111 1 r:1dc111:1rb. 'They :irt.' 11·JLsl111urb. A trusted hr:ind is :i genuine asset. \Xlhcn people purchase crnnp111t·rs for rlwir comp:111y, die 11 t1.-:1111:1rk 11 Hl'i 1i:1:: :t tlt·t'i 11 i I•· :Hll':llll:t>~l'. /\11 l'Sl'(llliVt'. kllt1\VS ill:tl :111 I l\/vJ ,·1>1111111rl'r will he 1wll m:1d" :irnl wl'll serviced. He :ils() kntHvs 111:11 11,· ll'lll1°1 gel (irl'd liir h11yi11g I l\lvl. 11'\/vl docsn'r sr:md for l111n11:11i1111:1I l1i11si11css Machines. 11\/'vl is :t 1rns1111:1rk. 11 s1:111ds liir "I lk·liL·v,· i11 this /vl:ichim:".
"( ;.,<>,lll'ill" is defined :1s rl1l'. fi11:1m·i:d v:il11e of rlw rcpurnrion :1 · · comp:111y h:1s with irs cust:omcrs. .. Th:1r is wh:n branding is nil abour .... " :1 repur:11 inn that a product/service/ comp:my has with its customers. According t:P rhe ;1ccounrnnts, ho11'l'Vl'r, rhl' ()nly way :1 company c:111 rt'C()gni.)l' t:hcir years of i11vcst·111L·111· in hrand h11ilding is to sell ilw comp;111y. This policy t:ncu11r:ii,,·s huyi111, :ind selling rnrher rhan i11vcsring in [~rands.
Many execurivcs arc nervous :ihour hr:mds, t·oo. To them, if yo11 c111'r 11w:1s11rt· sn111crhing, it docsn'r l'sisr. Ir's h:ml 10 l'lll'.:isure ll:clings. Ir is'h:1rd I() q11:1nt ii"y tksircs, dreams, c:irl'S, concerns, :1mhitio1is, :1ffcction, loy:ilry, low. Pi11r, fcclin1~s do exist. Every cust<lllll'.r comes with :i br:·Jin :111d :1 hc:1rr. Rrnnds :ippeal ro both. A hr:ind is rnore rh:in a product. To prod11cr f11ncrion, :1 hr:incl <idcls kdi11g. To prod11cr perf()r111:1nce, :1 hr:111d :idds pcrso11:dit:y. The roll: of :1dvl'rtisi11g is \:() 111ake a product: inro :i brand. 13rands arc worth more than prod11crs. Hrnnds :ire v:duahll'. :issct:s.
S11111.: rrirics :irgue d1at :i reason liir 11"1 1 n·:iring hr:111ds as ;1ss.·1s is dll' ,·nnu·rn rh:ir 1h,: li(e of :1 hr:ind 111iglu hl'. li111ited. This makes no sense. The life of :1 brand is one of rh<· ft:ll' porcnrially 1111li111itcd :1ssei:s ,.( 1iiv t'lllll\':tll)'. l~r:ind :lSSL'IS :ll'l' c·1H.lurin1: :1sscts. /Jnrnds 011t.!i·11c
Jirnchicts. Fm L'X:implc, lvkrr.cclcs has lt)ng :1,t.:o t1udi ved the original
1:1crorics :ind rh<· ori1.:i11:d c111pln\'l'<'S. This poin1 o( view is 1Tr.t11.:11isnl in
l:1w. The law rl'lls 11s th:1t ni' 1IH: 1lm·1· furn1s of' inrelkcru:·d properry, p:11c111s musr expire. Copyrights expire. Only :1 rrndcmark can be owned forevc1".
/. _The Law of Dominance
All 1his emphasis on br:111ds is Vl'1·y good. It forces us t:o focus on the rr11c enduring :issers of :i cnmp:111y, rhc hr:111d :isscrs. /\11d do111i11:1n1 hr:111ds :in· the hl'.Sl' :ISSl't:S.
\Ve conducted ;i special study of the return on inl'estmc1H (prL"· inrercsr, pre-tax) vs. m:irkcr rank i\1r 2746 businesses in the renowned PIMS darn base. W c found ;1 clc:ir relationship between m::irkcr rnnk :ind profir<ibilit:y.
Herc is t:he evidence:
f
.' -·-.. ·-··-'""'""' ........ --··-·-··· .. ··-----
MARKET RANK VS. ROl
I R~NK 1;~)] I z 21
3 16 4+ 12
l:\usinesscs with a market rnnk of I avcr:1ge :in ROI o( .31 percent. Thosc with a market rank of 4 or worse deliver :in ROI nf only 17. pn<"t~nr. Market leaders arc about two ;111d :·1 half times as profit:-ible as those lrnsincsses which rank 4+. A 4+ busi11css isn't really a vi:1ble business; it is an unprnfit:1hlc hobhy.
The p:irrcrn is consisrcnr :ind clc:H. We c;dl this p:itrern the L:1w of Dominance. One is wonderful. Two c:in he rerrific. Three is ofrcn 1:hrc:1r<:ned. Ami four is usually (:it:d.
\Vt: recognise, howl'vcr, rh:11 :ill k:1dcrs :uc nor the s:1me. Thcrl' :11·c drnnin:itors and there :uc marginal leaders. A market "dominator" is dd'ined as a b11sincss with sales vDl1111H: :1r k:isr 1.5 ri111<·s i1s nl':1n·,1· cu111pet:iwr. Thl' rc111aimlcr u(
nurnhl'.r I businesses arc defined <ls "marginal leaders".
I! f,' .'':.''. "•.; .:.• :··. ,.·:;:. ":. ,• '. "' ' •• '. '.~ ~',', ·· ' , •

Univers
ity of
Cap
e Tow
n
tv\/\ IZK l'.T IZ/\ N K VS l\UI IZi\NK IZ()I l.v:11krs
[)01ni11;11or 'H lv!argin;d Lc:1der 2(i
Competitors CcilllJ'l'l:irnr 2 2 I C"1111•:·1 i1·.•r » I (i
;:"ll"11·vr., Ii
!vl:nkcr r:111k is :1 niric:1I • k1cr111i11;.111t (lf husincs' pcrfurn1a!-.C1'. :\ '.11:11'1«:! 1.lll111i11:11m is '>2'){, mtH't' J'n·i!'ir:1hk rh:111 i1s 1lt::1rL'St ,·"11111erit11r (l:Pl11J1Cl'il'm n :1111J i:; 1Jirt't'. l'illH'S ;JS 11rnfir;ihlc :is rht' 1?1;1rkcr i'11il<>wcrs.
Tl11: h:11 t Ii: i'"r l1r:111d 1.l"111i11:111r1· i:; 11ut :111 q:\l trip. It is gt>i>d husi11css sense. Domin:t!H hr:inds ;ire the 11111sr prnfi rah le <isscrs.
lkw:1rc· nf rhn:;c' wh" s:1y "This 11vrh:.r is Sil l:1rgt' "''' c:111 h;ivl' ;1 ::1n:d I sh:ll'l' :111d sri ! I succeed". \\/rong! This kind of advice is mislending, 111is1~uided, rnisr:1kcn 111is111:nkcri11g.
1vl:1rkct· ,;i;:l' ;, n11t rhe issue. In ;i
hig 111;1rkcr nr in :1 s111:1ll markc't:, leaders ;.hriw:, while i'ullowcrs ,;rrugi~lc rn smviv1'. C<"1nn'rHr:·1rc yom 1"Csourrt:•S on de:1rly dcfinc.d lllarkcrs in which you 1.::111 h::rnrnl' :111d s1::1y ;1 lc:1dcr. 1 r is 111ore pruhr:1hk, tu he :1 niche-picking leader than ro enter a hig market and hi~ ;: fol!nw1~r. Be ;1
gi;mr. 13c :1 gi:mrkilkr. lk :1 nich,: ..
picking dnrni11:1r1lr. 1\ig 1:1:nkl't Ill'
s1n:dl i:!:1rkcr, :1irn 1." d111nin:1tc Ill'
expect to die.
:How to Build Brand Assets
\Xlh:1r f:1crll1·, :ire :1ssllci:i1cd wi1h markL't r:rnk! We s1.udit:d 1;vcr 25 str:!lc1~ic f:ICrors. Hnt' ;1rc rwn i1111;m1;u11 i':H.'.t:t>r> :1s::(lci:it.l'd witl1 k:idcrship.
; . Quality ii: Critical M;·1rkvt leaders :1rl' disringuislH:d hy ,:up1:rior quality rcl:11ivc t'll CtHllJ.'''ti· 1 inn. Prnduos rn:1rkL'!Td by d1Hni:1:1-t:urs arc: rared J 4% h,,rit:r rh:m competitive ;1ltcrnnrivL·s. Foil1>wers, 1m the l)l'h1:r hand, lll:trkct prot.l11i:.1.s
135
wlii1·li :trt' \,I% ll'!lt'Sl' 111:111 ._.l,llljh'I ilt1rs' JH'lhlucts. l )u1nin:ll'llrs
:;,·II "" q11:ili1 y, wliik ;;,11111vns :11 lt'lllJ'I 111 1·1111q)('tC 1111 J'>l'i('(.:.
MARKET l\i\NK I l11111i1i:11t1r:;
lvl:1rgi11:1l Le:1dt:rs lt111k Two
lNDEX OF RELATIVE QUALITY
I 11 +(i
+0,3 -2,7
I
I R:rnk Three F1illnwcrs -3, 1 . i
\)1t:tlity hr:rnds :ire more rhan JU:it q11:diry prllducrs. To lit' :1 qu:tliry hr:1nd, l'l'l'l'ytl1in1; ;1ss1it·.i:ncd wirh rhc lir;11HI 11111st lw q11:di1y. Y1>11 c;11111ut
'sell qu:ility ,;:;cept in ;1 consistenr qu.:tlity manner.
T\ut:, t:hc hc;1n Ctluntcrs have. a J':1ssinn for productivity. Tht:y focus only llll ci>sr curring. They focus 1111ly 1 H1 d'i'icicncy inst:c:id of tll1 t:ffl·crivcncss. They lollk ;1['.
:idvi:rrising in rcrms of wh:tt it cnsrs i11srl·:1d 1if wh:1t· iris worth. They rocus only on hnw w do somcrhing chl.':tper insrl':1d 1ll. how to do it hl'rrer. They cncour:lgc a strategy dvsrined I'll huild 111:1rkc1 (ulluwers, nor m:irker do111i11arnrs. Tll h11ild :111 cndurinh:. dnrni11:1nt, prnfir:1l~k hrand ;isser, quality products mu~t: be supported by q11:ilit:y m:lrkctini;. Improving quality incrc:isl'S rhe odds 11( k:ttkrsliip. S11ppmri11:~ :1 qu:diry pmducr with i11crt~;1st>d :1dvutising wcighr signii'icmtly improves rhosc: odds. A hr:m1l is :1 rnr:d L'Xpcriencc which includes <•vcrything :1ssllciared with rln' prnducr ... c<;nsickrarion, p11rch:1:«", 11St' :ind rt'purchasl'. A hr:111d l'XJ'l:ricncc includes displ:iy, pr< 1rn1Hi1111, 1':1rk:igin1'., p11hlic 1"t·l:HillllS, :1dvcnising, ere. \Xlh;1t is rlw 11sc "( 111:1ki11g :1 hii~h q11ality prtld11ct: :md rht:n marketing it in a l1.1w qu:diry 111;.111ner? .
The Marketing Mix Matters Thnt: is :t i'uritl11S hardc r:tging in 111:1rkt:ring. /\ hau:lc bL·rwe.cn rhe r•r11p1111e11l'.~ 1>( :1dvt't'l'isinµ vs. th,,
prtlptmt·n!s "f pn1111111 inn. Tht' t:.strt>lllt'S :ire, nl c1n1rst:, wr1lllg. Tlwr .. is :1 pl:i1·1· i'llr h<tih :idvnrisi111: :11id pn>l1ll>l'itln. Spt·nd 100')(. on promotion and you build vol11111c h11r nor loyalty. Spend l001XJ lll1 ;1dvcrt:ising ;incl you huild loy;ilty hur ins11fficienr vol11111l.' ro he :1 m:irkcr 11':111.:r. Yl\11 111·,·d I'""' :11k1:r1 i::i111: and pmmnriun w he an enduring market dominator. It is not only how much you spend, but hnw ytn1 spc111l ir r.h:it m:Ht:crs. 011r evidt:nce in unt'q11ivrn·:11. Compared rn the ;1ver:1ge::, dtlmi11:11:nrs spt:nd 20% more of their hudgcr lHl :1dvnrising. Followers .-;pl'nd 'J 'J •y., less t h:lll t lw :1vcr:1gl: 1 in :1tlvnt isi11g. The key is to get the balance righr. While dominators spend ha!( of their budget on advertising, rollowcrs Sl)CJlcl two out Ot three doJl:ns nn prnmotion. Spend rwo rhirds of thl' :1dvertising :lnd prnrnorinn budget l>n price mt her than on brand qu;1 l.i ric:. :111d you arc selling producrs, nnr m:Hkcting brands. lnsre:id of emphasising how good :1 bran,! is, we ;ire stressing how cl1L':)p it is.
There is an important pbcc for b"th advertising :rnd promot io1i. Promotion b<iilds volume. Advertising build., loy:dty. You nl'cd product volume to be a clomin:irur. You need brnnd loyalty co he a prnfirnblc domin:unr. l\r:ind luy:ilt y is key l'\1 prnfir:1hiliry. The rt: is 11<1 such thing :is prndw:t loya[t)'. Thert: is 1mly bra11d loycdt1'. V/c cannot build long-rcrm hr;;nd. ioy:ilty by exccssivL: cmph:·1.':is ,,11 shorr.-term bribes. The exccssi1·e use uf dc::ilint,: and prrnnnr.io11 tlehiiir:m:s, dch:1.<cs, :ind J.'nrcnri:illy dl'.'i!T<l)'.': br:ind assets.
If rlws<: IT<'nds c111Hin1tl:, t·1'1.'rvh11(I\' loses. The manu(;1cturcr loses hr:111d lny:-ilty. The retailer llJSes quality br:mcb to sdl. And the consunH::r loses quality brands to buy.
Markering policies ll'hich dcsrn1y r:nhcr 1 h;in SffL>ngrhcn hr:rn,1 :i:;sers arl' wrong!
I-low do ynu build cncluri11g, domin;int, prnfir:1blc br:iml ;1ssL'.rs1
' •' ••" '~ ·~ : ' .'' ' • • ' • ,'' ~ w• ' • • '• ' • ,., 'f. '\ • '•

Univers
ity of
Cap
e Tow
n
Quality i,: 1·ritic:il. P11· 1·x1·1·ll1·111. .'~ ( )o()(I 1.·1HH1gl1is11"11~11rnl
1•111 HIJ~l1. /\ q11:di1 \' 1'r:1111l is 11111n· 1li:111 qu:tli1y pr11d111·1 p1·d;1r111:1111·1'. /\ qwilit·y hra11d is ;1 ror:il qu:rliry cxpcriL'llCL' ... ;1 qu:tlit·y pn1d11cr l'l'L'sc11rcd :111d cxpnie11ccd i11 :1 qu:iliry m:m11c1'.
Diffi:n:nliatc y1H1r hr:1rnl. /1 ldcnrify a n.:lcv;1nt l:on~un1er
w:uir. C:irvc out :1 sp<.:ci:tl niche. As one philosopher pninrcd out -- you c:m'r be cxccllcnr; you musr he L'xcdlc11r at: snmcrhi11g. ldcnri(y rh1.· s111nl'rhin1~ spL·c:i:tl whid1 difk1·enri:1r(',; your hr:1nd. 1.\m'r rry rn :1ppc:1l I'll everyone. Be vny spL:ci:tl ro sninc:one speci:1I.
/\i111 Ill dllmi11:1t1:. l'l:ty Ill 11•i11 llr 111111'1 1iJ:iy. lk :t i<-:1111'1' ill l'l'l'I'\"
1.hi11g y1H1 do. Tii reach rl1c tt1p iii' 1 lw 111;1rkct, be rop (ti' mind. Do111in:Hc in media, displ:1y, pru11H1tion, etc. Consumers rrust: bider:;. Big 111:ll'h:t 1lr sm:·rll 111:11-kl't', :rim I'<• d11111in:1re. Tt1 dt1111i11:1l'1', you 11H1:;1 1·111K.cntr:uc. Concenrrar.t· y1.n1r rcsuurces. Diffusi1111 leads r111lilurion. C1111L'L'.1Hr:1t\' y<>ur rcsou1·cl~S nn :1 11ichc you c:m donlin:w..:.
i !
. The Financial Value of Brand Assets
I ....
Su1:ccss in the (u(urc will 1.kp1·1HI ni•r un the fac.ro1·ics you own, hut: 011 the mmkets you own. The only way l'Cl
own a l\\'11'kct is vi:1 hr:-mding. \Vh:ll' is rhc Cinancial vnlue oC :1 diffcrl'nt iarL:1l, quality, d11111i11:111r hr:ind :tSSl't / While it: is difficulr tt1 qu:1ntify rl11.: spl"cific cont:rihurion llf c:1ch input int11 :1 lmmd's rcpurari1111, it i,; possible to qu:mrify rhc ror:d v:1luc 11(
tltl' hr:1111I :1SSl'I its1·1i'. \X/l' 1111is1 1\·111l'lllh1~r 111 :1v11id "11n(1·,·1illll p:1ralysis". Fk:c:1usc su111cr.hing is h:ird 10 mc;.1surc pl'rfccrly, t h:1t docs nor lllC:ll) \\'l' :-.1\\)lJl ... ln't I ry !1) llll':lSlll'l' it
:ti :di. \Xlh:1l i,; :1 hr:1nd :1ss1·1' /\ hr:ind
:rssL'l' is a result. p(:
l. how the rn:irket rnl'c.-; ynur hr:md in use;
136
111111· thl' 111:1rkl'i differe>1tiatcs
)'llllr l1r:111d J'l'llJll Ctllllj)Cliti1lll; 111111· t lil' 111:1rkvr rw1i<s yll11r hr:111d i11 s:1ks.
\Y./L· ClllllJlllll:d whar we rcrm "marker :1ss1.·r v:d11I.'" or "MA\/". MA\/ is ddined :is rill' comhi11:1riun uf three q11:111rit:Hivc 111t·:1s11rcs: (1) 1vl:irkcr q11:ili1y, {J.) lvl:1rkt·t diffn1·111i:11iu11, :111d (_l) lvl:rrkl"r rnnk. Wc currcl:11:cd 011r mc:rsttrl' n( :1 husincss's marker :·ISSl'l' v:duc wit.h rhc "invesrmenr mul t:ipk" :issocintcd with ;i busincss (1kf'incd :1s stock m:irkcl' value vs. h1111k value).
l\l.'s11lr! J:\usincsses wirh :1 high lv!A \/ h:tvL: ;111 investment rnult:iplc 1 h:1r is uvcr 22 S% gr1.·arcr rhan businesses with ;i low MA V. A h11sinl'ss wirh high q11:iliry, in:rrkl'r 1lilfn1·111i:11,·t!, 111:trk1·r domin:m1 hr:11HI:-. is w11rtl1 11v1..·r 1wit·1..· :1s 11lt11..:l1
111 t hl' Hn:1ncial crn11m11nity. l11vcsr111·s will pay ;1 premium 11vcr hook v:du1.· hn::111sc rhcy v:duc premium qu:ility, highly diff<.~rcntiarcd, marker 1l1ll11in:1111 hr:1nds.
Nl.'s1k didn'r 11:1y 25 rinH:s <.::irnings fm l\mvmrcc's r:1crories. They huught Rownt rcc's di(i'crl'nt:i:1tnl, q11:tliry, dumin:mr hr:inds. Comp:i-11ies :md invL:srms recognise rh:it a cornp:my\ 111osr valuable assets arc its hmml :1sscrs. And rhe hest: assets are difkrcnri:1red, quality, dominant hr:111d :1ss1:1s.
The Smarter Generation wants Brands
Tht: S111:1rrcr Ucncr:rtion n:spt:ct:s :111d rrnsrs leaders. They will pay ;1 J'l'Cmium price for leading brands. The husincss :rml financial communi-1 iL's i1icr1.·asin).!ly recognise t:hnr :1 ( 1111111:111y':; ll\t1Sl v:tl11:thl1· :ISSl'IS :1rl' its l1r:111<I :1s.'i1'IS. /\11.I ilw 11111sr v:rlu:1hk hr:111d :1ssL·rs arc high qu:1liry, 111:1rkt:r diil1·rL·nri:1rl'.d, 111:1rker dmninanr hr:1111I :1:.s1·1,. t .:1111s11111l'rs v:rilll' 1p1:ili1y, 1liUn1·111i:111·1I, di1111i1r:1111 hr:11Hls ... :111d th\.' i'i11:inci:d co11111111-11i1 y v:rl11cs cu111p:111ics rh:1r marker rhusc hr:inds.
/\11 :1dvcnisin1~ :igcncy is really :1
111:m11f:Kr11rin1~ co111p:t11y. Clil'nrs 111:11111f:icturc prod11crs. Agencies 111:11111facr11r\.' hr:1nds. Tlw :igc11cy's 111:1111d:1Cwring plant: is in rhl' consumer's .mind. The m:muf:1cturi11g prm:ess is m:irkcring. 1vl:1rkering, p:trt icularly :1dvcrcising, creates :1 hr:111d which is worrli mmc ru rl1e ,·,111s11111cr rh:1n rhL: pmd11(r itself'. Consumers will pay more (or hr:1nds t:han for producrs.
Strong brand assets arc good for business. Strong brand assets me go\lll for consumers. Strong brands are :i trust assurance policy for rhc consumer. Strong brand ;1ss<.:rs :m:
1~ood marketing policy :111d gnod public policy.
'\/./e live branded lives. We drive hr:rndcd ems. 'v./c c:it. :11: hr:111dcd rcs1:i11r:1nrs. '11./1' 11se hr:1111kd nl'dir c:irds. \X/c wcar l1r:t11Lkd clotl1L:s. Cl11r children mtcnd branded schouls. \X/1~ live in branded cities where wc h:iv1.· jnlis in hrandcd companiL·s. \Xie t:tkl' hr:mdcd pl:111es rn branded v:1r.:1rio11 dcs1i11:ll'ions. 'l/./c live hr:111dcd lives. And hr:inded livcs me bcrrer lives.
The Sm:1rrer Cencr:1rion is 11n rn1r side. Thcy arc t:clling us that: h1·:1nd loy:1lry is not hnught: rhrough bribes, ir is l':1rncd thrnugh trusr. The Sm:irtcr Gcnernrion t:rttst.~ le:iclci"~· They cell us they want quality, rhcy W<rnt value, and they value time as well :is money. They will p:1y a premium price for differentiated, quality, dominant brands. They rcll us rhcy wam a qualit:y tornl brand experience s11ppon:cd by qualit:y mmkering, communicated in :i q11:diry 111:11111cr. They will pay more for hr:rnds rh:111 for prnduct:s. They will p:iy mmc for l'rcmium quality, marker diffcrcnri:11:ed, nrnrkct dominant: hr:111ds. They 111:1111 tn1s!11wrks, IH>r llll'l'l' 1r:1d1· .. 111:irks. Tlwy w:llH wh:1l 11i:1rk<:1L·rs
W:l ll I l'O .P.1.·~v !~i.l' ._ -- .. ___ -· .. !''"'
i To our Readers i For :iddirion:il copies of rhis issue of
l~cse:irch Digesr. Just: co11t::1cr: John Annandale
, Reade.r's Digest, PO Box 784483 !Sandton 2146. Tel: (011) 883-6910 I

Univers
ity of
Cap
e Tow
n
137
APPENDIX B
INTERNAL REPORT
Refer to p. 60. Two relevant issues are
discussed:
Management Planning and Control
Operational Control
The aims as set out in this report can
only be achieved through specific productivity
<or performance} measurement.

Univers
ity of
Cap
e Tow
n
•
I
I I • I ~
•
138
EXECUTIVE ROLES AND OBJECTIVE SETTING ---·-----·------··-···· ···--·----··-------·---··---------·---·----·--·--·----------·---·
1. Organi_sational Needs
Modern organisations are large and complex. Because they have become so it has been necessary to delegate the responsibility of managing their component parts to an ever-increasing hierarchy of managers.
This hierarchy of managers, through the organisational design and the network of planning, control and information systems within which they function, forms the infrastructure of the modern organisation. Together they form a gestalt and, under the influence of the chief executive, give the organisation its character, style and personality.
There is, however, an order in this infrastructure which allows one to generalise about the roles of managers at the various hierarchical levels.
In this section:
The need for organisational effectiveness and efficiency J.s explored .
Strategic planning and management (business) planning and control that reflect effectiveness, operational control that reflects efficiency, are defined.
Delegation and its effect on managerial roles are examined.
Finally, a model indicating the degree to which a particular manager, at a particular level in a managerial hierarchy, should be involved in strategic planning, management planning and control and operational control is developed.
This model has been termed the normative management structure and is compared to what can be termed an empirical management structure which indicates that managers in most organisations are overly involved in operational control and that, in comparison with the normative model, too little innovative planning is undertaken.
It is also indicated that, if organisations are to move from the empirical model to the normative model, managerial key performance areas need to be identified, the flow of redundant operational control information needs to be eliminated, and a proper management control system to trigger dynamic continuous replanning needs to be developed.

Univers
ity of
Cap
e Tow
n
139
An organisation needs to be both effective and efficient to survive and grow. It needs to be effective in the sense that its interaction with its environment leads to profitable growth. This requires continuous entrepreneurial action in.
The development and selection of a grand strategy for growth and survival. This includes the setting of various kinds of objectives and policies and the specification of strategic guidelines that are essential to give direction to the various planning processes in organisation.
The choice of products and markets to ensure that they fulfil a need in society. this involves both formal and informal market research and the development of new products and markets to keep pace with the changing demands of society on the one hand, and to keep ahead of competition on the other.
The development and maintenance of a competitive strategy to create and stimulate demand, to ensure material and financial resources and to increase market share. This includes the dynamic use of marketing tools in the light of changing patterns of demand, substitutes and new entrances to the market.
The choice and source of raw materials in manufacturing organisations and suppliers in merchandising organisations appropriate to its competitive strategy.
The application of innovations developed within as well as outside of the organisation to the manufacturing and other functional processes of the firm.
The selection and development of human resources to improve productivity and managerial efficiency. Use of these resources through improved relationships to carry out tasks operationally.
The effectiveness of action in these areas is reflected in an organisation's ability to anticipate changes in the environment and to develop competitive strategies in advance of such changes and thus to always be in a position to grow profitably in the changing world of tomorrow. It is also relected in an organisation's ability to react quickly and efficiently to those unanticipated changes with which competitors, governments and labour unions like to confront the organisation.

Univers
ity of
Cap
e Tow
n
14~
The group of managers who are primarily responsible for effectiveness are the e~trepreneurs of change agents - short, the thinkers - in the organisation. They interact with an ever-changing dynamic environments and therefore function in an open system. They are to be found in the higher echelons of management.
An organisation also needs to be efficient in the sense that th~ numerous tasks that are carried out internally in the organisation should be performed at a level considered to be acceptable. An organisation therefore should see to:
The development of standards of acceptable performance. These standards can be developed historically or scientifically by using work study or industrial engineering techniques. Examples of efficiency standards are man-hours per unit of product, machine-hours per unit of product, material per unit of product, machine downtime, productive time ratios, minimum/maximum invetory levels, percentage rejects per volume of output, salesman calls per day, average sales per call, contribution per salesman, cost per kilometre, billings per clerk, and many others.
The development of rules and procedures that prescribe the preferred manner in which things are to be done in the organisation, as well as a means of monitoring the application of these rules.
The development of a culture of discipline within the organisation which involves the development of control systems to monitor the efficient performance of tasks, together with a mechanism to ensure that corrective action is initiated when variances from the standards exceed acceptable levels.
Efficiency here is reflected in an organisation's ability to perform according to the stated standards and to generate corrective action whenever there are unacceptable deviations. It is also reflected in its ability to continuously improve productivity along the learning curve as opposed to productivity improvements that are the result of specific plans and programmes aimed at changing the composition of resources used in any particular situation.

Univers
ity of
Cap
e Tow
n
' I
I •
141
The group of managers who are primarily responsible for efficiency is much larger than the group primarily responsible for effectiveness. They are the administrators and supervisors in an organisation and tend to operate in an evironment which is to a large extent buffered from the uncertainties of the external environment; they thus function in a relatively closed system (or, more correctly, a less open system) than the entrepreneurs and change agents responsible for effectiveness. They are to be found in the lower echelons of management.
Thus, if an organisation is to survive and grow profitably, it must be both effective and efficient, with the higher levels of management primarily involved in effectiveness and the lower levels of management primarily involved in efficiency.
2. Strategic Planning, Management Planning & Control & ~rational Control.
A more explicit way of specifying an organisation's need for both effectiveness and efficiency is to do so in terms of the planning and control activities it has to undertake. These are:
strategic planning Management planning and control Operational or technical control
Strategic planning and management (business) planning and control are primarily aimed at ensuring effectiveness while operational control is aimed at ensuring efficiency;
Strategic planning is the process of deciding on the mission and objectives of the organisation, on the resources to be used in attaining these objectives and on the strategic 9uidelines and policies that are to guide and govern the management or business planning process. It therefore involves
deciding on the mission of the organisation and thus what kind of business or businesses the organisation wants to be involved in,
specifying the objectives of the organisation and also any changes in these objectives,
the allocation of resources, and
the specification of strategic guidelines and policies that are required to give direction to the management or business planning process.

Univers
ity of
Cap
e Tow
n
142
Management (business) planning and control is the process of ensuring that resources are obtained and used effectively in .the accomplishment of the organisation's objectives. It therefore involves
the development of plans for the effective acquisition of resources, and
the development of pl~ns and action programmes relating to the effective utilisation of these resources in the areas of administration, marketing, manufacture, inventory holding, research and development, and in any other area in the organisation in which resources are used.
The plans and action programmes are all aimed at the accomplishment of the organisation's objectives in a continuously changing and uncertain environment and are often bound by the strategic guidelines and policies resultirig from the strategic planning process.
It is clear that many more managers are involved in management planning and control than in strategic planning.
Operational or technical control is the process of ensuring that specific tasks are carried out effeciently. This involves:
a clear specification of the task to be performed as well as procedures for performing it;
the specification of efficiency standards;
the measurement of actual performance
the identification of variances from the efficiency standard; and
the initiation of corrective action.
Operational control therefore involves the creation of a whole network of efficiency standards and operational control systems within the technical and administrative core of the organisation. In comparison with the strategic and management planning and cbntrol processes, it involves many more managers at supervisory level where physical tasks are performed.
The characteristic~of the foregoing planning and control processes are summarised below.

Univers
ity of
Cap
e Tow
n
•
Ch
ara
cte
risti
c
Fo
cu
s
Pers
on
s p
rim
ari
ly
inv
olv
ed
Pro
cess
Men
tal
acti
vit
y
Tim
e h
ori
zo
n
Deg
ree
of
str
uctu
re
Natu
re
of
info
rmati
on
·--...
.
Str
ate
gic
P
lan
nin
g
One
asp
ect
at
a ti
me.
To
p
man
ag
em
en
t an
d sta
ff
Em
ph
asi
s o
n
pla
nn
ing
Cre
ati
ve
an
d an
aly
tical;
p
oli
tical
an
d n
eg
oti
ate
d
Ten
ds
to
be
lon
g
Un
str
uctu
red
an
d
Irre
gu
lar
pro
jects
Tail
ore
d fo
r p
rob
lem
ex
tern
al,
inaccu
rate
, fu
turis
tics,h
igh
ly
un
cert
ain
---·
~--• --
. -•
Man
agem
ent
Pla
nn
ing
an
d co
ntr
ol
Wh
ole
o
pera
tio
n
Lin
e
man
ag
ers
Co
ntr
ol
thro
ug
h
rep
lan
nin
g
Cre
ati
ve,j
ud
gem
en
tal
pers
uasiv
e
Med
ium
(a
nn
ual,
y
ear
en
d)
Str
uctu
red
an
d
rhy
thm
ic
Inte
gra
ted
,fin
an
cia
l fu
turis
tic
fore
casts
, m
ore
accu
rate
Op
era
tio
nal
co
ntr
ol
Sin
gle
ta
sk
o
r tr
an
sacti
on
Su
perv
iso
ry
man
ag
em
en
t
Co
ntr
ol
thro
ug
h
co
rrecti
ve acti
on
Fo
llo
win
g
of
instr
ucti
on
s
an
d
reli
an
ce
on
ru
les
Sh
ort
(d
ay
-to
d
ay
)
Hig
hly
str
uctu
red
Tail
or-
mad
e
to
op
era
tio
ns,
his
toric
,accu
rate
.... .j::
l.1l

Univers
ity of
Cap
e Tow
n
144
r::gurc 1. , ... Jorr.iJ11vr~ :n:Jnase:-nent srruc~ure
I ,/ Ir-·-· ,-:)l'..:.-:>i /.,r '
I ~~- -..'' o
I -;- '::!'- ->"' ..:~ r-~ To:J rnan2c_ eme!l! ·"'' . 1 o' I I " , ~ ,G ~ '"' ./'.:::: v Co
-·:'·
/,l.. [i - ~~· Ii .... ~":'=i' // I l__ __ I __! l_I - ~ ,,/ ~
/- -1:::._:-:_:;--:_..=_~_:__::-_::-i-· -\- - - - - -,- ~ - - - - - - - ~-::·_~ - - - -, ;:,-::.~:o_ - - .,
1 i-i n n 07i· ..... J. ... ·--··-··---··-·:.__······--·--········--_:_ ___ : _____ Q.~::. __ .............. :-... G . 1 '--' -- --- l..'...'.....: 'co'"~11nc ./ '·' I
11 !-------~----·---- ~:n;~~;~r;i~·n( / .... · ,..,0·:::: ' ' I I - C""'
/ , __ · ___ j '---~J .cJ n o \ // L . \ / -------------------' =:ir1101iii2a :--Jrs"2.n1:::~·iion.s1 h1erarc~y
Narr.iative mana9~mcnc strucrure (re1;;.1ive 11mes soen1 on p1anning _ cna c;:;n1ral)
Normative management theory emphasises that top management should be heavily involved in strategic planning and supervisory or operating management heavily involved in opera~ional or technical control. The role of middle management is less clearly defined in normative theory, but one would intuitively expect them to be fairly heavily involved in management planning and control, that is to say the effective acquisition and utilisation of resources in a dynamic and ever-changing environment, and only marginally involved in strategic planning on the one hand and operational control on the other.
The principles of delegation tend to modify the foregoing statement slightly insasmuch as the accountability of managers for the performance of subordinates inevitably involves them in the planning and control activities that have been delegated to those subordinates. Top management thus become more heavily involved in management planning and control and even in highly exceptional cases in operational control than is, according to normative theory, necessary.
It would therefore seem that -
top management should be heavily involved in strategic planning as well as in management planning and control, but only in highly exceptional cases in operational control;

Univers
ity of
Cap
e Tow
n
145
middJ.e mana9ement shouJ.d be heavily involved in management pJ.anning and control but also in operational control, and to a .lesser degree in strategic planning; and
operational management should be heavily involved in operational control, to a much smaller degree in management planning and control, and not involved in strategic planning at all.
Assuming that the foregoing statements correctly reflect the planning and control responsibilities of line management at the various managerial levels, it is possible to develop a normative management structure in the manner illustrated in figure 1. The managerial pyramid at the gross level distinguishes between top, middle and operating management and, within that, at a more detailed level, the organisation chart illustrates the specific levels of management and their relationship to the normative management ~tructure.
The levels of management are indicated by the vertical axis and the relative average time spent on the various planning and control activities within an average year by the horizontal axis. A horizontal cut across the normative management structure at any hierarchical level will illustrate what planning and control activities a manager at that particular level, normatively speaking, should be involved in.
The horizontal cut will also indicate, approximately, the relative proportions of time spent on planning and control of the three types, and thus in which of these areas the manager uniguely contributes to the achievement of organisational objectives. This is due to the fact that the mangement structure, although illustrated abstractly, highlights managerial involvement in the various planning and control activities at the different managerial levels, relative to one another. As already stated, this division refers only to time spent on planning and control, and not to total working time, for the 'manager will typically also spend time on other activities such as interaction with subordinates, peers and supervisors; thus on activating functions as well as in operating or the doing activities, which do not fall under planning and control.
With reference to figure 1.2, manager A would spend approximately AB/AD% of his planning and control time on strategic planning, BC/AD% on management planning and control and CD/AD% on operational control. Likewise manager B would' spend EF/EG% of his planning and control time on mangement planning and control and FG/EG% on operational control.
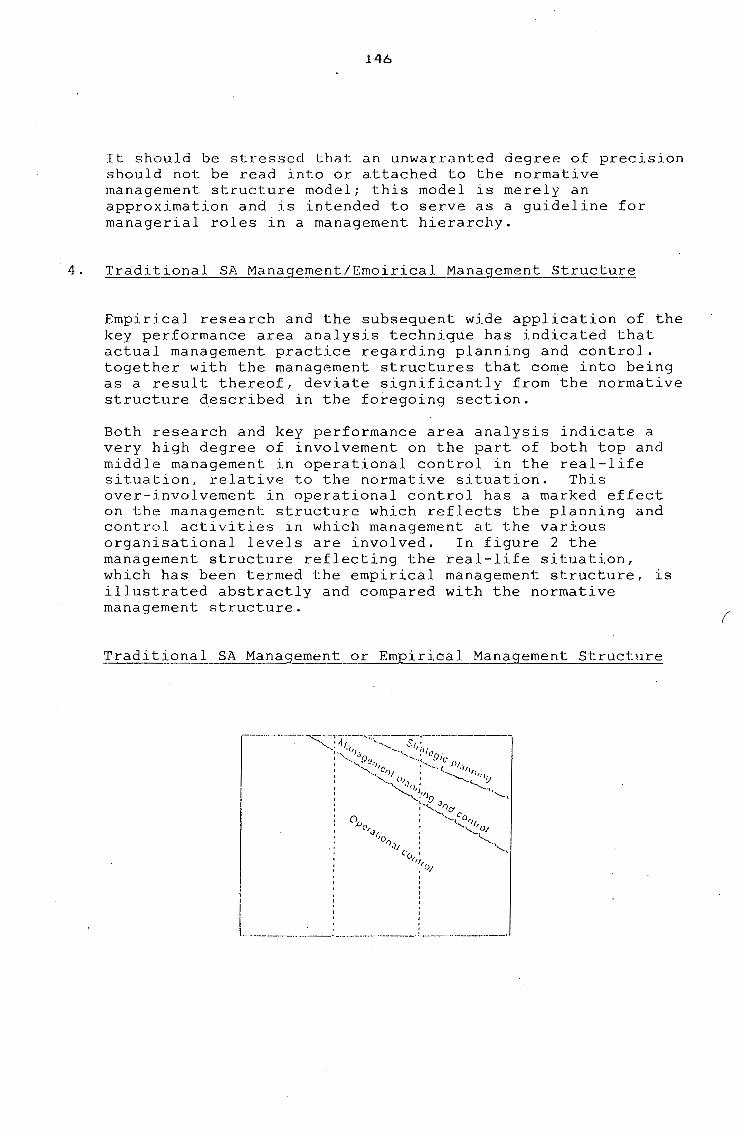
Univers
ity of
Cap
e Tow
n
146
It should be stressed that an unwarranted degree of precision should not be read into or attached to the normative management structure model; this model is merely an approximation and is intended to serve as a guideline for managerial roles in a management hierarchy.
4. Traditional SA Man~~ment/Emoirical Management Structure
Empirical research and the subsequent wide application of the key performance area analysis technique has indicated that actual management practice regarding planning and control. together with the management structures that come into being as a result thereof, deviate significantly from the normative structure described in the foregoing section.
Both research and key performance area analysis indicate a very high degree of involvement on the part of both top and middle management in operational control in the real-life situation, relative to the normative situation. This over-involvement in operational control has a marked effect on the management structure which reflects the planning and control activities in which management at the various organisational levels are involved. In figure 2 the management structure reflecting the real-life situation, which has been termed the empirical management structure, is illustrated abstractly and compared with the normative management structure.
Traditional SA Manageme~t or EmEirical Man~gement Structure
I
l ' ' ' __________ · __ :_·---------------~---··----------·
(
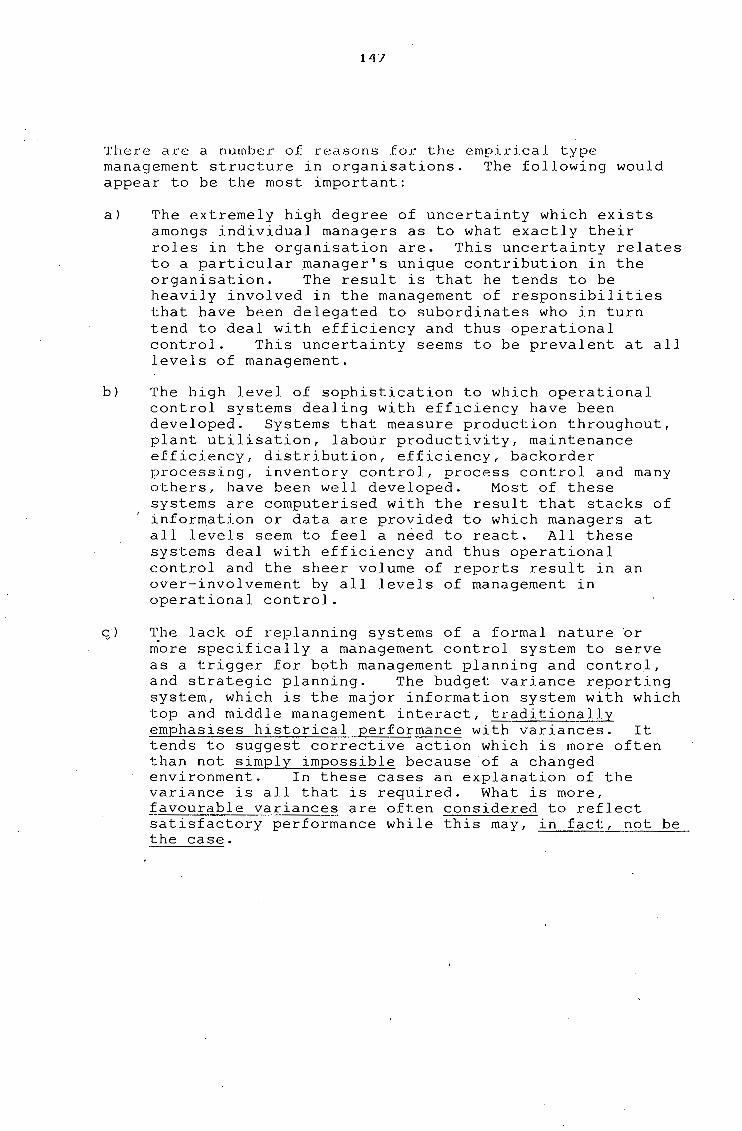
Univers
ity of
Cap
e Tow
n
147
There are a number of reasons for the empirical type management structure in organisations. The following would appear to be the most important:
a) The extremely high degree of uncertainty which exists amongs individual managers as to what exactly their roles in the organisation are. This uncertainty relates to a particular manager's unique contribution in the organisation. The result is that he tends to be heavily involved in the management of responsibilities that have been delegated to subordinates who in turn tend to deal with efficiency and thus operational control. This uncertainty seems to be prevalent at all levels of management.
b) The high level of sophistication to which operational control systems dealing with efficiency have been developed. Systems that measure production throughout, plant utilisation, labour productivity, maintenance efficiency, distribution, efficiency, backorder processing, inventory control, process control and many others, have been well developed. Most of these systems are computerised with the result that stacks of information or data are provided to which managers at all levels seem to feel a need to react. All these systems deal with efficiency and thus operational control and the sheer volume of reports result in an over-involvement by all levels of management in operational control.
g) The lack of replanning systems of a formal nature ~r more specifically a management control system to serve as a trigger for both management planning and control, and strategic planning. The budget variance reporting system, which is the major information system with which top and middle management interact, traditionally emphasises historical performance with variances. It tends to suggest corrective action which is more often than not simply impossible because of a changed environment. In these cases an explanation of the variance is all that is required. What is more, favourable variances are often considered to reflect satisfactory performance while this may, in fact, not be the case.

Univers
ity of
Cap
e Tow
n
148
dl finally, there seems to be a number of less important reasons for the evolution of an empirical type management structure, such as -
the inability of managers to move from functional or specialist management to general management;
the inability to delegate;
the tendency, on promotion, to drag the old job along; and
the Peter principle of promotion to a level of incompetence.

Univers
ity of
Cap
e Tow
n
149
APPENDIX C
ORGANIZATIONAL CHART
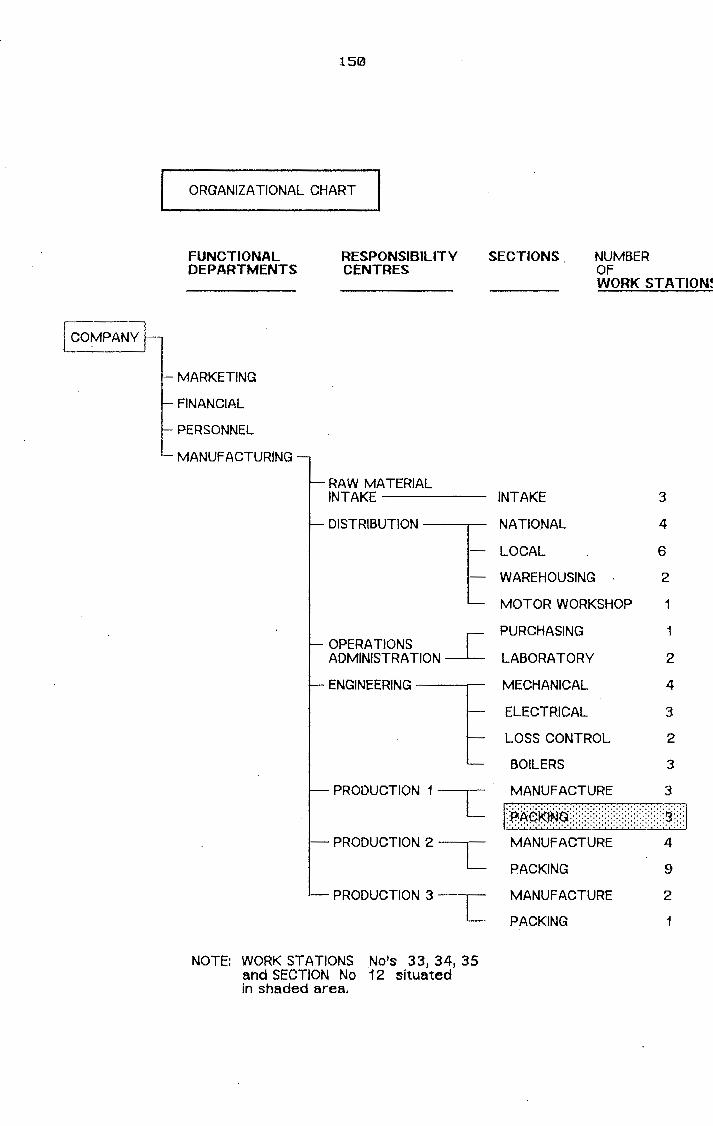
Univers
ity of
Cap
e Tow
n
150
ORGANIZATIONAL CHART
FUNCTIONAL DEPARTMENTS
-MARKETING
FINANCIAL
PERSONNEL
- MANUFACTURING
RESPONSIBILITY CENTRES
RAW MATERIAL INTAKE
- DISTRIBUTION 1 OPERATIONS _[ ADMINISTRATION
ENGINEERING~
SECTIONS. NUMBER Of WORK STATION~
INTAKE 3
NATIONAL 4
LOCAL 6
WAREHOUSING 2
MOTOR WORKSHOP 1
PURCHASING 1
LABORATORY 2
MECHANICAL 4
ELECTRICAL 3
LOSS CONTROL 2
BOILERS 3
PRODUCTION 1 ---r- MANUFACTURE 3
L l:#.~9ffl9;i:i:i:i:i:):):i:i:::::i:i:::£~J PRODUCTION 2 L
- PRODUCTION 3 L
NOTE: WORK STATIONS No's 33, 34, 35 and SECTION No 12 situated in shaded area.
MANUFACTURE
PACKING
MANUFACTURE
PACKING
4
9
2
1

Univers
ity of
Cap
e Tow
n
151
APPENDIX D
INCOME STATEMENT - APRIL PERIOD 1
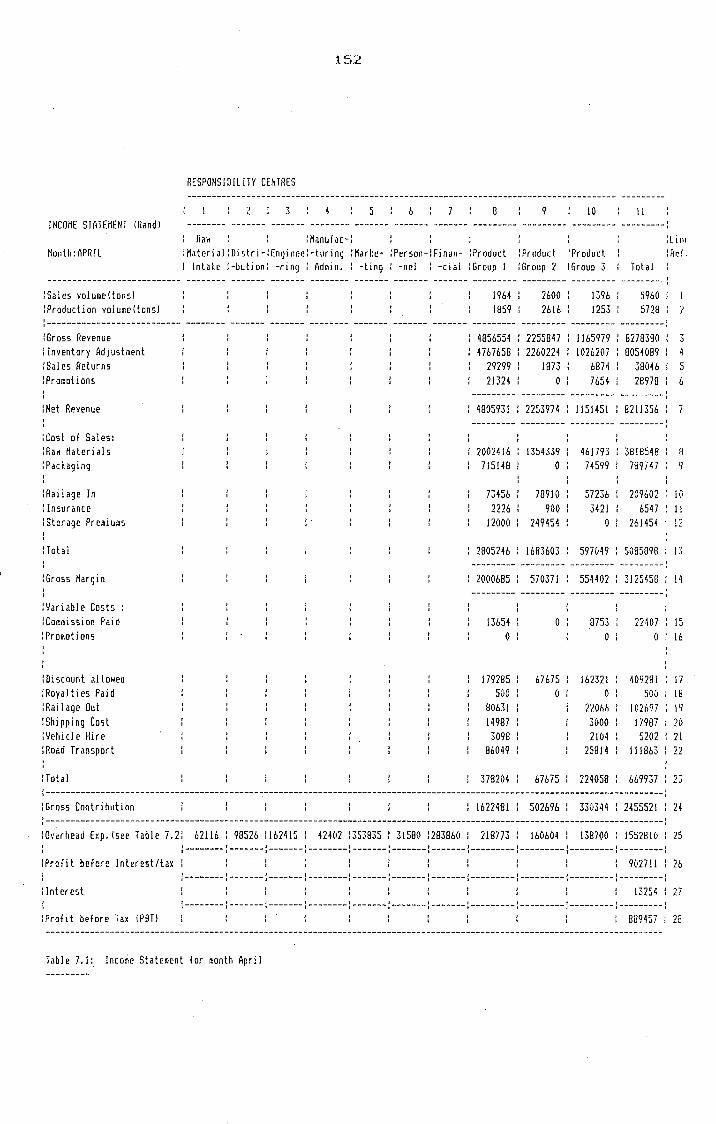
Univers
ity of
Cap
e Tow
n
INCOME STATEMENT IRandl
Month:OPR!L
15.2
RESPONSJOJLJTY CENTRES
3 5 b 9 10 11 -------- ·------- ------- -------- ------- ------- ------- --------- --------- --------- ---------:
Raw :Manufac-: :M.1terial :Distri-:EnginP.r.:-turing :Marke- :Person-:Finan- :Product : lnlal:e :-bution: -ring : Odmin. : -ting : -nel : -cial :Group l
:Produr.t !Group 2
: Product !Group 3 Total
: Li Ill :Her.
--------------------------- -------- ------- ------- -------- ------- ------- ------- --------- --------- --------- ---------: !Sales volume!tons) :Production volume!tonsl
1964 1859
2600 2616
1396 1253
5960 5728
:--------------------------- -------- ------- ------- -------- ------- ------- ------- --------- --------- --------- ---------: :Gross Revenue I Inventory Adjustment :Sales Returns :Promotions
:Net Revenue
:cost of Sales: :Raw Materials :Pad aging
:Rail age In : Insurance :storage Premiums
:Total
:Gross Margin
:variable Costs : :commission Paid :Pro~otions
:Discount allowed : Royalties Paid :Ri!ilage Out :Shipping Cost il/ehicle Hire :Road Transport
:Total
I I
! .
' '
4856554 2255847 1165979 827838(1 4767658 2260224 1026207 8054089 4
29299 1873 6874 38046 5 21324 0 7654 28978
--------- --------- --------- ---------r 4805931 I 2253974 I 1151451 I 8211356 I
I I ' ' --------- --------- --------- ---------:
20024lb 1354339 461793 38l8548 715148 0 74599 789747
73456 789!(1 57236 209602 J(I
2226 900 3421 6547 l! 12000 249454 0 261454 12
2805246 1683603 597049 5085098 1:;
--------- --------- --------- ---------2000685 : 570371 : 554402 I 3125458 : 14 '
--------- --------- --------- ---------!
13654 0
0 0753 0
22407 15 0 16
179285 500
80631 14987 3098
86049
378204
67675 0
67675
lb232l 0
22066 3000 2104
25814
moss
409281 l 7 500 lB
1on97 19 17987 20 5202 21
l l!Bb3 22
669937 23 :-----------------------------------------------------------------------------------------------------------------------------: :Gross Contribution : 1622481 : 502696 : 330344 : 2455521 : 24 :---------------------------------------------------------------------~-------------------------------------------------------: :o~~rhead Exp. !see Table 7.2: 62116 : 98526 :162415 : 42402 :353835 : 31580 l283860 : 218773 : 160604 : 138700 : 1552810 : 25
:--------:-------:-------:--------!-------:-------:-------:---------:---------:---------:---------: :Profit before Interest/tax 902711 : 26
:--------:-------:-------:--------:-------:-------:-------:---------:---------:---------:---------: : Interest 13254 l 27
:--------:-------:-------:--------:-------:-------:-------:---------:---------:---------:---------: :Profit before Tax \PBTI BU9457 : 28
Table 7.1: lnco~e Statement for reonth April

Univers
ity of
Cap
e Tow
n
OVERHEAD EXPENSES !Randi SUMMARY
Month:APRIL
Responsibility Centres
2 5 6 7 B 9 10 !1 -------- ------- ------- -------- ------- ------- ------- --------- --------- --------- ---------:
Ra~ :Hanufac-: :Materiai :Distri-!Enginee!-turing !Marke- !Person-: Finan- !Product :Product :Product : lntal:e :-bution: -ring : Admin. : -ting : -nel : -cial l6roup 1 l6roup 2 :Group ~ Total
lline : Ref.
--------------------------- -------- ------- ------- -------- ------- ------- ------- --------- --------- --------- ---------: lFixed Expenses: !Assessment Rates : Audit Fees :Bad Debts : Banr. Charges :canteen !Cleaning :Computer Expenses :Depreciation :Donations
·:Fines & Penalties :Forklift Expenses :General Expenses : Insurance !laboratory Expenses : launch Costs :Legal : Licences IMarl:eting Expenses :Merchandising Expenses :Factory Expenses :Motor Car Expenses :Postage :Power:Coal :Power: Electricity :Printing & Stationery :Property Maintenance :Protective Clothing :Profit Provision :Regional Service levies :Factory Maintenance :Research & Development :Salaries : Security :staff Costs :staff Recruitment :staff Training :sterilization :Telephone Services :Transport Vehicle Cost :Travel & Ent: local :Travel & Ent: Overse;s :Wages :water
1832
7654 213'12
1051
231 856
4453 1283
4234 9876
5B90 11541
986 313 537
12087
25217 47827
3212
876
19765 54654
56'13
14332
12433
231
47832 3414
5432
: 160675 217B
1500 8765
4213 919 15433 :123456
7124 3087 2BB14
160 4321
1021 3753
0 20613
3256
B43
3121
14532 2399 3986 1432
7645
30
1325 45324
1743 432
1345 563
6754
: 150000 3893
6654 32541
1331 6508 215
15733
196 2754
231 654
(I 0
0 0 0 (1
0 2343
B1234
2132 0
432 B7b
3215
19MS
22343
1B03B
435 234
67B46
0 0 0 0 (I
1234
1203'13
0 0
124 678
1101
•1452
4532
5292
643 27B
21927
(I
0 0 (I
0 2132
4 3(143
3241
765 876
27B4
17400
7765
11339
134 289
48932
14532 2399 39B6 1432 3256 7541 7645
2B2260
2
5
7 8
341 9 30 10
9B56 ll 1325 12
45324 l 3 4432 14
0 15 17 43 rn
16(1675 2178 1552
16615 563
16 17 18 19 20 21 22
19765 23 54654 24
6754 25 7123 26 3121 27
15000(1 3B93
52B76 5132
241166 7124
104272 215
15733 2198 9313
l20B7 5659
(I
2B0194 3414
2B 29 3(1
31 32 33 34
36 27 38 29 40 41 42 43
:---------------------------:~-------:-------:-------:--------:-------:-------:-------:---------!---------:---------:---------:
: Total 62116: 9852b :162415: 42402 :353835: 31580 :283860: 21B773: 160604: 138700: 1552810: 44
Table 7.2 Overhead Expenses for Month April

Univers
ity of
Cap
e Tow
n
154
APPENDIX E
INCOME STATEMENT - MAY PERIOD 2

Univers
ity of
Cap
e Tow
n
INCOME STATEMENT !Rand)
Honth:MAY
155
Responsibility Centres
2 ,) 5 6 7 8 9 JO
Raw :Manufac-: :MaterialiDistri-iEngineei-turing :Marl:e- :Person-:Finan- :Product :Product !Product : Intal:e i-butioni -ring : Admin. : -ting : -nel : -ciaI :Group J :Group 2 :Group 3
Jl
Total
:Line :P.ef.
--------------------------- -------- ------- ------- -------- ------- ------- ------- --------- --------- --------- ---------: :Sales volumeltonsl :Production volumeltonsl
1760 I 867 l
2171 2179 :
1357 1385 :
5288 mt:
:--------------------------- -------- ------- ------- -------- ------- ------- ------- --------- --------- --------- ---------: : Gross .f<evenue !Inventory Adjustment !Sales Returns :Promotions
lNet Revenue
!Cost of Sales: i RaH Materials :Packaging
\Railage In :Insurance :storage Pre~uims
\Total
/Gross Margin
:Variable Costs : !Commission Paid : Promoti ans :Discount allowed :Royalties Paid lRailage Out :Shipping Cost :Vehicle Hire
•:Road Transport
\Total
·' '
I
'
:
4409660 1891611 1136319 7437590 4649648 1895730 111(1770 7656148
26321 0 7321 33642 13245 0 5436 18681
--------- --------- --------- ---------4370094 ' 1891611 ' I 123562 ' 7385267 ' I ' ' J.
--------- --------- --------- ---------~
2001103 1127438 50244 I 3630982 699982 (I 72(111 771993
62345 83543 66754 212642 2341 934 3654 6929
11765 251454 0 263219
2777536 ' 1463369 644860 4885765 ' --------- --------- --------- ---------:
1592558 : 428242 I 478702 ' 2499502 ' ' ' ' --------- --------- --------- ---------:
13235 0
162625 500
72765 12765
1567 71111
334568
0
56710 (1
56710
8754 (I
150757 (I
21049 3564
980 25876
210980
21989 (I
370092 5(1(1
93814 16329 2547
96987
602258
c J
6
8 9
10 11 12
13
14
15 16 17 18 19 20 21 22
23
:-----------------------------------------------------------------------------------------------------------------------------: !Gross Contribution : 1257990 : 371532 : 267722 : 1897244 : 24 :-----------------------------------------------------------------------------------------------------------------------------: :overheads (see Table 7.4) 52894 : 92913 :152534 : 41951 l375256 : 19465 :142990 : 211597 : JS4729 : 132510 : 1376839 : 25
:--------~-~-----l-------f--------:-------l-------:-------:---------:---------:---------:---------:
:Profit before lnterestitax 52(14(15 : 26 :--------:-------:-------:--------:-------:-------:-------:---------:---------:---------:---------:
: Interest 9878 : 27 {--------:-------:-------:--------:-------:-------:-------:---------:---------:---------:---------:
!Profit before Tax 510527 : 28
Table 7.3: Income Statement for month May

Univers
ity of
Cap
e Tow
n
OVERHEAD EXPENSES !Randi
Month:MAY
156
Responsibility Cenlre5
5 6 B 9 10
Raw IHanufac-: :Material IDistri-IEngineei-turing I Marke- I Person-I Finan- :Product :Product :Product : Intal:e 1-butionl -ring : Admin. : -ting : -nel I -cial :Group l :Group 2 :Group 3
11
Total
:Li Of
: Ref.
--------------------------- -------- ------- ------- -------- ------- ------- ------- --------- --------- ·-------- ---------: :Assessment Rates /Audit Fees :Bad Debts : B;;nl: Charges :Canteen I Cleaning :computer Expenses : Depreciation I Oona lions /Fines & Penalties :Forklift Expenses :General Expenses : Insurance :Laboratory Expenses /Launch Costs :Legal :Licences :Harl:eting Expenses :Merchandising Expenses /Factory Expenses :Motor far Expenses :Postage : Power: Coal :Power: Electricity :Printing & Stationery :Property Maintenance !Protective Clothing /Profit Provision :Regional Service Levies :Factory Maintenance :Research & Development :Salaries I Security :staff Costs tStaf f Recruitment :staff Training :sterilization :Telephone Services :Transport Vehicle Cost :Travel & Ent: Local :Travel & Ent: Overseas :wages I Hater
1814
5645 20987 2323
1051 3432
167 821 872
18987 5(1985
876
2315 751 7654
4234 9876 12450
5267 10442 10875
1098 298 563 201
9765
23054 44227 43897 3414
5432
5865
341
: 187659 5134
1478 8456
3798 : 80 14569 :119065 7189 2812 26822
154 4132
654 3656
19911
2134
784
2865
14532 2399 3986 1432
7864
1654 45324
456 342
1544 654
6209
10000 4m
6654 32541
1284 6280 '
5432
205 2654
107 376
0 0 (1
0 0
2432
0 (1
0 0 (1
1254
81234 ' 120343
2132 (I
0 0
453 821
2712
16540
22343
16953
265 216
65496
b(I
632
986
80(1
4532
4869
312 245
20696
(I
0 (I
0 (I
2243
43043
324!
14532 2399 3986 1432 2134 7743 7864
6 7
279007 8 341
(I 10 "1856 11 1654 12
45324 13 5865 14
0 15 456 16 m 11
. 187659 18 5134 19
543 1223 20 834 16242 :. 21
654 22 18987 23 50985 24 6209 25
3287 7861 26
16321
7765
10127
133 267
44706
2865 21 10000 28 4743 29
44381 30 3878 3 I
234029 32 7189 ~;,
95731 34
5432 36 !BOB 37 8935 38 9765 39 4793 41}
(I 41 261987 42
3414 43 ----------------------------:--------~-------:-------:--------!-------:-------:-------:---------:---------:---------:---------: /Total (Randl 52894 : 92913 I 152534 I 41951 1375256 I 19465 I 142990 I 211597 : !54729 : 132510 : 1376839 : 44
Table 7.4: Overhead Expenses for month of May

Univers
ity of
Cap
e Tow
n
157
APPENDIX F
PRODUCTIVITY STATEMENT

Univers
ity of
Cap
e Tow
n
158
5 6 7 B 9 ----------- -------- --------- ----------- -------- --------- ------ ---------
April April : April : : Hay : Hay May : iPRODUC: Profit TOTAL OUTPUT : Current : Tons : Derivrd :: Current JEquiva. :Constant : iTIVITYJHovement JLine
:Total \lalue: :Unit PriceJTotal Value: Tons :Unit Pricellndex : JRef. ----------- -------- --------- ----------- -------- --------- ------ ---------
!Rand) --------------- ----------- -------- ---------: :----------- -------- ---------
:Product Group 1: 4767658 :Product Group 2: 2260224 : :Product Group 3: 1026207 :
1859 2564.64 : : 2616: 86•1.00 :: 1253 : 819.00 : :
4649648 1895730 : 1110770 :
'' '' '' 't '' t•
:--------------- ----------- -------- ---------::----------- -------- ---------1: :Total output 8054089: 5728: 1406.09 :: 7656148: 5445: 1406.09 :: =============== =========== ======== =========: :=========== ======== =========::
: 5431 1409. 71 --Actual Hay Month
Table 7.5: Er.tract from Productivity Statement: Total Output.
2 3 5 6 8 ----------- -------- --------- ----------- -------- --------- ------ ---------
April April : April : : Hay J Hay Hay : lPRODUCJ Profit
l 2
U1BOUR INPUT : Current : Tnns : Derivrd : : Current IEquiva. JConslunt : ITIVITYINovement :Line :Total Value: :Unit PriceJTotal Value: Tons :Unit Pricellnder. : :Ref. ----------- -------- --------- ----------- -------- --------- ------ ---------
--------------- ----------- -------- ---------: :----------- -------- ---------: :------:---------: : Salaries R241,166 5728 R42. 1(1
,, R234,029 5559 R42.10 '' 98 !R4,779): 5 1• I•
: ~!ages R280,194 572B R48.92 R261,987 5355 R48.92 '' 102 R4,363 ' 6 1• t
: Motor Cars Rl6,6!5 5728 R2.90 Rl6,242 56(11 R2.90 ll 97 !R448}: : Sta ff costs F:J04 ,272 5728 RIB. 20 R95,731 5260 R!B. 20 :: 104 R3,389 B : Staff recrui te P.215 5728 R0.04 RO 0 R0.04 •1 R204 9 '' : Staff training Rl5,733 5728 R2.75 RS,432 1975 R2.75 ,,
276 R9,524 1(1 ti
: Prat. Cloth. R3, 121 5728 R0.54 R2,B65 5306 R0.54 ,, 103 Rl02 11 •t
:canteen R3,256 5728 R0.57 ' R2, 134 3744 t R0.57 '' 145 R961 12 ,, '· I•
:--------------- ----------- -------- ---------::----------- -------- ---------: 1------ ---------: JLABOUR : R664 ,572 ' 45824 ' Rl4.50 :: R618,420 : 42650 ' Rl4.50 :: 102 ' Rl3,316 : 13 ' t ' I
:--------------- ----------- -------- ---------::----------- -------- ---------: :------ ---------:
Table 7.6: Extract from Productivity Statement: Labour input. ---------
2 5 6 8 q
: April : April : April : : May : Kay Hay I JPRODUCI Profit _ JNPUT: Current : Tons : Derivrd : : Current iEquiva. :constant : :TJVITYiMoveiaent iLrne :MATERIALS
:Total Value: :Unit Price:Total Value: Tons :Unit Price: Index : iRef.
--------------- ----------- -------- ---------: :----------- -------- ---------: :------ -----~---JR3,Bl8,54B 572B R666.65 ::R3,630,982 5447 R666.65 '' 100 : {Rj I 103) J :Raw Materials I•
R209,602 5728 R36.59 :: R212,642 581 l R36.59 ,,
94 : {813,396}: JRailage IN ti
,, t•
'' I•
R7B9,747 5728 Rl37.87 '' R771, 993 5599 Rl37.87 '' 97 : !R21, 266): :Packaging '' •t
•t '' '' ''
15 16 17 18 19
:Insurance R61547 5728 Rl.14 :: R6,929 6078: Rl.14 :: 90 (R705l: 20
:storage Premiu~: R261,454 5728 R45.64 :: R263,219: 5767: R45.64 :: 94 :rnt4,b83}: 21 :--------------- ----------- -------- ---------: :----------- -------- -----~---::------ ---------: lMAT£RIALS :R5,085,B98: 28640: Rl77.58 ::R4,885,765: 27513: Rl77.58 :1 99 :rnsJ,1541: 22 :--------------- ----------- -------- ---------::----------- -------- ---------::------ ---------:
Table 7.7: Extract from Productivity Statement: Materials Input.
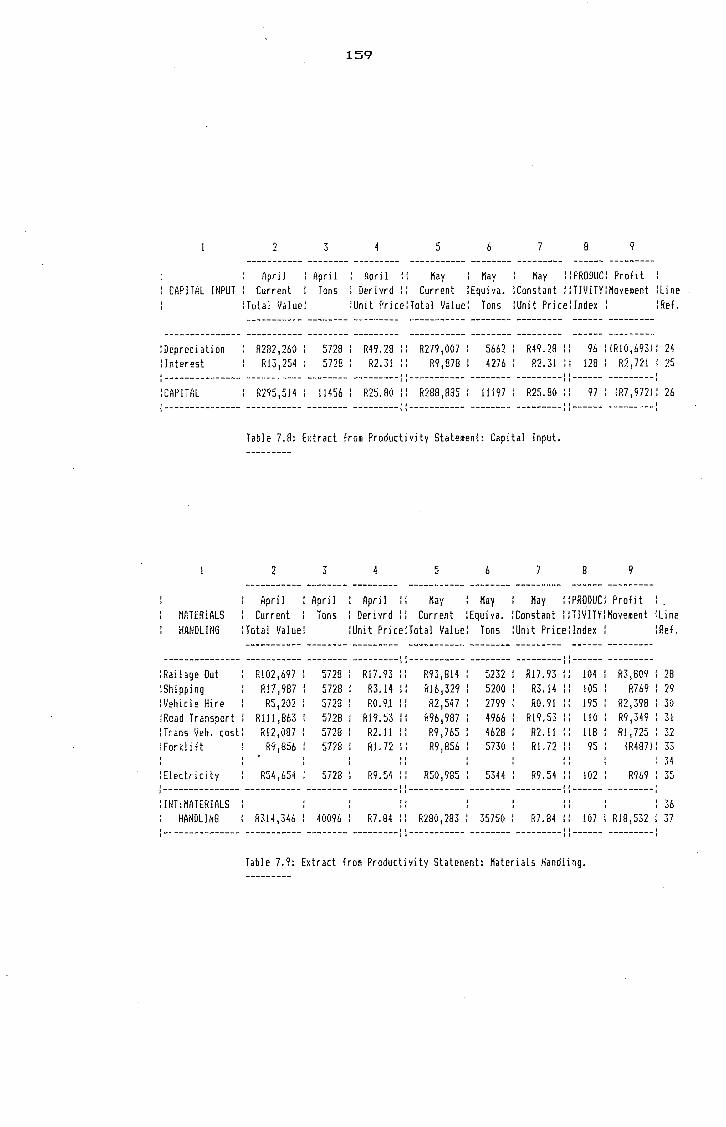
Univers
ity of
Cap
e Tow
n
CAPITAL INPUT
:Oepreci al ion : Interest
2 -----------
April (urrent
: Total Value:
R282,260 : R13,254 :
159
7 4 r 6 7 B 9 ·' J
--------- ----------- --------- ---------April April '' May Hay May : : PRODUC: Profit ,, Tons : Derivrd '' Current :Equiva. :Constant ::TIVITY:Hovement :Line ''
:Unit Price:Total Value:
5728 R49.28 :: R279,007 : 5728 : R2.3! : : R9,B7B :
Tons : Unit Price: Index ' i Ref. '
5662: R49.2B :: 96 :rn10,693l: 24 4276 i R2.31 :: 128: R2,721 : 25
:--------------- ----------- -------- ---------::----------- -------- ---------::------ ---------: : CAP ITAL R295,514 : 11456 : R25.BO : : R28B,B85 : 11197 : R25.BO i: 97 : (R7,972l: 26
----------- -------- ---------::----------- -------- ---------::------ ---------:
Table 7. B: [;:tract from Productivity Statement: Capita! Input.
~ 3 4 5 6 7 8 9 L
----------- --------- ----------- --------- ---------April April April •1 Hay Hay Hay i: PROD UC i Profit II
MATERIALS Current Tons Derivrd 11 Current :Equiva. : Constant iiTIVITYiHovement :Line 1•
HANDLING :Total Value: !Unit PriceiTotal Value: Tons :Unit Price: Index I !Ref. '
--------------- ----------- -------- ---------::----------- -------- ---------;:------ ---------:Rai!age Out R102,697 5728 Rl7.93 '' R93,814 5232 Rl7.93 'I 104 R3,B09 28 II I•
:Shipping RJ7,987 5728 R3.14 1 • Rlb,329 52(10 R3.14 •I 105 R769 29 I• II
:Vehicle Hire RS,202 5728 RO. 9,! •1 R2,547 2799 R0.91 1• 195 R2,398 30 I• II
:Road Transport Rll l ,863 5728 R19.53 '' R96,987 4966 Rl9.53 '' 110 R9,349 31 11 II
: fr ans Yeh. cost: Rl2,0B7 5728 R2. l l 1• 1• R9,765 4628 R2. ll :: 118 Rl I 725 7~
·'-'-:Forklift R9,856 5728 R!. 72 '' R9,B56 5730 R!.72 'I 95 (R487): 33 ''
,, !l II 34 ''
:Electricity R54, 654 5728 R9.54 '' R50,985 5344 R9.54 11 102 R969 35 '' '' :--------------- ----------- -------- ---------::----------- -------- ---------::------ ---------: : INT: MATER! ALS 11 11 36 ,, ''
HANDLING R314,346 : 40096 ' R7.B4 '' R2B0,2B3 ' 3575(1 ' R7.84 '' 107 : RlB,532 : 37 I II ' ' 1• :--------------- ----------- -------- ---------ll----------- -------- '' ---------I I------ ---------:
Table 7.9: Ex tr act f rorn Productivity Statement: Materials Handling. ---------
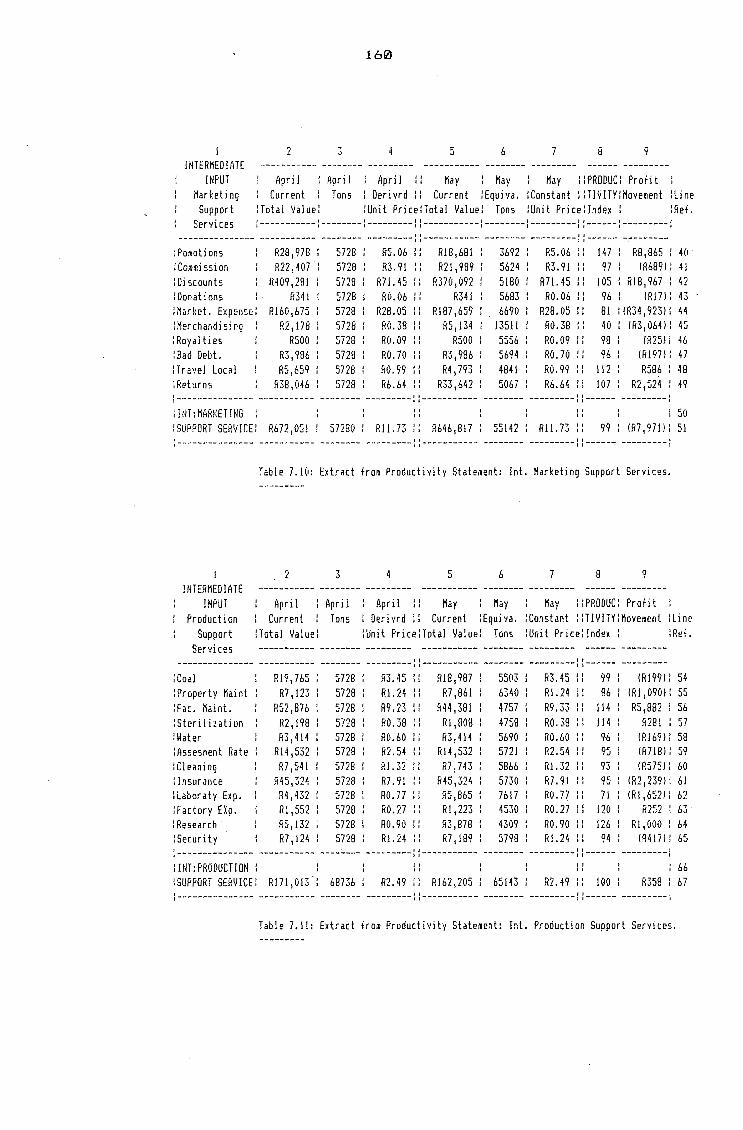
Univers
ity of
Cap
e Tow
n
2 7
·'
160
5 6 7 8
April April : April :: May : Kay Hay ::PRODUCl Profit
1 JNTERHEDIATE
INPUT Marketing Support
Services
: Current : Tons : Derivrd : : Current /Equiva. :Constant : :Til/ITY:Movement lline :Total \lalue: /Unit Price:Total Value: Tons :Unit Price/Index : /Ref. I I I I I I I II I I I----------- I --------1 ---------I I -----------1 --------1 ---------1 I------.--------- I
--------------- ----------- -------- ---------::----------- -------- ---------1:------ ---------: Pomoti ans R2B,978 5728 R5.06 I• Rl8,681 3692 P.5.06 II 147 RB,865 : 4(1 ,, •I
:Commission R22,407 572B R3.9l 11 R2l, 989 5624 R3.91 II 97 !R6B9 l : 41 II II
:Discounts 11409,281 5728 R71. 45 11 R370,092 5180 R7 I. 45 II 105 RlB,967 I 42 II 11 I
:Donations R341 5728 R0.06 II R341 5683 R0.06 11 96 !R17l: 43 II 11
: Marl: et. Er.pense: Rl60,675 5728 R28.05 II P.187,659 6690 R2B.05 II Bl : !R34, 923l: 44 11 II
: Merchandising R2, 178 5728 RO. 38 11 P.5, 134 13511 R0.38 11 40 !R3' 064) : 45 11 11
:Royalties RSOO 5728 R0.09 II R500 5556 R0.09 I• 98 !R25): 46 II II
: Bad Debt. R3,986 5720 R0.70 II R3,986 5694 R0.70 11 96 !R197l: 47 11 11
/Travel Local R5,659 5728 R0.99 II R4,793 4841 R0.99 II 112 R586 I 48 11 II I
:Returns R38,046 5728 R6.64 II R33,642 5067 R6.64 :: 107 R2,524 : •\9 11
:--------------- ----------- ~------- ---------::----------- -------- ---------::------ ---------: : ltH:HARf:ETING I 11 11 5(1 I II II
:SUPPORT SERVICE: R672,051 I 57280 I Rl 1. 73 11 R646,817 I 55142 I Rl 1. 73 11 99 I (R7' 971): 51 I I 11 I I II I
;--------------- ----------- -------- ---------: :----------- -------- ---------l : ------ ---------:
Table 7.10: Extract from Productivity Statement: Int. Marketing Support Services.
1 2 3 4 C" 6 7 B 9 J
UHERMEDIATE ----------- -------- --------- ----------- -------- --------- ------ ---------INPUT April l\pri l I .4pri 1 II Hay I Hay May : : PP.ODUC: Profit I II I
Production I Current I Tons I Derivrd 11 Current iEquiva. :constant ::TIVITYiHovement iline I I I 11
Support l Total Value: :unit Price: Total Value: Tons :Unit Price: Index I : Ref. I
Services -----~----- -------- --------- ----------- -------- --------- ------ ------------------------ ----------- -------- ---------~:----------- -------- ---------::------ ---------
:coal R19,765 5728 R3.45 R18,9B7 55(13 R3.45 11 99 (R199): 54 II
:Property Maint R7, 123 5728 RI. 24 R7,861 6340 Rl. 24 11 B6 !RI ,090): 55 11
: F ac. Ma int. R52,87b 5728 R9.23 RH,381 4757 R9.33 11 114 RS,882 I 56 II I
:sterilization R2, 198 5728 R0.38 RI ,BOB 475B R0.38 11 114 R281 I 57 11 I
:water P.3,414 5728 R0.60 R3,414 5690 R0.60 :: 96 (P.169): 58 :Assesment Rate R 14, 532 5728 R2.54 Rl4,532 5721 R2.54 II 95 (R718): 59 II
/Cleaning R7,541 572B Rl. 32 II R7,743 5866 RI. 32 11 93 (R575l : 60 II 11
: Insurance R45,324 5728 R7.9l II R45,324 5730 R7.91 11 95 (R2,239): 61 11 11
:Labor aty Exp. R4,432 5728 RO. 77 11 R5,865 7617 RO. 77 II 71 !Rl ,652): 62 01 11
:Factory EXp. RI ,552 5728 R0.27 11 RI ,223 4530 R0.27 II 120 R252 I 63 II II I
: Research · R5, 132 5728 R0.90 II R3,878 4309 R0.90 II 126 Rl ,000 : 64 II II
:security R7, 124 5728 RI. 24 11 R7, 189 5798 RI. 24 11 94 IR417l: 65 11 II
:--------------- ----------- ----~--- ---------::----------- -------- ---------::------ I ---------. :JtH: PRODUCT ION I II II 66 I 11 11
:SUPPORT SERVICE: Rl71,013 I 68736 I R2.49 II Rl62,205 I 65143 I R2.49 11 !GO I R358 I 67 I I II I I 11 I I
:--------------- ----------- 11 I I I -------- ---------1 .----------- -------- --------- l. ------ ---------I
Table 7.11: Extract from Productivity Statement: Int. Production Support Services.

Univers
ity of
Cap
e Tow
n
161
2 3 4 5 6 7 8 9 INTERMEDIATE ----------- -------- --------- ----------- -------- --------- ---------
INPUT April April April 11 Hay May Hay : iPRODUCl Profit 11
l Ad mini strati on Current Tons I ilerivrd 11 Current lEquiva. :constant : iTIVITYlMovement :Line I 11
Support : Total Value: :Unit Price:Total Value: Tons :Unit Price: Index : lRef. Services ----------- -------- --------- "·---------- -------- --------- ------ ---------
--------------- ------··---- -------- 11 ---------11----------- -------- ---------: :------ --··------:Audit Fees R2,399 5728 R0.42 11 R2,399 5712 R0.42 11 95 !Rl 19): 70 11 11
:Bank charges Rl ,432 5728 R0.25 11 Rl,432 5728 R0.25 11 95 (R71): 71 11 11
:computer E>:pens: R7,645 5728 Rl. 33 11 R7,B64 5913 Rl. 33 11 92 !R597) : 72 11 11
:Fines R30 5728 R0.01 11 RO 0 R0.01 11 R29 I 73 11 11 I
:General Rl,325 5728 R0.23 II Rl 1654 7191 R0.23 11 76 !R394) : 74 11 11
:Legai Rl, 743 5728 R0.30 11 R456 152(1 R0.30 11 358 Rl ,201 I 75 11 11 I
:Licences R432 5728 RO.OB 11 R342 4275 RO.OB 11 127 R69 I 76 11 11 I
:Postage R563 5728 R0.10 11 P.654 6540 R0.10 11 83 !Rl 19): 77 11 11
:Print & Stat. R6 1754 572B Rl.18 11 R6,209 5262 RL!B 11 103 R211 I 78 11 11 I
:F:egi on al Serv. R3,893 5728 R0.68 II R4,743 6975 R0.68 11 78 (Rl,042): 79 I; 11
:Telephone R9,3!3 572B R! .63 11 P.8,935 5482 R1.b3 11 99 (R82l: 80 11 11
:Travel o/s RO R0.00 II RO R0.00 11 81 11 11
:--------------- ----------- -------- II ---------, 1----------- -------- ---------:~------ ---------: : INT:ADNIN 11 11 82 11 11
:SUPPORT SERVICE: P.351529 I 63008 I R0.56 11 R34,688 I 61943 I R0.56 11 97 I (R9!4): B3 I I I; I I 11 I
:--------------- ----------- -------- ---------: :----------- -------- ---------: :------ ---------:
Table 7.12: Extract from Productivity Statement: Int. Admin. Support Services. ---------
2 3 4 5 6 7 8 9
TOTAL April April April : l May May Hay : l PROD UC l Profit INTERMEDIATE Current Tons
INPUT :Total Value: : Derivrd :: Current lEquiva. :constant : iTIVITYlMovement lline :Unit Price: Total Value: Tons :Unit Price: Inde>: : lRef.
11 11 ----------- -------- ---------.1----------- -------- ---------11------ ---------l!IH£RMEDIATE iRl 1192,939 l 229120 : RS.21 : :Rl,123,993 : 217407 l RS.17 l l 100 l Rl0,005 : 86 :--------------- ----------- --~----- --------~: :---------~- -------- ---------: l------ ---------:
Table 7.13: Extract from Productivity Statement: Total Intermediate Input.
2 3 4 5 6 7 8 9
April April : l May Nay May : lPIWDUCl Profit TOTAL INPUT
April Current
:Total Value: Tons l Derivrd l: Current lEquiva. :Constant : iTIVITVlMovement lline
:Unit PriceiTotal Value: Tons lUnit Price:Index : :Ref.
--------------- ----------- -------- ---------: :----------- -------- ---------::------ ---------TOTAL INPUT l R7, 238, 923 315040 R22.9B Rb 1917,063 301004 R22.98 l: 99 : !R35,B05l: BB
:=============== =========== ======== ========= =========== ======== ========= ====== ========= !PROF.PROVISION : R150,000 :
PBT P.889 1 457 l 5728 l R26.19 :: P.10,000 :
·5728 l R155.2B l: R510,527 : 382: R26.19 ::
3288 : R155.2B ::
Table 7.14: Extract froJT: Productivity Statement: Total Input.
90 91

Univers
ity of
Cap
e Tow
n
162
APPENDIX G
SALES TRENDS

Univers
ity of
Cap
e Tow
n
163
Product Group 1. Gross Sales Volume \tonnes) --------------
Product TOTAL Oct Nov Dec Jan Feb March April Hay
----- -------- -------- -------- -------- -------- -------- -------- -------- ---------A 812 680 622 656 752 84B 904 BOB 6082 B 496 630 590 630 630 B05 783 721 5285 c 144 113 112 124 139 143 !Bl 140 1096 D 71 67 54 61 70 80 83 78 564 E 10 9 6 6 8 8 9 9 65 F 3 3 3 3 4 4 4 28
I .----- -------- -------- -------- -------- -------- -------- -------- -------- ---------: : Total: 1537 I 1502 I 1387 I 148(1 : 1602 I 1888 I 1964 I 1760 I 13120 I
I I I I I I I I
Product Group 2. Gross Sales Volume (tonnes) --------------
Product TOTAL Oct Nov Dec Jan Feb Har ch April May
----- -------- -------- -------- -------- -------- -------- -------- -------- ---------G 812 569 476 530 696 886 1006 804 5780 H 595 I 960 I 9·? I 96(1 I 960 I 1568 I 1483 I 1258 I 8627 I
' I ~~ I I I I I I I
115 I 71 I 70 I B5 I 107 I 114 I 110 I 109 I 781 I I I l I I I I l I
i----- -------- -------- -------- -------- -------- -------- -------- -------- ---------: :Total: 1522 : 1601 : 1388 : 1576 : 1764 i 2567 : 2600 : 2171 : 15188 :
Product Group 3. Gross Sales Volume itonnes) --------------
Product TOTAL Oct Nov Dec Jan Feb Har ch April May
----- -------- -------- -------- -------- -------- -------- -------- -------- ---------AA 430 360 329 347 398 464 495 490 3314 AB 154 103 94 110 114 124 142 140 982 AC 133 137 129 136 1"' Jb 182 194 192 1259 AD 131 108 98 104 119 139 148 146 992 AE 115 88 93 107 124 132 131 118 909 AF 106 81 86 98 114 122 121 107 835 AG 87 75 72 76 BO 82 84 82 638 AH 54 49 47 47 50 c•
,J.) 52 50 402 Al 23 23 23 24 25 27 30 30 205
:----- -------- -------- -------- -------- -------- -------- -------- -------- ---------: :Total: 1233 I 1024 I 972 I 1049 I 1181 I 1325 I 1396 I 1357 I 9536 l
I I I I l I I I I
----- -------- -------- -------- -------- -------- -------- -------- -------- ---------

Univers
ity of
Cap
e Tow
n
•
•
164
APPENDIX H
EFFICIENCY REPORTS
- DAILY
- l>JEEl<LY
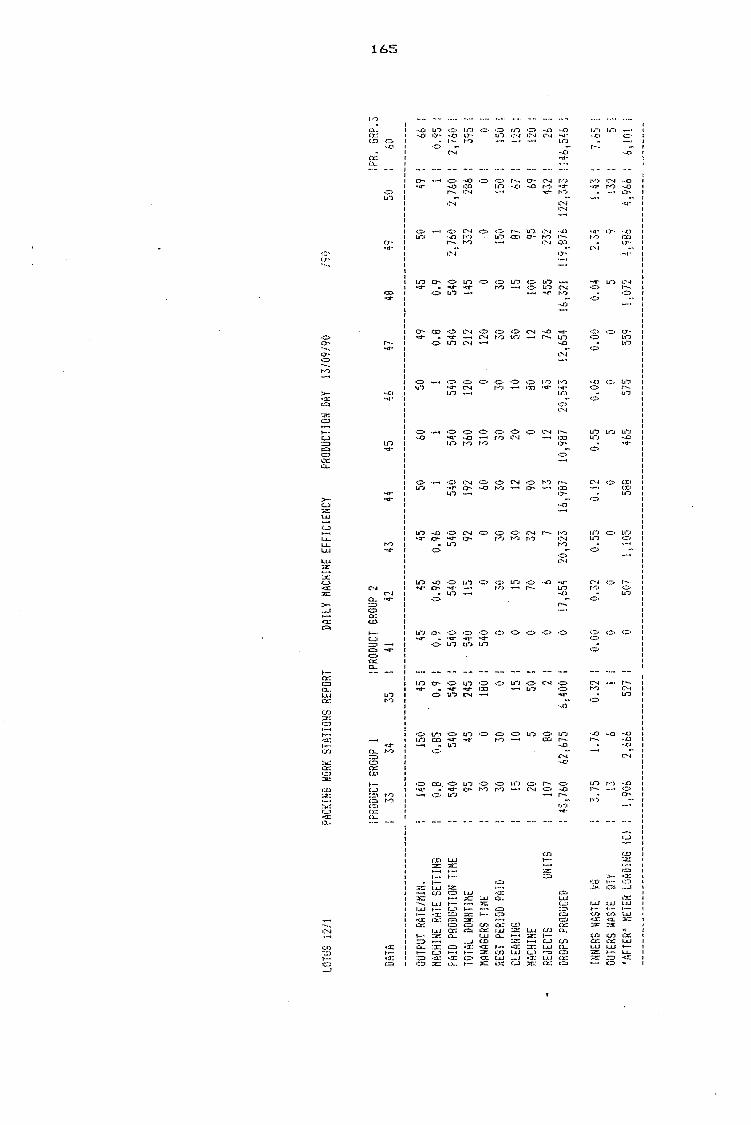
Univers
ity of
Cap
e Tow
n LO
TUS
12i1
PA
CKiH
6 WO
RK S
TATi
DHS
REPO
RT
DAIL
Y MA
CHHi
E EF
FICI
ENCY
iPROD
UCT
GROU
P 1
lPROD
UCT
6ROU
P 2
DATA
"'
T"'
T
..,.
,.
.).)
.)
't
OUTP
UT R
ATE/M
IN.
' 14
0 15
0 I
MACH
INE R
ATE
SETT
ING
' O.
B (i.
85
I
PAID
PRO
DUCT
ION
TIME
I 54
0 54
0 I
TOTA
L DO
WNTIH
E i
9r:: .!
45
MA NA
BERS
Tl M
E I
30
(l I
REST
PER
IOD
PAID
!
30
. .)V
I
~· ~·"!"<;
' 15
[(
) L
LtH
fi ...
fi._,
I
MAC
HrnE
I.
20
5 I
REJE
CTS
UHiTS
I
107
80
I
DROP
S PR
ODUC
ED
; 45
,760
62
,675
HiNE
RS li
ASTE
k8
J
3. 7
5 !.
76
J
OUTE
RS N
ASiE
QTY
! 13
6
!
~AFTER!
HETE
R LO
ADIN
G iC
) l
! ! '
f\}b
2,
666
""''
,\J 4r
'
J '
0.9
: 54
0 l
245
: 18
0 :
0 :
15
: 50
!
·i
' I.
;
6,40
0 :
0.32
:
i i
527
l
41
42
43
44
45
45
'C"
~.!
50
0.9
0.96
0
.%
1 54
0 54
0 54
0 54
0 54
0 11
5 92
19
2 54
0 (!
0 6(1
0 30
30
30
0
15
30
12
" 70
32
90
0
6 7
13
0 17
,654
20
,323
i6
,%7
o. !)
(;
0.32
0.
55
0. 1
2 0
(i !)
(i
(i 50
7 1,
105
58B
PRDD
UCTiG
f.i D1
W 13
/09/
90
45
46
47
48
6(l
50
49
45
1 1
0.8
0.9
540
540
540
540
360
120
212
145
310
0 12
0 0
30
30
30
30
20
10
:'.,!U
IC
" l.
J
(i 80
i2
i(
i(i
12
43
76
.H:~
•.J.
J
10,9
87
20~5
43
12,6
54
i6,3
2i
0.55
0.
06
0.00
0.
04
5 0
0 5
465
575
559
1,07
2
49 50
1 2,
760
332 0
150 87
95
232
1!9
.876
2.34
'1 4!
986
lPR.
GR
P.3
50
O\J
49
: 66
:
1 i
0.95
:
2,76
0 :
2,76
0 l
286
: 39
5 i
(l :
(! i
150
! 15
0 ~
'~
I 0
/ I
!25
69
: 12
0 :
432
: 26
i
i22s
343
l146
~546
l
1. 4
3 ;
7.65
i
i32
: ~
! .J
!
4i96
6 :
6!10
1 :
lo""
0- UI

Univers
ity of
Cap
e Tow
n
cOiil
S 12
11
WOR
i: ST
ATIO
N RE
F.
33
A.
~RO?S
lO!A
L CA
PACl
lY
AVAI
LABL
E ;o
,~so
i(il
fil
CAr1
iCiiY
UT
Ill
lEO
lS
,053
iO
iAL
CAPf
1Cll'I
IG
AIH
l/LO
SS:
!l,9
2i
OPER
ATOR
S CA
?A'Y
AV
AiLA
BLE!
:.i
,120
OP
ERAT
ORS
CAPA
'Y U
i!L!Z
E&
: ~5
,&53
OP£R
~TOR
S LO
SSES
: ~
14b
!
B.
CA?~
Ciii
' LO
SSES
XHNH
GER
SCtE
UDL!
J.IG
~ORK
ST
1\TI
OH
:REJ
ECTS
RE
ST
ClEA
!iillG
MA
CHI H
E UH
fltCLA
RED
!:.
l'i1Cl
:nG I
llG L
OSSE
S
!N!IE
RS L
OST
OU!E
R U
!iiiS
5:.)
bQ
107
3,36
0
16S
(i , 2
40
:081
)
! l2 13
PACK
illG
~ilR
i:
5il:i
!OllS
REP
ORi:
31
681B5
ij 62
,595
o.2
ss
68,0
5(1
b2 ,5
95
b, 2
55 ac1
3,82
5 1,
275
63&
i53 53
55
2! ,8
10
6139
B !$
102
H,5
60
;,:.
98
9 1
!S2
q
2119
71.i ,1
21,0
71)
\2
23,3
29
1; 1 c~a
5,bB
Q
{Q)
23,3
20
!) ,e
lB
5 10S
O
i 129
(! 21
,97(
1 2 (1
&08
2 ~ ;)
25
5:54
8 1(1:
I:
1,2%
6·
i8
3102
~
7lib
1(1
DA IL
Y K
ACH
!HE
EFF
IC I E
HCY
,,
23,3
28
20,l
lb
3,01
2
23,3
28
'2(1
,316
JI
012
l 129
0 ! i
2116
1,
382
(969
1
lb
\I
27 ,O
(lO
lo,9
74
10, (
•2b
21,0
00
lb,9
74
7,0'.?
0
3 1(10
0 13
1,50
0 60
(1 ~ ,so
o ~
13
45
32,1
00
10,9
)5
21, 1
25
13,8
00
10,9
75
2,82
5
JS,b
OO
!2
I ,
BOO
l 12iJ
IJ 0 11
871
10
lb
2) ,o
oo
21),5
00
b, 5
00
2i ,o
oo
20,S
M
0150
(1 (1 43
l: 5
00
5\IO
\ ,00
0 15
7
PROD
UCT
I OH
DA'i
!3i 0
9/90
17
21, 1
68
12,5
78
8 159
0
!01\M
12
,578
3,
686
4 I 7(1~ ib
! , 1
70
l, 9b
(J U
(I
2tH
18
21,9
70
I5,B
66
b,00
1
21,2
70
t51eo
o 0,
001
4::
.JJ
1 1
·=
• 1
-IJ
oOB
4,1)5
(1
~32H
19
2J 1(
J!j(I
21,2
bl
5,n
;
27 ,o
oo
21,2
&4
5, 7
30
57
l ,Sl
;C
75(1
j 12
50
1, i7
9 ;c•
5l)
2~ l ~6(1
2213
63
I ,Q
q)
;,l
531B5
S 27
, 966
~.o"
2:1H
O
~ 33
1BS
S 22
,30}
:
17,%
b ~
10~'7
: s 1
en
Si
H
; I~ j
l}
i I B
S\
392
: l :
5.:;
t I ~
2i
l : 25
~
: ,02
: : 1
i i6
!C: 0
: ; ;
; ;:;
==
;; =
==; ;
:: ; :
:::::
=; ::
::::::
: :;;
; :;:;
; ===
===
::::: ;
=:;
;; ==
=== =
= : ::
:::: =
;; :::
:;::::
::::::
::::::
::; =
=;;;
====
=: =
==: =
====
===:
=:;
== =
=: =
= ==
= =
=;: ==
===::
: ;::::
: ::: :::
=== =
== =
=::;
= :::
::: :::
:::::: :::
=-=::
: =::
~ :: ::
: ::::::
: :: =
= ;
~.
uROP
S PE
RCEN
TAGE
S
iOiA
L CA
?ACi
iY
AYAi
LAEL
E ;Q
TAL
GriC
iE!iC
Y
iOiA
L C~
?ACi
i'i
LOSS
100.0(1~
75. ~
BZ
2~.
527.
ilPER
ATOR
S C
AP1
n AV
t.ILA
BLE!
1(
10.Q
Ql
OPER
1\TOR
S ff
f i C
i EHC
Y OP
ERAT
ORS
LOSS
ES
E.
LOSS
ES P
ERCE
Mi A
GES
~iii
!AGE
R SC
HEDU
LI llG
W
OR•
Sift
i iGH
: RE
JECT
S RE
ST
CLEA
HIHG
KA
CHIN
E iiH
i!ECL
ARED
!HHE
P.S L
OS i
OUTE
R UN
I TS
79. 9
2'i.
2fJ.0
81.
5. 56
1 o.
m
S.B
8l
2. 9~l
H2
l 7
.in
0.2
H
0. o
Sl
i00.
0(14
90
.92!
9.
oax
10(1
.•)0l
90
. 92!
~.
(JB~
0. 0
(1!
0.12
! s.
56!
I. 8
5!
o.rn
o.
ou
O.o
Bl
(L 1
3r
h)(1
,(1(
1l
100.(
IOX
100.
00l
l•lO
.OO
i. 10
0.00
Z !0
0.0·
ll
i00.
001
100.
00l
iOO.
OO!
19. 2
sz
o. t)
(1I
75. o
sz
s1. 0
111
62. a
n
.n. a
n 1s
. ni
59. 4
2!
n. s
s1
iv.i
Sl
100.
UO
I 2
L\S
l 12
.91l
3
7.m
b
b.r
n
21.0
71.
10.S
Bl
2;.
m
hX1.
oo;:
tOV
.O(ll
13
. 88!
\\.
00]
56.1
21
O.tl
OI
l3.3
Jl:
100.
00X
0.
017.
: 0.
00!
o.oo
i: o.G
VZ
1. m
: <1
.001
13.8
9!:
0.00
! ~a.o5x:
o. oo
z
9. i
5x:
o.m
: ER
R ER
P.
!00
.00
l 10
0. O
Ol
75.o
>l
a1.o
n 2
US
X
12
.91
l
0. oo
x 0.
03Z
5.
SOi
: 2.
7BI
!2.%
1 J.
.034
0.05
! o.
on
o. 0
0!
o.m
5.
Sol
5.
Sb!
5.
93I
-l. lt
l
o.oa
i \\
001.
1M.0
0l
70. 7
3I
29 .2
81.
11.1
1'
O.O
Sl
b.25
! 2.
50!
18. 7
51
i.m
0.02
' 0.
001
100.
00!
lOO
.OO
l !0
0.00
l 10
0.00
! 79
.53!
75
.93!
76
.IOI
72.5
51
20.~n
2~.on
n.o
oi
27.4
51
s1.m
o.
on
13.0
ll
B. 7
0!
O.OO
l -i
.361
0.15
! I .
OB
l
0. O
Ol
O. l
bl
s. 5b
1 I.
BS
! 1
;,m
l.
09
'
22.m
0.
001
O. l
bl
2. O
Bl
1.m
s.
m
! I. 9
0!
2. 7
8!
2.8b
l: IE
.52!
1
.2n
-1
.m
O.O
il 0.
001
0.01
! •)
.Ill
o.o
o;:
o.oo
i
100.
oor
iB. 7
61
21.2
'1
!i!O
.Ml
7B. 7
&!
21. 2
<!
O.O(
lr 0.
21!
5.56
1 2.
m
1.m
B
.Oil
o.r1s
r I.
li!
iiJ\i.
t'.·~
1! i l.
i(l, (
l\)~
3~.
52'!.
82. b
Oi:
! 5. ~
BL
i 7. ~
(I!
!00.
•iOr
IVV.
V(li;
>1
.m
ai.o
oi
iS.4
21.
!?.H
1l
o. 00
! o.
m
5. 5
61
L ~Si
:
~. 2
6!:
3.%
!:
o. oo
x:
0.01
7.:
5. 50~
\.03X
3.
iO<
J..4
7!
·J.on
: o.v
01:
l.>JI
Z:
~i.0
1.H:
:::; ::.
: :; :;
=::: =
;; ==
::::.:::
:: ===
= = = =::
: =:: =
= = =:
: = = ==
= = = ==
= ==
:; =:; =
: ==:
::; =
=:;::
= =:
:;; :;
:; ==
= = = = :
:::: =
= = = =:
; = = ==
===:
; == =
== =:
: = :::
:: =:
=:: =
= =::::
::: =
= = =
;:;.
== =
=;;
=:; ==
:: ::::
:::;
:: :: :::
:: =
= =: ;:
:; =::
=::;;
=:: =
= = =;
,....
a- 0'-
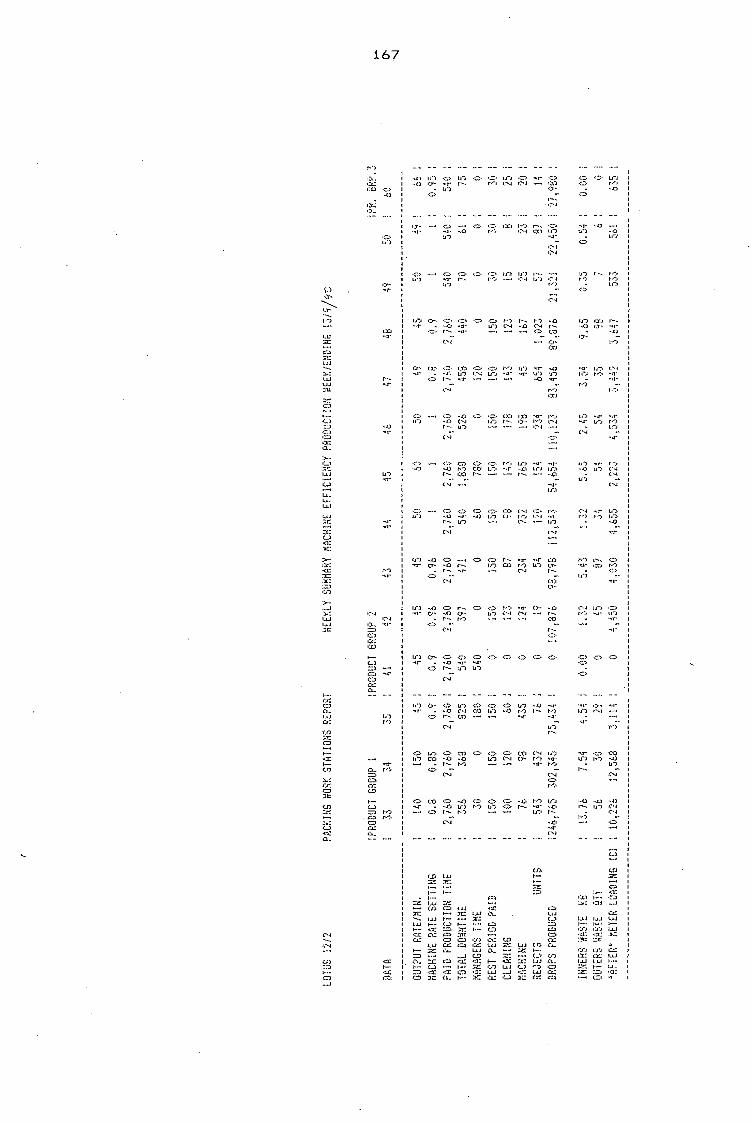
Univers
ity of
Cap
e Tow
n
\.)
"' > ;:::;
,~-::.
::t: l • ..t.I ··-::...:: 1.J.J IJJ :111. :;:: 1::-.:1
w
'-', ..... 1...LI
l·•<l: ,_ c.n
167
1:L, 1:i:: CJ) .:::. ..
1:-.C: •::t-.
,_ '-' ::::1
... o
.~.:::. ... J-1::. '"' '"-
l·-1:.J =J , ..... )
, 1:::. r<• ·=· 1'.:l.: 1.·.l-
··U IJ") •.• () 1:;r. :~f: :~~~
IJ·:1
.::,:. .:,:;. .;-;;. 1:C1 , •• ~:. ,.... .. ·::..;.
... ~- ... o r.-:. 1:-··.c i::c1 ll-J Ii") '"".:t"
~~ ;:?:: •:::;. ;::.::: In :~::; ::~~ 1; .... 4 IJ";I r~·:•
tJ-J O""- ·=:::· ·::> ·~"::. .:::.;. r~·:· r..... 1·<• .. ,o ···1"" ··-0 -u-- Ll-:t ('4 -.o t."-t r-
•::::· r-.... •rt· •:::. c:o ('-l r,:r ..
("O
~~~ ;;~ C• ;7) ~!~ ~=~ ~~: ~:::-~ r-·· 1.1'":> 1: ..... 1
(" ... , ·:::·
•::.;. i::o •::::• r<• IJ") -·J· ...... .. .()to') (;('J IJ-==• •,(;I 10 1,-;1 r-. 1:.-c1 r·- r..... ··.O
<''·' _... -..-IJ";I
.:::;.. ·:::. .. -::::· .:::· •::O 1>-1 ·:::> r··:· ·..() •1t· .. .(;1 IJ? ()• t•") 1;'•-l ••1" !"•· I.I) '·°"'-' IJ')
IJ-:1 .. .() .:::;, .. - .. ·~.r •:r- .. o r-.
r-. •11-
·=:::·
IJ"l -.o ·:::::· r·-.. -:::-~ .:-_::. 1·<· •rt· o·- .. .c-, "•1" I:'/" •.Q ()-· JJ-:1 1:--1 ('I r-.
r·- t·-:• 1:0
~I r~.
·:::·
~ ~~~ ~ .::.-. •:::· -=::::· ·=-=- ·:::· •::::· ,._ 1..-J l.1-.i
IJ') ,:_., •• :::;. l.1") "IJ° •·/_1 1:-•J
·::::· 1-. i::t:1
1:---J
·::::< 1.1·;1 ··.() ... r .,,_:i ,....... , ... ~ , .... ..
... ,.. "l:f·•
·==· i'.1l ~~ t~ ~;~ ~~,;. .. ~- r-......
('.j .;:,. 1·-";1
~ •:X-J :~ ii~~ ~~; ~~~ :~; ~~ I"·'°) IJ'? "\:I" •.Cl 1.1·:1 r-. ·::> , ... _ l"""J
1:.r:.1 l..1.J :z r: , __ 1--
1 , __ _
I ::c: 1..U Z I 1:r.i •=• l ?.:~ l.LJ ,. __
: ::~ :a: ?i: I •.:J: C:: 1:::1 I 1:;£; 1::l I I.LI a:: I I··-.% 1:",1... I ::::i ·-' ::c: 1::.l (:i.: 1, 1::i .. I L·-· I :::'J I 1:::,i
1:..:i t-· ·a: •::1: (.":) )t: o .• ~--
1.1-J r·"'.o r.-;, 1·-·:•
1.1·:i ·::::·
IA'? (,Y.;1 .. .() (.)'• "•1"
·.0 I~, ..
.. u- 11") 1:·-~ ,,-,, r-":• "11· .. ,,. I'·")
1.1-:1 "•1" ..... '"-'" 11·:i r,·>
Li")
l.f":• • .,,. r·"J •-.t,:1 11-:1 C•I
i:.•·.j l.l"J
.; ... J ... ,- l.1-:1 , .... ;. , ... :. l.1?
·-.(.l
('"~ 1.1-:1 .;:::. r<• ... ,. 11-.1 .. ,,..
·:::=- .;:;:. -::::· ·=:> ·:::>
I .. ,,. 1:;1-. I l.i'''.I (''-/ I
I "'J" •• I
1-.•) I I I I I
~J~ ;~; ~ : O"J I
1-.... - I N
... o ··.(.°J -..() 1-. IJ-:1 1:-·~
1:-•.1 1"":0
1::::. ·•:1.:
~=~ ::i; ~3 1:.r.::
l..i.J l.J.I LJ...J 1---· ,_ .. l·-1:n 1:.rJ 1 ..... 1 ·::J: .:!):: ;!!:..:; ::t~:: ::a:
0 1:r,t 1:ri t.".c: 1:-.i: .:>:: 1.,LJ 1-LJ u.1 t·-
~J. ~.; ~~= 1::::1 ....

Univers
ity of
Cap
e Tow
n
168
I
- - - - - - - -- ··- - - - - - - - - -- - - - -- -~ D ~ N = N 0 -~ - ~ n . - N - - -~ . g - = - g N M -n -m =
~ ~ ~ ~ N - N 0 -N N . -- a ~ - 0 n -D 0 -~ n D ~ n = n N - -- -- ·• . m ~ ~ ~ 0 0 ~ 0 ~ . = w ~ N N . - - - - - - -- - - - - - - - - - - - - --- -D - a - = N ~ -~ ~ N g - a 0 -- 0 - --= N -- N - N m - ~ D - -- ~ m = -- - '" .
~ ~ - ~ - - . = g ~ ~ g ~ c 0 ~ N N ~ 0 ~ -~ -~ -- . = ' . ' c - 0 - 0 = D D -. --~ - a - --- M N - ~ = ~ 0 0 0 --m c ·• 00 0 ~ g ~ a ~ ~ N . a - 0 ~ - p a - = ~ - ~ ~ - ~ . 0 ~
~ ~ m m m . ¢ ~ 0 -- 0 ~ --- - = w s w - ·- . -,,, = -- = - a -~ - = a ~ - -- 0 N -- n ~ N - ~ - 0 -n -n N = ~ N - m ~ - a n 0 0 - a - --m - Q . ~ -- - 0 . 0
?. ~ ~ 0 ~ 0 0 c ~ ~ ~ 0 N 00 N m N - - " x . = N m N = N " = - - " " z . - ~ - - -" ~
N N a ~ N 0 - N . ~ . 0 - -- ~ - --.
~ m 0 ~ - . 0 -N ~ -N ~ 0 - m 0 w 0 00 ~ -. D n a 0 - - ~ -~ ~ 0
~ 00 M m ~ ·• = ~ " ~ ~ ~ ~ 0 ~ " w - . = 0 n ~ = - . x m N n -N 0 - . 0 00
a 00 N ~ -N . ~ . 0 . - - N - --0 ~ 0 . 0 a 0 0 -
. ~ M -~ . " u - . - 0 a - 0 m g m = -= n ~ . 0 -M 0 -- 0 a
~ 0 - - m - n . - i ~ = 0 d ~ ~ 0 m m - .
~ Q - -m - N N
= -= N -0 N . ~ . u .
N -~ 0 a = 0 0
. ~ -N - - -~ g c ~ ~
a = - - = - = - -,,, N - -u ~ = 0 u = - 0 -a -n 0 ~ = a w N ~ N ~ -~ ~ ~ n m 0 ~ -. . ~ - ~ . ~ -= --c a N
~ ~ -~ ~ 0 ~ ~ . -- ~ N
'" - . = 0 M a - 0 D 0 D = ,,, - . -- 0 m N --,,, - -~ M
. g ~ - -~
= N n 0 N a N = a 0 n ,,, . a N 0 n -~ 0 - 0 - = ~ 0 n ~ - . a 00 g -- ~ 0 ~ M ~ = 0 " -N ~ ~ N N M -- . Q m m
M N N ·- - . . . m
. - N - -c N m N - = 0 m - N - = N m = N m D ~ -~ m . ~ - ~
~ m --m ~ ~ a - -m . 0 m 0 - 0 a - 0
~ N N - ~ " ~ ~ g 0 ~ 0 m ; . 0 N 0 - m c N " -m 0 m 2 --~ " 0 - -~ N ~ .
~ ~ . -~
N ~ N ~ 0 . 0 - ~ ~ 0 = 0 - N -- -~ n . n g - - n ·~ m n - - . 0 n 0 0 m 0 0 .
~ N N m - N m M ~ -- . g g ~ g 0 ~ 0 0 ~ - -. 0
- ~ ~ - n ~ ~ . ~ . ~ = - " . . . --- --- --- - " 0 0 0 0 0 a 0 0 0 0 0 0 I
Q a 0 D c 0 0 g 0 0 0 ~ ~
m 00 ~ ~ - 0 0 0 0 0 0 n 0 0 0 = = =
~ ~ - g 0 g 0 0 g ~ 0 0 0 0 g ~ w
" ~ . ~ 0
00 N
~ - -- - - - - -- - - - - - - - - - - - - - -- - . ~ . - - ---- - " ~
~ m N 0
~ N 0 - n a 00
M ~ ~ " a N 00 0 N ~ N - ro --m m -~
~ n N ~ - . --- - . 0 ~ D 00 n 0 M ~ -w - N 0 -- . g ~ c ~ ~ 0 ~ -N ~ - . N 0 0 ~ - n - ~ N N . - ~ N
~ ~ - ~ N .
" .
~ -N - - -- N ~ 0
. a
N
·-· 0 - 0 - N n ~ ~ ~ n ~ a 0 0 0 0 ~ 0 N M ~ ~ ~
~
~ 0 ~ ~ = - N -,,, N a w N Q m 0 M ~ ~ 0 . ~ -
~ ~ . - N g ~ ~ n a 0 ~ --= ~ ~
M n 0 ~
~ a ~ ~ n N N - ~ m
= -- - " ~ " - = N m a ~ -a = N 0 - -n n Q - -~ --~ - N N =
~ N - -~ = ~ ~ - ~ n a - 0 ~ 0 - - ~
~ M
N n -N -i - g g . 0 ~ ~ ~ - = 0 M ~ -~ ~ -~ ~ - m 0 N ~ 0
N = ~ ~ ~
- ~ ,,,
~.
~ .. ,
'·'' ~ ~ ....
= ~ = ~ c
~ ~ w w - ~ w ~ 0 5 ~ w m ~ ~ « uo w m
~ - ~ ~ i ~ w ~
~ ~ w - z w -~
~ ~ w w z ~ - ~ u
~ w ~ ~
- - ~ w w uo
~ « x w ~ z u
> ~ w ~
"' ~ ~ ~
~ 0
~ w w =
'" w « ~ w m - ~ ~ - w w u - - ~ w w -w 0 ~ ~ ~ - ~
~ ~ « Ll l•.I
~ ~ ~ w ~ ~ -- ~ ~ ~ --w = ~ w = - = m w ~ - ~ -L ~
~ ~ w ~ w -~ ~ = z 0 w ~ - 0
~ = w ~
~ w w -w
0 w ~ - w w u ~ m w - w ~ w x 0
~ --- -w - u ~ ·~
~ - - ~ w ~ -- 0 c ~ = ~
~ ~ - c ~ - ~ --- ~
~ ~ - ~
'" ~ = ~ -N ~ ~ w = ~ n.
~ ~ w ~ = ~ = - w ~ =
~ -~ - w ~ ~
~ - - m ~ ~
w ~ c - = - w
~ ~ - = -~ - m
ill - ~ c - ~
~ w w m ~ w "' = ~ ~
d. 0 ~ ~ ~ ~ -0 w ~ ~ 0 0 L ~ ,,, - ~ z ~ m ~ 0 a = ~ ~ 0 - - 0 0 ~ 0
~

Univers
ity of
Cap
e Tow
n
169
APPENDIX I
EFFECTIVENESS REPORT
- WEEl<LY ONLY

Univers
ity of
Cap
e Tow
n •
I
.......
.:..,··· ··-·"
.:.1-:1 i:.1-:1 W.J ::c: LJ.J ::; ... t-··-· 1:..:.i
"' '-'-IJ •. 1 •• 1,J
i.-·"
I.fl ::.'l _,_,
.~~~
····-=·
Cl::: 1:) ...
LJ, .. LJJ 1.')::
f I I f I f I
' I I I f I I
' I-·- I ·:<~C I t-·• I 1:.r-:1 (_!::1
~)~~ ~!'~
~~ ~~~ u .. I
i~:::
1 7121
-· . - . .::::· .. -.-1. (::~ Cl"·
I u·-:1 ...... • 1.r-.1 1 r-... r-... I .;::;:. .:;:::. I
•· I ··J:J -.l;"J I
l•') r::'!• Ji') r·-· -.1:> -::::• t<• t--..
... ··:1
-:::-.. c·..J c·-1
<:::.· .:;:::· -::::-:5~: :?~ ,.~~
f I
' I I I I
;:~ ;:~~: ;~~: "':r· o··· 1J·:1
O··· IJ·-.1 ··J:'J ··A;') r···:, . .,I) .. i:1· •<· ('I)
If') (1···
:~(j :.;::~; :.:::~
6::i 0'" 1·-··:.
1·-.•• 1.i-:1 o··· r--. 1·<• J.f'J 0"• !'.''•.I 1:" .. I
r··- 1.c:1 1>-1 li':1 I"··-=· 1>.I ··.r,J .... ;:i ·::.-:·
CJ·- O'.l 1::i-· r .. -.1 ··J:t -:::;. r.J·-
(I .. · •,J;) t·<• g; g~~ •::;;.
t'--' o::i tr.1 ":-.r u·-; r.:1;:1 r ..... ·r:;r- i:-·.J
r-... u-~ 1:--1 l.1°') 1>J 1·.-·.1 r--. •.-:::· r--
.-1-• .t ,_.., I .• + . .t ·--• (jJ 1'(.l I QJ l'IJ i:::r• ::::; :;;~ I r.::n ::;; :;;i:: "'- -\.··' I L-r'l,1 LJ ,..,_ I fL1 1..J • ._
1-··,.. •r.:r.. O;".i t-··- r--·- ·•:'.C: i::S:"J i:rJ Co)
er.:
i::;::
3 ::r.:: i:. . .:1 <r: ::n:::
NJ;:1 .:·· ... "t:I" 0" S:"•J
0'" i::i::•
"~:"' .. ~,-i:;i'... 1;:1"
1>1 ·:::::· i:- .. 1 i:·-..r l'."··l r··-:• t··-:1
1:"~ .:::::- 1>.t u-.i Ll"'.I O·· L')-·
IJ.'J •::::• ();:1 o::i t:l:'J 1:0 r.J:i
('···I<'.'.:• (".,I ,.... .. ... (;() L'))
·::::· • ...... ·::::·
(,) ..... .r;:i , ... -J
t··-:· t·"":J Li'-> IJ-J
o:i ·::::;. i:b ,...... t·"? ~::.-
.............. (IJ •TJ i;::i·· :::.1 ::r:i;: lo ... ..,.,,I
,.'.:~ ·::~C! r.0
f I I I f I I I I I f I
1:.r:i o::: Ll.J :;w:: ;;;::::
1·<· t"".• r-... r-... I.I") l.f';1
1·.·-) o,J:'.J ,. .....
1· ... c··.i "i:r'
1.r-:1 .. .1~1 o··· ·.1:·1 l·"'.i 1.·· . .r J,f'.I '":1•
"::I" 0) .:::::· o· .. ("-.!
L)-- c· .. 1 /'•,., i:;1-. ~r.r 1..-·:i l.1":1 l..i'~1
t<• •:::::· t···:· O;'J 1··":0 µ·:1 -·l:"J ... 1~1
L(') .:;;;. l.r'":I 0- •1::1- IJ-J lf') Ii')
1..1··:1 1:;i• .. l.1 .. :1 Li'') i'.'".t c·..s 1.1··.1 l("J
Jr:.:.·:.: •• · ~~s ~=::
1:".,j
1:);'J 0"'· 0-· 1·---:· ....... l.l'".1 1·-... ll"'J
I
::i ~ ~:~ l .. I
f I I
f I I I I
.+.-' ,....., I CIJ "11 I C;.T• ::J ::?i!'.: I lo •• -1>.J I •'I) l.J "•-. I
,_..~ •!!'.C ~J::i I I
(r)
C.t::: 1..1,J ,_ ... ;:~ 1 .. 1.J
~~f ,. ..... U) .-.::1: :!ii::
II II -.1;:1 II 1;"..f 0;'.l ··J~1 11
II ··.t) 0"· /·.-·::. II II o::i o-· It II II II 1'"·- .. J;i II II (".., C"-1 II II II
fl II II
r·"'.I o:i IJ":t 11 o::i ·-J:i o::i 11 II r···;i ... r;:i C'-.1 11 II l.1'':1 (··J I'"·• II II II II •:::> 0:'.I 1·-... II II II II II
fl II II
,.,. .. , Ii (;l"- II ll 1>.1 (:i::1 1.t''J II 11 11''.I .1:1 II II II
:: 0"· :~=:~ (.".J ::
II II ff
II II •:::::• ~::1· "r.1- 11 ... (.I 11") 11
u~:i "i:r· 11 r·'"J !'."•\ 11 II .:;;;. O;:t t:"·.I II II -· 11 II 0;;1 ,,..) C·.f 11 II II II II
fl II II
r·":• -· 1"··:1 : : '.~~~ r;>' :?'.~ : : t I ~:~:; 1.f';1 11 II 11 II r:··.i II II lt II II
II II II
.. 1;) 11 0"· C'--1 fl
:: :~'.:: ::.::~ .:::::. : : II II II .:::;. IJ") l.f'') II 11 4>1 II II II
fl II II
• . ..:r· II I'•") ;.-·:• II It t"':• 1::-~ ... J) II II IJ°':I 0::1 ... 1:) 11 II II 11 r--:i r·":• o·- 11 II ('"-l II II II
fl -.J;) .:;;:• ···O II
fl fl If fl II If
If fl
C:.~ ("·.I O.:.'f II
;~:~ :;~~ 1-.-:, :: II
·..1::1 -<::i"" 11 ff II fl
II II lf') •::::• IJ'':t II ("·.I (.1--· ti
II ("·.I ·•::t- l"·· II II .. .1:1 1.1'·:1 .;:::• 11 II -· II 11 1;;1;i •:::::- 0;) 11 II 11 II II
II II 11
II I'<• • t•") II II II II o:i ·:::::· i::o II II It II II
:: ;~:'.'. ... ··.·-~.·~.· 1,;::) ::~
·==:~ ·:::::· ·::.-:· :: 1r.1 ·::::· u·1 ::~ 11 ,. .. ._ I"··· II"" II •::::• •::.":. ti II .... II II .. .i;:i ~J:;I II II II II II ""-0
II~"-
·J:'J :: 0'" iJ'':t I.(') :: :;j-:: '.~:; :~;~ ::;-t; :: C'r') ~ ti II ........... 11 1-.··,, 11 II II II tl~C
II ~ "'-.
o·~ o··· 1:1-.. : : u·-:1 r··-:· : : "'-~-·-=· 1:):: L1") II -.J:t •::> .. ,) 11 ~ ......
:: 1.1-J •-.() 0'- :: ~ 11 1;:1-. 1::1 ... O-· tr II tJ':i "!:I" II
:: ::~ IJ°') !;~~ l."l;) :: :::;~'. 1::0 ~:'.~ :: ~
11 °::::1 t;)'" : : '-l)~
-t-.t .... .... Q.I ... , (:)"• ::.1 I., __ ,.._.
fCI t.I I'-·- ·:::i:
II II II IJ._J 1:"·~ C··~ 1 l 11 I.I'') I.(~) 11 II I!
fl II II II 11 II l.J.J II II CJ') 11 II O::: II II 1--- __ .J C') II 11 l_t.J •::'J: ::tr.: 11
::tr.: II t:.!:J :::::;.. II II O::: I·-·- .... II
:;~ :: ;:: :;:]. B'j :: II t-··- II II I-··- II II 1.J.J II II LJ::. 11 II 11 II 11 II It II II II ti
" II
" fl fl fl

Univers
ity of
Cap
e Tow
n
171
APPENDIX J
LABOUR PRODUCTIVITY REPORT
- WEEKLY ONLY