profile of the meeting industry in - hbaa | ukeis...profile of the meeting industry in the uk 2011...
TRANSCRIPT
Profile of the Meeting Industry in the UK
2011
Project Director: Dr ShiNa Li
Research team (in alphabetical order): Glenn Bowdin, Emma Heslington, Steve Jones, Jackie Mulligan, Mihaela-Oana Tara-Lunga, Carolyn Tauxe, Professor Rhodri Thomas and Dr Pei-Ying Wu.
The team also would like to acknowledge the support of Professor Leo Jago, Professor Calvin Jones, Tony Rogers and Dr Emma Wood.

2013 | Page 2
HeaDlIne FInDIngs• More than 1,301,600 meetings1 took place in the UK that attracted2 116.1 million
attendees who accounted for spending3 just under £40 billion. More than half of the attendees came to consumer shows and exhibitions; nearly 40% attended conferences.
• Meetings took place in 10,127 meeting venues4 across the UK, 27.7% were in large hotels (more than 50 rooms) with meeting facilities. Almost 20% were classed as unusual, unique or special event venues and 14.2% were purpose-built convention or exhibition centres. In total, the venues occupied 60 million square metres or the equivalent of over 6,000 football pitches and offered a total seating capacity of approximately 8.5 million.
• On average, each venue was used for 125 days in the year. Large hotels with meeting facilities held all types of meetings, conferences, consumer shows, exhibitions and incentive events. More trade shows and business exhibitions were held in purpose- built convention and exhibition centres than in other types of properties. Small hotels hosted more incentive events. Resort properties, university/educational institutions and unique and special event venues without bedrooms proved a popular choice for conferences.
• On average, meeting organisations staged 147 events in the year. More than 81% of meetings were held for the corporate sector, 6.3% of meetings were for associations, 5.2% for non-government and not-for-profit organisations and 4% for government and public service organisations.
• Sixty-four per cent of meetings were classed as small meetings with less than 100 attendees; nearly 30% were for between 100 and 500 attendees and 6% attracted more than 500 attendees.
• The average length of a meeting was two days. More than half (53.8%) of meetings in the UK in 2011 were a day or less in length. Most meetings happened in March and April (272,926); far fewer meetings happened in December (46,346). Within England, the Greater London region hosted the most meetings (362,500) followed by the South East (163,349) and the West Midlands (143,210). Scotland hosted 86,524, Wales hosted 75,802 and Northern Ireland hosted 20,447.
• More than three quarters (78.5%) of people attending meetings were domestic. In 2011, the total spend generated by international meeting attendees was £10.8 bil-lion; national meeting attendees spent £21.3 billion. The total spend by people who accompanied attendees to the host destination was £7.7 billion. The largest average spend was by international attendees who stayed for one night or more (£717) and the smallest average spend was by international attendees who did not stay overnight (£136). Domestic attendees who did not stay overnight had an average spend of £141 and domestic attendees who stayed for one night or more spent £474.
• The largest expenses for UK meeting organisations were for venue hire (17.4%), equipment/production (13.4%) and food and beverage (11.9%). The most prominent income was from delegate registration fees (38.1%) followed by exhibitor fees (31.6%) and sponsorship (19.5%).
• The largest attendee spend was accommodation (20.6%), followed by registration (18.7%). Another 10.3% of attendee spend was for air transport, with 9.5% spent on food and beverage from restaurants, cafés and bars and 5.8% spent on fees to attend optional programs such as reception events, dinners and social events.
• UK venues spent most on salaries and wages (18.6%), maintenance and repairs (17.8%) and other administrative expenses such as professional fees and contracted services (17%). The highest amount of revenue was gained from meeting space rental (58.1%), followed by exhibition services (14.7%) and food and beverage (11.5%).
• Out of the four key business tourism markets surveyed, U.S. attendees spent more than the others (£3.9 billion), followed by Ireland (£2.5 billion), Germany (£1.2 billion) and France (£0.9 billion).
• Sixty per cent of venues and meeting organisations indicated that the number of meet-ing attendees stayed around the same from 2010 to 2011. Another 21.7% of meeting suppliers felt that the number of attendees increased in 2011.
• The total number of employees (full-time equivalent) working specifically on meetings was estimated to be 423,445.
ContentsHeadline findings.............................. 2
1. Introduction............................. 3
1.1 Context of study....................... 3
1.2 Key definitions......................... 3
2. acknowledgements.................. 3
4. Methods.................................. 4
4.1 Data collection......................... 4
4.2 Number of questionnaires received and breakdown........... 4
4.3 Secondary research.................. 4
5 Profile of meetings................... 5
5.1 Number and location of meetings.............................. 5
5.2 UK meeting venues................... 5
5.3 Venue types............................. 6
5.4 Meeting types.......................... 6
5.5 Meeting clients........................ 7
5.6 Meeting organisations.............. 7
5.7 Meeting size............................. 7
5.8 Length of meetings and seasonality........................ 8
5.9 Meeting attendance.................. 8
5.10 Meeting attendance by venue type........................... 9
5.11 Exhibition organisations and exhibitors.......................... 9
5.12 Employment............................. 9
6 Revenue and spend.................. 9
6.1 Meeting organisations.............. 9
6.2 Venues..................................... 10
6.3 Destination management organisations (DMO)................. 10
6.4 Meeting attendance.................. 10
6.5 Exhibitors................................. 10
7 outlook.................................... 10
7.1 Number of meeting attendees................................. 10
7.2 Meeting revenue....................... 11
7.3 Venue revenue.......................... 11
8 Conclusion............................... 12
2013 | Page 3
1. Introduction1.1 Context of study The UK Economic Impact Study (EIS), commissioned by the Meet-ing Professionals International (MPI) Foundation and undertaken by Leeds Metropolitan University, represents a landmark study for the UK meeting industry. It encompasses the size and economic impact of meetings at the national, regional and city levels and incorporates a diverse range of stakeholders involved in the meet-ing industry. This report provides the findings of the first phase of the proj-ect to establish the profile of the meeting industry in the UK. Pri-mary data were collected from the four home countries (England, Northern Ireland, Scotland, Wales), the main regions of England (East, East Midlands, Greater London, North East, North West, South East, South West, West Midlands and Yorkshire and the Humber), as well as for five UK cities (Belfast, Cardiff, Edinburgh, Liverpool and London). Disaggregated data were provided at national, regional and city levels. 1.2 Key definitionsThe meeting industry has emerged as a significant contributor to national economies. As a result, the United Nations World Tourism Organisation (UNWTO), along with the International Convention and Congress Association (ICCA), Meeting Profes-sionals International (MPI) and Reed Travel Exhibitions promot-ed the initiative of measuring the economic activity of meetings on a national scale. The UNWTO and its partners developed definitions, elaborated a methodology based on the extension of national tourism satellite accounts and created a pilot program for individual countries. The definitions and guidelines outlined by the UNWTO5 and used in previous EIS reports6 for the United States, Canada and Mexico served as a foundation for this research. For the pur-poses of this study, the term “meeting” is defined in Table 1.
Table 1. Definition of a meeting
2. acknowledgementsThe research team is pleased to acknowledge the support of the following organisations for sponsoring this important study.- Barbican - Condé Nast- ExCel London- IMEX Group- InterContinental Hotels Group (IHG)- International Confex- International Congress and Convention Association (ICCA)- London & Partners- Meetings & Incentive Travel- MPI Foundation- Q Hotels- Reed Travel Exhibitions- Scottish Exhibition and Conference Centre (SECC)- Site International Foundation- The Meetings Show UK- Visit Scotland- Visit Wales
We are pleased to acknowledge the contribution of the following organisations for their support in distributing questionnaires to their constituents.- Association of British Professional Conference Organisers (ABPCO)- Belfast Visitor & Convention Bureau- Cardiff and Co.- Conference and Travel (CAT) Publications- Confex / UBM- Edinburgh Convention Bureau- Emergency Planning College- Experian- The World Exhibition for Incentive Travel, Meetings & Events (IMEX) Group- InterContinental Hotels Group (IHG)- Leeds and Partners- Leeds Metropolitan University- Leicester Shire Promotions- London & Partners- Meeting Professionals International (MPI)- Meeting industry Association (MIA)- Q Hotels- Site International Foundation- Tony Rogers Conference & Event Services- Visit Scotland- Visit Wales
Secondary data was kindly supplied by the following organisations.- FaceTime, report co-founded by the Association of Event Organisers (AEO), the Association of Event Venues (AEV) and the Event Supplier and Services Association (ESSA)- Meeting Industry Association (MIA)- Visit England
Meeting AimsTo motivate participants, to conduct business, to share ideas, to learn, to socialise and to hold discussions.
Meeting Length Four hours or more
Meeting Size Minimum 10 participants
Meeting VenueWhere there is payment for the use of a contracted venue for meetings.
Meeting Location United Kingdom
Key Meeting Types
• Conventions/conferences/congresses • Trade shows/business exhibitions • Consumer shows/consumer exhibitions• Incentive events• Corporate/business meetings • Other meetings (which qualify under the defined criteria above)
Meeting Types Excluded
• Social or recreational/entertainment activities• Formal educational activities • Political campaign rallies
SOURCE: UNWTO7
2013 | Page 4
4. Methods 4.1 Primary data collection Primary research consisted of online surveys aimed at fi ve stakeholder groups: organisers, venues, destination management organisations, delegates and exhibitors. The design of research instruments was informed by previous studies, including those undertaken by the UNWTO, and other EIS projects for the U.S., Mexico, Canada, Australia and Denmark. Samples were derived from databases held by Leeds Met-ropolitan University, Experian and other stakeholders. Links to questionnaires were sent to prospective participants via email. Online panel recruitment was also used to obtain meeting attendee and exhibitor data, as well as additional responses from meeting organisers and venue managers. Responses were gathered through panel surveys from international attendee and exhibitor audiences from France, Germany, Ireland and the U.S., which when com-bined account for 60% of business visits to the UK This study was commissioned in 2012. The most recent full calendar year of data available was 2011. These were used for the study and profi le report.
4.2 number of questionnaires received and breakdown A total of 3,460 completed questionnaires were received. Of these, 3,350 responses provided data from 2011 and, to check validity, a further 110 responses were analysed from live events in 2012. The total number of questionnaires received from each group is as follows.
Meeting Organisers: 548Venues: 457Destination Management Organisations: 33Attendees: 1,617Exhibitors: 695Live Event Attendees and Exhibitors: 110
Table 2. Survey responses received from each stakeholder group
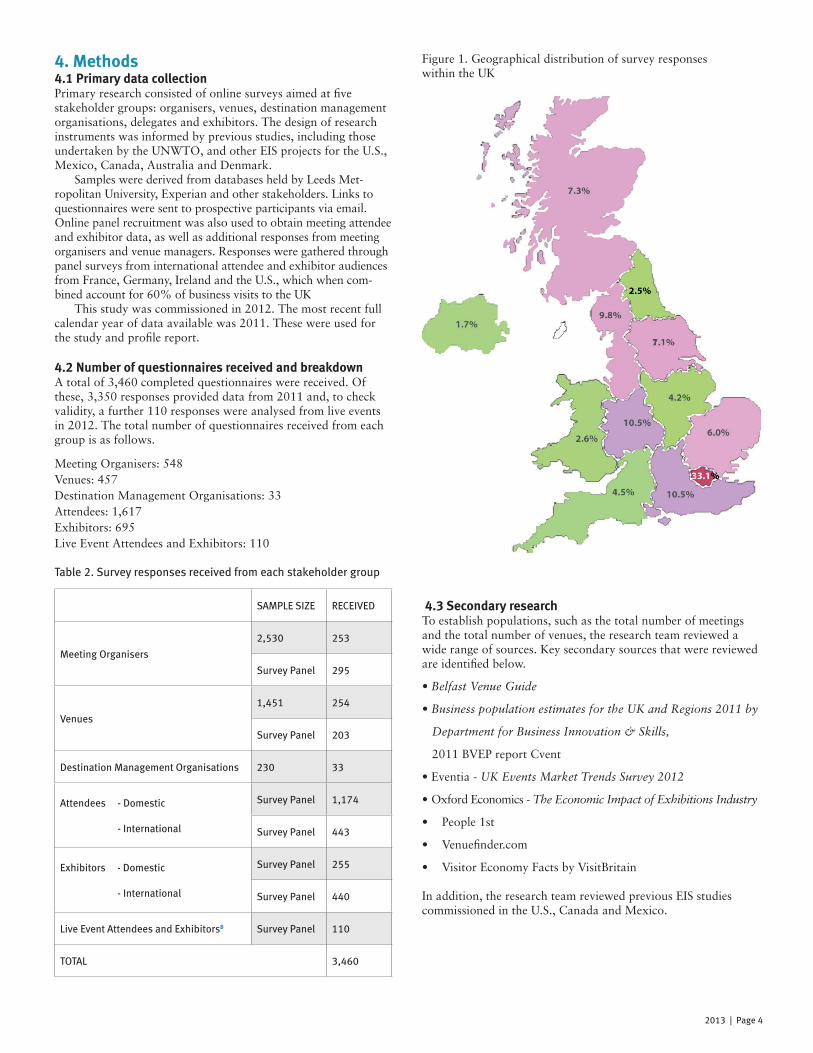
Figure 1. Geographical distribution of survey responses within the UK
4.3 secondary researchTo establish populations, such as the total number of meetings and the total number of venues, the research team reviewed a wide range of sources. Key secondary sources that were reviewed are identifi ed below.
• Belfast Venue Guide
• Business population estimates for the UK and Regions 2011 by
Department for Business Innovation & Skills,
2011 BVEP report Cvent
• Eventia - UK Events Market Trends Survey 2012
• Oxford Economics - The Economic Impact of Exhibitions Industry
• People 1st
• Venuefi nder.com
• Visitor Economy Facts by VisitBritain
In addition, the research team reviewed previous EIS studies commissioned in the U.S., Canada and Mexico.
SamPLe SIZe reCeIVed
Meeting Organisers
2,530 253
Survey Panel 295
Venues
1,451 254
Survey Panel 203
Destination Management Organisations 230 33
Attendees - Domestic
- International
Survey Panel 1,174
Survey Panel 443
Exhibitors - Domestic
- International
Survey Panel 255
Survey Panel 440
Live Event Attendees and Exhibitors8 Survey Panel 110
TOTAL 3,460
2013 | Page 5
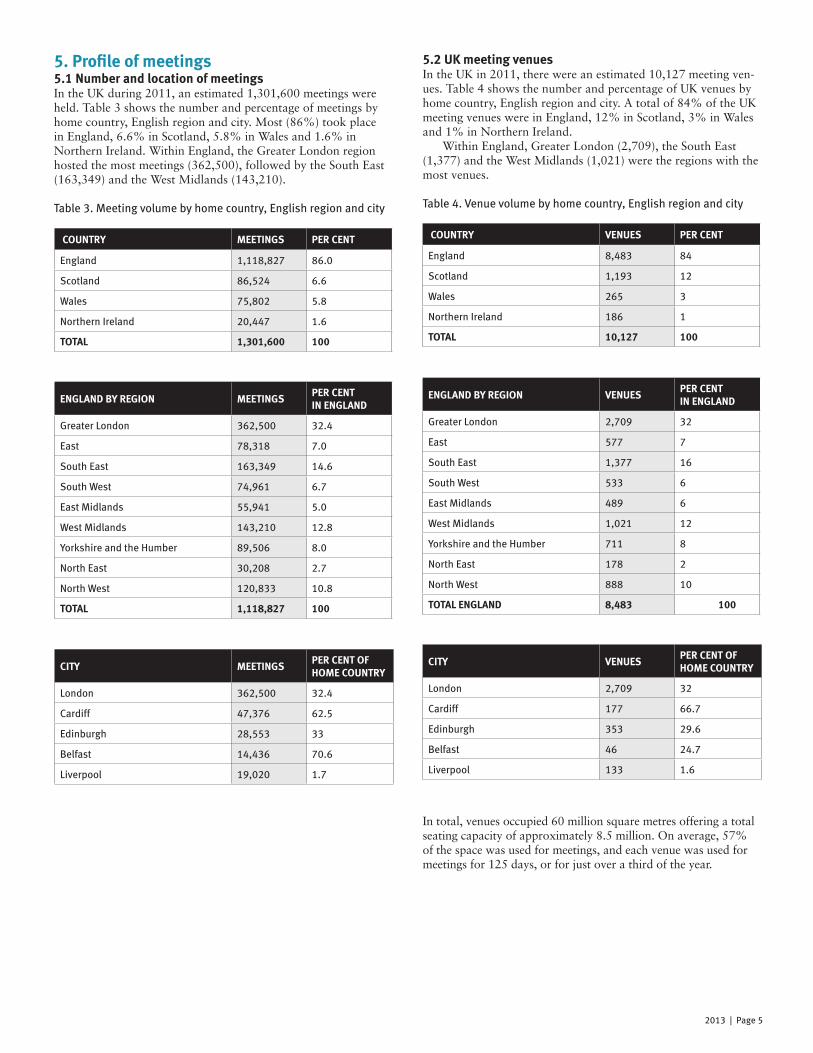
5. Profile of meetings5.1 number and location of meetingsIn the UK during 2011, an estimated 1,301,600 meetings were held. Table 3 shows the number and percentage of meetings by home country, English region and city. Most (86%) took place in England, 6.6% in Scotland, 5.8% in Wales and 1.6% in Northern Ireland. Within England, the Greater London region hosted the most meetings (362,500), followed by the South East (163,349) and the West Midlands (143,210).
Table 3. Meeting volume by home country, English region and city
5.2 UK meeting venuesIn the UK in 2011, there were an estimated 10,127 meeting ven-ues. Table 4 shows the number and percentage of UK venues by home country, English region and city. A total of 84% of the UK meeting venues were in England, 12% in Scotland, 3% in Wales and 1% in Northern Ireland. Within England, Greater London (2,709), the South East (1,377) and the West Midlands (1,021) were the regions with the most venues.
Table 4. Venue volume by home country, English region and city
In total, venues occupied 60 million square metres offering a total seating capacity of approximately 8.5 million. On average, 57% of the space was used for meetings, and each venue was used for meetings for 125 days, or for just over a third of the year.
englanD by RegIon MeetIngsPeR Cent In englanD
Greater London 362,500 32.4
East 78,318 7.0
South East 163,349 14.6
South West 74,961 6.7
East Midlands 55,941 5.0
West Midlands 143,210 12.8
Yorkshire and the Humber 89,506 8.0
North East 30,208 2.7
North West 120,833 10.8
total 1,118,827 100
englanD by RegIon venUesPeR Cent In englanD
Greater London 2,709 32
East 577 7
South East 1,377 16
South West 533 6
East Midlands 489 6
West Midlands 1,021 12
Yorkshire and the Humber 711 8
North East 178 2
North West 888 10
total englanD 8,483 100
CIty MeetIngsPeR Cent oF HoMe CoUntRy
London 362,500 32.4
Cardiff 47,376 62.5
Edinburgh 28,553 33
Belfast 14,436 70.6
Liverpool 19,020 1.7
CIty venUesPeR Cent oF HoMe CoUntRy
London 2,709 32
Cardiff 177 66.7
Edinburgh 353 29.6
Belfast 46 24.7
Liverpool 133 1.6
CoUntRy MeetIngs PeR Cent
England 1,118,827 86.0
Scotland 86,524 6.6
Wales 75,802 5.8
Northern Ireland 20,447 1.6
total 1,301,600 100
CoUntRy venUes PeR Cent
England 8,483 84
Scotland 1,193 12
Wales 265 3
Northern Ireland 186 1
total 10,127 100
2013 | Page 6
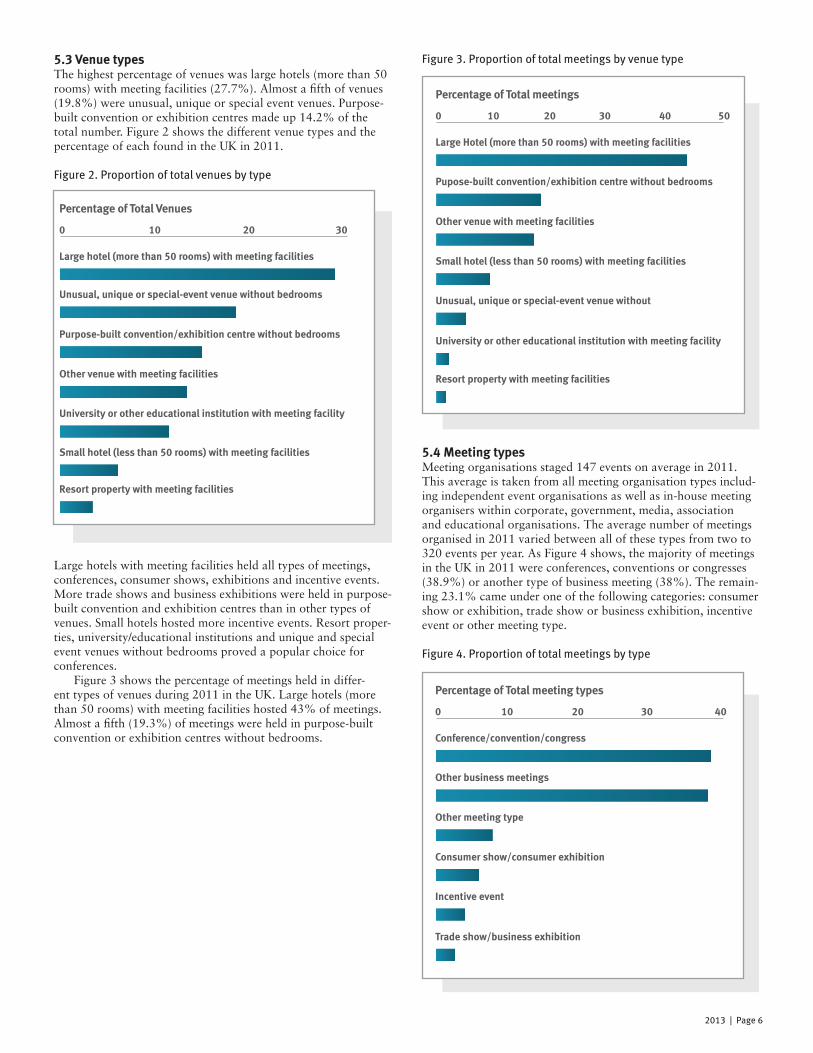
Figure 3. Proportion of total meetings by venue type
5.4 Meeting typesMeeting organisations staged 147 events on average in 2011. This average is taken from all meeting organisation types includ-ing independent event organisations as well as in-house meeting organisers within corporate, government, media, association and educational organisations. The average number of meetings organised in 2011 varied between all of these types from two to 320 events per year. As Figure 4 shows, the majority of meetings in the UK in 2011 were conferences, conventions or congresses (38.9%) or another type of business meeting (38%). The remain-ing 23.1% came under one of the following categories: consumer show or exhibition, trade show or business exhibition, incentive event or other meeting type.
Figure 4. Proportion of total meetings by type
5.3 venue typesThe highest percentage of venues was large hotels (more than 50 rooms) with meeting facilities (27.7%). Almost a fifth of venues (19.8%) were unusual, unique or special event venues. Purpose-built convention or exhibition centres made up 14.2% of the total number. Figure 2 shows the different venue types and the percentage of each found in the UK in 2011.
Figure 2. Proportion of total venues by type
Large hotels with meeting facilities held all types of meetings, conferences, consumer shows, exhibitions and incentive events. More trade shows and business exhibitions were held in purpose-built convention and exhibition centres than in other types of venues. Small hotels hosted more incentive events. Resort proper-ties, university/educational institutions and unique and special event venues without bedrooms proved a popular choice for conferences. Figure 3 shows the percentage of meetings held in differ-ent types of venues during 2011 in the UK. Large hotels (more than 50 rooms) with meeting facilities hosted 43% of meetings. Almost a fifth (19.3%) of meetings were held in purpose-built convention or exhibition centres without bedrooms.
0 10 20 30
0 10 20 30 40 50
0 10 20 30 40
Percentage of total venues
Percentage of total meetings
Percentage of total meeting types
large hotel (more than 50 rooms) with meeting facilities
large Hotel (more than 50 rooms) with meeting facilities
Conference/convention/congress
Unusual, unique or special-event venue without bedrooms
Pupose-built convention/exhibition centre without bedrooms
other business meetings
Purpose-built convention/exhibition centre without bedrooms
other venue with meeting facilities
other meeting type
other venue with meeting facilities
small hotel (less than 50 rooms) with meeting facilities
Consumer show/consumer exhibition
University or other educational institution with meeting facility
Unusual, unique or special-event venue without
Incentive event
small hotel (less than 50 rooms) with meeting facilities
University or other educational institution with meeting facility
trade show/business exhibition
Resort property with meeting facilities
Resort property with meeting facilities
2013 | Page 6
2013 | Page 7
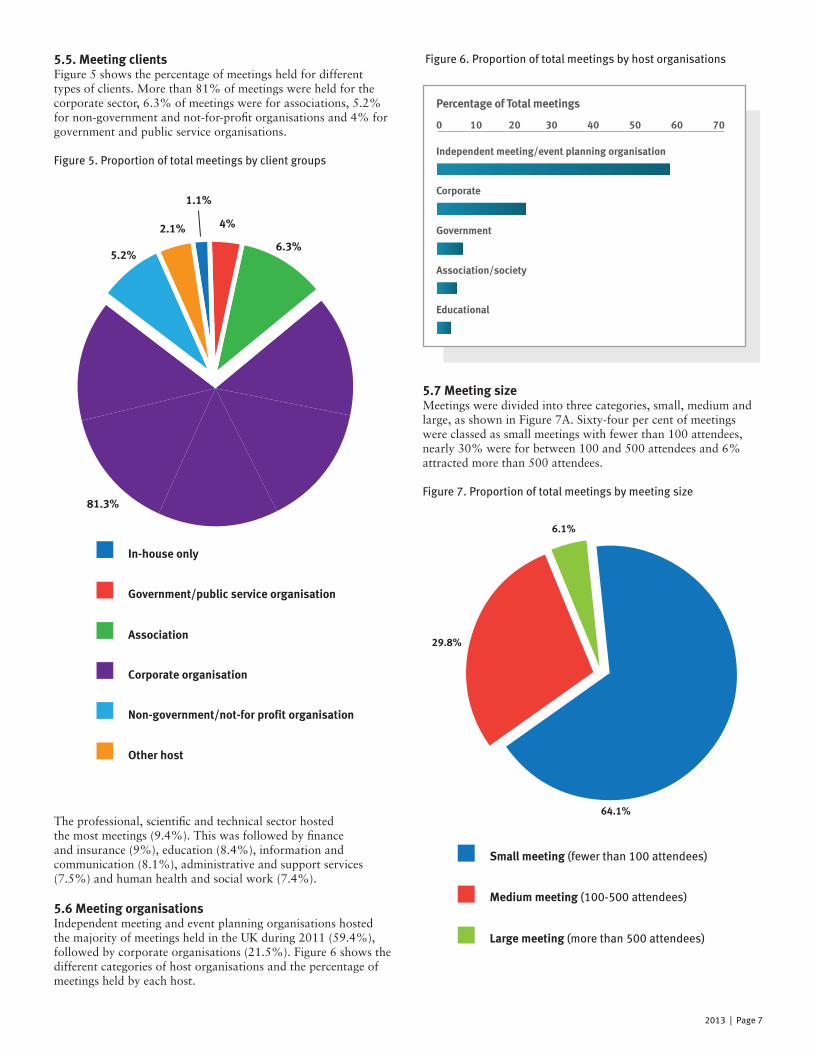
5.5. Meeting clientsFigure 5 shows the percentage of meetings held for different types of clients. More than 81% of meetings were held for the corporate sector, 6.3% of meetings were for associations, 5.2% for non-government and not-for-profit organisations and 4% for government and public service organisations.
Figure 5. Proportion of total meetings by client groups
The professional, scientific and technical sector hosted the most meetings (9.4%). This was followed by finance and insurance (9%), education (8.4%), information and communication (8.1%), administrative and support services (7.5%) and human health and social work (7.4%).
5.6 Meeting organisationsIndependent meeting and event planning organisations hosted the majority of meetings held in the UK during 2011 (59.4%), followed by corporate organisations (21.5%). Figure 6 shows the different categories of host organisations and the percentage of meetings held by each host.
Figure 6. Proportion of total meetings by host organisations
5.7 Meeting sizeMeetings were divided into three categories, small, medium and large, as shown in Figure 7A. Sixty-four per cent of meetings were classed as small meetings with fewer than 100 attendees, nearly 30% were for between 100 and 500 attendees and 6% attracted more than 500 attendees.
Figure 7. Proportion of total meetings by meeting size
0 10 20 30 40 50 60 70
Percentage of total meetings
Independent meeting/event planning organisation
Corporate
government
association/society
educational
81.3%
5.2%
2.1%
1.1%
4%
6.3%
In-house only
government/public service organisation
association
Corporate organisation
non-government/not-for profit organisation
other host
64.1%
29.8%
6.1%

2013 | Page 8
5.8 length of meetings and seasonality The average length of a meeting was two days. More than half (53.8%) of meetings in the UK in 2011 were a day or less in length. Figure 8 shows the number of meetings attended per month in 2011. April attracted the highest number of meetings (138,832), while December attracted the lowest number (46,346).
Figure 8. Meeting number by month (2011)
5.9 Meeting attendance The year 2011 saw an estimated 116.1 million people attending meetings in the UK. The average number of attendees per meet-ing was 435. However, the average number of attendees varied depending on the meeting category. Numbers ranged from an average of 61 attendees at “other business meetings” to 2,839 attendees at consumer shows and exhibitions.
Table 5. Average number of attendees per meeting, by meeting type
The category with the highest number of attendees was consumer shows and exhibitions, which accounted for 50.2% of the total number of attendees, followed by conferences, conventions and congresses, which attracted 38.7% of total attendees.
Figure 9. Proportion of total attendance by meeting type
Most (91.5%) of attendees came to meetings in England. The main English regions in terms of attracting the largest number of attendees were Greater London (59.9%), the South East (11.4%) and the West Midlands (15.4%). The city that attracted the most attendees was London, with 63.6 million attendees coming to events there. Attendees spent, on average, two nights at the meeting host destination. Figure 10 shows the number and percentage of people who attended meetings in the UK in 2011. Domestic attendees accounted for 78.5% of attendees, while international attendees comprised 21.5% of the total meeting attendees.
Figure 10. Number of attendees attending meetings from within and outside of the UK
160,000
129,563
99,901
134,094 138,832
122,353
126,885
99,48990,426
116,380109,994
87,336
46,346
140,000
120,000
100,000
80,000
60,000
40,000
20,000
0
Janu
ary
Febr
uary
Mar
ch
april
May
June
July
augu
stse
ptem
ber
oct
ober
nove
mbe
rDe
cem
ber
0 10 20 30 40 50 60
Percentage of total attendance
Consumer show / consumer exhibition
Conference / convention / congress
trade show / business exhibition
Incentive event
other business meetings
MeetIng tyPeaveRage nUMbeR oF attenDees
Conference/convention/congress 295
Consumer show/exhibition 2,839
Trade show/business exhibition 239
Incentive event 176
Other business meetings 61
Within the UK91,107,431
(78.5%)
outside the UK24,992,569
(21.5%)

2013 | Page 9
5.10 Meeting attendance by venue typeMore than three quarters of attendees (76.4%) attended meet-ings at purpose built convention or exhibition centres. Almost 13 million people attended meetings at unusual, unique or special event venues and close to 6 million attended meetings at large hotels.
5.11 exhibition organisations and exhibitorsA diverse range of exhibition organisations representing a wide variety of sectors emerged from the research—human health and social work (9.3%), manufacturing (8.7%), professional, scientific and technical (8%), administrative and support services (7.8%) and education (6.6%). On average, each exhibitor at-tended five exhibitions. As Figure 11 shows, domestic exhibitors accounted for 67.9% of the total, while international exhibitors comprised 32.1% of the total number of exhibitors in 2011.
Figure 11. Number of exhibitors from within and outside of the UK
On average, the length of meetings that exhibitors attended was four days, and they spent three nights at the host destination in 2011. As shown in Figure 12 the most popular location for exhibitions in 2011 was England (87%). Scotland, Northern Ireland and Wales, together hosted 12.9% of the exhibitions held in 2011.
Figure 12. Proportion of total exhibitions by home country
5.12 employmentSecondary sources show that the event industry, including meet-ings and cultural and sporting events, employs around 540,000 people.9 According to the research conducted for this paper, the total number of employees (full-time equivalent) working directly for meetings activities (directly providing services and products for meeting attendees) was estimated to be 423,445 in 2011. Indirect and induced employment will be captured in the next stage of evaluating the economic impact of this industry.
6. Revenue and spend6.1 Meeting organisationsThe breakdown of major expenditure10 items for meeting organ-isations in 2011 was venue hire (17.4%), equipment/production (13.4%) and food and beverage (11.9%). The most prominent source of income for meeting organisers during 2011 was from registration fees from delegates (38.1%), followed by fees from exhibitors (31.6%) and sponsorship (19.5%). The meeting organisations that generated the highest rev-enue, as well as the highest costs, were conference, convention and congress meetings, with £89.1 million in revenue and £61.8 million in costs. Organisations hosting other types of meetings generated £43.9 million in revenue and £42.5 million in costs and those hosting other types of business meetings made £26.5 million in revenue and spent £22.9 million.
Within the UK179,963
(67.9)
outside the UK85,037(32.1)
87.1%
6.5%
2.8% 3.6%
england
scotland
Wales
northern Ireland

2013 | Page 10
6.2 venuesThe highest expenditure by UK venues during 2011 was attrib-uted to salaries and wages (18.6%), maintenance and repairs accounted for 17.8% and other administrative expenses, such as professional fees and contracted services, equalled 17%. At the same time, the highest amount of revenue was obtained from meeting space rental (58.1%), followed by exhibition services (14.7%) and food and beverage (11.5%).
6.3 Destination management organisations (DMos)DMOs were asked about their involvement in the meetings sec-tor in terms of annual budget. The main sources of revenue for DMOs came from commercial activity (46.7%) and national and local government (46.4%). Figure 13 shows the budget of DMOs by area of allocation. The meeting industry had 30.5% of the 2011 budget allocation and the tourism industry had 33.8%. The main area of budget allocation in 2011 was stated as “other.” DMO respondents included campaigns, foreign direct investment, attracting foreign students and major events in this category.
Figure 13. Allocation of DMO expenditure
6.4 Meeting attendanceIn 2011, total spending generated by national meeting attendees was £21.3 billion. International attendees spent £10.8 billion. Total spend by people who accompanied attendees to the host destination was £7.7 billion. Attendees demonstrated higher expenditures in England, fol-lowed by Scotland, Wales and Northern Ireland. Out of the four key business tourism markets surveyed, U.S. attendees (£3.9 bil-lion) spent more than the other markets—Ireland (£2.5 billion), Germany (£1.2 billion) and France (£0.9 billion). Table 6 shows average spend by domestic and international attendees based on length of stay (day or overnight). The largest average spend was by international attendees who stayed for one night or more (£717); the smallest was by international attendees who did not stay overnight (£136). Domestic attendees who did not stay overnight had a slightly higher average spend of £141, and domestic attendees who stayed for one night or more spent £474 on average.
Table 6. Average spend per attendee
Delegate spend mainly comprised of accommodation expenditure (20.6%), followed by meeting registration fees (18.7%). Another 10.3% of attendee spend was on air transport. Food and bever-age from restaurants, cafés and bars (9.5%) and fees for optional meeting programs such as reception events, dinners and social events (5.8%) made up the remainder. There’s an association between public subsidy and the vol-ume of meetings and attendees in an area. In general, the higher the subsidy provided to meeting venues and organisers, the more meetings and meeting attendees they had.
6.5 exhibitorsThe average spend of exhibitors at UK meetings during 2011 was £2,354 per event.The highest exhibitor spend was on meeting registration fees (14.2%), followed by accommodation (12.9%). Ten per cent was spent on food and beverage from restaurants, cafés and bars. Fees for air transport and optional meeting pro-grams such as reception events, dinners and social events each made up 8.6% of total exhibitor spend.
7. outlook7.1 number of meeting attendeesIn the UK, approximately 60% of meeting organisations (venues and organisers) indicated that the number of meeting attendees stayed around the same from 2010 to 2011 and would remain stable between 2011 and 2012. However, a fifth (21.7%) of venues and organisers reported that the number of attendees actually increased in 2011 compared to 2010. Another 22.1% predicted that numbers would decrease in 2012 when compared to 2011. Figure 14 shows the changes in the number of meeting attendees between 2010 and 2012.
Figure 14. Changes in the number of meeting attendees between 2010 and 2012
STayed NO NIghTSSTAYED FOR ONE NIghT Or mOre
Domestic £141 £474
International £136 £717
Increased
80%
70%
60%
50%
40%
30%
20%
10%
2010-11 2011-120
stayed around the same
Decreased
100%
90% 21.7%
60.2%
18.1%
17.3%
60.6%
22.1%
Increased
80%
70%
60%
50%
40%
30%
20%
10%
2010-11 2011-120
stayed around the same
Decreased
100%
90% 21.3%
52.2%
26.5%
27.6%
48.9%
24.1%
Increased
80%
70%
60%
50%
40%
30%
20%
10%
2010-11 2011-120
stayed around the same
Decreased
100%
90%11.8%
47.1%
41.1%
23.5%
41.2%
35.3%
2013 | Page 11
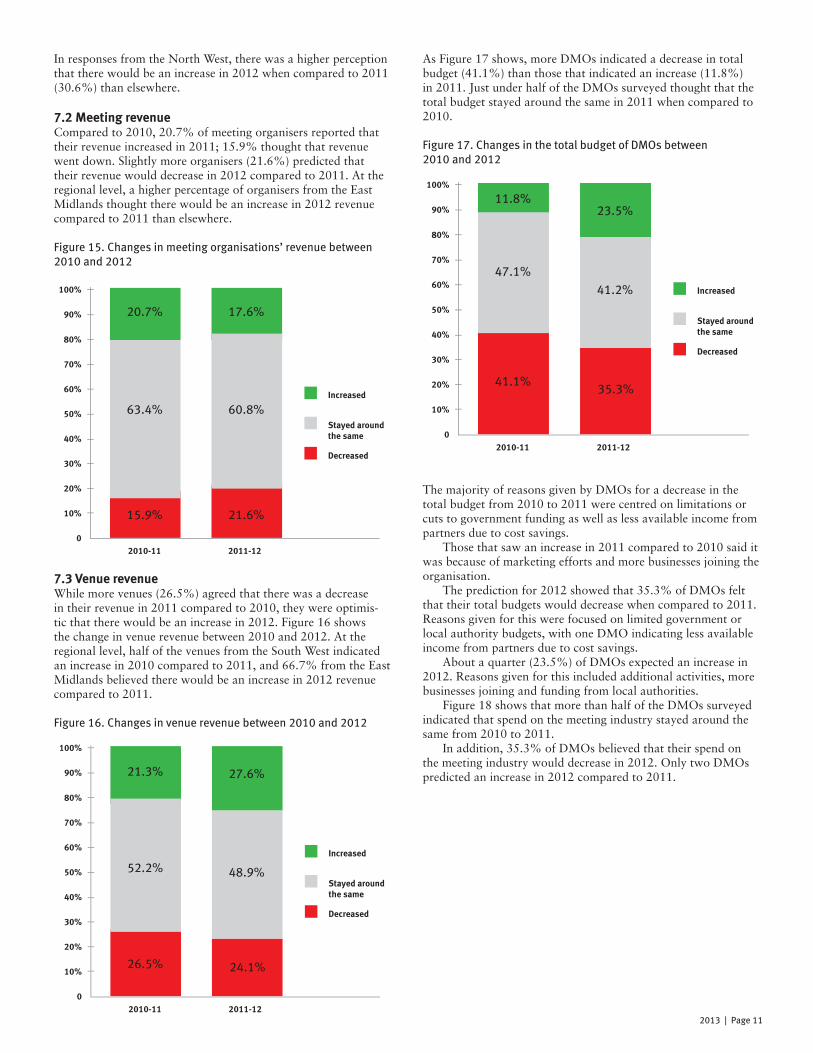
In responses from the North West, there was a higher perception that there would be an increase in 2012 when compared to 2011 (30.6%) than elsewhere.
7.2 Meeting revenueCompared to 2010, 20.7% of meeting organisers reported that their revenue increased in 2011; 15.9% thought that revenue went down. Slightly more organisers (21.6%) predicted that their revenue would decrease in 2012 compared to 2011. At the regional level, a higher percentage of organisers from the East Midlands thought there would be an increase in 2012 revenue compared to 2011 than elsewhere.
Figure 15. Changes in meeting organisations’ revenue between 2010 and 2012
7.3 venue revenueWhile more venues (26.5%) agreed that there was a decrease in their revenue in 2011 compared to 2010, they were optimis-tic that there would be an increase in 2012. Figure 16 shows the change in venue revenue between 2010 and 2012. At the regional level, half of the venues from the South West indicated an increase in 2010 compared to 2011, and 66.7% from the East Midlands believed there would be an increase in 2012 revenue compared to 2011.
Figure 16. Changes in venue revenue between 2010 and 2012
As Figure 17 shows, more DMOs indicated a decrease in total budget (41.1%) than those that indicated an increase (11.8%) in 2011. Just under half of the DMOs surveyed thought that the total budget stayed around the same in 2011 when compared to 2010.
Figure 17. Changes in the total budget of DMOs between 2010 and 2012
The majority of reasons given by DMOs for a decrease in the total budget from 2010 to 2011 were centred on limitations or cuts to government funding as well as less available income from partners due to cost savings. Those that saw an increase in 2011 compared to 2010 said it was because of marketing efforts and more businesses joining the organisation. The prediction for 2012 showed that 35.3% of DMOs felt that their total budgets would decrease when compared to 2011. Reasons given for this were focused on limited government or local authority budgets, with one DMO indicating less available income from partners due to cost savings. About a quarter (23.5%) of DMOs expected an increase in 2012. Reasons given for this included additional activities, more businesses joining and funding from local authorities. Figure 18 shows that more than half of the DMOs surveyed indicated that spend on the meeting industry stayed around the same from 2010 to 2011. In addition, 35.3% of DMOs believed that their spend on the meeting industry would decrease in 2012. Only two DMOs predicted an increase in 2012 compared to 2011.
Increased
80%
70%
60%
50%
40%
30%
20%
10%
2010-11 2011-120
stayed around the same
Decreased
100%
90% 20.7%
63.4%
15.9%
17.6%
60.8%
21.6%

2013 | Page 12
Figure 18. Changes in spend on the meeting industry by DMOs between 2010 and 2012
8. ConclusionThis research shows that during 2011 more than 1,301,600 meetings took place in the UK in its 10,127 venues. Meeting at-tendees numbered 116.1 million and accounted for a total spend of just under £40 billion. Total spend by people who accompa-nied attendees to the meeting host destination was £7.7 billion. Primary research revealed that 78.5% of people attending meetings were from within the UK. Sixty per cent of meeting suppliers (venues and organisers) said that the number of meet-ing attendees stayed around the same from 2010 to 2011 and would do so between 2011 and 2012. The majority of meetings (81%) were held for the corporate sector. April attracted the highest number of meetings (138,832), while December attracted the lowest (46,346). Based on respons-es, the total number of employees (full-time equivalent) working directly on meetings activities was estimated to be 340,498. The outlook for 2012 showed that 35.3% of DMOs felt that their total budgets and spend on the meeting industry would de-crease when compared to 2011. Over a fifth (23.5%) of DMOs thought that their total budgets would increase. The next stage of the study will be an evaluation of the economic impact of meetings using extended Tourism Satellite Account and Input and Output modelling. The results of that analysis will be released in July 2013.
Increased
80%
70%
60%
50%
40%
30%
20%
10%
2010-11 2011-120
stayed around the same
Decreased
100%
90%11.8%
58.8%
29.4%
5.9%
58.8%
35.3%
(1) “Meetings” are defined by the United Nations World Tourism Organisation (UNWTO) and include conferences, conventions, congresses, exhibitions, trade shows, consumer shows, incentive events and other business events. (2) The total number of meetings and the number of attendees are estimated by referring to other previous studies, including the Eventia UK Events Market Trends Survey 2012 and Oxford Economics’ The Economic Impact of the UK Exhibitions Industry (February 2012).(3) Figure includes attendee spend plus accompanying people spend. Attendee spend alone was £32.1 billion.(4) The total number of venues is estimated by referring to various secondary sources including Venue Finder, Cvent, Findmeaconference and the Belfast Visitor & Convention Bureau’s Belfast, A Fresh Perspective: Conference & Meetings Guide, Belfast & Northern Ireland 2012/2014. (5) UNWTO, Measuring the Economic Importance of the Meeting industry: Developing a Tourism Satellite Account Extension (November 2006).
(6) Previous economic impact studies: The Economic Contribution of Meetings Activity in Canada (June 2008), The Economic Significance of Meetings to the U.S. Economy (January 2011), The Economic Significance of Meetings to Mexico (September, 2011).(7) UNWTO Measuring the Economic Importance of the Meeting industry: Developing a Tourism Satellite Account Extension (November 2006).(8) Live event attendee and exhibitor surveys were for 2012, while the others were for 2011.(9) People 1st, Highlighting Professionalism in the Events Industry, 2010; Business Visits & Events Partnership, Opportunities for Growth in the UK Events Industry – Roles & Responsibilities: A Report to the All Party Parliamentary Group For Events, 2011.(10) These expenditure items are taken from the survey information only. The full picture of industry expenditure will be released in the Economic Impact Report.

2013 | Page 13
© 2013, meeting Professionals International. all rights reserved
about ICreThThe International Centre for research in events, Tourism and hospitality (ICreTh) combines the research and enterprise strengths of the UK Centre for Events Management as well as the former Centre for Tourism and Cultural Change (CTCC), the International Centre for responsible Tourism (ICrT) and the Centre for hospitality and retailing. ICreTh is part of the School Of events, Tourism and hospitality as well as the Carnegie research Institute at Leeds Metropolitan University. ICreTh includes three professors, two readers, three senior research fellows as well as a team of more than 20 researchers. Most research is multi- and interdisciplinary. There are some 30 doctoral students from the UK and internationally. Current thematic strengths include responsible and sustainable tourism and events; economic impacts and event impact evalua-tions; cultural tourism; management in events, tourism and hospitality; and sports events. The centre hosts a wide range of seminars and guest lecture series, and details of upcoming events are available on our web site. In addition to university investment, research is funded via a range of international, national and local agencies or businesses. In recent years, these have been as diverse as meeting Professionals International (mPI), the United Nations World Tourism Organisation (UNWTO), the European Commis-sion, the Organisation for Economic Co-operation and Development (OECD), the Economic and Social Research Council (ESRC), the World Bank, govern-ment departments, the Institute of Travel and Tourism (ITT), the NgOs in various countries, sports governing bodies, event organisations and private companies. Research is disseminated via industry reports, white papers, live event presentations and workshops as well as books and articles in various journals, including internationally leading, peer-reviewed publications. The centre also houses several book series and the Journal of Policy Research in Tourism Leisure and Events, Mobilities and Progress in Responsible Tourism. Visit www.leedsmet.ac.uk/icreth or follow @icreth on Twitter.
Canada6519-B Mississauga Road Mississauga, Ontario L5N 1A6 Canada tel +905-286-4807fax +905-567-7191
about the mPI Foundation The mPI Foundation is committed to bringing vision and prosperity to the global meeting and event com-munity by investing in results-oriented initiatives that
shape the future and bring success to the meetings and events community. Visit www.mpifoundation.org.
about mPImeeting Professionals International (mPI), the meeting and event industry’s largest and most vibrant global community, helps it’s members thrive by providing human connections to knowledge and ideas, relationships and marketplaces. mPI membership is comprised of more than 20,000 members belonging to 71 chapters and clubs worldwide. For additional information, visit www.mpiweb.org.
Meeting Professionals InternationalHeadquarters3030 LBJ Freeway, Suite 1700 Dallas, TX 75234-2759 tel +1-972-702-3000fax +1-972-702-3089