progress report 2011 - ipswich
TRANSCRIPT

Ipswich Borough Council – England January 2012
2011 Progress Report i
2011 Air Quality Progress Reportfor
Ipswich Borough Council
In fulfillment of Part IV of the Environment Act 1995Local Air Quality Management
Date: January 2012

January 2012 Ipswich Borough Council
2011 Progress Reportii
LocalAuthorityOfficer
R Brooks
Department Environmental Protection ServicesAddress Ipswich Borough Council, Grafton
House, 15-17 Russell Road,Ipswich, Suffolk, IP1 2DE
Telephone 01473 432000e-mail [email protected]
ReportReferencenumber
PR/RAB/r1
Date January 2012
Ipswich Borough Council – England January 2012
2011 Progress Report iii
Executive Summary
Diffusion tubes and Continuous Monitors located within the existing Air QualityManagement Areas have shown exceedences of the nitrogen dioxide annualaverage objective level. Exceedences were also obtained at a small number oflocations outside of the existing Air Quality Management Areas, all of which areunder investigation as part of ongoing assessments or very close to an Air QualityManagement Area boundary where they will be reviewed as part of a FurtherAssessment.
Particulate monitoring showed no exceedances of the PM10 objectives over thecourse of 2010. The monitor has now been decommissioned following monitoring attwo locations within the town (over the past few years) and in a residential area ofdust complaints, with no exceedances of the objective levels identified. The resultsof the 2011 monitoring will be reported in the 2012 Updating and ScreeningAssessment.
Ipswich Borough Council has identified the following new or previously unidentifiedlocal developments, which may impact on air quality in the Local Authority area:
Biogas plant at Anglian Water Services, Cliff QuayDonalds garage, West End Road – waste oil burningBiomass Combustion plant proposed for the Environment Agency, Cobham RoadTarmac Ltd, Ipswich Works have moved to Cliff Road, Ipswich.
These will be taken into consideration in the next Updating and ScreeningAssessment, scheduled for 2012.
January 2012 Ipswich Borough Council
2011 Progress Reportiv
Table of contents
1 Introduction 6
1.1 Description of Local Authority Area 6
1.2 Purpose of Progress Report 6
1.3 Air Quality Objectives 6
1.4 Summary of Previous Review and Assessments 8
2 New Monitoring Data 14
2.1 Summary of Monitoring Undertaken 14
2.2 Comparison of Monitoring Results with Air Quality Objectives 25
3 New Local Developments 34
3.1 Road Traffic Sources 34
3.2 Other Transport Sources 34
3.3 Industrial Sources 34
3.4 Commercial and Domestic Sources 34
3.5 New Developments with Fugitive or Uncontrolled Sources 35
4 Local / Regional Air Quality Strategy Error! Bookmark not defined.
5 Planning Applications 36
6 Air Quality Planning Policies 37
7 Local Transport Plans and Strategies 38
8 Climate Change Strategies 40
9 Implementation of Action Plans 41
10 Conclusions and Proposed Actions 52
10.1 Conclusions from New Monitoring Data 52
10.2 Conclusions relating to New Local Developments 52
10.3 Other Conclusions 52
10.4 Proposed Actions 52
11 References 54

Ipswich Borough Council – England January 2012
2011 Progress Report v
Appendices
Appendix 1 QA/QC Data
List of Tables
Table 1.1 Air Quality Objectives included in Regulations for the purposes ofLocal Air Quality Management in England
Table 1.2 Summary of previous review and assessments carried out byIpswich Borough Council
Table 2.1 Details of automatic monitoring sites
Table 2.2 Details of non-automatic monitoring sites
Table 2.3a Results of Automatic Monitoring for Nitrogen Dioxide:Comparison with Annual Mean Objective
Table 2.3b Results of Automatic Monitoring for Nitrogen Dioxide:Comparison with 1-hour Mean Objective
Table 2.4 Results of Nitrogen Dioxide Diffusion Tube monitoring
Table 2.5 Results with distance fall off applied as relevant
Table 2.6a Results of PM10 Automatic Monitoring: Comparison with AnnualMean Objective
Table 2.6b Results of PM10 Automatic Monitoring: Comparison with 24 hourmean objective
Table 9.1 Action Plan Progress
List of Figures
Figure 1 Map of AQMA boundaries
Figure 2.1 Map of Automatic Monitoring Sites
Figure 2.2 Map of Non-Automatic Monitoring Sites
January 2012 Ipswich Borough Council
2011 Progress Report6
1 Introduction
1.1 Description of Local Authority Area
Ipswich is the county town of Suffolk and is the fastest growing urban centre in the Eastof England. A third of a million people live within 15 miles of Ipswich town centre.
Ipswich is a centre for financial services, for major public sector employers and formaritime and related industries. It is home to one of England’s newest universities,University Campus Suffolk, which has its main campus on the Waterfront. Suffolk NewCollege, catering for further education, is based nearby and is close to the town centreand the Waterfront. A new sixth-form centre is located on the edge of Ipswich.
The main routes into and out of Ipswich are congested during typical rush hour timesand travel across Ipswich is restricted to certain routes by the River Orwell. Transportand traffic management are key priorities for the town as the Waterfront and the otherareas of the town are undergoing significant redevelopment. Continuing economicprosperity is dependent on people being able to move around the town for work,shopping and leisure. The car remains a significant form of travel.
1.2 Purpose of Progress Report
Progress Reports are required in the intervening years between the three-yearlyUpdating and Screening Assessment reports. Their purpose is to maintain continuity inthe Local Air Quality Management process.
They are not intended to be as detailed as Updating and Screening AssessmentReports, or to require as much effort. However, if the Progress Report identifies the riskof exceedence of an Air Quality Objective, the Local Authority should undertake aDetailed Assessment immediately, and not wait until the next round of Review andAssessment.
1.3 Air Quality Objectives
The air quality objectives applicable to Local Air Quality Management (LAQM) in Englandare set out in the Air Quality (England) Regulations 2000 (SI 928), and the Air Quality(England) (Amendment) Regulations 2002 (SI 3043). They are shown in Table 1.1. Thistable shows the objectives in units of microgrammes per cubic metre g/m3 (for carbonmonoxide the units used are milligrammes per cubic metre, mg/m3). Table 1.1. includesthe number of permitted exceedences in any given year (where applicable).

Ipswich Borough Council – England January 2012
2011 Progress Report 7
Table 1.1 Air Quality Objectives included in Regulations for the purpose ofLocal Air Quality Management in England.
Pollutant
Concentration Measured as
Date to beachieved by
16.25 µg/m3 Running annualmean
31.12.2003Benzene
5.00 µg/m3 Annual mean 31.12.2010
1,3-Butadiene 2.25 µg/m3 Running annualmean
31.12.2003
Carbon monoxide 10.0 mg/m3 Maximum dailyrunning 8-hourmean
31.12.2003
0.5 µg/m3 Annual mean 31.12.2004Lead
0.25 µg/m3 Annual mean 31.12.2008
200 µg/m3 not to beexceeded more than18 times a year
1-hour mean 31.12.2005Nitrogen dioxide
40 µg/m3 Annual mean 31.12.2005
50 µg/m3, not to beexceeded more than35 times a year
24-hour mean 31.12.2004Particles (PM10)(gravimetric)
40 µg/m3 Annual mean 31.12.2004
350 µg/m3, not to beexceeded more than24 times a year
1-hour mean 31.12.2004
125 µg/m3, not to beexceeded more than3 times a year
24-hour mean 31.12.2004
Sulphur dioxide
266 µg/m3, not to beexceeded more than35 times a year
15-minute mean 31.12.2005

January 2012 Ipswich Borough Council
2011 Progress Report8
1.4 Summary of Previous Review and Assessments
Round 1The first round of air quality review and assessment was completed in March 2001 andconsisted of three stages, each reported separately and progressively looking into moredetailed analysis when required;
Stage 1 comprised of an initial study to identify which pollutants required furtherinvestigation;
Stage 2 required estimating, modelling or measuring pollutants where there was anindication that national objectives would not be achieved; and
Stage 3 involved using advanced modelling techniques and emissions inventories.
The final assessment (third stage report) concluded that the Air Quality Objectiveswould be met. There were, however, some areas of concern where levels of nitrogendioxide from road traffic pollution were expected to be close to reaching the objectivelevel and the need to keep these under review was recognised.
Round 2In 2003, all local authorities were required to complete a second round of air qualityreviews and assessments. The Government issued guidance to assist with this and todirect authorities on the methodology for completing the review. The first stage of thereview was an Updating and Screening Assessment (USA). This was based on achecklist to identify those matters that had changed since the first review completed in2001 and which required further assessment. The USA covered new monitoring data,new sources of pollution and other changes that affected air quality.
The Council’s USA, completed in December 2003, concluded that further detailedassessments of nitrogen dioxide from road traffic sources and particulate matter froman industrial source were required to determine whether air quality objectives would beexceeded in 2005. In July 2005, further detailed assessments were completed inrespect of the impact of road traffic on concentrations of nitrogen dioxide in StMargaret’s Street, Norwich Road/Chevallier Street junction and the Star Lane gyratorysystem/St Helen’s Street. The assessment was completed using a dispersion model,traffic and meteorological data and an ambient real time continuous monitor to produceconcentration plots for 2005 and 2010.
The results of the detailed assessments for nitrogen dioxide indicated that the annualmean objective pollution level would be exceeded along most of the roads under study.In places, the exceedance of the 40μg/m3 annual mean standard extended 50 metresfrom the kerb into residential areas.
Under Section 83(1) of the Environment Act 1995, local authorities have to designateareas with a predicted exceedance of the Air Quality Objectives as Air Quality

Ipswich Borough Council – England January 2012
2011 Progress Report 9
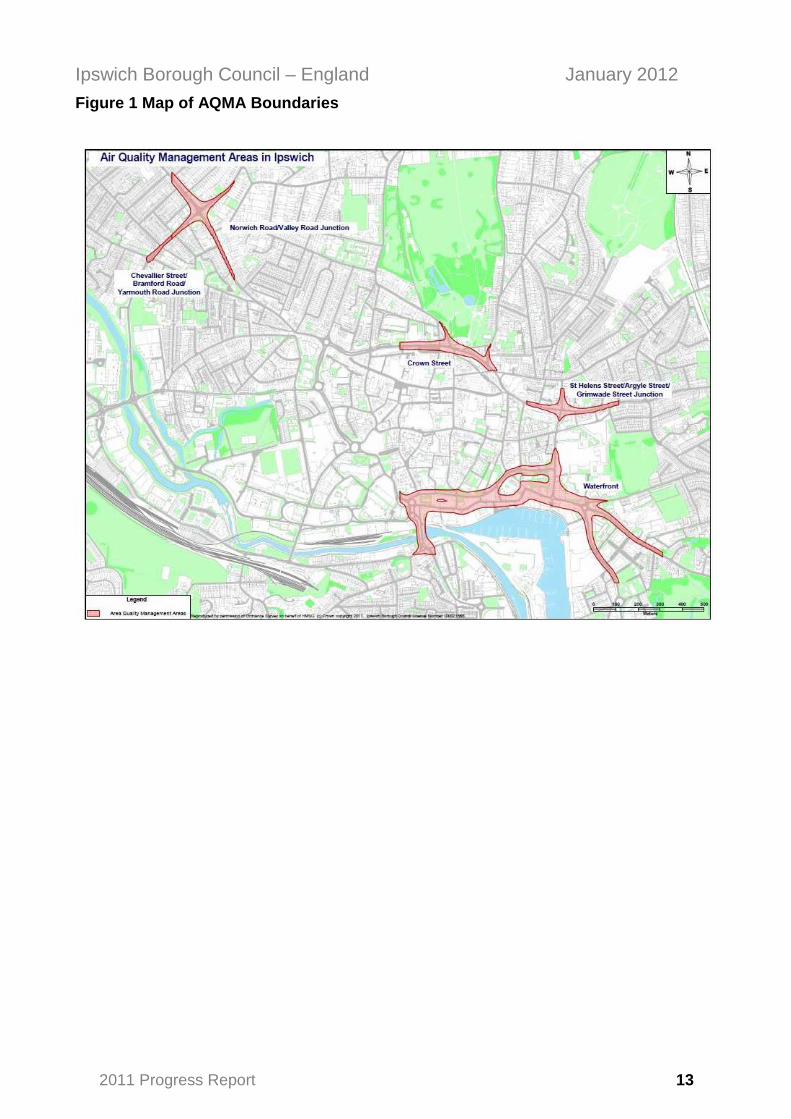
Management Areas (AQMAs). Ipswich Borough Council declared three AQMAs on the11th of April 2006:
Ipswich Air Quality Management Order No 1, 2006: Norwich Road, ChevallierStreet and Valley Road
This junction is located on one of the main routes into Ipswich town centre withfour roads leading into a double mini roundabout (a map of the AQMA is shownin Figure 1).
Generally, the area around this junction is open with some green space andbuildings set back from the road. However, there is a public house (with flatabove) and some residential flats that are both located adjacent to the junction.In addition, one road, Chevallier Street, leading from the roundabout hasterraced properties facing directly onto a pavement.
Ipswich Air Quality Management Order No 2, 2006: Junction of Crown Streetwith Fonnereau Road and St Margaret’s Street and St Margaret’s Plain
This AQMA includes four roads all leading off each other (a map of the AQMA isshown in Figure 1). There are main traffic lights at the junction of St Margaret’sStreet and St Margaret’s Plain and pedestrian crossing lights just beyond thejunction of Crown Street and Fonnereau Road. The area along St Margaret’sStreet is partially canyoned.
St Margaret’s Street has historically been flanked by flats on one side, and avacant building on the other. The vacant building has recently been demolishedbut historic permission has been given for this to be turned into residentialdwellings. There are residential buildings on all roads within the AQMA.
Ipswich Air Quality Management Order No 3, 2006: Star Lane gyratory systemand St Helen’s Street/Grimwade Street
The gyratory system is a circular network of one-way roads located next to thedocks (a map of the AQMA is shown in Figure 1). There are many residentialdwellings (mainly high-rise flats) within these areas and some commercial andoffice buildings. Further development of the Gyratory system and Dockside isongoing, although slower in recent times.
Traffic flow through many of the areas of this AQMA can be congested.
The Department for Environment, Food and Rural Affairs (DEFRA) also requires thatlocal authorities should submit annual air quality (Progress Reports) in between threeyearly USAs. This is to provide a means of ensuring that air quality review is acontinuous process and act as a timely indication of the need for measures to improveair quality, rather than delaying for three years until a full review is carried out. IpswichBorough Council completed a Progress Report in September 2005.
Round 3

January 2012 Ipswich Borough Council
2011 Progress Report10
The third round of review and assessment commenced in 2006 to enable localauthorities to determine whether Air Quality Objectives in their areas would be met byspecific target dates by means of a USA review. Ipswich Borough Council completed itsUSA in January 2008. The USA concluded that four of the seven prescribed pollutantswere likely to meet their Air Quality Objectives and as such a Detailed Assessment wasnot required. However, it was found that further screening works for Benzene, NitrogenDioxide (NO2) and particulates (PM10) were required, as well as a Detailed Assessmentof both NO2 and PM10 at the Yarmouth Road/ Bramford Road and Chevalier StreetJunction.
The Detailed Assessment, recommended in the USA, was completed in draft inDecember 2009 and finalised August 2010, and concluded that there were likely to beexceedances of the annual mean NO2 objective at this location. It was unlikely that thehourly objective will be exceeded. The predicted exceedances of the annual meanobjective can be attributed to slow moving vehicles, congestion and queuing traffic. Anew AQMA was declared in December 2010 and is shown on figure 1:
Ipswich Air Quality Management Order No. 4, 2010: Bramford Road/YarmouthRoad/Chevallier Street junction.
For the pollutant PM10, modelling indicated a very unlikely risk of exceeding the annualmean PM10 objective in the base year and the future year of 2010.
The screening works resulting from the round 3 USA have been completed as part ofround 4 USA. At the advice of DEFRA, the information usually included in a progressreport has also been incorporated into the round 4 document.
Round 4The fourth and current round of review and assessment began in 2009. The USA wascompleted in January 2010. The USA concluded that five of the seven prescribedpollutants were likely to meet the Air Quality Objectives. However, it was found that aDetailed Assessment for NO2 was required for the Civic Drive/St Matthews Streetjunction and St Helens Street, along with a Detailed Assessment of both NO2 and PM10
at a Biomass Boiler on Nacton Road. The Detailed Assessment of NO2 and PM10 at aBiomass Boiler on Nacton Road was completed in September 2011 and concluded thatthere was no need for any further assessments of this process. Further screening forNO2 and PM10 at the Reg Driver Centre, Christchurch Park was also required and wasreported in the 2010 Progress Report which was completed in October 2010. It wasfound that the emissions rates from the Reg Driver Centre were well below thoserequiring further investigation or screening.
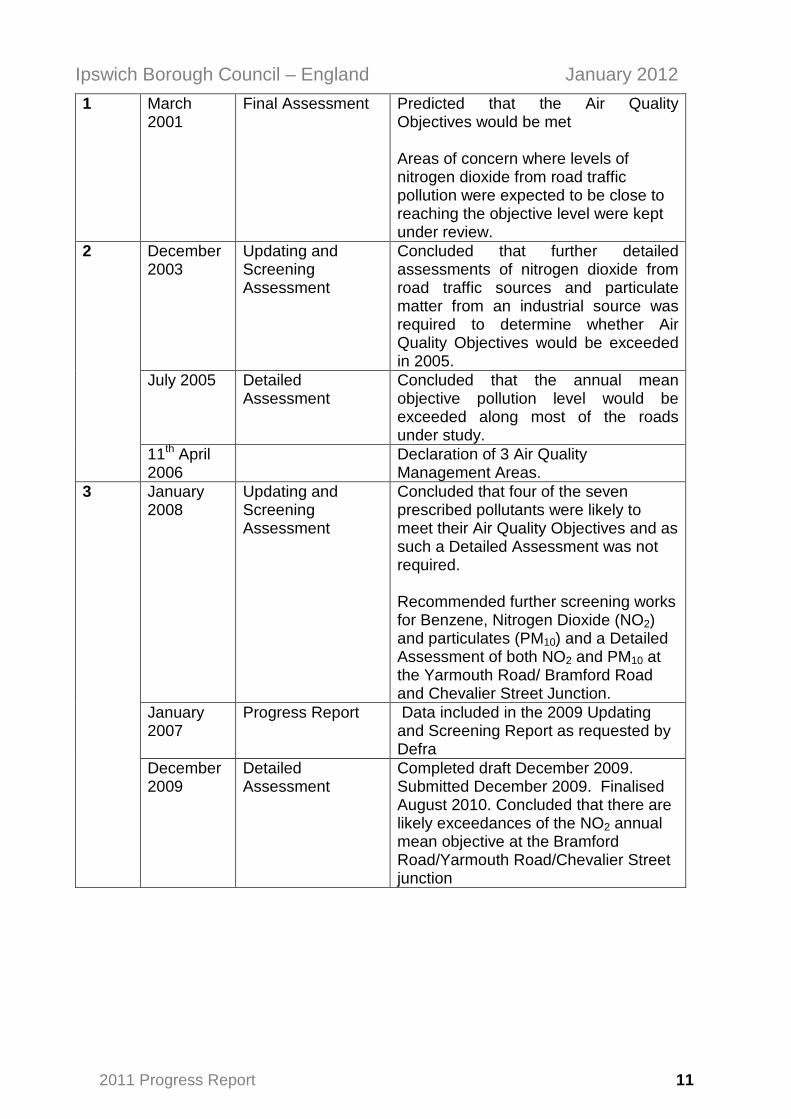
SummaryThe various stages of the previous review and assessments are summarised in Table1.2.
Table 1.2 Summary of previous review and assessments carried out byIpswich Borough Council
Round Date Type ofAssessment
Conclusion/Outcome
Ipswich Borough Council – England January 2012
2011 Progress Report 11
1 March2001
Final Assessment Predicted that the Air QualityObjectives would be met
Areas of concern where levels ofnitrogen dioxide from road trafficpollution were expected to be close toreaching the objective level were keptunder review.
December2003
Updating andScreeningAssessment
Concluded that further detailedassessments of nitrogen dioxide fromroad traffic sources and particulatematter from an industrial source wasrequired to determine whether AirQuality Objectives would be exceededin 2005.
July 2005 DetailedAssessment
Concluded that the annual meanobjective pollution level would beexceeded along most of the roadsunder study.
2
11th April2006
Declaration of 3 Air QualityManagement Areas.
January2008
Updating andScreeningAssessment
Concluded that four of the sevenprescribed pollutants were likely tomeet their Air Quality Objectives and assuch a Detailed Assessment was notrequired.
Recommended further screening worksfor Benzene, Nitrogen Dioxide (NO2)and particulates (PM10) and a DetailedAssessment of both NO2 and PM10 atthe Yarmouth Road/ Bramford Roadand Chevalier Street Junction.
January2007
Progress Report Data included in the 2009 Updatingand Screening Report as requested byDefra
3
December2009
DetailedAssessment
Completed draft December 2009.Submitted December 2009. FinalisedAugust 2010. Concluded that there arelikely exceedances of the NO2 annualmean objective at the BramfordRoad/Yarmouth Road/Chevalier Streetjunction

January 2012 Ipswich Borough Council
2011 Progress Report12
January2010
Updating andScreeningAssessment
Concluded that a Detailed Assessmentfor nitrogen dioxide is required at St-Matthew’s Street and St-Helen’s Street.A Detailed Assessment was alsorequired for a 2.90MW biomasscombustion plant on Nacton Road forparticulate matter with considerationgiven to nitrogen dioxide. Particulatematter and nitrogen dioxide emissionsfrom the Reg Driver Centre,Christchurch Park, Ipswich alsorequired further screening work.
October2010
Progress Report Further investigation of emissions ofparticulate matter and nitrogen dioxideemissions from the Reg Driver Centre,Christchurch Park, Ipswich concludedthat they are well below those requiringfurther investigation or screening.Particulate monitoring at one locationwithin the borough shows noexceedances of the objective levels.Six new or previously unidentified localdevelopments were acknowledged asrequiring further investigation during thenext Updating and ScreeningAssessment, scheduled for 2012.
21December2010
Declaration of Air Quality ManagementArea – Bramford Road/ChevallierStreet junction.
4
September2011
DetailedAssessment
NO2 and PM10 at a Biomass Boiler onNacton Road – concluded noexceedances of objective levels.
Ipswich Borough Council – England January 2012
2011 Progress Report 13
Figure 1 Map of AQMA Boundaries
January 2012 Ipswich Borough Council
2011 Progress Report14
2 New Monitoring Data
2.1 Summary of Monitoring Undertaken
2.1.1 Automatic Monitoring Sites
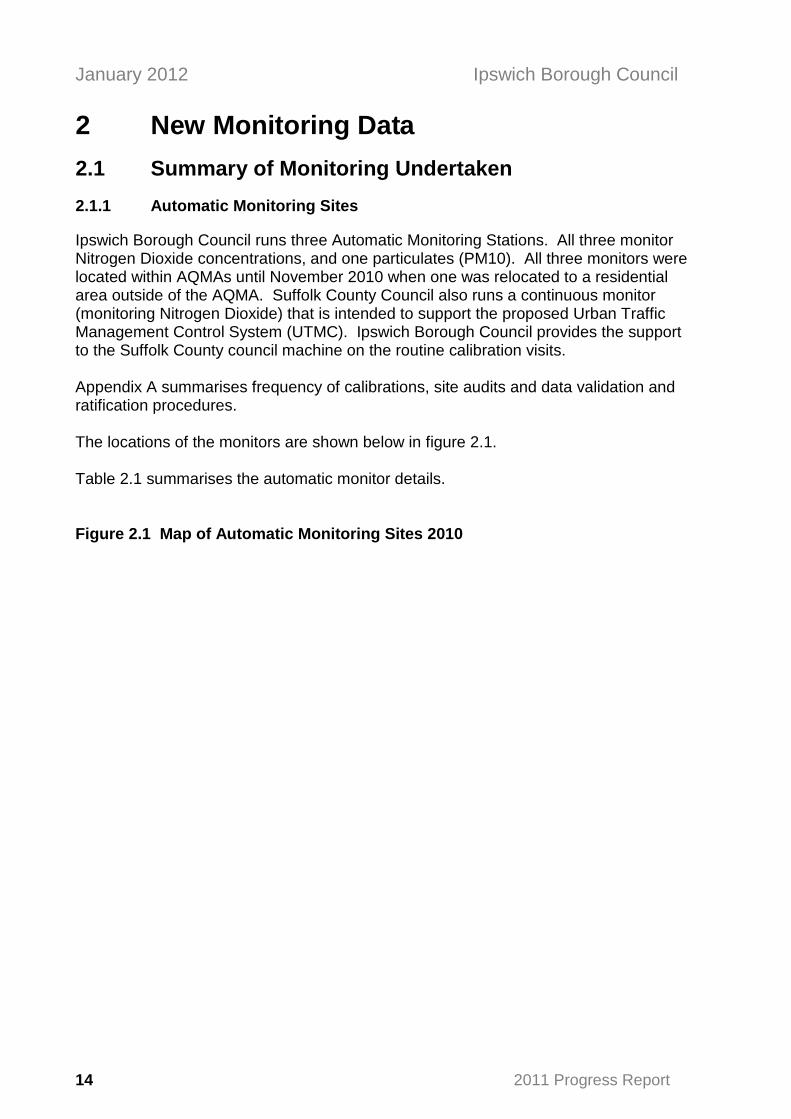
Ipswich Borough Council runs three Automatic Monitoring Stations. All three monitorNitrogen Dioxide concentrations, and one particulates (PM10). All three monitors werelocated within AQMAs until November 2010 when one was relocated to a residentialarea outside of the AQMA. Suffolk County Council also runs a continuous monitor(monitoring Nitrogen Dioxide) that is intended to support the proposed Urban TrafficManagement Control System (UTMC). Ipswich Borough Council provides the supportto the Suffolk County council machine on the routine calibration visits.
Appendix A summarises frequency of calibrations, site audits and data validation andratification procedures.
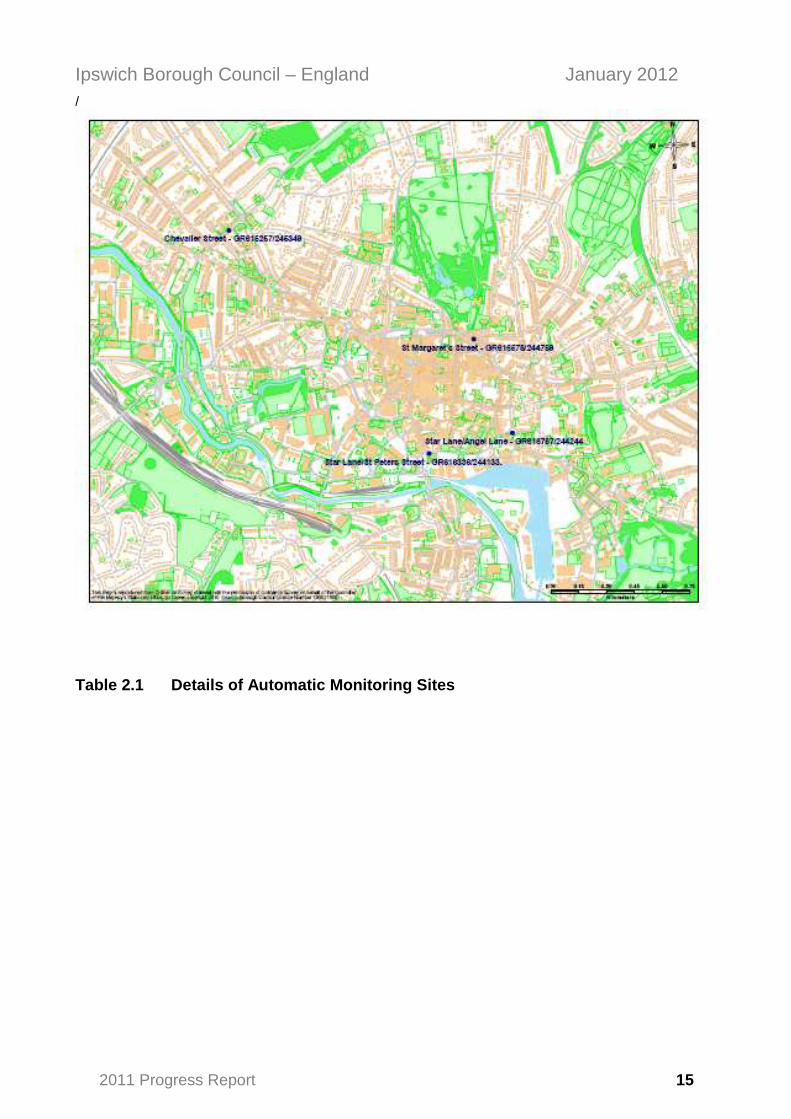
The locations of the monitors are shown below in figure 2.1.
Table 2.1 summarises the automatic monitor details.
Figure 2.1 Map of Automatic Monitoring Sites 2010
Ipswich Borough Council – England January 2012
2011 Progress Report 15
/
Table 2.1 Details of Automatic Monitoring Sites

January 2012 Ipswich Borough Council
2011 Progress Report16
Site Name Site Type OS Grid RefPollutantsMonitored
MonitoringTechnique
InAQMA?
RelevantExposure?
(Y/N withdistance (m) to
relevantexposure)
Distance tokerb of
nearest road(N/A if notapplicable)
Does thislocation
representworst-caseexposure?
Star Lane/AngelLane
Urban Roadside 616787 244244NO2 andPM10
FDMSTEOM
YY (across road,approx 20m)
3
Yes – closer toheavily usedtraffic lane thanrelevantexposure acrossthe road near lowusage bus lane.
Chevallier Street Urban Roadside 615257 245349 NO2 Y
Y (next doorresidentialpropertiesequal distancefrom kerb,approx 2.5m)
2.5 Yes
St Margarets Street Urban Roadside 616578 244759 NO2 Y
Y (sitedimmediatelyadjacent toresidentialproperty 3m)
3 Yes
Star Lane/opp StPeters Street
Urban Roadside 616336 244133 NO2 Y
N (placedalongsideproposeddevelopmentareas withinAQMA). Hotelacross road.
2.5
Yes. Located onfootpath nearheavily usedroad which hasfrequentcongestion.

Ipswich Borough Council – England January 2012
2011 Progress Report 17
2.1.2 Non-Automatic Monitoring Sites
During 2010, Ipswich Borough Council carried out non-automatic monitoring of NO2
using diffusion tubes located in 74 different sites in the borough. 91 diffusion tubesmonitor kerbside and roadside concentrations of NO2 and 2 diffusion tubes monitorbackground concentrations of NO2. A large number of the tubes were placed part waythrough the year and as such limited results have been obtained for 2010. Only theresults for those sites with over 9 months worth of data have been included in thisreport. The results from the other monitoring locations will be listed in future reports.
During 2010 the tubes were supplied to Ipswich Borough Council from HarwellScientifics. The preparation method was 50% TEA in Acetone. A summary of theQA/QC information is reported in Appendix A.
The bias adjustment figure applied to the diffusion tube results is a local factor of 0.87as a local average unless the site is very similar to one of the two continuous monitorsused to calculate the bias when a factor of 0.94 was used based on the monitor at StMargarets Street, or 0.8 based on the monitor on Chevallier Street. A national co-location study gives a bias adjustment factor of 0.85.
Figure 2.2 Map of Non-Automatic Monitoring Sites

January 2012 Ipswich Borough Council
2011 Progress Report18

Ipswich Borough Council – England January 2012
2011 Progress Report 19

January 2012 Ipswich Borough Council
2011 Progress Report20
Table 2.2 Details of Non- Automatic Monitoring Sites
Site Name Tube No Site Type OS Grid RefPollutantsMonitored
InAQMA
?
RelevantExposure?
Estimated distanceof diffusion tube to
kerb of nearestroad
Worst-case Location?
Civic Drive1
UrbanRoadside
615999/244399 NO2 N
Yes. Residentialproperties located
equal distance fromkerb.
3.8m Y
ChevallierStreet o/s no.
6&82
UrbanRoadside
615142/245242NO2 Y
Yes. On façade ofproperty
1.7m Y
Dock Street3 Urban
Roadside616379/243894 NO2 Y
Yes. Residentialproperties located
approximately 4.6mfrom kerb.
2.8m Y
Berners Streeto/s No.31 4
UrbanRoadside
615923/244923 NO2 NYes. Residential
properties located1.7m from kerb.
1.7m Y
Fore Street 5Urban
Roadside616860/244147 NO2 Y No. 1.7m Y
Kings Avenue6
UrbanBackground
617299/244412 NO2 NLocated in park as
background reading.14.6m N/A
Nacton Road7 Urban
Roadside618974/242291 NO2 N
Yes. Residentialproperties located
approximately 8.5mfrom kerb.
3.8m Y
NactonRd/A14 junct
8 Suburban 620078/241263 NO2 N
Yes. Residentialproperties located
approximately 35.8mfrom the kerb.
30.3m Y
NactonRd/A14 junct
9 Suburban 620078/241263 NO2 N
Yes. Residentialproperties located
approximately 35.8mfrom the kerb.
30.3m Y
WoodbridgeRd East
10 Suburban 619294/245109 NO2 N
Yes. Residentialproperties locatedapproximately 12m
from the kerb.
10.2m Y
St Margaret's Urban 616578/244759 NO2 Y Yes. Residential 2.2m Y

Ipswich Borough Council – England January 2012
2011 Progress Report 21
Street, PipersCourt
11 Roadside properties locatedapproximately 2.2m
from kerb.
St Margaret’sStreet, Pipers
Court co-location
12 UrbanRoadside
616578/244759 NO2 Y
Yes. Residentialproperties located
approximately 2.2mfrom kerb.
2.2m Y
St Margaret’sStreet, Pipers
Court co-location
19 UrbanRoadside
616578/244759 NO2 Y
Yes. Residentialproperties located
approximately 2.2mfrom kerb.
2.2m Y
Valley/Norwich Road 13
UrbanRoadside
615361/245436 NO2 YYes. Residential
approximately 5.5mfrom the kerb.
2.9m Y
Valley/Norwich Road
16 UrbanRoadside
615361/245436 NO2 Y
Yes. Residentialproperties located
approximately 2.6mfrom the kerb.
2.9m Y
Tavern Street15
Urban Centrebackground
616277/244641 NO2 N
Yes (background).Shops located
approximately 0.5mfrom kerb. Pedestrian-only road with limited
traffic flow in themorning and evening
for loading andunloading.
On pedestrianisedstreet
N/A
ChevallierStreet, outside
number 63
14 UrbanRoadside
615283/245391 NO2 Y
Yes. Residentialproperties located
approximately 2.6mfrom kerb.
2.6m Y
ChevallierStreet, outside
number 63
17 UrbanRoadside
615283/245391 NO2 Y
Yes. Residentialproperties located
approximately 2.6mfrom kerb.
2.6m Y
Norwich/Blenheim Road
18 UrbanRoadside
615269/245460 NO2 Y
Yes. Residentialproperties located
approximately 30.2mfrom kerb.
1.5m Y
St Margaret'sPlain/Fonnere
au Road
20 UrbanRoadside
616455/244824 NO2 YYes. Flats and shopslocated approximately
2.2m from kerb.2.2m Y

January 2012 Ipswich Borough Council
2011 Progress Report22
St Margaret'sPlain
21 UrbanRoadside
616490/244806 NO2 Y
Yes. Residentiallocated approximately1.7m from kerb, 9m
down road from tube.
1.7m Y
St Margaret'sPlain/Northgat
e St
22 UrbanRoadside
616477/244790 NO2 YYes. Public house
located approximately1.5m from kerb.
1.6m Y
St Margaret'sGreen/ StMargaret's
Street
23 UrbanRoadside
616641/244781 NO2 Y
Yes. Residentialproperties locatedapproximately 3m
from kerb.
3m Y
St Margaret'sStreet
24 UrbanRoadside
616659/244689 NO2 YYes. Residential
properties located3.2m from kerb.
3m Y
St Helen'sStreet
25Urban
Roadside616750/244578 NO2 Y
Yes. Flats locatedapproximately 2.2m
from kerb.1.3m Y
St Helen'sSt/Grimwade
Street
26 UrbanRoadside
616968/244510 NO2 Y
Yes. Residentialproperties located
approximately 3.6mfrom kerb.
3.6m Y
St Helen'sSt/Argyle
Street
27 UrbanRoadside
616961/244536 NO2 YYes. Flats located
approximately 1.7mfrom kerb.
1.5m Y
St Helen'sSt/DoveStreet
28 UrbanRoadside
617023/244508 NO2 Y
Yes. Public house andflats located
approximately 1.9mfrom kerb.
1.5m Y
Fore Hamlet 29Urban
Roadside617102/244077 NO2 Y
Yes. Flats locatedapproximately 2.2m
from kerb.2.2m Y
Fore Street 30Urban
Roadside616963/244106 NO2 Y
Yes. Flats locatedapproximately 7.7m
from kerb.4m Y
Star Lane(opp St Peters
Street)
31 UrbanRoadside
616336/244133 NO2 Y
No. Hotel locatedacross road.
Proposeddevelopment sites in
area.
2.4m N
Star Lane(opp St Peters
Street)
32 UrbanRoadside
616336/244133 NO2 YNo. Hotel located
across road.Proposed
2.4m N

Ipswich Borough Council – England January 2012
2011 Progress Report 23
development sites inarea.
Star Lane(opp St Peters
Street)
33 UrbanRoadside
616336/244133 NO2 Y
No. Hotel locatedacross road.
Proposeddevelopment sites in
area.
2.4m N
College Street 34Urban
Roadside616466/244072 NO2 Y
Yes. Residentialproperties located1.7m from kerb.
1.7m Y
Cobden Place 35Urban
Roadside616743/222696 NO2 Y
Yes. Residentialproperties located1.1m from kerb.
1.1m Y
FranciscanWay/Wolsey
Street
36 UrbanRoadside
616153/244242 NO2 NYes. Residential
properties located1.85m from kerb.
1.85m Y
Lower BrookStreet 37
UrbanRoadside
616480/244163 NO2 YNo. Offices located
3.5m from kerb.2.8m Y
Civic Drive byVictoria PH
38Urban
Roadside615898/244789 NO2 N
Yes. Residentialproperties located7.2m from kerb.
1m Y
StarLane/Fore
Street
39 UrbanRoadside
616730/244246 NO2 Y No. 0.6m Y
Star Lane/Angel Lane
40 UrbanRoadside
616787/244244 NO2 Y
Yes. Residentialproperties locatedacross road (20m),equal distance from
kerb.
3m Y
Star Lane/Angel Laneco-location
41 UrbanRoadside
616787/244244 NO2 Y
Yes. Residentialproperties locatedacross road (20m),equal distance from
kerb.
3m Y
Star Lane/Angel Laneco- location
42 UrbanRoadside
616787/244244 NO2 Y
Yes. Residentialproperties locatedacross road (20m),equal distance from
kerb.
3m Y
YarmouthRd/Bramford
Road
43 UrbanRoadside
615107/245197 NO2 NYes. Residential
properties locatedapproximately 4.8m
3.8m Y

January 2012 Ipswich Borough Council
2011 Progress Report24
from kerb.
BramfordRoad
44Urban
Roadside615049/245234 NO2 N
Yes. Residentialproperties located
approximately 1.4mfrom kerb.
1.4m Y
ChevallierStreet,
WellingtonCentre
45 UrbanRoadside
615257/245349 NO2 Y
Yes. Residentialproperties short
distance along road6.4m from kerb.
4.1m Y
ChevallierStreet,
WellingtonCentre co-
location
46Urban
Roadside615257/245349 NO2 Y
Yes. Residentialproperties short
distance along road6.4m from kerb
4.1m Y
ChevallierStreet,
WellingtonCentre co-
location
47Urban
Roadside615257/245349 NO2 Y
Yes. Residentialproperties short
distance along road6.4m from kerb.
4.1m Y
NorwichRd/Anglesea
Road
48 UrbanRoadside
615397/245337 NO2 YYes. Residential
located approximately1.8m from kerb.
1.8m Y
St MatthewsStreet
49 UrbanRoadside
615803/244872 NO2 N
Yes. Residentialproperties located
approximately 1.8mfrom kerb.
1.8m Y

Ipswich Borough Council – England January 2012
2011 Progress Report 25
2.2 Comparison of Monitoring Results with Air QualityObjectives
2.2.1 Nitrogen Dioxide
Automatic Monitoring Data
Table 2.3a summarises the results of the automatic monitoring of Nitrogen Dioxidewithin the Ipswich borough compared to the annual average objective. Table 2.3bshows the same monitoring data, but compared to an hourly average objective.
Table 2.3a Results of Automatic Monitoring for Nitrogen Dioxide: Comparisonwith Annual Mean Objective
Annual meanconcentrations (g/m3)
LocationWithin
AQMA?
Relevantpublic
exposure?Y/N
DataCapture formonitoring
period%
DataCapture for
fullcalendar
year2010
%
2008 2009 2010
StarLane/AngelLane
Y Y (acrossroad, approx20m)
88.51 88.51 - 382 401
ChevallierStreet
Y Y (next doorresidentialpropertiesequaldistancefrom kerb,approx2.5m)
87.5 87.5 31 32 34
St MargaretsStreet
Y Y (sitedimmediatelyadjacent toresidentialproperty 3m)
99.3 99.3 46 48 51
Star Lane/oppSt PetersStreet
Y N (placedalongsideproposeddevelopmentareas withinAQMA).Hotel acrossroad.
99.7 99.7 - 41.63 51.3
1 Monitoring carried out November 2009 – November 2010
2 April – December
3 March - December
The annual average objective is exceeded at three of the four automatic monitoringlocations. The trend in the annual mean nitrogen dioxide concentrations is that ofincreasing concentrations across all automatic monitoring sites.
January 2012 Ipswich Borough Council
2011 Progress Report26
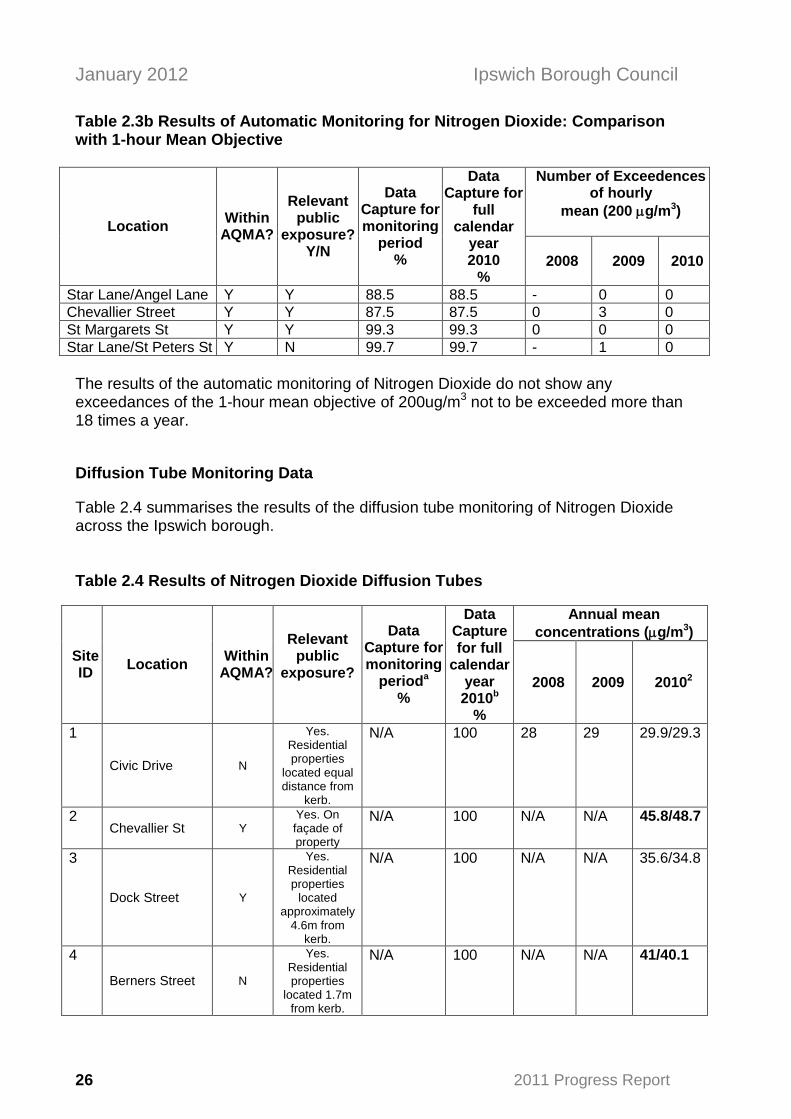
Table 2.3b Results of Automatic Monitoring for Nitrogen Dioxide: Comparisonwith 1-hour Mean Objective
Number of Exceedencesof hourly
mean (200 g/m3)Location
WithinAQMA?
Relevantpublic
exposure?Y/N
DataCapture formonitoring
period%
DataCapture for
fullcalendar
year2010
%2008 2009 2010
Star Lane/Angel Lane Y Y 88.5 88.5 - 0 0Chevallier Street Y Y 87.5 87.5 0 3 0St Margarets St Y Y 99.3 99.3 0 0 0Star Lane/St Peters St Y N 99.7 99.7 - 1 0
The results of the automatic monitoring of Nitrogen Dioxide do not show anyexceedances of the 1-hour mean objective of 200ug/m3 not to be exceeded more than18 times a year.
Diffusion Tube Monitoring Data
Table 2.4 summarises the results of the diffusion tube monitoring of Nitrogen Dioxideacross the Ipswich borough.
Table 2.4 Results of Nitrogen Dioxide Diffusion Tubes
Annual meanconcentrations (g/m3)
SiteID
LocationWithin
AQMA?
Relevantpublic
exposure?
DataCapture formonitoring
perioda
%
DataCapturefor full
calendaryear2010b
%
2008 2009 20102
1
Civic Drive N
Yes.Residentialproperties
located equaldistance from
kerb.
N/A 100 28 29 29.9/29.3
2Chevallier St Y
Yes. Onfaçade ofproperty
N/A 100 N/A N/A 45.8/48.7
3
Dock Street Y
Yes.Residentialproperties
locatedapproximately
4.6m fromkerb.
N/A 100 N/A N/A 35.6/34.8
4
Berners Street N
Yes.Residentialproperties
located 1.7mfrom kerb.
N/A 100 N/A N/A 41/40.1

Ipswich Borough Council – England January 2012
2011 Progress Report 27
5 Fore Street Y No. N/A 100 39 43 52.1/47.16
Kings Avenue N
Located inpark as
backgroundreading.
N/A 91.7 18 20 19.7/19.2
7
Nacton Road N
Yes.Residentialproperties
locatedapproximately
8.5m fromkerb.
N/A 100 N/A 26 29.7/29
8
Nacton Rd/A14 N
Yes.Residentialproperties
locatedapproximately
35.8m fromthe kerb.
N/A 100 N/A 27 27.8/27.2
9
Nacton Rd/A14 N
Yes.Residentialproperties
locatedapproximately
35.8m fromthe kerb.
N/A 100 N/A 28 29.4/28.7
10
Woodbridge Rd East N
Yes.Residentialproperties
locatedapproximately12m from the
kerb.
N/A 100 N/A 25 28.4/27.8
11
St Margarets St Y
Yes.Residentialproperties
locatedapproximately
2.2m fromkerb.
N/A 100 46 51 50/45.2
12
St Margarets St Y
Yes.Residentialproperties
locatedapproximately
2.2m fromkerb.
N/A 100 45 50 51.4/46.5
19
St Margarets St Y
Yes.Residentialproperties
locatedapproximately
2.2m fromkerb.
N/A 83.3 42 50 49.8/45.1
13
Valley Rd/Norwich RdY
Yes.Residential
approximately5.5m from the
kerb.
N/A 100 38 38 39.9/39
14
Chevallier St Y
Yes.Residentialproperties
locatedapproximately2.6m from the
kerb.
N/A 100 44 46 54.7/58.1

January 2012 Ipswich Borough Council
2011 Progress Report28
17
Chevallier St Y
Yes.Residentialproperties
locatedapproximately
2.6m fromkerb.
N/A 91.7 43 48 56.6/60.1
15
Cornhill N
Yes(background).
Shopslocated
approximately0.5m from
kerb.Pedestrian-
only road withlimited traffic
flow in themorning andevening forloading andunloading
N/A 100 25 32 30.9/30.2
16
Valley/Norwich Rd Y
Yes.Residentialproperties
locatedapproximately
2.6m fromkerb.
N/A 100 37 40 41.9/41
18
Norwich/Blenheim RdY
Yes.Residentialproperties
locatedapproximately
30.2m fromkerb.
N/A 100 28 32 34.7/33.9
20
St MargaretsPlain/Fonn Rd
Y
Yes. Flatsand shops
locatedapproximately
2.2m fromkerb.
N/A 100 34 36 34.8/34
21
St Margarets Plain Y
Yes.Residential
locatedapproximately
1.7m fromkerb, 9m
down roadfrom tube.
N/A 100 32 40 41.3/40.3
22St MargaretsPlain/Northgate St
Y
Yes. Publichouse locatedapproximately
1.5m fromkerb.
N/A 100 37 39 45/43.9
23
St Margarets Green Y
Yes.Residentialproperties
locatedapproximately3m from kerb.
N/A 100 N/A N/A 26.9/26.3
24
St Margarets St N
Yes.Residentialproperties
located 3.2mfrom kerb.
N/A 100 42 45 51/46.1

Ipswich Borough Council – England January 2012
2011 Progress Report 29
25
St Helens St N
Yes. Flatslocated
approximately2.2m from
kerb.
N/A 91.7 45 47 49.6/48.5
26
St HelensSt/Grimwade St
Y
Yes.Residentialproperties
locatedapproximately
3.6m fromkerb.
N/A 100 N/A 40 43.2/42.2
27
St Helens St/Argyle StY
Yes. Flatslocated
approximately1.7m from
kerb.
N/A 100 40 43 48.7/47.6
28
St Helens St/Dove St Y
Yes. Publichouse and
flats locatedapproximately
1.9m fromkerb.
N/A 100 29 32 31.4/30.7
29
Fore Hamlet Y
Yes. Flatslocated
approximately2.2m from
kerb.
N/A 91.7 32 36 40.4/39.4
30
Fore Street Y
Yes. Flatslocated
approximately7.7m from
kerb.
N/A 91.7 39 34 34.3/33.5
31
Star Lane Y
No. Hotellocated
across road.Proposed
developmentsites in area.
N/A 100 N/A 39 40
32
Star Lane Y
No. Hotellocated
across road.Proposed
developmentsites in area.
N/A 100 N/A 39 39.1
33
Star Lane Y
No. Hotellocated
across road.Proposed
developmentsites in area.
N/A 100 N/A 38 39.8
34
College St Y
Yes.Residentialproperties
located 1.7mfrom kerb.
N/A 91.7 N/A N/A 45.5/44.5
35
Cobden Place N
Yes.Residentialproperties
located 1.1mfrom kerb.
N/A 100 N/A N/A 30/29.3
36
FranciscanWay/Wolsey St
N
Yes.Residentialproperties
located1.85m from
kerb.
N/A 100 N/A N/A 37.3/36.4

January 2012 Ipswich Borough Council
2011 Progress Report30
37Lower Brook St Y
No. Officeslocated 3.5m
from kerb.
N/A 100 28 30 30.6/29.9
38
Civic Drive N
Yes.Residentialproperties
located 7.2mfrom kerb.
N/A 91.7 N/A N/A 41.7/40.8
39 Star Lane/Fore St Y No. N/A 100 45 48 48.5/47.440
Star Lane/Angel LaneY
Yes.Residentialproperties
locatedacross road(20m), equaldistance from
kerb.
100 83.3 N/A 36 38.6/35.3
41
Star Lane/Angel LaneY
Yes.Residentialproperties
locatedacross road(20m), equaldistance from
kerb.
100 83.3 N/A 36 39.7/36.3
42
Star Lane/Angel LaneY
Yes.Residentialproperties
locatedacross road(20m), equaldistance from
kerb.
100 83.3 N/A 35 38.1/34.8
43
YarmouthRd/Bramford Rd
Y
Yes.Residentialproperties
locatedapproximately
4.8m fromkerb.
N/A 100 40 43 45.5/44.4
44
Bramford Rd N
Yes.Residentialproperties
locatedapproximately
1.4m fromkerb.
N/A 100 343 43 46.4/45.3
45
Chevallier St Y
Yes.Residentialproperties
short distancealong road6.4m from
kerb.
N/A 100 30 35 35.3/37.5
46
Chevallier St Y
Yes.Residentialproperties
short distancealong road6.4m from
kerb
N/A 100 32 34 34.4/36.5

Ipswich Borough Council – England January 2012
2011 Progress Report 31
47
Chevallier St Y
Yes.Residentialproperties
short distancealong road6.4m from
kerb.
N/A 100 32 34 34.2/36.4
48
Norwich Rd/AngleseaRd
N
Yes.Residential
locatedapproximately
1.8m fromkerb.
N/A 100 28 32 33.1/32.4
49
St Matthews St N
Yes.Residentialproperties
locatedapproximately
1.8m fromkerb.
N/A 100 46 47 51.3/50.2
a i.e. data capture for the monitoring period, in cases where monitoring was only carried out for part of the year.b i.e. data capture for the full calendar year (e.g. if monitoring was carried out for six months the maximum data capture for the fullcalendar year would be 50%.).2Local average/national average bias adjusted tubes. Local bias adjustment factors of 0.8,0.87,0.94 applied dependent on locationof tube; national bias adjustment factor applied 0.85.3 Figure influenced by a low result one month.
As can be seen within table 2.4, the diffusion tube monitoring shows a number ofexceedances of the annual average objective. Of the locations showing an exceedance ofthe objective, just six are outside of existing AQMAs in the 2010 period. Four, BernersStreet, Civic Drive, St Margarets Street and St Matthews Street, are all within an areaundergoing a Detailed Assessment as a result of the 2009 USA report. The Civic Driveresult is reduced to well below the objective level once fall off with distance is calculated.The exceedance at Bramford Road will be considered as part of the Further Assessment ofthe AQMA.
Fall off with distance calculations have been applied to a number of the results as shown intable 2.5. However these results should be treated with caution as distances have beenestimated and tube and receptor locations are all within 3m of each other except for tubenumber 38.
Table 2.5 Results with distance fall off applied as relevant
Tube ID andLocation
Measured Resultug/m3
Result with fall off forDistance ug/m3 (1)
24 St Margarets Street 51/46.1 50.5/45.725 St Helens Street 49.6/48.5 46.3/45.327 St Helens Street/Argyle St 48.7/47.6 47.9/46.838 Civic Drive 41.7/40.8 32.9/32.443 Yarmouth Rd/Bramford Rd 45.5/44.4 43.8/42.8(1) Local Bias Correction Factor applied / National Bias Correction Factor applied.

January 2012 Ipswich Borough Council
2011 Progress Report32
2.2.2 PM10
Ipswich Borough Council has one automatic monitor that monitors concentrations ofPM10 along with NO2.
This monitor is a TEOM FDMS with a type C drier. It has been operational since April2009. Whilst it was located in an open space beside a busy urban road, it is ofapproximately equal distance from the kerbside of a busy traffic lane as the kerbside isto relevant receptor locations on the opposite side of the road near a less busy buslane and so is considered representative of worst case.
The monitor was re-located in November 2010 to an area where complaints of dusthave been received, upwind from a number of potential sources of particulates.
Table 2.6a Results of PM10 Automatic Monitoring: Comparison with Annual MeanObjective
Annual mean concentrations(g/m3)
LocationWithin
AQMA?
DataCapture formonitoring
period%
DataCapturefor full
calendaryear2010
%
2008 2009 2010
Star Lane/Angel Lane Y 84.11 84.11 - 23 231
1 November 2009 – November 2010
Table 2.6b Results of PM10 Automatic Monitoring: Comparison with 24-hour MeanObjective
Number of Exceedences ofdaily mean objective
(50 g/m3)LocationWithin
AQMA?
DataCapture formonitoring
period%
DataCapture
2010% 2008 2009 2010
Star Lane/Angel Lane Y 84.11 84.11- 6 111
1 November 2009 – November 2010

Ipswich Borough Council – England January 2012
2011 Progress Report 33
The results from the years worth of particulate monitoring show that neither the annualaverage objective of 40ug/m3 or the daily average of 50 ug/m3 (not to be exceededmore than 18 times a year), are exceeded.
The monitor has been relocated to a residential area where complaints of dust from the Portarea of Ipswich have been received, upwind from several sources of particulates.
2.2.3 Sulphur Dioxide
Ipswich Borough Council has not carried out any monitoring of Sulphur Dioxide.
2.2.4 Benzene
Ipswich Borough Council has not carried out any monitoring of Benzene.
2.2.5 Other pollutants monitored
Ipswich Borough Council has not carried out monitoring for any other pollutants.
2.2.6 Summary of Compliance with AQS Objectives
Ipswich Borough Council has examined the results from monitoring Particulates(PM10s) in the borough. Concentrations are all below the objective levels and there isno need to proceed to a Detailed Assessment.
Ipswich Borough Council has examined the results from monitoring Nitrogen Dioxidein the borough. Concentrations outside of the AQMAs are mainly below theobjectives at relevant locations. Where there is an exceedance outside of the AQMAthe concentrations of Nitrogen Dioxide are already being assessed as part of aDetailed or Further Assessment. There is no need for further Detailed Assessments.

January 2012 Ipswich Borough Council
2011 Progress Report34
3 New Local Developments
3.1 Road Traffic Sources
Ipswich Borough Council transport policy section confirms that there are no significantchanges to transport flows during 2010 which will impact on air quality.
3.2 Other Transport Sources
A new proposed rail link is under development within the Ipswich borough. Air Qualityis being considered during development.
3.3 Industrial Sources
Storage of petrol at Vopak has ceased.
Whilst not in the year 2010, it is relevant to note that the Environment Agency have onenew permitted installation at Anglian Water Services, Cliff Quay - a Biogas plant issuedin February 2011. This comprises of 2 spark ignition engines with combined thermalinput of 2.9MW and 2 hot water boilers with a thermal input of 1.4MW each.
The Environment Agency confirms that emissions from other permitted processeswithin Ipswich have had no significant change in emissions or have reduced emissions.
Donalds Garage, West End Road, was permitted for waste oil burning in 2010.
Tarmac Ltd Ipswich Works have moved premise to Cliff Road, Ipswich, Suffolk IP3 0AXfor both the cement batching and roadstone coating.
3.4 Commercial and Domestic Sources
A new Biomass Combustion plant is proposed for the Environment Agency site,Cobham Road.
There has been no obvious increase in areas of small individual biomass combustionwithin the borough. The council has not received significant numbers of complaintsabout nuisance dust or odour relating to burning and there is no obvious smell ofburning of solid fuel apart from isolated incidents around the borough. Properties withinthe Ipswich borough have access to mains gas and there are no known high level salesof solid fuel via home delivery or local outlets.

Ipswich Borough Council – England January 2012
2011 Progress Report 35
3.5 New Developments with Fugitive or UncontrolledSources
There are no new landfill sites or quarries within the Ipswich area, or immediatelyadjacent to it, that would affect air quality.
There were no known unmade haulage roads on industrial sites indentified during2010. Whilst a number of dust complaints were received by the Council, there were nostatutory nuisances witnessed.
There have been no new waste transfer stations in 2010.
The port area is a potential source of fugitive particulate emissions and a number ofdust complaints have been received. The particulate monitor has been located upwindfrom the Port to monitor levels of particulate in the residential area. No statutorynuisance has been witnessed.
Ipswich Borough Council has identified the following new or previously unidentifiedlocal developments which may impact on air quality in the Local Authority area.
Biogas plant at Anglian Water Services, Cliff QuayDonalds Garage, West End Road – waste oil burningBiomass Combustion plant proposed for the Environment Agency, Cobham RoadTarmac Ltd Ipswich Works have moved to Cliff Road, Ipswich.
These will be taken into consideration in the next Updating and ScreeningAssessment, scheduled for 2012.

January 2012 Ipswich Borough Council
2011 Progress Report36
4 Planning Applications
There have been a number of small and large scale applications/permissions fordevelopment across Ipswich. The area around the riverside has been undergoingconsiderable regeneration into a residential and commercial extension to the centre ofIpswich over a number of years alongside the development of student quarters aroundthe university. Air Quality is considered for each application with both the effect of theair quality on the new relevant receptors, and the effect of the development on the airquality of the area being assessed.
The following potential developments are identified as requiring further consideration atthe Updating and Screening Assessment stage:
Grafton Way – mixed use development.2-32 St Matthews Street – planning application for residential developmentKennings Site, Duke Street – planning application for mixed use development7-11 Great Whip Street – application for mixed use and heating/power plant.
Ipswich Borough Council – England January 2012
2011 Progress Report 37
5 Air Quality Planning Policies
The Suffolk Local Authority Air Quality group has written draft guidance on planningand air quality. This is currently undergoing final consultation and amendment. It ishoped that all the Suffolk authorities will adopt the guidance. The aim of the guidanceis to provide support to local authority air quality officers, planning officers andapplicants/consultants, along with improving consistency.

January 2012 Ipswich Borough Council
2011 Progress Report38
6 Local Transport Plans and Strategies
The Local Transport Plan, prepared in 2005 by Suffolk County Council, to run from2006 to 2011 is a county wide document for the purposes of stating transport policy:Suffolk County Council Local Transport Plan.
The Local Transport Plan contains information on the four shared priorities :accessibility, safety, congestion and air quality. It contains a chapter dedicated to AirQuality, (Ch 8) with the two main objectives stated as being:
■ to comply with the requirements of the National Air Quality Strategy
■ to seek to maintain and, where possible, improve air quality in Suffolk
An LTP2 Progress Report was prepared in the summer of 2008:LTP2 Progress Report . This document also included a dedicated chapter to air qualitywithin Suffolk.
The Ipswich Borough Council Environment Strategy has considerable information onthe role of the council in local transport strategy. The following extract is taken from theEnvironment Strategy and summarises ongoing work on sustainable travel:
‘Ipswich’s Role in Transport Strategy.As the Passenger Transport Authority and the Highway Authority, Suffolk CountyCouncil (SCC) is the statutory body responsible for determining transport policy in Ipswich.However, Ipswich does have significant powers provided through its HighwayAgency agreement with SCC. This means that Ipswich can undertake works withinthe highway without having to obtain permission, for example, making improvementsto sustainable transport provision such as cycle and pedestrian routes.Ipswich uses its discretionary powers to support public transport such as grants tosupport bus routes that are not commercially viable but socially desirable, theprovision of bus shelters and highway infrastructure work to aid access.The primary drivers for transport strategy are the Ipswich Transport Strategy (ITS)and the Council’s Local Transport Plan (LTP). The strategic objectives are to containthe growth in traffic and congestion by improving flow at key junctions whilstdiscouraging single occupancy car use in favour of walking, cycling and publictransport (modal shift). These aims are pulled together through the Ipswich MajorScheme ‘Ipswich – Transport Fit for the 21st Century’. The scheme contains apackage of sustainable transport measures covering the full range of travel patterns –in and around the town centre, between the town centre and the suburbs, and to andfrom the rural hinterland and towns. It comprises landmark changes to the town centrebus interchanges: expansion and improvement of other bus facilities; an Urban TrafficManagement and Control system; Real Time Passenger information system and adetailed programme of improvements to the walk/cycle routes and crossings. Thescheme aim is to achieve a 15% modal shift.In support of this there are two schemes to promote modal shift that will be underwayin 2010, Travel Smart and Ipswich Smiles.TravelSmart funded by Defra Greener Living Fund and Suffolk County Council withinput from IBC; offers individualised travel marketing and planning to 17,000

Ipswich Borough Council – England January 2012
2011 Progress Report 39
households in Ipswich. Delivered by the sustainable transport charity Sustrans, theproject encourages modal shift to cycling, walking and public transport. Focussed ontwo sectors, the inner ring around the town centre and a second area that adjoinsspecific bus routes; the project covers the following wards: Castle Hill, Rushmere, StMargarets, Westgate, Gipping, Alexandra, Bridge, Sprites and Stoke Park. Theprogramme aims to achieve modal shift of up to 15% in the target areas. Launching inSpring 2010 a final report will be made in Spring 2011.IpswichSmiles is a pilot scheme that is principally funded by ERDF & SCC withfurther financial contributions from public transport providers, Business ImprovementDistrict and business networks. The aim of the scheme is to encourage modal shift bysupporting small to medium sized local businesses (SMEs) in establishing travel plansin the organisation. The package will include technological innovations to makepublic transport more attractive, such as ticketing and timetabling by mobile phone,and a set of incentives and rewards for those travelling sustainably. The programmewill also include exploration of how businesses might be able to use salary sacrifice tosupport the purchase of bus passes through the payroll. The scheme aims are toachieve a 15% reduction in carbon emissions arising from travel & congestion andencourage modal shift of up to 15%.
Both schemes are exploring ways of delivering multi operator and journey ticketing.The vision is to create simple and equitable schemes that encourage greater travel bypassenger transport and promote accessibility to key services through provision ofaffordable travel. Multi operator ticketing schemes are considered particularlybeneficial for Ipswich, where two major operators provide commercial services.The Council is able to offer its own Green Travel Plan for staff travel as an exemplarof travel planning. Supported by charges for staff parking, the Plan offers discountedcommuting on public transport and encourages walking, cycling and car sharing. Staffsurveys indicate that the scheme is now achieving a level of 50% of staff travellingsustainably by bus, walking, cycling, rail or carsharing.’
The Travel Smart project referred to above has now been completed.

January 2012 Ipswich Borough Council
2011 Progress Report40
7 Climate Change Strategies
Ipswich Borough Council has not yet published a Climate Change Strategy. However,a comprehensive Environment Strategy has been adopted by the Council and is in theprocess of being updated.
The Environment Strategy is an overarching document which explains how otherstrategies, policies, and plans contribute to the councils environmental objectives.Included within the document is a brief summary of air quality work and the links toclimate change. The main link between the air quality work and the climate changework within Ipswich is on transport and the need to move to sustainable travel andreduce emissions to air. The Ipswich AQMAs exist because of congestion and highlevels of vehicle useage. Further detail on the Environment Strategy is given in chapter6 of this report.
It is intended that a Climate Change Adaption Strategy will be written during 2011/12.

Ipswich Borough Council – England January 2012
2011 Progress Report 41
8 Implementation of Action Plans

January 2012 Ipswich Borough Council
2011 Progress Report42
Table 9.1 Action Plan Progress
No Measure Focus Leadauthority
Planningphase
Implemen-tation phase
Indicator Targetannual
emissionreduction
in theAQMA
Progressto date
Progress inlast 12months
Estimated
comp-letiondate
Commentsrelating toemissionreductions
1 IpswichMajorScheme
Ensure AQ is fullyconsidered withinMajor Scheme andWaterside/Gyratoryroad networkalterations
a) Princes Streetroundaboutalterations
b) Bus StationImprovements
c) Cycling andwalking routes
SuffolkCountyCouncil
Detaileddesignduring2011
Constructionduring 2012and 2013
ReducedCongestionandpromotion ofsustainabletravel
>0.5ug/m3
Fundingconfirmedby Dft inFebruary2011
Air qualityassess-ments tobe carriedout for a)and b).
Design workis beingcarried out forthe differentcomponents
May2014
2 UrbanTrafficManage-mentControl(UTMC)
Reduce congestion byuse of UTMC whichrationalises flows
SuffolkCountyCouncil
This is amajorcom-ponent ofIpswichMajorScheme
Constructionduring 2012and 2013
Traffic wouldbe controlledto reducecongestionand reduceidling.
0.5-1ug/m
3Air QualityAssess-ments tobe carriedout for a)and b)above.
Design workhas started.Air qualityassessmentsto be carriedout to supportthe designprocess andensureoptimisation.
3 IdlingVehicles
Service of penaltynotices on idlingvehicles
IpswichBoroughCouncil
Raiseawareness ofimportance ofcar emissionsto air quality.
<0.5ug/m3
None None

Ipswich Borough Council – England January 2012
2011 Progress Report 43
No Measure Focus Leadauthority
Planningphase
Implemen-tation phase
Indicator Targetannual
emissionreduction
in theAQMA
Progressto date
Progress inlast 12months
Estimated
comp-letiondate
Commentsrelating toemissionreductions
4 RoadsideEmissionTesting
General roadside andbus emission campaignto ensure minimumstandards are adheredto.
IpswichBoroughCouncil
Raiseawareness ofimportance ofcar emissionsto air quality.
<0.5ug/m3
None None
5 EmploymentZoning
Identify where theHGVs are headedthrough the NorwichRoad/Chevallier Streetroundabout by camerasurveys. Identify moreappropriate lesspolluting routes
IpswichBoroughCouncil/SuffolkCountyCouncil
Re-routingHGVs reducesthe emissionsat thisjunction.
>0.5ug/m3
None None
6 BramfordRoad/Chev.Streetpedest-riancrossingreview
Pedestrian crossingmay be impacting oncongestion in AQMA
IpswichBoroughCouncil
Shouldreducecongestion oftraffic atlights.
<0.5ug/m3
None None
7 StMargaretsStreetSignalReview
Signals in St MargaretsStreet may beimpacting oncongestion
IpswichBoroughCouncil
Reducecongestion inAQMA
<1ug/m3
UrbanTrafficControl inplace
Ongoing Anticipatedfurtherimprove-ments aspart ofUTMCscheme.
8 ValleyRoadcycleLane
Cycle lane leading intomini roundabout
IpswichBoroughCouncil
EncourageCycling
<0.5ug/m3
Completed

January 2012 Ipswich Borough Council
2011 Progress Report44
No Measure Focus Leadauthority
Planningphase
Implemen-tation phase
Indicator Targetannual
emissionreduction
in theAQMA
Progressto date
Progress inlast 12months
Estimated
comp-letiondate
Commentsrelating toemissionreductions
9 Bus StopImprovements
All buses used on localstage carriage worksmust be accessible
SuffolkCountyCouncil
Encouragesbus use andreduces caruse
<1ug/m3
Ongoing
10 BusTimetableImprovements
To consolidate alltimetables into one andreal time information
SuffolkCountyCouncil
Encouragesbus use andreduces caruse by morecustomerfriendly time-tableinformation.
<0.5ug/m3
Bustimetablesandadditionalleaflets areavailableonhttp://www.suffolk.gov.uk/TransportAndStreets/PublicTransporttogetherwith othertimetablessuch asrail.Leafletshave beenmade morewidelyavailableacross thecounty.
On-going
There willbe real timebusinformationat thestation andat bus stopsas part ofMajorScheme.
11 BishopsHill BusLane
New bus lane toprioritise busmovement into town
SuffolkCountyCouncil
Will make busjourney fasterand
NEG-<0.5ug/m
3Schemecompletedand opened to

Ipswich Borough Council – England January 2012
2011 Progress Report 45
No Measure Focus Leadauthority
Planningphase
Implemen-tation phase
Indicator Targetannual
emissionreduction
in theAQMA
Progressto date
Progress inlast 12months
Estimated
comp-letiondate
Commentsrelating toemissionreductions
centre encouragebus use
traffic on 1st
August 201112 Train
ServiceImprovements
Signalling changes toimprove Ipswich –Lowestoft service
SuffolkCountyCouncil/RailComp-anies
Prioritise trainuse thereforereducing caruse
<0.5ug/m3
Progress withstationinvestmentplan –additional carparkingprovided atMelton andCampseaAshe. Serviceimprovementsto an hourlytrain servicebetweenIpswich andSaxmundham.
Comp-letionex-pectedby Dec2012.Hourlyserviceforwhole ofEastSuffolkLine (Ipsto Low-estoft)willoccur byend Dec2012.
13 Use ofBusSubsidies
Promotion of existingdiscounted multi-buytickets. Concentratespend on services inAQMAs.
SuffolkCountyCouncil/IpswichBoroughCouncil
Promotes bususe thereforereducing caruse.
<0.5ug/m3
Informationoutstanding
14 QualityBusPartner-shipdevelop-ment
Bus QualityPartnerships to ensurenew engines used.
SuffolkCountyCouncil/IpswichBoroughCouncil
Would reduceemissionsfrom buses
<1ug/m3
Beingdevelopedas part ofthe MajorScheme.Draft inplace.
Progressdelayed asreliant onMajor Schemefunding.
Depen-dent onMajorScheme
15 HealthySchool
Each School in Suffolkdevelops plan to
SuffolkCounty
Reduced caruse leading to
<0.5ug/m3
Completed forall state
Comp-leted

January 2012 Ipswich Borough Council
2011 Progress Report46
No Measure Focus Leadauthority
Planningphase
Implemen-tation phase
Indicator Targetannual
emissionreduction
in theAQMA
Progressto date
Progress inlast 12months
Estimated
comp-letiondate
Commentsrelating toemissionreductions
Status include sustainabletravel such as walkingbus by March 2009
Council reducedcongestion.
schools.
16 Park andRide x 2
Two new park and ridesites proposed aroundIpswich
SuffolkCountyCouncil
To bedeleted.Fundingnotavailable.
Reduces cartrips throughAQMAs.
NEGATIVE -<1ug/m
3
None N/A.To bedel-eted.Fund-ing notavail-able.
17 Raiseawareness of allpass-engertransport
Include raisingawareness ofwww.traveline.infowww.transportdirect.info- to give advice re howto travel door to doorsustainably
SuffolkCountyCouncil
Encouragesreduced carusage andthereforereducesemissions
<0.5ug/m3
SuffolkCountyCouncil hasset up adedicatedweb-sitecalled “Get onboard!” whichcan be foundat:http://www.suffolkonboard.com/ wheredetails ofpublictransportarrangementscan be found.A moregeneral web-page isavailable at

Ipswich Borough Council – England January 2012
2011 Progress Report 47
No Measure Focus Leadauthority
Planningphase
Implemen-tation phase
Indicator Targetannual
emissionreduction
in theAQMA
Progressto date
Progress inlast 12months
Estimated
comp-letiondate
Commentsrelating toemissionreductions
http://www.suffolk.gov.uk/TransportAndStreets/PublicTransportwherePassengerTransport,DemandResponsiveTransportServices,CommunityTransport,EducationTransport,Tendering andContractInformationand FurtherInformation isavailable.
18 GreenTravelPlans
Green Travel Plans tobe encouraged andpromoted in localbusinesses. IBCDevelopment Controlrequire these for newdevelopments.
IpswichBoroughCouncil–developmentcontrolthroughPlanningSuffolk
Encouragespeople to useothermethods oftravelthereforereducing caruse andcongestion.
<1ug/m3
Ongoing On-going

January 2012 Ipswich Borough Council
2011 Progress Report48
No Measure Focus Leadauthority
Planningphase
Implemen-tation phase
Indicator Targetannual
emissionreduction
in theAQMA
Progressto date
Progress inlast 12months
Estimated
comp-letiondate
Commentsrelating toemissionreductions
CountyCouncilhave 2officerstaskedwith per-suadingbusin-esses tohavetravelplans
19 SmarterTravelPlanSuffolk
Travel Plan throughoutSuffolk encouragingpeople ontosustainable modes oftransport in and out ofIpswich. To includeone to one advice by atravel plan advisor.
SuffolkCountyCouncil
Encouragesreduced carusage andthereforereducesemissions
<1ug/m3
Travelsmart is aprojectofferinghouse-holdsinform-ation andsupport toenablepeople towalk, cycleand usepublictransportmoreoften. Itstarted inIpswich in2010.
A total of17,000households inIpswich wereinvited to takepart since theprojectcommencedin 2010.http://www.sustrans.org.uk/what-we-do/travelsmart/current-travelsmart-projects/travelsmart-in-ipswich
20 Season University Campus Univer- Some extra <0.5ug/m3
Students Students can On-

Ipswich Borough Council – England January 2012
2011 Progress Report 49
No Measure Focus Leadauthority
Planningphase
Implemen-tation phase
Indicator Targetannual
emissionreduction
in theAQMA
Progressto date
Progress inlast 12months
Estimated
comp-letiondate
Commentsrelating toemissionreductions
tickets tostudents
Suffolk to offer freeseason tickets tostudents
sityCampusSuffolk
use of bus. canpurchaseticket forFirstBuses atchildprices.
purchaseticket for FirstBuses at childprices.
going
21 ElectricChargingPoints
There is a shortage ofelectric vehiclecharging points inIpswich
IpswichBoroughCouncil– to bedeleted.Evalu8aredeliver-ing the‘pluggedinproject’
Will ensurethat peopleusing electricvehicles caneasilyrecharge.Mayencourageuse of electricvehicleslocally.
<0.5ug/m3
OnelocationwithinIpswichnow withelectricchargingpoint –UniversityCollege.
Ongoingprogress ofproject byEvalu8.
2013 Twolocationswithchargingpointsoutside ofIpswich –AdastralPark,MartleshamandHarwichPort.
22 Public AirQualityMonitor-ingInforma-tion
Make the continuousNO2 monitoring resultsavailable to the publicin real time via awebsite link.
IpswichBoroughCouncil
Thecontinuousmonitors areall situated inthe AQMAs,enablingaccess toreal-timemonitoringmay raiseawareness ofthe poor airquality and
<0.5ug/m3
To bere-vieweddue tore-sourceimplic-ations

January 2012 Ipswich Borough Council
2011 Progress Report50
No Measure Focus Leadauthority
Planningphase
Implemen-tation phase
Indicator Targetannual
emissionreduction
in theAQMA
Progressto date
Progress inlast 12months
Estimated
comp-letiondate
Commentsrelating toemissionreductions
contribute tobehaviourchanges.
23 AirQualityAssess-ments
Developers required toassess the air qualityimpact ofdevelopments in andaround the AQMAs.
IpswichBoroughCouncil/SuffolkCountyCouncil
Developmentdetrimental toAQMAscontrolled.
<1ug/m3
Developersrequired tosubmit airqualityassess-ments asapprop-riate.
Air Qualityand PlanningGuidanceDocumentdevelopedand in finalstages ofconsultation/adoption.
On-going

Ipswich Borough Council – England January 2012
2011 Progress Report 51
The Healthy School Status project is now completed. However, a School Travel Plan project isbeing undertaken by Suffolk County Council and is ongoing. All state schools have a travel plan,and some independent schools are undertaking the actions expected within a plan. The aim of theproject is to encourage sustainable travel to school.
January 2012 Ipswich Borough Council
2011 Progress Report52
9 Conclusions and Proposed Actions
9.1 Conclusions from New Monitoring Data
Ipswich Borough Council has monitored particulates and nitrogen dioxide within the borough.Concentrations of particulates are all below the objective levels and there is no need to proceed toa Detailed Assessment.
The results of the Nitrogen Dioxide monitoring show that concentrations outside of the AQMAs aremainly below the objective levels at relevant locations. Where there are exceedances outside ofthe AQMAs the concentrations are already being assessed as part of a Detailed Assessment orFurther Assessment. There is no need for further Detailed Assessments.
Monitoring results within the AQMAs still show that the AQMAs are appropriate although there areareas of non exceedance within them.
9.2 Conclusions relating to New Local Developments
Ipswich Borough Council has identified the following new or previously unidentified localdevelopments which may impact on air quality in the Local Authority area.
Biogas plant at Anglian Water Services, Cliff QuayDonalds garage, West End RoadBiomass Combustion plant proposed for the Environment Agency, Cobham RoadTarmac Ltd Ipswich Works have moved to Cliff Road, Ipswich.
These will be taken into consideration in the next Updating and Screening Assessment, scheduledfor 2012.
9.3 Other Conclusions
The Air Quality Action Plan is currently being reviewed and will be reported in future assessmentreports.
9.4 Proposed Actions
The monitoring data has not identified the need to proceed to a Detailed Assessment for any ofthe pollutants monitored. The need for any additional monitoring is considered each year andadjustments made. Tube locations have been altered slightly for 2011 and 2012.
The next course of Action for Ipswich Borough Council is : Complete a Detailed Assessment for Nitrogen Dioxide concentrations at the Civic Drive/St
Matthews Street junction;

Ipswich Borough Council – England January 2012
2011 Progress Report 53
Complete a Detailed Assessment for Nitrogen Dioxide concentrations at the locationbetween St Margarets Street AQMA and St Helen Street AQMA;
Complete a Further Assessment for the Bramford Road/Chevallier Street AQMA. Continue to progress and review the AQMA Action Plan.

January 2012 Ipswich Borough Council
2011 Progress Report54
10 References
Air Quality Action Plan (2008)Air Quality (England) Regulations 2000 (SI 928)Air Quality Daughter DirectiveDefra website http://smokecontrol.defra.gov.uk/appliances.phpDetailed Assessment (April 2005)Detailed Assessment (2010)Bramford Road/Chevallier Street Detailed Assessment (2010)Environment Act (1995)Further Assessment Report (August 2008)Ipswich Air Quality Management Order No 1, 2006Ipswich Air Quality Management Order No 2, 2006Ipswich Air Quality Management Order No 3, 2006National Atmospheric Emissions Inventory DatabaseProgress Report (2005)Progress Report (2010)Technical Guidance LAQM.TG (09)The Air Quality (England) (Amendment) Regulations 2002 (SI 3043)Updating and Screening Assessment (2003)Updating and Screening Assessment (2008)Updating and Screening Assessment (2009)

Ipswich Borough Council – England January 2012
2011 Progress Report 55
Appendices
Appendix A: QA/QC Data

January 2012 Ipswich Borough Council
2011 Progress Report56
Appendix A: QA:QC Data
Diffusion Tube Bias Adjustment Factors
The diffusion tubes were supplied to Ipswich Borough Council by Scientifics and were 50% TEA:50% Acetone. The samples were analysed in accordance with guidelines set out in Defras‘Diffusion Tubes for Ambient Nitrogen Dioxide monitoring: Practical Guidance’.
In the WASP inter-comparison scheme, Scientifics was ranked as a Category Good laboratory.
Factor from Local Co-location Studies (if available)
The bias adjustment figure applied to the diffusion tube results is a local factor of 0.87 as a localaverage unless the site is very similar to one of the two continuous monitors used to calculate thebias when a factor of 0.94 was used based on the monitor at St Margarets Street, or 0.8 based onthe monitor on Chevallier Street. A national co-location study gives a bias adjustment factor of0.85.
QA/QC of Automatic Monitoring
The automatic monitors are routinely calibrated once every 2 weeks by an Ipswich BoroughCouncil Environmental Protection Officer and serviced twice a year by contractors.
All data collected from the automatic monitors is managed by external consultants (AEA) to qualityprocedures developed under the UK National Network. The data management processesrepresent best practice and fully meet the requirements set out in LAQM TG(09).
All data are screened and scaled (on the basis of site calibrations) and the final data setspresented within this report have benefited from a full process of data ratification, includingthorough additional data quality checks that include site UKAS quality control audits and a finaldata ratification process that corrects data for instrument sensitivity drift between routinecalibrations.