project report of the minor research project 2012-14 ...pesrsncollege.in/pissurlekar.pdf · project...
TRANSCRIPT

Project Report
Of the Minor Research Project 2012-14
Funded by UGC Western Regional Office Pune
“Preparation, Characterization and Magnetization Studies of Some Soft Ultrafine
Mixed Metal Ferrites”
Principal Investigator
Dr. Vikas J. Pissurlekar
Co- Investigator
Prof. Jayant S. Budkuley
Department of Chemistry
P. E. S‟s Ravi S. Naik College of Arts & Science
Farmagudi Ponda
Goa- 403401.

Acknowledgements
Dr. Vikas J. Pissurlekar, Principal Investigator wishes to express sincere gratitude to U.G.C.
Western Regional office Pune for sanctioning a Minor Research Project entitled “Preparation,
Characterization and Magnetization Studies of Some Soft Ultrafine Mixed Metal Ferrites”.
My sincere thanks to my mentor, guide and PhD supervisor Professor Jayant S. Budkuley,
Retired Professor and Head of the Department of Chemistry of Goa University for
encouraging and motivating me to work on this project topic and for continuous support
and guidance during the project.
I am also thankful to the Management of Ponda Education Society for their support and
encouragement throughout the project.
I would like to thank Dr. A. S. Dinge, Principal of P. E. S‟s Ravi S. Naik College of Arts &
Science Farmagudi Ponda Goa for his support, and also for providing all the necessary
facilities to carry out the project work
I would also like to thank my B.Sc. students who carried out the experimental work as their
project work. Mr. Pranav Naik for providing some of the instrumental data. The Head,
Department of Physics, Goa University and various other institutions like NCAOR and
ADEC Technologies Goa, for helping in gathering the various instrumental data for the
samples of the project work,
The principal investigator is thankful to the Librarian of P. E. S‟s Ravi S. Naik College of
Arts & Science and Goa University for providing library facilities.
I would also like to acknowledge the cooperation of Shri. R.V. S. Kuncolienkar the
accountant of the college and other administrative staff and my departmental colleagues
especially Mr. Nitin Naik, Mrs. Swarupa Kerkar, Mr. Ranganath Naik, Mr.Prakash Naik,
Mr.Eknath Naik and Mr. Raju Bandodkar.
Lastly, I would like to thank all my colleagues, family and friends for their support in
various capacities during the course of the present study.
- Dr. Vikas J. Pissurlekar

Content
page No
Chapter I: LITERATURE SURVEY
1.1 Introduction 1
1.2. Classification of Ferrites 2
1.3. Spinel Structure 6
1.4. Properties of Ferrites 9
1.5. Applications: 13
Chapter II: SYNTHESIS OF FERRITES
2.1 Methods of Synthesis 18
Chapter III: EXPERIEMENTAL MEASUREMENTS OF Mn-Zn FERRITE
3.1 The Method of preparation of Mn-Zn ferrite samples. 22
3.2. Characterization 23
3.3 Physical Properties 26
3.4. Magnetic Properties 29
3.5. Electrical properties 32
3.6. Conclusion 33
Chapter IV EXPERIEMENTAL MEASUREMENTS OF Ni-Zn FERRITE
4.1 The Synthesis of Ni-Zn ferrite samples. 35
4.2. Characterization 36
4.3 Physical Properties 40
4.4. Electrical properties 43
4.5. Magnetic Properties 44
4.6. Conclusion 47
References 49
1
CHAPTER I
LITERATURE SURVEY
I.1 Introduction
What is Ferrite?
Ferrites are categorized as electro-ceramics with ferromagnetic properties. They are ceramic
like material with iron (III) oxide (Fe2O3) as their principal component. Ferrite exhibits
ferrimagnetism due to the super-exchange interaction between electrons of metal and oxygen
ions. The opposite spins in ferrite results in the lowering of magnetization compared to
ferromagnetic metals where the spins are parallel. Due to the intrinsic atomic level interaction
between oxygen and metal ions, ferrite has higher resistivity compared to ferromagnetic
metals. This enables the ferrite to find applications at higher frequencies and makes it
technologically very valuable.
The chemical formula of ferrite is generally expressed as MeFe2O4, where „Me‟ represents a
divalent metal ion. (e.g. Fe2+
, Ni2+
, Mn2+
, Mg2+
, Co2+
, Zn2+
, Cu2+
etc). The crystal lattice of
ferrite is spinel. Most important commercial derivatives of these ferrites are Zn2+
substituted
Ni and Mn ferrite represented as NiZnFe2O4 and MnZnFe2O4 respectively. The major
difference among these two ferrites is in their resistivity.
The magnetic property of ferrite is the manifestation nature of ions and their relative lattice
position. Ferrites exist in spinel lattice structures. Metal ions are located at octahedral and
tetrahedral positions. Fe2+
, Ni2+
, Mn2+
etc ions prefer tetrahedral sites. Ni-Zn ferrite and Mn-
Zn ferrites has inverse spinel structures where a part of the B atom occupies in the tetrahedral
site and A atom occupy the Octahedral site. Depending on the composition and process
conditions such as sintering temperature and atmosphere, the lattice site occupancy changes
leading to the change in magnetic and electrical properties. This shows that in ferrite
manufacturing both composition and process conditions are very critical to get the required
quality
Ferrites exhibits ferrimagnetism. This means there is net magnetic moment in molecular level
as a result of electronic interaction between metal and oxygen ions called super exchange. In
bulk ferrite, there are domains called Weiss Domains in which all these molecular magnets
2
are aligned in one direction. Domain walls separates different domain aligned in random
directions and in the presence of an external magnetic field these moments can be forced to
align in one direction. Some energy has to be spent for this process and the magnetization
always lags behind the magnetizing field and results in a magnetization loop. This is called as
B-H Loop.
The term ferrimagnetism was coined by the French physicist Louis Neel, who first studied
ferrites systematically on the atomic level. There are several types of ferrimagnetism. In
collinear ferrimagnetism the fields are aligned in opposite directions, in triangular
ferrimagnetism the field orientation may be at various angles to each other. Ferrites can have
several different types of crystalline structures, including spinel, garnet, perovskite, and
hexagonal.
The most important properties of ferrites include high magnetic permeability and high
electrical resistance. High permeability to magnetic fields is particularly desirable in devices
such as antennas. High resistance to electricity is desirable in the cores of transformers to
reduce eddy currents. Ferrites of a type known as square-loop ferrites can be magnetized in
either of two directions by an electric current. This property makes them useful; in the
memory cores of digital computers, since it enables a tiny ferrite ring to store binary bits of
information. Another type pf computer memory can be made of certain single crystal ferrites
in which tiny magnetic domains called bubbles can be individually manipulated. A number of
ferrites absorb microwave energy in only one direction or orientation; for this reason, they are
used in microwave wave guides.
1.2. CLASSIFICATION OF FERRITES:-
Ferrite magnets, or ferromagnetic materials, are classified broadly on the basis of a property
called magnetic coercivity, or perseverance of internal magnetism and structure.
1.2.1. SOFT FERRITES:
Soft ferrites are extensively used in electronic devices because of their good magnetic
properties. The most important property of soft ferrites is their high magnetic polarization in
combination with a high electrical resistivity much higher than that of metallic magnetic
materials. The most important soft ferrite material is Manganese Zinc Ferrite (MnZnFe2O4).
3
Soft ferrites are also used in transformer or electromagnetic cores contain nickel, zinc, or
manganese compounds. They have a low coercivity which means that the materials
magnetization can easily reverse direction without dissipating much energy (hysteresis
losses), while the materials high resistivity prevents eddy currents in the core, another source
of energy loss. Because of their comparatively low losses at high frequencies, they are
extensively used in the cores of RF transformers and inductors in applications such as
Switched-mode power supplies.
The most common soft ferrites are:
Manganese-Zinc ferrite (Mn-Zn, with the formula MnxZn(1-x)Fe2O4. Mn-Zn ferrites
have higher permeability and saturation induction in comparison than Ni-Zn.
Nickel-Zinc ferrite (Ni-Zn, with the formula NixZn(1-x)Fe2o4. Ni-Zn ferrites exhibit
higher resistivity than Mn-Zn, and are therefore more suitable for frequencies above
1MHz.
1.2.2 . HARD FERRITES:
In contrast, permanent ferrites magnets are made of hard ferrites, which have a high
coercivity and high remanence after magnetization. These are composed of iron and barium
or strontium oxides. The high coercivity means the materials are very resistant to becoming
demagnetized, an essential characteristic for a permanent magnet. They also conduct
magnetic flux well and have a high magnetic permeability; this enables these so-called
ceramic magnets to store stronger magnetic fields than iron itself. They are cheap, and are
widely used in household products such as refrigerator magnets. The maximum magnetic
field B is about 0.35tesla and the magnetic field strength H is about 30 to 160 kilo ampere
turns per meter (400 to 2000 oersteds). The density of ferrite magnets is about 5g/cm3.
The most common hard ferrites are:
Strontium ferrite, SrFe12O19 (SrO.6Fe2O3), a common material for permanent magnet
applications.
Barium ferrite, BaFe12O19 (BaO.6Fe2O3), a common material for permanent magnet
applications. Barium ferrites are ceramics that are generally stable to moisture and
4
corrosion- resistant. They are used in e.g. subwoofer magnets and as a medium for
magnetic recording, e.g. on magnetic stripe cards.
Cobalt ferrite, CoFe2O4 (CoO.Fe2O3), used in some media for magnetic recording.
1.2.3. FERROSPINELS:
Normal ferrites in which all the „Me‟ ion are in the tetrahedral A sites and all the Fe3+
ions are in the octahedral sites.
Inverse ferrites, in which all the „Me‟ ions and half of the Fe3+
ions are in B sites, while
remaining Fe3+
ions are in A sites.
Random ferrites in which the „Me‟ and Fe3+
are distributes uniformly over tetrahedral
and octahedral sites.
The magnetic interaction between the magnetic ions in spinels is of indirect type (super
exchange), i.e. it takes place via the intermediate oxygen ions.
In a spinel structure, each oxygen ion is surrounded by three B cations and one A
cation.
1.2.4. Garnets:
The garnet mineral known as YIG, chemical formula for the ferrogarnets is „Me3Fe5O12‟ and
„Me‟ is a trivalent ion such as a rare earth of Y3+
, containing the rare-earth element yttrium,
has formula Y3Fe5O12; it is used in microwave circuitry. The unit cell is cubic and contains
eight metal ions are distributed over three types of sites. The „Me‟ ions occupy the
dodecahedral (called C sites) where they are surrounded by eight oxygen ions; whereas the
Fe3+
ions are distributed over tetrahedral and octahedral sites in the ratio 3:2. Thus the cation
distribution is Mec3Fea2Fed3O12.
1.2.5. Orthoferrites:
Orthoferrites have the general formula „MeFeO3‟; where „Me‟ is a large trivalent metal ion,
such as rare earth ions as Y. they crystallize in a distorted perovskite structure with an
orthorhombic unit cell. The rare-earth ion subsystem acquires magnetization due to an
interaction with the iron subsystem. The ortho-ferrites are particularly interesting because of
the presence of an anti systematic exchange interaction which involves the vector across
product of neighboring spins as opposed to the usual scalar product. In the absence of this
interaction, the ortho ferrite would be antiferromagnetic. Its presence leads to a small canting

5
of the sub-lattices, making the ortho-ferrite “weak” ferromagnetic. Another interesting
feature of these materials is the fact that some of them exhibit a transition as a function of
temperature, in which the direction of the antiferromagnetically ordered spins and
consequently also of the net magnetization rotates by 900.
Examples:
o Lanthanum orthoferrite, LaFeO3
o Dysprosium ortho ferrite, DyFeO3
1.2.6. Hexagonal ferrites:
There are number of ferrites that crystallize in hexagonal structure and some of them have
gained considered technological importance in recent years. These ferrites are further sub-
classifies into M, W, Y, Z and U compounds. The „M „has the simplest structure. Since their
discovery in the 1950s there has been an increasing degree of interest in the hexagonal
ferrites, also known as hexa-ferrites, which is still growing exponentially today. These have
been massively important materials commercially and technologically accounting for the bulk
of the total magnetic materials manufactured globally, and they have a multitude of uses and
applications. As well as their use as permanent magnets, common applications are as
magnetic recording and data storage materials, and as components in electrical devices,
particularly those operating at microwave/GHz frequencies.
Barium ferrites, the well-known hard ferrite belong to this class. The compound have the
general formula‟ MeFe12O19‟ where „Me‟ is a divalent ions of a large ionic radius, such as
Ba2+
, Sr2+
or Pb2+
. In these one iron per formula unit is present as Fe2+
to allow for the charge
compensation.
M- type ferrites, such as BaFe12019 (bam or barium ferrite), SrFe12O19 (SrM or strontium
ferrite) , and cobalt-titanium substituted M ferrite, Sr or BaFe12-2xCoxTixO19 (CoTiM).
Z-type ferrites (Ba3Me2Fe24O41) such as Ba3Co2Fe24O41, or Co2Z.
Y-type ferrites (Ba2Me2Fe12022), such as Ba2Co2Fe12O22, or Co2Y.
W-type ferrites (BaMe2Fe16027), such as BaCo2Fe16027, or CO2W.
X-type ferrites (Ba2Me2Fe28046), such as Ba2Co2Fe28O46, or Co2X.
U-type ferrites (Ba4Me2Fe36O60), such as Ba4Co2Fe36O60, or Co2U.

6
The best known hexagonal ferrites are those containing barium and cobalt as divalent cations,
but many variations of these and hexa-ferrites containing other cations (substituted or doped)
will also be discussed, especially M, W, Z and Y ferrites containing strontium, zinc, nickel
and magnesium. The hexagonal ferrites are all ferrimagnetic materials, and their magnetic
properties are intrinsically linked to their crystalline structures. They all have a magneto-
crystalline anisotropy (MCA) that is the induced magnetisation has a preferred orientation
within the crystal structure.
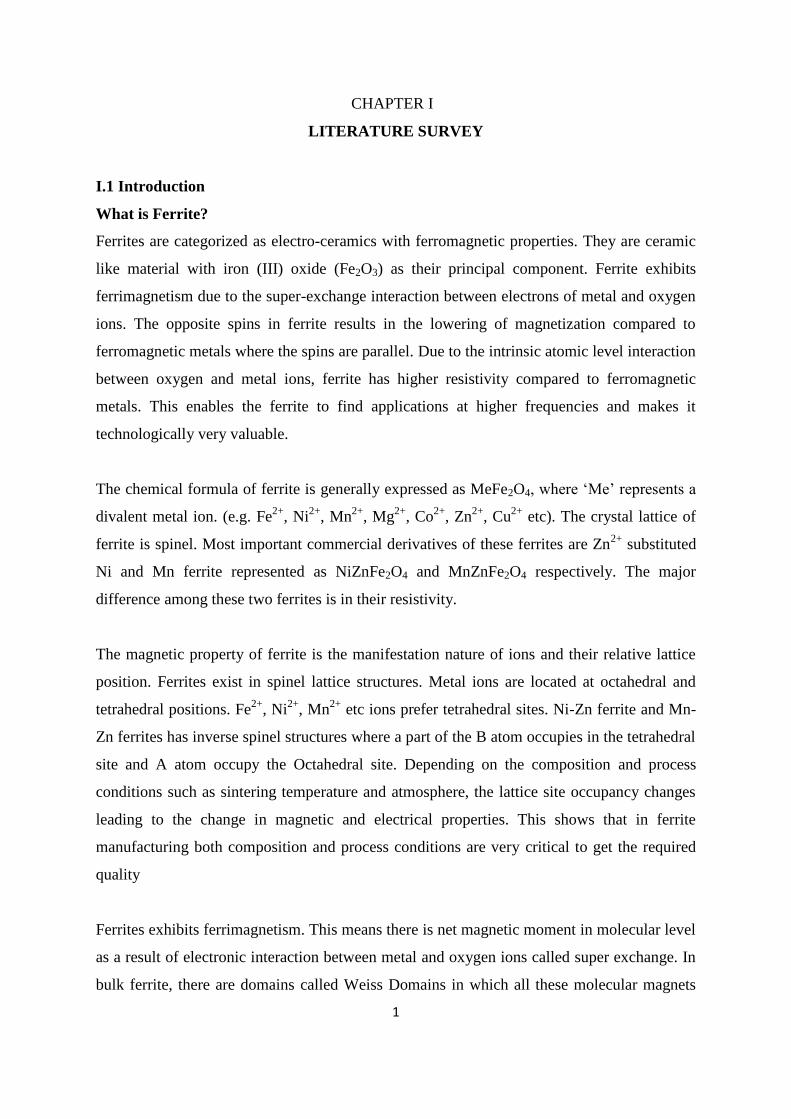
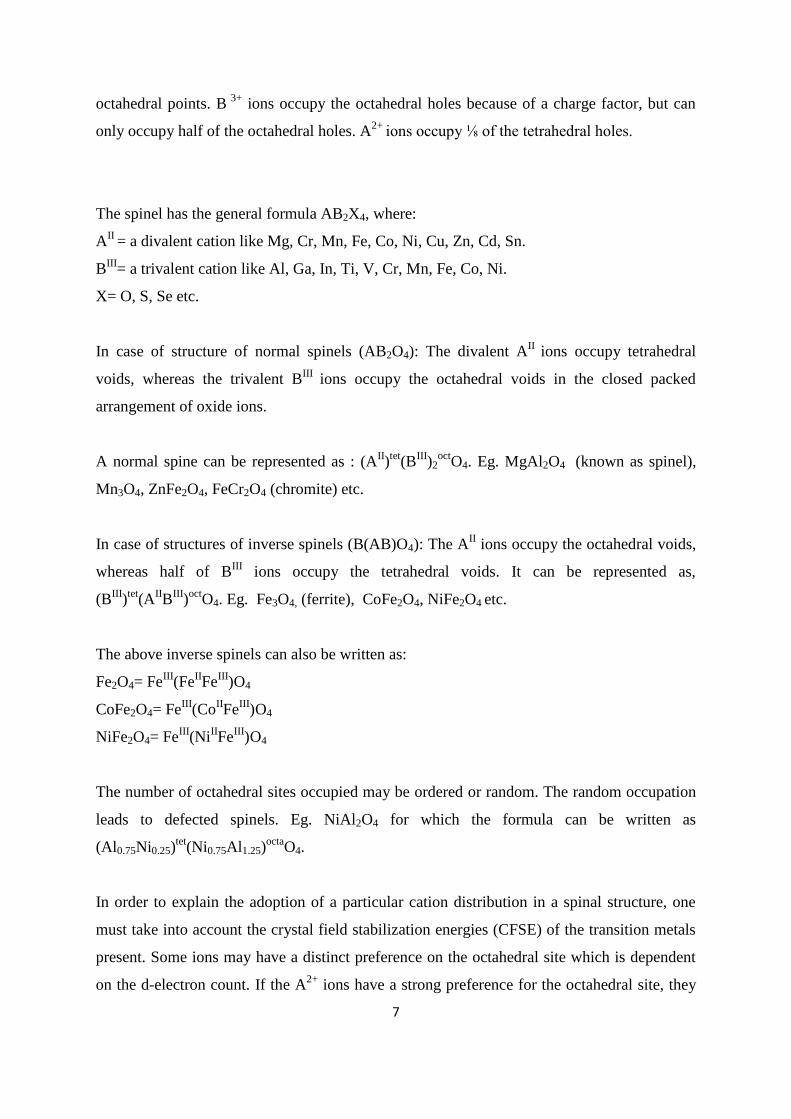
1.3. Spinel structure:
Fig: 1.1.: Spinel structure
The spinal ferrite structure MFe204 can be described as a cubic close-packed arrangement of
oxygen ions, with M2+
and Fe3+
ions at two different crystallographic sites. These sites have
one octahedral and two tetrahedral sites per oxide. The tetrahedral points are smaller than the
7
octahedral points. B 3+
ions occupy the octahedral holes because of a charge factor, but can
only occupy half of the octahedral holes. A2+
ions occupy ⅛ of the tetrahedral holes.
The spinel has the general formula AB2X4, where:
AII
= a divalent cation like Mg, Cr, Mn, Fe, Co, Ni, Cu, Zn, Cd, Sn.
BIII
= a trivalent cation like Al, Ga, In, Ti, V, Cr, Mn, Fe, Co, Ni.
X= O, S, Se etc.
In case of structure of normal spinels (AB2O4): The divalent AII
ions occupy tetrahedral
voids, whereas the trivalent BIII
ions occupy the octahedral voids in the closed packed
arrangement of oxide ions.
A normal spine can be represented as : (AII)tet
(BIII
)2oct
O4. Eg. MgAl2O4 (known as spinel),
Mn3O4, ZnFe2O4, FeCr2O4 (chromite) etc.
In case of structures of inverse spinels (B(AB)O4): The AII ions occupy the octahedral voids,
whereas half of BIII
ions occupy the tetrahedral voids. It can be represented as,
(BIII
)tet
(AIIB
III)
octO4. Eg. Fe3O4, (ferrite), CoFe2O4, NiFe2O4 etc.
The above inverse spinels can also be written as:
Fe2O4= FeIII
(FeIIFe
III)O4
CoFe2O4= FeIII
(CoIIFe
III)O4
NiFe2O4= FeIII
(NiIIFe
III)O4
The number of octahedral sites occupied may be ordered or random. The random occupation
leads to defected spinels. Eg. NiAl2O4 for which the formula can be written as
(Al0.75Ni0.25)tet
(Ni0.75Al1.25)octa
O4.
In order to explain the adoption of a particular cation distribution in a spinal structure, one
must take into account the crystal field stabilization energies (CFSE) of the transition metals
present. Some ions may have a distinct preference on the octahedral site which is dependent
on the d-electron count. If the A2+
ions have a strong preference for the octahedral site, they

8
will force their way into it and displace half of the B3+
ions from the octahedral sites to the
tetrahedral sites. If the B3+
ions have a low or zero octahedral site stabilization energy
(OSSE), then they have no preference and will adopt the tetrahedral site.
Burdett and co-workers proposed an alternative treatment of the problem of spinel inversion,
using the relative sizes of s and p atomic orbitals of the two types of atom to determine their
site preference. This is because the dominant stabilizing interaction in the solids is not the
crystal field stabilization energy generated by the interaction of the ligands with the d-
electrons, but the σ-type interactions between the metal cations and the oxide anions. This
rationale can explain anomalies in the spinel structures that crystal-field theory cannot, such
as the marked preference of Al3+
cations for octahedral sites or of Zn2+
for tetrahedral sites
using crystal field theory would predict that both have no site preference. Only in the cases
where this size-based approach indicates no preference for one structure over another do
crystal field effects make any difference – in effect they are just a small perturbation that can
sometimes make a difference, but which often do not.
Nano particles are unique as important changes occur in the electronic band structure. The
size dependent properties of material are very interesting not only to fabricate technologically
important devices but also to understand how starting from atoms , molecules clusters evolve
ending up in the solid and how the structure bonding , electronic structure and other
properties changes during evolution. Magnetization in nano particles is considerably different
from that of crystalline/polycrystalline material as they are characterized by a high value of
surface to volume ratio with a large fraction of atoms present at grain boundaries. Magnetic
materials possess some type of anisotropy which affects their magnetic behavior.
The most common method of preparation of ferrites is the conventional ceramic method;
involving high temperature solid state reaction between constituent oxides or carbonates. The
particles obtained are large and non-uniform in size, as well as non homogeneous on
microscopic scale. The non-stoichiometry is due to extensive grinding and high heating
temperature involved in preparation process and also due to possibility of presence of
unreacted phases in the finished product. This also results in loss of fine particle size.
9
The chemical methods of preparation have advantages over conventional ceramic methods as
it produces uniform, homogenous and with stoichiometric composition of the product. The
demand for high performance of ferrite for especially for application requiring low loss at
high frequencies has created the need for newer methods for preparing compositionally and
structurally perfect ferrites exhibiting low magnetic and electrical losses.
There are different wet chemical methods such as co-precipitation, citrate precursor, sol gel
etc.
Precursor methods are simple; inexpensive does not require much experimental set up and
relatively fast. The ferrites obtained by this method are found to show better properties then
those prepared by ceramic method.
The performance of ferrites depends on the synthesis process. It is also known that nano
particles have physical dimensions in the range of few nanometers to less than a hundred
nanometers.
1.4. Properties of ferrites:
1.4.1. Magnetic properties
Magnetic property depends upon concentration and non-magnetic ions in mixed ferrites. In
case of Ni-Zn ferrites, Zn2+
are non-magnetic ions and Ni2+
are magnetically weak ions,
therefore at lower concentration of Zn2+
ions, the saturation magnetization of mixed ferrites is
high. Magnetic properties are most fundamental properties of any ferrite material. The
magnetic properties include saturation magnetization, retentively, coercivity, permeability,
susceptibility, and Curie temperature.
10
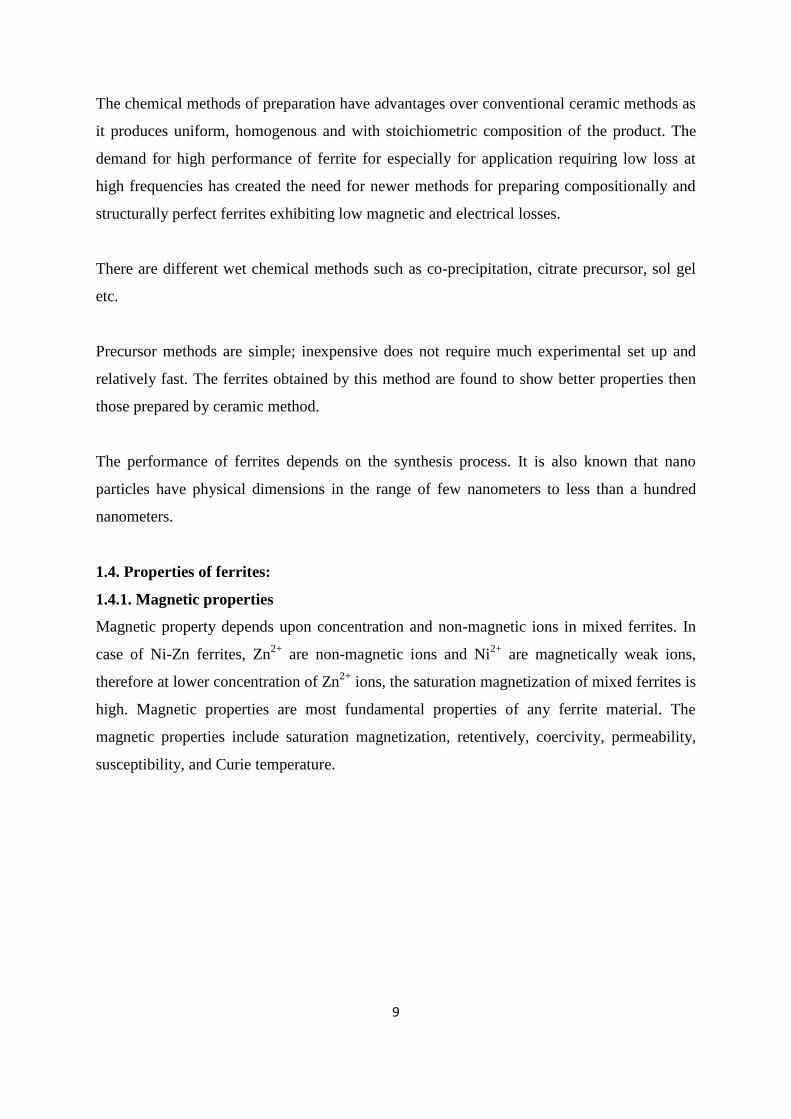
1.4.1. Saturation magnetization:
Fig: 1.2. Variation of magnetization against applied field.
Saturation is the state reached when an increase in applied external magnetic field H cannot
increase the magnetization of the material further, so the total magnetic flux density B levels
off. It is a characteristic particularly of ferromagnetic materials, such as iron, nickel, cobalt
and their alloys. Saturation is most clearly seen in the magnetization curve ( also called BH
curve or hysteresis curve) of a substance, as a bending to the right of the curve. As the H field
increases, the B field approaches a maximum value asymptotically, the saturation level for
the substance. Technically, above saturation, the B field continues increasing, but at the
paramagnetic rate, which is 3 orders of magnitude smaller than the ferromagnetic rate seen
below saturation.
The relation between the magnetizing field H and the magnetic field B can also be expressed
as the magnetic permeability:
μ = B/H or the relative permeability
μr = μ/μ∘ , where μ∘ is the vacuum permeability. The permeability of ferromagnetic materials
is not constant, but depends on H. In saturable material the relative permeability is not
constant, but depends on H. In saturable materials the relative permeability increases with H
to a maximum, then as it approaches saturation inverts and decreases toward one.
Different materials have different saturation levels. For example, high permeability iron
alloys used in transformers reach magnetization saturation at 1.6 – 2.2 teslas (T), whereas

11
ferrites saturate at 0.2 – 0.5 T. some amorphous alloys saturate at 1.2 – 1.3 T. Mu metal
saturates at around 0.8 T.
Fig:1.3. Variation of permeability.
Fig: 1.4. The above diagram predicts Magnetization (M)
versus Magnetic field strength (H)
The smooth curve depicts the rotation of the vector moment in the domain wall as the
magnetic field strength (H) is varied. When the applied field is decreased magnetization is
also decreased in multi domain bulk material, demagnetization occur primarily via spin
rotation through the domain wall. If the demagnetization curve, during the removal of the
applied field, does not allow the initial magnetization curve, the material displays hysteresis,
which is the lag observed in the figure.

12
1.4.2. AC Susceptibility:
In electromagnetism, the magnetic susceptibility is a dimensionless proportionality constant
that indicates the degree of magnetization of a material in response to an applied magnetic
field. A related term is magnetizability, the proportion between magnetic moment and
magnetic flux density [10]. A closely related parameter is the permeability which expresses
the total magnetization of material and volume. When the magnetic susceptibility is measured
in response to an AC magnetic field (i.e. a magnetic field that varies sinusoidally), this is
called AC Susceptibility. AC Susceptibility (and closely related “AC Permeability”) is
complex quantities, and various phenomenons (such as resonances) can be seen in AC
Susceptibility that cannot be seen in constant field (DC) Susceptibility. In particular, when
the AC field is applied perpendicular to the detection direction (called the “transverse
susceptibility” regardless of the frequency), the effect has a peak at the Ferromagnetic
resonance frequency of the material with a given static applied field. Currently this effect is
called the Microwave Permeability or Network Ferromagnetic Resonance in the literature.
These results are sensitive to domain wall configuration of the materials and Eddy currents.
In terms of ferromagnetic resonance, the effect of an AC field applied along the direction of
magnetization is called Parallel Pumping.
1.4.3. Electrical properties:
Some of the important electrical properties of ferrites are resistivity, dielectric constant, etc.
1.4.3.1 Resistivity:
Ferrites have resistivity ranging from 103 to 10
11 Ohms at room temperature. These wide
ranges in resistivities of ferrites are explained on the basis of actual location of cations in the
spinels structure and hopping mechanism. Their high conductivity is due to presence of
ferrous and ferric ions in the crystallographically equivalent sites. The high resistivity in
ferrites is associated with the occupation of B sites by other divalent metal ion and trivalent
Fe ions. Thus spinel ferrites contain large number of oxygen ions and small number of metal
ions in the interstitial spaces. Both Fe2+
and Fe3+
ions are at B sites, conduction takes place
when electrons moves from Fe2+
and Fe3+
ions. The resistivity of ferrites is affected by
temperature. The diffusion of charge carries from one state to other is to raise to photons and
electrons hop between the possible only when the energy exceeds activation energy. The
13
thermal lattice vibrations consistently give pairs of state either by absorption or by emission
of photons each time. In this way transport of charge carriers is achieved by hoping process
through interaction with photons. On the basis of this the temperature dependence of
resistivity of ferrites is given by the relation:
ρ=ρₒ exp (-∆E/KT) 1.1
Where,
ρ0= Temperature dependent constant
∆E= Activation energy
K= Boltzmann constant
T= Absolute temperature
These factors which differentiate the electrical behavior, of the ferrite, from that of
semiconductors, led to the development of two main models such as Hoping model of
electrons and small polaron model.
1.4.3.2. Dielectric constant:
Ferrites show high dielectric constant and dispersion of dielectric constant in the frequency
range from 20 Hz to 1 GHz. The dielectric properties of ferrites are dependent upon several
factors including the method of preparation, chemical composition, grain-size and sintering
temperature. A dielectric substance, when subjected to an alternating electric field, the
positive and negative charges within the material gets displaced with respect to one another
and the system acquires an electric dipole moment. The dipole moment per unit volume is
called polarization. Koop‟s gave a phenomenological theory of dispersion in the dielectric
constant.
1.5. APPLICATIONS:
1.5.1. Antenna Core
A winding distributed about the length of a ferrite rod forms an antenna in broadcast radio
receivers. The high permeability of the ferrite concentrates the energy in the ferrite, thus
increasing the efficiency of reception over that of an air core antenna. The high value of Q of
the ferrites gives the antenna a good selectivity. To reduce demagnetizing effects the length –

14
to-diameter ratio, however the sensitivity of the antenna is increased by increasing the
volume of the ferrite rod.
1.5.2. Fly-back transformers and deflection yokes
Large numbers of ferrite cores are used in fly-back transformers for television applications.
These cores must have low losses at flux levels up to as high as 1500 gauss the 15.75
kilocycles/sec. the Curie temperature must be high enough so that losses do not rise
excessively at the operating temperature. A small ring gap is used to reduce changes caused
by the presence of d-c fields.
Cores for deflection yoke in a television picture tube are an example of the use of ferrites of
the nickel-zinc-iron or manganese zinc iron variety. The deflection yoke consists of wire coils
wound to fit around the neck of a television picture tube. The ferrite cores are molded so that
they can be assembled tightly around these coils. These complete structure slips over the neck
of a television picture tube. When high frequency current from the tubes of the television set
pass through these coils, the electron beam of the picture tube is deflected vertically and
horizontally, thus projecting a picture. Because of their high resistivity and the consequent
eddy current loss, use of ferrite cores greatly increases the efficiency of the operation.
Deflection yokes with a ferrite yokes with a ferrite core.
1.5.3. Inductors
Ferrites are primarily used as inductive components in a large variety of electronic circuits
such as low-noise amplifiers, filters, voltage-controlled oscillators, impedance matching
networks, for instance. Their recent applications as inductors obey, among other tendencies,
to the general trend of miniaturization and integration as ferrite multilayers for passive
functional electronics devices. The multilayer technology has become a key technology for
mass production of integrated devices; multi layers allow a high degree of integration density.
Multi-layer capacitors penetrated the market a few decades ago, while inductors started in the
1980s. The basic components to produce the inductance are a very soft ferrites and a metallic
coil.
In addition, to provide a high permeability at the operation frequency, the ferrite film should
be prepared by a process compatible with the integrated circuit manufacturing process.

15
Sputtering provides films with high density, but the composition is sometimes difficult to
control with accuracy, and the annealing processes can attain high temperatures. Pulsed laser
deposition leads to high- quality films; however, a method involving the preparation of the
ferrites film by a combination of sol-gel and spin-coating seems easier and with a lower cost.
Layered samples of ferrites with piezoelectric oxides can lead to a new generation of
magnetic field sensors. The basis of their performance is the capability of converting
magnetic fields into electrical voltages by a two-step process. First, the magnetic field
produces a mechanical strain then induces a voltage in the piezoelectric layer. These sensors
can provide a high sensitivity, miniature size, and virtually zero power consumption. Sensors
for ac and dc magnetic fields, ac and dc electric currents, can be fabricated. Sensors based on
nickel ferrites (Ni1-xZnxFe2O4 with x=1-0.5) lead zirconate-titanate (PbZr0.52Ti0.48O3) have
shown an excellent performance. Both ferrite and zirconate-titanate films are prepared by
tape casting; typically, 11 ferrite layers were combined with 10 piezoelectric layers.
1.5.4. Electromagnetic Interference (EMI) Suppression:
The significance increase in the amount of electronic equipment, such as high-speed digital
interfaces, in notebooks, computers, digital cameras, scanners, and so forth, in small areas,
has seriously enhanced the possibility of disturbing each other by electromagnetic
interferences (EMI). In particular, the fast development of wireless communication has led to
interference induced by electric and magnetic fields. Electromagnetic interference can be
defined as the degradation in performance of an electronic system caused by an
electromagnetic disturbance. The noise from electric devices is usually produced at
frequencies higher than circuit signals. To avoid, or at least reduce EMI, suppressors should
work as low-pass filter, that is, circuits that block signals with frequencies higher than a given
frequency value.
There are several approaches to build EMI suppressors: soft ferrites, ferromagnetic metals,
ferromagnetic metal/hexa-ferrite composites, encapsulated magnetic particles and carbon
nano-tube composites.
Ferrites components for EMI suppressors have been used for decades. In the recent years,
however, there have been special needs for these materials as a consequence of the
miniaturization trends, increase in integration density, and increase in higher clock frequency,
16
especially in communication, computing, and information technologies. Ferrites multilayer
components have been developed as a response to these needs, formed essentially by a highly
conductive layer embedded in a ferrites monolithic structure, produces by ceramics co-
processing technologies. Typically, Ni-Zn ferrites are used for the 20-200 MHz frequency
range. Multilayer suppressors behave like a frequency – dependent resistors, at low
frequencies, losses in the ferrite are negligible. As frequency increases, losses increase also,
and, as ferromagnetic resonance is approached, the inductor behaves as a frequency-
independent resistor and no longer as inductor.
1.5.5. Power:
Power applications of ferrites are dominated by the power supplies for a large variety of
devices such as computers, all kinds of peripherals, TV and video systems, and all types of
small and medium instruments. The main application is in the systems known as switched-
mode power supplies (SMPs). In this application, the mains power signal is first rectified, it is
then switched as regular pulses (typically rectangular) at a high frequency to feed into a
ferrite transformer, and finally it is rectified again to provide the required power to the
instrument. An increase power delivery and efficiency can be obtained by increasing the
working frequency of the transformer.
A recent approach to increase efficiency of the ferrite cores is based on the decrease of eddy
currents, by increasing resistivity. Beside the use of non-conducting additives that locate
preferentially on grain boundaries (and limit the inter-grain conductivity), Mn-Zn and Ni-Zn
are combined as MnxNi0.5-xZn0.5Fe2O4 and obtained through a citrate precursor method.
1.5.6. Medical treatment:
Using magnetic jewellery for health is not new. Early civilization recognized that magnetism
had restorative properties. Cleopatra frequently adorned herself with magnetic jewels to
preserve her youthfulness and health. Magnetic jewellery if often used for general well- being
and vitality. It can also be used to treat more specific problems areas in the body. Key
acupressure points can be accessed on the wrist, neck and fingers to give relief from pain.
17
1.5.7. Biosciences:
Magnetic materials in the form of nanoparticles, mainly magnetite (Fe3O4), are present in
various living organisms and can be used in a number of applications. Magnetic nanoparticles
can, of course, be prepared in the laboratory by means of the well-known methods. However,
magnetic biogenic particles have better properties than synthetic ones: they are almost perfect
crystallographically, and sometimes they possess unusual crystallographic morphologies.
Extracellular production of nano meter magnetic particles by various types of bacteria has
been described. In many cases, the biogenic particles retain a lipid; layer which makes them
very stable and easily biocompatible.
Many biotechnological applications have been developed based on biogenic and synthetic
magnetic micro- and nanoparticles. Magnetic nanoparticles have been used to guide radio
nuclides to specific tissues. An approach has been developed to directly label a radioisotope
with ferrite particles in vivo liver tissue in rats. Therapeutic applications are feasible by
further conjugation with other medicals.
In magnetic resonance imaging (MRI), magnetite super-paramagnetic particles are selectively
associated with healthy regions of some tissues( liver, for instance); since these particles
change the rate of proton decay from the excited to the ground state (which is the basis of
MRI), a different , darker contrast is obtained from these healthy regions of tissue.
Thermal energy from hysteresis loss of ferrites can be used in hyperthermia, that is, the
heating of specific tissues or organs for treatment of cancer. The addition of magnetic several
spinel ferrites (M-Zn, with M=Mn, Co, Fe2+
and Fe3+
-Mn) are under investigation as well as
hexa- ferrites.
Enzymes, oligo-nucleotides, antibodies, and other biologically active compounds can be
immobilized, as an important technique used in biotechnology. Such immobilized compounds
can be targeted to specific place or can be removed from the system by using an external
magnetic field. The compounds can exert their activity on the specific place or tissue or can
be used as affinity ligands to trap the cells or target molecules. Magnetic nanoparticles can
also be used in a variety of applications: modification, detection, isolation, and study of cells
and isolation of biologically active compounds for instance.
18
CHAPTER II
SYNTHESIS OF FERRITES
2.1 There are different methods of synthesis of ferrites which are reported in literature, some
of them are discussed in brief in this chapter.
2.1.1. CERAMIC PROCEDURE:
The most common method of preparing metal oxides and other solid materials is by the
ceramic method which involves grinding powders of oxides, carbonates, oxalates or other
compounds containing the relevant materials and heating the mixtures at a desired
temperature, generally after palletizing the material. Several oxides, sulphides, phosphides
have been prepared by this method. Knowledge of phase diagram is helpful in fixing the
desired composition and conditions for synthesis. Some caution is necessary in deciding the
choice of the container. Platinum, silica and alumina containers are generally used for the
synthesis of metal oxides. Most ceramic preparations require relatively high temperatures
which are attained by resistance heating.
2.1.2. COMBUSTION SYNTHESIS:
Combustion synthesis or self-propagating high temperature synthesis is a versatile method for
the synthesis of a variety of solids. The method makes use of highly exothermic reaction
between the reactant to produce a flame due to spontaneous combustion which then yields the
desired product or its precursor in finely divided form. Borides, carbides, oxides and other
metal derivatives have been prepared by this method. In order that combustion to occur, one
has to ensure that the initial mixture of reactant is highly dispersed and contains high
mechanical energy. For example, one may add a fuel and oxidizer in preparing oxides by this
method, to yield the product or its precursor. Thus one can take a mixture of nitrates
(oxidizer) of the desired metal along with fuel (e.g. Hydrazine, Glycine or Urea) in solution,
evaporate the solution to dryness and heat the resulting solid to around 423K to obtain
spontaneous combustion, yielding an oxides product in fine particulate form. Even if the
desired product is not formed just after combustion, the fine particulate nature of the product
facilities is formation on the further heating.
19
2.1.3. SOL- GEL SYNTHESIS:
The sol-gel method has provided a very important means of preparing inorganic oxides. It is a
wet chemical method and a multi-step process involving both chemical and physical process
such as hydrolysis, polymerization, drying and densification. The name “sol- gel” is given to
the process because of the distinctive viscosity increase that occurs at the particular point into
the sequence of the step. A sudden increase in viscosity is the common features in sol-gel
processing, indicating the onset of gel formation. In the sol-gel process synthesis of inorganic
oxides is achieved from inorganic or organo-metallic precursors (generally metal alkoxides).
Most of the sol-gel literature deals with synthesis from alkoxides. Ethyl orthosilicate,
si(OEt)4 titanium tetra-isopropoxides are typical alkoxides used in sol-gel synthesis.
The important features of sol-gel method are better homogeneity compared to the traditional
ceramic method, high purity, lower processing temperature and more uniform phase
distribution in multi component system, better size and morphological control, the possibility
of preparing new crystalline and non-crystalline materials and lastly easy preparations of thin
film and coatings. The sol-gel method is widely used in ceramic technology.
The six important steps involved in the gel synthesis are as follows-
HYDROLYSIS
The process of hydrolysis may start with a mixture of a metal alkoxide and water in a solvent
(usually alcohol) at the ambient or a slightly elevated temperature. Acid or base catalyst are
added to speed up the reaction.
POLYMERISATION
This step involves condensation of adjacent molecules where in water and alcohols are
eliminated and metal oxide linkage are formed. Polymeric networks grow to colloidal
dimensions in the liquid (sol) state.
GELATION
In this step a polymeric network, link up to form a three dimensional network throughout, the
liquid.
20
DRYING
Here, water and alcohol are removed at a moderate temperatures (470K), leaving a
hydroxylated metal oxide with residual organic content.
DEHYDRATION
This step is carried out between 670K and 1070K to dry out the organic residue and
chemically bound water, yielding a glassy metal oxide with up to 20-30% micro porosity.
DENSIFICATION
Temperature in excess of 1270K is used to form dense oxide product.
2.1.4. ELECTROCHEMICAL METHODS:
Electrochemical methods have been employed to advantage for the synthesis of many solid
materials. Typical of the materials prepared in this manner are metal borides, silicates, oxides
and sulphides. Vanadate spinels of the formula MV2O4 as well as tungsten bronzes, AxWO3
have been prepared by the electrochemical route. Tungsten bronzes are obtained at cathode
when current is passed through two electrodes immersed in a molten solution of alkali metals
tungsten A2WO4 and WO3 ; Oxygen is liberated at anode. Blue Mo Bronzes have been
prepared by fused salt electrolysis.
2.1.5. CO-PRECIPITATION METHOD:
In this method oxalates of zinc and iron are used as the reactants, these are dissolved in
water in the ratio 1:1, the solutions are then mixed and heated to evaporate the water.
Oxalates of zinc and iron are gradually precipitated together and resulting fine powder is a
solid solution that contains the cations mixed together essentially on an atomic scale. The
precipitated solids are filtered off and heated.
2Fe (COO)2+Zn(COO)2-------------------- ZnFe2O4+4CO+2CO2
This method has been successfully used for the precipitation of other spinels.
21
2.1.6. PRECURSOR METHODS:
It was pointed out earlier that diffusion distances for the reacting cations are rather larger in
ceramic method. Diffusion distances are markedly reduced to a few angstorms by
incorporating the cations in the same solid precursor. A precursor method involves
preparation of a compound (precursors) of metals and mixed metals, which yield the desired
product of oxides on decomposition. Product obtained is fine, homogeneous in nature, and of
high purity. Synthesis of complex by the decomposition of precursor compounds has been
known for sometimes. e.g. Thermal decomposition of LaCo(CN)6.H2O and LaFe(CN)6.6H2O
in air readily yield LaCoO3 and LaFeO3 respectively. Ferrite spinels of the general formula
MFe2O4 (M=Mg, Mn, NI, Co) are prepared by thermal decomposition of acetate precursor of
the type M3Fe6(CH3CoO)17O3OH.12C5H5N chromates of the type MCr2O4 are obtained by
the decomposition of (NH4)M(CrO4).6H2O.[1,3]
2.1.7. PRESENT STUDY:
Synthesis of mixed metal ferrites of Mn-Zn and Ni-Zn were carried out by using different
chemical compounds with various chemical ligands to generate the precursors which were
decomposed utilizing different technique to obtain the desired ferrite products.
22
CHAPTER III
EXPERIEMENTAL MEASUREMENTS OF Mn-Zn FERRITE
The mixed metal ferrites of Mn-Zn ferrite and Ni-Zn ferrite with general chemical formula
MnxZn(1-x)Fe2O4 and NixZn(1-x)Fe2O4 were synthesized using precursor method and aqeous
chemical ligand with different decomposition techniques to obtain the desired ferrite
products. The sample obtained were characterized, magnetic and electrical properties were
studied for each series which are presented in chapter III first for Mn-Zn ferrite and then in
chapter IV for Ni-Zn ferrite.
3.1 The following method was used to prepare Mn-Zn ferrite samples.
3.1.1 BY WET CHEMICAL METHOD:
Manganese Acetate, Zinc Nitrate, Ferric Nitrate were dissolved in minimum quantity of
distilled water to obtain aqueous solution of metal ion. To this solution a calculated amount
of Succinate hydrazinate ligand solution was added and it was thoroughly mixed to obtain a
precursor. The mixture was then kept for drying on a hot plate. The solution dried to a solid
mass, which automatically got decomposed into the powdered form and this powders were
used for characterization and study of electrical and magnetic properties.
Table 3.1. Amount of compounds taken the synthesis of ferrites.
Sr. No. Composition Mn(CH3COO)2.4H2O
in g.
Zn(NO3)2.6H2O
in g.
Fe(NO3)3.9H2O
in g.
1 Mn0.4Zn0.6Fe2O4 4.9018 8.9240 40.400
2 Mn0.5Zn0.5Fe2O4 6.1273 7.4368 40.400
3 Mn0.6Zn0.4Fe2O4 7.3527 5.9494 40.400
4 Mn0.7Zn0.3Fe2O4 8.5781 4.4620 40.400
5 Mn0.8Zn0.2Fe2O4 9.8036 2.9747 40.400

23
3.2. Characterization:
Characterization of materials is an essential part of synthetic study in the development of
materials and understanding their compositions, structure etc.
The technique used for characterization of ferrites is
1. Infra- Red Spectroscopy (IR)
2. X-Ray Diffraction Spectroscopy (XRD)
3. Scanning Electron Microscopy (SEM)
3.2.1 Infra -Red Spectroscopy (IR):
It is used in characterization of material as it is quite a versatile tool in the qualitative as well
as quantitative analysis of molecular species. In IR spectroscopy identification of various
functional groups in unknown substances is carried out through the identification of different
covalent bond that are present in the compound and by comparing the absorption seen in an
experimental spectrum with the literature of absorptions of various functional groups, it is
possible to determine a list of possible identities for the bonds present.
IR absorption spectroscopy helps us to identify the spinel structure. The three typical
vibrational bands associated with spinel structure are at (1)600-550cm-1
(2)450-385cm-1
(3)350-330cm-1
for metal-oxygen bands.
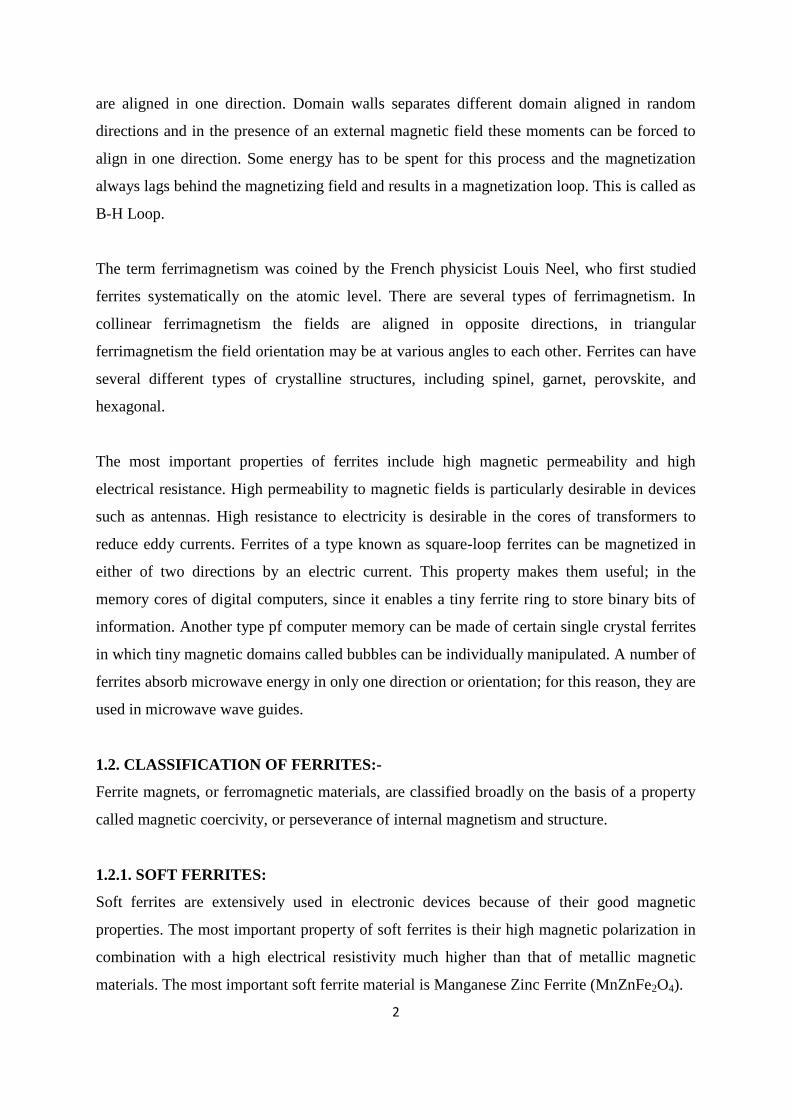
Fig 3.1(a): IR spectrum of Mn0.5Zn0.5Fe2O4 sample.
4000 3500 3000 2500 2000 1500 1000 500
0.5
0.4
0.3
0.2
0.1
0.0
Tra
nsm
issi
on
1/ cm-1
Mn0.5
24
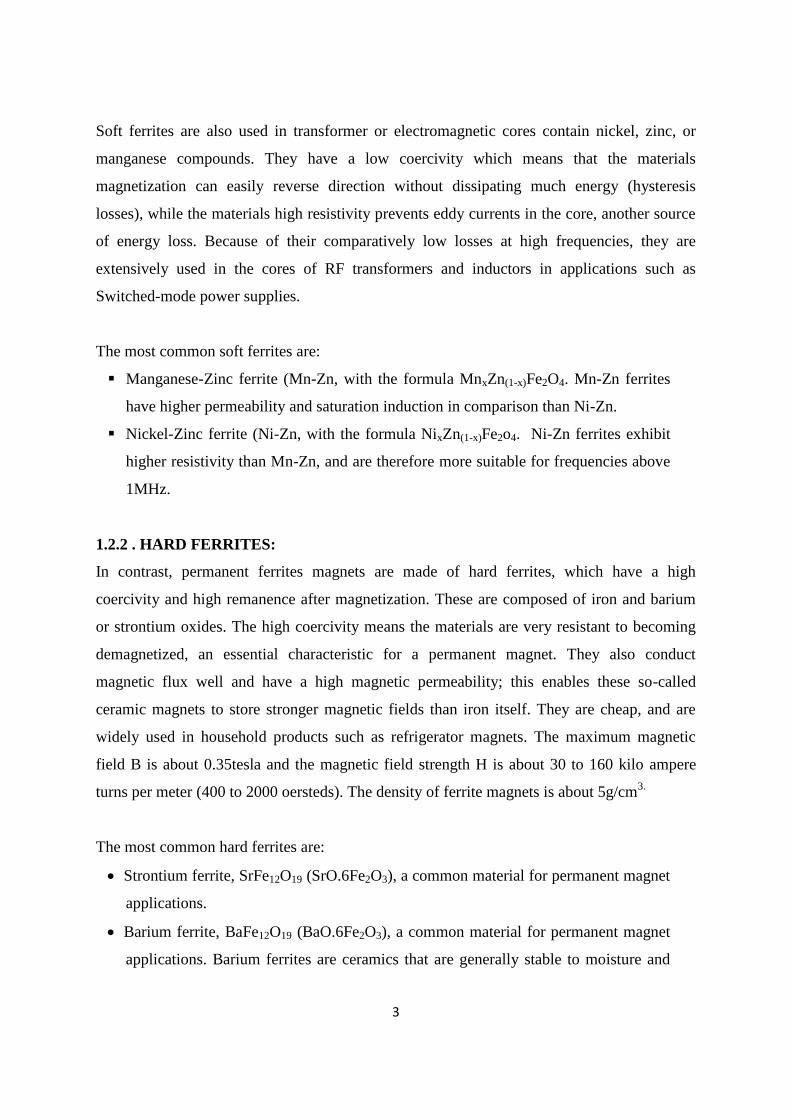
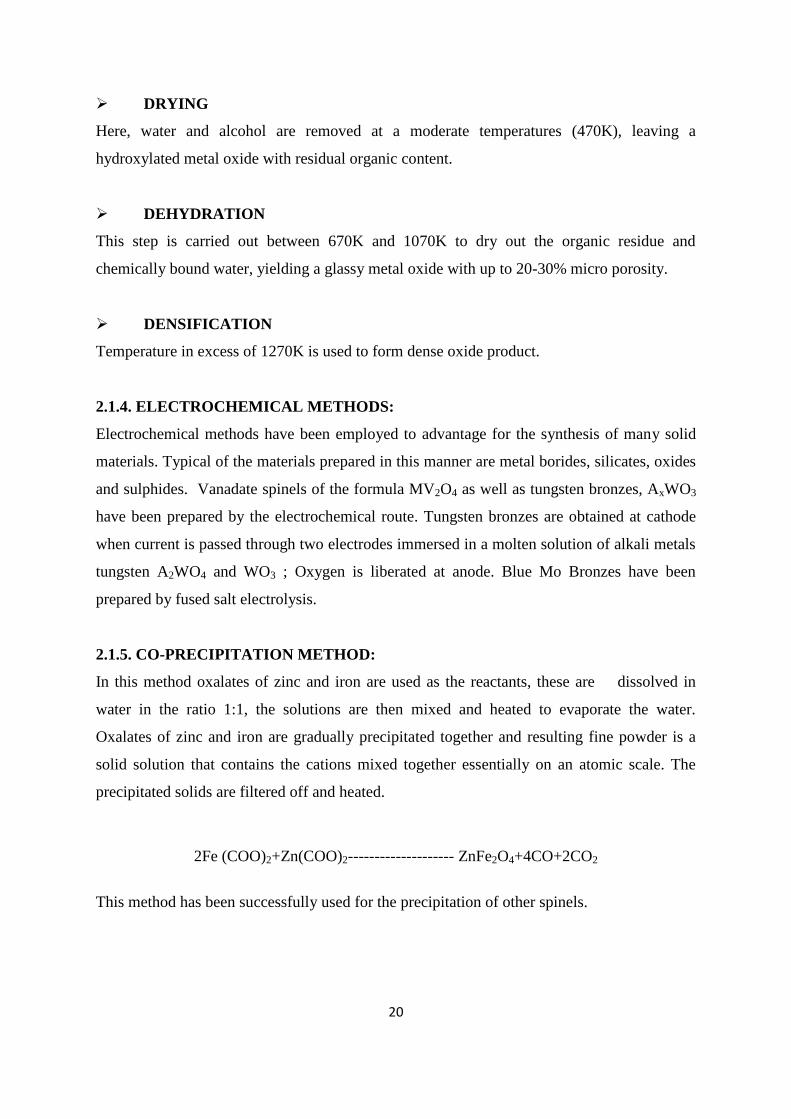
Fig 3.1(b): IR spectrum of Mn0.7Zn0.3Fe2O4 sample.
3.2.1.1 Results and Discussion
The infrared spectrum of Mn0.5Zn0.5Fe2O4 and Mn0.7Zn0.3Fe2O4 ferrite sample is shown in
Fig. 3.1(a) and 3.1(b) recorded in the range of 4000-400 cm-1
The IR spectrum of sample show two peaks, one in the range 600-550 cm-1
and the other 450-
385 cm-1
corresponding to:
(a) MeT – O – MeO stretching vibration 600-550 cm-1
(b) MeO O stretching vibration 450-385 cm-1
Here O is oxygen, MeO is metal in the octahedral site and MeT in the tetrahedral site. The
metal oxygen absorption bands (a) and (b) are pronounced for all spinel structures and
essentially for ferrites. For Mn0.5Zn0.5Fe2O4 sample two bands at 578.14 cm-1
and 470.10cm-1
and for Mn0.7Zn0.3Fe2O4 sample two bands at 574.76 cm-1
and 461.66 cm-1
are observed.
Similar patterns were obtained for all the samples. IR spectral data of all the ferrite samples
are in agreement with the reported value [4].
3.2.2 X-Ray Diffraction Spectroscopy-
X-Ray powder diffraction (XRD), is an instrumental technique that is used to identify the
crystal structure as it is reliable tool for material identification. As the interatomic spacing in
the crystal is of the order of 10-8
cm, therefore a ray with wavelength of similar order will
4000 3500 3000 2500 2000 1500 1000 500
1.0
0.8
0.6
0.4
0.2
0.0
Tra
nsm
issi
on
1/ cm-1
Mn0.7
25
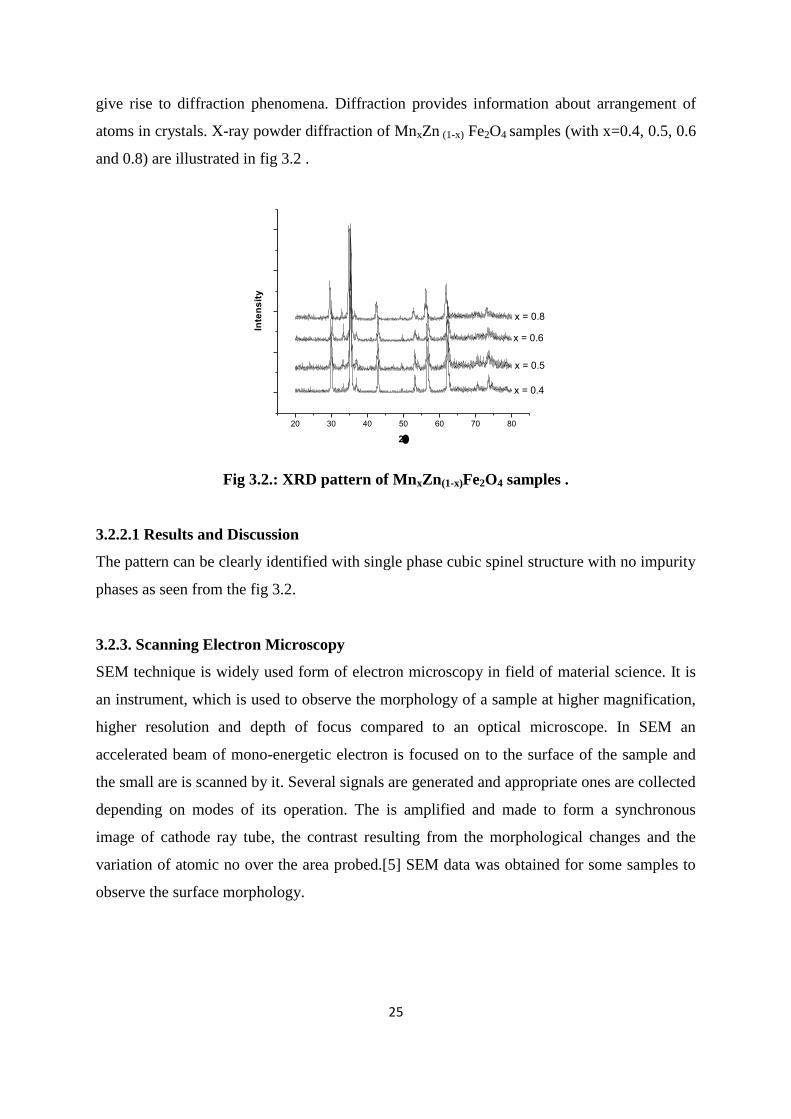
give rise to diffraction phenomena. Diffraction provides information about arrangement of
atoms in crystals. X-ray powder diffraction of MnxZn (1-x) Fe2O4 samples (with x=0.4, 0.5, 0.6
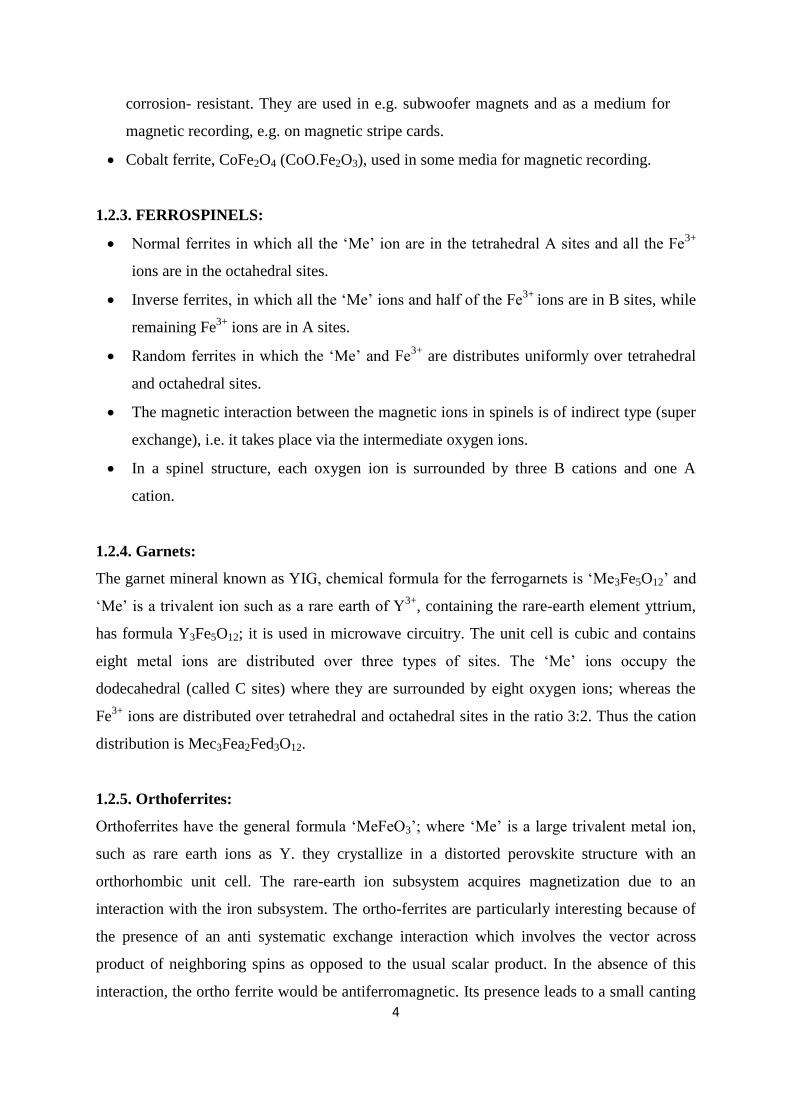
and 0.8) are illustrated in fig 3.2 .
20 30 40 50 60 70 80
x = 0.5
x = 0.4
x = 0.6
x = 0.8
Inte
ns
ity
2
Fig 3.2.: XRD pattern of MnxZn(1-x)Fe2O4 samples .
3.2.2.1 Results and Discussion
The pattern can be clearly identified with single phase cubic spinel structure with no impurity
phases as seen from the fig 3.2.
3.2.3. Scanning Electron Microscopy
SEM technique is widely used form of electron microscopy in field of material science. It is
an instrument, which is used to observe the morphology of a sample at higher magnification,
higher resolution and depth of focus compared to an optical microscope. In SEM an
accelerated beam of mono-energetic electron is focused on to the surface of the sample and
the small are is scanned by it. Several signals are generated and appropriate ones are collected
depending on modes of its operation. The is amplified and made to form a synchronous
image of cathode ray tube, the contrast resulting from the morphological changes and the
variation of atomic no over the area probed.[5] SEM data was obtained for some samples to
observe the surface morphology.
26
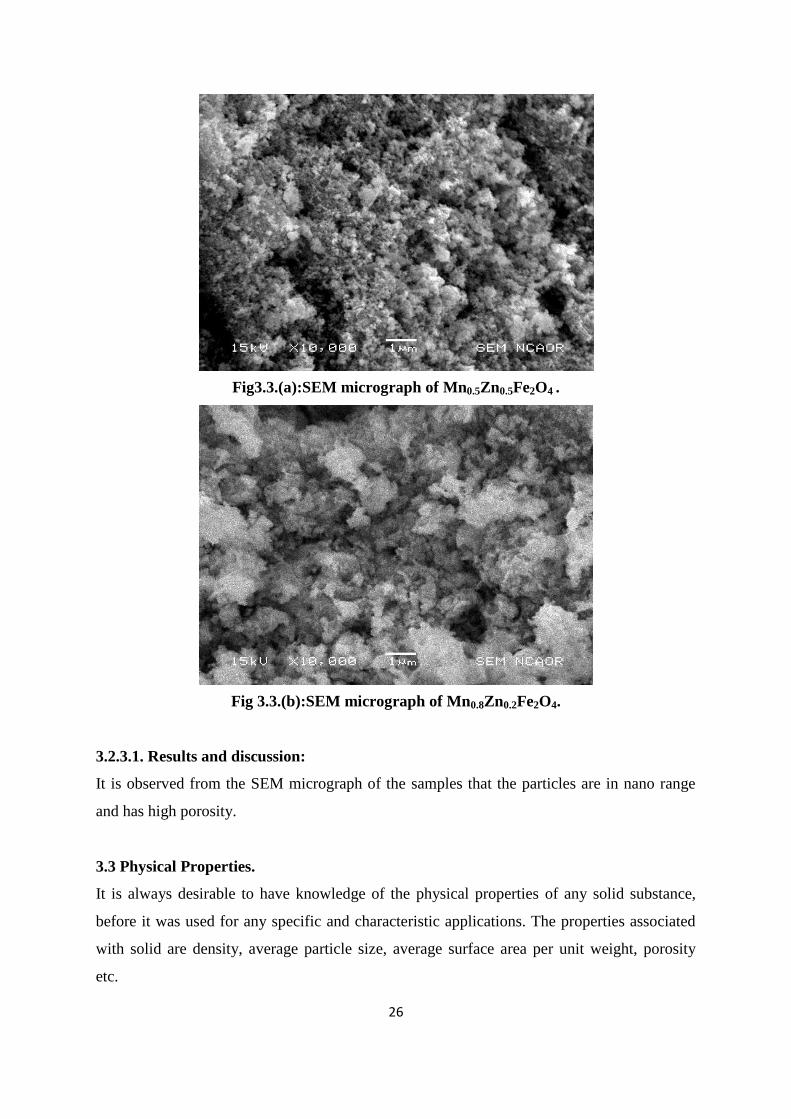
Fig3.3.(a):SEM micrograph of Mn0.5Zn0.5Fe2O4 .
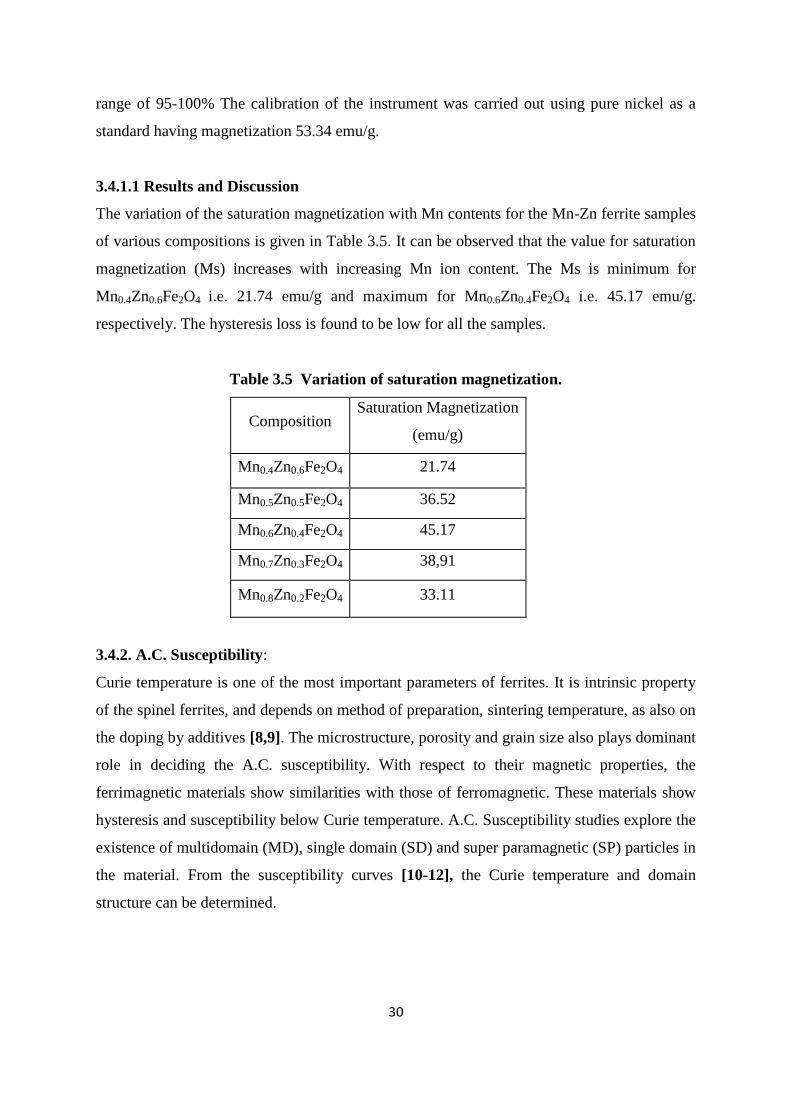
Fig 3.3.(b):SEM micrograph of Mn0.8Zn0.2Fe2O4.
3.2.3.1. Results and discussion:
It is observed from the SEM micrograph of the samples that the particles are in nano range
and has high porosity.
3.3 Physical Properties.
It is always desirable to have knowledge of the physical properties of any solid substance,
before it was used for any specific and characteristic applications. The properties associated
with solid are density, average particle size, average surface area per unit weight, porosity
etc.

27
In the present study on Mn-Zn ferrites, the investigations were restricted to few of these
properties such as inter planar distance, lattice constant, X-ray density and average particle
size.
3.3.1. Inter planar distance and Lattice constant from X-ray Diffraction data:
The X-ray data is use to determine interplanar distances and the lattice constants. Due to the
random orientation of the crystallites in the sample, a reflection at the particular position is
due to a set of atomic planes which are satisfying Braggs condition.
Bragg‟s equation is given by
nλ =2dhkl sinθ 3.1
Where dhkl is the interplanar spacing or distance of crystal planes of miller indices (hkl), „Ɵ‟
is the reflection angle, „λ‟ is the wavelength of the x-ray radiation and „n‟ is the order of
reflection.
For a cubic lattice, the interplanar distance dhkl,, lattice parameter „a‟ and the miller indices
(hkl) are related by relation,
dhkl = a / (h2+k
2+l
2)1/2
3.2
thus by using the above relation , the values of lattice constants „a‟ were calculated as shown
in table 3.2.
3.3.2 X-Ray Density:
X-ray was calculated by using the following relation [6]
ρx = 8M/Na3 3.3
where ρx is the x-ray density, „8‟ represents the no of atoms in unit cell of spinel lattice, „M‟
is the molecular weight of ferrite, „a‟ is the lattice constant and „N‟ is the Avogadro‟s
number.
3.3.3 Particle size using X-ray analysis:
As the particle size decreases the peaks in the XRD patterns get broadened due to the
incomplete destructive interference. This broadening caused by the fine crystallites is related
to the size of the grains by the Scherer formula.[7]
T=0.9 λ/Dp Cosθ 3.4

28
„T‟= Crystallite size, „λ‟=wavelength, „DP‟ FWHM (Full Width Half Measure) „θ‟= reflection
angle.
The particle size is an important parameter in the ferrite materials with regards to their
applications. By using XRD peak broadening and with help of Scherer formula the particle
size values were calculated. The size of Mn-Zn ferrites particles formed were in the nano-
meter range. The values are given in Table 3.4.
3.3.3.1 Results and Discussion
Formation of single phase cubic spinel structure of Mn(x)Zn(1-x)Fe2O4 with
x=0.4/0.5/0.6/0.7/0.8 was confirmed with help of XRD patterns obtained for all the samples.
As shown in table 3.2. The values of lattice constants „a‟ calculated from these were found to
increase with increasing Mn concentration and are in excellent agreement with reported
values. Similarly the interplanar distance „d‟ calculated is also in agreement with the
reported values.
The x-ray density calculated as shown in table 3.3 lies in the range of 5.251 g/cc for
Mn0.4Zn0.6Fe2O4 to 5.081 g/cc for Mn0.8Zn0.2Fe2O4. As the lattice constant increases the x-ray
density decreases as it is inversely proportional to lattice constant.
The particle size calculated using the Scherer formula, indicated in Table 3.4. are in the range
of 20.4 nm to 41.1nm. This shows that this method gives nano size ferrite particles, which is
also confirmed by the SEM micrograph.
Table.3.2 Showing the „a‟ values for various MnxZn(1-x)Fe2O4 samples.
Composition a in A0
Mn0.4Zn0.6Fe2O4 8.4219
Mn0.5Zn0.5Fe2O4 8.4431
Mn0.6Zn0.4Fe2O4 8.4628
Mn0.7Zn0.3Fe2O4 8.4704
Mn0.8Zn0.2Fe2O4 8.4826

29
Table.3.3 X-ray density for various MnxZn(1-x)Fe2O4 samples.
Concentration of Mn X-ray density in g/cc
0.4 5.251
0.5 5.206
0.6 5.196
0.7 5.114
0.8 5.081
Table.3.4. Variation of particle size in nm
Concentration of Mn Particle size in nm
0.4 20.4
0.5 21.9
0.6 34.1
0.7 38.6
0.8 41.1
3.4. Magnetic Properties:
3.4.1. Saturation Magnetization.
Experimental measurement
Powdered samples of MnxZn(1-x)Fe2O4 synthesized were pressed into pellets of the size 1.0
cm in diameter and of thickness ranging between 2mm-3mm under a pressure of 75KN
applied for about 3 minutes.
The saturation magnetization measurements of the samples were carried out using a high
field hysteresis loop tracer supplied by Magneta, Mumbai India. This instruments works on
the principle that the high magnetic field is generated in a solenoid by passing a pulse current
of sinusoidal shape. A pickup coil system is kept in the solenoid to detect field and the
magnetization signal of a sample placed in the pickup coil. The signals produced are then
processed by an electronic system. These transitory signals are digitized by a micro-controller
and then sent to computer for plotting a hysteresis loop, which is absorbed on the monitor
with calculated values of hysteresis parameters. The applied magnetic field was of 5 KOe.
The magnetization sensitivity: was of 10 EMU. The accuracy of measurements was in the
30
range of 95-100% The calibration of the instrument was carried out using pure nickel as a
standard having magnetization 53.34 emu/g.
3.4.1.1 Results and Discussion
The variation of the saturation magnetization with Mn contents for the Mn-Zn ferrite samples
of various compositions is given in Table 3.5. It can be observed that the value for saturation
magnetization (Ms) increases with increasing Mn ion content. The Ms is minimum for
Mn0.4Zn0.6Fe2O4 i.e. 21.74 emu/g and maximum for Mn0.6Zn0.4Fe2O4 i.e. 45.17 emu/g.
respectively. The hysteresis loss is found to be low for all the samples.
Table 3.5 Variation of saturation magnetization.
Composition Saturation Magnetization
(emu/g)
Mn0.4Zn0.6Fe2O4 21.74
Mn0.5Zn0.5Fe2O4 36.52
Mn0.6Zn0.4Fe2O4 45.17
Mn0.7Zn0.3Fe2O4 38,91
Mn0.8Zn0.2Fe2O4 33.11
3.4.2. A.C. Susceptibility:
Curie temperature is one of the most important parameters of ferrites. It is intrinsic property
of the spinel ferrites, and depends on method of preparation, sintering temperature, as also on
the doping by additives [8,9]. The microstructure, porosity and grain size also plays dominant
role in deciding the A.C. susceptibility. With respect to their magnetic properties, the
ferrimagnetic materials show similarities with those of ferromagnetic. These materials show
hysteresis and susceptibility below Curie temperature. A.C. Susceptibility studies explore the
existence of multidomain (MD), single domain (SD) and super paramagnetic (SP) particles in
the material. From the susceptibility curves [10-12], the Curie temperature and domain
structure can be determined.

31
Experimental measurement:
A.C. susceptibility measurements of the unsintered were made using computerized pulse field
A.C. susceptibility apparatus described by Likhite et al [13]. The apparatus consists of
Helmholtz coil, two pick-up coils, furnace, sample holder, temperature measuring device,
control unit, data acquisition system, power supply to run the furnace and PC with related
software to execute the run cycle. The Helmholtz coil is powered to produce pulsating
magnetic field. To avoid over heating of coils, a glass jacket with water circulation was used.
In a typical experiment, the weighed sample was placed in the sample holder, a quartz tube
fused at one end, which then was inserted in glass jacket and placed at the centre of the pick-
up coil for uniform heating. The data, that is, magnetization (emu/g) as a function of
temperature collected by the data acquisition system is directly saved in a file on the PC
which simultaneously shows the progress of the experiment by way of a graph on the PC
monitor. The temperature of the furnace was maintained by a power supply and was
measured by using platinum rhodium thermocouple. It is a regulated digital power supply
whose voltage and current are varied automatically by the PID temperature controller output
which can be programmed for a set temperature and a set heating rate. The magnetic
moments were recorded at various temperatures while, the sample was heated at a preset
heating rate. The heating was continued till the magnetization (emu/g) signal reduces to zero.
This happens when the Curie temperature is attained.
Table 3.6 Variation of Curie Temperature
Composition Curie temperature
in 0C
Mn0.4Zn0.6Fe2O4 232
Mn0.5Zn0.5Fe2O4 257
Mn0.6Zn0.4Fe2O4 289
Mn0.7Zn0.3Fe2O4 341
Mn0.8Zn0.2Fe2O4 384
3.4.2.1 Results and Discussion
The Curie temperature was found to increase with increase in manganese content in the
samples Mn0.4Zn0.6Fe2O4 to Mn0.8Zn0.2Fe2O4 from 232 0C to 384
0C

32
3.5. Electrical properties:
3.5.1. Resistivity.
Experimental measurement
MnxZn(1-x)Fe2O4 of various composition (x=0.4,0.5,0.6,0.7 and 0.8) samples were pressed
into pallets of 10mm in diameter and thickness between 2mm to 3mm under a pressure of 75
KN applied for 3 minutes. The dc resistivity measurements on these samples were then
carried out using standard two probe method.
Fig.3.4. Variation of log10ρ with 1000/temp+273 k for MnxZn(1-x)Fe2O4 samples
3.5.1.1. Results and Discussion:
The fig 3.4 shows the graph of log10ρ v/s 1000/T k for the as prepared samples. All the
samples show semiconductor behavior wherein initially the conductance is low and it
increases with the temperature and also undergoes ferrimagnetic to paramagnetic transition.
The curve has two distinct broad parts; initial parts of curve indicating low conductance at
lower temperature and later on sharp increase with steep slope when conductance increases or
resistivity decreases. The samples show resistivity value in the range 3.6810 X 10⁶ ohm cm to
4.7596 X 10⁴ ohm cm with low value for Mn0.8Zn0.2Fe2O4 and high for Mn0.6Zn0.4Fe2O4
sample synthesized by this method. Electronic conduction mechanisms in ferrites have been
studied by many research workers [14] and various models have been proposed; however, the
thermally activated hopping model is found to be more appropriate in explaining
1.6 1.8 2.0 2.2 2.4 2.6 2.8 3.0
1
2
3
4
5
6
7
Log 10
1000/Temp+273 K
Mn 0.4
Mn 0.5
Mn 0.6
Mn 0.7
Mn 0.8

33
quantitatively the electrical behavior of Mn–Zn ferrite. In the hopping process the additional
electron on ferrous (Fe2+
) ion requires little energy to move to an adjacent (Fe3+
) ion on the
equivalent lattice sites(B sites). In the presence of the electric field, these extra electron
hopping between iron ions give rise to the electrical conduction. Therefore any change in the
(Fe2+
) ion content in spinel ferrite lattice and/or the distance between them is crucial to the
intrinsic resistivity of Mn–Zn ferrite. It is also affected by impurities. The introduction of
another cation into the lattice causes a change in the valence distribution on the B sites, then
the number of electrons potentially available for transfer will be altered. This is crucial for the
conduction mechanism.
3.6. CONCLUSION:
3.6.1. Summary:-
The present study was carried out to synthesize fine particles Mn-Zn mixed metal ferrite
material with formula MnxZn1-xFe2O4 with x= 0.4 0.5, 0.6 0.7 and 0.8 the samples were
prepared using the precursor method.
Samples were obtained at low temperature and were confirmed by different methods of
characterization such as IR spectral analysis, XRD and SEM analysis
The lattice constant for the samples are in the range of 8.4219 A0- 8.4826 A
0 . The values are
in close agreement with the reported values.
The average particles size calculated using Scherer formula was in the range of 20.4 nm to
41.1 nm.
Saturation magnetization (Ms) values of samples are found increase as manganese content
increases but beyond X=0.6 it if found to decrease. The hysteresis losses for the samples are
found to be low.
The Curie temperature was found to increase with decrease in non-magnetic Zn content for
the samples.
34
The room temperature dc resistivity is found in the range of 104 to 10
6for the samples of this
method. The values of room temperature resistivity are slightly higher than reported values
for ceramic method.
Thus This simple precursor method, adopting auto combustion for the synthesis, was found to
produce high performance nanoparticle Mn – Zn ferrite materials.
3.6.2. Scope for future work
Further study on magnetic permeability, dielectric constant, thermo electric power and other
parameters of ferrites can be carried out. Sintering of the as prepared samples can be done to
study the properties of bulk material.

35
CHAPTER IV
EXPERIEMENTAL MEASUREMENTS OF Ni-Zn FERRITE
4. Study of Nickel Zinc Ferrite:
4.1. Synthesis of Ni(x)Zn(1-x)Fe2O4 mixed metal ferrites by precursor method.
Stoichiometric amounts of nickel nitrate, iron nitrate and zinc nitrate were taken as per the
composition of Ni2+
, Zn2+
and Fe3+
ions mentioned in the table below.
Table 4.1. Amount of compounds taken the synthesis of ferrites.
Samples Nickel Nitrate
in g.
Zinc Nitrate in
g.
Iron Nitrate in
g.
Ni0.3Zn0.7Fe2O4
4.3619 10.4114 40.400
Ni0.4Zn0.6Fe2O4
5.8158 8.9241 40.400
Ni0.5Zn0.5Fe2O4
7.2697 7.4367 40.400
Ni0.6Zn0.4Fe2O4
8.7237 5.9494 40.400
Ni0.7Zn0.3Fe2O4
10.1776 4.4620 40.400
Nickel nitrate, zinc nitrate and iron nitrate were dissolved in minimum quantity of distilled
water to obtain aqueous solution of metal ions. To this solution a calculated amount of
succinate hydrazinate ligand solution was added and it was thoroughly mixed. The mixture
was then kept for drying on a hot plate. The mixture dried to a solid mass which
automatically got decomposed into the powder form and these powders were used for
characterization and study of electrical and magnetic properties as in the first method.
36
4.2. Characterization.
Characterisation of material is carried out in order to systematically study the development of
materials and to understand their composition, structure, etc. The techniques used for the
characterization of ferrite are:
1. Infra Red Spectroscopy (IR)
2. X-ray Diffraction Spectroscopy (XRD)
3. Scanning Electron Microscope
4.2.1. Infra Red Spectroscopy:
Infra Red (IR) Spectroscopy is used in characterization of materials as it is versatile tool in
qualitative as well as quantitative analysis of molecular species. In IR spectroscopy
identification of various functional groups in unknown substances is carried out through the
identification of different covalent bonds that are present in compound and by comparing the
absorption seen in an experimental spectrum with the literature of absorption of various
functional groups, it is possible to determine a list of possible identities for the bonds present.
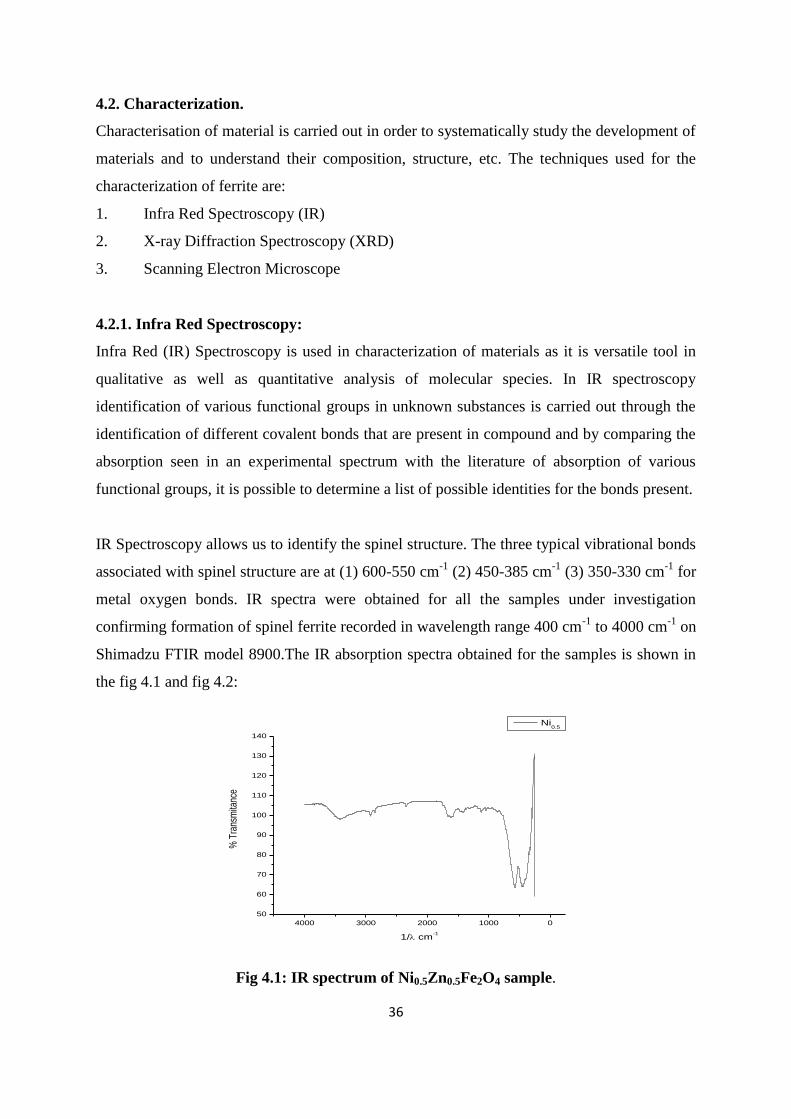
IR Spectroscopy allows us to identify the spinel structure. The three typical vibrational bonds
associated with spinel structure are at (1) 600-550 cm-1
(2) 450-385 cm-1
(3) 350-330 cm-1
for
metal oxygen bonds. IR spectra were obtained for all the samples under investigation
confirming formation of spinel ferrite recorded in wavelength range 400 cm-1
to 4000 cm-1
on
Shimadzu FTIR model 8900.The IR absorption spectra obtained for the samples is shown in
the fig 4.1 and fig 4.2:
Fig 4.1: IR spectrum of Ni0.5Zn0.5Fe2O4 sample.
4000 3000 2000 1000 0
50
60
70
80
90
100
110
120
130
140
% T
rans
mita
nce
1/ cm-1
Ni0.5

37
Fig 4.2: IR spectrum of Ni0.7Zn0.3Fe2O4 sample.
Results and Discussion:-
The infrared spectrum of Ni0.5Zn0.5Fe2O4 and Ni0.7Zn0.3Fe2O4 ferrite sample is shown in
Fig.4.1 and 4.2. respectively and recorded in the range of 4000-400 cm-1
The IR spectrum of sample show two peaks, one in the range 600-550 cm-1
and the other 450-
385 cm-1
corresponding to:
(c) MeT – O – MeO stretching vibration 600-550 cm-1
(d) MeO O stretching vibration 450-385 cm-1
Here O is oxygen, MeO is metal in the octahedral site and MeT in the tetrahedral site. The
metal oxygen absorption bands (a) and (b) are pronounced for all spinel structures and
essentially for ferrites, which are also seen in the sample. For Ni0.5Zn0.5Fe2O4 sample two
bands are at 570.85 cm-1
and 446.35cm-1
and for Ni0.7Zn0.3Fe2O4 sample two bands are at
575.08 cm-1
and 445.35 cm-1
. Similar patterns were obtained for all the samples. IR spectral
data of all the ferrite samples are in agreement with the reported value [15,16].
4.2.2. X-Ray Diffraction Spectroscopy:
X-ray powder diffraction (XRD), is an instrumental technique that is used to identify the
crystal structure as it is reliable for material identification. As the interatomic spacing in the
crystal is of the order of 10-8
cm, therefore a ray with wavelength of similar order will give
4000 3000 2000 1000 0
60
80
100
120
140
160
% T
ran
smita
nce
1/ cm-1
Ni0.7
38
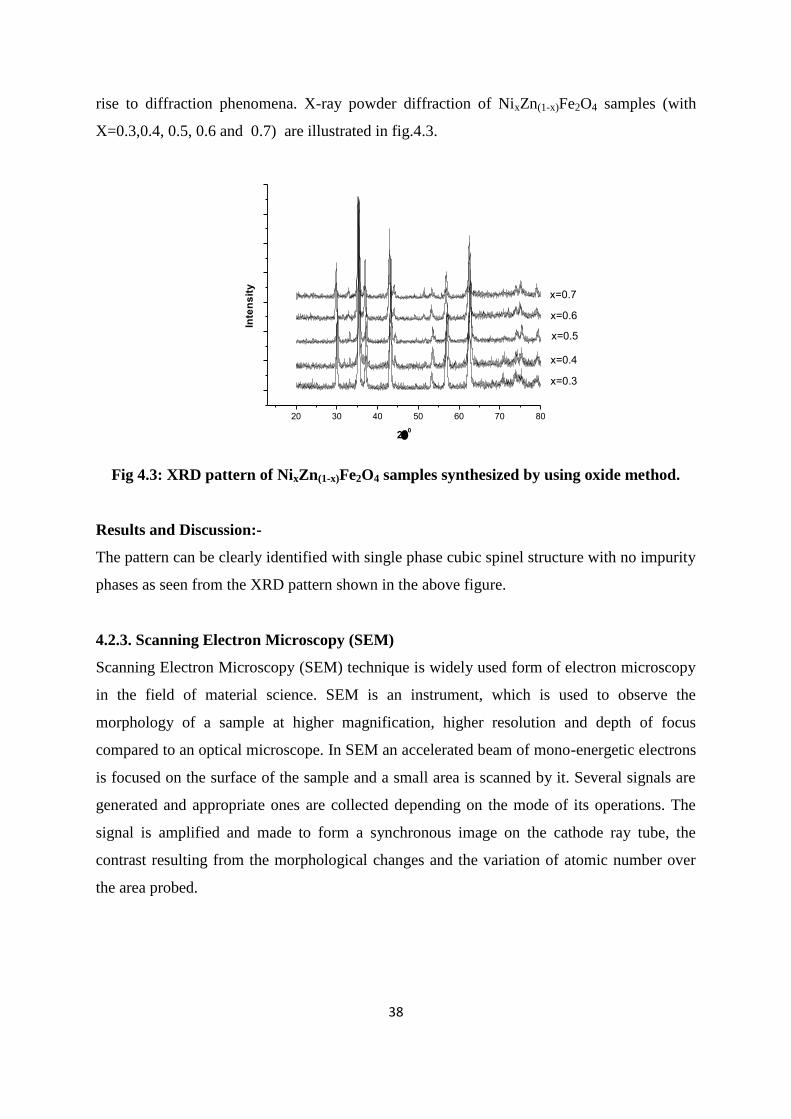
rise to diffraction phenomena. X-ray powder diffraction of NixZn(1-x)Fe2O4 samples (with
X=0.3,0.4, 0.5, 0.6 and 0.7) are illustrated in fig.4.3.
20 30 40 50 60 70 80
x=0.3
x=0.6
x=0.5
x=0.7
x=0.4
Inte
ns
ity
20
Fig 4.3: XRD pattern of NixZn(1-x)Fe2O4 samples synthesized by using oxide method.
Results and Discussion:-
The pattern can be clearly identified with single phase cubic spinel structure with no impurity
phases as seen from the XRD pattern shown in the above figure.
4.2.3. Scanning Electron Microscopy (SEM)
Scanning Electron Microscopy (SEM) technique is widely used form of electron microscopy
in the field of material science. SEM is an instrument, which is used to observe the
morphology of a sample at higher magnification, higher resolution and depth of focus
compared to an optical microscope. In SEM an accelerated beam of mono-energetic electrons
is focused on the surface of the sample and a small area is scanned by it. Several signals are
generated and appropriate ones are collected depending on the mode of its operations. The
signal is amplified and made to form a synchronous image on the cathode ray tube, the
contrast resulting from the morphological changes and the variation of atomic number over
the area probed.

39
SEM data was obtained for some samples to observe the surface morphology.
Fig 4.4: SEM micrograph of Ni0.3Zn0.7Fe2O4 .
Fig 4.5: SEM micrograph of Ni0.6Zn0.4Fe2O4 .
Results and Discussion:-
As can be seen from the SEM micrograph Fig 4.4 and Fig 4.5 of Ni0.4Zn0.6Fe2O4 and
Ni0.6Zn0.4Fe2O4 samples obtained from this method that the particles are in nano range and
have high porosity.

40
4.3. Physical Properties.
It is better to have the knowledge of the physical properties of any solid substance, before it is
used for any specific and characteristic application. The properties associated with solid are
density, average particle size, average surface area per unit weight, porosity, etc.
In the present study on Ni-Zn ferrites, the investigations were restricted to few of these
properties such as interplanar distance, lattice constant, X-ray density and average particle
size.
4.3.1. Inter Planer Distance and Lattice Constants from X-ray Diffraction Data:
The X-ray data is used to determine interplanar distances and the lattice constants. Due to the
random orientation of crystallites in the sample, a reflection at the particular position is due to
the set of the atomic planes which are satisfying Bragg‟s condition.
Bragg‟s equation is given by:-
nλ = 2dhkl sinθ (4.1)
Where :- „d‟hkl is the interplanar spacing or distance of crystals planes of miller indices (hkl).
„θ‟ is the reflection angle.
„λ‟ is wavelength of the X-ray radiation.
„n‟ is order of reflection.
For a cubic lattice, the interplanar distance dhkl, lattice parameter „a‟ and miller indices (hkl)
are related by equation :-
d(hkl) = a/(h2+k
2+l
2)1/2
(4.2)
thus, by using the above relation (2), the values of lattice constants „a‟ were calculated.
4.3.2. X-Ray Density:
The X-ray density was calculated by using the relation[ ] :-
ρx = 8M/Na3 (4.3)
where „ρx‟ is the X-ray density.
„8‟ represents the number of atoms in a unit cell of spinel lattice.
„M‟ is the molecular weight of the ferrite.
„a‟ is the lattice constant.
„N‟ is the Avogadro‟s number.

41
4.3.3 Particle Size Using X-Ray Analysis
As the particle size decreases the peaks in the XRD patterns gets broadened due to the
incomplete destructive interference. This broadening caused by the fine crystallites is related
to the size of the grains by the Scherer formula [ ].
T= 0.9λ / Dρ cosθ (4.4)
Where :- T=Crystallite size; λ= Wavelength; Dρ= FWHM (Full width half maxima);
θ= reflection angle.
Results and Discussion:-
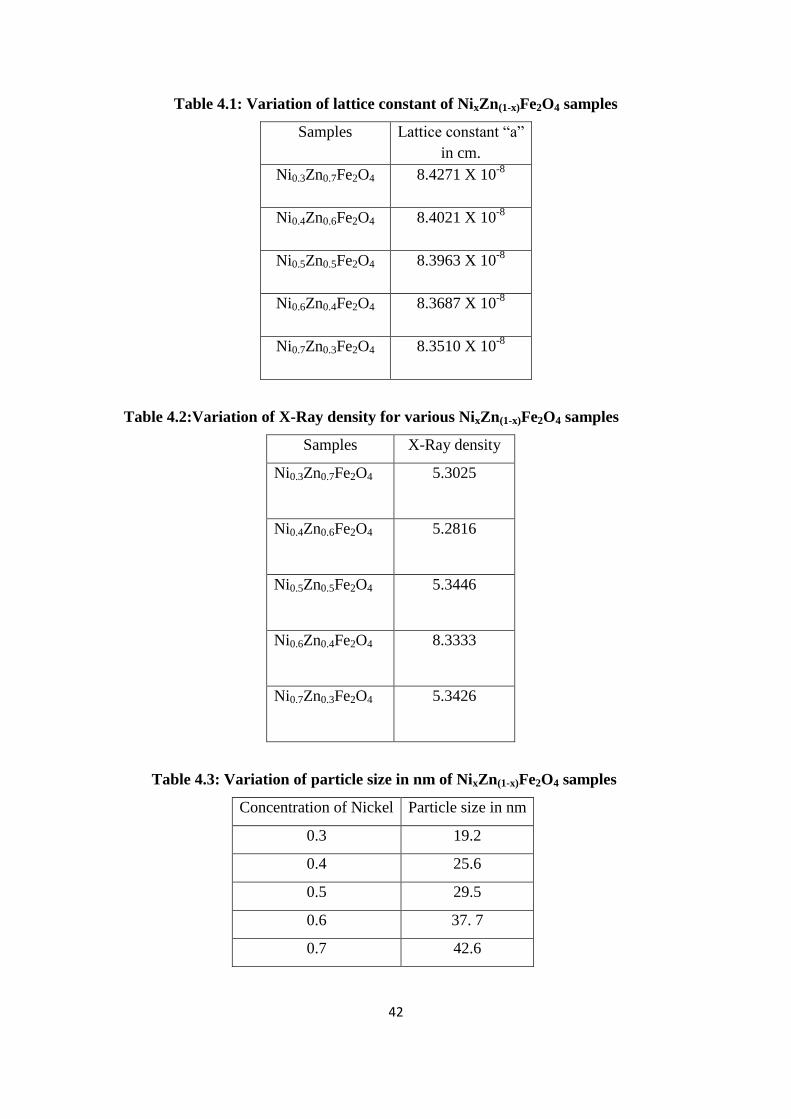
Formation of single phase cubic spinel structure of NixZn(1-x)Fe2O4 (X= 0.3,0.4, 0.5, 0.6, and
0.7) samples was confirmed with help of XRD patterns obtained for all the samples. As
shown in the table 4.1 and 4.2 the values of lattice constants „a‟ calculated from these were
found to decrease with increase in Ni concentration. This decrease is attributed to the lower
ionic radii of Ni (0.78Ao) as compared to Zn (0.82A
o) and are in agreement with reported
values [17],.
The X-ray density calculated for the samples synthesised using oxide method are shown in
table 4.3, it lies in the range of 5.2946 g/cc for Ni0.4Zn0.6Fe2O4 to 5.3443 g/cc for
Ni0.7Zn0.3Fe2O4 and the X-ray density calculated for the samples synthesised using wet
chemical method are shown in table 4.4, and lie in the range of 5.3158 g/cc for
Ni0.4Zn0.6Fe2O4 to 5.3387 g/cc for Ni0.8Zn0.2Fe2O4 as the lattice constants decreases the X-ray
density is found to increase as it is inversely proportional to the lattice constant.
The particle size of samples synthesized using oxide method and wet chemical method is
calculated using the Scherer formula, indicated in table 4.5 and 4.6 are in the range from
19.42 nm to 22.58 nm and 22.56 nm to 26.95 nm respectively. This shows that both the
method gives nano size ferrite particles, which is also confirmed by the SEM micrograph.
42
Table 4.1: Variation of lattice constant of NixZn(1-x)Fe2O4 samples
Samples Lattice constant “a”
in cm.
Ni0.3Zn0.7Fe2O4
8.4271 X 10⁻⁸
Ni0.4Zn0.6Fe2O4
8.4021 X 10⁻⁸
Ni0.5Zn0.5Fe2O4
8.3963 X 10⁻⁸
Ni0.6Zn0.4Fe2O4
8.3687 X 10⁻⁸
Ni0.7Zn0.3Fe2O4
8.3510 X 10⁻⁸
Table 4.2:Variation of X-Ray density for various NixZn(1-x)Fe2O4 samples
Samples X-Ray density
Ni0.3Zn0.7Fe2O4
5.3025
Ni0.4Zn0.6Fe2O4
5.2816
Ni0.5Zn0.5Fe2O4
5.3446
Ni0.6Zn0.4Fe2O4
8.3333
Ni0.7Zn0.3Fe2O4
5.3426
Table 4.3: Variation of particle size in nm of NixZn(1-x)Fe2O4 samples
Concentration of Nickel Particle size in nm
0.3 19.2
0.4 25.6
0.5 29.5
0.6 37. 7
0.7 42.6
43
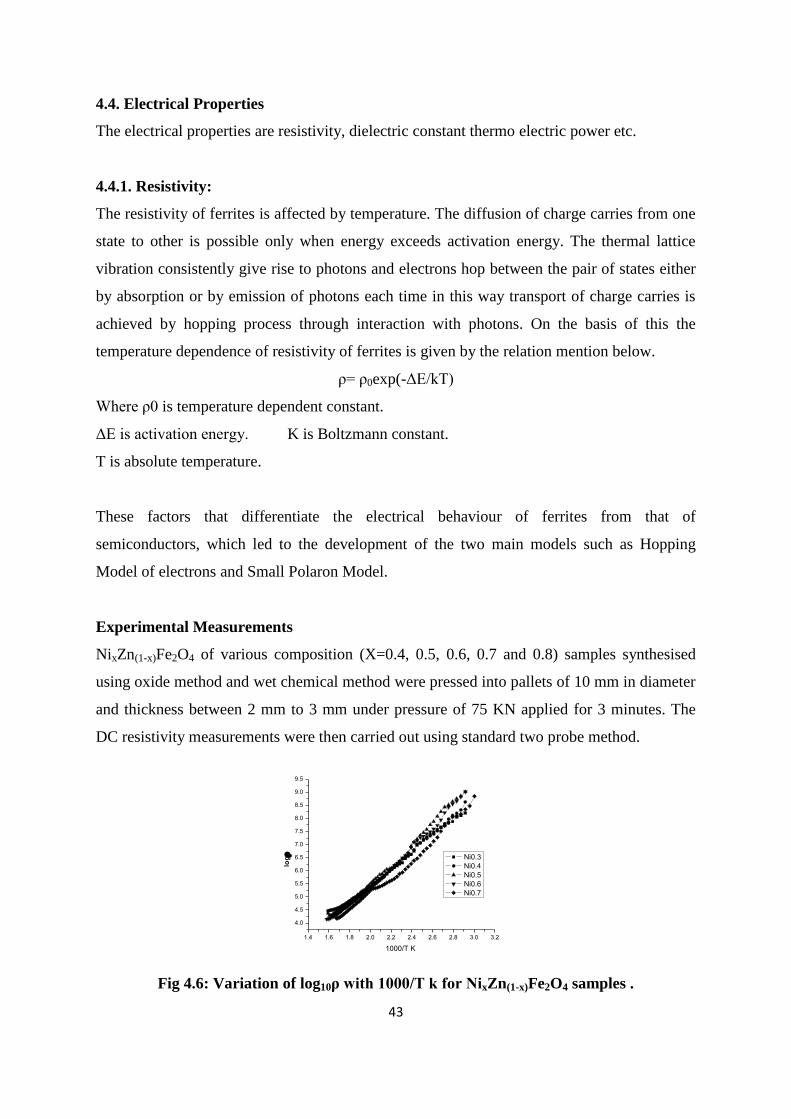
4.4. Electrical Properties
The electrical properties are resistivity, dielectric constant thermo electric power etc.
4.4.1. Resistivity:
The resistivity of ferrites is affected by temperature. The diffusion of charge carries from one
state to other is possible only when energy exceeds activation energy. The thermal lattice
vibration consistently give rise to photons and electrons hop between the pair of states either
by absorption or by emission of photons each time in this way transport of charge carries is
achieved by hopping process through interaction with photons. On the basis of this the
temperature dependence of resistivity of ferrites is given by the relation mention below.
ρ= ρ0exp(-ΔE/kT)
Where ρ0 is temperature dependent constant.
ΔE is activation energy. K is Boltzmann constant.
T is absolute temperature.
These factors that differentiate the electrical behaviour of ferrites from that of
semiconductors, which led to the development of the two main models such as Hopping
Model of electrons and Small Polaron Model.
Experimental Measurements
NixZn(1-x)Fe2O4 of various composition (X=0.4, 0.5, 0.6, 0.7 and 0.8) samples synthesised
using oxide method and wet chemical method were pressed into pallets of 10 mm in diameter
and thickness between 2 mm to 3 mm under pressure of 75 KN applied for 3 minutes. The
DC resistivity measurements were then carried out using standard two probe method.
1.4 1.6 1.8 2.0 2.2 2.4 2.6 2.8 3.0 3.2
4.0
4.5
5.0
5.5
6.0
6.5
7.0
7.5
8.0
8.5
9.0
9.5
log
1000/T K
Ni0.3
Ni0.4
Ni0.5
Ni0.6
Ni0.7
Fig 4.6: Variation of log10ρ with 1000/T k for NixZn(1-x)Fe2O4 samples .

44
Results and Discussion:
The fig 4.6 shows the graph of log10ρ v/s 1000/Tk for the prepared samples. All the samples
show semiconductor behavior wherein initially the conductance is low and it increases with
the temperature and also undergoes ferrimagnetic to paramagnetic transition. The curve has
two distinct broad parts; initial parts of curve indicating low conductance at lower
temperature and later on sharp increase with steep slope when conductance increases or
resistivity decreases. The samples show resistivity value in the range 1.3217 X 10⁷ ohm cm to
7.4604 X 10⁶ ohm cm with low value for Ni0.7Zn0.3Fe2O4 and high value for Ni0.3Zn0.7Fe2O4.
Electronic conduction mechanisms in ferrites have been studied by many and various models
have been proposed; however, the thermally activated hopping model is found to be more
appropriate in explaining quantitatively the electrical behavior of Ni–Zn ferrite. In the
hopping process the additional electron on ferrous (Fe2+
) ion requires little energy to move to
an adjacent (Fe3+
) ion on the equivalent lattice sites(B sites). In the presence of the electric
field, these extra electron hopping between iron ions give rise to the electrical conduction.
Therefore any change in the (Fe2+
) ion content in spinel ferrite lattice and/or the distance
between them is crucial to the intrinsic resistivity of Ni–Zn ferrite. It is also affected by
impurities. The introduction of another cation into the lattice causes a change in the valence
distribution on the B sites, then the number of electrons potentially available for transfer will
be altered. This is crucial for the conduction mechanism.[14]
4.5. Magnetic Properties
The magnetic properties include saturation magnetization, retentivity, coercivity,
permeability, susceptibility and Curie temperature.
When the applied field is decreased, magnetization decreases. In multi domain bulk
materials, demagnetization occurs primarily via spin rotation through the domain walls. If the
demagnetization curve, during the removal of the applied field, does not follow the initial
magnetization curve, the material displays hysteresis, which is the lag observed.
Remanance magnetization (Mr) is the magnetization at zero applied field (H=0). The
magnetic field applied in the negative direction requires returning the magnetization to zero is
the coercive force (Hc).

45
Experiment Measurement:
4.5.1 Saturation magnetization:
Powder samples of NixZn1-xFe2O4(X= 0.3, 0.4, 0.5, 0.6 and 0.7) were pressed into pellets of
the size 10 mm diameter of thickness between 2 mm to 3 mm under a pressure of 75 KN
applied for 3 minutes. The saturation magnetization and hysteresis loss measurement on the
samples were carried out using a high field hysteresis loop tracer, supplied by Magneta,
Mumbai.
Table 4.4: Variation of saturation magnetization
of NixZn(1-x)Fe2O4 samples prepared by oxide method.
Figure 4.7: Variation of Saturation magnetization
.
Concentration Saturation
Magnetization
(emu/g)
Ni0.3Zn0.7Fe2O4 31.64
Ni0.4Zn0.6Fe2O4 39.28
Ni0.5Zn0.5Fe2O4 47.86
Ni0.6Zn0.4Fe2O4 41.16
Ni0.7Zn0.3Fe2O4 36.31
-6 -4 -2 0 2 4 6
-60
-40
-20
0
20
40
60
0.3
0.5
0.6
0.4
0.7
Magnetic Field Strength in Oe
Sat
urat
ion
Mag
netis
atio
n in
em
u/gm
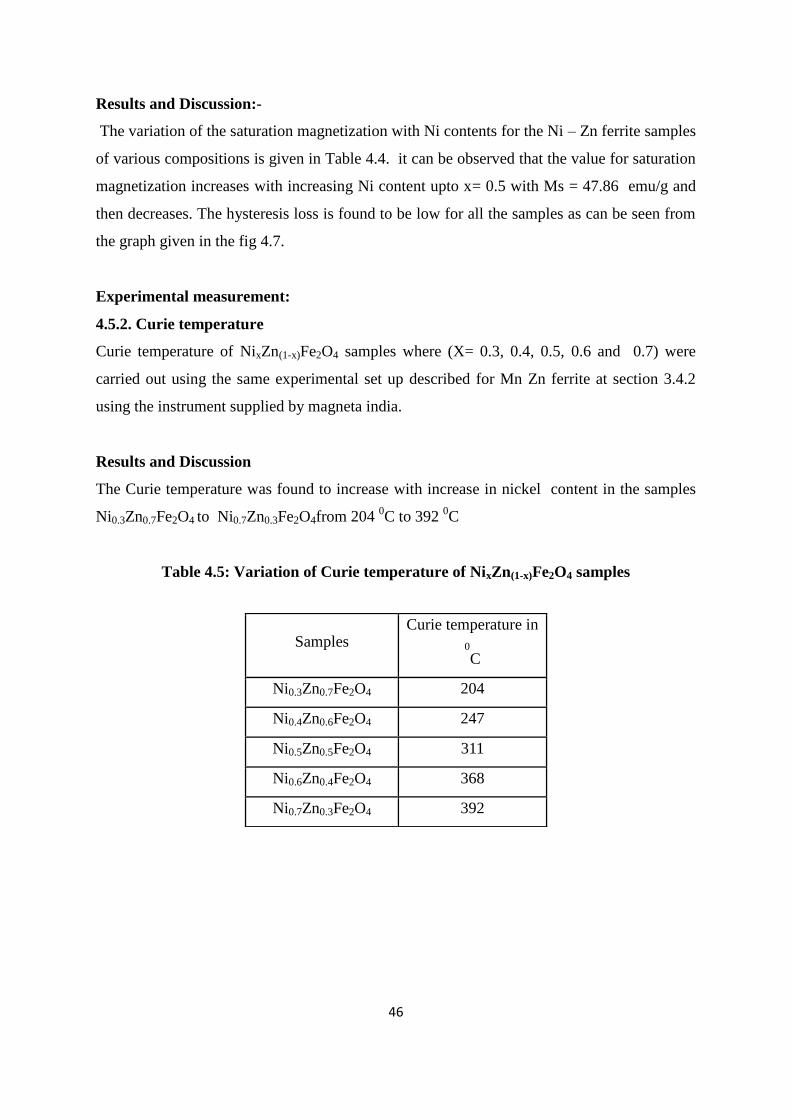
46
Results and Discussion:-
The variation of the saturation magnetization with Ni contents for the Ni – Zn ferrite samples
of various compositions is given in Table 4.4. it can be observed that the value for saturation
magnetization increases with increasing Ni content upto x= 0.5 with Ms = 47.86 emu/g and
then decreases. The hysteresis loss is found to be low for all the samples as can be seen from
the graph given in the fig 4.7.
Experimental measurement:
4.5.2. Curie temperature
Curie temperature of NixZn(1-x)Fe2O4 samples where (X= 0.3, 0.4, 0.5, 0.6 and 0.7) were
carried out using the same experimental set up described for Mn Zn ferrite at section 3.4.2
using the instrument supplied by magneta india.
Results and Discussion
The Curie temperature was found to increase with increase in nickel content in the samples
Ni0.3Zn0.7Fe2O4 to Ni0.7Zn0.3Fe2O4from 204 0C to 392
0C
Table 4.5: Variation of Curie temperature of NixZn(1-x)Fe2O4 samples
Samples Curie temperature in
0
C
Ni0.3Zn0.7Fe2O4 204
Ni0.4Zn0.6Fe2O4 247
Ni0.5Zn0.5Fe2O4 311
Ni0.6Zn0.4Fe2O4 368
Ni0.7Zn0.3Fe2O4 392
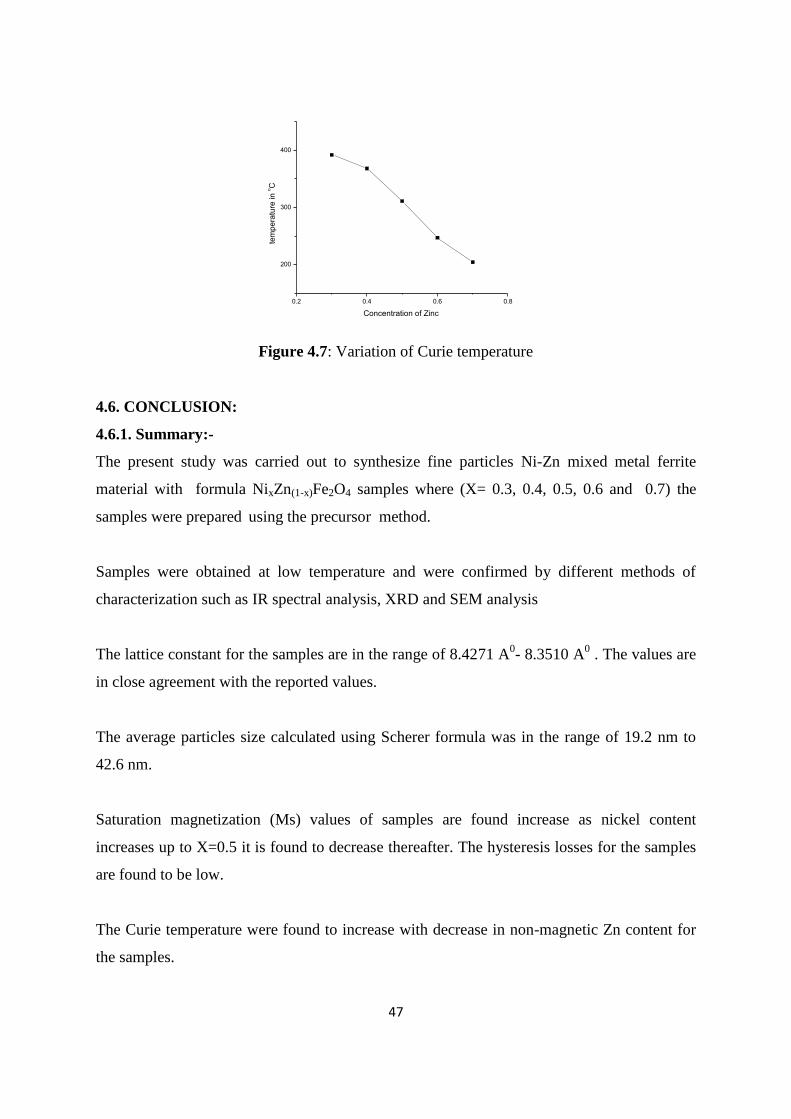
47
0.2 0.4 0.6 0.8
200
300
400
tem
pe
ratu
re in
oC
Concentration of Zinc
Figure 4.7: Variation of Curie temperature
4.6. CONCLUSION:
4.6.1. Summary:-
The present study was carried out to synthesize fine particles Ni-Zn mixed metal ferrite
material with formula NixZn(1-x)Fe2O4 samples where (X= 0.3, 0.4, 0.5, 0.6 and 0.7) the
samples were prepared using the precursor method.
Samples were obtained at low temperature and were confirmed by different methods of
characterization such as IR spectral analysis, XRD and SEM analysis
The lattice constant for the samples are in the range of 8.4271 A0- 8.3510 A
0 . The values are
in close agreement with the reported values.
The average particles size calculated using Scherer formula was in the range of 19.2 nm to
42.6 nm.
Saturation magnetization (Ms) values of samples are found increase as nickel content
increases up to X=0.5 it is found to decrease thereafter. The hysteresis losses for the samples
are found to be low.
The Curie temperature were found to increase with decrease in non-magnetic Zn content for
the samples.

48
The room temperature dc resistivity is found in the range of 106 to 10
7for the samples of this
method. The values of room temperature resistivity are slightly higher than reported values
for ceramic method.
Thus This simple precursor method, adopting auto combustion for the synthesis, was found to
produce high performance nanoparticle NI – Zn ferrite materials.
4.6.2. Scope for future work
Further study on magnetic permeability, dielectric constant, thermo electric power and other
parameters of ferrites can be carried out. Sintering of the as prepared samples can be done to
study the properties of bulk material.
49
References:
[1] A. R. West, „Solid State Chemistry and its Applications‟, John Wiley and Sons
(2007).
[2] www.google.Ferrites.com
[3] C.N.R. Rao and J. Gopalakrishnan, New Directions in Solid State Chemistry,
Cambridge University Press, (1986).
[4] A.A. Sattar, H.M. El-Sayed, K.M. El-Shokrofy and M.M. El-Tabey J. Applied
Sciences 5 (1) (2005) 162-168.
[5] J. Goldstein, „Scanning Electron Microscopy and X-ray Microanalysis,‟ Kluwer
Academic Plenum Publishers, (2003).
[6] B. D. Cullity, „Elements of X-ray Diffraction,‟ 2nd edition, Addison Wesley (1978).
[7] V. J. Pissurlekar and J. S. Budkuley, Asian J. Chem. 23, 4 (2011), 1677-1679.
[8] A. A. Sattar and K .M. El-Shokrofy J. Phys. IV France 7 Colloq (1997), Cl- 245.
[9] N. Rezlescu, S. Instrate, E. Rezlescu and Luca. J.Phys. Chem. Solid.35,43 (1974).
[10] G. J. Baldha, R.G.Kulkarni, Solid Stat. Commun. 53 (1985)11.
[11] C. Radhakrishnnamurthi, J.Goel. Soc. India 26(9) [1985] 640.
[12] R. V. Uphadhay, G. J. Baldha, R. G. Kulkarni, Mater.Res.Bull.21(1986)1015.
[13] S. D. Likhite, C. Radhakrishnamurthy, Curr. Sci. 35 (1966) 534.
[14] M. I. Klinger and A. A. Samokhvalov, Phys. Status Solidi B 79 (1977) 9.
[15] V. C. Farmer, “The Infrared Spectra of Minerals” ed. V. C. Farmer, Mineralogical
Society, London, (1974) 18.
[16] R. Iyer, R. Desai, R. V. Upadhyay, Bull. Mater. Sci., 322, (2009) pp. 141–147.
[17] S.S. Kumbhar , M.A.Mahadik , V.S.Mohite , K.Y.Rajpure , J.H.Kimb, A.V.Moholkar,
C.H.Bhosale .J. Magne. Magne. Mater., 363, (2014) 114–120.