project risk and cpi - earned schedule risk and cpi.pdfproject risk and cpi why should cpi = 1? walt...
TRANSCRIPT

Project Risk and CPIWhy Should CPI = 1?
Walt LipkePMI - Oklahoma City
+1 405 364 1594
www.earnedschedule.com

EVM Europe 2011Copyright Lipke 20112
Abstract
The expectation when applying Earned ValueManagement is to control performance such thatCPI = 1.00. This presentation examines thatpremise. Two influences are identified: scheduleand risk. Each is shown to have negative impacton CPI. Recognizing how the influence isexhibited, an alternative management approach isproposed.

EVM Europe 2011Copyright Lipke 20113
Overview
Introduction
CPI and Schedule
CPI and Risk
Risk Impact on CPI
Management Application
Forecast and Schedule Application
Summary
Final Comment

EVM Europe 2011Copyright Lipke 20114
Introduction
Should we rightfully expect CPI = 1.00?
To refresh, CPI is the cost performanceefficiency, CPI = EV / AC
Project managers desire to guide the costperformance such that CPI = 1.00
Those who receive and analyze project statusreports examine with reference to CPI = 1.00
When the CPI value is less than a threshold(CPIT = 0.85) an explanation and a plannedaction for performance improvement isexpected

EVM Europe 2011Copyright Lipke 20115
Introduction
That’s today’s practice of EVM
Nevertheless …
Is CPI = 1.00 a reasonable expectation?
Commonly, when CPI CPIT for an extendedtime, the PM requests approval to re-baseline
By establishing a revised baseline, the pressureto improve is relieved …and, momentarily,status reports become acceptable

EVM Europe 2011Copyright Lipke 20116
Introduction
This practice diminishes the managementeffectiveness of EVM – for the current projectand for future planning and evaluation ofprocess improvement initiatives
If EVM practitioners could view CPI with anexpectation of something other than the valueof 1.00 – it may be possible to minimize revisingproject baselines and preserve project history

EVM Europe 2011Copyright Lipke 20117
CPI and Schedule
For small projects that may require differentskills there may be gaps for certain skills
For example, the project requires 12 engineers,but for a two week period only 10 have plannedwork.
Shouldn’t this affect CPI?
Unless the engineers are pooled with anotherproject, they will accrue cost and not have PVavailable to be earned

EVM Europe 2011Copyright Lipke 20118
CPI and Schedule
From the outset, we know the resource cost forthe project (ACR) is greater than the budgetedcost, BAC. Thus the expectation for costefficiency is
CPIS = BAC / ACR 1.00
In turn, this affects management reserve
MRS = ACR – BAC
During planning, CPIS could be used as ameasure of scheduling effectiveness. Skillshaving time gaps could be evaluated andminimized so as to bring CPIS closer to 1.00
EVM Europe 2011Copyright Lipke 20119
CPI and Risk
Over the years there have been severalinitiatives and efforts to couple EVM and RiskManagement (RM) In 2005, NDIA survey results indicated a strong desire
within the EVM community to integrate the twomethodologies
At the 2006 IPMC, Patti Tisone presented theNorthrop Grumman process
In a 2004 paper, David Hilson developed a methodconnecting EVM performance to risk managementreactions
Lauren Bone, at the 2007 IPMC, described anapproach of interfacing EVM and RM

EVM Europe 2011Copyright Lipke 201110
CPI and Risk
The risk evaluation for the project shoulddirectly relate to the creation of the EVMManagement Reserve (MR). MR is intended to fund the effort needed to address
the impact of a risk, should it occur
Although the other references cited imply thisconnection, only the presentation by Boneexplicitly makes the relationship The Bone method is a probabilistic approach which
produces the PMB, MR, and schedule reserve

EVM Europe 2011Copyright Lipke 201111
CPI and Risk
From the Bone presentation, potential risks arecategorized into – known & unknown
For the known risks, plans are created and putinto action upon risk occurrence The risk plan is integrated into the PMB, as needed,
removing funding from MR
BAC and the project duration is increased
The risk action can then be tracked and managedusing EVM methods …integration of EVM & RM isachieved

EVM Europe 2011Copyright Lipke 201112
CPI and Risk
The handling of the unknown risks is not so welldefined – the presumption is the same methodis used …with the exception that the planningneeded for the mitigation action is included aspart of the action
The Bone method is very good …however,there may be circumstances for whichmanagement may not choose to integrate therisk action into the PMB …it may be seen asnot worth the effort

EVM Europe 2011Copyright Lipke 201113
CPI and Risk
When the risk action is not integrated into thePMB, costs are accrued for the project but noEV is accrued Risk cost must appear in the project …somewhere
MR is used to fund the risk mitigation action …wheredid it go? …consumed by inefficiency
CPI should be expected to decrease when therisk action plan is not integrated into PMB
In this instance, the practice of using the CPIthreshold may cause unnecessarymanagement actions and project re-baselines

EVM Europe 2011Copyright Lipke 201114
Risk Impact on CPI
The Bone presentation indicated the distributionof possible project outcomes as right-skewed The distribution is caused by the uncertainty of the
occurrence of the risks …and is consistent with myprevious research
My hypothesis is the risk impact distribution is right-skewed, as well – and has relationship with theconcentration of dependent activities (the number ofdependent activities is, itself, right-skewed withrespect to percent complete)
EVM Europe 2011Copyright Lipke 201115
Risk Impact on CPI
We have established As risks occur, MR is consumed
When the mitigation action is not integrated with thePMB, CPI suffers
The pieces are all connected
Risk planning MR
MR Risk mitigation
Percent complete Risk occurrence
Risk occurrence Cost performance
EVM Europe 2011Copyright Lipke 201116
Risk Impact on CPI
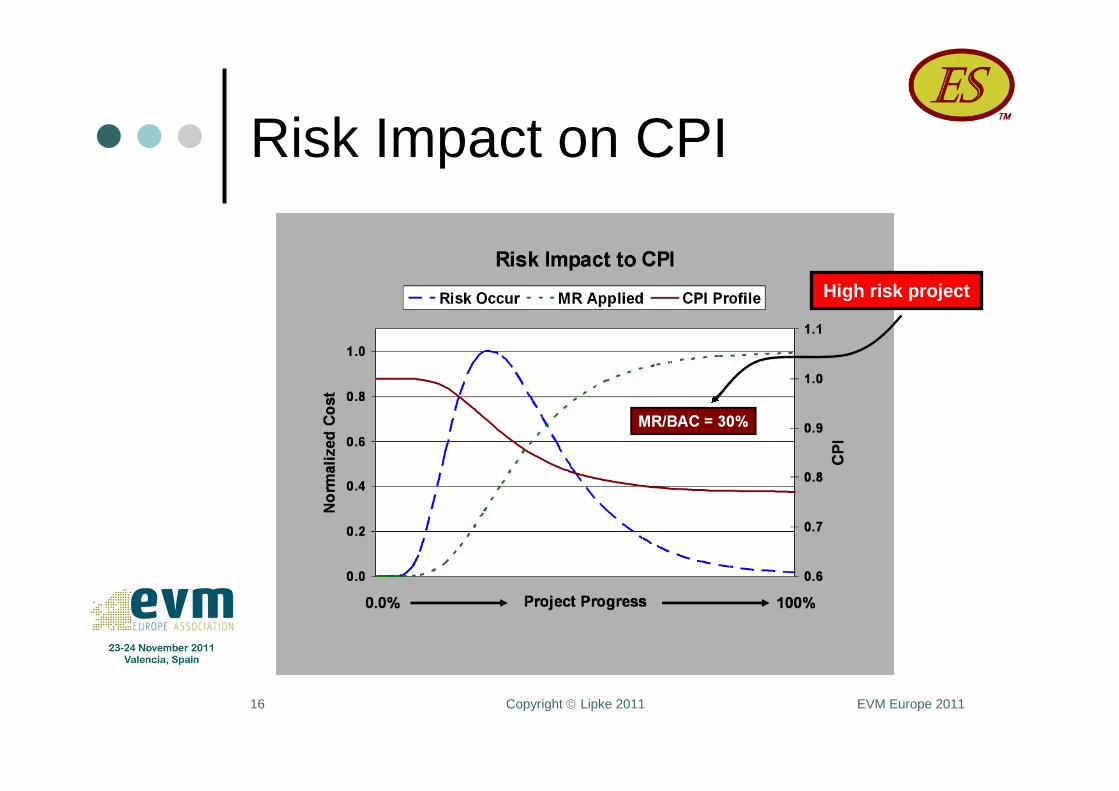
High risk project

EVM Europe 2011Copyright Lipke 201117
Risk Impact on CPI
Risk Occur and MRApplied are normalizedrepresentations
Risk Occur increases forthe first third and thendecreases
If well-planned, MR willbe equal to the expectedimpact of risk
Then, MR becomes theintegration of the riskoccurrence impact

EVM Europe 2011Copyright Lipke 201118
Risk Impact on CPI
On the figure, CPI is shown decreasing withproject progress – beginning at 1.00 and endingat 0.77
Risk mitigation is not integrated into the PMB…and, thus, there is no PV to earn
For this situation
CPI = EV / (ACP + ACR) ACP = actual cost associated with tasks in the PMB
ACR = cost to mitigate risk not integrated into PMB

EVM Europe 2011Copyright Lipke 201119
Risk Impact on CPI
If MR is utilized as expected, ACR will follow thegraph of MR Applied
For perfect cost efficiency, CPI is equal to
CPI = EV / (EV + MRA) MRA = MR Applied ( function of project progress)
Thus, for perfect cost efficiency, it is obviousthat CPI must decrease as risks occur

EVM Europe 2011Copyright Lipke 201120
Risk Impact on CPI
The equation yields the value 0.77 shown onthe graph
CPI = EV / (EV + MRA)
= BAC / (BAC + 0.3 BAC)
= 1 / 1.30 = 0.77
The example demonstrates that as project riskbecomes high the CPI can be expected to havea final value much lower than 1.00

EVM Europe 2011Copyright Lipke 201121
Management Application
In today’s practice of EVM, the CPI threshold does notconsider project risk Whether high or low risk, CPIT = 0.90
PMs are compelled to react to breach of threshold
For the graph, CPI falls below 0.90 early …and notunderstanding …PM reacts unnecessarily

EVM Europe 2011Copyright Lipke 201122
Management Application
Because risk events continue to occur, the mitigationactions taken don’t halt the decline of CPI
As conditions worsen, to avert criticism …a revisedbaseline is created …consuming time and diverting effortfrom the project

EVM Europe 2011Copyright Lipke 201123
Management Application
The graph is the outcome of the project planningconsidering the anticipation of risk
The CPI as a function of project progress could be usedfor comparison to actual value …rather than the thresholdcomparison presently used

EVM Europe 2011Copyright Lipke 201124
Management Application
The alternative method proposed should
Improve management information and decision making
Prevent pointless effort to improve cost efficiency
Avoid cost and time expended for project re-baselining
Improve project histories

EVM Europe 2011Copyright Lipke 201125
Forecast and ScheduleApplication
An interesting point – cost forecasting is notdependent upon integrating risk actions into thePMB
To illustrate – MR = 0.3 BAC and CPIfinal = 0.77
When risk is integrated, the budget = 1.3 BAC Forecast = Project Budget / CPI
= 1.3 BAC / 1.00 = 1.3 BAC
When risk not integrated, budget = BAC Forecast = BAC / CPI
= BAC / 0.77 = 1.3 BAC
EVM Europe 2011Copyright Lipke 201126
Forecast and ScheduleApplication
Presentation has been focused on costperformance
It is reasonable to think that scheduleperformance using SPI(t) from EarnedSchedule will behave analogously to thedescription for CPI
Thus, the method presented for cost may beapplied to schedule, as well

EVM Europe 2011Copyright Lipke 201127
Summary
The idea of CPI = 1.00 being a constant point ofreference is questioned
It was shown …when resources are not fullyutilized in the plan, there is cost without EV
Relationship was described between riskoccurrence, MR consumed, and CPI as afunction of project progress
A method of managing cost performanceutilizing the expectation of worsening CPI isproposed

EVM Europe 2011Copyright Lipke 201128
Final Comment
The idea that CPI is expected to worsen duringproject execution is unsettling
It is contrary to the application concept of EVM
The underlying thinking is when inefficientperformance is reacted to early in theexecution, the possibility of a successful projectis enhanced
EVM Europe 2011Copyright Lipke 201129
Final Comment
However, studies have shown that decreasingCPI is very “normal”
Dr. Christensen & S. Heise noted in a studythat, “…the cumulative CPI …usually declinedas the contract proceeded to completion”
A recent study by USAF Major Jack tested forimprovement in CPI after a project re-baseline.His finding was that CPI tended not to improve:“…we find there is no statistically significantchange in cumulative CPI slope (negative) afteran OTB intervention”

EVM Europe 2011Copyright Lipke 201130
Final Comment
The two studies give credence to the idea: Risknegatively impacts CPI throughout the project
With acceptance of the connection between riskand CPI, the application of the CPI comparisonmethod proposed can be seriously considered
Research is needed to explore, prototype, andvalidate the idea presented
Those having good EVM data are challenged topursue this research topic
EVM Europe 2011Copyright Lipke 201131
References
“Interfacing Earned Value & Risk Management,” InternationalIntegrated Program Management Conference, November 2007.[L Bone, V Jonas]
“Cost Performance Index Stability,” National ContractManagement Journal, 1993 (Vol 25): 7-15 [D Christensen, SHeise]
“Earned Value Management and Risk Management: A PracticalSynergy,” PMI Global Congress Proceedings, 2004. [DHillson]
Project Management Using Earned Value, Orange, CA:Humphreys & Associates, 2002. [G Humphreys]
“Contract Over Target Baseline (OTB) Effect On Earned ValueManagement’s Cost Performance Index (CPI), Air ForceInstitute of Technology Thesis, June 2010 [Major D Jack]
EVM Europe 2011Copyright Lipke 201132
References
Earned Schedule, Raleigh, NC: Lulu Publishing 2009: 144-150[W Lipke]
“A Study of the Normality of the Earned Value Indicators,” TheMeasurable News, December 2002: 1-16. [W Lipke]
“Integrating Risk Management with Earned ValueManagement,” National Defense Industrial Association-ProgramManagement Systems Committee, January 2005.
Practice Standard for Earned Value Management, NewtownSquare, PA: PMI, 2005.
“Integration of Risk Management and Earned ValueManagement,” International Integrated Program ManagementConference, November 2006. [P Tisone]