project safe haven - washington€¦ · project safe haven: pacific county v research team college...
TRANSCRIPT
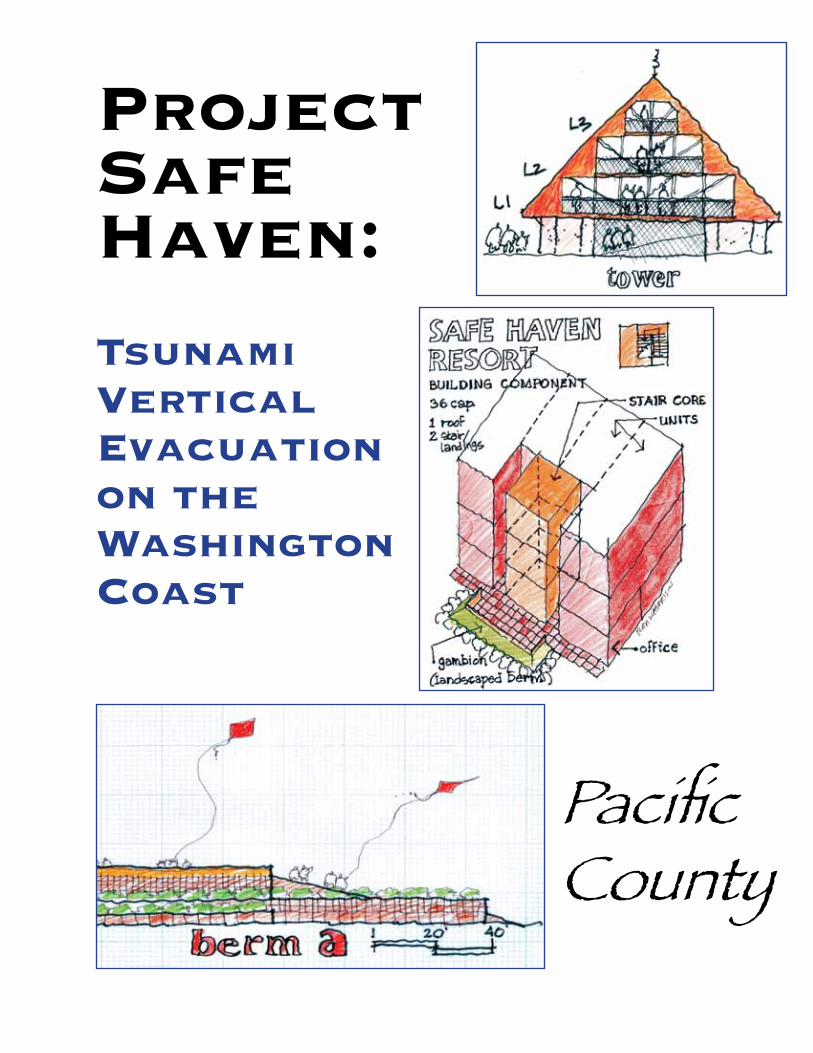
Project Safe Haven:
Pacific County
TsunamiVertical Evacuation on the Washington Coast

ii Project Safe Haven: Pacific County
Project Safe Haven: Pacific County iii
Funding for Project Safe Haven provided by the National Tsunami Hazard Mitigation Program

iv Project Safe Haven: Pacific County
Project Safe Haven: Pacific County v
Research Team
College of Built EnvironmentsDepartment Of Urban Design & PlanningOversight team: institute fOr hazards mitigatiOn Planning and research
Bob Freitag (Principal Investigator) Jeana Wiser (Project Lead) Amanda Engstfeld Katherine Killebrew Christopher Scott
urban design team
Ron Kasprisin (Design Lead) Tricia DeMarco Josh Vitulli
Department of Construction ManagementcOst estimating team
Omar El-Anwar (Engineering Lead) Kirk HochstatterWashington State Emergency Management Division (EMD)John Schelling (State Lead) Dave Nelson Jamie Mooney Brynne WalkerWashington State Department Of Natural Resources (DNR)Tim Walsh (Geology Lead)
Thank you to all the members of Pacific County communities who helped through their participation in meetings, comments, and walking exercises.
Acknowledgments
The 2010-2011 Pacific County Project Safe Haven team was led by the College of Built Environments, University of Washington and the Washington Emergency Management Division
Federal Emergency Management Agency, Region X Tamra BiascoUnited States Geological Survey (USGS)Nathan WoodNational Oceanic And Atmospheric Association (NOAA)Frank González Tyree Wilde
Degenkolb EngineersCale Ash, PE, SE (Technical Advisor)
EditorJulie Clark
In Collaboration WithPacific County Emergency Management Agency (PCEMA)Stephanie Fritts Denise Rowlett
Shoalwater Bay TribeChairwoman Charlene Nelson Lee Shipman
City Of Long BeachGene Miles

vi Project Safe Haven: Pacific County
Project Safe Haven: Pacific County vii
Table of Contents1. Executive Summary . . . . . . . . . . . . . . . . . . . . . . . . . . . . . . . . . . . . . . . . . . . . . . . . 1
2. Project Safe Haven: Pacific County . . . . . . . . . . . . . . . . . . . . . . . . . . . . . . . . . . 3
3. Background . . . . . . . . . . . . . . . . . . . . . . . . . . . . . . . . . . . . . . . . . . . . . . . . . . . . . . 5
4. Methodology and Results . . . . . . . . . . . . . . . . . . . . . . . . . . . . . . . . . . . . . . . . . 13
5. Conclusions and Next Steps . . . . . . . . . . . . . . . . . . . . . . . . . . . . . . . . . . . . . . . 57
Appendix A: Community Context Maps . . . . . . . . . . . . . . . . . . . . . . . . . . . . . . . . . . 59
Appendix B: SWOT Analysis Description. . . . . . . . . . . . . . . . . . . . . . . . . . . . . . . . 61
Appendix C: Long Beach SWOT Analysis Comments . . . . . . . . . . . . . . . . . . . . . . . 62
Appendix D: Project Assumptions . . . . . . . . . . . . . . . . . . . . . . . . . . . . . . . . . . . . . 63
Appendix E: Lines Of Defense . . . . . . . . . . . . . . . . . . . . . . . . . . . . . . . . . . . . . . . . 65
Appendix F: Ocean Park Area Maps . . . . . . . . . . . . . . . . . . . . . . . . . . . . . . . . . . . . 66
Appendix G: Ocean Park SWOT Analysis Comments . . . . . . . . . . . . . . . . . . . . . . . 68
Appendix H: Chinook Observer Article . . . . . . . . . . . . . . . . . . . . . . . . . . . . . . . . . 69
Appendix I: Site Analysis. . . . . . . . . . . . . . . . . . . . . . . . . . . . . . . . . . . . . . . . . . . . 71
Appendix J: Walking Volunteer Results . . . . . . . . . . . . . . . . . . . . . . . . . . . . . . . 76
Appendix K: Survey Responses. . . . . . . . . . . . . . . . . . . . . . . . . . . . . . . . . . . . . . . . 78
Appendix L: Countywide Meeting Voting Results . . . . . . . . . . . . . . . . . . . . . . . . 80
Appendix M: Summary of Cost Estimates . . . . . . . . . . . . . . . . . . . . . . . . . . . . . . . . 81
Appendix N: Structure calculation formula tables . . . . . . . . . . . . . . . . . . . . . . 83
Appendix 0: Project Safe Haven Submitted Biographies . . . . . . . . . . . . . . . . . . . 85
Appendix P: References . . . . . . . . . . . . . . . . . . . . . . . . . . . . . . . . . . . . . . . . . . . . . 89
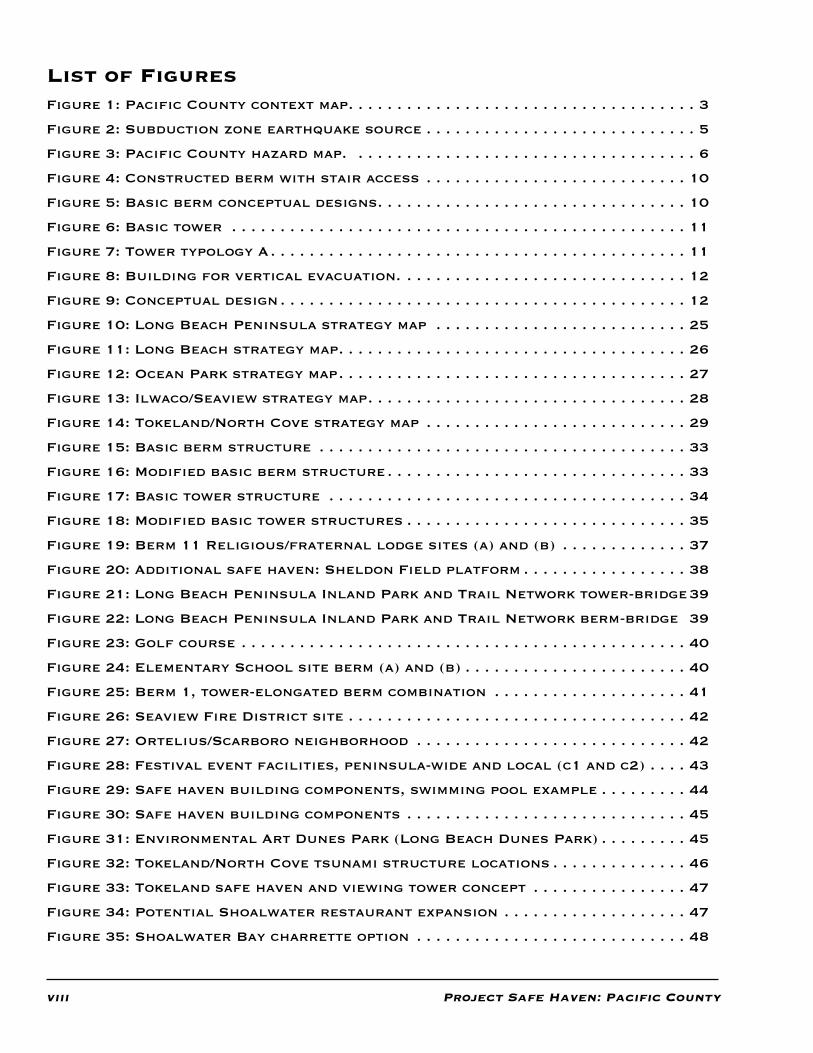
viii Project Safe Haven: Pacific County
List of FiguresFigure 1: Pacific County context map. . . . . . . . . . . . . . . . . . . . . . . . . . . . . . . . . . . . 3
Figure 2: Subduction zone earthquake source . . . . . . . . . . . . . . . . . . . . . . . . . . . . 5
Figure 3: Pacific County hazard map. . . . . . . . . . . . . . . . . . . . . . . . . . . . . . . . . . . . 6
Figure 4: Constructed berm with stair access . . . . . . . . . . . . . . . . . . . . . . . . . . . 10
Figure 5: Basic berm conceptual designs. . . . . . . . . . . . . . . . . . . . . . . . . . . . . . . . 10
Figure 6: Basic tower . . . . . . . . . . . . . . . . . . . . . . . . . . . . . . . . . . . . . . . . . . . . . . . 11
Figure 7: Tower typology A. . . . . . . . . . . . . . . . . . . . . . . . . . . . . . . . . . . . . . . . . . . 11
Figure 8: Building for vertical evacuation. . . . . . . . . . . . . . . . . . . . . . . . . . . . . . 12
Figure 9: Conceptual design . . . . . . . . . . . . . . . . . . . . . . . . . . . . . . . . . . . . . . . . . . 12
Figure 10: Long Beach Peninsula strategy map . . . . . . . . . . . . . . . . . . . . . . . . . . 25
Figure 11: Long Beach strategy map. . . . . . . . . . . . . . . . . . . . . . . . . . . . . . . . . . . . 26
Figure 12: Ocean Park strategy map. . . . . . . . . . . . . . . . . . . . . . . . . . . . . . . . . . . . 27
Figure 13: Ilwaco/Seaview strategy map. . . . . . . . . . . . . . . . . . . . . . . . . . . . . . . . . 28
Figure 14: Tokeland/North Cove strategy map . . . . . . . . . . . . . . . . . . . . . . . . . . . 29
Figure 15: Basic berm structure . . . . . . . . . . . . . . . . . . . . . . . . . . . . . . . . . . . . . . 33
Figure 16: Modified basic berm structure. . . . . . . . . . . . . . . . . . . . . . . . . . . . . . . 33
Figure 17: Basic tower structure . . . . . . . . . . . . . . . . . . . . . . . . . . . . . . . . . . . . . 34
Figure 18: Modified basic tower structures . . . . . . . . . . . . . . . . . . . . . . . . . . . . . 35
Figure 19: Berm 11 Religious/fraternal lodge sites (a) and (b) . . . . . . . . . . . . . 37
Figure 20: Additional safe haven: Sheldon Field platform . . . . . . . . . . . . . . . . . 38
Figure 21: Long Beach Peninsula Inland Park and Trail Network tower-bridge 39
Figure 22: Long Beach Peninsula Inland Park and Trail Network berm-bridge 39
Figure 23: Golf course . . . . . . . . . . . . . . . . . . . . . . . . . . . . . . . . . . . . . . . . . . . . . . 40
Figure 24: Elementary School site berm (a) and (b) . . . . . . . . . . . . . . . . . . . . . . . 40
Figure 25: Berm 1, tower-elongated berm combination . . . . . . . . . . . . . . . . . . . . 41
Figure 26: Seaview Fire District site . . . . . . . . . . . . . . . . . . . . . . . . . . . . . . . . . . . 42
Figure 27: Ortelius/Scarboro neighborhood . . . . . . . . . . . . . . . . . . . . . . . . . . . . 42
Figure 28: Festival event facilities, peninsula-wide and local (c1 and c2) . . . . 43
Figure 29: Safe haven building components, swimming pool example . . . . . . . . . 44
Figure 30: Safe haven building components . . . . . . . . . . . . . . . . . . . . . . . . . . . . . 45
Figure 31: Environmental Art Dunes Park (Long Beach Dunes Park) . . . . . . . . . 45
Figure 32: Tokeland/North Cove tsunami structure locations . . . . . . . . . . . . . . 46
Figure 33: Tokeland safe haven and viewing tower concept . . . . . . . . . . . . . . . . 47
Figure 34: Potential Shoalwater restaurant expansion . . . . . . . . . . . . . . . . . . . 47
Figure 35: Shoalwater Bay charrette option . . . . . . . . . . . . . . . . . . . . . . . . . . . . 48

Project Safe Haven: Pacific County ix
Figure 36: Option one . . . . . . . . . . . . . . . . . . . . . . . . . . . . . . . . . . . . . . . . . . . . . . . 49
Figure 37: Option two . . . . . . . . . . . . . . . . . . . . . . . . . . . . . . . . . . . . . . . . . . . . . . . 49
Figure 38: Tokeland Road and Evergreen Street Park . . . . . . . . . . . . . . . . . . . . . 50
Figure 39: Nelson Crab expansion facilities. . . . . . . . . . . . . . . . . . . . . . . . . . . . . 50
Figure 40: Tokeland Market Square Option One . . . . . . . . . . . . . . . . . . . . . . . . . . 52
Figure 41: Tokeland Market Square Option Two . . . . . . . . . . . . . . . . . . . . . . . . . . 53
Figure 42: Tokeland Market Square Option Three . . . . . . . . . . . . . . . . . . . . . . . . 53
Figure 43: Tokeland Market Square axonometric diagram . . . . . . . . . . . . . . . . . . 53
Figure 44: Coastal Walkway Arts and Crafts Village viewing tower. . . . . . . . . 55
Figure 45: Additional tower explorations. . . . . . . . . . . . . . . . . . . . . . . . . . . . . . . 56
Figure 46: Long Beach community context map . . . . . . . . . . . . . . . . . . . . . . . . . . . 59
Figure 47: Ilwaco/Seaview community context map . . . . . . . . . . . . . . . . . . . . . . . . 59
Figure 48: Ocean Park community context map . . . . . . . . . . . . . . . . . . . . . . . . . . . 60
Figure 49: Tokeland/North Cove community context map . . . . . . . . . . . . . . . . . . . 60
Figure 50: Natural lines of defense in Pacific County . . . . . . . . . . . . . . . . . . . . 65
Figure 51: Ocean Park area overview. . . . . . . . . . . . . . . . . . . . . . . . . . . . . . . . . . . 66
Figure 52: Ocean Park area A . . . . . . . . . . . . . . . . . . . . . . . . . . . . . . . . . . . . . . . . . 66
Figure 53: Ocean Park area B . . . . . . . . . . . . . . . . . . . . . . . . . . . . . . . . . . . . . . . . . 67
Figure 54: Ocean Park areas CD . . . . . . . . . . . . . . . . . . . . . . . . . . . . . . . . . . . . . . . 67
Figure 55: Ocean Park area E . . . . . . . . . . . . . . . . . . . . . . . . . . . . . . . . . . . . . . . . . 67
Figure 56: Site 6, Ocean Park . . . . . . . . . . . . . . . . . . . . . . . . . . . . . . . . . . . . . . . . . 72
Figure 57: Site 8, Surfside Estates . . . . . . . . . . . . . . . . . . . . . . . . . . . . . . . . . . . . 72
Figure 58: Site 9, Surfside Estates . . . . . . . . . . . . . . . . . . . . . . . . . . . . . . . . . . . . 72
Figure 59: Site 10, Surfside Estates . . . . . . . . . . . . . . . . . . . . . . . . . . . . . . . . . . . 72
Figure 60: Site 2, Long Beach . . . . . . . . . . . . . . . . . . . . . . . . . . . . . . . . . . . . . . . . . 73
Figure 61: Site 3, Long Beach . . . . . . . . . . . . . . . . . . . . . . . . . . . . . . . . . . . . . . . . . 73
Figure 62: Site 1, Ilwaco . . . . . . . . . . . . . . . . . . . . . . . . . . . . . . . . . . . . . . . . . . . . . 74
Figure 63: Site 3, Ilwaco . . . . . . . . . . . . . . . . . . . . . . . . . . . . . . . . . . . . . . . . . . . . . 74
Figure 64: Site 1, Tokeland . . . . . . . . . . . . . . . . . . . . . . . . . . . . . . . . . . . . . . . . . . . 75
Figure 65: Site 3, Tokeland . . . . . . . . . . . . . . . . . . . . . . . . . . . . . . . . . . . . . . . . . . . 75
Figure 66: Site 4, Tokeland . . . . . . . . . . . . . . . . . . . . . . . . . . . . . . . . . . . . . . . . . . . 75
Figure 67: Site 5, Tokeland . . . . . . . . . . . . . . . . . . . . . . . . . . . . . . . . . . . . . . . . . . . 75
Figure 68: Site 6, Tokeland . . . . . . . . . . . . . . . . . . . . . . . . . . . . . . . . . . . . . . . . . . . 75
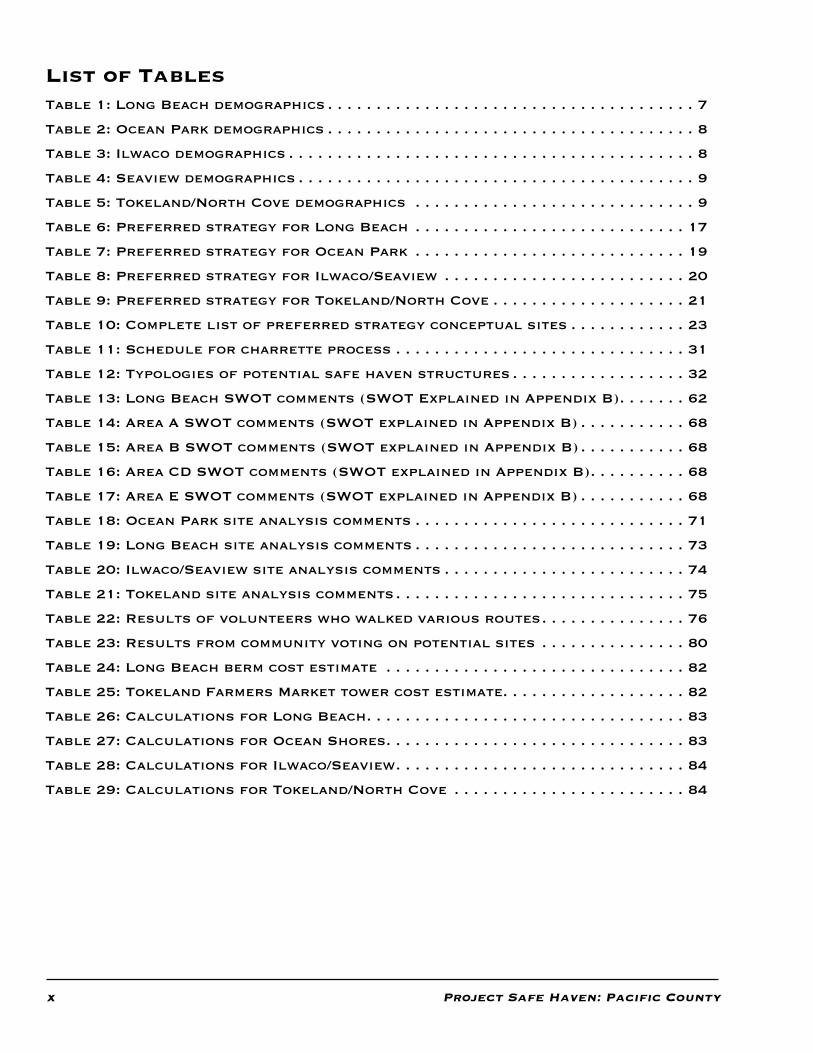
x Project Safe Haven: Pacific County
List of TablesTable 1: Long Beach demographics . . . . . . . . . . . . . . . . . . . . . . . . . . . . . . . . . . . . . . 7
Table 2: Ocean Park demographics . . . . . . . . . . . . . . . . . . . . . . . . . . . . . . . . . . . . . . 8
Table 3: Ilwaco demographics . . . . . . . . . . . . . . . . . . . . . . . . . . . . . . . . . . . . . . . . . . 8
Table 4: Seaview demographics . . . . . . . . . . . . . . . . . . . . . . . . . . . . . . . . . . . . . . . . . 9
Table 5: Tokeland/North Cove demographics . . . . . . . . . . . . . . . . . . . . . . . . . . . . . 9
Table 6: Preferred strategy for Long Beach . . . . . . . . . . . . . . . . . . . . . . . . . . . . 17
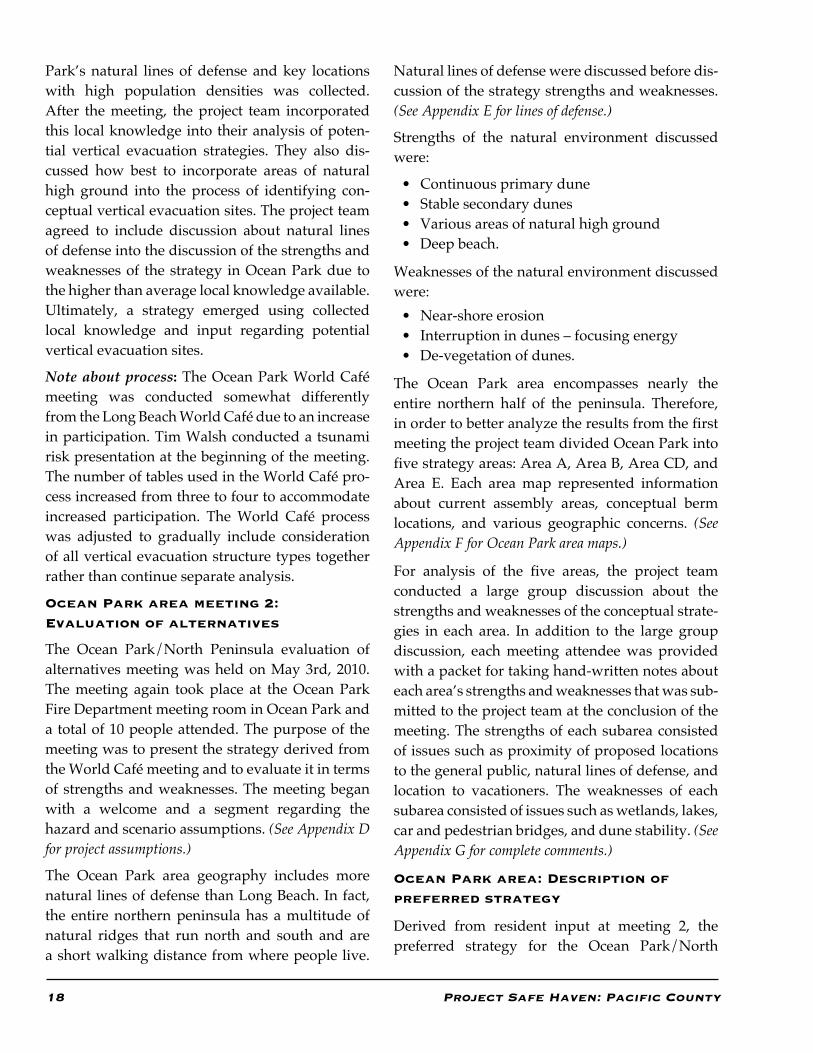
Table 7: Preferred strategy for Ocean Park . . . . . . . . . . . . . . . . . . . . . . . . . . . . 19
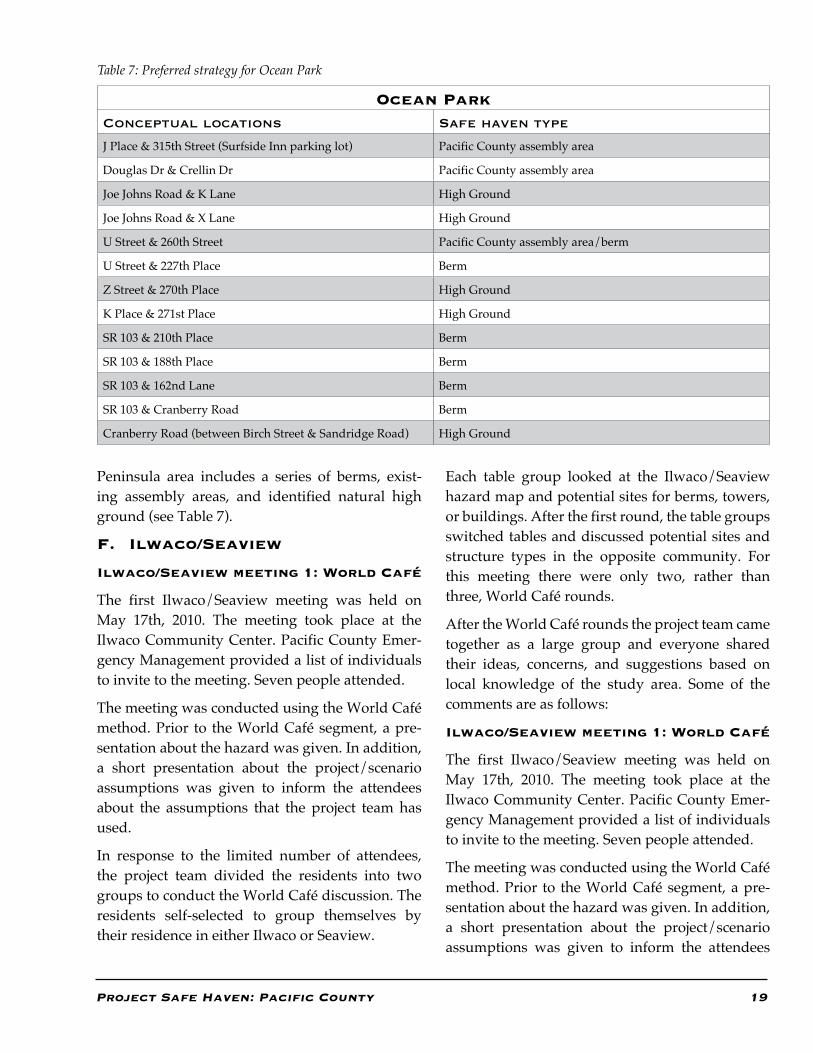
Table 8: Preferred strategy for Ilwaco/Seaview . . . . . . . . . . . . . . . . . . . . . . . . . 20
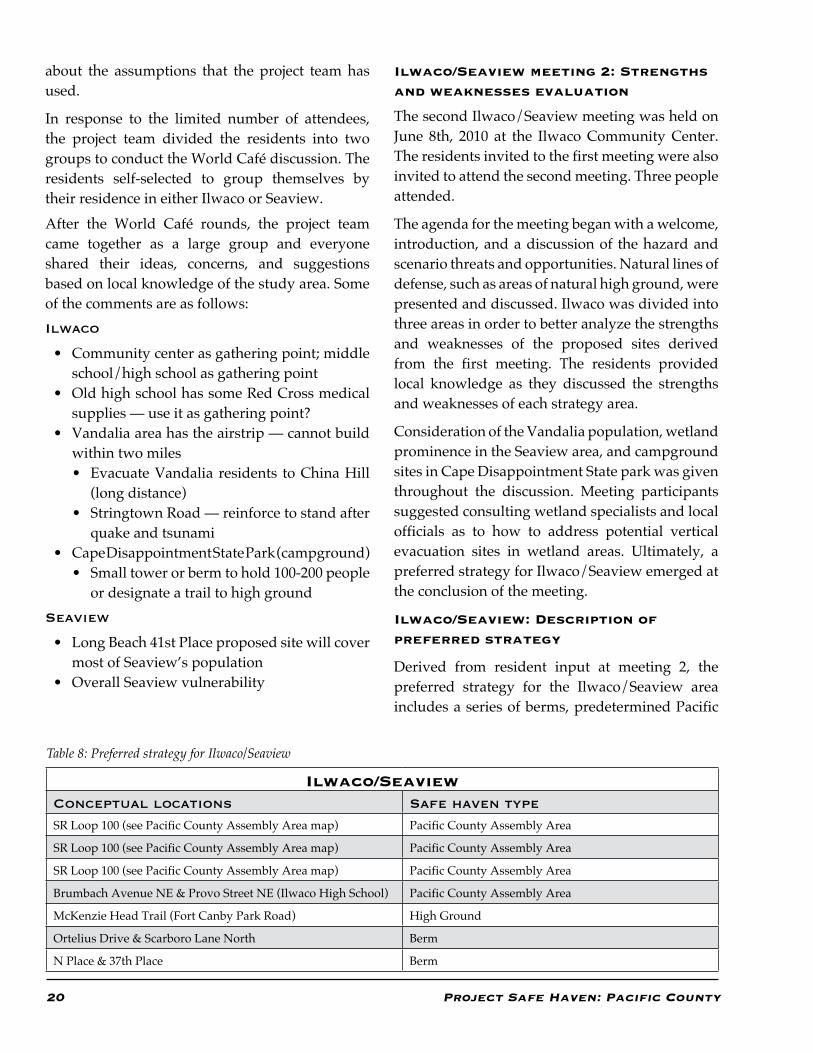
Table 9: Preferred strategy for Tokeland/North Cove . . . . . . . . . . . . . . . . . . . . 21
Table 10: Complete list of preferred strategy conceptual sites . . . . . . . . . . . . 23
Table 11: Schedule for charrette process . . . . . . . . . . . . . . . . . . . . . . . . . . . . . . 31
Table 12: Typologies of potential safe haven structures . . . . . . . . . . . . . . . . . . 32
Table 13: Long Beach SWOT comments (SWOT Explained in Appendix B). . . . . . . 62
Table 14: Area A SWOT comments (SWOT explained in Appendix B) . . . . . . . . . . . 68
Table 15: Area B SWOT comments (SWOT explained in Appendix B) . . . . . . . . . . . 68
Table 16: Area CD SWOT comments (SWOT explained in Appendix B) . . . . . . . . . . 68
Table 17: Area E SWOT comments (SWOT explained in Appendix B) . . . . . . . . . . . 68
Table 18: Ocean Park site analysis comments . . . . . . . . . . . . . . . . . . . . . . . . . . . . 71
Table 19: Long Beach site analysis comments . . . . . . . . . . . . . . . . . . . . . . . . . . . . 73
Table 20: Ilwaco/Seaview site analysis comments . . . . . . . . . . . . . . . . . . . . . . . . . 74
Table 21: Tokeland site analysis comments . . . . . . . . . . . . . . . . . . . . . . . . . . . . . . 75
Table 22: Results of volunteers who walked various routes. . . . . . . . . . . . . . . 76
Table 23: Results from community voting on potential sites . . . . . . . . . . . . . . . 80
Table 24: Long Beach berm cost estimate . . . . . . . . . . . . . . . . . . . . . . . . . . . . . . . 82
Table 25: Tokeland Farmers Market tower cost estimate. . . . . . . . . . . . . . . . . . . 82
Table 26: Calculations for Long Beach. . . . . . . . . . . . . . . . . . . . . . . . . . . . . . . . . 83
Table 27: Calculations for Ocean Shores. . . . . . . . . . . . . . . . . . . . . . . . . . . . . . . 83
Table 28: Calculations for Ilwaco/Seaview . . . . . . . . . . . . . . . . . . . . . . . . . . . . . . 84
Table 29: Calculations for Tokeland/North Cove . . . . . . . . . . . . . . . . . . . . . . . . 84
Project Safe Haven: Pacific County 1
1. Executive SummaryA magnitude 9+ Cascadia earthquake and tsunami — last experienced in 1700 AD — will endanger the low-lying communities along the Washington coast. The Long Beach and Tokeland peninsulas’ vulnerability to a tsunami combined with the diffi-culty of typical horizontal evacuation spurred inter-est in alternative evacuation methods. Students from the University of Washington, with support from county and state emergency management officials, created a community-driven process to identify potential locations for vertical evacuation. This project addressed four coastal communities in Pacific County: Long Beach, Ilwaco/Seaview, Ocean Park, and Tokeland/North Cove. In the future, the project team will work with additional Washington coastal counties.
This report outlines the process, strategies, and scientific data used by the team for the project.
Project Safe Haven, a grassroots process to develop ideas and strategies about vertical evacuation, is the first of its kind. The project team adopted a six-phase methodology to accomplish its task.
1. A Steering Committee composed of local and state officials, emergency managers, and sci-entists was created to guide the project.
2. A team site visit to each community helped to identify opportunities for, and barriers to, potential vertical evacuation projects.
3. Community ideas and comments were solic-ited at the first public meeting, using World Café methodology. Community members were encouraged to discuss the possible strengths and weaknesses of the three vertical evacuation options: berms, towers, and build-ings. Meeting participants used interactive hazard maps to discuss conceptual locations for the structures, and the pros and cons of each structure type.
4. The project team translated community members’ ideas into three alternatives. At a second meeting, these were presented back to the participants, using maps and text. The
strengths and weaknesses of each alternative were discussed. Ultimately, a preferred strat-egy emerged for each community.
5. Once each community developed a preferred strategy, the fifth phase was to conduct two communitywide meetings, one in Tokeland and one in Seaview, to present the final strat-egy. Each meeting was widely publicized and open to the public. The meetings allowed community members one more chance to reas-sess the final strategies. At each meeting, all four local strategies were presented to allow review for comprehensiveness, redundancy, and coordination of efforts.
6. A design team was introduced to the local communities to conduct intensive design charrettes to identify opportunities presented by the proposed vertical evacuation strategy. Identification of specific structure locations and how the structures will best fit into the contexts of the communities were discussed. Potential day-to-day uses for each vertical evacuation structure at each proposed site were incorporated into the overall vertical evacuation strategy and presented back to the community as hand-drawn conceptual designs.
7. The final version of the Pacific County pre-ferred strategy includes:
• 13 berms• 5 towers • 2 parking garages • 6 identified areas of high ground • 10 existing Pacific County assembly areas.
8. Construction costs for 20 facilities offering tsu-nami safe havens for 6,300 residents through the construction of 13 berms, 5 towers, and 2 buildings could be in the neighborhood of $11 million.

2 Project Safe Haven: Pacific County
Project Safe Haven: Pacific County 3
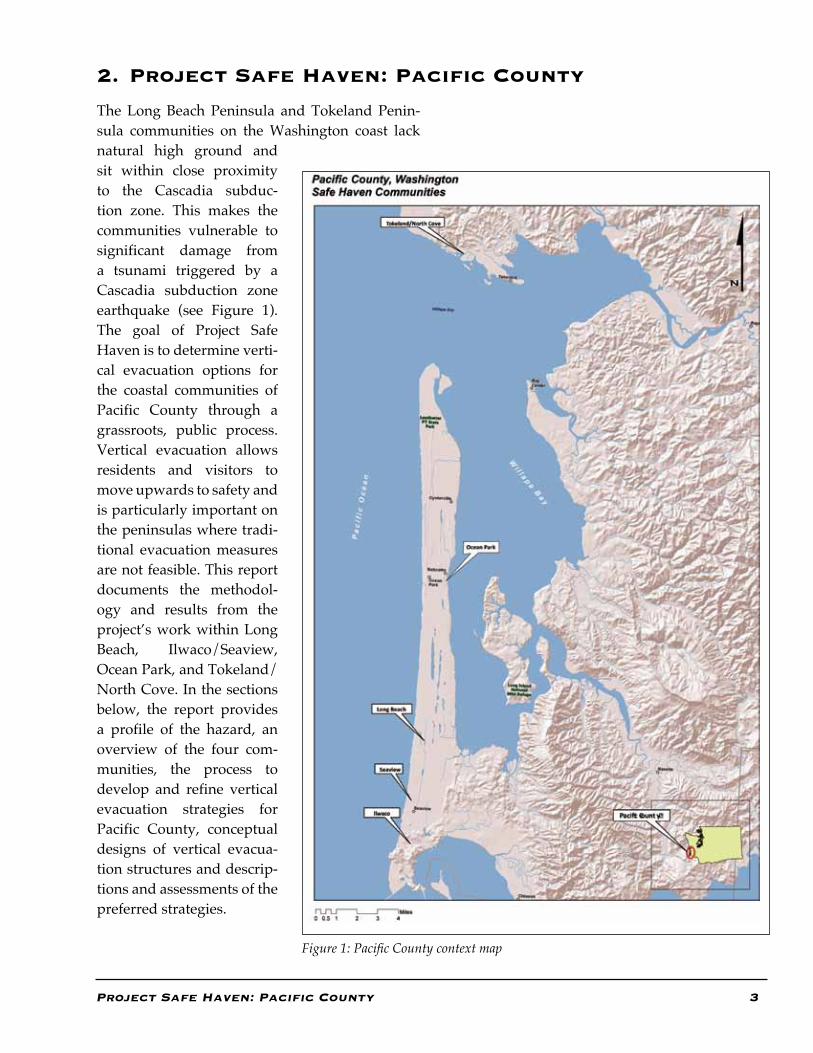
The Long Beach Peninsula and Tokeland Penin-sula communities on the Washington coast lack natural high ground and sit within close proximity to the Cascadia subduc-tion zone. This makes the communities vulnerable to significant damage from a tsunami triggered by a Cascadia subduction zone earthquake (see Figure 1). The goal of Project Safe Haven is to determine verti-cal evacuation options for the coastal communities of Pacific County through a grassroots, public process. Vertical evacuation allows residents and visitors to move upwards to safety and is particularly important on the peninsulas where tradi-tional evacuation measures are not feasible. This report documents the methodol-ogy and results from the project’s work within Long Beach, Ilwaco/Seaview, Ocean Park, and Tokeland/North Cove. In the sections below, the report provides a profile of the hazard, an overview of the four com-munities, the process to develop and refine vertical evacuation strategies for Pacific County, conceptual designs of vertical evacua-tion structures and descrip-tions and assessments of the preferred strategies.
Figure 1: Pacific County context map
2. Project Safe Haven: Pacific County

4 Project Safe Haven: Pacific County
Project Safe Haven: Pacific County 5
A. Hazard profile and modeled scenario
A tsunami is a series of sea waves, commonly caused by an undersea earthquake. Pacific County is vulnerable to two types of tsunamis:
• Those created by a distant seismic event (such as an earthquake near Japan).
• Those created by a local, offshore earthquake.
After a distant earthquake, Pacific County may be far enough from the epicenter so that there is no damage to evacuation infrastructure, such as roadways. A distant tsunami will not reach Pacific County for several hours. Residents will have time to receive warning from the AHAB (all-hazards alert broadcast) system and evacuate by car, using standard tsunami evacuation routes to Pacific County assembly areas.
A local earthquake, however, will cause tremen-dous destruction and leave little time for people to evacuate to high ground before the subsequent tsunami waves arrive. This short timeframe and lack of natural high ground requires the devel-opment of a vertical evacuation strategy; constructed areas of high ground, whether made of soil or using buildings, give people a place for evacuation. These areas should be easily accessible on foot within fifteen minutes after a near earthquake event.
To analyze the effects of a worst-case sce-nario tsunami, Project Safe Haven used a modeled subduction zone earthquake hazard scenario (developed in part by Priest and others, 1997; and Walsh and others, 2000). Additional information from by the Cascade Region Earthquake Work-group (CREW, 2005) was combined with the model.
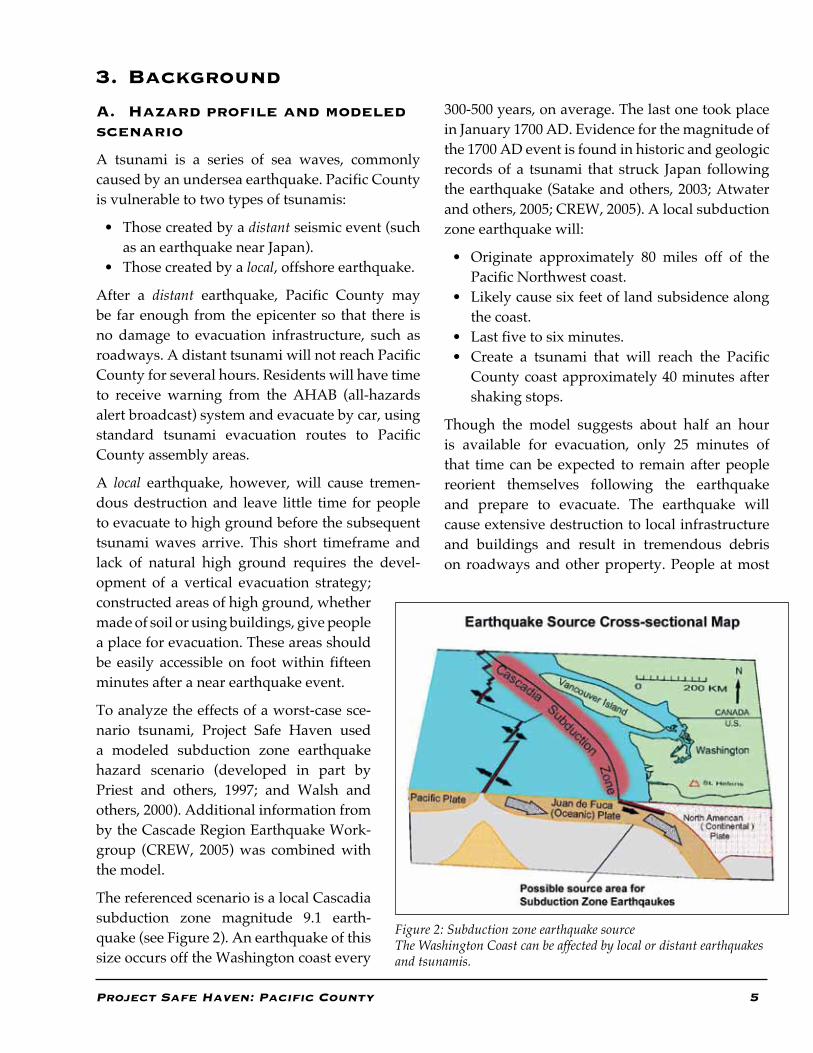
The referenced scenario is a local Cascadia subduction zone magnitude 9.1 earth-quake (see Figure 2). An earthquake of this size occurs off the Washington coast every
3. Background
Figure 2: Subduction zone earthquake sourceThe Washington Coast can be affected by local or distant earthquakes and tsunamis.
300-500 years, on average. The last one took place in January 1700 AD. Evidence for the magnitude of the 1700 AD event is found in historic and geologic records of a tsunami that struck Japan following the earthquake (Satake and others, 2003; Atwater and others, 2005; CREW, 2005). A local subduction zone earthquake will:
• Originate approximately 80 miles off of the Pacific Northwest coast.
• Likely cause six feet of land subsidence along the coast.
• Last five to six minutes. • Create a tsunami that will reach the Pacific
County coast approximately 40 minutes after shaking stops.
Though the model suggests about half an hour is available for evacuation, only 25 minutes of that time can be expected to remain after people reorient themselves following the earthquake and prepare to evacuate. The earthquake will cause extensive destruction to local infrastructure and buildings and result in tremendous debris on roadways and other property. People at most
6 Project Safe Haven: Pacific County
locations on the Long Beach peninsula and the Tokeland peninsula will only be able to evacuate on foot. As an additional margin of safety, the estimated on-foot evacuation time was reduced to 15 minutes, to take into account the physical and emotional turmoil people experience during and after a major earthquake.
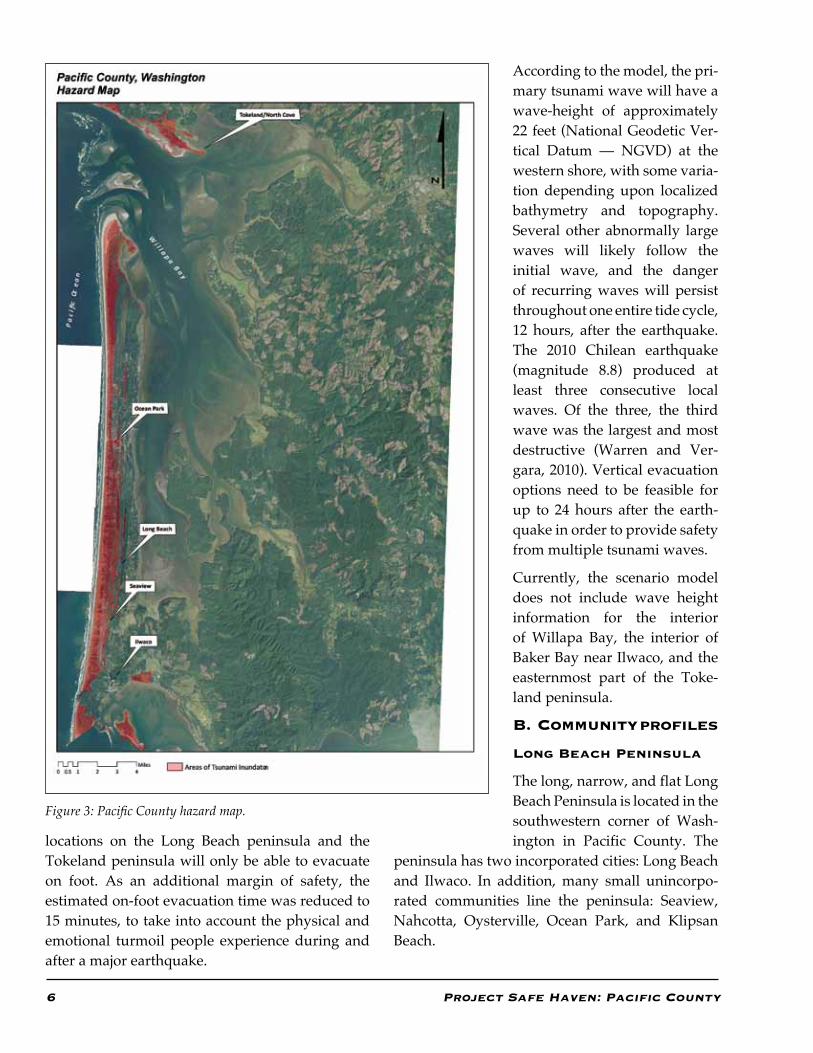
Figure 3: Pacific County hazard map.
According to the model, the pri-mary tsunami wave will have a wave-height of approximately 22 feet (National Geodetic Ver-tical Datum — NGVD) at the western shore, with some varia-tion depending upon localized bathymetry and topography. Several other abnormally large waves will likely follow the initial wave, and the danger of recurring waves will persist throughout one entire tide cycle, 12 hours, after the earthquake. The 2010 Chilean earthquake (magnitude 8.8) produced at least three consecutive local waves. Of the three, the third wave was the largest and most destructive (Warren and Ver-gara, 2010). Vertical evacuation options need to be feasible for up to 24 hours after the earth-quake in order to provide safety from multiple tsunami waves.
Currently, the scenario model does not include wave height information for the interior of Willapa Bay, the interior of Baker Bay near Ilwaco, and the easternmost part of the Toke-land peninsula.
B. Community profiles
Long Beach Peninsula
The long, narrow, and flat Long Beach Peninsula is located in the southwestern corner of Wash-ington in Pacific County. The
peninsula has two incorporated cities: Long Beach and Ilwaco. In addition, many small unincorpo-rated communities line the peninsula: Seaview, Nahcotta, Oysterville, Ocean Park, and Klipsan Beach.
Project Safe Haven: Pacific County 7
as a place where “Discovery awaits!” In addition to significantly contributing to the population numbers, seasonal visitors are often not aware of the tsunami hazard.
City of Long Beach
Long Beach is well known for its festivals and attractions such as the annual International Kite Festival and “one of America’s best boardwalks.” (See Appendix A for the Long Beach context map.) The majority of Long Beach’s populated areas are not within a 15-minute walking distance to existing high ground. The annual population of Long Beach fluctuates considerably from 1,400 during the off-season to 4,000 to 5,000 during the peak season (see Table 1). The housing stock reflects this. Only 57% of the housing stock is inhabited year round, and vacation rentals comprise 43% of the housing. The city contains 147 recreational vehicle (R. V.) parking spaces, 700+ hotel rooms, and 20 bed and breakfasts to accommodate seasonal tourists and visitors.
Project Safe Haven began in the city of Long Beach in response to its nearly complete lack of high ground and because Long Beach is the most densely populated location on the peninsula.
Ocean Park
Ocean Park is an unincorporated community located near the northern end of the Long Beach Peninsula. Ocean Park’s general topography is low; however, there are a number of high, natu-rally occurring dunes that run north-south on both the west side and the east side of the peninsula.
The peninsula is nationally recognized as having the longest continuous beach in the United States, 28 miles in length. There is very little natural high ground on the peninsula. Despite several Pacific County designated assembly areas located on the eastside and southern tip of the peninsula, the majority of residents do not live within reasonable walking distance to these locations or other areas of natural high ground. Most residents and visi-tors are not within a 15-minute walking distance to natural high ground.
Project Safe Haven has emphasized the con-sideration of capabilities and limitations of the peninsula’s aging population. A large percentage of peninsula residents are over the age of 50 and many will likely require ramps to access the verti-cal evacuation structures.
Permanent residents on the peninsula are familiar with the threat of a tsunami. Multiple tsunami evacuation signs are located along major arteri-als and thoroughfares directing people to one of several Pacific County designated assembly areas. Local businesses have embraced the tsunami hazard in their products and logos. The Corral Drive-in offers a “Grand Tsunami Burger.” The Long Beach Coffee Roasters sign depicts a tsunami of coffee leaping out a coffee cup. Additionally, public awareness efforts organized by Pacific County Emergency Management and publicized on their Facebook and Twitter pages elevate public awareness and education levels. The residents’ awareness of tsunamis has further improved after education and preparedness programs by the Weather Forecast Office (WFO) of Portland (Oregon), Washington Emergency Management, and Pacific County.
The Long Beach peninsula experiences substantial seasonal population fluxes because of its reputa-tion for enchanting coastal vacations. During the seasonal peaks, thousands of visitors flock to the peninsula to attend festivals or to stay in one of the many vacation homes that dot the area. Local tourism efforts, such as the Long Beach Visitors Bureau (www.funbeach.com), promote the region
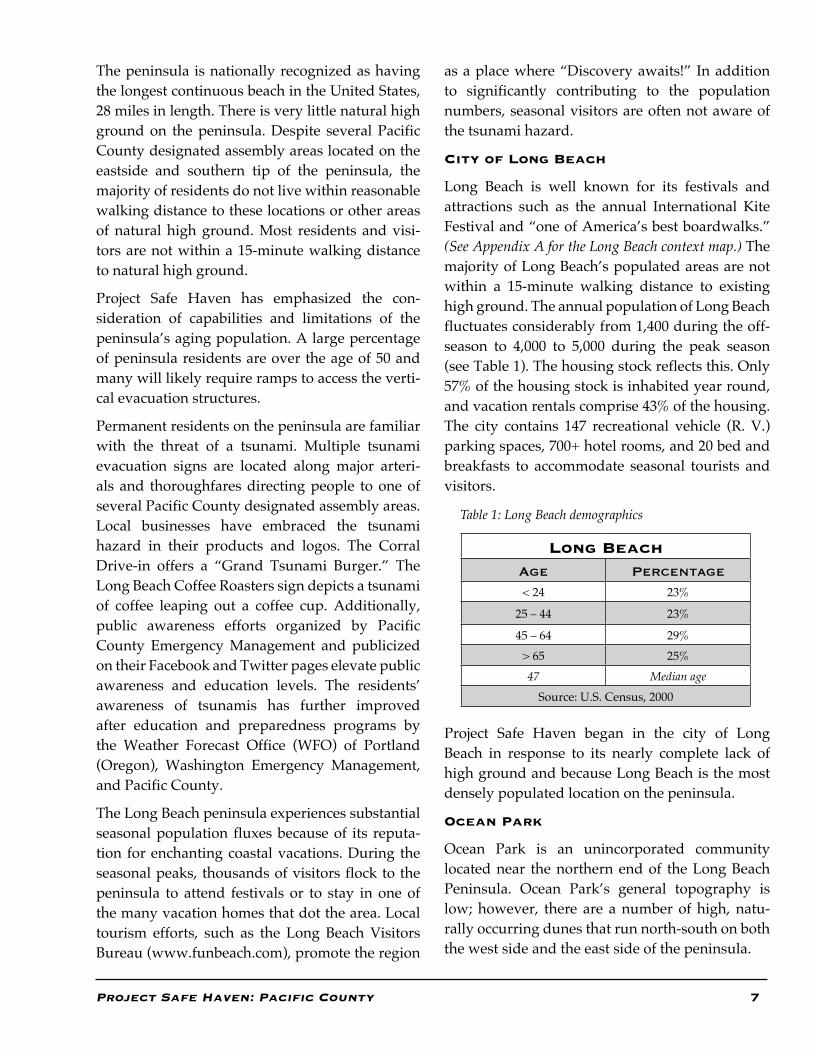
Long BeachAge Percentage< 24 23%
25 – 44 23%
45 – 64 29%> 65 25%47 Median age
Source: U.S. Census, 2000
Table 1: Long Beach demographics
8 Project Safe Haven: Pacific County
multiple campgrounds, and a seasonal downtown Saturday Market. The fishing industry provided the early economy of Ilwaco and the Port of Ilwaco still serves as a fishing destination for sea life rang-ing from sturgeon to crab. Founded in 1848, Ilwaco was incorporated and established as a community in 1890. The City of Ilwaco, in collaboration with local businesses, holds many popular events throughout the year including: The Blessing of the Fleet (May), Art Walks (June-September), Inde-pendence Day fireworks (July), and the Ilwaco Blues & Seafood Festival (August).
Approximately 950 people live in the City of Ilwaco (see Table 3).
Of the 524 housing units, 79% are occupied year round. Unlike other peninsula communities such as Long Beach and Ocean Park, Ilwaco has a larger percentage of year round residents than of vaca-tion or second homes. (See Appendix A for the Ilwaco/Seaview Context Map.)
Seaview
Seaview is an unincorporated area south of Long Beach and north of Ilwaco. Geographically, Seaview is very flat with little to no natural high ground. Seaview originally developed in the 1880s as a getaway for the socialites of Portland, Oregon. It was a stop on the original clamshell rail-road that served the peninsula from 1889 to 1930. Today, many of the Victorian homes, a tree-lined streetscape, and the train depot still exist.
The permanent population of Seaview is approxi-mately 516 (see Table 4).
Ocean Park was settled in the late 1800s when the co-founder of nearby Oysterville fled to the area to establish it as a religious community. The area remains grounded in its past, with two bible camps and multiple churches. A significant number of seasonal tourists come to Ocean Park for annual festivals and beautiful beaches. Some major annual events are: The Northwest Garlic Festival (June), Fourth of July Parade (July), and the Rod Run to the End of the World (September).
The permanent population of the Ocean Park area is approximately 1,500 (see Table 2).
Only 47% of the housing stock is occupied year round, meaning that about half of the housing stock is used as second homes or vacation rentals or are otherwise vacant. (See Appendix A for the Ocean Park Context Map.)
Ilwaco/Seaview
Ilwaco
Ilwaco, an incorporated city located at the south-ern end of the Long Beach Peninsula, is often referred to as a “working fishing village.” Ilwaco’s topography is diverse. Three bodies of water sur-round Ilwaco: Baker Bay, the Columbia River, and the Pacific Ocean. The downtown area’s elevation is very low, but the surrounding areas to the west, north, and east have areas of easily accessible natural high ground. Ilwaco is home to the Lewis and Clark National and State Historic Park, Cape Disappointment State Park (the larg-est state park in Washington), ample beaches,
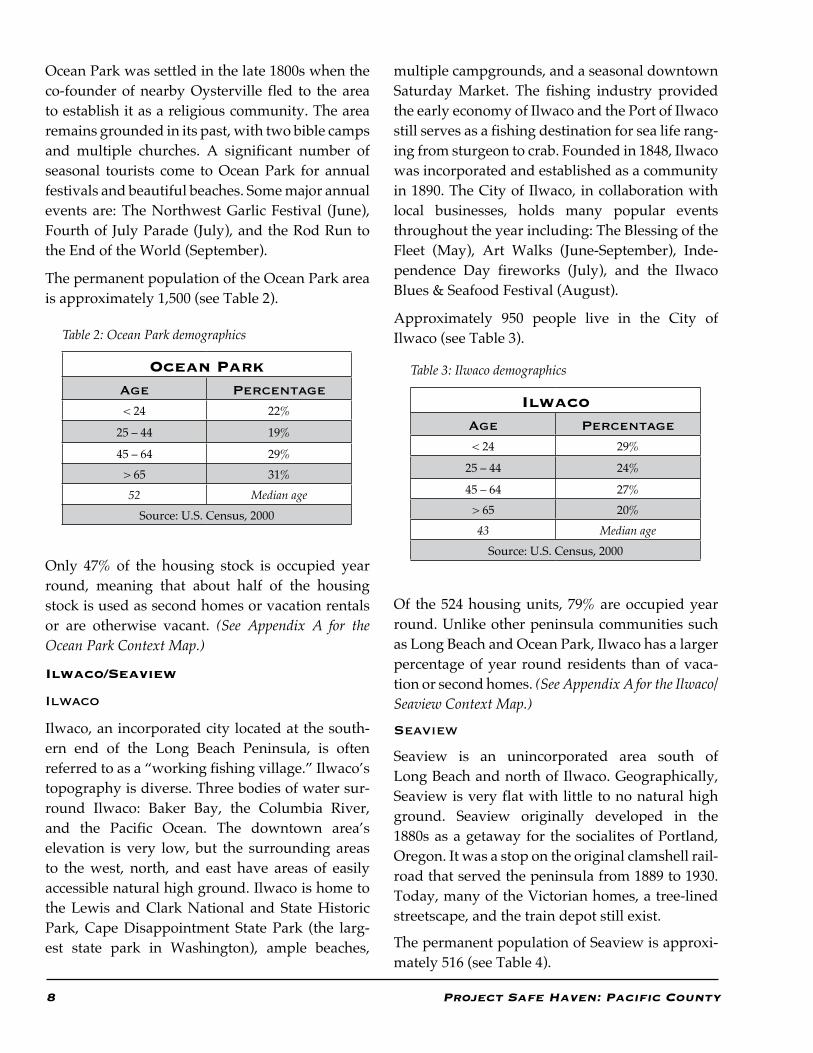
Ocean ParkAge Percentage< 24 22%
25 – 44 19%
45 – 64 29%> 65 31%52 Median age
Source: U.S. Census, 2000
Table 2: Ocean Park demographics
IlwacoAge Percentage< 24 29%
25 – 44 24%
45 – 64 27%> 65 20%43 Median age
Source: U.S. Census, 2000
Table 3: Ilwaco demographics
Project Safe Haven: Pacific County 9
The permanent population of Tokeland/North Cove is approximately 435 (see Table 5).
Of the 403 housing units, 46% are occupied year round. As a result, a significant percentage of the housing stock is most likely utilized as vacation rentals or second homes. (See Appendix A for the Tokeland/North Cove Context Map.)
C. Vertical evacuation
After a tsunami warning, residents of the affected area typically evacuate horizontally, either by car or on foot. A horizontal evacuation strategy is appropriate when communities have natural high ground that is easily accessible. The traditional advice is, “go uphill or inland.”
However, if a community has little or no natural high ground, horizontal evacuation may not be an option. A different strategy is necessary. A vertical evacuation strategy provides artificial high ground in communities that lack natural high ground.
Structure types
In order to accommodate vertical evacuation, the project team evaluated three potential options defined in FEMA P646: Guidelines for Design of Structures for Vertical Evacuation from Tsunamis. These options are berms, towers, and buildings. The minimum space for each is based on allotting every person ten square feet of space.
The conceptual designs for the structures, explained below, are intended as generalized designs to work under most conditions. These designs take into consideration the forces of both the earthquake vibration (anticipated to reach up to 1g, defined as 100% of the force of gravity) and the immense lateral forces of a tsunami. All conceptual designs reference and rely on design considerations for vertical evacuation structures found in FEMA P646.
Cost
The cost of a vertical evacuation structure is a function of structure type, required safe haven area, and required structure height. The required height of the structure includes:
Of the 398 housing units, 63% are occupied year round, leaving a noteworthy percentage of the housing stock most likely used as vacation rentals or second homes.
Tokeland/North Cove
The Tokeland peninsula area is named after Chief Toke, a Chinook/Chehalis native, and is home to the historic Tokeland Hotel, Shoalwater Bay Tribe, and Washaway Beach. Geographically, the Tokeland peninsula is narrow, less than three miles long and bordered by Willapa Bay and the Pacific Ocean. Just north of the peninsula, inland, is the Shoalwater Bay Tribal Reservation, Tribal Complex (Tribal Headquarters, Health Clinic, and Library), and Casino. Due west of tribal lands is the area referred to as North Cove. Washaway Beach is located in North Cove and is currently experiencing erosion at a rate of 100 feet per year over the last century. Washaway Beach has the most rapid rate of erosion anywhere on the west coast of the US.
SeaviewAge Percentage< 24 24%
25 – 44 24%
45 – 64 31%> 65 22%46 Median age
Source: U.S. Census, 2000
Table 4: Seaview demographics
Tokeland/North CoveAge Percentage< 24 27%
25 – 44 20%
45 – 64 30%> 65 23%47 Median age
Source: U.S. Census, 2000
Table 5: Tokeland/North Cove demographics
10 Project Safe Haven: Pacific County
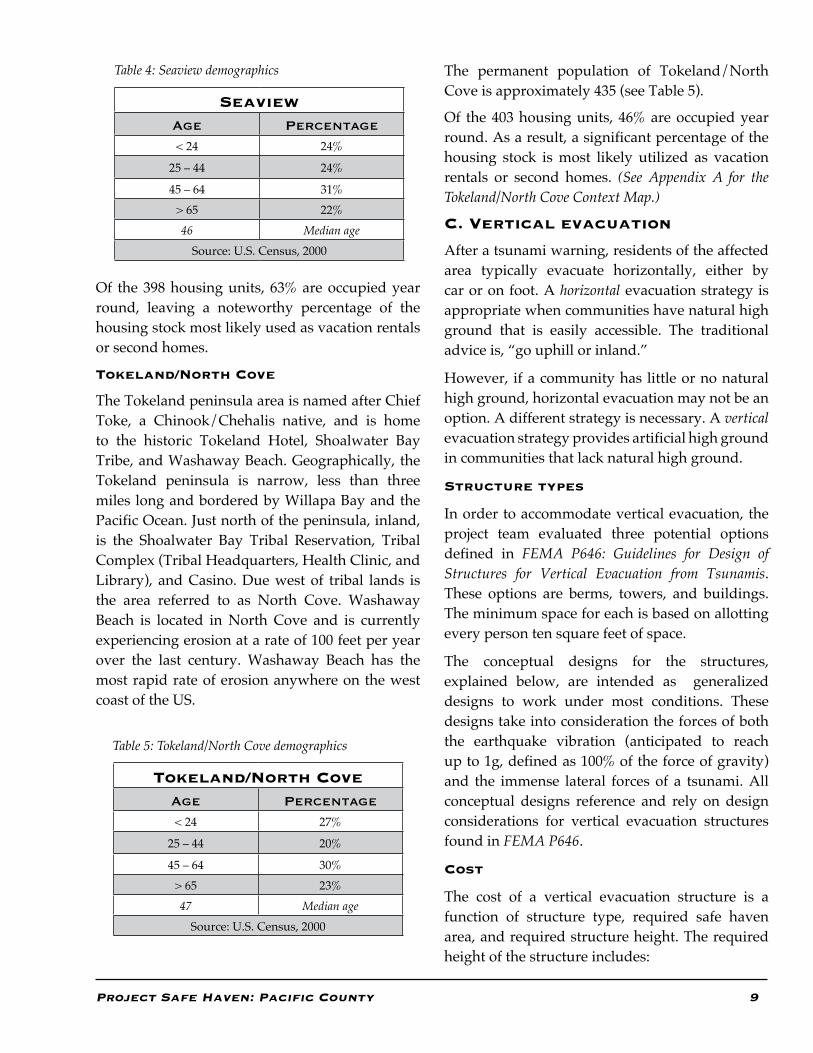
They typically have ramps at a 1:4 slope provid-ing access from the ground to the elevated surface. Berms have a large footprint on the landscape, giving the appearance of an engineered and designed hill (see Figure 4). A berm can range in size from 1,000 square feet for 100 people up to 100,000 square feet for 10,000 people.
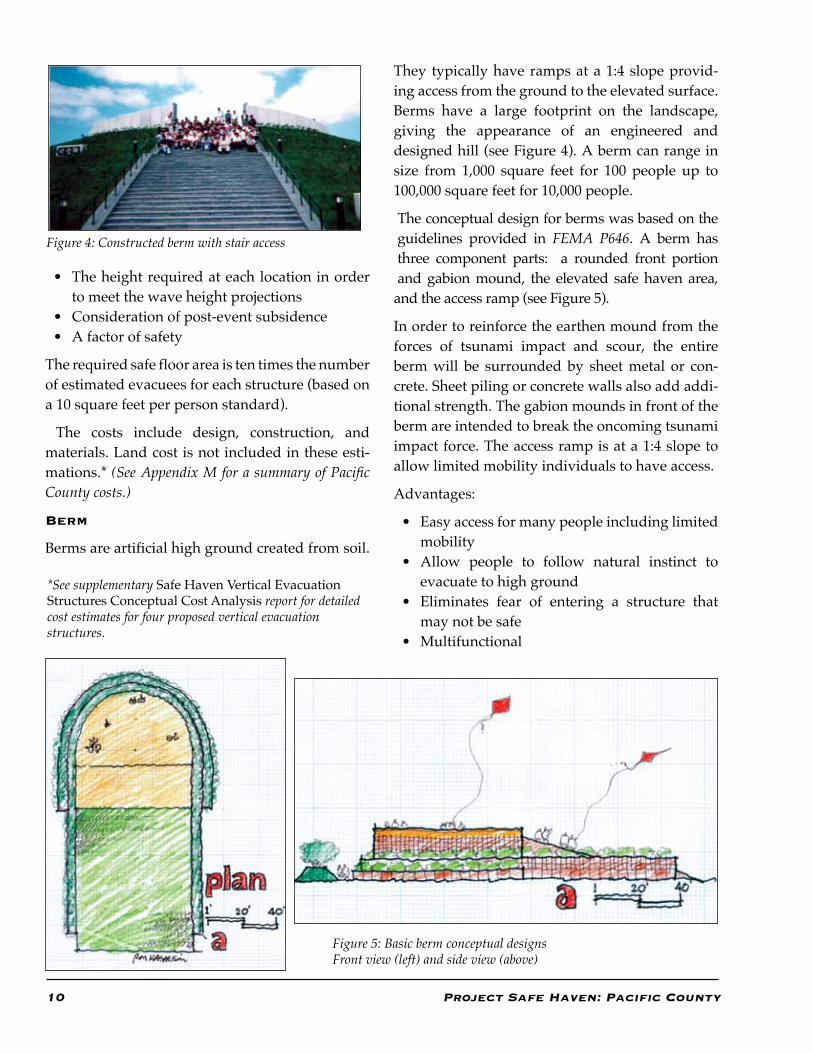
The conceptual design for berms was based on the guidelines provided in FEMA P646. A berm has three component parts: a rounded front portion and gabion mound, the elevated safe haven area,
and the access ramp (see Figure 5).
In order to reinforce the earthen mound from the forces of tsunami impact and scour, the entire berm will be surrounded by sheet metal or con-crete. Sheet piling or concrete walls also add addi-tional strength. The gabion mounds in front of the berm are intended to break the oncoming tsunami impact force. The access ramp is at a 1:4 slope to allow limited mobility individuals to have access.
Advantages:
• Easy access for many people including limited mobility
• Allow people to follow natural instinct to evacuate to high ground
• Eliminates fear of entering a structure that may not be safe
• Multifunctional
• The height required at each location in order to meet the wave height projections
• Consideration of post-event subsidence • A factor of safety
The required safe floor area is ten times the number of estimated evacuees for each structure (based on a 10 square feet per person standard).
The costs include design, construction, and materials. Land cost is not included in these esti-mations.* (See Appendix M for a summary of Pacific County costs.)
Berm
Berms are artificial high ground created from soil.
Figure 4: Constructed berm with stair access
*See supplementary Safe Haven Vertical Evacuation Structures Conceptual Cost Analysis report for detailed cost estimates for four proposed vertical evacuation structures.
Figure 5: Basic berm conceptual designsFront view (left) and side view (above)
Project Safe Haven: Pacific County 11
retractable staircase to leave the tower.
Advantages:
• Economical• Small footprint• Due to lower cost, more towers
could be distributed throughout the affected areas to increase accessibility and availability
• Multifunctional.
Building
A building used as a tsunami evacuation structure has several lower levels that allow the tsunami wave to flow through it or the building is faced in a manner that the structural integrity of the building will support the force of the wave. Tsunami refu-gees seek safety in the upper floors of the building. Typical tsunami evacuation buildings are hotels or parking structures (see Figure 8).
A variety of building types can be used for verti-cal evacuation. A vertical evacuation building will likely be constructed with reinforced concrete. This material has proven to be strong against both earthquake and tsunami forces. In order to increase the likelihood of withstanding a tsunami, the first level is considered “transparent,” having little surface area to create resistance against the force of the tsunami (see Figure 9).
Tower
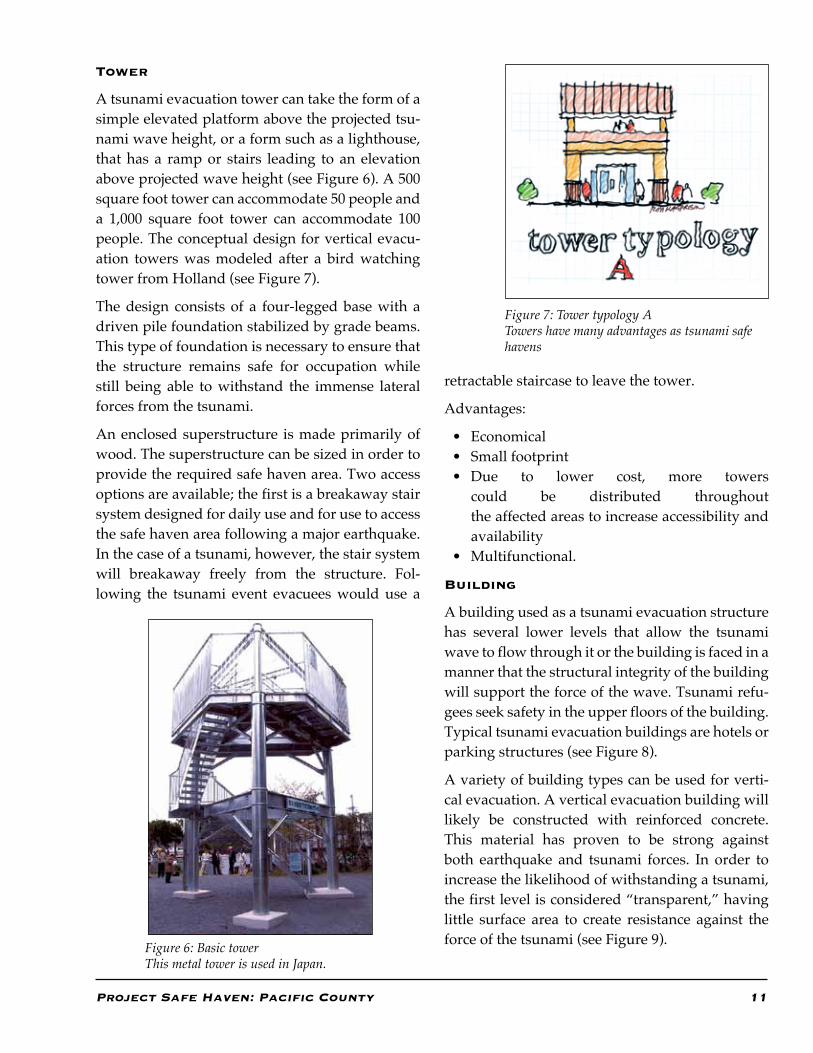
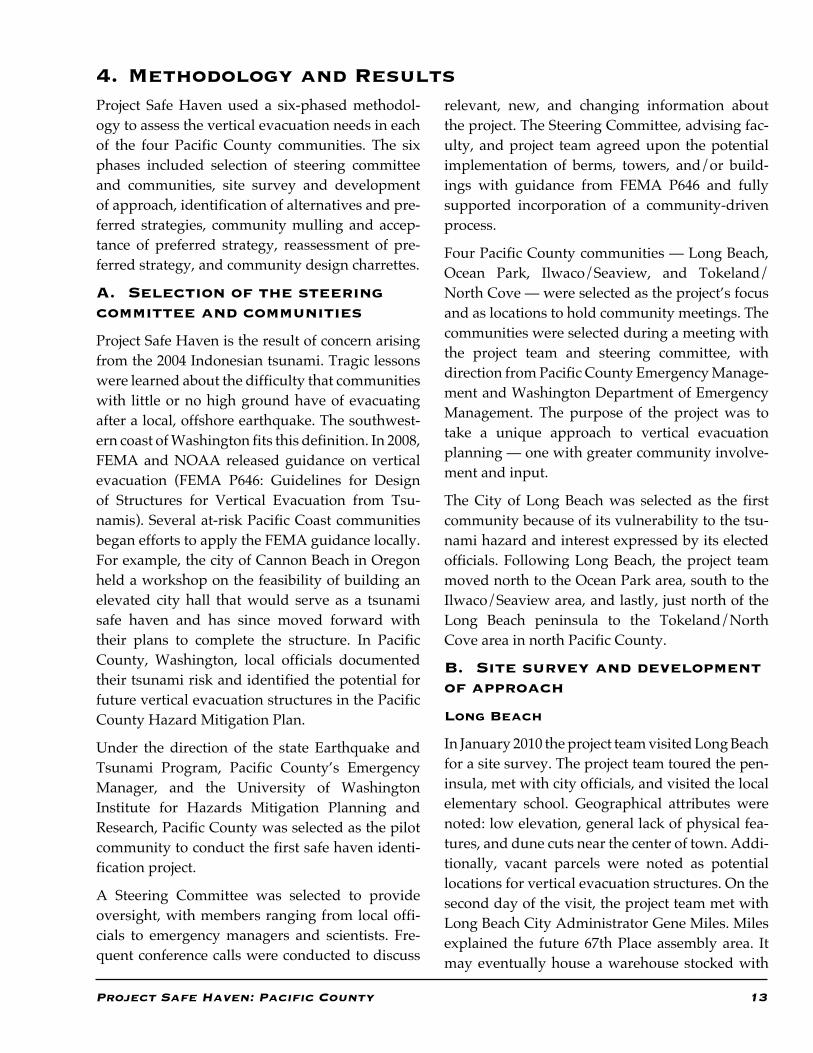
A tsunami evacuation tower can take the form of a simple elevated platform above the projected tsu-nami wave height, or a form such as a lighthouse, that has a ramp or stairs leading to an elevation above projected wave height (see Figure 6). A 500 square foot tower can accommodate 50 people and a 1,000 square foot tower can accommodate 100 people. The conceptual design for vertical evacu-ation towers was modeled after a bird watching tower from Holland (see Figure 7).
The design consists of a four-legged base with a driven pile foundation stabilized by grade beams. This type of foundation is necessary to ensure that the structure remains safe for occupation while still being able to withstand the immense lateral forces from the tsunami.
An enclosed superstructure is made primarily of wood. The superstructure can be sized in order to provide the required safe haven area. Two access options are available; the first is a breakaway stair system designed for daily use and for use to access the safe haven area following a major earthquake. In the case of a tsunami, however, the stair system will breakaway freely from the structure. Fol-lowing the tsunami event evacuees would use a
Figure 6: Basic towerThis metal tower is used in Japan.
Figure 7: Tower typology ATowers have many advantages as tsunami safe havens

12 Project Safe Haven: Pacific County
Figure 8: Building for vertical evacuation.Buildings can be used for other functions when not needed for evacuation.
Figure 9: Conceptual designPotential building with tsunami vertical evacuation capability.
Advantages:
• Lower levels of a building can be designed as “open space,” allowing the water to flow through without compromising the engineering
• Multifunctional• Top level of a parking structure could pro-
vide a helicopter landing pad after the event to deliver much needed supplies
• Buildings have the potential to generate money through other, non-tsunami uses.
Project Safe Haven: Pacific County 13
4. Methodology and ResultsProject Safe Haven used a six-phased methodol-ogy to assess the vertical evacuation needs in each of the four Pacific County communities. The six phases included selection of steering committee and communities, site survey and development of approach, identification of alternatives and pre-ferred strategies, community mulling and accep-tance of preferred strategy, reassessment of pre-ferred strategy, and community design charrettes.
A. Selection of the steering committee and communities
Project Safe Haven is the result of concern arising from the 2004 Indonesian tsunami. Tragic lessons were learned about the difficulty that communities with little or no high ground have of evacuating after a local, offshore earthquake. The southwest-ern coast of Washington fits this definition. In 2008, FEMA and NOAA released guidance on vertical evacuation (FEMA P646: Guidelines for Design of Structures for Vertical Evacuation from Tsu-namis). Several at-risk Pacific Coast communities began efforts to apply the FEMA guidance locally. For example, the city of Cannon Beach in Oregon held a workshop on the feasibility of building an elevated city hall that would serve as a tsunami safe haven and has since moved forward with their plans to complete the structure. In Pacific County, Washington, local officials documented their tsunami risk and identified the potential for future vertical evacuation structures in the Pacific County Hazard Mitigation Plan.
Under the direction of the state Earthquake and Tsunami Program, Pacific County’s Emergency Manager, and the University of Washington Institute for Hazards Mitigation Planning and Research, Pacific County was selected as the pilot community to conduct the first safe haven identi-fication project.
A Steering Committee was selected to provide oversight, with members ranging from local offi-cials to emergency managers and scientists. Fre-quent conference calls were conducted to discuss
relevant, new, and changing information about the project. The Steering Committee, advising fac-ulty, and project team agreed upon the potential implementation of berms, towers, and/or build-ings with guidance from FEMA P646 and fully supported incorporation of a community-driven process.
Four Pacific County communities — Long Beach, Ocean Park, Ilwaco/Seaview, and Tokeland/North Cove — were selected as the project’s focus and as locations to hold community meetings. The communities were selected during a meeting with the project team and steering committee, with direction from Pacific County Emergency Manage-ment and Washington Department of Emergency Management. The purpose of the project was to take a unique approach to vertical evacuation planning — one with greater community involve-ment and input.
The City of Long Beach was selected as the first community because of its vulnerability to the tsu-nami hazard and interest expressed by its elected officials. Following Long Beach, the project team moved north to the Ocean Park area, south to the Ilwaco/Seaview area, and lastly, just north of the Long Beach peninsula to the Tokeland/North Cove area in north Pacific County.
B. Site survey and development of approach
Long Beach
In January 2010 the project team visited Long Beach for a site survey. The project team toured the pen-insula, met with city officials, and visited the local elementary school. Geographical attributes were noted: low elevation, general lack of physical fea-tures, and dune cuts near the center of town. Addi-tionally, vacant parcels were noted as potential locations for vertical evacuation structures. On the second day of the visit, the project team met with Long Beach City Administrator Gene Miles. Miles explained the future 67th Place assembly area. It may eventually house a warehouse stocked with
14 Project Safe Haven: Pacific County
emergency supplies when complete. In the event of a distant tsunami, a two to three hour warning will allow residents to drive to 67th Place. How-ever, in the event of a near tsunami, most residents cannot walk there within 15 minutes.
Ocean Park
The project team visited Ocean Park and the north peninsula area in April 2010. The team toured the northern end of the peninsula, noting significant differences from Long Beach, such as various high ridges within walking distance for many resi-dents. Numerous house foundations cut into the dune system were also noted. Dune cuts reduce the effectiveness of the dune’s natural defense against tsunamis. A system of pedestrian and automobile bridges in the north peninsula area of Surfside Estates is vulnerable to failure during an intense earthquake event. This is critical because most natural high ground is eastward. The bridges provide the majority of access in the near vicinity for tsunami evacuation.
Ilwaco/Seaview
The project team visited the Ilwaco and Seaview communities in May 2010. The team toured the area, noting the distinctive geographical attributes of each community. Several parcels without build-ings were noted; however, most parcels are located on the east side of the highway and are currently being used for cranberry production.
Ilwaco has significant high ground within the Cape Disappointment State Park area near the ocean, as well as several high hills to the north and east of downtown. To the east, the area called Vandalia, with little to no elevation, is located adjacent to the river and recognized as a flood zone
The entire community of Seaview lies on low ground, in stark contrast to Ilwaco. The community is located between Highway 103 and the beach in a very low-lying area with marshes and cranberry bogs to the east. After the earthquake and subsid-ence of six feet the marshy areas as well as roads may experience mild flooding and would hinder all forms of evacuation, even on foot evacuation.
Tokeland/North Cove
The project team visited the Tokeland and North Cove communities in June 2010. The team noted the low lying Tokeland peninsula and the large bodies of water surrounding it. Further inland, in the vicinity of the Shoalwater Bay Casino on Hwy 105, accessible high ground was observed. Toke-land has two designated assembly areas located north of Highway 105: Annex Road and Eagle Hill Road. One is located west of the Casino and the other is located east of the Casino. The assembly areas are not within a fifteen-minute walking dis-tance for the residents of the Tokeland peninsula.
One major area of concern for this area is Washa-way Beach located in North Cove. The beach and shoreline have been drastically eroding over the past 100 years at a rate of 100 feet per year.
C. Identification of alternatives, assessment of alternatives, and development of preferred strategies
Community meetings
A series of meetings was conducted in each of the four communities to develop a vertical evacu-ation strategy. The first meeting used the World Café meeting process to identify and discuss the concept of vertical evacuation, various structure types, and conceptual site locations. In the second community meeting the project team presented the alternatives that had been synthesized from the first meeting and conducted discussions about the strengths and weaknesses of each alternative and conceptual vertical evacuation structure location. Two countywide meetings were held in Seaview and Tokeland at the end of the project to confirm the final preferred strategies and to receive further feedback. Lastly, two intensive, community design charrettes were led by an accomplished urban designer from the University of Washington to identify everyday uses for the proposed structures in the vertical evacuation strategies.
Meeting 1: World Café
The World Café process is a “café style”
Project Safe Haven: Pacific County 15
conversation to facilitate small group brainstorm-ing. It is commonly referred to as encouraging “conversations that matter.” Participants dis-cussed key issues at one of three stations, with one participant at each station facilitating the discus-sion and taking notes.
Before the meetings, project team members pre-pared for the role of facilitator by taking small group dynamics training. They were facilita-tors, not leaders, of discussion. They took notes throughout the rounds to record participant’s comments.
Each station represented a different type of verti-cal evacuation structure: berm, tower, or building. Each station used large table maps of the commu-nity, in combination with walking circles and Lego models of vertical evacuation structures, to deter-mine ideal placement locations. When the allotted time ended, station participants rotated to another station, leaving one member behind to facilitate and share notes with the incoming group. This process typically continued until every participant had a turn at each station.
Meeting 2: Discussion of strengths and weaknesses
The purpose of the second meeting was to pres-ent results from the first meeting and to discuss the strengths and weaknesses of each conceptual site and vertical evacuation type. The project team presented the alternatives derived from the first meeting using maps and graphics. Next, the team facilitated a large group brainstorming session regarding the strengths and weaknesses of each alternative using SWOT analysis techniques. The goal of the meeting was to build consensus among those present and to develop a preferred strategy. (See Appendix B for a complete description of SWOT analysis.)
Countywide meetings
The final preferred strategies and the accompany-ing maps for each community were presented at the countywide, open house meetings. The project team encouraged verbal and written comments. Additional information about estimated costs,
community processes and the tsunami hazard was presented. Attendees were asked to vote for their favorite or most important proposed vertical evacuation location.
Community design charrettes
A design team, led by an urban designer from the University of Washington, joined Project Safe Haven after the countywide meetings to look at alternative community uses for the proposed vertical evacuation structures. The design team conducted two intensive, community design char-rettes in Pacific County to encourage local residents to consider how the proposed vertical evacuation structures might fit into the context of the existing built environment and how the proposed struc-tures could contribute to and even enhance the communities.
D. Long Beach
Long Beach meeting 1: World Café
The first Long Beach meeting was held on Feb-ruary 11, 2010. The City Administrator invited twelve people representing public, business, and nonprofit sectors to the meeting. Seven community invitees attended the meeting and were assigned to one of three groups. Five county and state invi-tees also attended the meeting and participated in the discussion, and four UW students assisted in the World Café process.
The students introduced the assumption that despite a warning time of approximately 40 min-utes for a local tsunami, the expected earthquake shaking, road/sidewalk conditions, and general confusion would reduce the amount of time a person had to evacuate to 15 minutes. Each station was given a table-sized hazard map of Long Beach and was asked to examine one of the three types of vertical structures (berm, tower, and building). The purpose of the stations was to propose and discuss possible sites and sizes for the structures. Each station was given foam board cutouts repre-senting the footprints of their assigned structure type. Station participants were also given two walking circles to determine how many people
16 Project Safe Haven: Pacific County
each proposed structure will serve based on walk-ing speeds (from Kaeser and Laplante, 2007):
• One circle represented a radius of 3,600 feet, the distance a person at average walking speed can cover in 15 minutes (four feet per second, 3,600 feet in 15 minutes)
• One circle represented a radius of 2,700 feet, the distance a person at below average walk-ing speed can cover in 15 minutes (three feet per second, 2,700 feet in 15 minutes).
The participants moved the walking circles to dif-ferent places on the map to analyze the accessibil-ity of different locations for berms, towers, and buildings.
Participants at the first station were allotted 25 minutes to discuss structure placement alterna-tives. The second session lasted 20 minutes, and the third session lasted 10 minutes. After completing three rounds, the meeting participants reconvened to discuss the outcomes of each of the stations to inform the next step, assessment of alternative.
Comments recorded during the rounds were:
• Additional street names on maps would be helpful
• Chopsticks showing water direction (dune cuts) are useful
• Participants seemed very engaged working with the maps
• World Café process/intention during the second round needs to be better introduced by the facilitator
• Better explanation of wave height gradient would be helpful
• Using red to show tsunami inundation levels is confusing since water is usually colored blue on maps
• At least five minutes were needed for expla-nation of what was discussed during the first round
• More pictorial examples of potential structures need to be provided.
The World Café process allowed meeting par-ticipants to provide the project team with an abundance of local knowledge about Long Beach. Participants recorded their input and suggestions on the table maps by drawing arrows, identify-ing areas with a higher density of senior citizens, and correcting and adding labels to better identify important areas for consideration. The large maps at each table facilitated participation by providing a way for people to actively manipulate the build-ing footprint cutouts and walking circles. After completing three rounds, the meeting participants reconvened to discuss the outcomes of each of the stations. Students recorded the information and input from this meeting to inform the next step, assessment of alternatives for vertical evacuation.
Note about process: Throughout the series of com-munity meetings, the meeting process morphed as strengths and weaknesses about the process were identified. The noted strengths and weaknesses of the World Café process were: good brainstorming, good quantity of ideas, consensus reached, more people would have been better, and some people were confused as to what the maps portrayed. The adjustments made were: revision of maps (easier to understand), increased guided discussion at each table group, and encouraged map revisions and map notes to be written on the map itself. Par-ticipants provided feedback about the project itself and the idea of vertical evacuation both verbally and in writing. The World Café approach facili-tated increased feedback in the sense that those attending were given multiple types and levels of opportunities to participate.
Three alternatives
The Project Safe Haven team developed three alternatives from the World Café meeting results.
1. Five berms located along the eastern bound-ary of the city
2. Four berms located along the eastern bound-ary of the city and one public building
3. Five berms and three potential hotel develop-ments or redevelopments.
Project Safe Haven: Pacific County 17
Long Beach meeting 2: Evaluation of alternatives
After generating three alternatives during meeting 1, a second meeting was held on February 25th, 2010 with the same set of meeting participants. Students presented and explained the alternatives, and then asked the participants to conduct a Strengths, Weaknesses, Opportunities, and Threats (SWOT) analysis of the three alternatives. When used as a planning tool, a SWOT analysis can help identify supporting and unfavorable internal and external factors of a project. Students gave participants a SWOT matrix worksheet to facilitate group brain-storming and evaluation. Participants noted the strengths and weaknesses of the alternatives; they came to a consensus that alternatives one and two offered more benefits than alternative three. They proposed merging the first and second alternative into a single preferred strategy. (See Appendix C for complete comments.)Long Beach: Description of preferred strategy
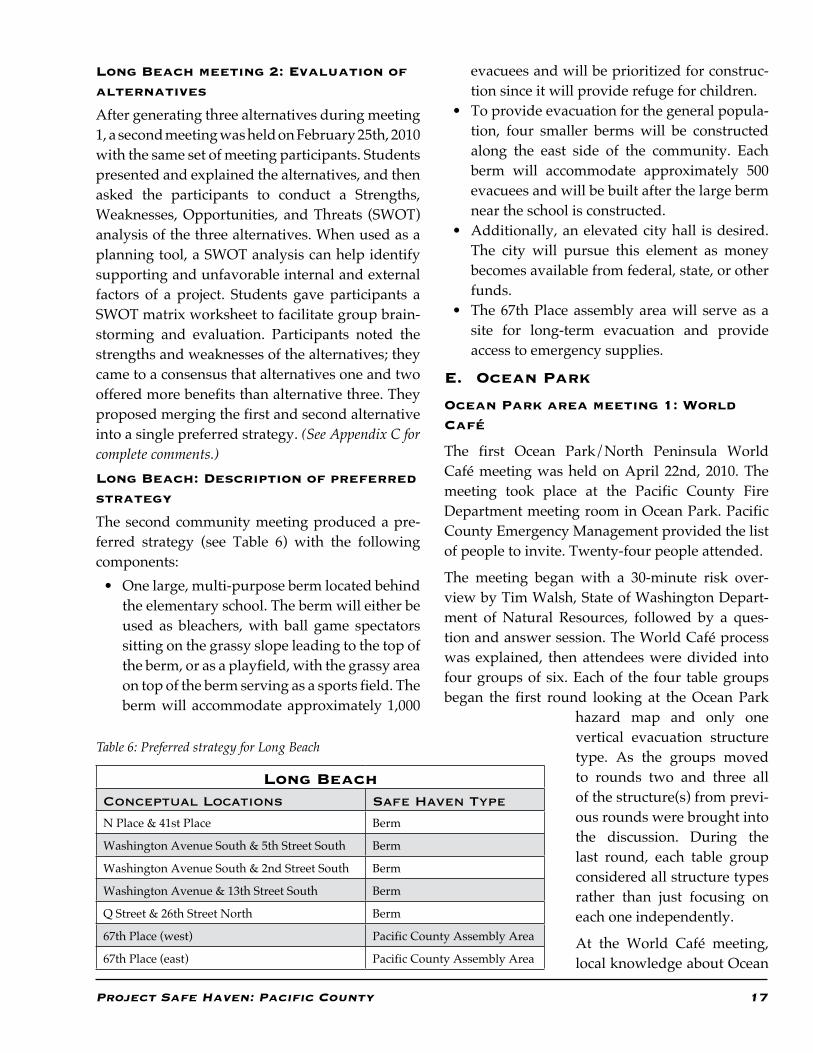
The second community meeting produced a pre-ferred strategy (see Table 6) with the following components:
• One large, multi-purpose berm located behind the elementary school. The berm will either be used as bleachers, with ball game spectators sitting on the grassy slope leading to the top of the berm, or as a playfield, with the grassy area on top of the berm serving as a sports field. The berm will accommodate approximately 1,000
evacuees and will be prioritized for construc-tion since it will provide refuge for children.
• To provide evacuation for the general popula-tion, four smaller berms will be constructed along the east side of the community. Each berm will accommodate approximately 500 evacuees and will be built after the large berm near the school is constructed.
• Additionally, an elevated city hall is desired. The city will pursue this element as money becomes available from federal, state, or other funds.
• The 67th Place assembly area will serve as a site for long-term evacuation and provide access to emergency supplies.
E. Ocean Park
Ocean Park area meeting 1: World Café
The first Ocean Park/North Peninsula World Café meeting was held on April 22nd, 2010. The meeting took place at the Pacific County Fire Department meeting room in Ocean Park. Pacific County Emergency Management provided the list of people to invite. Twenty-four people attended.
The meeting began with a 30-minute risk over-view by Tim Walsh, State of Washington Depart-ment of Natural Resources, followed by a ques-tion and answer session. The World Café process was explained, then attendees were divided into four groups of six. Each of the four table groups began the first round looking at the Ocean Park
hazard map and only one vertical evacuation structure type. As the groups moved to rounds two and three all of the structure(s) from previ-ous rounds were brought into the discussion. During the last round, each table group considered all structure types rather than just focusing on each one independently.
At the World Café meeting, local knowledge about Ocean
Long BeachConceptual Locations Safe Haven Type
N Place & 41st Place Berm
Washington Avenue South & 5th Street South Berm
Washington Avenue South & 2nd Street South Berm
Washington Avenue & 13th Street South Berm
Q Street & 26th Street North Berm
67th Place (west) Pacific County Assembly Area
67th Place (east) Pacific County Assembly Area
Table 6: Preferred strategy for Long Beach
18 Project Safe Haven: Pacific County
Park’s natural lines of defense and key locations with high population densities was collected. After the meeting, the project team incorporated this local knowledge into their analysis of poten-tial vertical evacuation strategies. They also dis-cussed how best to incorporate areas of natural high ground into the process of identifying con-ceptual vertical evacuation sites. The project team agreed to include discussion about natural lines of defense into the discussion of the strengths and weaknesses of the strategy in Ocean Park due to the higher than average local knowledge available. Ultimately, a strategy emerged using collected local knowledge and input regarding potential vertical evacuation sites.
Note about process: The Ocean Park World Café meeting was conducted somewhat differently from the Long Beach World Café due to an increase in participation. Tim Walsh conducted a tsunami risk presentation at the beginning of the meeting. The number of tables used in the World Café pro-cess increased from three to four to accommodate increased participation. The World Café process was adjusted to gradually include consideration of all vertical evacuation structure types together rather than continue separate analysis.
Ocean Park area meeting 2: Evaluation of alternatives
The Ocean Park/North Peninsula evaluation of alternatives meeting was held on May 3rd, 2010. The meeting again took place at the Ocean Park Fire Department meeting room in Ocean Park and a total of 10 people attended. The purpose of the meeting was to present the strategy derived from the World Café meeting and to evaluate it in terms of strengths and weaknesses. The meeting began with a welcome and a segment regarding the hazard and scenario assumptions. (See Appendix D for project assumptions.)
The Ocean Park area geography includes more natural lines of defense than Long Beach. In fact, the entire northern peninsula has a multitude of natural ridges that run north and south and are a short walking distance from where people live.
Natural lines of defense were discussed before dis-cussion of the strategy strengths and weaknesses. (See Appendix E for lines of defense.)
Strengths of the natural environment discussed were:
• Continuous primary dune• Stable secondary dunes• Various areas of natural high ground• Deep beach.
Weaknesses of the natural environment discussed were:
• Near-shore erosion• Interruption in dunes – focusing energy• De-vegetation of dunes.
The Ocean Park area encompasses nearly the entire northern half of the peninsula. Therefore, in order to better analyze the results from the first meeting the project team divided Ocean Park into five strategy areas: Area A, Area B, Area CD, and Area E. Each area map represented information about current assembly areas, conceptual berm locations, and various geographic concerns. (See Appendix F for Ocean Park area maps.)
For analysis of the five areas, the project team conducted a large group discussion about the strengths and weaknesses of the conceptual strate-gies in each area. In addition to the large group discussion, each meeting attendee was provided with a packet for taking hand-written notes about each area’s strengths and weaknesses that was sub-mitted to the project team at the conclusion of the meeting. The strengths of each subarea consisted of issues such as proximity of proposed locations to the general public, natural lines of defense, and location to vacationers. The weaknesses of each subarea consisted of issues such as wetlands, lakes, car and pedestrian bridges, and dune stability. (See Appendix G for complete comments.)
Ocean Park area: Description of preferred strategy
Derived from resident input at meeting 2, the preferred strategy for the Ocean Park/North
Project Safe Haven: Pacific County 19
Peninsula area includes a series of berms, exist-ing assembly areas, and identified natural high ground (see Table 7).
F. Ilwaco/Seaview
Ilwaco/Seaview meeting 1: World Café
The first Ilwaco/Seaview meeting was held on May 17th, 2010. The meeting took place at the Ilwaco Community Center. Pacific County Emer-gency Management provided a list of individuals to invite to the meeting. Seven people attended.
The meeting was conducted using the World Café method. Prior to the World Café segment, a pre-sentation about the hazard was given. In addition, a short presentation about the project/scenario assumptions was given to inform the attendees about the assumptions that the project team has used.
In response to the limited number of attendees, the project team divided the residents into two groups to conduct the World Café discussion. The residents self-selected to group themselves by their residence in either Ilwaco or Seaview.
Each table group looked at the Ilwaco/Seaview hazard map and potential sites for berms, towers, or buildings. After the first round, the table groups switched tables and discussed potential sites and structure types in the opposite community. For this meeting there were only two, rather than three, World Café rounds.
After the World Café rounds the project team came together as a large group and everyone shared their ideas, concerns, and suggestions based on local knowledge of the study area. Some of the comments are as follows:
Ilwaco/Seaview meeting 1: World Café
The first Ilwaco/Seaview meeting was held on May 17th, 2010. The meeting took place at the Ilwaco Community Center. Pacific County Emer-gency Management provided a list of individuals to invite to the meeting. Seven people attended.
The meeting was conducted using the World Café method. Prior to the World Café segment, a pre-sentation about the hazard was given. In addition, a short presentation about the project/scenario assumptions was given to inform the attendees
Table 7: Preferred strategy for Ocean Park
Ocean ParkConceptual locations Safe haven type
J Place & 315th Street (Surfside Inn parking lot) Pacific County assembly area
Douglas Dr & Crellin Dr Pacific County assembly area
Joe Johns Road & K Lane High Ground
Joe Johns Road & X Lane High Ground
U Street & 260th Street Pacific County assembly area/berm
U Street & 227th Place Berm
Z Street & 270th Place High Ground
K Place & 271st Place High Ground
SR 103 & 210th Place Berm
SR 103 & 188th Place Berm
SR 103 & 162nd Lane Berm
SR 103 & Cranberry Road Berm
Cranberry Road (between Birch Street & Sandridge Road) High Ground
20 Project Safe Haven: Pacific County
about the assumptions that the project team has used.
In response to the limited number of attendees, the project team divided the residents into two groups to conduct the World Café discussion. The residents self-selected to group themselves by their residence in either Ilwaco or Seaview.After the World Café rounds, the project team came together as a large group and everyone shared their ideas, concerns, and suggestions based on local knowledge of the study area. Some of the comments are as follows:Ilwaco
• Community center as gathering point; middle school/high school as gathering point
• Old high school has some Red Cross medical supplies — use it as gathering point?
• Vandalia area has the airstrip — cannot build within two miles• Evacuate Vandalia residents to China Hill
(long distance)• Stringtown Road — reinforce to stand after
quake and tsunami• Cape Disappointment State Park (campground)
• Small tower or berm to hold 100-200 people or designate a trail to high ground
Seaview
• Long Beach 41st Place proposed site will cover most of Seaview’s population
• Overall Seaview vulnerability
Ilwaco/Seaview meeting 2: Strengths and weaknesses evaluation
The second Ilwaco/Seaview meeting was held on June 8th, 2010 at the Ilwaco Community Center. The residents invited to the first meeting were also invited to attend the second meeting. Three people attended.
The agenda for the meeting began with a welcome, introduction, and a discussion of the hazard and scenario threats and opportunities. Natural lines of defense, such as areas of natural high ground, were presented and discussed. Ilwaco was divided into three areas in order to better analyze the strengths and weaknesses of the proposed sites derived from the first meeting. The residents provided local knowledge as they discussed the strengths and weaknesses of each strategy area.
Consideration of the Vandalia population, wetland prominence in the Seaview area, and campground sites in Cape Disappointment State park was given throughout the discussion. Meeting participants suggested consulting wetland specialists and local officials as to how to address potential vertical evacuation sites in wetland areas. Ultimately, a preferred strategy for Ilwaco/Seaview emerged at the conclusion of the meeting.
Ilwaco/Seaview: Description of preferred strategy
Derived from resident input at meeting 2, the preferred strategy for the Ilwaco/Seaview area includes a series of berms, predetermined Pacific
Ilwaco/SeaviewConceptual locations Safe haven type
SR Loop 100 (see Pacific County Assembly Area map) Pacific County Assembly Area
SR Loop 100 (see Pacific County Assembly Area map) Pacific County Assembly Area
SR Loop 100 (see Pacific County Assembly Area map) Pacific County Assembly Area
Brumbach Avenue NE & Provo Street NE (Ilwaco High School) Pacific County Assembly Area
McKenzie Head Trail (Fort Canby Park Road) High Ground
Ortelius Drive & Scarboro Lane North Berm
N Place & 37th Place Berm
Table 8: Preferred strategy for Ilwaco/Seaview
Project Safe Haven: Pacific County 21
County assembly areas and highlighted natural high ground (see Table 8).
G. Tokeland/North Cove
Tokeland/North Cove meeting 1: Group discussion and local knowledge
The first Tokeland/North Cove meeting was held on June 22nd, 2010 at the North Willapa Harbor Grange Hall. The project team was provided with a list of contacts from the Pacific County Emer-gency Management Coordinator. From the list of Tokeland/North Cove contacts three residents attended. Due to the limited number of attendees the project team changed the format of the meeting from a World Café format to a group discussion format. The meeting began with a presentation about the hazard by Tim Walsh. The meeting con-tinued with a discussion of the Tokeland hazard map and potential berm, tower, and/or building locations. Two of the three meeting attendees were representatives from the local Shoalwater Bay Tribe. One was the tribal chairwoman and the other was the tribe’s emergency manager. The tribal representatives were very familiar with the hazard and have already worked on tribal plans to build a parking structure for the casino that could also serve as a vertical evacuation structure.
The comments and suggestions received:
• Tokeland’s winter population is 250 – 300
• Tokeland’s summer population is about 500• Future parking garage at casino• Mobility issues: use smaller walking circles
exclusively• Towers could be dual use: bird watching,
view, etc.• What about a rope to access steep hill near
Annex Road assembly area?• Tribe is the largest employer in Pacific County• Easternmost tower needs to hold 250 people.
Ultimately, a preliminary strategy emerged using towers and parking structures. Towers were a popular vertical evacuation type due to the small footprint and limited open space on the Tokeland Peninsula. The participants used the smaller walk-ing circles exclusively due to the high percentage of the population with walking limitations.
Tokeland/North Cove meeting 2: World Café and strengths and weaknesses evaluation
The second Tokeland/North Cove meeting was held on July 13th, 2010 at the Shoalwater Bay Tribal Complex in Tokeland. The location was changed in order to increase participation among local residents. The project team opened the meet-ing to the general public using local media outlets to advertise the meeting. The attempts to increase participation and interest in the project were suc-cessful as more than 25 local residents attended the
Tokeland/North CoveLocation Safe haven type
Eagle Hill Road Pacific County assembly area
Annex Drive Pacific County assembly area
Shoalwater Bay Casino Parking structure
Shoalwater Bay Tribal Complex Parking structure
Kindred Avenue (Nelson Crab) Tower
Tokeland Road & Evergreen Street Tower
Tokeland Road & Pine Lane Tower
SR 105 & Whipple Avenue Tower
SR 105 & Warrenton Cannery Road Tower
Table 9: Preferred strategy for Tokeland/North Cove
22 Project Safe Haven: Pacific County
meeting. Since the World Café was not possible at the first meeting, the project team took advantage of the larger number at the second meeting and conducted the World Café during the first part of the meeting. The participants were divided into four smaller groups. Two of the groups repre-sented Tokeland residents and two of the groups represented North Cove residents. Those attend-ing the meeting represented Tokeland and North Cove evenly.
The area of Tokeland/North Cove was divided into two areas for mapping purposes: Tokeland and North Cove. Each table group focused their efforts on thinking about potential berms, towers, and/or buildings in one of the two locations. Rather than rotating tables, like other World Café processes, the small groups only rotated once to the second table looking at the same community. Therefore, residents of North Cove only looked at North Cove and the same for Tokeland. The proj-ect team attempted to accomplish a combination of meeting 1 and meeting 2 in only one meeting. Ultimately, at the end of the second round consen-sus building was attempted and an analysis of the strengths and weaknesses of the consensus results was conducted in the second half of the meeting.
Tokeland/North Cove: Description of preferred strategy
Derived from resident input at meeting 2, the pre-ferred strategy for Tokeland/North Cove includes a series of towers, existing assembly areas, and potential future parking garages (see Table 9).
H. Community mulling and acceptance of preferred strategy
After the series of initial community meetings were complete, the project team allowed time for the community to mull over and accept the preferred community strategies. This period lasted from July to November. The mulling process provided opportunities for both formal and informal com-munity discussions about the preferred strategies. On September 25, 2010 the project team occupied
a booth at the Emergency Preparedness Fair that was held in Ocean Park. Preliminary strategies were presented to the general public in the form of brochures and community profiles. The prelimi-nary findings contributed to the community mull-ing process because it served as an educational component for residents who were unaware of the safe haven project
Pacific County ground-truthing trip
Over the summer, one project team member trav-eled to the study area in Pacific County to perform ground-truth research at the site level for each proposed vertical evacuation site. Additionally, walking volunteers were solicited to confirm the walking speed assumptions used throughout the project.
Information about the project and walking volun-teer opportunities was disseminated with the help of a local writer for the Chinook Observer. The team member had met with the local writer to discuss the project and the need for walking volunteers and a newspaper article emerged from the conser-vation and was published in the Chinook Observer. (See Appendix H for newspaper article.) Volunteers from all four communities participated in the study by walking from their home to the nearest proposed berm, tower, or buildings or assembly location and recording the time, distance, walk-ing path, age, and any potential obstructions. This particular component of the project was essential in encouraging discussion, acceptance and excite-ment about the project. Additionally, volunteers were encouraged to think about the limitations, reality, and necessity of evacuation on foot in the event of a near tsunami.
Site ground-truthing: berm/tower/building, assembly area, and high ground inspections
Overall, there were 36 sites to inspect in four communities. Each site was photo documented as well as significant attributes noted. Addition-ally, seemingly safe routes to natural high ground were noted throughout the area and mapped. It is
Project Safe Haven: Pacific County 23
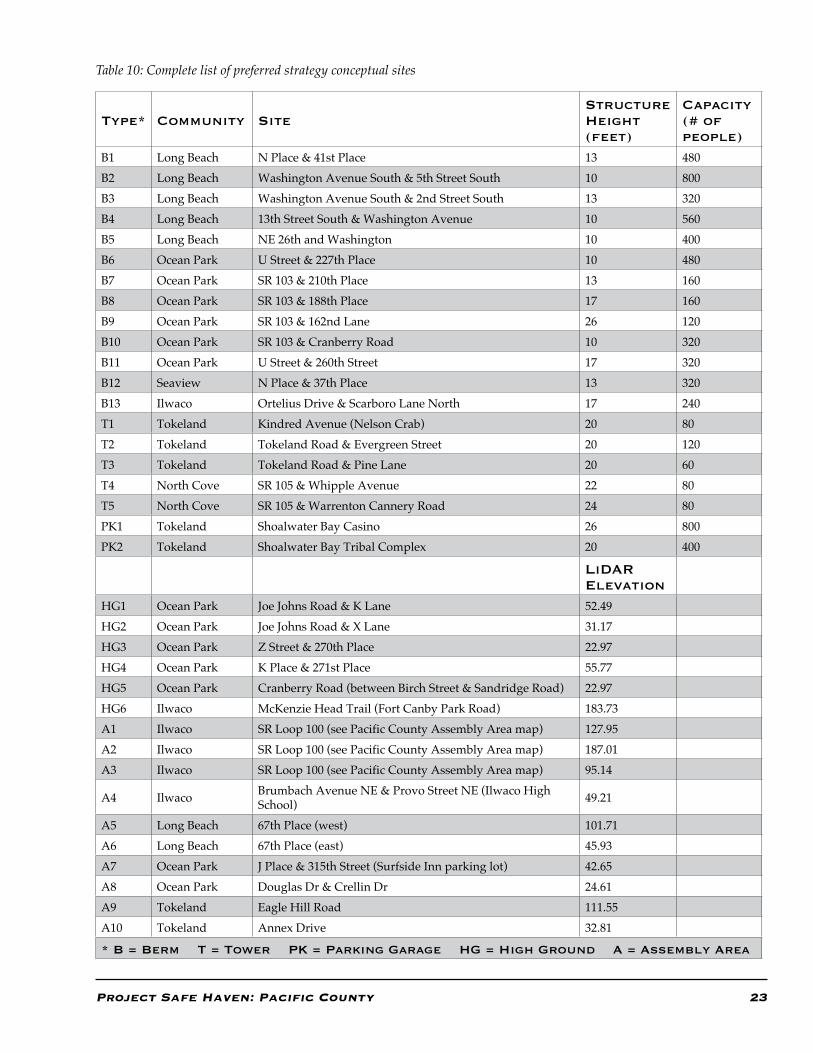
Table 10: Complete list of preferred strategy conceptual sites
Type* Community SiteStructure Height (feet)
Capacity (# of people)
B1 Long Beach N Place & 41st Place 13 480B2 Long Beach Washington Avenue South & 5th Street South 10 800B3 Long Beach Washington Avenue South & 2nd Street South 13 320B4 Long Beach 13th Street South & Washington Avenue 10 560B5 Long Beach NE 26th and Washington 10 400B6 Ocean Park U Street & 227th Place 10 480B7 Ocean Park SR 103 & 210th Place 13 160B8 Ocean Park SR 103 & 188th Place 17 160B9 Ocean Park SR 103 & 162nd Lane 26 120B10 Ocean Park SR 103 & Cranberry Road 10 320B11 Ocean Park U Street & 260th Street 17 320B12 Seaview N Place & 37th Place 13 320B13 Ilwaco Ortelius Drive & Scarboro Lane North 17 240T1 Tokeland Kindred Avenue (Nelson Crab) 20 80T2 Tokeland Tokeland Road & Evergreen Street 20 120T3 Tokeland Tokeland Road & Pine Lane 20 60T4 North Cove SR 105 & Whipple Avenue 22 80T5 North Cove SR 105 & Warrenton Cannery Road 24 80PK1 Tokeland Shoalwater Bay Casino 26 800PK2 Tokeland Shoalwater Bay Tribal Complex 20 400
LiDAR Elevation
HG1 Ocean Park Joe Johns Road & K Lane 52.49HG2 Ocean Park Joe Johns Road & X Lane 31.17HG3 Ocean Park Z Street & 270th Place 22.97HG4 Ocean Park K Place & 271st Place 55.77HG5 Ocean Park Cranberry Road (between Birch Street & Sandridge Road) 22.97HG6 Ilwaco McKenzie Head Trail (Fort Canby Park Road) 183.73A1 Ilwaco SR Loop 100 (see Pacific County Assembly Area map) 127.95A2 Ilwaco SR Loop 100 (see Pacific County Assembly Area map) 187.01A3 Ilwaco SR Loop 100 (see Pacific County Assembly Area map) 95.14
A4 Ilwaco Brumbach Avenue NE & Provo Street NE (Ilwaco High School) 49.21
A5 Long Beach 67th Place (west) 101.71A6 Long Beach 67th Place (east) 45.93A7 Ocean Park J Place & 315th Street (Surfside Inn parking lot) 42.65A8 Ocean Park Douglas Dr & Crellin Dr 24.61A9 Tokeland Eagle Hill Road 111.55A10 Tokeland Annex Drive 32.81
* B = Berm T = Tower PK = Parking Garage HG = High Ground A = Assembly Area
24 Project Safe Haven: Pacific County
important to note that these sites are conceptual locations only, not proposed locations. Particular parcels have not been selected as of yet. The pref-erence is to find publicly owned parcels; however if not available, then potential willing property owners will be identified. If private parcels were used, the process would include assembling multi-ple parcels and negotiating with property owners. (See Appendix I for complete site analysis.) Community volunteers were solicited to assist with confirmation of the assumed walking speeds of an average pedestrian speed and a below average pedestrian speed. Volunteers walked from either their home or workplace to the nearest proposed vertical evacuation structure or designated high ground to confirm walking times and to identify potential barriers. Walking worksheets were filled out by each volunteer and submitted to the Project team for analysis. Resident walking volunteers along with a couple of Project team members suc-cessfully confirmed the assumed walking speeds based on walking ability: 3,600 feet per 15 minutes and 2,700 feet per 15 minutes. (See Appendix J for walking volunteer results.)After the ground-truthing trip was completed and the community given time to mull, the project team reconvened to analyze data and create the final strategy to be presented at the countywide meet-ings. In order to create the final strategy, the team utilized new LiDAR elevation data in combination with wave height data for each conceptual site. Each conceptual site was designated berm, tower, parking structure, high ground, or assembly area. Some proposed berm locations were changed to high ground to reflect the LiDAR elevation data. In conclusion, based on the LiDAR and wave height data the team’s final strategy included final conceptual sites.Final conceptual sites
The final conceptual sites were derived from the community participation processes with guidance from the project team (see Table 10). The sites and strategies were confirmed during the community mulling process and ground-truthing trip (see
Figures 10 through 14). The maps were presented at the countywide meetings along with estimated capacities for each vertical evacuation site or struc-ture. (See Appendix N for structure calculations.)I. Reassessment of preferred strategy: Countywide meetings
Two countywide meetings were held during November 2010. Both meetings were open to the general public, including those who were not familiar with Project Safe Haven. One meeting was held in Tokeland for the Tokeland/North Cove area residents. One meeting was held in Seaview for the Long Beach peninsula residents. The purpose of the countywide meetings was to present information about the community’s pre-ferred strategies, further educate residents about the hazard, and present information about vertical evacuation structure estimated costs. Additionally, we asked meeting attendees to fill out a survey to indicate their level of knowledge about tsunamis in general and to provide the project team with feedback about the meeting itself. The meetings operated in an open house style with four stations: Tsunami Hazard, Vertical Evacu-ation, Community Strategies, and Community Design. The meeting did not have an official open-ing or closing. Rather, meeting attendees were allowed to come and go at any point during the two-hour allotted meeting time. Each station used a combination of maps to display the community strategies or tsunami hazard and educational brochures to represent the process of the project in Pacific County and to inform residents about vertical evacuation. Project team members were located at all four stations and interacted with local residents throughout the open house by answer-ing questions and explaining the process and pur-pose of Project Safe Haven. As the residents left the meeting they were asked to fill out a survey about the meeting and their overall understanding of the tsunami risk. Additionally, they were asked to vote for their top two conceptual locations to prioritize for future planning efforts, those loca-tions that are most needed or most important in their opinion.
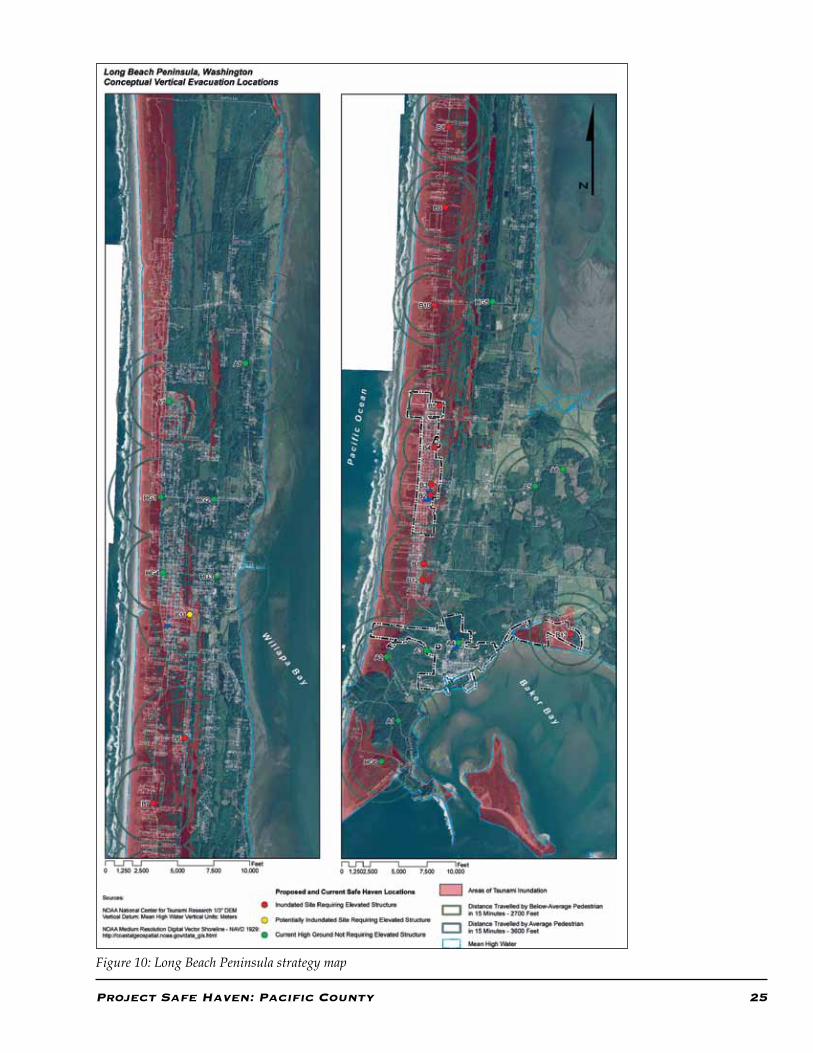
Project Safe Haven: Pacific County 25
Figure 10: Long Beach Peninsula strategy map
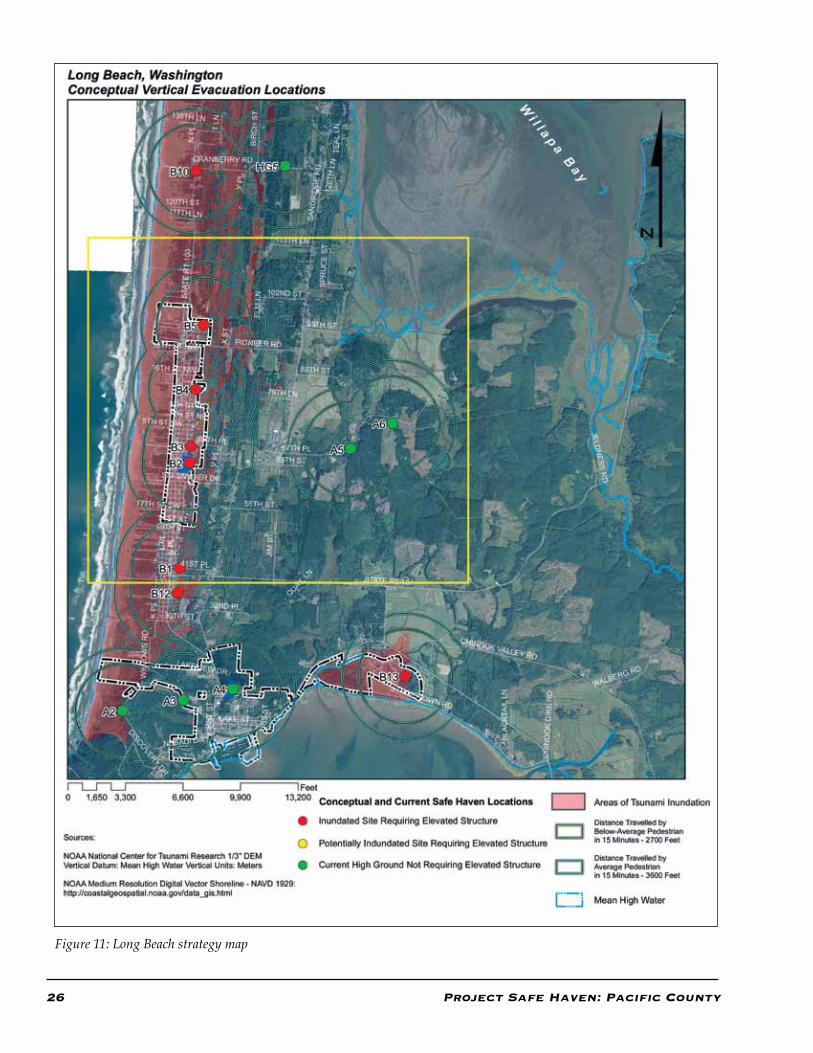
26 Project Safe Haven: Pacific County
Figure 11: Long Beach strategy map
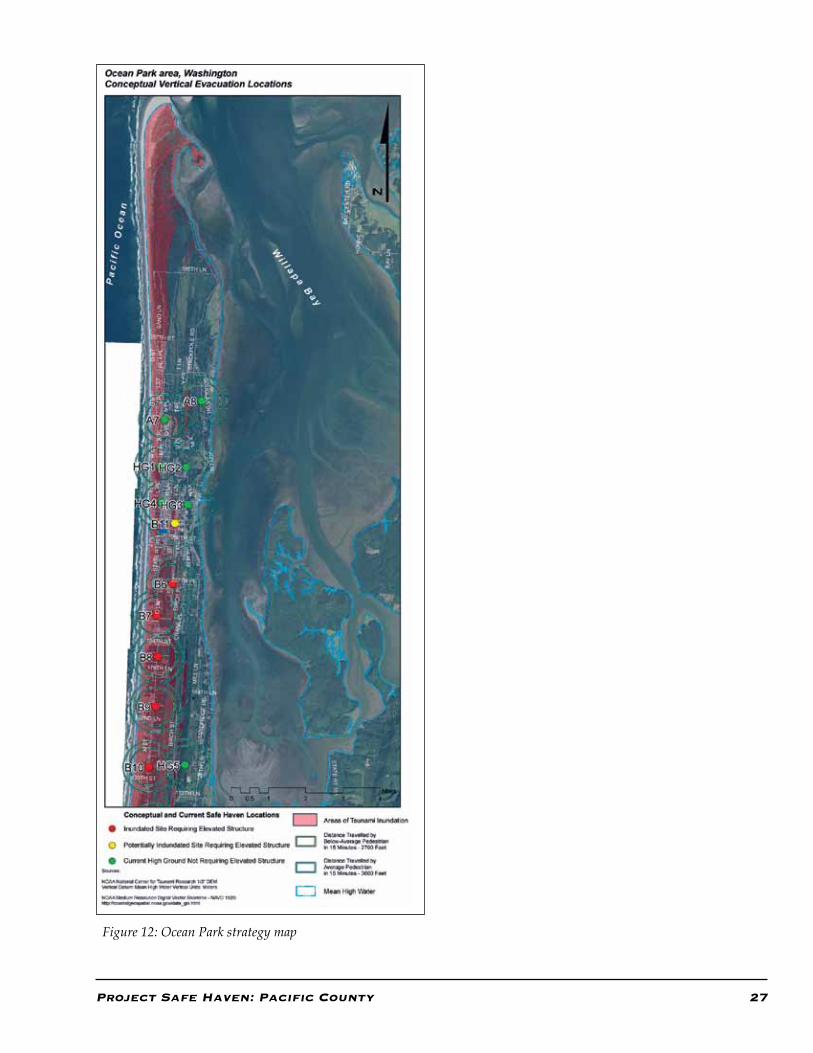
Project Safe Haven: Pacific County 27
Figure 12: Ocean Park strategy map
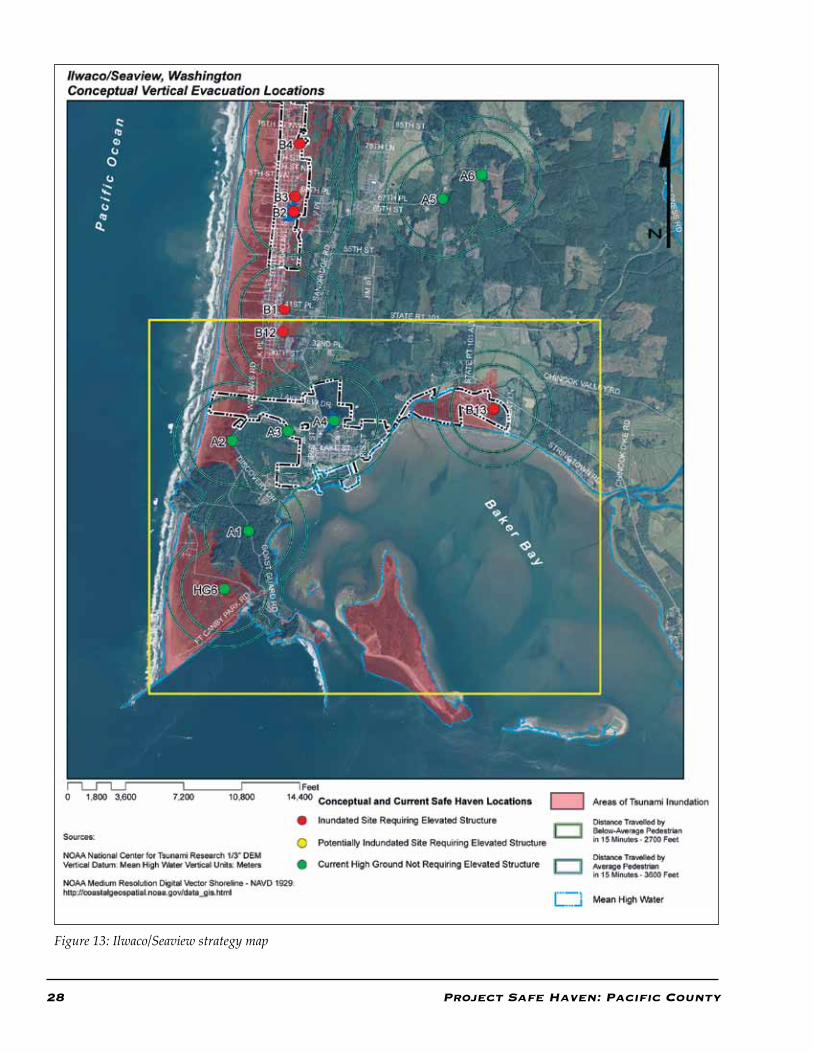
28 Project Safe Haven: Pacific County
Figure 13: Ilwaco/Seaview strategy map
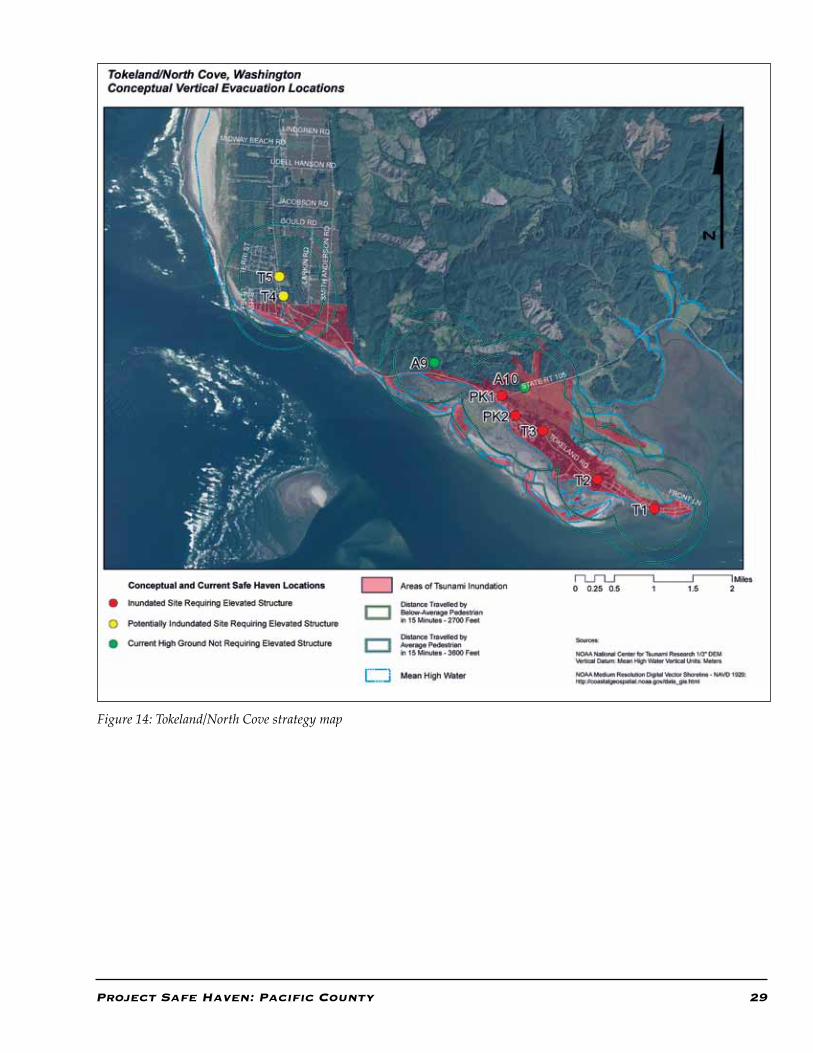
Project Safe Haven: Pacific County 29
Figure 14: Tokeland/North Cove strategy map

30 Project Safe Haven: Pacific County
Results
The results from the two countywide meetings took the form of survey responses, voting for top two preferred vertical evacuation sites and general impressions of the successes and potential short-comings of the meetings.
Survey responses
Participants were asked to fill out a survey at each countywide meeting to provide feedback to the project team about the meeting itself, participant’s knowledge of tsunamis, final strategy and concep-tual sites, and likelihood of implementation. Over-all, most of the respondents had an average knowl-edge of tsunamis before attending the meeting and recorded an increase in knowledge as they exited. Almost all respondents appreciated the format of the meeting using thematic stations but only about half agreed fully with the proposed strategy. (See Appendix K for complete survey responses.)
Site voting results
The project team requested meeting attendees to vote, with sticky dots, for their top two favorite or deemed most important vertical evacuation structure locations. The voting only took place at the Seaview meeting on the Long Beach Peninsula. The results reflect the interests of the attendees. In the future, decision makers will take their prefer-ences into consideration as well as consider which conceptual vertical evacuation locations are the best for the community. (See Appendix L for voting results.)
Successes and shortcomings
The open house meeting method was selected for the countywide meetings because it cre-ates a casual, non-threatening, atmosphere and facilitates discussion amongst all participants. Although a good deal of discussion took place, the meeting may have been too casual for some par-ticipants, without enough structure. This potential shortcoming was recognized at the first county-wide meeting in Tokeland. As a result, the project team adjusted the meeting structure for the second
countywide meeting in Seaview. The purpose and format of the meeting was better communicated to meeting participants through the use of an agenda that explained the general idea of each station. Another adjustment was to decrease the number of handouts at each station. At the Tokeland meet-ing the number of handouts at each station ranged from one to three. At the Seaview meeting the number of handouts at each station was limited to one and in some cases two.
J. Community design charrettes
During phase six, community members worked hand-in-hand with urban design faculty and stu-dents from the University of Washington, Depart-ment of Urban Design and Planning, to determine options for integration of pioneering vertical evacuation structures into the communities’ exist-ing and new built form. Community members assisted the team in generating ideas for alterna-tive community-benefit uses as well as designs for the vertical evacuation structures that fit the needs and desire of the local community; while provid-ing a safe and effective haven for tsunami vertical evacuation.
The design process builds upon the vertical evacu-ation strategies developed in previous meetings. General locations and structure types were deter-mined based on an interactive community process. The preferred strategy represents selected sites, necessary site capacities, recommended minimum vertical heights to avoid inundation, and structure type preferences.
Safe haven design charrette process
A charrette is a product driven intensive design process guided by community input on verti-cal evacuation structure design and alternative uses. Through a series of exercises, design team interpretations and explorations, and discus-sions, community members guide and critique the design process. Their ideas are interpreted and illustrated by urban designers from the University of Washington and cycled back to the community for approval and modification. The products of the
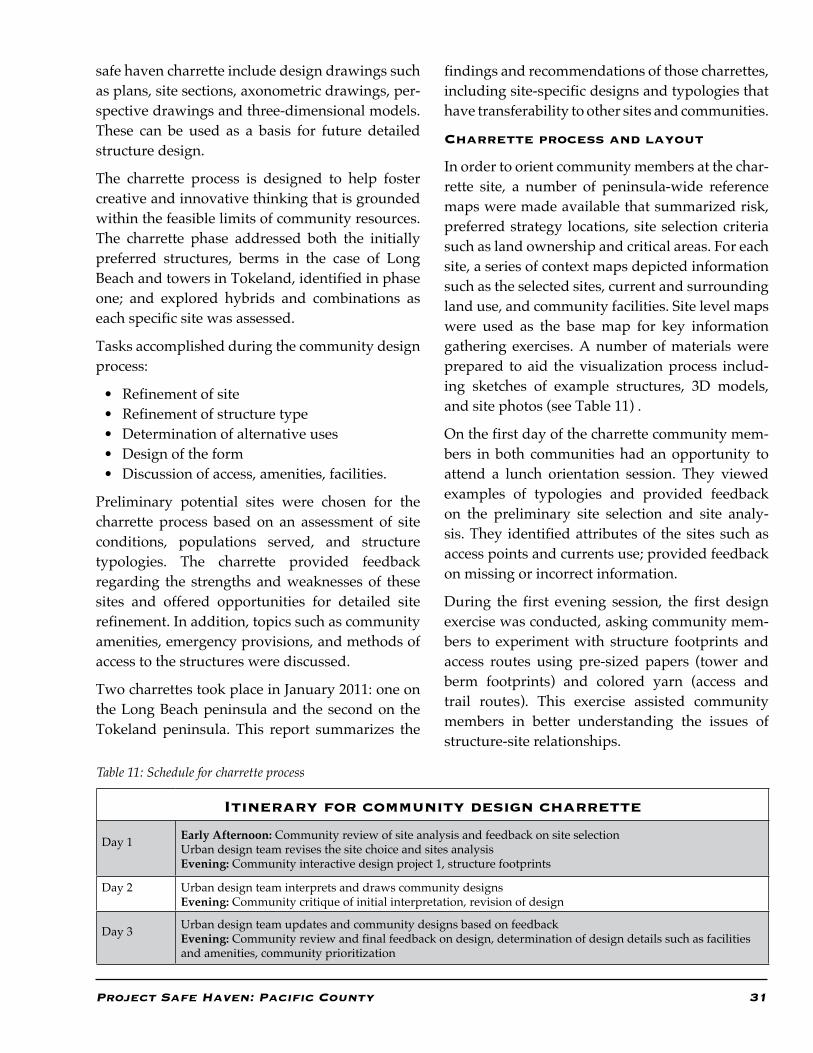
Project Safe Haven: Pacific County 31
safe haven charrette include design drawings such as plans, site sections, axonometric drawings, per-spective drawings and three-dimensional models. These can be used as a basis for future detailed structure design.
The charrette process is designed to help foster creative and innovative thinking that is grounded within the feasible limits of community resources. The charrette phase addressed both the initially preferred structures, berms in the case of Long Beach and towers in Tokeland, identified in phase one; and explored hybrids and combinations as each specific site was assessed.
Tasks accomplished during the community design process:
• Refinement of site• Refinement of structure type• Determination of alternative uses• Design of the form• Discussion of access, amenities, facilities.
Preliminary potential sites were chosen for the charrette process based on an assessment of site conditions, populations served, and structure typologies. The charrette provided feedback regarding the strengths and weaknesses of these sites and offered opportunities for detailed site refinement. In addition, topics such as community amenities, emergency provisions, and methods of access to the structures were discussed.
Two charrettes took place in January 2011: one on the Long Beach peninsula and the second on the Tokeland peninsula. This report summarizes the
findings and recommendations of those charrettes, including site-specific designs and typologies that have transferability to other sites and communities.
Charrette process and layout
In order to orient community members at the char-rette site, a number of peninsula-wide reference maps were made available that summarized risk, preferred strategy locations, site selection criteria such as land ownership and critical areas. For each site, a series of context maps depicted information such as the selected sites, current and surrounding land use, and community facilities. Site level maps were used as the base map for key information gathering exercises. A number of materials were prepared to aid the visualization process includ-ing sketches of example structures, 3D models, and site photos (see Table 11) .
On the first day of the charrette community mem-bers in both communities had an opportunity to attend a lunch orientation session. They viewed examples of typologies and provided feedback on the preliminary site selection and site analy-sis. They identified attributes of the sites such as access points and currents use; provided feedback on missing or incorrect information.
During the first evening session, the first design exercise was conducted, asking community mem-bers to experiment with structure footprints and access routes using pre-sized papers (tower and berm footprints) and colored yarn (access and trail routes). This exercise assisted community members in better understanding the issues of structure-site relationships.
Itinerary for community design charrette
Day 1 Early Afternoon: Community review of site analysis and feedback on site selection Urban design team revises the site choice and sites analysisEvening: Community interactive design project 1, structure footprints
Day 2 Urban design team interprets and draws community designs Evening: Community critique of initial interpretation, revision of design
Day 3 Urban design team updates and community designs based on feedbackEvening: Community review and final feedback on design, determination of design details such as facilities and amenities, community prioritization
Table 11: Schedule for charrette process
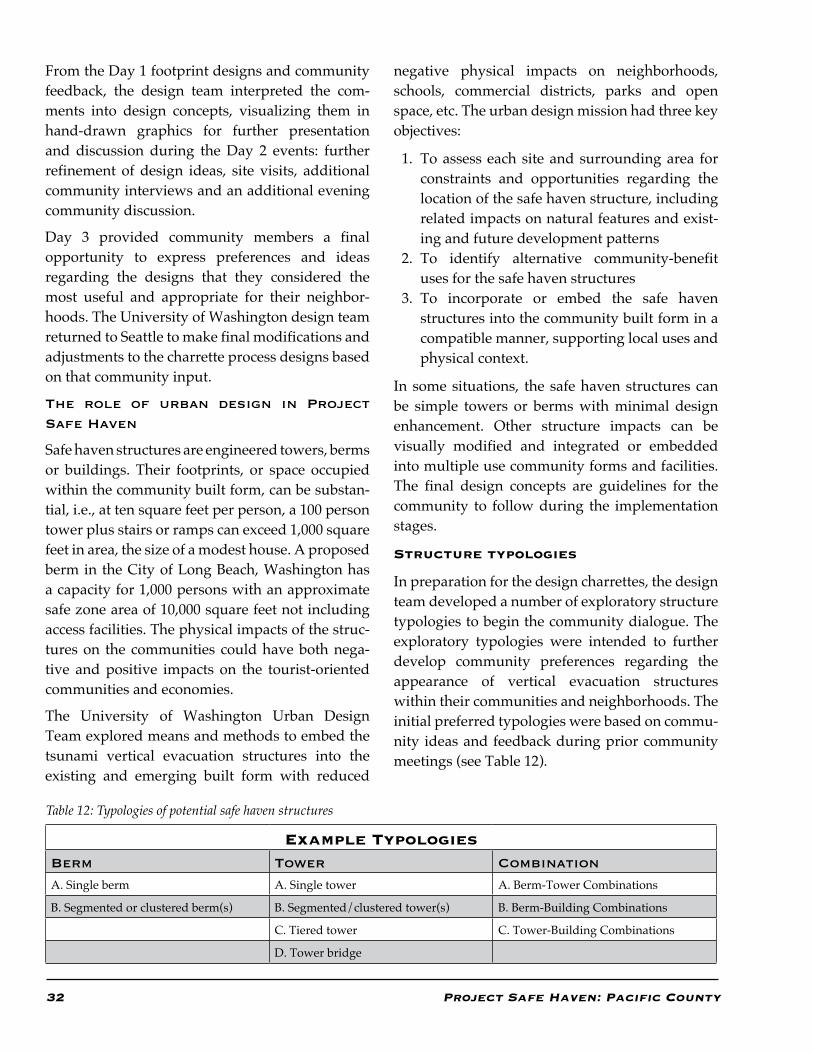
32 Project Safe Haven: Pacific County
From the Day 1 footprint designs and community feedback, the design team interpreted the com-ments into design concepts, visualizing them in hand-drawn graphics for further presentation and discussion during the Day 2 events: further refinement of design ideas, site visits, additional community interviews and an additional evening community discussion.
Day 3 provided community members a final opportunity to express preferences and ideas regarding the designs that they considered the most useful and appropriate for their neighbor-hoods. The University of Washington design team returned to Seattle to make final modifications and adjustments to the charrette process designs based on that community input.
The role of urban design in Project Safe Haven
Safe haven structures are engineered towers, berms or buildings. Their footprints, or space occupied within the community built form, can be substan-tial, i.e., at ten square feet per person, a 100 person tower plus stairs or ramps can exceed 1,000 square feet in area, the size of a modest house. A proposed berm in the City of Long Beach, Washington has a capacity for 1,000 persons with an approximate safe zone area of 10,000 square feet not including access facilities. The physical impacts of the struc-tures on the communities could have both nega-tive and positive impacts on the tourist-oriented communities and economies.
The University of Washington Urban Design Team explored means and methods to embed the tsunami vertical evacuation structures into the existing and emerging built form with reduced
Example TypologiesBerm Tower Combination
A. Single berm A. Single tower A. Berm-Tower Combinations
B. Segmented or clustered berm(s) B. Segmented/clustered tower(s) B. Berm-Building Combinations
C. Tiered tower C. Tower-Building Combinations
D. Tower bridge
Table 12: Typologies of potential safe haven structures
negative physical impacts on neighborhoods, schools, commercial districts, parks and open space, etc. The urban design mission had three key objectives:
1. To assess each site and surrounding area for constraints and opportunities regarding the location of the safe haven structure, including related impacts on natural features and exist-ing and future development patterns
2. To identify alternative community-benefit uses for the safe haven structures
3. To incorporate or embed the safe haven structures into the community built form in a compatible manner, supporting local uses and physical context.
In some situations, the safe haven structures can be simple towers or berms with minimal design enhancement. Other structure impacts can be visually modified and integrated or embedded into multiple use community forms and facilities. The final design concepts are guidelines for the community to follow during the implementation stages.
Structure typologies
In preparation for the design charrettes, the design team developed a number of exploratory structure typologies to begin the community dialogue. The exploratory typologies were intended to further develop community preferences regarding the appearance of vertical evacuation structures within their communities and neighborhoods. The initial preferred typologies were based on commu-nity ideas and feedback during prior community meetings (see Table 12).
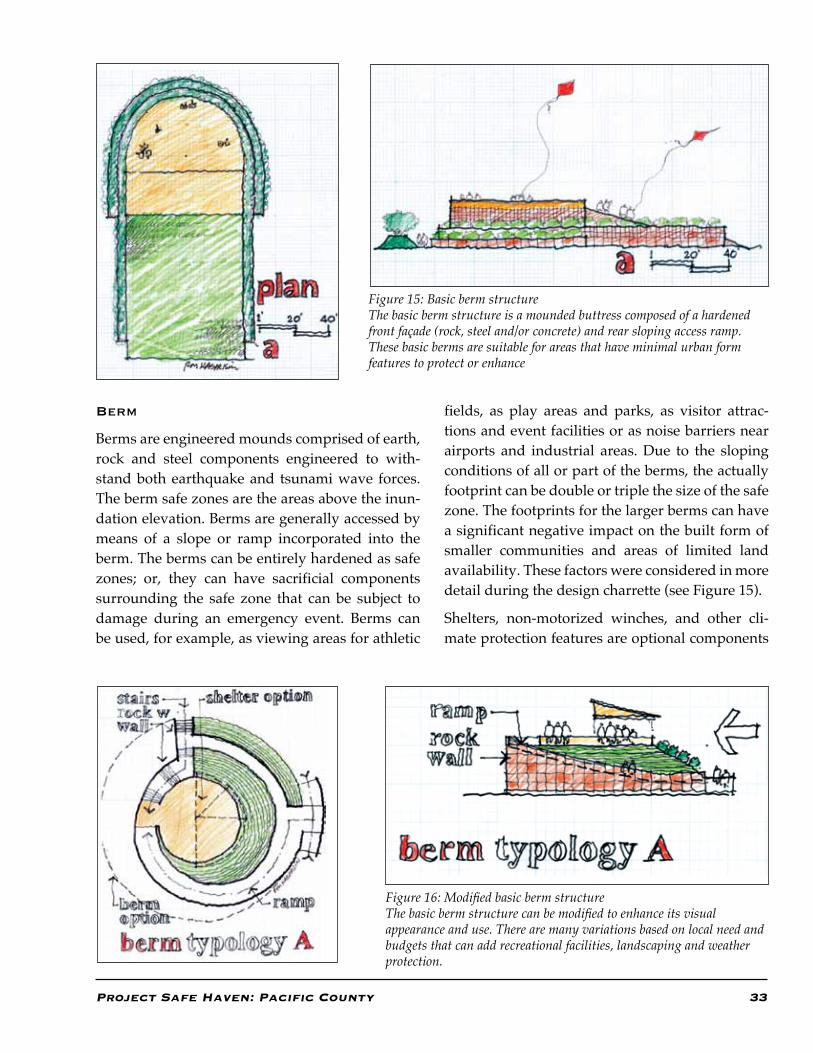
Project Safe Haven: Pacific County 33
Berm
Berms are engineered mounds comprised of earth, rock and steel components engineered to with-stand both earthquake and tsunami wave forces. The berm safe zones are the areas above the inun-dation elevation. Berms are generally accessed by means of a slope or ramp incorporated into the berm. The berms can be entirely hardened as safe zones; or, they can have sacrificial components surrounding the safe zone that can be subject to damage during an emergency event. Berms can be used, for example, as viewing areas for athletic
fields, as play areas and parks, as visitor attrac-tions and event facilities or as noise barriers near airports and industrial areas. Due to the sloping conditions of all or part of the berms, the actually footprint can be double or triple the size of the safe zone. The footprints for the larger berms can have a significant negative impact on the built form of smaller communities and areas of limited land availability. These factors were considered in more detail during the design charrette (see Figure 15).
Shelters, non-motorized winches, and other cli-mate protection features are optional components
Figure 15: Basic berm structureThe basic berm structure is a mounded buttress composed of a hardened front façade (rock, steel and/or concrete) and rear sloping access ramp. These basic berms are suitable for areas that have minimal urban form features to protect or enhance
Figure 16: Modified basic berm structureThe basic berm structure can be modified to enhance its visual appearance and use. There are many variations based on local need and budgets that can add recreational facilities, landscaping and weather protection.
34 Project Safe Haven: Pacific County
and can serve as community amenities for every-day use. Bathroom facilities and storage facilities for basic supplies such as water, medical supplies, and tarps are additional options to be considered (see Figure 16).
Berm typology A: single Berm
Single berms have one primary safe zone at the top elevation with access provided by ramps, land-scaped slopes and/or stairs. Alternate uses vary according to location and context. Single berms can be more effective in reducing negative visual urban design impacts when sufficient land area is provided for the base footprint. They are less suited for smaller built-up urban sites. The design of individual berms can incorporate numerous features to improve compatibility with the sur-rounding area including landscape features and natural features such as wetlands, ponds, etc.; and formal forms as sculpted mounds or pyramids.
Berm typology B: segmented/clustered Berm(s)
Segmented berms are separated berms, possibly clustered, that disperse safe zones within a given site to reduce the size of the berm-form footprint; or to adapt to site-specific form-functions. Seg-mented berm safe zones can be connected via pedestrian bridges, ramps, stairs, and safe haven towers. These berms are best suited for larger open space areas such as athletic facilities, farms, golf courses and undeveloped open space.
Figure 17: Basic tower structureA basic tower structure is a horizontal platform elevated above inundation levels by vertical supports. The at-grade level is open and can have additional rock or concrete barriers to break up wave-born debris. A “bare-bones”tower, essentially 40 feet square (200 person capacity) for example is a steel structure with a footprint of approximately 1,600 sf minimum.
Towers
Towers are elevated safe zone platforms supported by vertical structural members. The platforms can be freestanding in geometries such as a square, rectangle, circle, and other geometric shapes depending upon local use and context. They gen-erally have open ground level areas, uncovered or covered platforms with safety fencing. Towers can be used for a variety of functions including visitor centers, in which the at-grade level acts as sacrifi-cial office, display areas or viewing platforms for scenic and/or wildlife areas, in conjunction with community water towers (see Figure 17).
Towers have a smaller footprint than berms for the same number of people. Access to tower structures can be restrictive to physically challenged and aged people if ramps are not included. A berm/tower combination typology has been developed to address limited mobility concerns. The provision of shelters and emergency facilities are optional.
tower typology A: single tower
Single towers may be the most appropriate struc-ture for less costly safe havens where alternative uses are not feasible and/or land is limited. Alter-native uses for towers and at-grade floor area can be accommodated as open space or with sacrificial uses such as shops, information booths, storage areas, etc. Towers can be accessed by stairs, ramps, and mechanical vertical assists in non-emergency
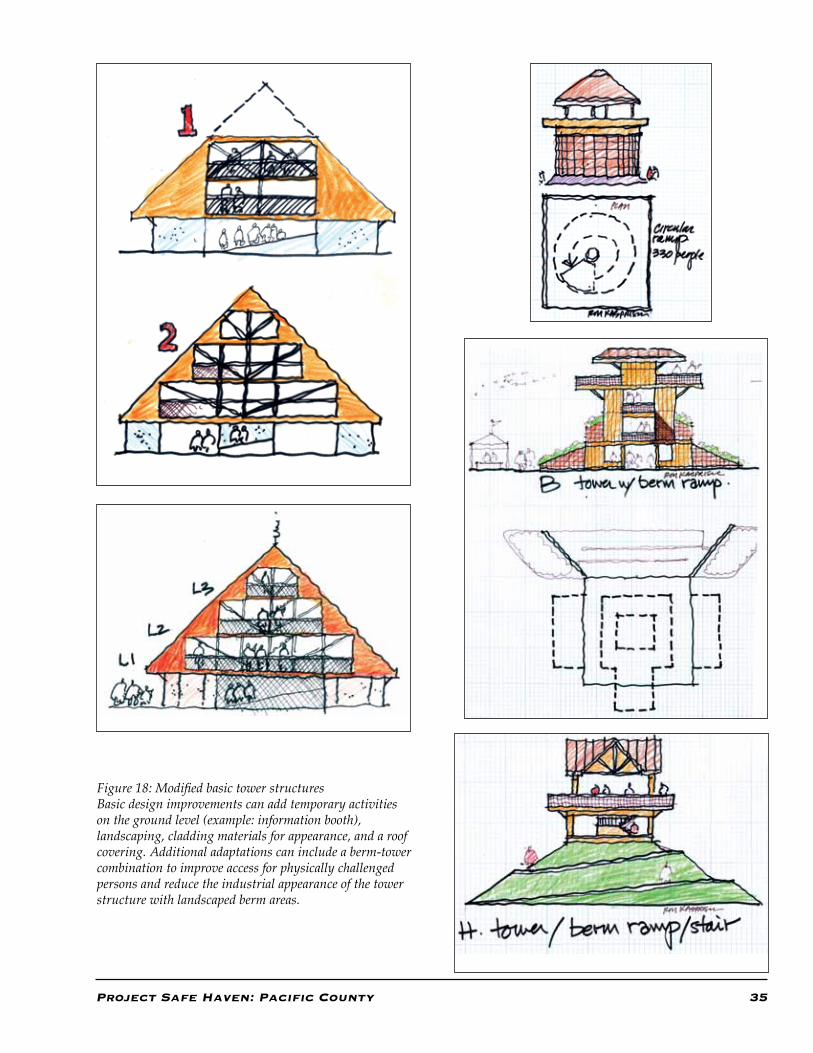
Project Safe Haven: Pacific County 35
Figure 18: Modified basic tower structuresBasic design improvements can add temporary activities on the ground level (example: information booth), landscaping, cladding materials for appearance, and a roof covering. Additional adaptations can include a berm-tower combination to improve access for physically challenged persons and reduce the industrial appearance of the tower structure with landscaped berm areas.
36 Project Safe Haven: Pacific County
situations; and, manual vertical assists (winches, etc.), for emergency events (Figure 18).
tower typology B: modulAr tower
Modular towers break the estimated tower size into smaller components. These towers are ideal for phased construction or to spread out the aus-tere impacts of larger towers; and are appropriate where small pockets of land are available as scat-tered parcels throughout a community or where access within the walking radius is restricted due to physical barriers. They can either be segmented or clustered and contain multiple safe haven platforms within a given project site. In order to enhance integration into the desired built form the tower levels can be at varying heights, separate or connected by pedestrian bridges for shared access facilities. Where appropriate they can also be incor-porated into or surrounding existing buildings.
tower typology c: clustered towers
Similar to segmented towers, clustered towers allow for many freestanding smaller platforms scattered across a number of sites within a given area. Clustered towers reduce the impact of large safe haven areas on a small-scale urban form. This type of tower may be appropriate where only small pockets of land are available as scattered parcels throughout a community or where access within the walking circle is restricted due to barriers.
tower typology d: tiered towers
Tiered towers can reduce the size of the safe zone imprint on smaller site areas by stacking safe zones vertically on a number of levels. The lowest platform level exceeds the minimum inundation elevation. Upper tiers can be available for physi-cally able persons accessed by stairs or ladders.
tower typology e: tower Bridge
A tower bridge structure connects two or more areas that may or may not be safe zones (such as play berms). These areas can include, for example, two or more safe havens, as in the segmented berm
or segmented towers, as a pedestrian overpass in congested areas, as water course crossings, or as a connection between free-standing building con-nections. The tower bridge can either be affixed to two structures designed to withstand earthquake and tsunami forces or can have an independent support structure.
Combinations
There are a number of design alternatives that offer hybridized combinations of towers and berms. The combinations offer an opportunity to capitalize on the best components of each structure type within the given physical context. For example, ramp-berms can provide access to tower structures if space permits, increasing access capabilities for physically challenged persons.
Berm-tower comBinAtions
Berm-tower combinations present opportunities to reduce the physical and visual impacts of larger tower structures with partial or complete sacrifi-cial berm amendments. They also can reduce the overall footprint for a large berm structure.
Berm-Building comBinAtions
Berms can be combined with new building struc-tures in certain situations. The berm acts to pro-vide a design element that can soften or reduce building mass and provide sloped access to build-ing roofs and other safe zones. Examples include parking garages, industrial buildings, pedestrian overpasses, etc.
tower-Building comBinAtions
Tower structures can be incorporated into new building structures to provide safe zones and reduce the construction costs of safe-zone-hard-ening the entire building. Examples include entry-ways-lobby areas, stair towers, office components, etc.
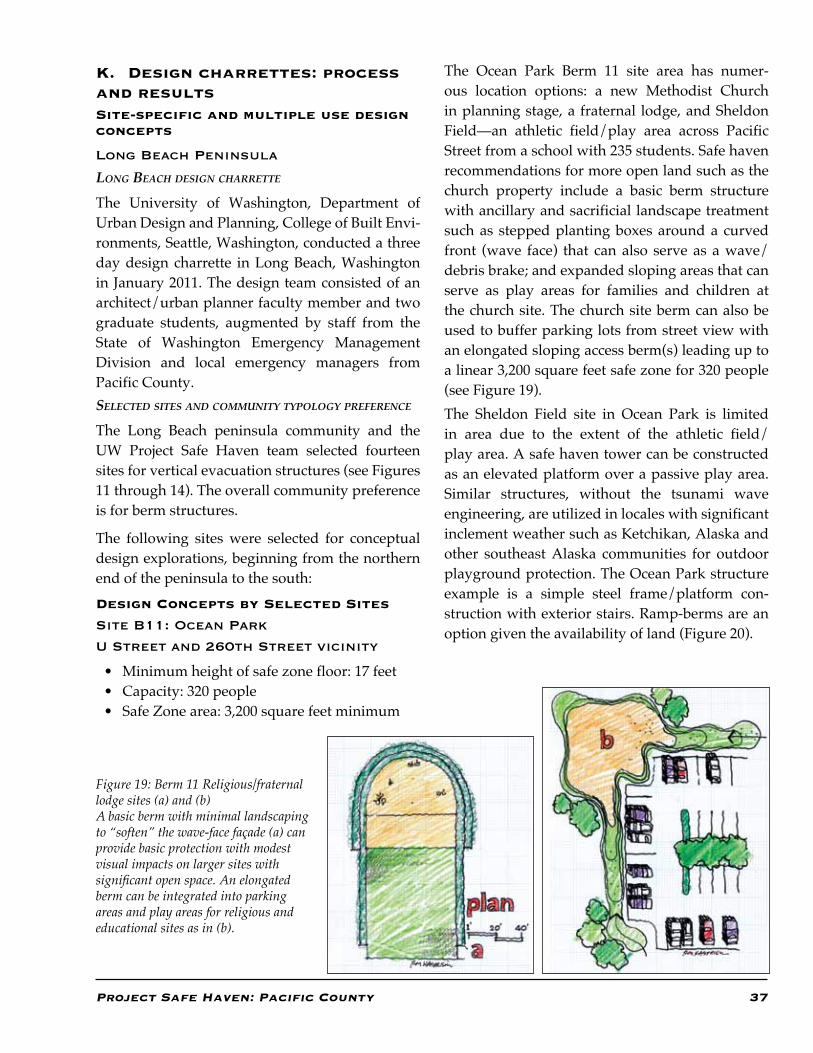
Project Safe Haven: Pacific County 37
K. Design charrettes: process and resultsSite-specific and multiple use design concepts
Long Beach Peninsula
lOng beach design charrette
The University of Washington, Department of Urban Design and Planning, College of Built Envi-ronments, Seattle, Washington, conducted a three day design charrette in Long Beach, Washington in January 2011. The design team consisted of an architect/urban planner faculty member and two graduate students, augmented by staff from the State of Washington Emergency Management Division and local emergency managers from Pacific County.selected sites and cOmmunity tyPOlOgy Preference
The Long Beach peninsula community and the UW Project Safe Haven team selected fourteen sites for vertical evacuation structures (see Figures 11 through 14). The overall community preference is for berm structures.
The following sites were selected for conceptual design explorations, beginning from the northern end of the peninsula to the south:Design Concepts by Selected Sites
Site B11: Ocean Park
U Street and 260th Street vicinity
• Minimum height of safe zone floor: 17 feet• Capacity: 320 people• Safe Zone area: 3,200 square feet minimum
The Ocean Park Berm 11 site area has numer-ous location options: a new Methodist Church in planning stage, a fraternal lodge, and Sheldon Field—an athletic field/play area across Pacific Street from a school with 235 students. Safe haven recommendations for more open land such as the church property include a basic berm structure with ancillary and sacrificial landscape treatment such as stepped planting boxes around a curved front (wave face) that can also serve as a wave/debris brake; and expanded sloping areas that can serve as play areas for families and children at the church site. The church site berm can also be used to buffer parking lots from street view with an elongated sloping access berm(s) leading up to a linear 3,200 square feet safe zone for 320 people (see Figure 19).The Sheldon Field site in Ocean Park is limited in area due to the extent of the athletic field/play area. A safe haven tower can be constructed as an elevated platform over a passive play area. Similar structures, without the tsunami wave engineering, are utilized in locales with significant inclement weather such as Ketchikan, Alaska and other southeast Alaska communities for outdoor playground protection. The Ocean Park structure example is a simple steel frame/platform con-struction with exterior stairs. Ramp-berms are an option given the availability of land (Figure 20).
Figure 19: Berm 11 Religious/fraternal lodge sites (a) and (b) A basic berm with minimal landscaping to “soften” the wave-face façade (a) can provide basic protection with modest visual impacts on larger sites with significant open space. An elongated berm can be integrated into parking areas and play areas for religious and educational sites as in (b).
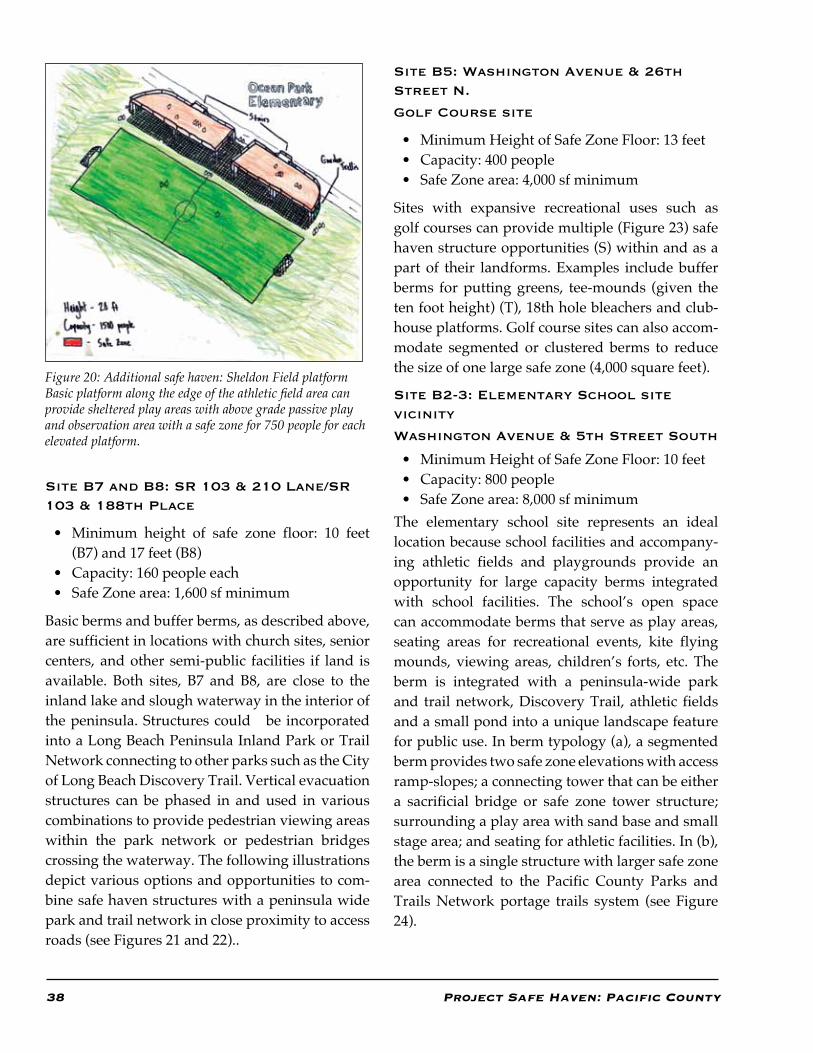
38 Project Safe Haven: Pacific County
Figure 20: Additional safe haven: Sheldon Field platformBasic platform along the edge of the athletic field area can provide sheltered play areas with above grade passive play and observation area with a safe zone for 750 people for each elevated platform.
Site B7 and B8: SR 103 & 210 Lane/SR 103 & 188th Place
• Minimum height of safe zone floor: 10 feet (B7) and 17 feet (B8)
• Capacity: 160 people each• Safe Zone area: 1,600 sf minimum
Basic berms and buffer berms, as described above, are sufficient in locations with church sites, senior centers, and other semi-public facilities if land is available. Both sites, B7 and B8, are close to the inland lake and slough waterway in the interior of the peninsula. Structures could be incorporated into a Long Beach Peninsula Inland Park or Trail Network connecting to other parks such as the City of Long Beach Discovery Trail. Vertical evacuation structures can be phased in and used in various combinations to provide pedestrian viewing areas within the park network or pedestrian bridges crossing the waterway. The following illustrations depict various options and opportunities to com-bine safe haven structures with a peninsula wide park and trail network in close proximity to access roads (see Figures 21 and 22)..
Site B5: Washington Avenue & 26th Street N.
Golf Course site
• Minimum Height of Safe Zone Floor: 13 feet• Capacity: 400 people• Safe Zone area: 4,000 sf minimum
Sites with expansive recreational uses such as golf courses can provide multiple (Figure 23) safe haven structure opportunities (S) within and as a part of their landforms. Examples include buffer berms for putting greens, tee-mounds (given the ten foot height) (T), 18th hole bleachers and club-house platforms. Golf course sites can also accom-modate segmented or clustered berms to reduce the size of one large safe zone (4,000 square feet).
Site B2-3: Elementary School site vicinity
Washington Avenue & 5th Street South
• Minimum Height of Safe Zone Floor: 10 feet• Capacity: 800 people• Safe Zone area: 8,000 sf minimum
The elementary school site represents an ideal location because school facilities and accompany-ing athletic fields and playgrounds provide an opportunity for large capacity berms integrated with school facilities. The school’s open space can accommodate berms that serve as play areas, seating areas for recreational events, kite flying mounds, viewing areas, children’s forts, etc. The berm is integrated with a peninsula-wide park and trail network, Discovery Trail, athletic fields and a small pond into a unique landscape feature for public use. In berm typology (a), a segmented berm provides two safe zone elevations with access ramp-slopes; a connecting tower that can be either a sacrificial bridge or safe zone tower structure; surrounding a play area with sand base and small stage area; and seating for athletic facilities. In (b), the berm is a single structure with larger safe zone area connected to the Pacific County Parks and Trails Network portage trails system (see Figure 24).
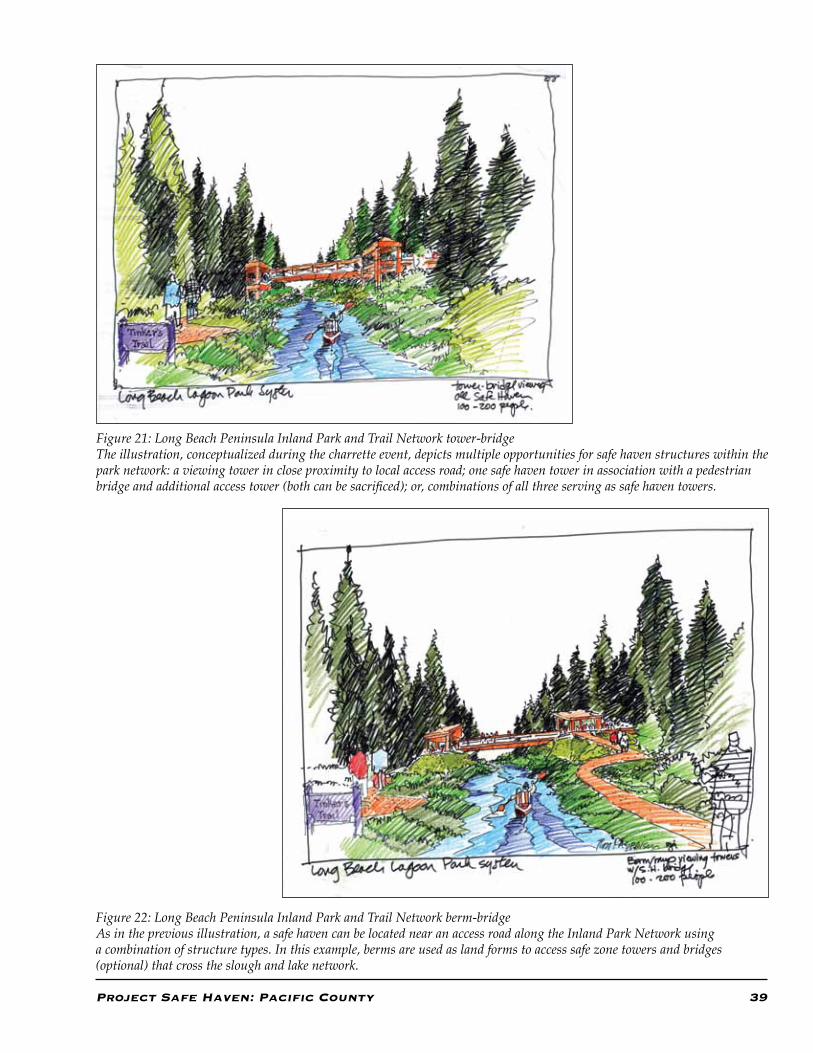
Project Safe Haven: Pacific County 39
Figure 21: Long Beach Peninsula Inland Park and Trail Network tower-bridgeThe illustration, conceptualized during the charrette event, depicts multiple opportunities for safe haven structures within the park network: a viewing tower in close proximity to local access road; one safe haven tower in association with a pedestrian bridge and additional access tower (both can be sacrificed); or, combinations of all three serving as safe haven towers.
Figure 22: Long Beach Peninsula Inland Park and Trail Network berm-bridgeAs in the previous illustration, a safe haven can be located near an access road along the Inland Park Network using a combination of structure types. In this example, berms are used as land forms to access safe zone towers and bridges (optional) that cross the slough and lake network.
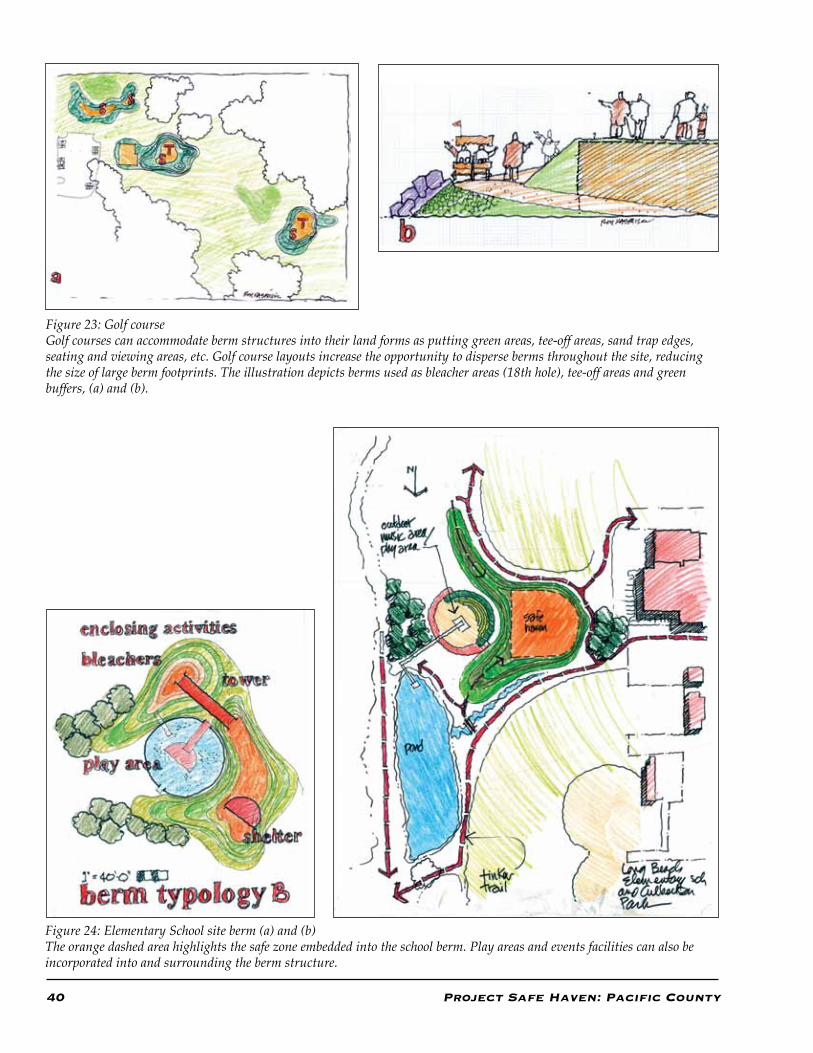
40 Project Safe Haven: Pacific County
Figure 23: Golf courseGolf courses can accommodate berm structures into their land forms as putting green areas, tee-off areas, sand trap edges, seating and viewing areas, etc. Golf course layouts increase the opportunity to disperse berms throughout the site, reducing the size of large berm footprints. The illustration depicts berms used as bleacher areas (18th hole), tee-off areas and green buffers, (a) and (b).
Figure 24: Elementary School site berm (a) and (b)The orange dashed area highlights the safe zone embedded into the school berm. Play areas and events facilities can also be incorporated into and surrounding the berm structure.
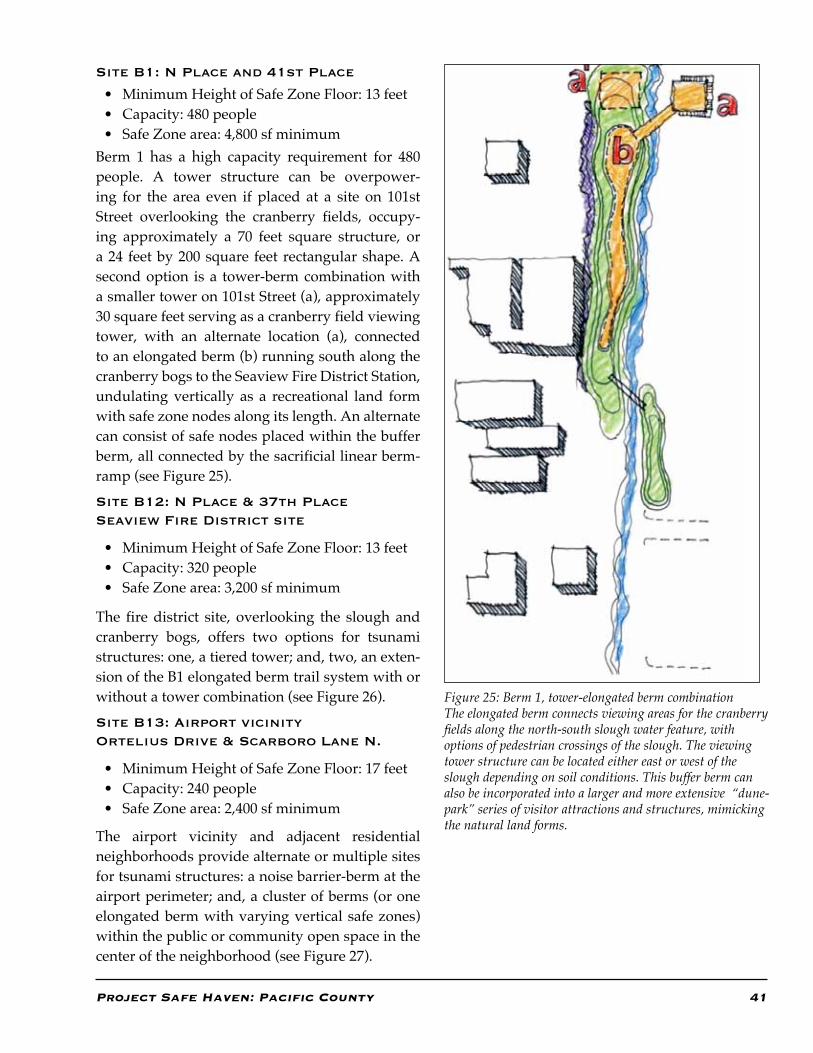
Project Safe Haven: Pacific County 41
Site B1: N Place and 41st Place
• Minimum Height of Safe Zone Floor: 13 feet• Capacity: 480 people• Safe Zone area: 4,800 sf minimum
Berm 1 has a high capacity requirement for 480 people. A tower structure can be overpower-ing for the area even if placed at a site on 101st Street overlooking the cranberry fields, occupy-ing approximately a 70 feet square structure, or a 24 feet by 200 square feet rectangular shape. A second option is a tower-berm combination with a smaller tower on 101st Street (a), approximately 30 square feet serving as a cranberry field viewing tower, with an alternate location (a), connected to an elongated berm (b) running south along the cranberry bogs to the Seaview Fire District Station, undulating vertically as a recreational land form with safe zone nodes along its length. An alternate can consist of safe nodes placed within the buffer berm, all connected by the sacrificial linear berm-ramp (see Figure 25).Site B12: N Place & 37th PlaceSeaview Fire District site
• Minimum Height of Safe Zone Floor: 13 feet• Capacity: 320 people• Safe Zone area: 3,200 sf minimum
The fire district site, overlooking the slough and cranberry bogs, offers two options for tsunami structures: one, a tiered tower; and, two, an exten-sion of the B1 elongated berm trail system with or without a tower combination (see Figure 26).Site B13: Airport vicinityOrtelius Drive & Scarboro Lane N.
• Minimum Height of Safe Zone Floor: 17 feet• Capacity: 240 people• Safe Zone area: 2,400 sf minimum
The airport vicinity and adjacent residential neighborhoods provide alternate or multiple sites for tsunami structures: a noise barrier-berm at the airport perimeter; and, a cluster of berms (or one elongated berm with varying vertical safe zones) within the public or community open space in the center of the neighborhood (see Figure 27).
Figure 25: Berm 1, tower-elongated berm combinationThe elongated berm connects viewing areas for the cranberry fields along the north-south slough water feature, with options of pedestrian crossings of the slough. The viewing tower structure can be located either east or west of the slough depending on soil conditions. This buffer berm can also be incorporated into a larger and more extensive “dune-park” series of visitor attractions and structures, mimicking the natural land forms.
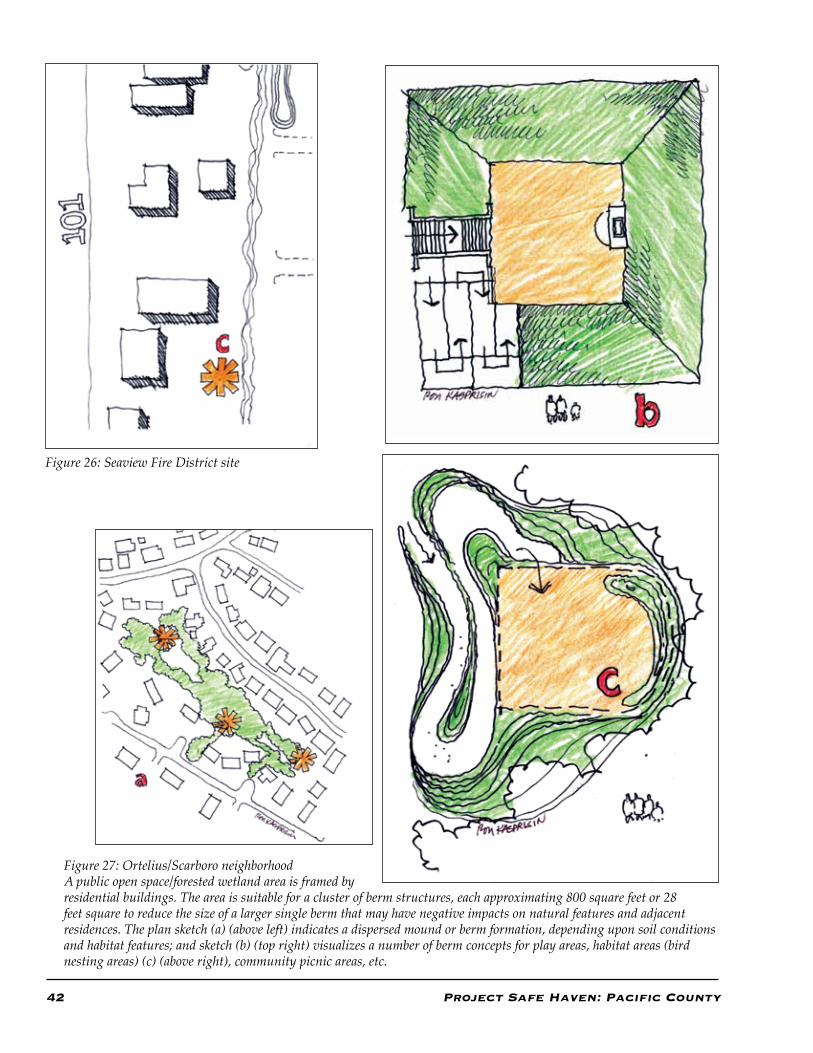
42 Project Safe Haven: Pacific County
Figure 26: Seaview Fire District site
Figure 27: Ortelius/Scarboro neighborhoodA public open space/forested wetland area is framed by residential buildings. The area is suitable for a cluster of berm structures, each approximating 800 square feet or 28 feet square to reduce the size of a larger single berm that may have negative impacts on natural features and adjacent residences. The plan sketch (a) (above left) indicates a dispersed mound or berm formation, depending upon soil conditions and habitat features; and sketch (b) (top right) visualizes a number of berm concepts for play areas, habitat areas (bird nesting areas) (c) (above right), community picnic areas, etc.
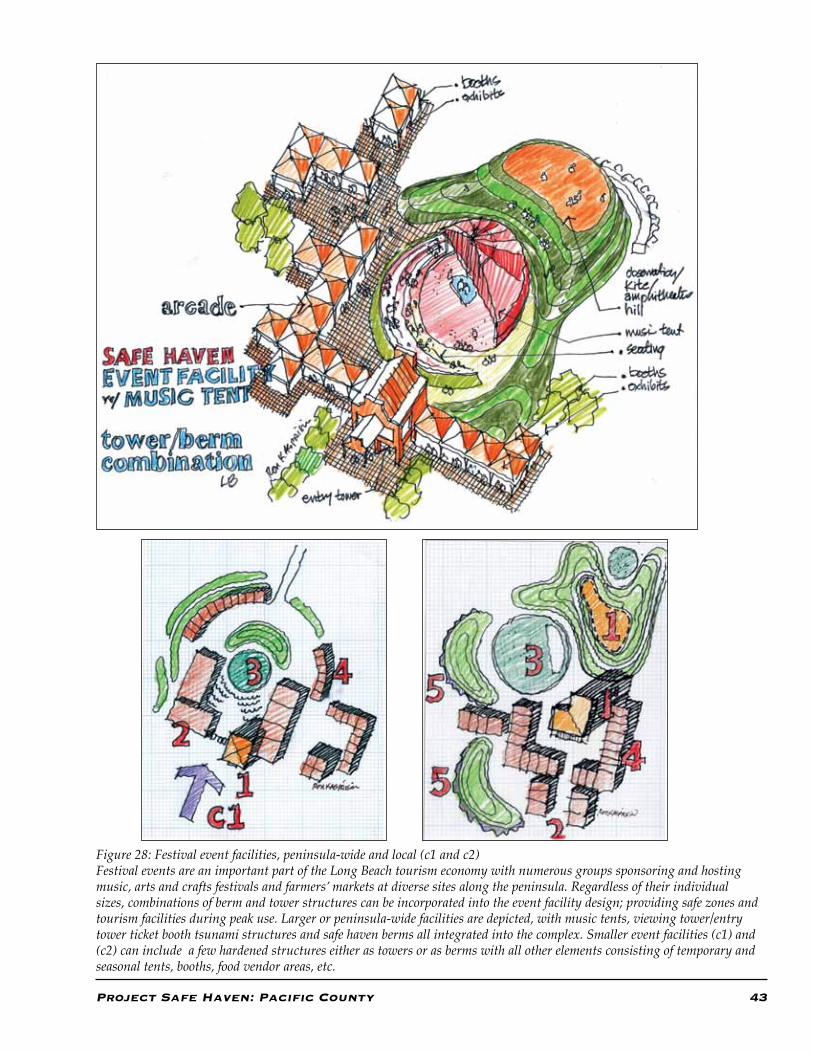
Project Safe Haven: Pacific County 43
Figure 28: Festival event facilities, peninsula-wide and local (c1 and c2)Festival events are an important part of the Long Beach tourism economy with numerous groups sponsoring and hosting music, arts and crafts festivals and farmers’ markets at diverse sites along the peninsula. Regardless of their individual sizes, combinations of berm and tower structures can be incorporated into the event facility design; providing safe zones and tourism facilities during peak use. Larger or peninsula-wide facilities are depicted, with music tents, viewing tower/entry tower ticket booth tsunami structures and safe haven berms all integrated into the complex. Smaller event facilities (c1) and (c2) can include a few hardened structures either as towers or as berms with all other elements consisting of temporary and seasonal tents, booths, food vendor areas, etc.
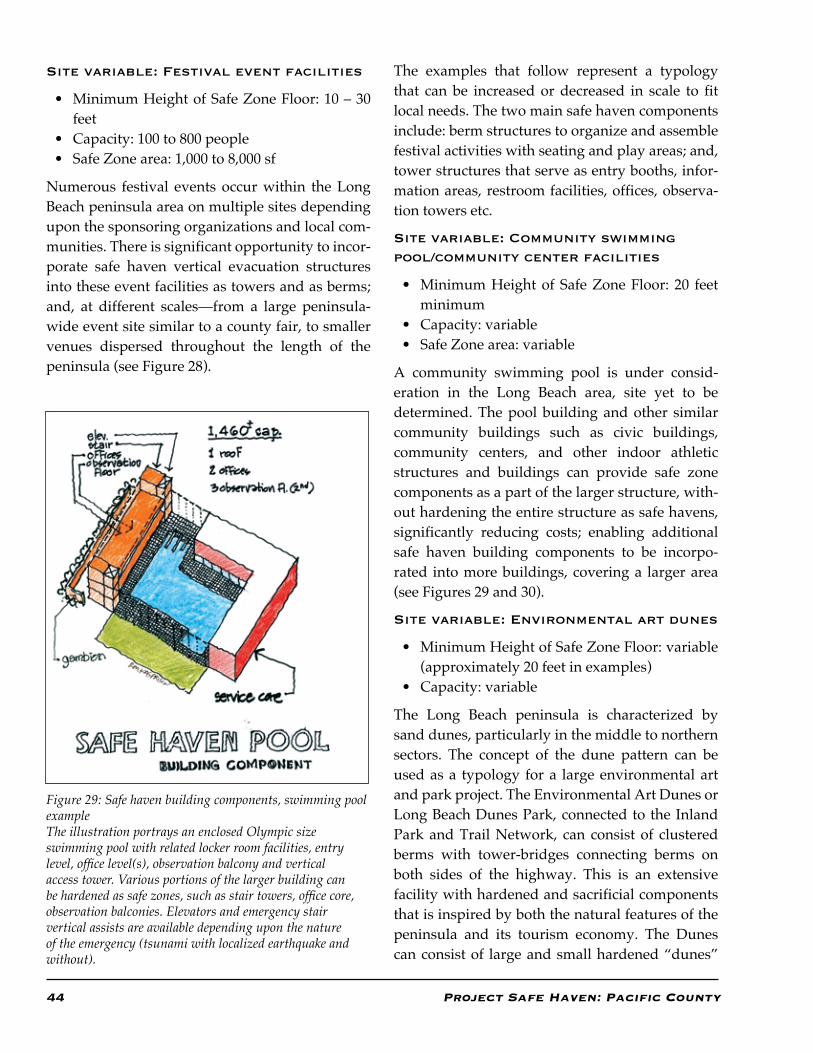
44 Project Safe Haven: Pacific County
Figure 29: Safe haven building components, swimming pool exampleThe illustration portrays an enclosed Olympic size swimming pool with related locker room facilities, entry level, office level(s), observation balcony and vertical access tower. Various portions of the larger building can be hardened as safe zones, such as stair towers, office core, observation balconies. Elevators and emergency stair vertical assists are available depending upon the nature of the emergency (tsunami with localized earthquake and without).
The examples that follow represent a typology that can be increased or decreased in scale to fit local needs. The two main safe haven components include: berm structures to organize and assemble festival activities with seating and play areas; and, tower structures that serve as entry booths, infor-mation areas, restroom facilities, offices, observa-tion towers etc.
Site variable: Community swimming pool/community center facilities
• Minimum Height of Safe Zone Floor: 20 feet minimum
• Capacity: variable• Safe Zone area: variable
A community swimming pool is under consid-eration in the Long Beach area, site yet to be determined. The pool building and other similar community buildings such as civic buildings, community centers, and other indoor athletic structures and buildings can provide safe zone components as a part of the larger structure, with-out hardening the entire structure as safe havens, significantly reducing costs; enabling additional safe haven building components to be incorpo-rated into more buildings, covering a larger area (see Figures 29 and 30).
Site variable: Environmental art dunes
• Minimum Height of Safe Zone Floor: variable (approximately 20 feet in examples)
• Capacity: variable
The Long Beach peninsula is characterized by sand dunes, particularly in the middle to northern sectors. The concept of the dune pattern can be used as a typology for a large environmental art and park project. The Environmental Art Dunes or Long Beach Dunes Park, connected to the Inland Park and Trail Network, can consist of clustered berms with tower-bridges connecting berms on both sides of the highway. This is an extensive facility with hardened and sacrificial components that is inspired by both the natural features of the peninsula and its tourism economy. The Dunes can consist of large and small hardened “dunes”
Site variable: Festival event facilities
• Minimum Height of Safe Zone Floor: 10 – 30 feet
• Capacity: 100 to 800 people• Safe Zone area: 1,000 to 8,000 sf
Numerous festival events occur within the Long Beach peninsula area on multiple sites depending upon the sponsoring organizations and local com-munities. There is significant opportunity to incor-porate safe haven vertical evacuation structures into these event facilities as towers and as berms; and, at different scales—from a large peninsula-wide event site similar to a county fair, to smaller venues dispersed throughout the length of the peninsula (see Figure 28).
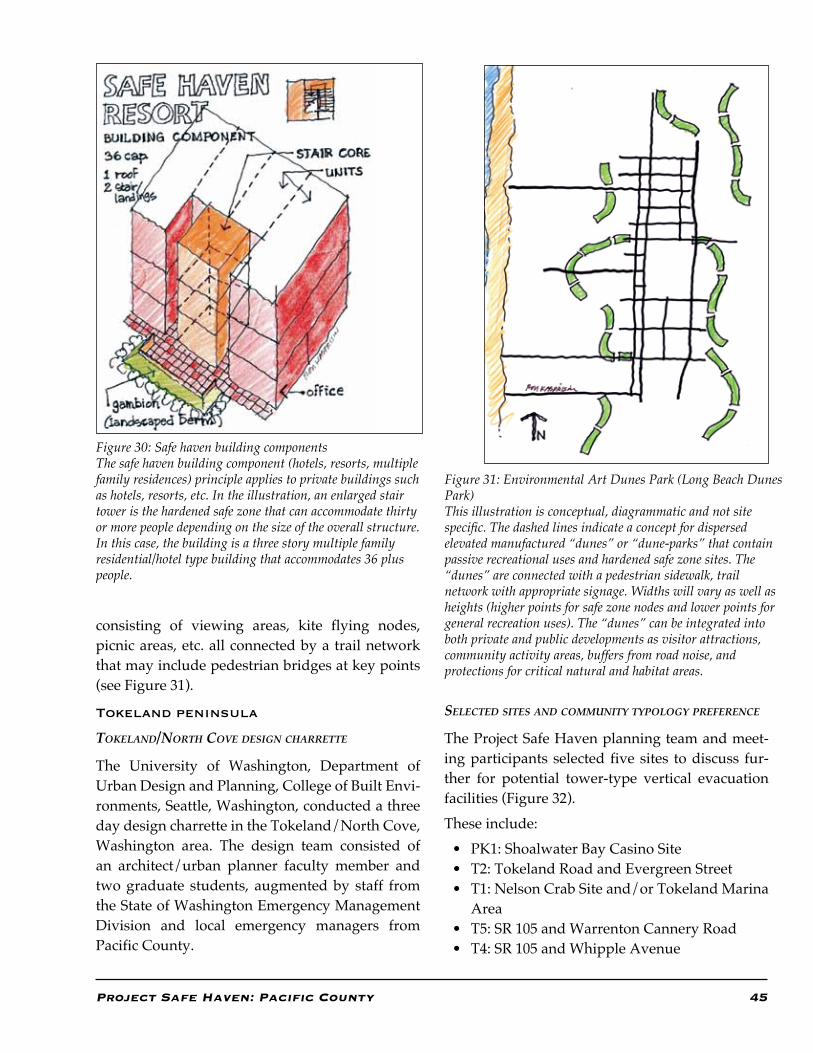
Project Safe Haven: Pacific County 45
Figure 30: Safe haven building componentsThe safe haven building component (hotels, resorts, multiple family residences) principle applies to private buildings such as hotels, resorts, etc. In the illustration, an enlarged stair tower is the hardened safe zone that can accommodate thirty or more people depending on the size of the overall structure. In this case, the building is a three story multiple family residential/hotel type building that accommodates 36 plus people.
Figure 31: Environmental Art Dunes Park (Long Beach Dunes Park)This illustration is conceptual, diagrammatic and not site specific. The dashed lines indicate a concept for dispersed elevated manufactured “dunes” or “dune-parks” that contain passive recreational uses and hardened safe zone sites. The “dunes” are connected with a pedestrian sidewalk, trail network with appropriate signage. Widths will vary as well as heights (higher points for safe zone nodes and lower points for general recreation uses). The “dunes” can be integrated into both private and public developments as visitor attractions, community activity areas, buffers from road noise, and protections for critical natural and habitat areas.
selected sites and cOmmunity tyPOlOgy Preference
The Project Safe Haven planning team and meet-ing participants selected five sites to discuss fur-ther for potential tower-type vertical evacuation facilities (Figure 32). These include:
• PK1: Shoalwater Bay Casino Site• T2: Tokeland Road and Evergreen Street• T1: Nelson Crab Site and/or Tokeland Marina
Area• T5: SR 105 and Warrenton Cannery Road• T4: SR 105 and Whipple Avenue
consisting of viewing areas, kite flying nodes, picnic areas, etc. all connected by a trail network that may include pedestrian bridges at key points (see Figure 31).
Tokeland peninsula
tOkeland/nOrth cOve design charrette
The University of Washington, Department of Urban Design and Planning, College of Built Envi-ronments, Seattle, Washington, conducted a three day design charrette in the Tokeland/North Cove, Washington area. The design team consisted of an architect/urban planner faculty member and two graduate students, augmented by staff from the State of Washington Emergency Management Division and local emergency managers from Pacific County.
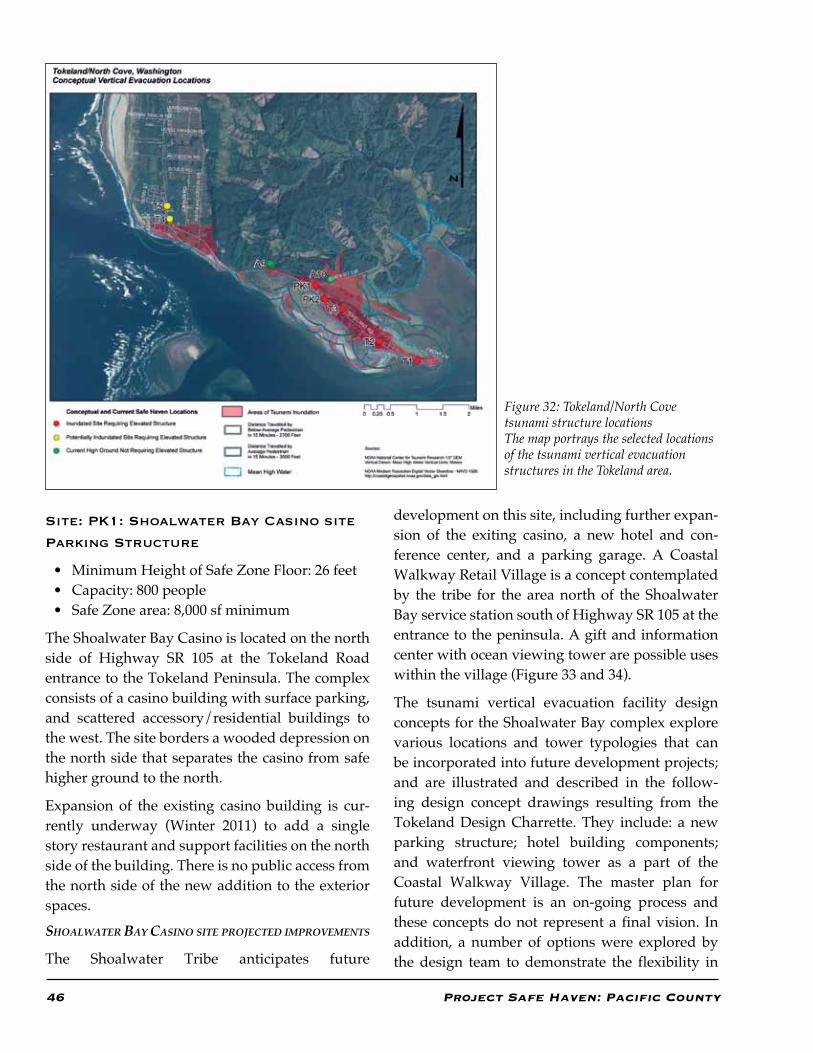
46 Project Safe Haven: Pacific County
Figure 32: Tokeland/North Cove tsunami structure locationsThe map portrays the selected locations of the tsunami vertical evacuation structures in the Tokeland area.
development on this site, including further expan-sion of the exiting casino, a new hotel and con-ference center, and a parking garage. A Coastal Walkway Retail Village is a concept contemplated by the tribe for the area north of the Shoalwater Bay service station south of Highway SR 105 at the entrance to the peninsula. A gift and information center with ocean viewing tower are possible uses within the village (Figure 33 and 34).
The tsunami vertical evacuation facility design concepts for the Shoalwater Bay complex explore various locations and tower typologies that can be incorporated into future development projects; and are illustrated and described in the follow-ing design concept drawings resulting from the Tokeland Design Charrette. They include: a new parking structure; hotel building components; and waterfront viewing tower as a part of the Coastal Walkway Village. The master plan for future development is an on-going process and these concepts do not represent a final vision. In addition, a number of options were explored by the design team to demonstrate the flexibility in
Site: PK1: Shoalwater Bay Casino site
Parking Structure
• Minimum Height of Safe Zone Floor: 26 feet• Capacity: 800 people• Safe Zone area: 8,000 sf minimum
The Shoalwater Bay Casino is located on the north side of Highway SR 105 at the Tokeland Road entrance to the Tokeland Peninsula. The complex consists of a casino building with surface parking, and scattered accessory/residential buildings to the west. The site borders a wooded depression on the north side that separates the casino from safe higher ground to the north.
Expansion of the existing casino building is cur-rently underway (Winter 2011) to add a single story restaurant and support facilities on the north side of the building. There is no public access from the north side of the new addition to the exterior spaces.
shOalwater bay casinO site PrOjected imPrOvements
The Shoalwater Tribe anticipates future
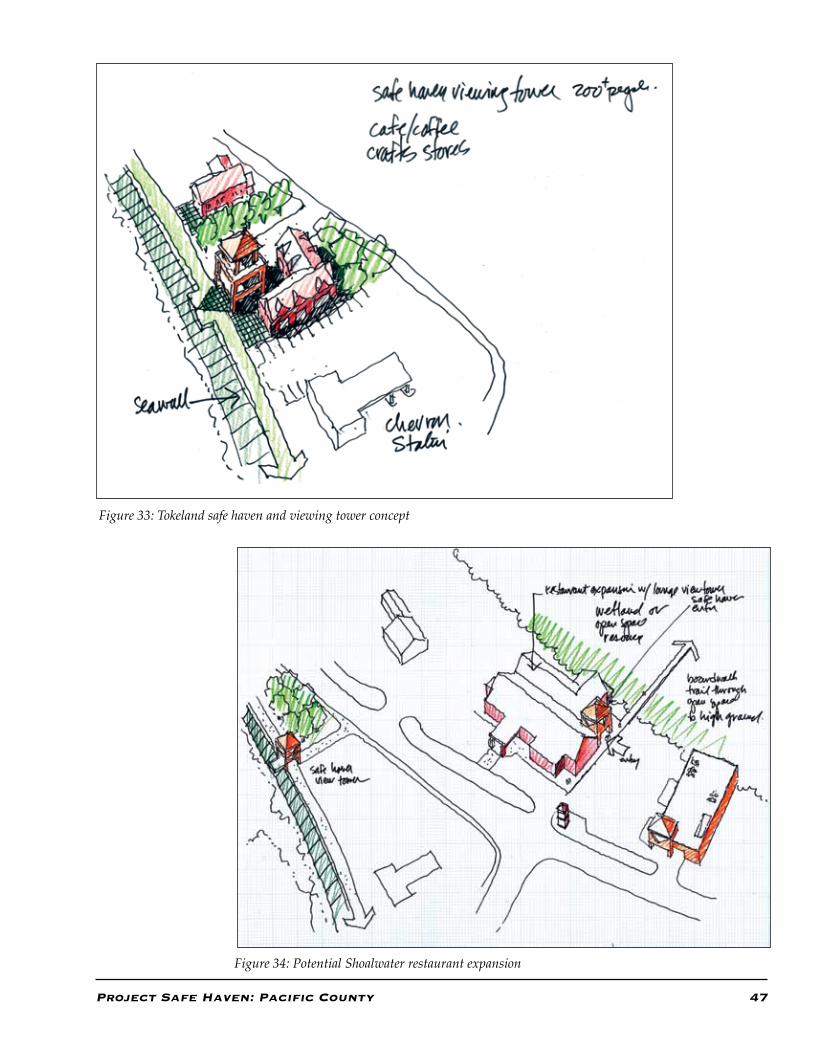
Project Safe Haven: Pacific County 47
Figure 33: Tokeland safe haven and viewing tower concept
Figure 34: Potential Shoalwater restaurant expansion
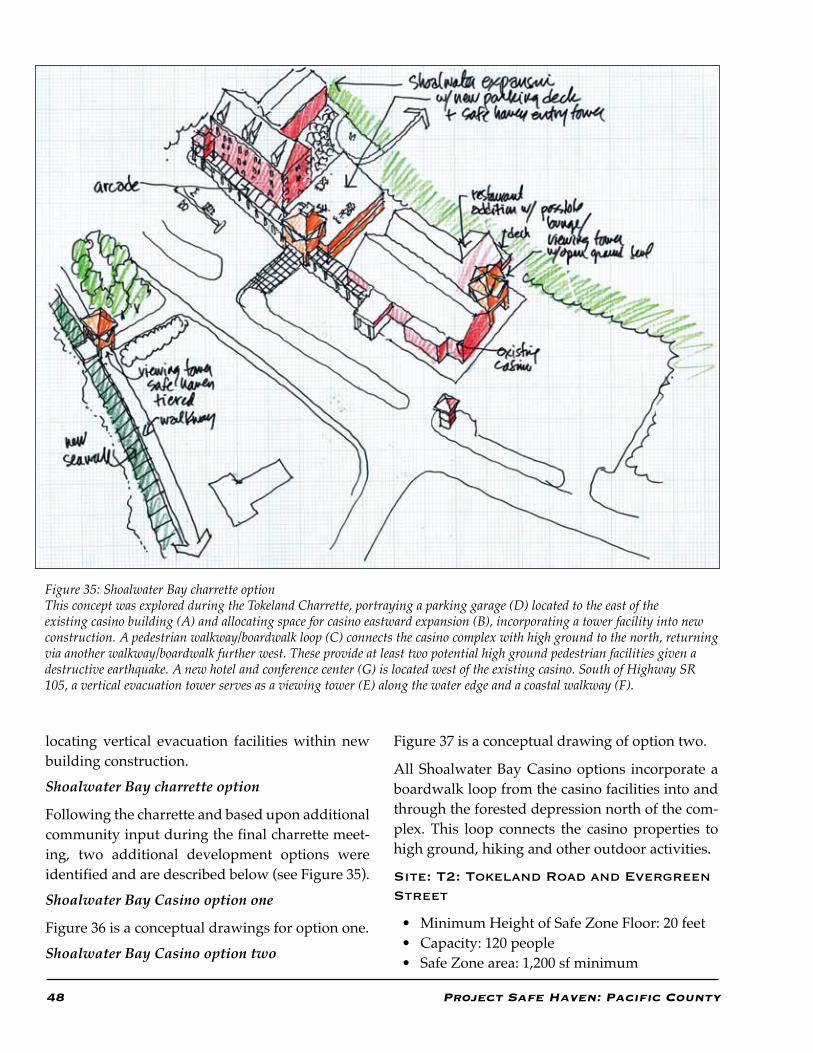
48 Project Safe Haven: Pacific County
Figure 35: Shoalwater Bay charrette optionThis concept was explored during the Tokeland Charrette, portraying a parking garage (D) located to the east of the existing casino building (A) and allocating space for casino eastward expansion (B), incorporating a tower facility into new construction. A pedestrian walkway/boardwalk loop (C) connects the casino complex with high ground to the north, returning via another walkway/boardwalk further west. These provide at least two potential high ground pedestrian facilities given a destructive earthquake. A new hotel and conference center (G) is located west of the existing casino. South of Highway SR 105, a vertical evacuation tower serves as a viewing tower (E) along the water edge and a coastal walkway (F).
locating vertical evacuation facilities within new building construction.
Shoalwater Bay charrette option
Following the charrette and based upon additional community input during the final charrette meet-ing, two additional development options were identified and are described below (see Figure 35).
Shoalwater Bay Casino option one
Figure 36 is a conceptual drawings for option one.
Shoalwater Bay Casino option two
Figure 37 is a conceptual drawing of option two.
All Shoalwater Bay Casino options incorporate a boardwalk loop from the casino facilities into and through the forested depression north of the com-plex. This loop connects the casino properties to high ground, hiking and other outdoor activities.
Site: T2: Tokeland Road and Evergreen Street
• Minimum Height of Safe Zone Floor: 20 feet• Capacity: 120 people• Safe Zone area: 1,200 sf minimum
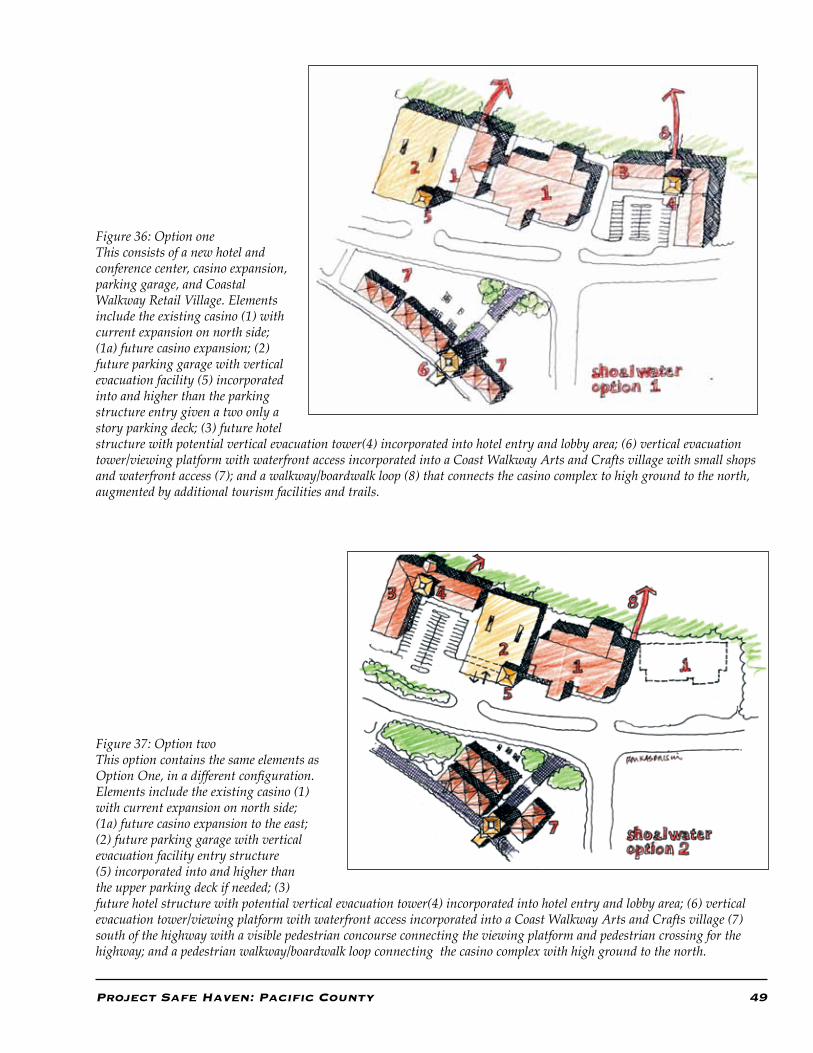
Project Safe Haven: Pacific County 49
Figure 36: Option oneThis consists of a new hotel and conference center, casino expansion, parking garage, and Coastal Walkway Retail Village. Elements include the existing casino (1) with current expansion on north side; (1a) future casino expansion; (2) future parking garage with vertical evacuation facility (5) incorporated into and higher than the parking structure entry given a two only a story parking deck; (3) future hotel structure with potential vertical evacuation tower(4) incorporated into hotel entry and lobby area; (6) vertical evacuation tower/viewing platform with waterfront access incorporated into a Coast Walkway Arts and Crafts village with small shops and waterfront access (7); and a walkway/boardwalk loop (8) that connects the casino complex to high ground to the north, augmented by additional tourism facilities and trails.
Figure 37: Option twoThis option contains the same elements as Option One, in a different configuration. Elements include the existing casino (1) with current expansion on north side; (1a) future casino expansion to the east; (2) future parking garage with vertical evacuation facility entry structure (5) incorporated into and higher than the upper parking deck if needed; (3) future hotel structure with potential vertical evacuation tower(4) incorporated into hotel entry and lobby area; (6) vertical evacuation tower/viewing platform with waterfront access incorporated into a Coast Walkway Arts and Crafts village (7) south of the highway with a visible pedestrian concourse connecting the viewing platform and pedestrian crossing for the highway; and a pedestrian walkway/boardwalk loop connecting the casino complex with high ground to the north.
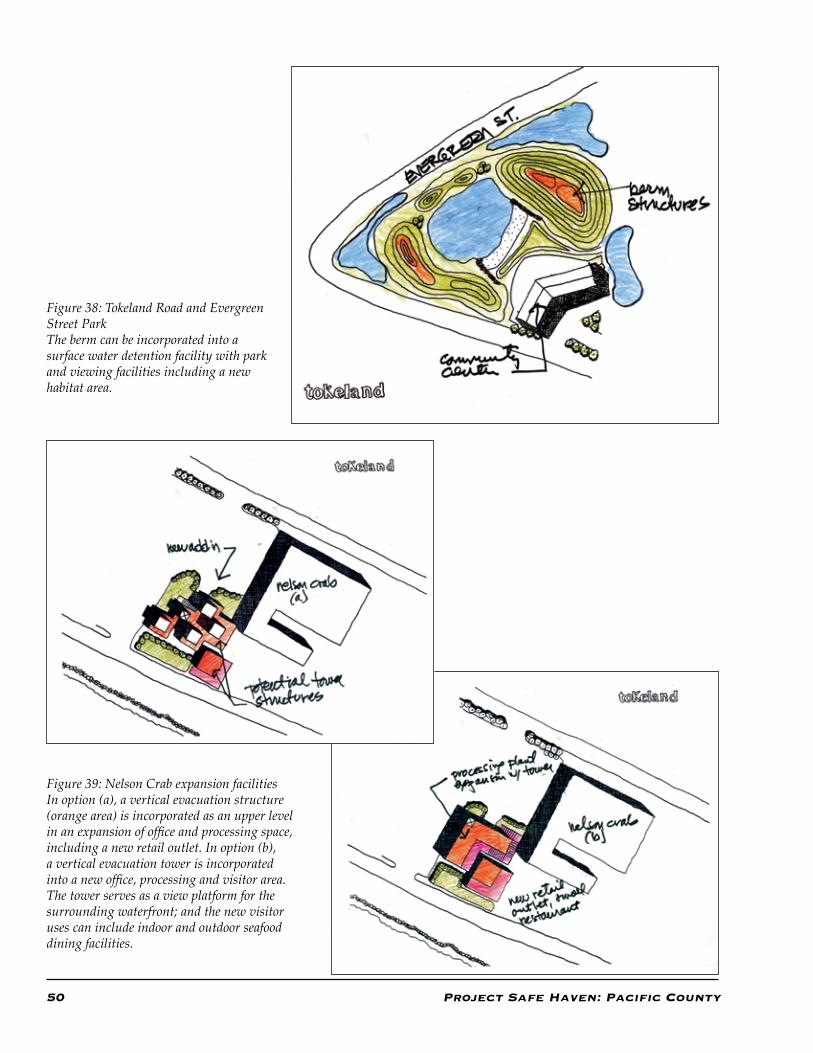
50 Project Safe Haven: Pacific County
Figure 39: Nelson Crab expansion facilitiesIn option (a), a vertical evacuation structure (orange area) is incorporated as an upper level in an expansion of office and processing space, including a new retail outlet. In option (b), a vertical evacuation tower is incorporated into a new office, processing and visitor area. The tower serves as a view platform for the surrounding waterfront; and the new visitor uses can include indoor and outdoor seafood dining facilities.
Figure 38: Tokeland Road and Evergreen Street ParkThe berm can be incorporated into a surface water detention facility with park and viewing facilities including a new habitat area.
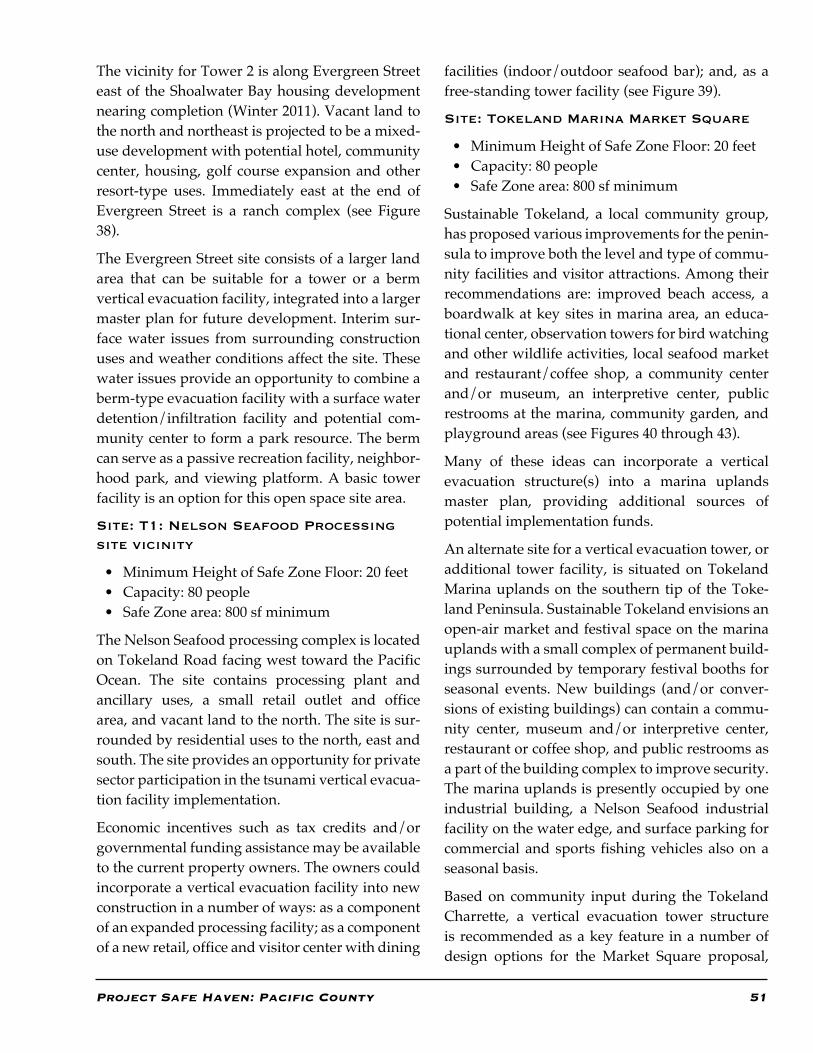
Project Safe Haven: Pacific County 51
The vicinity for Tower 2 is along Evergreen Street east of the Shoalwater Bay housing development nearing completion (Winter 2011). Vacant land to the north and northeast is projected to be a mixed-use development with potential hotel, community center, housing, golf course expansion and other resort-type uses. Immediately east at the end of Evergreen Street is a ranch complex (see Figure 38).
The Evergreen Street site consists of a larger land area that can be suitable for a tower or a berm vertical evacuation facility, integrated into a larger master plan for future development. Interim sur-face water issues from surrounding construction uses and weather conditions affect the site. These water issues provide an opportunity to combine a berm-type evacuation facility with a surface water detention/infiltration facility and potential com-munity center to form a park resource. The berm can serve as a passive recreation facility, neighbor-hood park, and viewing platform. A basic tower facility is an option for this open space site area.
Site: T1: Nelson Seafood Processing site vicinity
• Minimum Height of Safe Zone Floor: 20 feet• Capacity: 80 people• Safe Zone area: 800 sf minimum
The Nelson Seafood processing complex is located on Tokeland Road facing west toward the Pacific Ocean. The site contains processing plant and ancillary uses, a small retail outlet and office area, and vacant land to the north. The site is sur-rounded by residential uses to the north, east and south. The site provides an opportunity for private sector participation in the tsunami vertical evacua-tion facility implementation.
Economic incentives such as tax credits and/or governmental funding assistance may be available to the current property owners. The owners could incorporate a vertical evacuation facility into new construction in a number of ways: as a component of an expanded processing facility; as a component of a new retail, office and visitor center with dining
facilities (indoor/outdoor seafood bar); and, as a free-standing tower facility (see Figure 39).
Site: Tokeland Marina Market Square
• Minimum Height of Safe Zone Floor: 20 feet• Capacity: 80 people• Safe Zone area: 800 sf minimum
Sustainable Tokeland, a local community group, has proposed various improvements for the penin-sula to improve both the level and type of commu-nity facilities and visitor attractions. Among their recommendations are: improved beach access, a boardwalk at key sites in marina area, an educa-tional center, observation towers for bird watching and other wildlife activities, local seafood market and restaurant/coffee shop, a community center and/or museum, an interpretive center, public restrooms at the marina, community garden, and playground areas (see Figures 40 through 43).
Many of these ideas can incorporate a vertical evacuation structure(s) into a marina uplands master plan, providing additional sources of potential implementation funds.
An alternate site for a vertical evacuation tower, or additional tower facility, is situated on Tokeland Marina uplands on the southern tip of the Toke-land Peninsula. Sustainable Tokeland envisions an open-air market and festival space on the marina uplands with a small complex of permanent build-ings surrounded by temporary festival booths for seasonal events. New buildings (and/or conver-sions of existing buildings) can contain a commu-nity center, museum and/or interpretive center, restaurant or coffee shop, and public restrooms as a part of the building complex to improve security. The marina uplands is presently occupied by one industrial building, a Nelson Seafood industrial facility on the water edge, and surface parking for commercial and sports fishing vehicles also on a seasonal basis.
Based on community input during the Tokeland Charrette, a vertical evacuation tower structure is recommended as a key feature in a number of design options for the Market Square proposal,
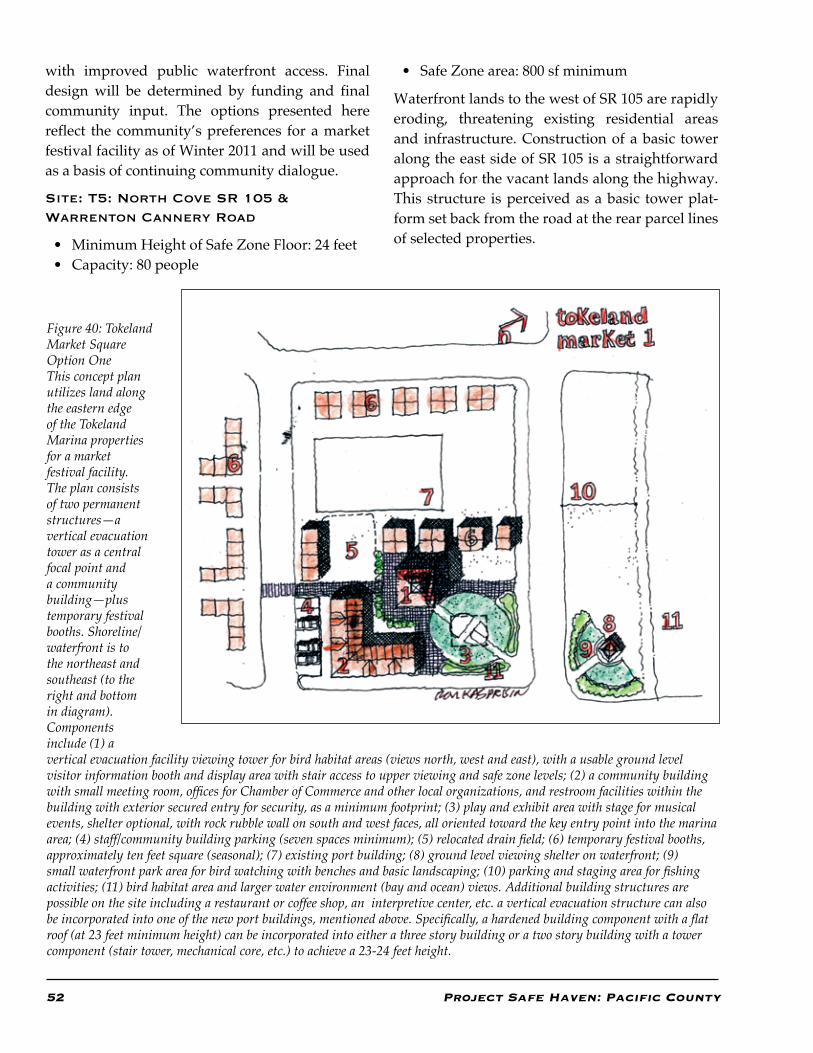
52 Project Safe Haven: Pacific County
Figure 40: Tokeland Market Square Option OneThis concept plan utilizes land along the eastern edge of the Tokeland Marina properties for a market festival facility. The plan consists of two permanent structures—a vertical evacuation tower as a central focal point and a community building—plus temporary festival booths. Shoreline/waterfront is to the northeast and southeast (to the right and bottom in diagram). Components include (1) a vertical evacuation facility viewing tower for bird habitat areas (views north, west and east), with a usable ground level visitor information booth and display area with stair access to upper viewing and safe zone levels; (2) a community building with small meeting room, offices for Chamber of Commerce and other local organizations, and restroom facilities within the building with exterior secured entry for security, as a minimum footprint; (3) play and exhibit area with stage for musical events, shelter optional, with rock rubble wall on south and west faces, all oriented toward the key entry point into the marina area; (4) staff/community building parking (seven spaces minimum); (5) relocated drain field; (6) temporary festival booths, approximately ten feet square (seasonal); (7) existing port building; (8) ground level viewing shelter on waterfront; (9) small waterfront park area for bird watching with benches and basic landscaping; (10) parking and staging area for fishing activities; (11) bird habitat area and larger water environment (bay and ocean) views. Additional building structures are possible on the site including a restaurant or coffee shop, an interpretive center, etc. a vertical evacuation structure can also be incorporated into one of the new port buildings, mentioned above. Specifically, a hardened building component with a flat roof (at 23 feet minimum height) can be incorporated into either a three story building or a two story building with a tower component (stair tower, mechanical core, etc.) to achieve a 23-24 feet height.
with improved public waterfront access. Final design will be determined by funding and final community input. The options presented here reflect the community’s preferences for a market festival facility as of Winter 2011 and will be used as a basis of continuing community dialogue.
Site: T5: North Cove SR 105 & Warrenton Cannery Road
• Minimum Height of Safe Zone Floor: 24 feet• Capacity: 80 people
• Safe Zone area: 800 sf minimum
Waterfront lands to the west of SR 105 are rapidly eroding, threatening existing residential areas and infrastructure. Construction of a basic tower along the east side of SR 105 is a straightforward approach for the vacant lands along the highway. This structure is perceived as a basic tower plat-form set back from the road at the rear parcel lines of selected properties.
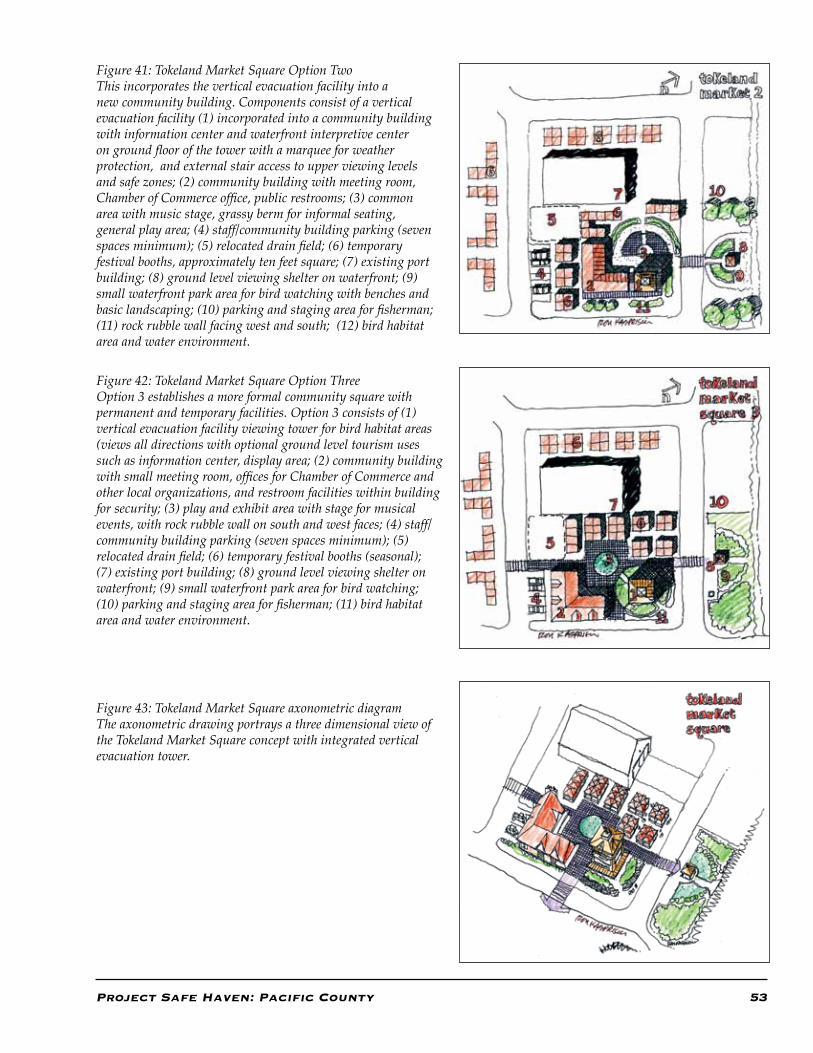
Project Safe Haven: Pacific County 53
Figure 41: Tokeland Market Square Option TwoThis incorporates the vertical evacuation facility into a new community building. Components consist of a vertical evacuation facility (1) incorporated into a community building with information center and waterfront interpretive center on ground floor of the tower with a marquee for weather protection, and external stair access to upper viewing levels and safe zones; (2) community building with meeting room, Chamber of Commerce office, public restrooms; (3) common area with music stage, grassy berm for informal seating, general play area; (4) staff/community building parking (seven spaces minimum); (5) relocated drain field; (6) temporary festival booths, approximately ten feet square; (7) existing port building; (8) ground level viewing shelter on waterfront; (9) small waterfront park area for bird watching with benches and basic landscaping; (10) parking and staging area for fisherman; (11) rock rubble wall facing west and south; (12) bird habitat area and water environment.
Figure 42: Tokeland Market Square Option ThreeOption 3 establishes a more formal community square with permanent and temporary facilities. Option 3 consists of (1) vertical evacuation facility viewing tower for bird habitat areas (views all directions with optional ground level tourism uses such as information center, display area; (2) community building with small meeting room, offices for Chamber of Commerce and other local organizations, and restroom facilities within building for security; (3) play and exhibit area with stage for musical events, with rock rubble wall on south and west faces; (4) staff/community building parking (seven spaces minimum); (5) relocated drain field; (6) temporary festival booths (seasonal); (7) existing port building; (8) ground level viewing shelter on waterfront; (9) small waterfront park area for bird watching; (10) parking and staging area for fisherman; (11) bird habitat area and water environment.
Figure 43: Tokeland Market Square axonometric diagramThe axonometric drawing portrays a three dimensional view of the Tokeland Market Square concept with integrated vertical evacuation tower.
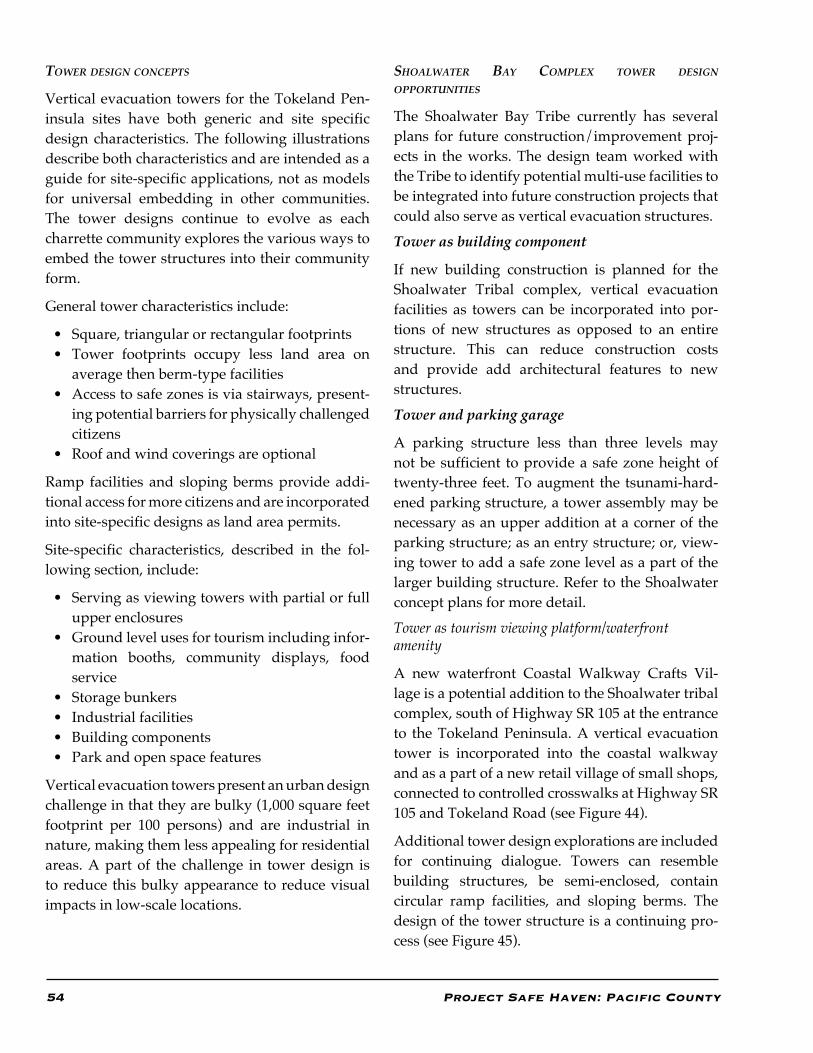
54 Project Safe Haven: Pacific County
tOwer design cOncePts
Vertical evacuation towers for the Tokeland Pen-insula sites have both generic and site specific design characteristics. The following illustrations describe both characteristics and are intended as a guide for site-specific applications, not as models for universal embedding in other communities. The tower designs continue to evolve as each charrette community explores the various ways to embed the tower structures into their community form.
General tower characteristics include:
• Square, triangular or rectangular footprints• Tower footprints occupy less land area on
average then berm-type facilities• Access to safe zones is via stairways, present-
ing potential barriers for physically challenged citizens
• Roof and wind coverings are optional
Ramp facilities and sloping berms provide addi-tional access for more citizens and are incorporated into site-specific designs as land area permits.
Site-specific characteristics, described in the fol-lowing section, include:
• Serving as viewing towers with partial or full upper enclosures
• Ground level uses for tourism including infor-mation booths, community displays, food service
• Storage bunkers• Industrial facilities• Building components• Park and open space features
Vertical evacuation towers present an urban design challenge in that they are bulky (1,000 square feet footprint per 100 persons) and are industrial in nature, making them less appealing for residential areas. A part of the challenge in tower design is to reduce this bulky appearance to reduce visual impacts in low-scale locations.
shOalwater bay cOmPlex tOwer design OPPOrtunities
The Shoalwater Bay Tribe currently has several plans for future construction/improvement proj-ects in the works. The design team worked with the Tribe to identify potential multi-use facilities to be integrated into future construction projects that could also serve as vertical evacuation structures.
Tower as building component
If new building construction is planned for the Shoalwater Tribal complex, vertical evacuation facilities as towers can be incorporated into por-tions of new structures as opposed to an entire structure. This can reduce construction costs and provide add architectural features to new structures.
Tower and parking garage
A parking structure less than three levels may not be sufficient to provide a safe zone height of twenty-three feet. To augment the tsunami-hard-ened parking structure, a tower assembly may be necessary as an upper addition at a corner of the parking structure; as an entry structure; or, view-ing tower to add a safe zone level as a part of the larger building structure. Refer to the Shoalwater concept plans for more detail.
Tower as tourism viewing platform/waterfront amenity
A new waterfront Coastal Walkway Crafts Vil-lage is a potential addition to the Shoalwater tribal complex, south of Highway SR 105 at the entrance to the Tokeland Peninsula. A vertical evacuation tower is incorporated into the coastal walkway and as a part of a new retail village of small shops, connected to controlled crosswalks at Highway SR 105 and Tokeland Road (see Figure 44).
Additional tower design explorations are included for continuing dialogue. Towers can resemble building structures, be semi-enclosed, contain circular ramp facilities, and sloping berms. The design of the tower structure is a continuing pro-cess (see Figure 45).
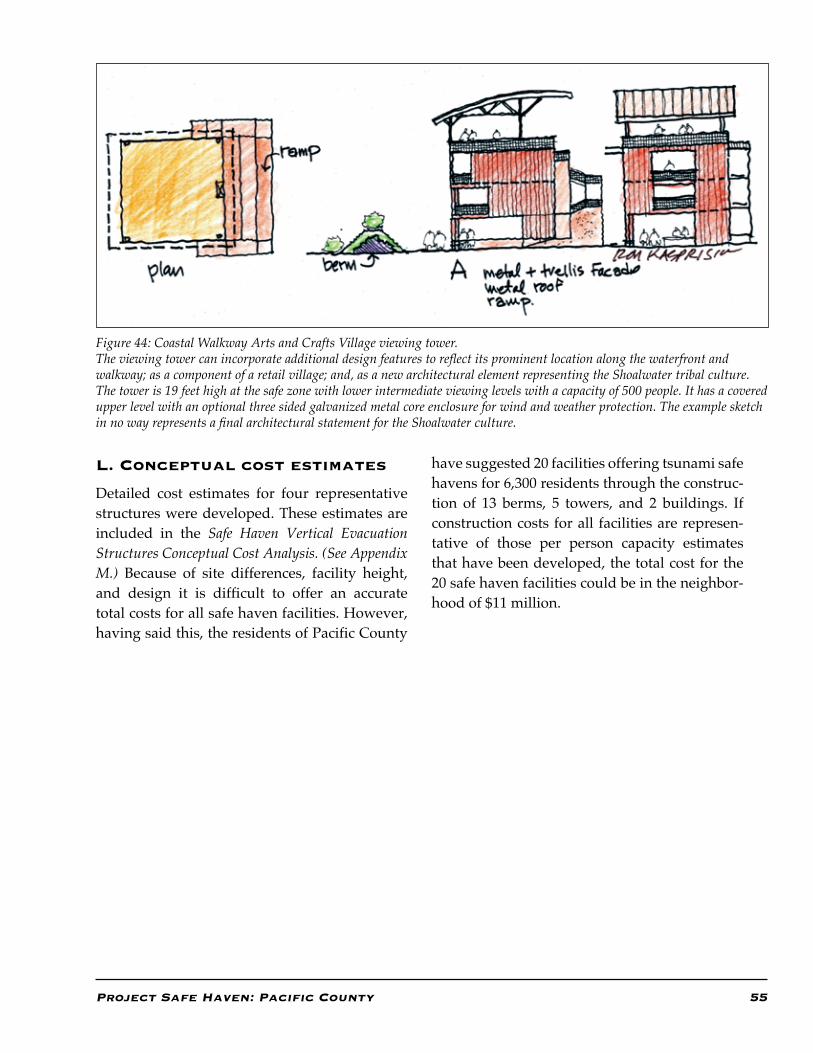
Project Safe Haven: Pacific County 55
Figure 44: Coastal Walkway Arts and Crafts Village viewing tower. The viewing tower can incorporate additional design features to reflect its prominent location along the waterfront and walkway; as a component of a retail village; and, as a new architectural element representing the Shoalwater tribal culture. The tower is 19 feet high at the safe zone with lower intermediate viewing levels with a capacity of 500 people. It has a covered upper level with an optional three sided galvanized metal core enclosure for wind and weather protection. The example sketch in no way represents a final architectural statement for the Shoalwater culture.
L. Conceptual cost estimates
Detailed cost estimates for four representative structures were developed. These estimates are included in the Safe Haven Vertical Evacuation Structures Conceptual Cost Analysis. (See Appendix M.) Because of site differences, facility height, and design it is difficult to offer an accurate total costs for all safe haven facilities. However, having said this, the residents of Pacific County
have suggested 20 facilities offering tsunami safe havens for 6,300 residents through the construc-tion of 13 berms, 5 towers, and 2 buildings. If construction costs for all facilities are represen-tative of those per person capacity estimates that have been developed, the total cost for the 20 safe haven facilities could be in the neighbor-hood of $11 million.
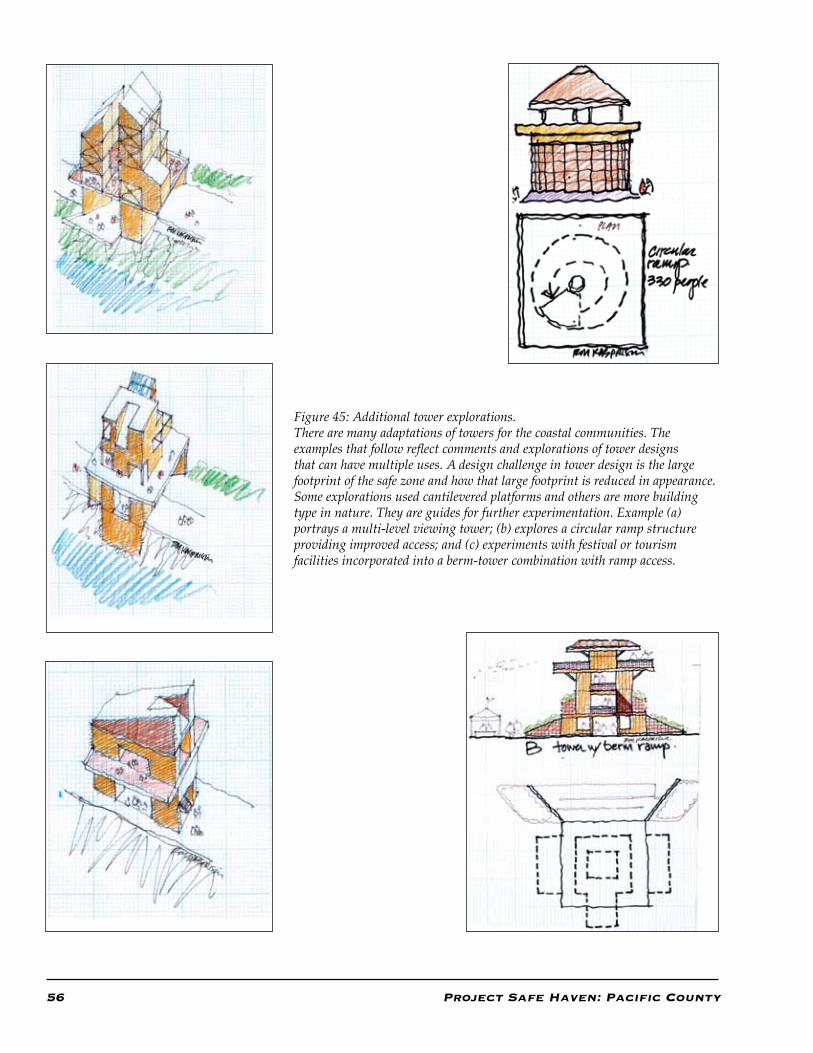
56 Project Safe Haven: Pacific County
Figure 45: Additional tower explorations. There are many adaptations of towers for the coastal communities. The examples that follow reflect comments and explorations of tower designs that can have multiple uses. A design challenge in tower design is the large footprint of the safe zone and how that large footprint is reduced in appearance. Some explorations used cantilevered platforms and others are more building type in nature. They are guides for further experimentation. Example (a) portrays a multi-level viewing tower; (b) explores a circular ramp structure providing improved access; and (c) experiments with festival or tourism facilities incorporated into a berm-tower combination with ramp access.
Project Safe Haven: Pacific County 57
5. Conclusions and Next Steps
Pacific County has high risk/low frequency tsuna-mis triggered by magnitude 9+ Cascadia subduc-tion zone earthquakes. The last Cascadia earth-quake to trigger such a tsunami was recorded in 1700 AD. The rate of occurrence is every 400 years. As a result, the concept of vertical evacuation as a strategy to provide refuge and high ground for evacuation along Washington’s coast could not be timelier. The preferred strategies developed for the four Pacific County communities reduce their vulnerability by proposing vertical refuges that are accessible to a significant amount of the popu-lation, both resident and tourist populations. The strategy was created through a process that builds upon the community’s strengths and minimizes its weaknesses, to make the communities safer and more prepared. In the future, the preferred strate-gies may be revisited and modified as needed. Funding opportunities will be researched and solicited in order to implement the preferred strat-egies with local government coordination. Imple-mentation will take place at a local level with pos-sible state assistance, based on community needs, preferences and response to public input gathered during the duration of Project Safe Haven.Recent international earthquake and tsunami events
The Pacific County Project Safe Haven report was in the process of being developed at the time of the February 27th, 2010 Chilean earthquake and tsunami. The March 11th, 2011 earthquake and tsunami in Japan took place during the same eve-ning of a Project Safe Haven workshop in Grays Harbor County. As a result, the processes and report development has been influenced by both international earthquake and tsunami events. Both events in Chile and Japan teach us the importance of tsunami preparedness and mitiga-tion. Several of the structures in Japan, intended for vertical evacuation, saved lives while some did not function as well because of prior assump-tions about the size of the event. Therefore, it is
imperative that the assumptions in these reports are dutifully revisited following any significant earthquake and/or tsunami to ensure that they remain valid and the conclusions reached in the reports are still applicable. Some of the items that may be revisited are: pedestrian travel times, engi-neering assumptions, subsidence, i.e.. On a related note, it is important to note that both reports are based on either existing tsunami inundation mod-eling and/or interpolation of existing modeling by technical experts. Prior to construction of any proposed vertical evacuation refuge, additional and/or comprehen-sive tsunami inundation modeling is required. The approach recommended by this study is to use what is known as an ensemble modeling approach, which uses multiple tsunami inunda-tion models and sources to determine the amount of flooding and the velocities of currents from a Cascadia event. The existing models, while good for traditional evacuation planning purposes, are not recommended for determining the final neces-sary height or elevation of a life-safety structure, such as a vertical evacuation refuge. Tsunami vertical evacuation refuges
It is important to communicate that the proposed vertical evacuation structures are “refuges” and not “shelters.” According to FEMA P646, vertical evacuation refuges are not necessarily required to meet ADA requirements when they operate as a refuge. However, for day-to-day uses, vertical evacuation refuges should consider the needs of disabled occupants to the extent possible and the extent required by law, in the event of an emer-gency evacuation. During a tsunami evacuation, following a near-source earthquake, disabled evacuees may need additional assistance accessing refuge areas in vertical evacuation structures. Throughout the public process of Project Safe Haven it has been the sincerest desire of the com-munities to incorporate accessibility features into the refuges to the greatest extent possible. For example, a hybrid tower-berm vertical evacuation
58 Project Safe Haven: Pacific County
structure typology was developed to specifically address the needs of those with limited mobility as the berm portion of the structure includes ramps for wheelchair access. All drawings included in this report are conceptual in nature and as a result no engineered drawings for permitting have been developed. In later stages of vertical evacuation structure development additional accessibility features may be incorporated into the existing conceptual designs. Ultimately, compliance with ADA may vary by structure type, function and whether or not the detailed building plans call for long-term sheltering options as opposed to a short-term safe area for refuge. Future Social Science Research
Additional social science research is necessary before implementation takes place. The research should look at how the proposed vertical evacu-ation refuges will be phased in over a number of years and how the refuges should be incorporated into existing evacuation planning and messaging. A strategy and methodology for how to conduct public education about evacuation to vertical evac-uation refuges needs to be created with updated, accompanying evacuation maps. Implementation and funding opportunities for vertical evacuation refuges
Tsunami vertical evacuation refuges have been developed over the course of decades in countries like Japan that historically had many significant tsunami incidents. Elsewhere, in countries that have also been recently impacted by devastating tsunamis, like Indonesia, tsunami vertical evacu-ation refuges are currently in the process of being implemented through the development of outdoor elevated parks. Funding for these projects has largely come from government or private sources. Intentionally designing any type of structure to serve as a tsunami safe haven is a relatively new concept for the United States and no official guid-ance for engineers or planners existed until late 2008. Traditional funding sources for structural mitigation activities, such as FEMA’s Hazard Miti-gation Grant Program (HMGP) and Pre-Disaster
Mitigation (PDM), do not yet consider tsunami vertical evacuation refuges eligible projects; how-ever, Washington Emergency Management is cur-rently working with FEMA and other stakeholders regarding this issue. It is likely that funding for implementation of this plan will require a com-bination of federal, state, local, private, and/or non-profit sources to realize full implementation in a timely manner. A variety of incentives may also be considered in order to leverage privately funded development projects. Therefore, project team members and local residents have begun to identify viable options to bring tsunami vertical evacuation to fruition in vulnerable communities along the coast. These funding options currently include, but are not limited to, the following:Public:
• Federal and State financial assistance with grants
• Local Improvement Districts• Incorporation of safe haven structures or
components thereof into new public works facilities
• Incorporation of safe haven structures or components thereof into new civic and recre-ational facilities
Private:• Internal Revenue Service tax credits similar to
Historic and/or Architecturally Significant tax credits
• Business improvement areas• Local and state tax credits• Zoning incentives in permitting, site require-
ments and building program (density, park-ing, square feet, building heights)
• Private donationsConclusion
In conclusion, it is important to note and remember that Project Safe Haven is merely a starting point. A collective community vision has been facilitated, recorded and presented. This report will serve as a guide and tool for how tsunami vertical evacua-tion may be incorporated into the community over a prolonged period of time with continued com-munity support and direction.
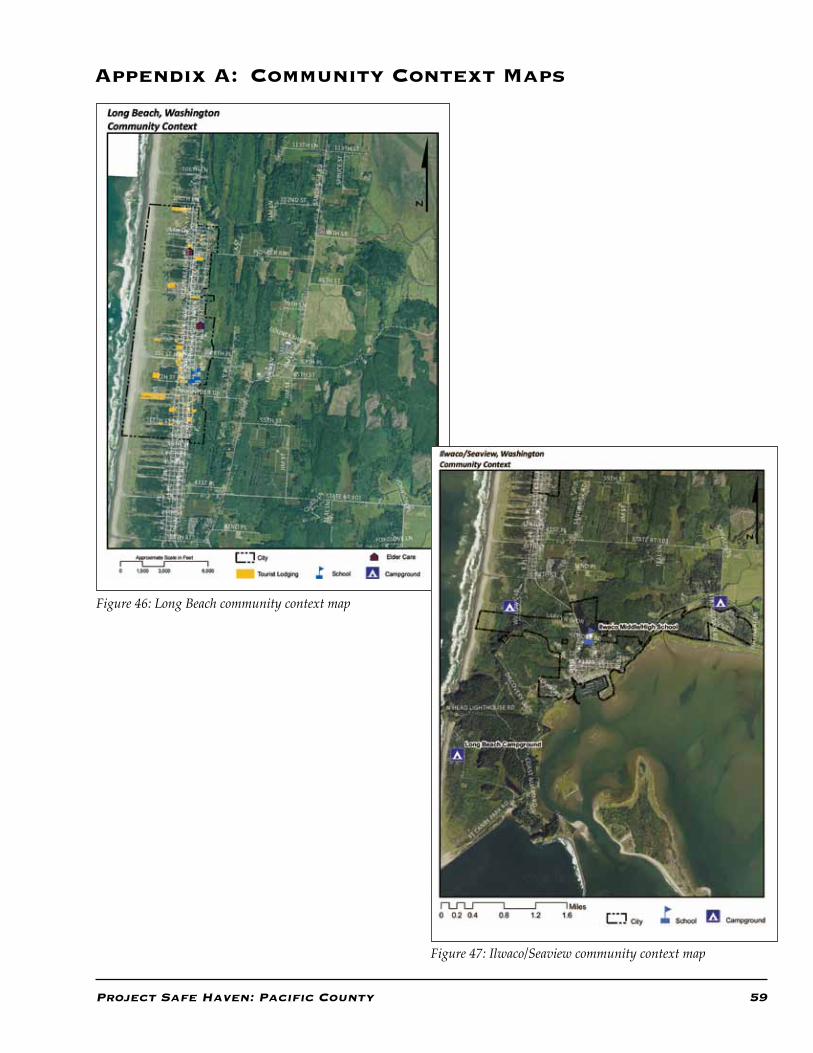
Project Safe Haven: Pacific County 59
Appendix A: Community Context Maps
Figure 46: Long Beach community context map
Figure 47: Ilwaco/Seaview community context map
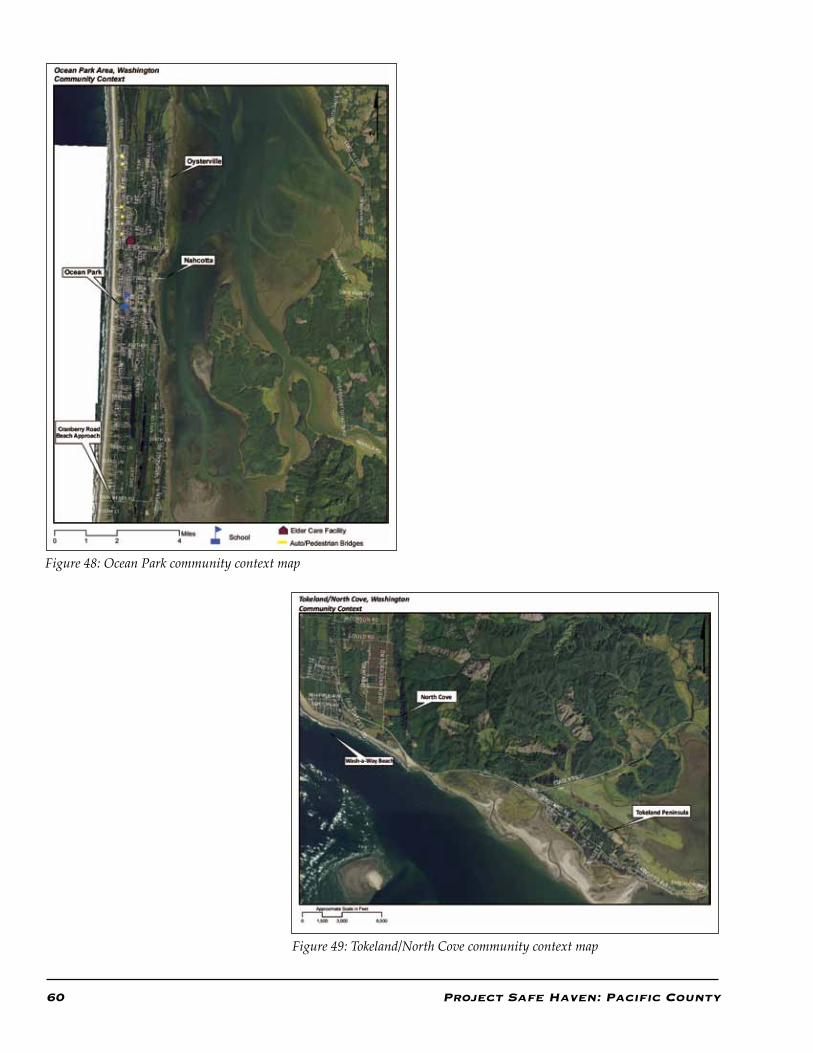
60 Project Safe Haven: Pacific County
Figure 48: Ocean Park community context map
Figure 49: Tokeland/North Cove community context map
Project Safe Haven: Pacific County 61
SWOT stands for Strengths, Weaknesses, Oppor-tunities, and Threats. The project team used SWOT analysis to identify the features of the preferred alternative that address underlying characteris-tics of the community. The SWOT analysis helps demonstrate that the preferred alternative builds on the community’s strengths, overcomes weak-nesses, takes advantage of opportunities, and minimizes threats. A version of the SWOT analy-sis was carried out during the second community meeting in an annotated form of strengths and weaknesses evaluation. Meeting participants were given strengths and weaknesses forms to fill out for each conceptual vertical evacuation site. The following represents the underlying assumptions and definitions of each: strengths, weaknesses, opportunities, and threats:
Strengths are capabilities
They are internal to the community and repre-sent items to build upon. Categories of strengths include: financial; mobility; preparedness and awareness; and built and natural environment. The preferred alternative builds on the commu-nity’s strengths.
Weaknesses are impacts, exposures, or vulnerabilities
They are internal to the community and represent items to overcome. Categories of weaknesses include: financial; mobility; preparedness and awareness; and built and natural environment. The preferred alternative helps overcome the com-munity’s weaknesses.
Opportunities are capabilities
They are external to the community and represent items to exploit or enhance. Categories of oppor-tunities include: business and economic; human and social capacity; natural and environmental; and built environment. The preferred alternative exploits opportunities available to the community.
Threats are hazards
They are external and generally out of the com-munity’s control. Categories of threats relate to geography, built environment, and demograph-ics. The preferred alternative helps minimize the threat presented by a tsunami.
Appendix B: SWOT Analysis Description
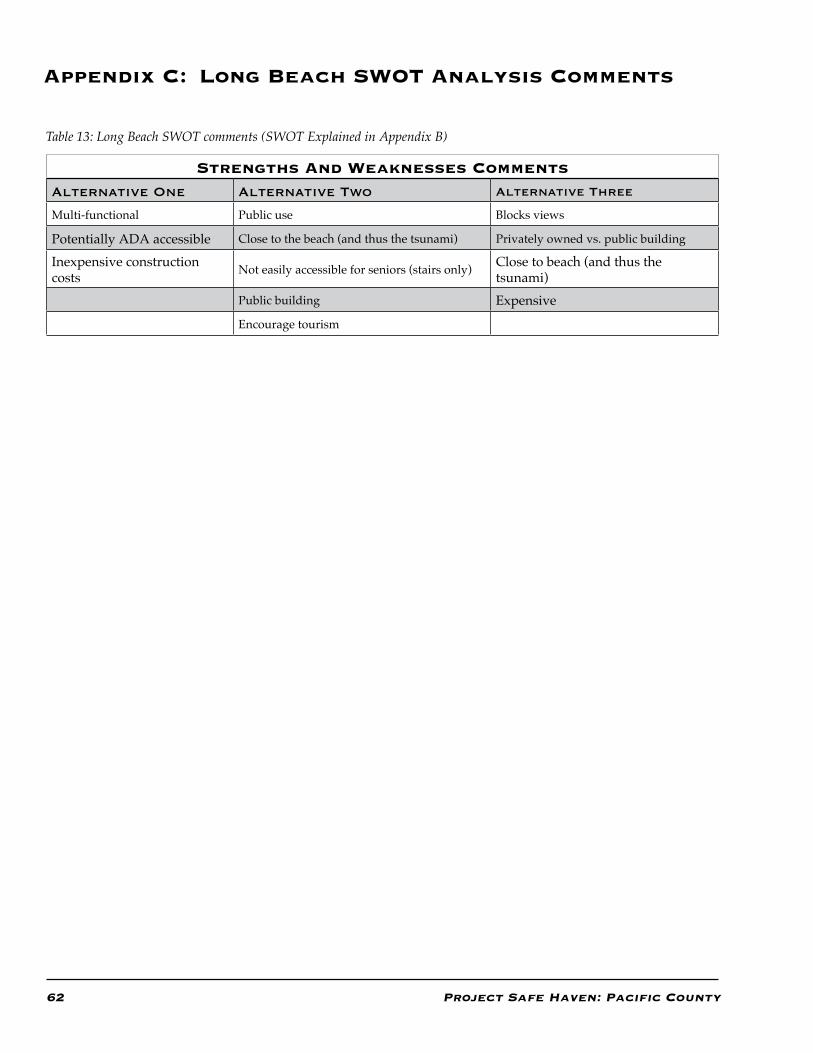
62 Project Safe Haven: Pacific County
Appendix C: Long Beach SWOT Analysis Comments
Strengths And Weaknesses CommentsAlternative One Alternative Two Alternative Three
Multi-functional Public use Blocks views
Potentially ADA accessible Close to the beach (and thus the tsunami) Privately owned vs. public building
Inexpensive construction costs Not easily accessible for seniors (stairs only) Close to beach (and thus the
tsunami)Public building Expensive
Encourage tourism
Table 13: Long Beach SWOT comments (SWOT Explained in Appendix B)
Project Safe Haven: Pacific County 63
To carry out the vertical evacuation community analysis, the project team made assumptions about the tsunami hazard, berm construction and design, and capabilities of the Pacific County population.
Assumptions about the tsunami hazard
1. The scenario event will be a 9.1 magnitude subduction zone earthquake approximately 80 miles off the coast of the Long Beach peninsula.
2. The earthquake will last five to six minutes and will create a tsunami.
3. Six feet of subsidence is expected.
4. The modeled tsunami will have a wave-height of approximately 22 feet (NGVD) at the pen-insula’s western shore, depending upon local-ized bathymetry, topography and the built environment.
5. The warning before the tsunami will be the earthquake.
6. There will be about 40 minutes between the cessation of shaking and arrival of the first tsunami wave.
7. Although subduction zone earthquake models propose a tsunami warning time of 40 minutes, the creation of the preferred strate-gies are based on a 15 minute warning time. This reduced warning time takes into account delayed response time of citizens, poor road and sidewalk conditions resulting from the earthquake, as well as possible panic among citizens. Additionally, evacuees will need 5 to 10 minutes to reorient themselves after the earthquake and will ultimately have 15 min-utes to walk to a safe haven.
8. Several other tsunami waves will likely follow the initial wave, and there will be danger of recurring waves throughout the entire post-event tide cycle.
Appendix D: Project Assumptions9. Tsunami refugees will remain on the structure
for two full tide cycles, or up to 24 hours.
10. Routes to vertical evacuation structures will be available and discernible after the earthquake.
11. Those evacuating will walk to the vertical evacuation structures — travel by car will not be possible.
12. Communication will be limited to voice.
13. There are natural lines of defense.
14. Some natural lines of defense have been destroyed.
15. Lines of defense that have been removed can be restored.
Assumptions about the capabilities of the Long Beach population
1. The majority of the Long Beach population is physically mobile and can walk to the pro-posed tsunami evacuation sites.
2. An average walking speed individual can walk 3,600 feet in 15 minutes and a slower walking speed individual can walk 2,700 feet in 15 minutes.
3. People on the beach have average to high physical mobility.
4. There is an awareness of tsunami risk in Pacific County.
Assumptions about the berm construction and design
1. Save havens can be provided.
2. The margin of safety (distance between the height of the tsunami and the floor of the berm) is factored to be 10 feet [Height above inundation level (4 feet) plus margin of safety (3 feet) plus allowance for climate change (3 feet)].
64 Project Safe Haven: Pacific County
3. If the vertical evacuation structures are con-structed on sites where wetlands are compro-mised, new wetlands will be developed or the compromised wetland will be mitigated in another way.
4. Each vertical evacuation structure will provide ten square feet of space per person.
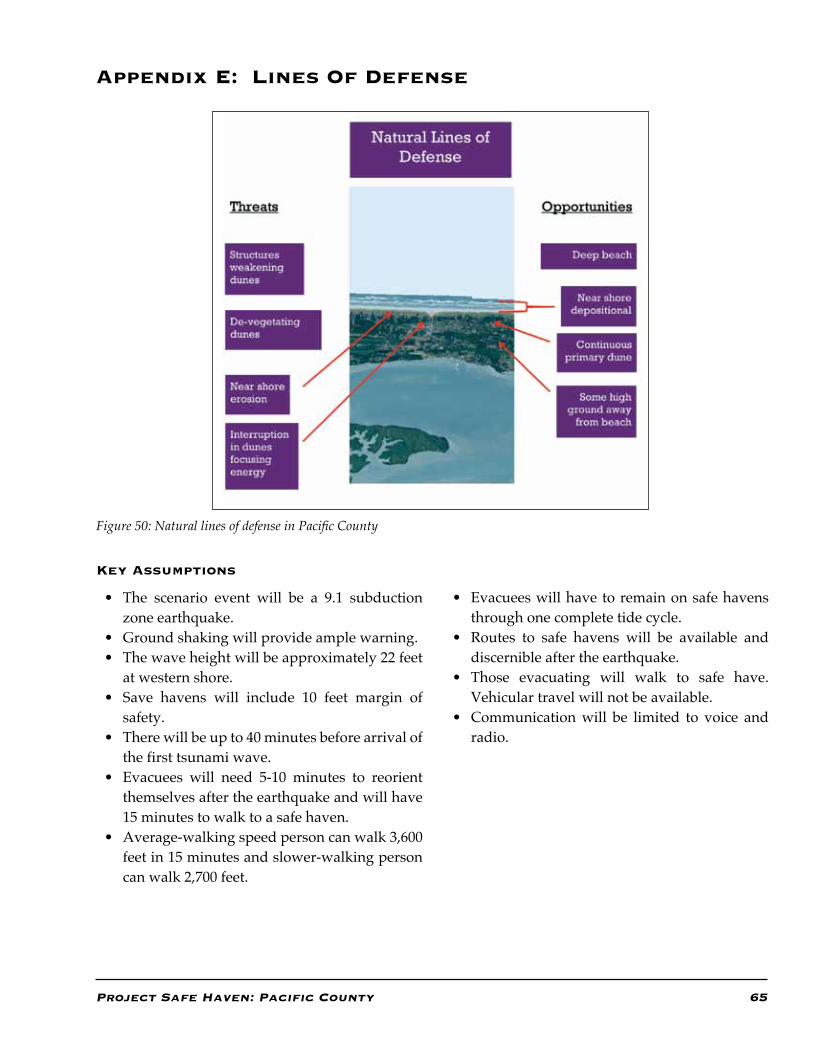
Project Safe Haven: Pacific County 65
Appendix E: Lines Of Defense
Figure 50: Natural lines of defense in Pacific County
Key Assumptions
• The scenario event will be a 9.1 subduction zone earthquake.
• Ground shaking will provide ample warning.• The wave height will be approximately 22 feet
at western shore.• Save havens will include 10 feet margin of
safety.• There will be up to 40 minutes before arrival of
the first tsunami wave.• Evacuees will need 5-10 minutes to reorient
themselves after the earthquake and will have 15 minutes to walk to a safe haven.
• Average-walking speed person can walk 3,600 feet in 15 minutes and slower-walking person can walk 2,700 feet.
• Evacuees will have to remain on safe havens through one complete tide cycle.
• Routes to safe havens will be available and discernible after the earthquake.
• Those evacuating will walk to safe have. Vehicular travel will not be available.
• Communication will be limited to voice and radio.
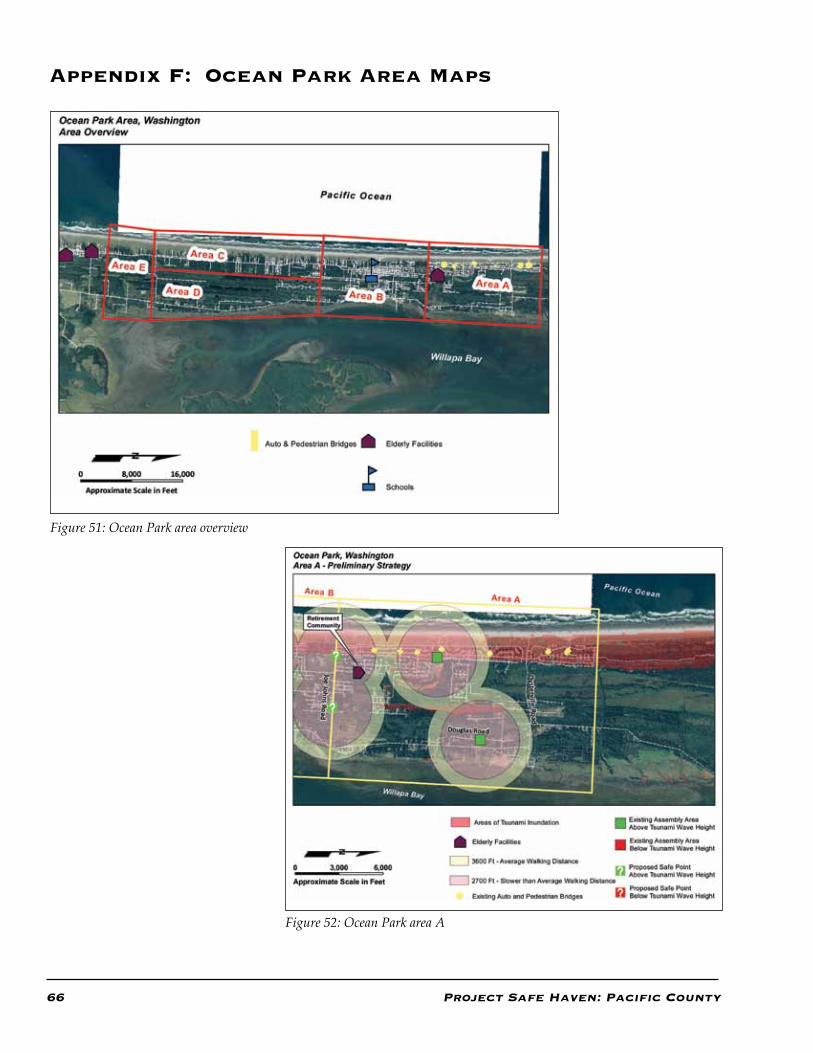
66 Project Safe Haven: Pacific County
Appendix F: Ocean Park Area Maps
Figure 51: Ocean Park area overview
Figure 52: Ocean Park area A
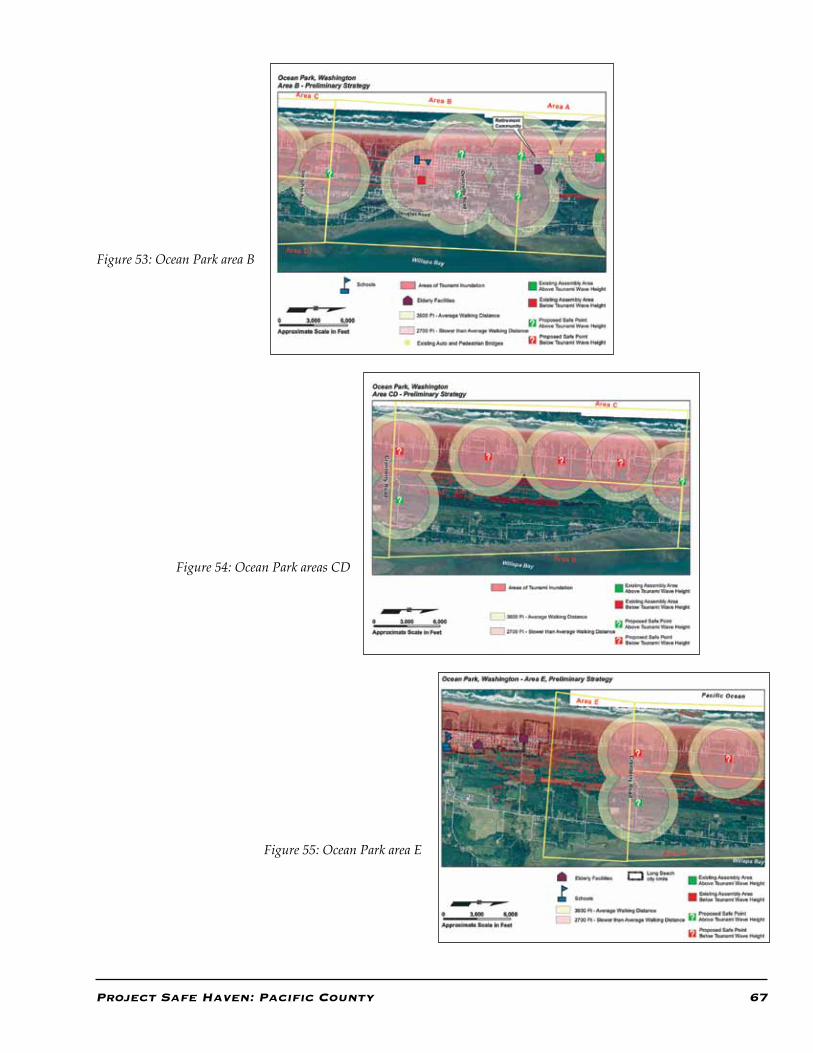
Project Safe Haven: Pacific County 67
Figure 53: Ocean Park area B
Figure 54: Ocean Park areas CD
Figure 55: Ocean Park area E
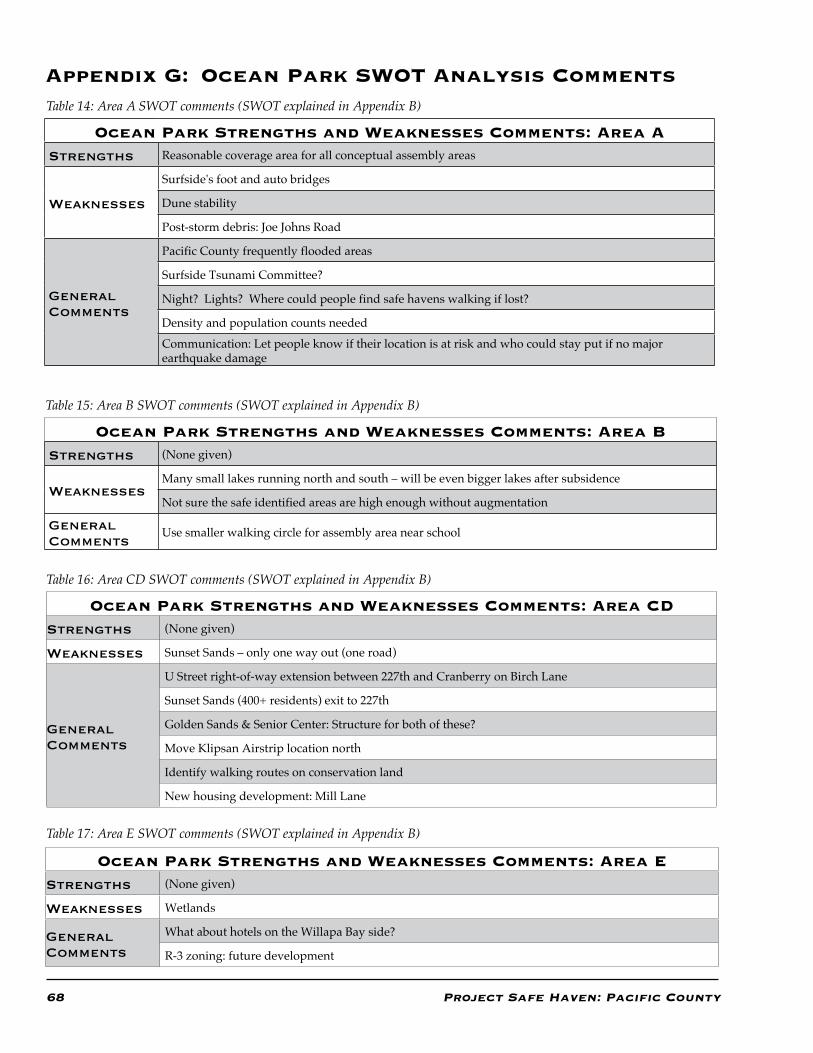
68 Project Safe Haven: Pacific County
Appendix G: Ocean Park SWOT Analysis Comments
Ocean Park Strengths and Weaknesses Comments: Area AStrengths Reasonable coverage area for all conceptual assembly areas
Weaknesses
Surfside's foot and auto bridges
Dune stability
Post-storm debris: Joe Johns Road
General Comments
Pacific County frequently flooded areas
Surfside Tsunami Committee?
Night? Lights? Where could people find safe havens walking if lost?
Density and population counts needed
Communication: Let people know if their location is at risk and who could stay put if no major earthquake damage
Table 14: Area A SWOT comments (SWOT explained in Appendix B)
Ocean Park Strengths and Weaknesses Comments: Area BStrengths (None given)
WeaknessesMany small lakes running north and south – will be even bigger lakes after subsidence
Not sure the safe identified areas are high enough without augmentation
General Comments
Use smaller walking circle for assembly area near school
Table 15: Area B SWOT comments (SWOT explained in Appendix B)
Ocean Park Strengths and Weaknesses Comments: Area CDStrengths (None given)
Weaknesses Sunset Sands – only one way out (one road)
General Comments
U Street right-of-way extension between 227th and Cranberry on Birch Lane
Sunset Sands (400+ residents) exit to 227th
Golden Sands & Senior Center: Structure for both of these?
Move Klipsan Airstrip location north
Identify walking routes on conservation land
New housing development: Mill Lane
Table 16: Area CD SWOT comments (SWOT explained in Appendix B)
Table 17: Area E SWOT comments (SWOT explained in Appendix B)
Ocean Park Strengths and Weaknesses Comments: Area EStrengths (None given)
Weaknesses Wetlands
General Comments
What about hotels on the Willapa Bay side?
R-3 zoning: future development
Project Safe Haven: Pacific County 69
By KEVIN HEIMBIGNER
LONG BEACH - Most of us have thought about what we would do if and when “The Big One” hits like the 9.1 earthquake and 22-foot high series of tsunami waves that struck the Peninsula in 1700, and now each of us can actually do something about improving chances of surviving such an event off our coast. And all you have to do is walk for 15 minutes and then report your age and how far you went.
Jeana Wiser, a University of Washington graduate student is doing research that may some day lead to building reinforced berms or parking garage-like structures or buildings that could safely accommodate people during the 24 hours it would take to withstand another “worst-case scenario” like what happened in 1700.
Wiser and her husband Jeff came to the Peninsula last week to encourage people to determine their circle of life, how far they could walk in 15 minutes, should a destructive earthquake and subsequent tsunami strike off our coast. They also went to sev-eral places where sophisticated light detection and ranging (LiDAR) equipment had determined were high enough to be safe during “The Big One.”
Wiser is working with Chris Scott, UW faculty advisor Bob Freitag, and a hazard mitigation instructor in a first of its kind project to provide elevated places to go for those in low-lying areas during a tsunami. Wiser visited Ocean Park, Long Beach, Ilwaco and Tokeland in April to discuss her project. “Our purpose of those meetings was to gain local knowledge and to make sure the plan would be community driven.”
She says, “We wanted to get people’s ideas and
Appendix H: Chinook Observer ArticleChinook Observer Long Beach, Washington
July 27, 2010
Walk 15 minutes to help increase survival during earthquake, tsunami
suggestions about what if a tsunami hit here. We wanted them to tell us where natural barriers such as marshes or sloughs might be.” Wiser adds, “The amount of interest was encouraging. Every com-munity wanted a high point near the schools as a priority.”
The Federal Emergency Management Adminis-tration (FEMA) has proposed plans for building structures one can go to in order to survive the ravages of an earthquake and resulting tsunami in Document P646. In each of the models they are working on designs that will withstand a 9.1 earth-quake. Wiser relates, “Information from Japan determined that here in 1700 the waves reached a height of 22 feet. The ground also sank six feet and FEMA is suggesting a six-foot margin of safety so the structures would be about 34 feet above sea level.”
There are places on the Peninsula that would likely be above water should a 9.1 earthquake hit off the coast, but many are accessible from the most pop-ulous areas only by automobile. Some of the high spots are behind gated entrances. It is likely roads would be blocked with fallen trees and debris and in some cases destroyed by the quake.
By far the least expensive type of structure to build would be reinforced berms. “Depending upon when a quake hits during the tide cycle it is estimated that the longest it would take for water levels to go back to normal would be 24 hours,” Wiser explains. The structures would be designed to keep people above a catastrophic series of waves that typically travel over 500 miles per hour and also the deadly surge of water later receding back to the ocean.
70 Project Safe Haven: Pacific County
“The berms could be used for many other things such as ball fields or places for recreation,” Wiser relates. “We just need to make sure when they are created that people can get to them within 15 min-utes and that’s where our current research comes in.”
And that’s where anyone willing to help with the project enters the picture. Just report your age, record your starting and ending points, your gen-eral rate of walking, and determine the distance you walk in 15 minutes. An automobile’s odometer with tenths of a mile reading can be helpful. Please call the Pacific County Emergency Management
office at 642-9340 by the Aug. 15 deadline with any questions.
“We will have a meeting in early October to dis-cuss the final draft from our study,” Wiser says. The study is funded by Washington State Emer-gency Management under the direction of John Schelling. Eventual implementation of the plan is likely years away, but for sure the North Ameri-can and Juan de Fuca subduction zone just off our coastline is something to do more than just think about.
Copyright, 2010, Chinook Observer (Long Beach, WA). All Rights Reserved. Reprinted with permission.
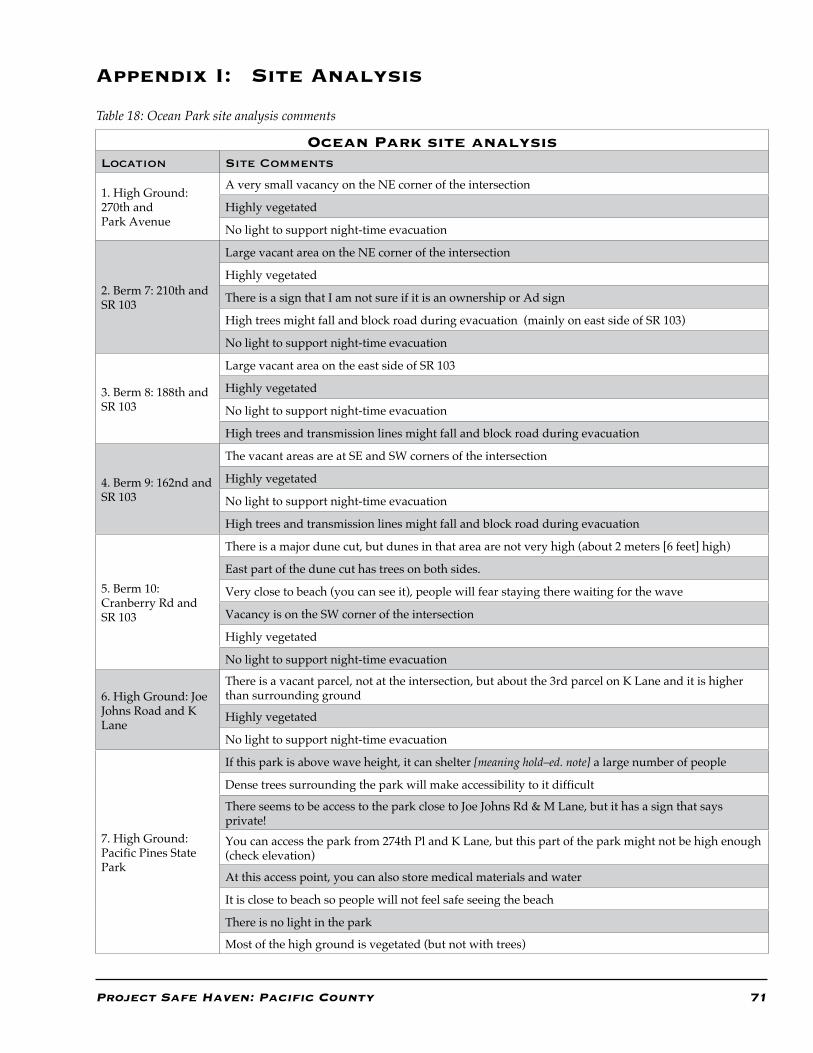
Project Safe Haven: Pacific County 71
Appendix I: Site Analysis
Ocean Park site analysisLocation Site Comments
1. High Ground: 270th and Park Avenue
A very small vacancy on the NE corner of the intersection
Highly vegetated
No light to support night-time evacuation
2. Berm 7: 210th and SR 103
Large vacant area on the NE corner of the intersection
Highly vegetated
There is a sign that I am not sure if it is an ownership or Ad sign
High trees might fall and block road during evacuation (mainly on east side of SR 103)
No light to support night-time evacuation
3. Berm 8: 188th and SR 103
Large vacant area on the east side of SR 103
Highly vegetated
No light to support night-time evacuation
High trees and transmission lines might fall and block road during evacuation
4. Berm 9: 162nd and SR 103
The vacant areas are at SE and SW corners of the intersection
Highly vegetated
No light to support night-time evacuation
High trees and transmission lines might fall and block road during evacuation
5. Berm 10: Cranberry Rd and SR 103
There is a major dune cut, but dunes in that area are not very high (about 2 meters [6 feet] high)
East part of the dune cut has trees on both sides.
Very close to beach (you can see it), people will fear staying there waiting for the wave
Vacancy is on the SW corner of the intersection
Highly vegetated
No light to support night-time evacuation
6. High Ground: Joe Johns Road and K Lane
There is a vacant parcel, not at the intersection, but about the 3rd parcel on K Lane and it is higher than surrounding ground
Highly vegetated
No light to support night-time evacuation
7. High Ground: Pacific Pines State Park
If this park is above wave height, it can shelter [meaning hold–ed. note] a large number of people
Dense trees surrounding the park will make accessibility to it difficult
There seems to be access to the park close to Joe Johns Rd & M Lane, but it has a sign that says private!You can access the park from 274th Pl and K Lane, but this part of the park might not be high enough (check elevation)
At this access point, you can also store medical materials and water
It is close to beach so people will not feel safe seeing the beach
There is no light in the park
Most of the high ground is vegetated (but not with trees)
Table 18: Ocean Park site analysis comments
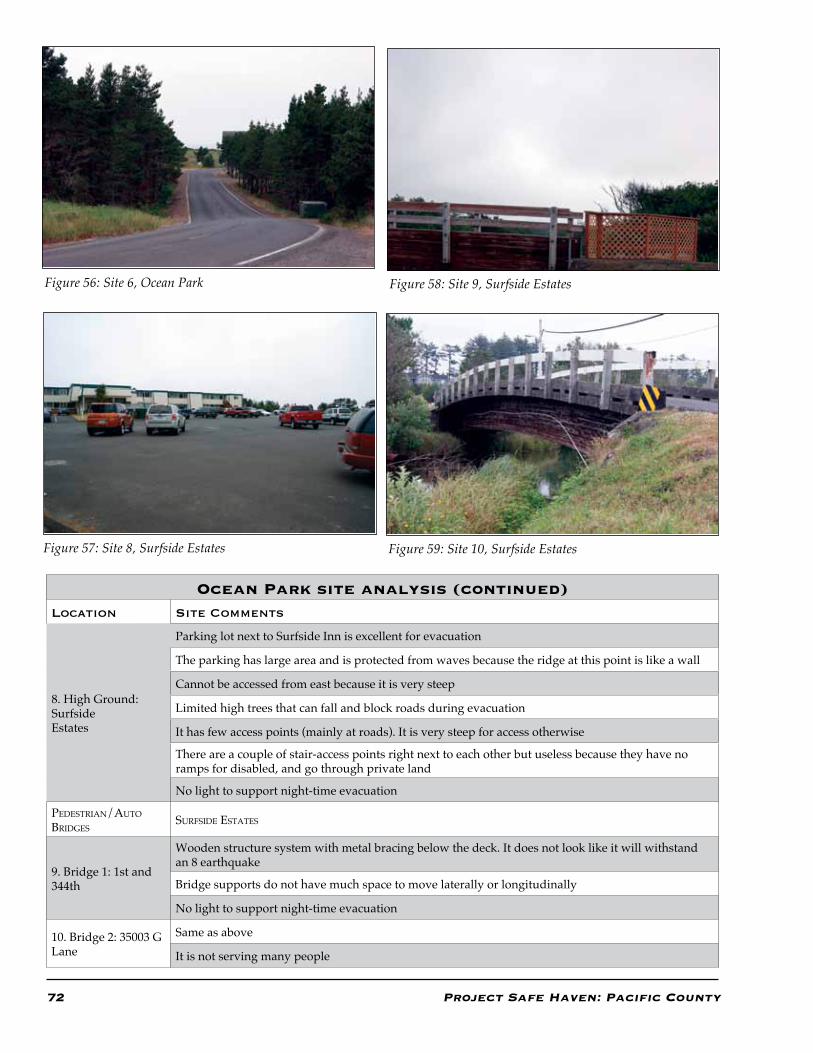
72 Project Safe Haven: Pacific County
Ocean Park site analysis (continued)Location Site Comments
8. High Ground: SurfsideEstates
Parking lot next to Surfside Inn is excellent for evacuation
The parking has large area and is protected from waves because the ridge at this point is like a wall
Cannot be accessed from east because it is very steep
Limited high trees that can fall and block roads during evacuation
It has few access points (mainly at roads). It is very steep for access otherwise
There are a couple of stair-access points right next to each other but useless because they have no ramps for disabled, and go through private land
No light to support night-time evacuation
Pedestrian/auto Bridges
surfside estates
9. Bridge 1: 1st and 344th
Wooden structure system with metal bracing below the deck. It does not look like it will withstand an 8 earthquake
Bridge supports do not have much space to move laterally or longitudinally
No light to support night-time evacuation
10. Bridge 2: 35003 G Lane
Same as above
It is not serving many people
Figure 56: Site 6, Ocean Park
Figure 57: Site 8, Surfside Estates
Figure 58: Site 9, Surfside Estates
Figure 59: Site 10, Surfside Estates
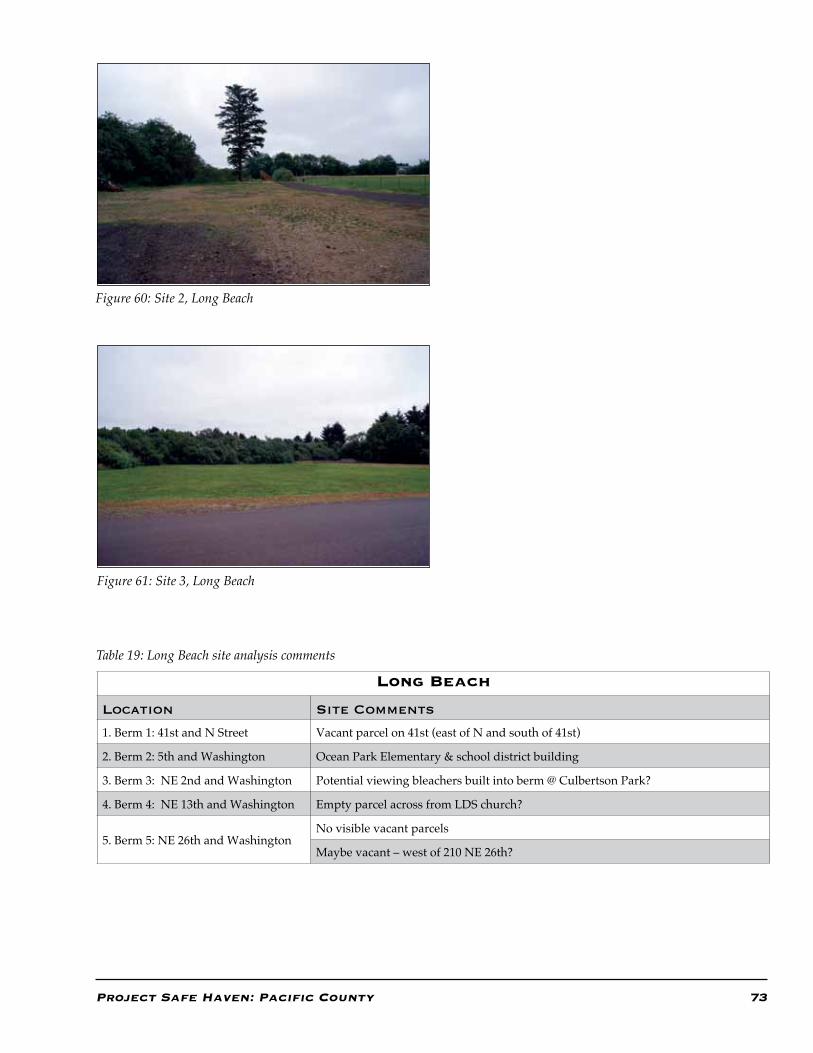
Project Safe Haven: Pacific County 73
Long Beach
Location Site Comments
1. Berm 1: 41st and N Street Vacant parcel on 41st (east of N and south of 41st)
2. Berm 2: 5th and Washington Ocean Park Elementary & school district building
3. Berm 3: NE 2nd and Washington Potential viewing bleachers built into berm @ Culbertson Park?
4. Berm 4: NE 13th and Washington Empty parcel across from LDS church?
5. Berm 5: NE 26th and WashingtonNo visible vacant parcels
Maybe vacant – west of 210 NE 26th?
Table 19: Long Beach site analysis comments
Figure 60: Site 2, Long Beach
Figure 61: Site 3, Long Beach
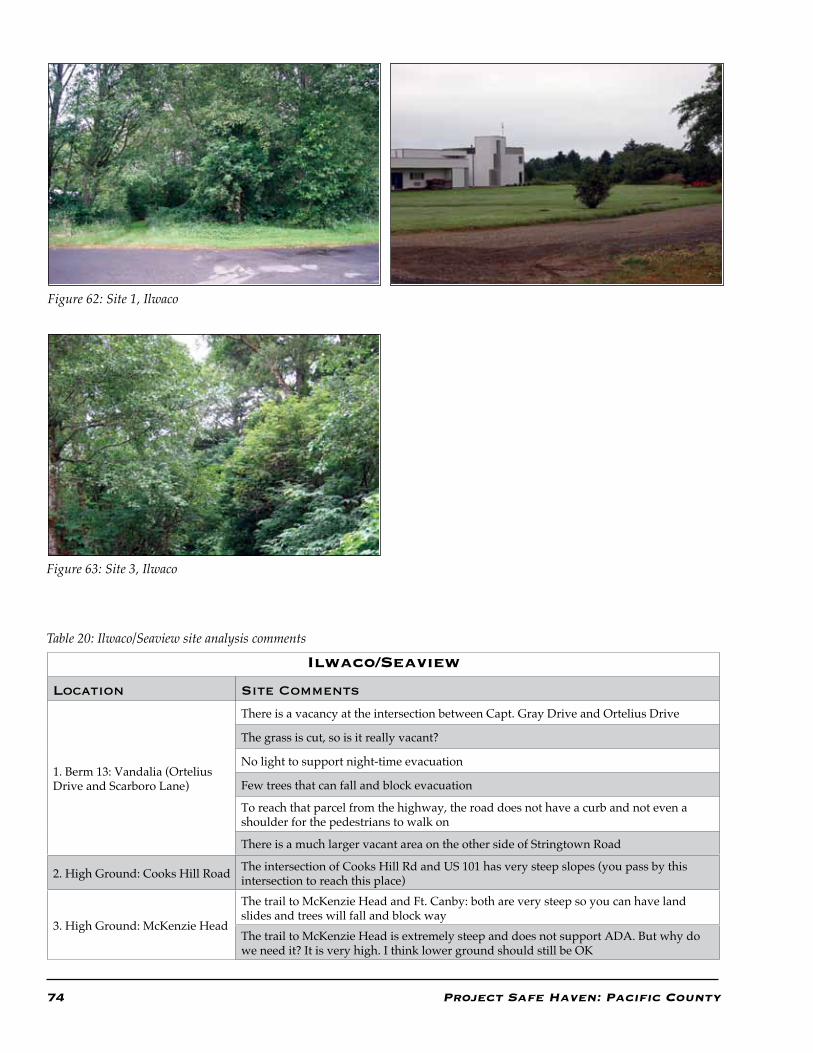
74 Project Safe Haven: Pacific County
Table 20: Ilwaco/Seaview site analysis comments
Ilwaco/Seaview
Location Site Comments
1. Berm 13: Vandalia (Ortelius Drive and Scarboro Lane)
There is a vacancy at the intersection between Capt. Gray Drive and Ortelius Drive
The grass is cut, so is it really vacant?
No light to support night-time evacuation
Few trees that can fall and block evacuation
To reach that parcel from the highway, the road does not have a curb and not even a shoulder for the pedestrians to walk on
There is a much larger vacant area on the other side of Stringtown Road
2. High Ground: Cooks Hill Road The intersection of Cooks Hill Rd and US 101 has very steep slopes (you pass by this intersection to reach this place)
3. High Ground: McKenzie Head
The trail to McKenzie Head and Ft. Canby: both are very steep so you can have land slides and trees will fall and block wayThe trail to McKenzie Head is extremely steep and does not support ADA. But why do we need it? It is very high. I think lower ground should still be OK
Figure 62: Site 1, Ilwaco
Figure 63: Site 3, Ilwaco
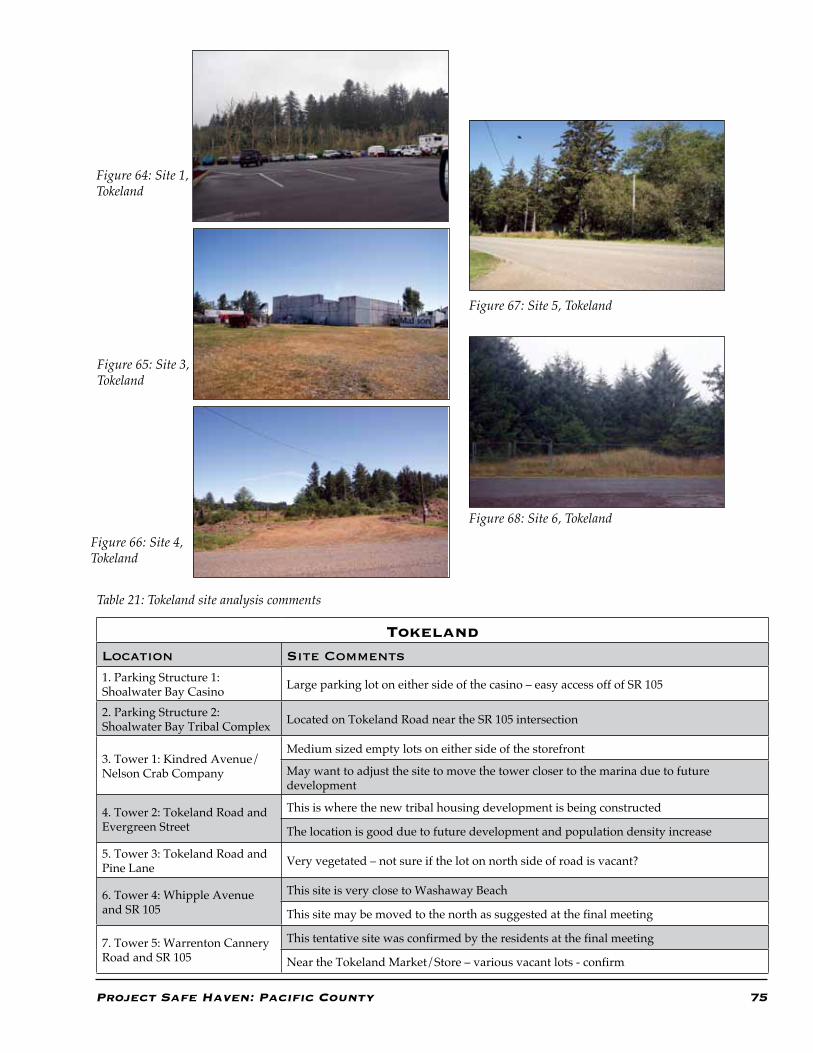
Project Safe Haven: Pacific County 75
Table 21: Tokeland site analysis comments
TokelandLocation Site Comments1. Parking Structure 1: Shoalwater Bay Casino Large parking lot on either side of the casino – easy access off of SR 105
2. Parking Structure 2: Shoalwater Bay Tribal Complex Located on Tokeland Road near the SR 105 intersection
3. Tower 1: Kindred Avenue/Nelson Crab Company
Medium sized empty lots on either side of the storefront
May want to adjust the site to move the tower closer to the marina due to future development
4. Tower 2: Tokeland Road and Evergreen Street
This is where the new tribal housing development is being constructed
The location is good due to future development and population density increase
5. Tower 3: Tokeland Road and Pine Lane Very vegetated – not sure if the lot on north side of road is vacant?
6. Tower 4: Whipple Avenue and SR 105
This site is very close to Washaway Beach
This site may be moved to the north as suggested at the final meeting
7. Tower 5: Warrenton Cannery Road and SR 105
This tentative site was confirmed by the residents at the final meeting
Near the Tokeland Market/Store – various vacant lots - confirm
Figure 64: Site 1, Tokeland
Figure 65: Site 3, Tokeland
Figure 66: Site 4, Tokeland
Figure 67: Site 5, Tokeland
Figure 68: Site 6, Tokeland
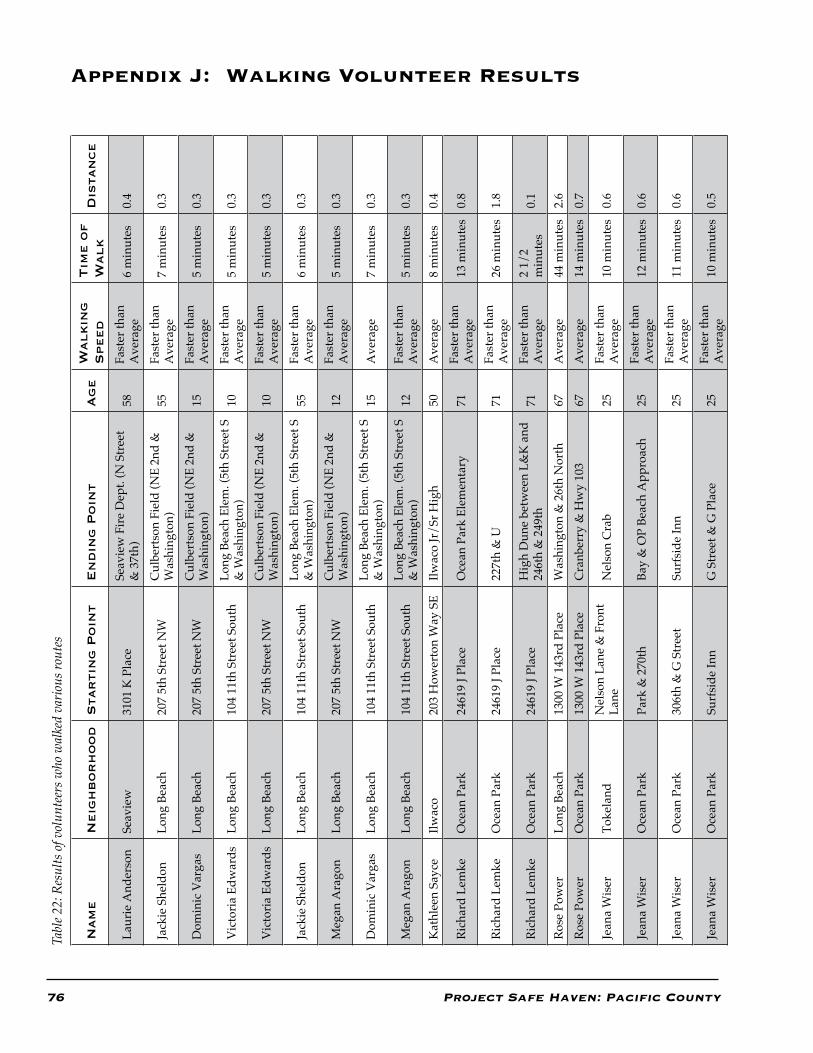
76 Project Safe Haven: Pacific County
Appendix J: Walking Volunteer ResultsN
am
eN
eig
hb
or
ho
od
Sta
rti
ng
Po
int
En
din
g P
oin
tA
ge
Walkin
g
Speed
Tim
e o
f
Walk
Dis
tan
ce
Laur
ie A
nder
son
Seav
iew
3101
K P
lace
Seav
iew
Fire
Dep
t. (N
Str
eet
& 3
7th)
58Fa
ster
than
A
vera
ge6
min
utes
0.4
Jack
ie S
held
onLo
ng B
each
207
5th
Stre
et N
WC
ulbe
rtso
n Fi
eld
(NE
2nd
&
Was
hing
ton)
55Fa
ster
than
A
vera
ge7
min
utes
0.3
Dom
inic
Var
gas
Long
Bea
ch20
7 5t
h St
reet
NW
Cul
bert
son
Fiel
d (N
E 2n
d &
W
ashi
ngto
n)15
Fast
er th
an
Ave
rage
5 m
inut
es0.
3
Vic
toria
Edw
ards
Long
Bea
ch10
4 11
th S
tree
t Sou
thLo
ng B
each
Ele
m. (
5th
Stre
et S
&
Was
hing
ton)
10Fa
ster
than
A
vera
ge5
min
utes
0.3
Vic
toria
Edw
ards
Long
Bea
ch20
7 5t
h St
reet
NW
Cul
bert
son
Fiel
d (N
E 2n
d &
W
ashi
ngto
n)10
Fast
er th
an
Ave
rage
5 m
inut
es0.
3
Jack
ie S
held
onLo
ng B
each
104
11th
Str
eet S
outh
Long
Bea
ch E
lem
. (5t
h St
reet
S
& W
ashi
ngto
n)55
Fast
er th
an
Ave
rage
6 m
inut
es0.
3
Meg
an A
rago
nLo
ng B
each
207
5th
Stre
et N
WC
ulbe
rtso
n Fi
eld
(NE
2nd
&
Was
hing
ton)
12Fa
ster
than
A
vera
ge5
min
utes
0.3
Dom
inic
Var
gas
Long
Bea
ch10
4 11
th S
tree
t Sou
thLo
ng B
each
Ele
m. (
5th
Stre
et S
&
Was
hing
ton)
15A
vera
ge7
min
utes
0.3
Meg
an A
rago
nLo
ng B
each
104
11th
Str
eet S
outh
Long
Bea
ch E
lem
. (5t
h St
reet
S
& W
ashi
ngto
n)12
Fast
er th
an
Ave
rage
5 m
inut
es0.
3
Kat
hlee
n Sa
yce
Ilwac
o20
3 H
ower
ton
Way
SE
Ilwac
o Jr
/Sr H
igh
50A
vera
ge8
min
utes
0.4
Rich
ard
Lem
keO
cean
Par
k24
619
J Pla
ceO
cean
Par
k El
emen
tary
71Fa
ster
than
A
vera
ge13
min
utes
0.8
Rich
ard
Lem
keO
cean
Par
k24
619
J Pla
ce22
7th
& U
71Fa
ster
than
A
vera
ge26
min
utes
1.8
Rich
ard
Lem
keO
cean
Par
k24
619
J Pla
ceH
igh
Dun
e be
twee
n L&
K a
nd
246t
h &
249
th71
Fast
er th
an
Ave
rage
2 1/
2 m
inut
es0.
1
Rose
Pow
erLo
ng B
each
1300
W 1
43rd
Pla
ceW
ashi
ngto
n &
26t
h N
orth
67A
vera
ge44
min
utes
2.6
Rose
Pow
erO
cean
Par
k13
00 W
143
rd P
lace
Cra
nber
ry &
Hw
y 10
367
Ave
rage
14 m
inut
es0.
7
Jean
a W
iser
Toke
land
Nel
son
Lane
& F
ront
La
neN
elso
n C
rab
25Fa
ster
than
A
vera
ge10
min
utes
0.6
Jean
a W
iser
Oce
an P
ark
Park
& 2
70th
Bay
& O
P Be
ach
App
roac
h25
Fast
er th
an
Ave
rage
12 m
inut
es0.
6
Jean
a W
iser
Oce
an P
ark
306t
h &
G S
tree
tSu
rfsi
de In
n25
Fast
er th
an
Ave
rage
11 m
inut
es0.
6
Jean
a W
iser
Oce
an P
ark
Surf
side
Inn
G S
tree
t & G
Pla
ce25
Fast
er th
an
Ave
rage
10 m
inut
es0.
5
Tabl
e 22:
Res
ults
of v
olun
teer
s who
wal
ked
vario
us ro
utes
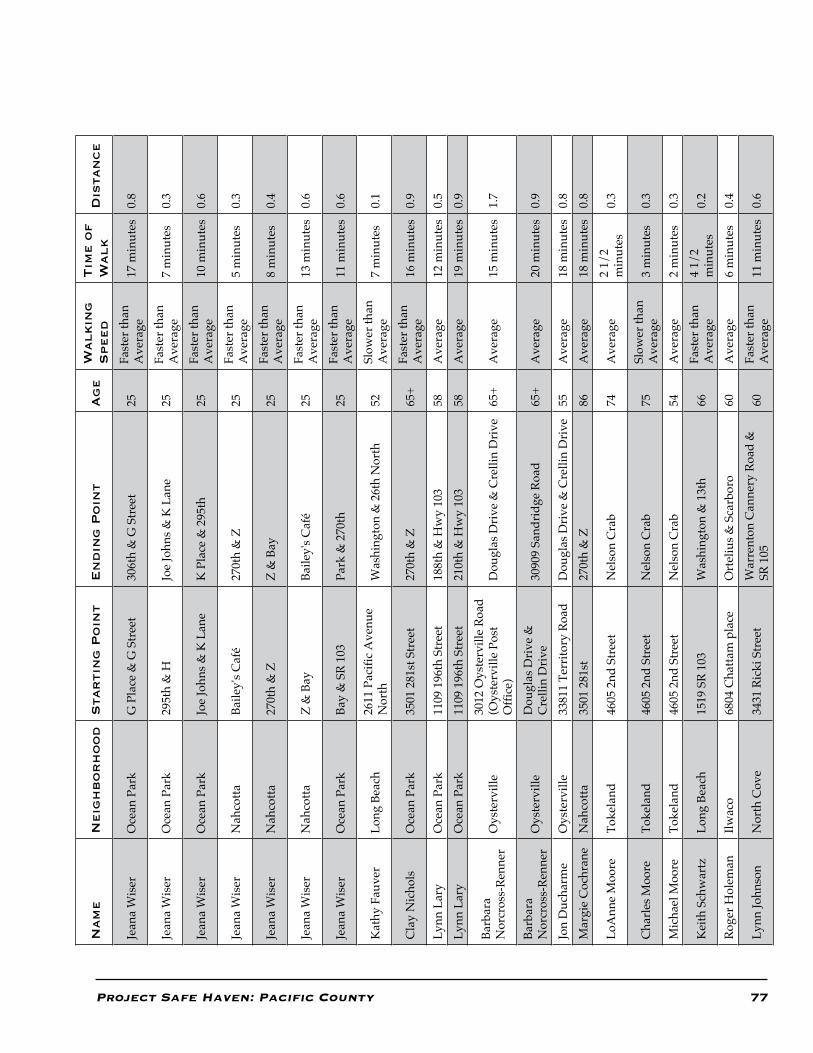
Project Safe Haven: Pacific County 77
Nam
eN
eig
hb
or
ho
od
Sta
rti
ng
Po
int
En
din
g P
oin
tA
ge
Walkin
g
Speed
Tim
e o
f
Walk
Dis
tan
ce
Jean
a W
iser
Oce
an P
ark
G P
lace
& G
Str
eet
306t
h &
G S
tree
t25
Fast
er th
an
Ave
rage
17 m
inut
es0.
8
Jean
a W
iser
Oce
an P
ark
295t
h &
H
Joe
John
s & K
Lan
e25
Fast
er th
an
Ave
rage
7 m
inut
es0.
3
Jean
a W
iser
Oce
an P
ark
Joe
John
s & K
Lan
eK
Pla
ce &
295
th25
Fast
er th
an
Ave
rage
10 m
inut
es0.
6
Jean
a W
iser
Nah
cotta
Baile
y's C
afé
270t
h &
Z25
Fast
er th
an
Ave
rage
5 m
inut
es0.
3
Jean
a W
iser
Nah
cotta
270t
h &
ZZ
& B
ay25
Fast
er th
an
Ave
rage
8 m
inut
es0.
4
Jean
a W
iser
Nah
cotta
Z &
Bay
Baile
y's C
afé
25Fa
ster
than
A
vera
ge13
min
utes
0.6
Jean
a W
iser
Oce
an P
ark
Bay
& S
R 10
3Pa
rk &
270
th
25Fa
ster
than
A
vera
ge11
min
utes
0.6
Kat
hy F
auve
rLo
ng B
each
2611
Pac
ific
Ave
nue
Nor
thW
ashi
ngto
n &
26t
h N
orth
52Sl
ower
than
A
vera
ge7
min
utes
0.1
Cla
y N
icho
lsO
cean
Par
k35
01 2
81st
Str
eet
270t
h &
Z65
+Fa
ster
than
A
vera
ge16
min
utes
0.9
Lynn
Lar
yO
cean
Par
k11
09 1
96th
Str
eet
188t
h &
Hw
y 10
358
Ave
rage
12 m
inut
es0.
5Ly
nn L
ary
Oce
an P
ark
1109
196
th S
tree
t21
0th
& H
wy
103
58A
vera
ge19
min
utes
0.9
Barb
ara
Nor
cros
s-Re
nner
Oys
terv
ille
3012
Oys
terv
ille
Road
(O
yste
rvill
e Po
st
Offi
ce)
Dou
glas
Driv
e &
Cre
llin
Driv
e65
+A
vera
ge15
min
utes
1.7
Barb
ara
Nor
cros
s-Re
nner
Oys
terv
ille
Dou
glas
Driv
e &
C
relli
n D
rive
3090
9 Sa
ndrid
ge R
oad
65+
Ave
rage
20 m
inut
es0.
9
Jon
Duc
harm
eO
yste
rvill
e33
811
Terr
itory
Roa
dD
ougl
as D
rive
& C
relli
n D
rive
55A
vera
ge18
min
utes
0.8
Mar
gie
Coc
hran
eN
ahco
tta35
01 2
81st
27
0th
& Z
86A
vera
ge18
min
utes
0.8
LoA
nne
Moo
reTo
kela
nd46
05 2
nd S
tree
tN
elso
n C
rab
74A
vera
ge2
1/2
min
utes
0.3
Cha
rles M
oore
Toke
land
4605
2nd
Str
eet
Nel
son
Cra
b75
Slow
er th
an
Ave
rage
3 m
inut
es0.
3
Mic
hael
Moo
reTo
kela
nd46
05 2
nd S
tree
tN
elso
n C
rab
54A
vera
ge2
min
utes
0.3
Kei
th S
chw
artz
Long
Bea
ch15
19 S
R 10
3W
ashi
ngto
n &
13t
h 66
Fast
er th
an
Ave
rage
4 1/
2 m
inut
es0.
2
Roge
r Hol
eman
Ilwac
o68
04 C
hatta
m p
lace
Ort
eliu
s & S
carb
oro
60A
vera
ge6
min
utes
0.4
Lynn
John
son
Nor
th C
ove
3431
Ric
ki S
tree
tW
arre
nton
Can
nery
Roa
d &
SR
105
60Fa
ster
than
A
vera
ge11
min
utes
0.6
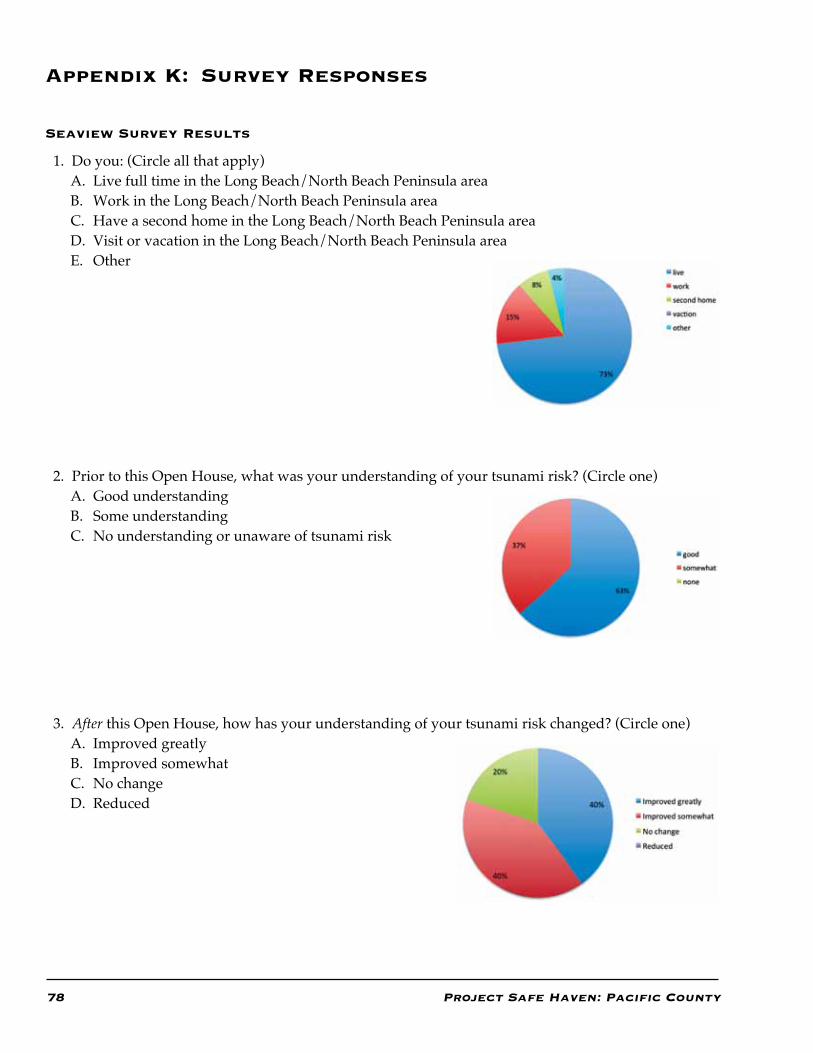
78 Project Safe Haven: Pacific County
Appendix K: Survey Responses
Seaview Survey Results
1. Do you: (Circle all that apply) A. Live full time in the Long Beach/North Beach Peninsula areaB. Work in the Long Beach/North Beach Peninsula areaC. Have a second home in the Long Beach/North Beach Peninsula areaD. Visit or vacation in the Long Beach/North Beach Peninsula areaE. Other
2. Prior to this Open House, what was your understanding of your tsunami risk? (Circle one)A. Good understandingB. Some understanding C. No understanding or unaware of tsunami risk
3. After this Open House, how has your understanding of your tsunami risk changed? (Circle one)A. Improved greatlyB. Improved somewhatC. No changeD. Reduced
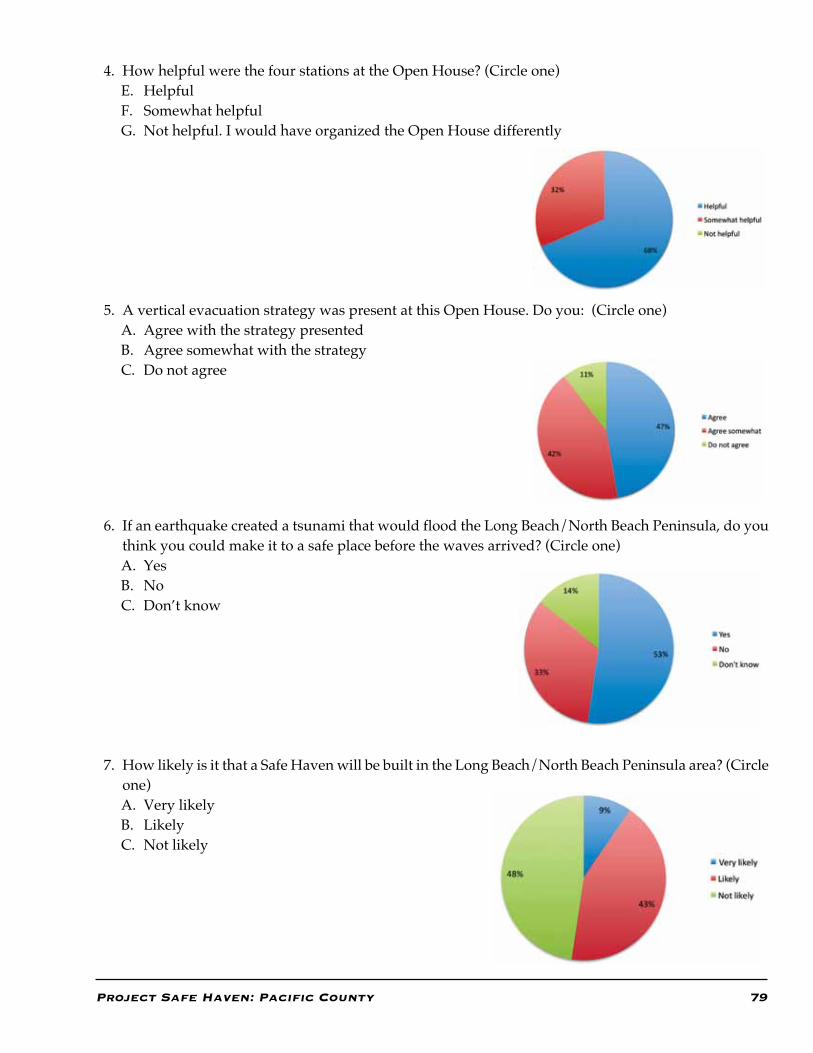
Project Safe Haven: Pacific County 79
4. How helpful were the four stations at the Open House? (Circle one)E. HelpfulF. Somewhat helpfulG. Not helpful. I would have organized the Open House differently
5. A vertical evacuation strategy was present at this Open House. Do you: (Circle one) A. Agree with the strategy presentedB. Agree somewhat with the strategy C. Do not agree
6. If an earthquake created a tsunami that would flood the Long Beach/North Beach Peninsula, do you think you could make it to a safe place before the waves arrived? (Circle one)A. YesB. No C. Don’t know
7. How likely is it that a Safe Haven will be built in the Long Beach/North Beach Peninsula area? (Circle one) A. Very likelyB. LikelyC. Not likely
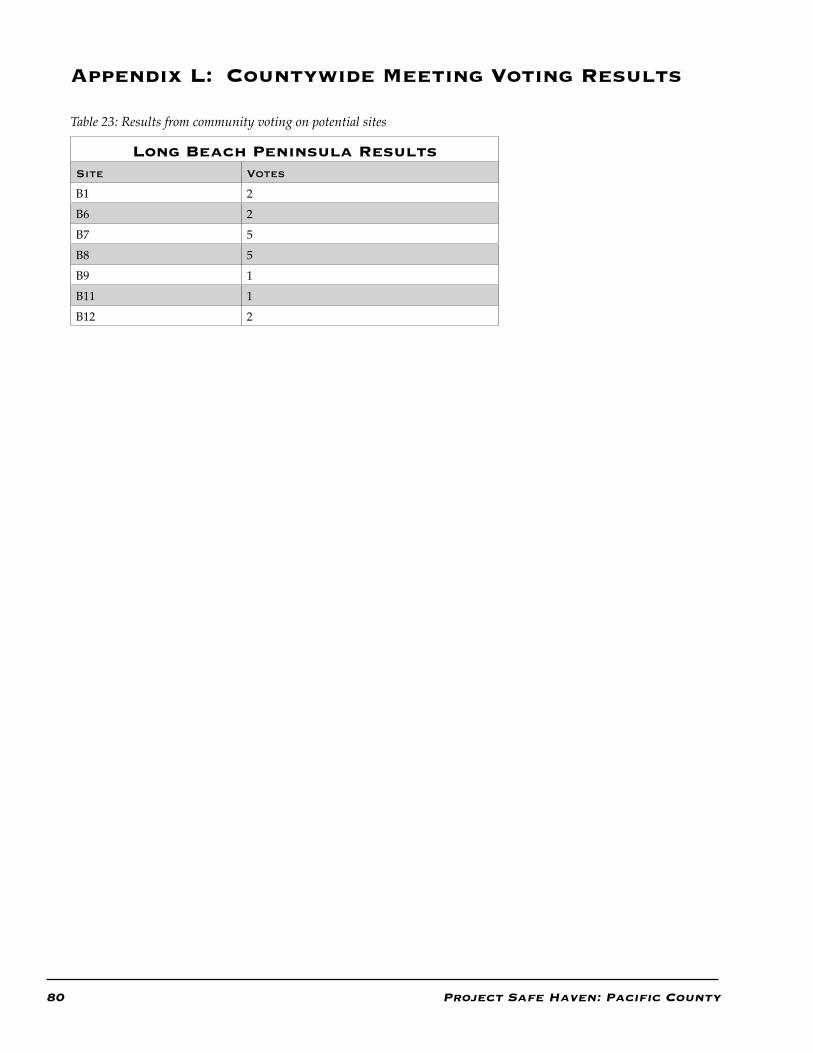
80 Project Safe Haven: Pacific County
Appendix L: Countywide Meeting Voting Results
Long Beach Peninsula ResultsSite Votes
B1 2B6 2B7 5B8 5B9 1B11 1B12 2
Table 23: Results from community voting on potential sites
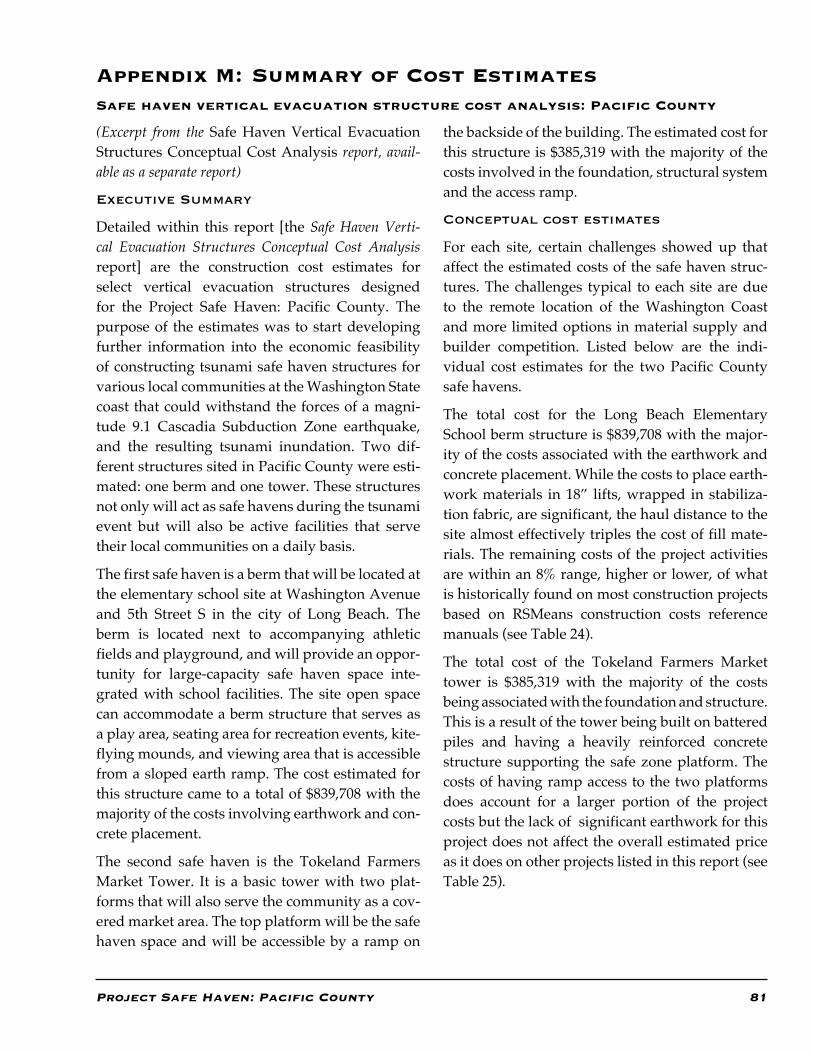
Project Safe Haven: Pacific County 81
Appendix M: Summary of Cost EstimatesSafe haven vertical evacuation structure cost analysis: Pacific County
(Excerpt from the Safe Haven Vertical Evacuation Structures Conceptual Cost Analysis report, avail-able as a separate report)
Executive Summary
Detailed within this report [the Safe Haven Verti-cal Evacuation Structures Conceptual Cost Analysis report] are the construction cost estimates for select vertical evacuation structures designed for the Project Safe Haven: Pacific County. The purpose of the estimates was to start developing further information into the economic feasibility of constructing tsunami safe haven structures for various local communities at the Washington State coast that could withstand the forces of a magni-tude 9.1 Cascadia Subduction Zone earthquake, and the resulting tsunami inundation. Two dif-ferent structures sited in Pacific County were esti-mated: one berm and one tower. These structures not only will act as safe havens during the tsunami event but will also be active facilities that serve their local communities on a daily basis.
The first safe haven is a berm that will be located at the elementary school site at Washington Avenue and 5th Street S in the city of Long Beach. The berm is located next to accompanying athletic fields and playground, and will provide an oppor-tunity for large-capacity safe haven space inte-grated with school facilities. The site open space can accommodate a berm structure that serves as a play area, seating area for recreation events, kite-flying mounds, and viewing area that is accessible from a sloped earth ramp. The cost estimated for this structure came to a total of $839,708 with the majority of the costs involving earthwork and con-crete placement.
The second safe haven is the Tokeland Farmers Market Tower. It is a basic tower with two plat-forms that will also serve the community as a cov-ered market area. The top platform will be the safe haven space and will be accessible by a ramp on
the backside of the building. The estimated cost for this structure is $385,319 with the majority of the costs involved in the foundation, structural system and the access ramp.
Conceptual cost estimates
For each site, certain challenges showed up that affect the estimated costs of the safe haven struc-tures. The challenges typical to each site are due to the remote location of the Washington Coast and more limited options in material supply and builder competition. Listed below are the indi-vidual cost estimates for the two Pacific County safe havens.
The total cost for the Long Beach Elementary School berm structure is $839,708 with the major-ity of the costs associated with the earthwork and concrete placement. While the costs to place earth-work materials in 18” lifts, wrapped in stabiliza-tion fabric, are significant, the haul distance to the site almost effectively triples the cost of fill mate-rials. The remaining costs of the project activities are within an 8% range, higher or lower, of what is historically found on most construction projects based on RSMeans construction costs reference manuals (see Table 24).
The total cost of the Tokeland Farmers Market tower is $385,319 with the majority of the costs being associated with the foundation and structure. This is a result of the tower being built on battered piles and having a heavily reinforced concrete structure supporting the safe zone platform. The costs of having ramp access to the two platforms does account for a larger portion of the project costs but the lack of significant earthwork for this project does not affect the overall estimated price as it does on other projects listed in this report (see Table 25).
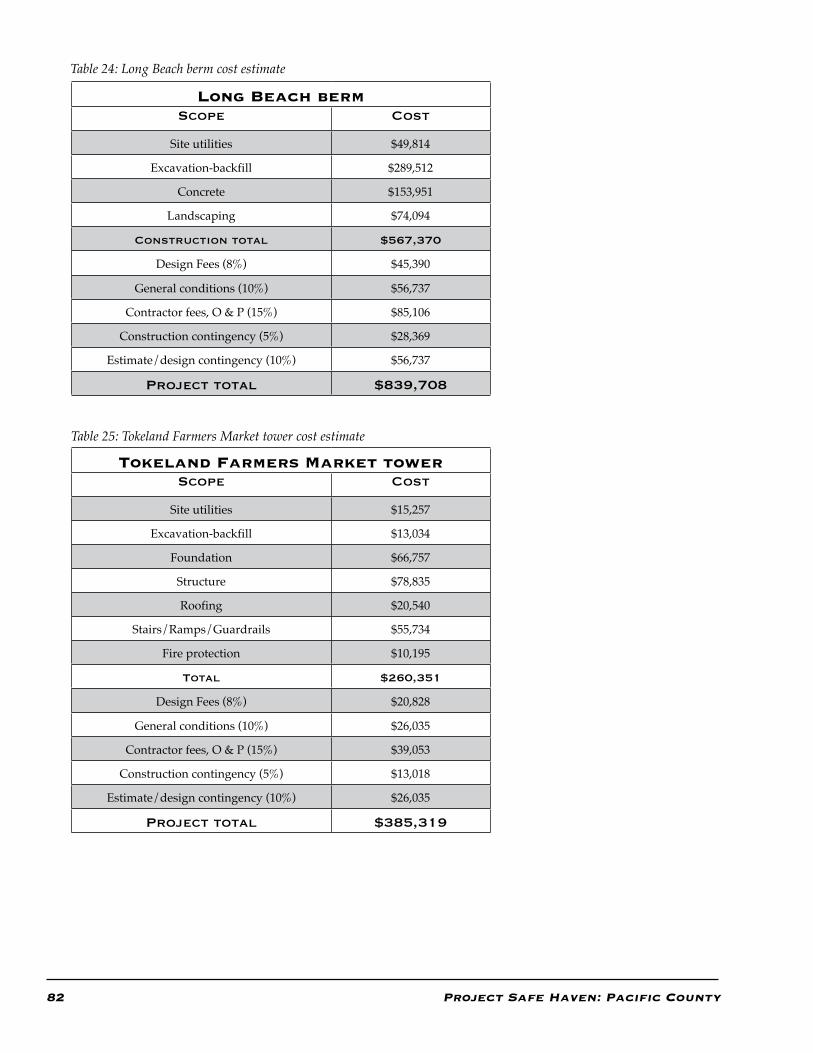
82 Project Safe Haven: Pacific County
Long Beach bermScope Cost
Site utilities $49,814
Excavation-backfill $289,512
Concrete $153,951
Landscaping $74,094
Construction total $567,370
Design Fees (8%) $45,390
General conditions (10%) $56,737
Contractor fees, O & P (15%) $85,106
Construction contingency (5%) $28,369
Estimate/design contingency (10%) $56,737
Project total $839,708
Table 24: Long Beach berm cost estimate
Tokeland Farmers Market towerScope Cost
Site utilities $15,257
Excavation-backfill $13,034
Foundation $66,757
Structure $78,835
Roofing $20,540
Stairs/Ramps/Guardrails $55,734
Fire protection $10,195
Total $260,351
Design Fees (8%) $20,828
General conditions (10%) $26,035
Contractor fees, O & P (15%) $39,053
Construction contingency (5%) $13,018
Estimate/design contingency (10%) $26,035
Project total $385,319
Table 25: Tokeland Farmers Market tower cost estimate
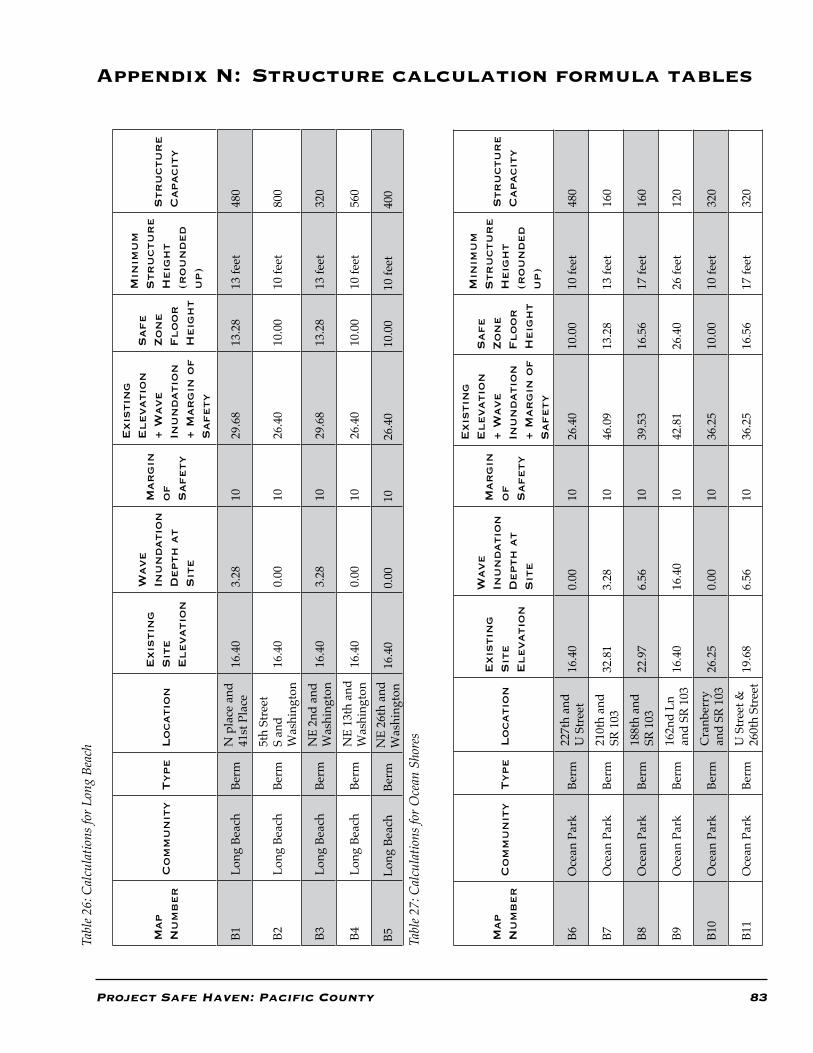
Project Safe Haven: Pacific County 83
Appendix N: Structure calculation formula tables
Map
Nu
mb
er
Co
mm
un
ity
Type
Lo
cati
on
Exis
tin
g
Sit
e
Elevati
on
Wave
Inu
nd
ati
on
D
epth
at
Sit
e
Mar
gin
o
f
Safety
Exis
tin
g
Elevati
on
+ W
ave
Inu
nd
ati
on
+ M
ar
gin
of
Safety
Safe
Zo
ne
Flo
or
H
eig
ht
Min
imu
m
Str
uctu
re
Heig
ht
(ro
un
ded
u
p)
Str
uctu
re
Capacit
y
B1Lo
ng B
each
Berm
N p
lace
and
41
st P
lace
16.4
03.
2810
29.6
813
.28
13 fe
et48
0
B2Lo
ng B
each
Berm
5th
Stre
et
S an
d W
ashi
ngto
n16
.40
0.00
1026
.40
10.0
010
feet
800
B3Lo
ng B
each
Berm
NE
2nd
and
Was
hing
ton
16.4
03.
2810
29.6
813
.28
13 fe
et32
0
B4Lo
ng B
each
Berm
NE
13th
and
W
ashi
ngto
n16
.40
0.00
1026
.40
10.0
010
feet
560
B5Lo
ng B
each
Berm
NE
26th
and
W
ashi
ngto
n16
.40
0.00
1026
.40
10.0
010
feet
400
Tabl
e 26:
Cal
cula
tions
for L
ong
Beac
h
Map
Nu
mb
er
Co
mm
un
ity
Type
Lo
cati
on
Exis
tin
g
Sit
e
Elevati
on
Wave
Inu
nd
ati
on
D
epth
at
Sit
e
Mar
gin
o
f
Safety
Exis
tin
g
Elevati
on
+ W
ave
Inu
nd
ati
on
+ M
ar
gin
of
Safety
Safe
Zo
ne
Flo
or
H
eig
ht
Min
imu
m
Str
uctu
re
Heig
ht
(ro
un
ded
u
p)
Str
uctu
re
Capacit
y
B6O
cean
Par
kBe
rm22
7th
and
U S
tree
t16
.40
0.00
1026
.40
10.0
010
feet
480
B7O
cean
Par
kBe
rm21
0th
and
SR 1
0332
.81
3.28
1046
.09
13.2
813
feet
160
B8O
cean
Par
kBe
rm18
8th
and
SR 1
0322
.97
6.56
1039
.53
16.5
617
feet
160
B9O
cean
Par
kBe
rm16
2nd
Ln
and
SR 1
0316
.40
16.4
010
42.8
126
.40
26 fe
et12
0
B10
Oce
an P
ark
Berm
Cra
nber
ry
and
SR 1
0326
.25
0.00
1036
.25
10.0
010
feet
320
B11
Oce
an P
ark
Berm
U S
tree
t &
260t
h St
reet
19.6
86.
5610
36.2
516
.56
17 fe
et32
0
Tabl
e 27:
Cal
cula
tions
for O
cean
Sho
res
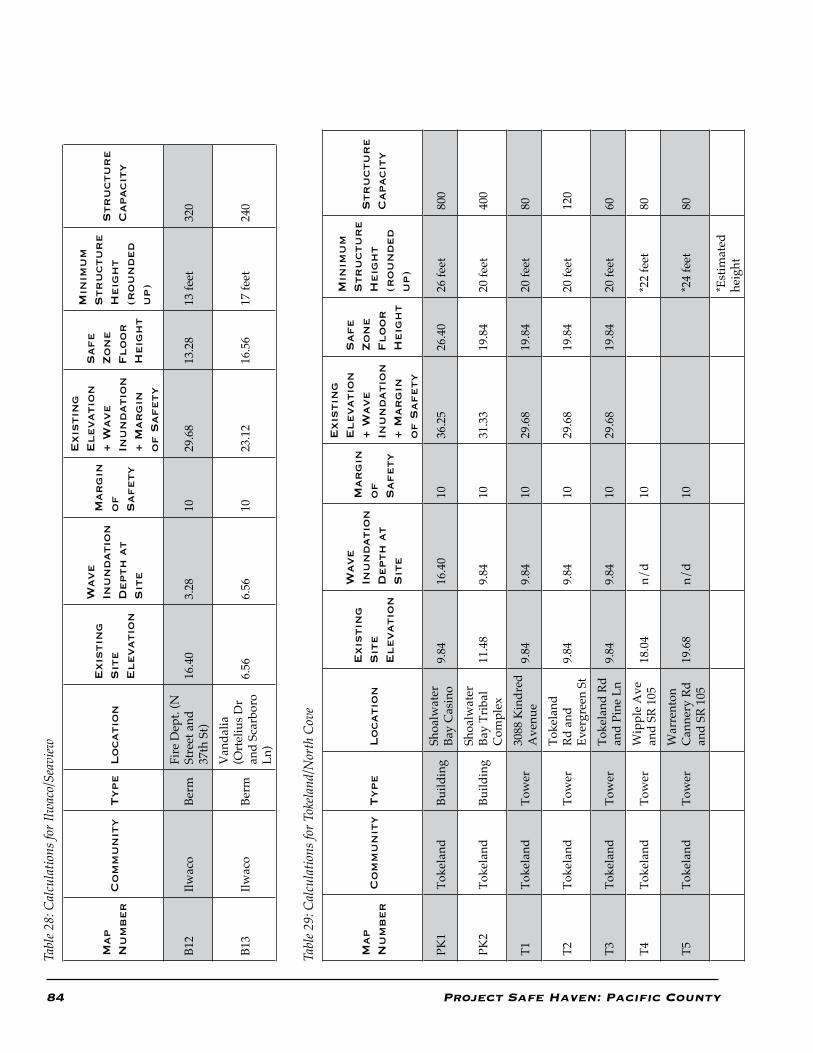
84 Project Safe Haven: Pacific County
Tabl
e 28:
Cal
cula
tions
for I
lwac
o/Se
aview
Map
Nu
mb
er
Co
mm
un
ity
Type
Lo
cati
on
Exis
tin
g
Sit
e
Elevati
on
Wave
Inu
nd
ati
on
D
epth
at
Sit
e
Mar
gin
o
f
Safety
Exis
tin
g
Elevati
on
+ W
ave
Inu
nd
ati
on
+ M
ar
gin
o
f S
afety
Safe
Zo
ne
Flo
or
H
eig
ht
Min
imu
m
Str
uctu
re
Heig
ht
(ro
un
ded
u
p)
Str
uctu
re
Capacit
y
B12
Ilwac
oBe
rmFi
re D
ept.
(N
Stre
et a
nd
37th
St)
16.4
03.
2810
29.6
813
.28
13 fe
et32
0
B13
Ilwac
oBe
rm
Van
dalia
(O
rtel
ius D
r an
d Sc
arbo
ro
Ln)
6.56
6.56
1023
.12
16.5
617
feet
240
Tabl
e 29:
Cal
cula
tions
for T
okela
nd/N
orth
Cov
e
Map
Nu
mb
er
Co
mm
un
ity
Type
Lo
cati
on
Exis
tin
g
Sit
e
Elevati
on
Wave
Inu
nd
ati
on
D
epth
at
Sit
e
Mar
gin
o
f
Safety
Exis
tin
g
Elevati
on
+ W
ave
Inu
nd
ati
on
+ M
ar
gin
o
f S
afety
Safe
Zo
ne
Flo
or
H
eig
ht
Min
imu
m
Str
uctu
re
Heig
ht
(ro
un
ded
u
p)
Str
uctu
re
Capacit
y
PK1
Toke
land
Build
ing
Shoa
lwat
er
Bay
Cas
ino
9.84
16.4
010
36.2
526
.40
26 fe
et80
0
PK2
Toke
land
Build
ing
Shoa
lwat
er
Bay
Trib
al
Com
plex
11.4
89.
8410
31.3
319
.84
20 fe
et40
0
T1To
kela
ndTo
wer
3088
Kin
dred
A
venu
e9.
849.
8410
29.6
819
.84
20 fe
et80
T2To
kela
ndTo
wer
Toke
land
Rd
and
Ev
ergr
een
St9.
849.
8410
29.6
819
.84
20 fe
et12
0
T3To
kela
ndTo
wer
Toke
land
Rd
and
Pine
Ln
9.84
9.84
1029
.68
19.8
420
feet
60
T4To
kela
ndTo
wer
Wip
ple
Ave
an
d SR
105
18.0
4n/
d10
*22
feet
80
T5To
kela
ndTo
wer
War
rent
on
Can
nery
Rd
and
SR 1
0519
.68
n/d
10*2
4 fe
et80
*Est
imat
ed
heig
ht
Project Safe Haven: Pacific County 85
College of Built Environments, University of Washington
Oversight Team:
bOb freitag cfm:
Bob Freitag is Director of the Institute for Hazards Mitigation Planning and Research, and Affili-ate Faculty at the University of Washington. The Institute promotes hazards mitigation principles through courses, student intern opportunities and research. Freitag is currently serving on the Board of Directors for the Association of State Flood-plain Managers (ASFPM) and was past Director of the Cascadia Region Earthquake Workgroup (CREW). He is coauthor of “Floodplain Manage-ment: A new approach for a new era” (Island Press 2009). In coming to the University, he left a 25-year career with the Federal Emergency Management Agency (FEMA) serving as Federal Coordinating Officer (FCO); Public Assistance, Mitigation and Education Officer. Before coming to FEMA, he was employed by several private architectural and engineering firms in Hawaii and Australia, and taught science as a Peace Corps Volunteer in the Philippines. Freitag received his Master of Urban Planning degree from the University of Washington.jeana c. wiser:
Jeana C. Wiser is a research assistant at the Institute for Hazards Mitigation Planning and Research at the University of Washington. She is the Planning and Outreach Project Lead for Project Safe Haven. Jeana has specialized experience in the following areas: hazard mitigation planning, historic pres-ervation, adaptive re-use, community outreach and project management. She recently graduated in June 2011 from the University of Washington with a Master’s of Urban Planning. In addition to the master’s degree, Jeana also earned a Certifi-cate of Historic Preservation. Her thesis research addressed the integration of Historic Preserva-tion and Hazard Mitigation especially regarding
Appendix 0: Project Safe Haven Submitted Biographies
Seattle’s unreinforced masonry buildings. Jeana also has two Bachelors’ of Science degrees in Ethnic Studies and Liberal Studies from Oregon State University. amanda engstfeld:
Amanda Engstfeld is a graduate of the Institute for Hazards Mitigation Planning and Research and holds a Masters Degree in Urban Planning, with a focus on hazard mitigation planning and land use from the University of Washington. Amanda is currently a Risk Analyst in the Mitigation Division for FEMA Region X. Prior to working for FEMA, Amanda worked as an Emergency Planner for the City of Redmond, Washington.
katherine killebrew:
Katherine Killebrew received her Master of Urban Planning and Master of Public Administration from the University of Washington in 2010. She now works as a policy analyst for the U.S. Govern-ment Accountability Office in the agency’s Seattle field office.christOPher a. scOtt:
Christopher Scott is a Master of Urban Planning student at the University of Washington, study-ing natural hazard and environmental resource planning. He holds a Bachelor of Arts in environ-mental studies from the University of Washington Bothell, where he focused on natural hazards and restoration ecology. Before continuing his educa-tion, Christopher was employed by several private environmental and geotechnical engineering firms where he served as a GIS and CAD specialist.
Urban Design Team:
rOn kasPrisin aia/aPa:
Ron Kasprisin is a Professor in Urban Design and Planning, College of Built Environments, Univer-sity of Washington, Seattle WA. Ron is an architect, urban planner and watercolor artist who is the prin-cipal designer on the Tsunami Vertical Evacuation Structures Charrette team. Ron is also a principal
86 Project Safe Haven: Pacific County
in Kasprisin Pettinari Design, Langley WA, since 1975. He has authored four books including: Urban Design—the composition of complexity, Routledge Press UK 2011; Design Media, John Wiley & Sons NY 1999; Visual Thinking for Architects and Design-ers with Professor James Pettinari UO, John Wiley & Sons NY 1995; and, Watercolor in Architectural Design, Van Nostrand Reinhold NY 1989.tricia demarcO:
Tricia DeMarco has recently graduated from the University of Washington with a Master in Urban Planning and a Master in Civil Engineering. Her specialization is in building the connection between engineering projects and their com-munity context. Past projects include brownfield redevelopment, transportation impact reduction, and small town systems planning primarily in developing countries throughout South America, Asia, and Eastern Europe. DeMarco is a LEED A.P. and E.I.T. She now works for Magnusson Klemen-cic in Seattle, WA as a site designer.
Cost Estimating Team:
dr. Omar el-anwar:
Dr. El-Anwar is an assistant professor in the Department of Construction Management at the University of Washington. He earned his Ph.D. in civil engineering from the University of Illinois at Urbana-Champaign, and both his M.Sc. in struc-tural engineering and B.Sc. in civil engineering from Cairo University. Dr. El-Anwar’s general area of research is to develop of robust IT-based decision support systems for increasing the sus-tainability and resiliency of civil infrastructure systems and building, with specific focus on quantifying and optimizing the social, economic, safety, and environmental impacts of planning for post-disaster housing and tsunami vertical evacuation. This research resulted in eight peer-reviewed journal publications in Disasters, Journal of Earthquake Engineering, Journal of Automation in Construction, as well as the ASCE Journals of Infra-structure Systems, Computing in Civil Engineering,
and Construction Engineering and Management. Moreover, the findings of this research were incor-porated in the development of two temporary housing decision-making modules, which are integrated in MAEviz software.kirk hOchstatter:
Kirk is a graduate student at the University of Washington pursuing his Masters of Science in Construction Management. Before attending UW he worked for General Contractors in Seattle and the San Francisco Bay Area. His main expertise comes in healthcare, commercial and biopharma-ceutical projects and he is LEED-AP. He is also and volunteer leader with Seattle Inner City Outings, which takes youth from low-income school dis-tricts on outdoor activities throughout the Puget Sound region. Kirk and his wife Megan live in Seattle and just welcomed their brand new baby, Lucile, into this word in June.
Washington State Emergency Management Division (EMD)
jOhn d. schelling:
John D. Schelling is the Earthquake/Tsunami Pro-gram Manager for Washington State Emergency Management Division. He is responsible for man-aging the seismic and natural hazard safety efforts in the state through the earthquake, tsunami, and volcano programs. He serves on the Washington State Seismic Safety Committee, Chairs the State/Local Tsunami Work Group, which coordinates efforts to improve tsunami preparedness and mitigation efforts in tsunami hazard zones, and is currently serving as the State Co-Chair of the National Tsunami Hazard Mitigation Program’s Mitigation & Education Subcommittee. In addi-tion to emergency management expertise, John has an extensive background in state and local government with an emphasis on policy analysis, land use planning, and implementation of smart growth management strategies. John received his Bachelor of Science degree from the University of West Florida and Master’s Degree from the Uni-versity of South Florida.

Project Safe Haven: Pacific County 87
jamie mOOney:
Jamie Mooney is the State Hazard Mitigation Strategist for Washington at the Emergency Man-agement Division. Prior to this position, she was a NOAA Sea Grant Fellow at Emergency Manage-ment focusing on building community resilience to coastal hazards. Jamie received her Masters of Marine Affairs from the University of Washing-ton’s School of Marine Affairs.
Washington State Department of Natural Resources (DNR)
tim walsh:
Tim Walsh is a licensed engineering geologist and Geologic Hazards Program manager for the Wash-ington Division of Geology and Earth Resources of the Department of Natural Resources. He has practiced geology in Washington for more than 30 years and taught at South Puget Sound Commu-nity College for 25 years. Tim has done extensive geologic mapping in all parts of the state and has done tsunami hazard mapping, active fault char-acterization, landslide, and abandoned coal mine hazard assessments. He has also directed and participated in a broad range of geologic hazard assessments and maps for land use and emergency management planning. Tim received Bachelor’s and Masters degrees in geology from UCLA.
United States Geological Survey (USGS)
nathan wOOd:
Nathan Wood is a research geographer at the U.S. Geological Survey Western Geographic Sci-ence Center. Dr. Wood earned a Ph.D. in geogra-phy from Oregon State University. His research focuses on characterizing and communicating societal vulnerability to natural hazards, with emphasis on tsunamis in the Pacific Northwest. He uses GIS software, collaborative community-based processes, and perception surveys to better understand how communities are vulnerable to tsunamis. He recently served on a National Research Council committee to evaluate the U.S.
tsunami warning system and national prepared-ness to tsunamis.
National Oceanic And Atmospheric Association (NOAA)
frank i. gOnzález:
Dr. González served as Leader of the Tsunami Research Program at the Pacific Marine Environ-mental Laboratory of the National Oceanic and Atmospheric Administration from 1985 until 2006, and was the founding Director of the NOAA Center for Tsunami Research. His work focused on the development of the NOAA Tsunami Forecast System, which integrates deep-ocean measurement and tsunami modeling technologies to produce real-time forecasts of tsunami impact on coastal communities. He has participated in field surveys of three devastating tsunamis that occurred in Nicaragua (1992), Indonesia (1992) and Japan (1993). As an affiliate Professor at the University of Washington, he continues to focus on tsunami research and education.
tyree wilde:
Tyree Wilde is the Warning Coordination Meteo-rologist for the National Weather Service (NWS) in Portland, OR. He works toward enhancing the forecast and warning system by closely tying the agency’s mission of protecting lives and property, and enhancing the region’s economy, with its cus-tomers, such as emergency managers, the media, land and water managers, and the marine commu-nity. Tyree holds a Masters degree in Meteorology from the University of Utah and has been a profes-sional meteorologist for 28 years. Prior to his pres-ent position in Portland, he served as the Warning Coordination Meteorologist in Flagstaff, AZ. He has also worked in weather stations in Omaha, NE, Phoenix, AZ, and Cape Canaveral, FL while serving as a Weather Officer in the US Air Force.
88 Project Safe Haven: Pacific County
Degenkolb Engineers
cale ash, Pe, se
Cale Ash is a Project Engineer with Degenkolb Engineers in Seattle and is a licensed Structural Engineer in Washington and California. He joined Degenkolb in 2003 after graduating with his BSCE and MSCE from the University of Illinois at Urbana-Champaign. His project experience at Degenkolb has focused on the seismic evaluation and rehabilitation of existing buildings. Cale is Vice President of the Cascadia Region Earthquake Workgroup (CREW) and chair of their Educa-tion & Outreach Committee. He is also a Board Member with the Seattle Chapter of the Structural Engineers Association of Washington (SEAW).
Editor
julie clark:
Julie Clark is a geologist and an author. With a BA degree in political science and an MS in geol-ogy, she has worked in areas that combine these disciplines. Past positions include working at the Oregon State Legislature and several state agen-cies, managing political campaigns, and serving as an elected school board member. She has written several publication on geologic hazards, including books and articles on earthquakes, tsunamis, and flooding.Pacific County Emergency Management Agency (PCEMA)
stePhanie k. fritts:
Stephanie K Fritts serves as the E911 and Emer-gency Management Director for Pacific County, Washington. Pacific County recognizes that it is day-to-day relationship building that assists our local communities and resdients to prepare for emergencies and disasters.
She has developed tsunami evacuation plans, routes, and public education campaigns in regard to the tsunami hazard within the local community. Ms. Fritts has also worked with the county and
local cities to complete the criteria necessary for the county to be designated as a “TsunamiReady” community.
Ms. Fritts received her Bachelor of Arts Degree in Economics and Business Administration from Lin-field College and worked several years for busi-nesses such as the Dayton Hudson Corporation and May Company. After leaving the corporate environment, she worked in local emergency ser-vices since 1983 and for the Pacific County since 1997.
CITY OF LONG BEACH
gene miles:
Gene has served as a city manager or administra-tor in Washington, Oregon, California and Kansas. He spent ten years as an educator both at the high school and university level, plus he coached high school tennis and basketball. Gene has also served as an elected official on the local level, first as a city commissioner of public works in the “com-mission form” of government (the same form of government Portland, OR has today), and later as deputy mayor and council member in the “coun-cil/administrator form” of government. While in working in Oregon Gene was a member of the Oregon Seismic Safety Policy Advisory Commis-sion, which works with the Governor, Legislature and State Government on Seismic issues. Gene’s education includes a master degree in Secondary School Administration and a BA in Political Sci-ence plus numerous senior management courses and training. In addition Gene has attended and participated in many seminars on tsunamis and seismic issues. He is a Full Member of the Interna-tional City Managers Association and a member of the Washington City-County Managers Asso-ciation. He is also a member of the American Public Works Association. During his tenure as a city manager he has been a volunteer firefighter, emergency medical and rescue member. Gene is a Vietnam Veteran.
Project Safe Haven: Pacific County 89
Appendix P: References
Atwater, Brian F. and others. 2005. The Orphan Tsunami Of 1700 — Japanese Clues To A Parent Earthquake In North America. U.S. Geological Survey Professional Paper 1707. Retrieved from: http://Pubs.Usgs.Gov/Pp/Pp1707/
Cascade Region Earthquake Workgroup (CREW). 2005. Cascadia Subduction Zone Earthquakes: A magnitude 9.0 earthquake scenario. Retrieved from: http://www.crew.org/PDFs/CREWSubductionZoneSmall.pdf
Federal Emergency Management Agency & National Oceanic and Atmospheric Admin-istration. 2008. Guidelines for Design of Struc-tures for Vertical Evacuation from Tsunamis. FEMA P646.
Kaeser, Thomas, and Laplante, John. 2007. “A History of Pedestrian Signal Walking Speed Assumptions.” 3rd Urban Street Symposium: June 24-27, Seattle: WA, p. 1-8.
National Oceanic and Atmospheric Administra-tion. 2005. SWWA Product Report: Inundation Modeling Projects for Long Beach and Ocean Shores. NOAA National Center for Tsunami Research, Pacific Marine Environmental Laboratory Seattle: Washington (December 2005).
Priest, G. R.; Myers, E. P., III; Baptista, A. M.; Flück, Paul; Wang, Kelin; Kamphaus, R. A.; Peterson, C. D. 1997. Cascadia subduction zone tsunamis: Hazard mapping at Yaquina Bay, Oregon. Oregon Department of Geology and Mineral Industries Open-File Report O-97-34, 144 p.
RSMeans Assemblies Cost Data, 36th Annual Edi-tion. 2011. RSMeans, A division of Reed Construction Data, Construction Publishers & Consultants. MA: USA.
RSMeans Square Foot Costs, 32nd Annual Edition. 2011. RSMeans, A division of Reed Con-struction Data, Construction Publishers & Consultants. MA: USA.
RSMeans Building Construction Cost Data, 69th Annual Edition. 2011. RSMeans, A division of Reed Construction Data, Construction Publishers & Consultants. MA: USA.
Satake, Kenji; Shimazaki, Kunihiko; Tsuji, Yoshinobu; Ueda, Kazue. 1996. Time and size of a giant earthquake in Cascadia inferred from Japanese tsunami records of January 1700. Nature, v. 379, no. 6562, p. 246-249.
Walsh, Timothy J.; Caruthers, Charles G.; Heinitz, Anne C.; Myers, Edward P., III; Baptista, Antonio M.; Erdakos, Garnet B.; Kamphaus, Robert A. 2000. Tsunami hazard map of the southern Washington coast--Modeled tsunami inundation from a Cascadia subduction zone earthquake. Washington Division of Geology and Earth Resources Geologic Map GM-49, 1 sheet, scale 1:100,000, with 12 p. text.
Warren, Michael and Vergara, Eva. “Tsunami Swept Away Fleeing Bus Full of Retirees.” Associated Press. 2010. Retrieved from: http://search.nwsource.com/search?searchtype=cq&sort=date&from=ST&byline=EVA%20VERGARA
