project title: biofeedback device team … g) pc receives data from the device, supplies device with...
TRANSCRIPT

1
PROJECT TITLE: Biofeedback Device
TEAM LEADER: Michal Adamski: [email protected]
TEAM MEMBERS: Michal Adamski, Janusz Fraczek: [email protected]
ADVISING PROFESSOR: Antoni Grzanka: [email protected]
UNIVERSITY: Warsaw University of Technology, POLAND
The Faculty of Electronics and Information Technology
DATE: 26/06/2011
TI PARTS USED IN PROJECT:
4x INA121 Instrumentation Amplifier
1x LM358 Operational Amplifier
16x TLC2274 Quad Operational Amplifier
2x ISO7241 Isolation
1x NE555 Single Precision Timer
4x CD4066 Bilateral Switch
PROJECT ABSTRACT
Biofeedback is a process that enables an individual to learn how to change physiological activity for the purposes of improving health and performance. Precise instruments measure physiological activity (brainwaves), and rapidly and accurately 'feedback' information to the user. The presentation of this information – in conjunction with changes in thinking, emotions, and behavior – supports desired physiological changes.
This project required a design of an electroencephalographic data acquisition system, as well as data analysis and presentation software. The device development incorporated a design of electrical circuits (both analog and digital blocks) along with PCB layouts, USB communication interface and convenient graphical user interface.

2
1. MOTIVATION FOR THE PROJECT The fundamental questions motivating authors to work on this project were apparently simple:
Can existing technology be harnessed in such a way as to allow a human operator to directly manipulate a computer through a brain actuated interface? Can it be achieved using a low-cost electronics?
Instead of giving an unproved Yes/No answers, we have tried to find our own solution. In the end: we did it!
We are really proud to introduce you to our Biofeedback, a Brain-Computer Interface (BCI), based on electroencephalographic data acquisition system and data analysis.
2. INTRODUCTION
2.1 Requirements for a Thought-Controlled Human-Computer Interface: In order for a thought-controlled human-computer interface to be truly feasible, there are several major factors to be considered.
Safety is perhaps the most fundamental requirement of a BCI, or in fact any bioengineering system directly involving human operators. Due to the relatively simple instrumentation requirements (simple in comparison with other possible techniques like MRI or PET) the EEG technique has evolved to a state of utmost safety.
The EEG is completely passive in the sense that it requires no outside stimulus and is non-invasive. This is a sharp contrast to the other technologies that have been used to study conscious thought, such as magnetic resonance imaging (MRI) and positron emission tomography (PET). MRI needs an exposure to high magnetic fields and PET requires a radioactive glucose to be injected into the bloodstream in order that the bloodflow in brain may be monitored. Apart from these ‘drawbacks’, the size of PET and MRI machines makes it impossible to use them as a handheld devices.
The other important issue to consider is a device cost. In order for a thought-controlled BCI to gain wide acceptability it must be cost-effective. The cost of a MRI or PET device is on the order of several million dollars, thus making it unfeasible in personal usage. On the other hand, a simple handheld EEG device might be done by two students taking part in Texas Instruments Analog Design Contest.
As a result of our work, we have created such a device: working and cost effective.
Our device is a universal biomedical amplifier, safe for the user, easy in application and interactive. It is a complete device with analog and digital part including GUI. It might be used in following applications: EEG, ECG, biofeedback, intraoperative awareness measurements, games, and applications requiring safe thought-controlled human-computer interface – imagination is the only limit.
3. THEORETICAL BACKGROUND
3.1 Measured Signal From an engineering stand point, the two most important features of the EEG are its amplitude and spectral content. As with many biological phenomena, these quantities are highly subject-dependent. The amplitude for normal EEG is in the range of 5 to 50 µV. The amplification of these voltages is performed using the EEG amplifier. The EEG spectrum is generally considered to be band-limited with the frequencies of

3
interest lying primarily in the 0-30 Hz range. The spectral content of the EEG is usually divided into specific, functionally related, frequency bands. These are: delta, theta, alpha, and beta bands. Each frequency is well correlated with specific working state of the human brain.
The frequency band receiving the most attention has been the alpha band. This band of frequencies ranging from 8-13Hz, is recorded primarily from the occipital region of the brain, located near the back of head (O1 and O2 in international 10-20 electrodes placement system).
It has been found that the alpha waves are predominantly present in two situations. The first is when a person is relaxed and in unstressed state. The second condition for alpha waves occurrence is for the person’s eyes to be closed. Upon opening the eyes, it is seen that the alpha waves disappear almost entirely.
The calculation of power spectral density of the alpha waves will give us a measure of subject’s relaxation level (or indication of its closed eyes). The basis of this algorithm is the Fast Fourier Transform (FFT) which gives information about amplitude of each frequency in received and digitized signal:
Those calculations are performed by the appropriate software, developed in Processing (Java framework) and Brain Bay by the authors.
3.2 Design Issues In general, signals resulting from physiological activity have very small amplitudes and must therefore be amplified before their processing and display can be accomplished.
Picture 1. International 10-20 electrodes placement system
Picture 2. Functional block diagram of the device for gathering bioelectric signal

4
The first step of amplification is the most subtle one, as it deals with the signal on the order of microvolts. Since it is the heart of each biomedical amplifier, we will focus a little on the most important aspects and parameters explaining a choice of a right one. Instrumentation amplifier must be chosen in order to meet the following criteria:
High Common-mode rejection ratio (CMRR) The human body is a good conductor, and thus will act as an antenna to pick up electromagnetic radiation present in the environment. One common type of electromagnetic radiation is the 50/60 Hz wave and its harmonics coming from the mains and radiated by power cords. The resulting interference on a bioelectrode is so large that it often obscures the underlying electrophysiological signals.
The CMRR of a biopotential amplifier is measurement of its capability to reject common-mode signals (e.g. power line interference)
Low Noise Noise is additional unwanted signal that contaminates a biopotential signal under measurement. The noise produced within amplifier circuity is usually measured either in microvolts peak to peak or microvolts root mean square, and applies as if it were a differential input voltage.
High Input impedance The input impedance of a biopotential amplifier must be sufficiently high so as not to attenuate considerably the electrophysiological signal under measurement.
In order to meet the mentioned criteria, the initial amplification stage must be done by instrumentation amplifier, based on FET or CMOS transistors, as the parameters offered by them fit best. After analysis, we have decided to choose: INA121
The INA121 is a FET-input, low power instrumentation amplifier offering excellent accuracy. It is laser-trimmed for very low offset voltage (±200µV), low offset drift (±2µV/°C), and high common-mode rejection (106dB at G = 100). It operates on power supplies as low as ±2.25V (+4.5V), allowing use in battery operated and single 5V systems (ideal to power up device from USB or battery, as in our case). Quiescent current is only 450µA, bias current: ±4pA, and input noise is low as well: 20nV/√Hz at f = 1kHz (G =100).
Now, as we have a right first stage amplifier, we will need the amplifiers for the other stages.
Gain The signals resulting from electrophysiological activity usually have amplitudes on the order of a few microvolts to a few milivolts. The voltage of such signals must be amplified to levels suitable for processing. Thus, biopotential amplifier must have gains of 1000 or greater (all stages together). In this project the gain parameter is set by the user via MCU. The possible values are: 2000, 20000, 50000, and this choice is enabled by the usage of CD4066: a bilateral switch.
For these stages amplifier selection isn’t that much demanding. As a general purpose quadruple operational amplifier we have used TLC2274. The amplifying stages based on TLC2274 incorporate also filtering, and are used in buffers, bootstraps etc.
The TLC2274 series of CMOS-input op amps combine precision dc performance with low quiescent current. They are ideal for general-purpose, portable, and battery operated applications, especially with high source impedance.
5
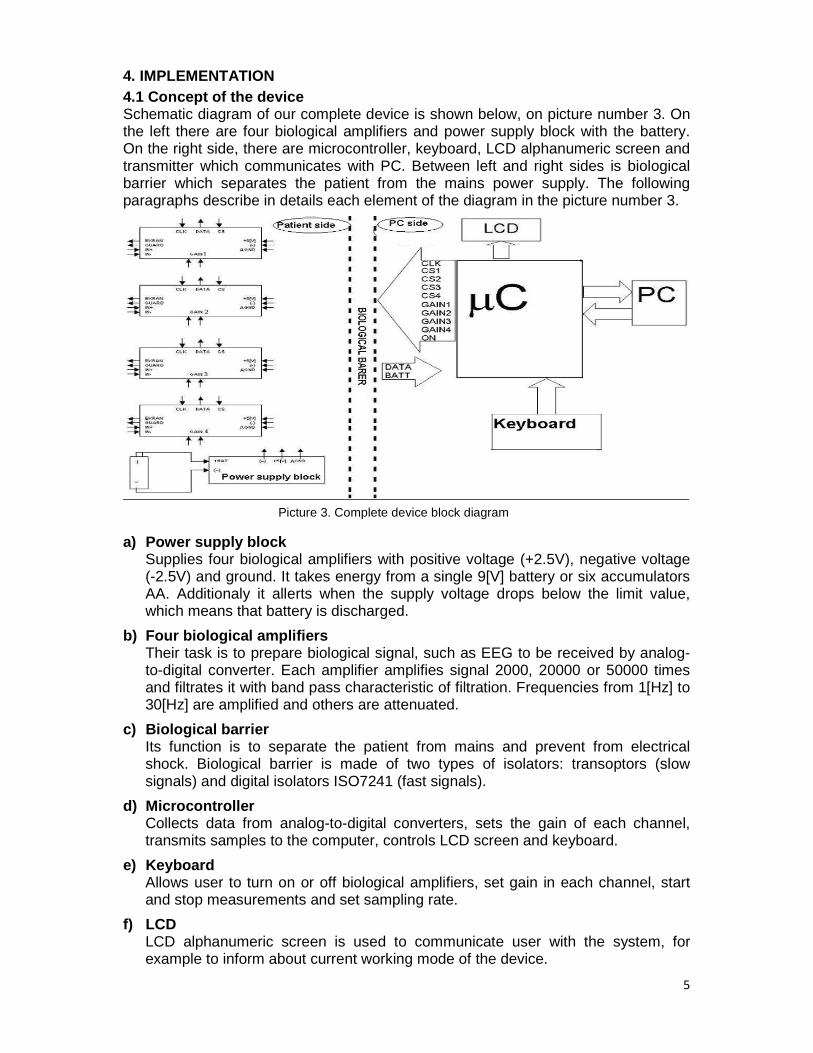
4. IMPLEMENTATION 4.1 Concept of the device Schematic diagram of our complete device is shown below, on picture number 3. On the left there are four biological amplifiers and power supply block with the battery. On the right side, there are microcontroller, keyboard, LCD alphanumeric screen and transmitter which communicates with PC. Between left and right sides is biological barrier which separates the patient from the mains power supply. The following paragraphs describe in details each element of the diagram in the picture number 3.
a) Power supply block Supplies four biological amplifiers with positive voltage (+2.5V), negative voltage (-2.5V) and ground. It takes energy from a single 9[V] battery or six accumulators AA. Additionaly it allerts when the supply voltage drops below the limit value, which means that battery is discharged.
b) Four biological amplifiers Their task is to prepare biological signal, such as EEG to be received by analog-to-digital converter. Each amplifier amplifies signal 2000, 20000 or 50000 times and filtrates it with band pass characteristic of filtration. Frequencies from 1[Hz] to 30[Hz] are amplified and others are attenuated.
c) Biological barrier Its function is to separate the patient from mains and prevent from electrical shock. Biological barrier is made of two types of isolators: transoptors (slow signals) and digital isolators ISO7241 (fast signals).
d) Microcontroller Collects data from analog-to-digital converters, sets the gain of each channel, transmits samples to the computer, controls LCD screen and keyboard.
e) Keyboard Allows user to turn on or off biological amplifiers, set gain in each channel, start and stop measurements and set sampling rate.
f) LCD LCD alphanumeric screen is used to communicate user with the system, for example to inform about current working mode of the device.
Picture 3. Complete device block diagram

6
g) PC Receives data from the device, supplies device with power, makes FFT and presents processed data on the computer screen.
4.2 Bioelectric amplifier circuit fragments The signal amplification is done in three stages to ensure that the amplifier system will not get accidently excited. Each amplification and filtration stage is presented in the picture 4.
While working on analog part of our design, we had to focus on several important issues. Let us point out the most important ones, with our solutions to them, starting from the frontend of our device:
• Amplification of the signal must be done in several stages involving instrumentation amplifier in the first stage. INA121 and TLC2274
• Instrumentation amplifier (INA121) needs an reference circuit incorporating operational amplifier (TLC2274) to solve the problem of high surface potentials (problems resulting from drying electrodes)
• A proper filtration is critical for this kind of designs. The following filters are needed, and were applied. FilterPro is very useful here to compute the resistors and capacitances values. As an OPAMP, TLC2274 has been used.
• Notch: filters 50/60Hz frequencies from power supply
30Hz 37Hz 44Hz 51Hz 58Hz 65Hz 72Hz 79Hz 86Hz 93Hz 100Hz0
1
2
3
4
5
6
7
8
9
10
11V(out)/V(in)
30Hz 37Hz 44Hz 51Hz 58Hz 65Hz 72Hz 79Hz 86Hz 93Hz 100Hz0
1
2
3
4
5
6
7
8
9
10
11V(out)/V(in)
Picture 4. Single bioelectric amplifier block diagram
Picture 5. Simulation of tuning center frequency, tuning Q-factor and a circuit of the notch filter
7
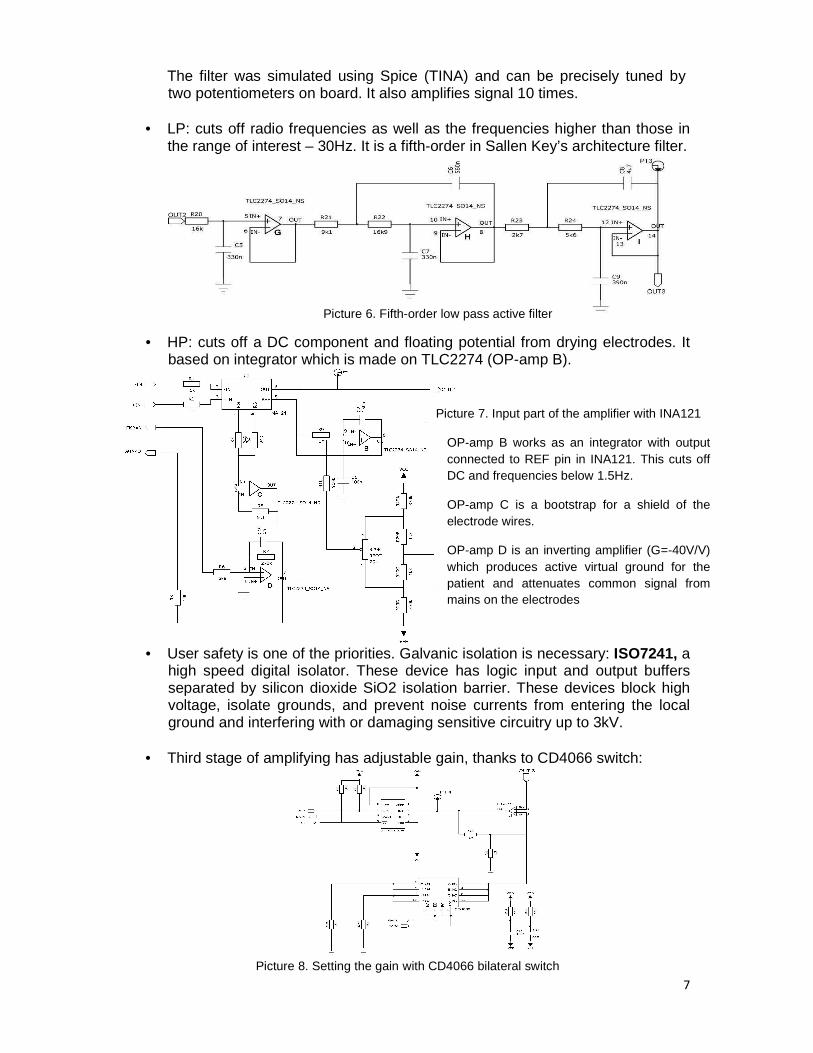
The filter was simulated using Spice (TINA) and can be precisely tuned by two potentiometers on board. It also amplifies signal 10 times.
• LP: cuts off radio frequencies as well as the frequencies higher than those in the range of interest – 30Hz. It is a fifth-order in Sallen Key’s architecture filter.
• HP: cuts off a DC component and floating potential from drying electrodes. It based on integrator which is made on TLC2274 (OP-amp B).
• User safety is one of the priorities. Galvanic isolation is necessary: ISO7241, a
high speed digital isolator. These device has logic input and output buffers separated by silicon dioxide SiO2 isolation barrier. These devices block high voltage, isolate grounds, and prevent noise currents from entering the local ground and interfering with or damaging sensitive circuitry up to 3kV.
• Third stage of amplifying has adjustable gain, thanks to CD4066 switch:
Picture 7. Input part of the amplifier with INA121
OP-amp B works as an integrator with output connected to REF pin in INA121. This cuts off DC and frequencies below 1.5Hz.
OP-amp C is a bootstrap for a shield of the electrode wires.
OP-amp D is an inverting amplifier (G=-40V/V) which produces active virtual ground for the patient and attenuates common signal from mains on the electrodes
Picture 6. Fifth-order low pass active filter
Picture 8. Setting the gain with CD4066 bilateral switch

8
• The amplified analog signal is transferred to high resolution ADC, and afterwards transmitted via SPI to microcontroller.
• Afterwards via USB port, digital signal is transmitted to the external PC, where FFT and PSD are calculated.
• FFT as well as PSD are the values that help us to determine the user’s relaxation level.
• As we have a measure, we are ready to display a result using our own GUI.
What is certainly worth mentioning, is a fact that the analog circuit was simulated using TINA Spice, and for filters design FilterPRO was used.
4.3 Bioelectric amplifier board This is a single amplifier board before putting it in a shielded cover for the first test:
In the middle of the board are located three potentiometers. First sets ground level precisely. Second sets frequency and third sets Q-factor of the notch filter.
As a signal generator we built “artificial head” based on NE555 precision timer:
Both of them (generator and amplifier) were put in shielding packages and 50000 times amplified signal was presented on the oscilloscope (picture 9. right). Layout of the single (one of four) amplifier board and board with barrier and power supply block are shown on picture 12 and 11. There are four channels for gathering EEG signal applied in four PCBs – each one with a complete amplifying and filtering system.
Picture 9. Amplifier board, generator connected with amplifier and signal before and after amplification with filtration
Picture 10. Signal generator for testing bioelectric amplifier. Signal amplitude 25µV p-p. Frequency 15Hz

9
5. EXPERIMENTAL RESULTS We connected complete 4-channel device with the human body and first collected ECG signal which is quite strong (few milivolts amplitude) with gain 2000V/V:
Next time we connected our device to user’s head and set the gain to 50000V/V:
Picture 11 (right). PCB layout with microcontroller (right side), power supply block with ports for four bioelectric amplifiers (left side of the board) and biological barrier between them.
Picture 12 (below). Single amplifier layout. On the left side of the board is input port for signal from electrodes and on the right side of the board is analog-to-digital converter with digital (SPI) output.
Picture 13. User and 4-channel ECG collected from his body in time of 10s(Brain Bay)
Picture 14. User and 4-channel EEG collected in 3s. Color bars show how strong are alpha waves in each channel. Their amplitudes are proportional to the patients relax level (Brain Bay).

10
6. CONCLUSIONS AND SUMMARY In many successive steps we have designed, launched and tested the complete system needed for gathering, processing and presenting electroencephalographic signal in real time which meets all specific requirements for biofeedback application.
We have constructed cost effective and fully functional device, which total cost is below 300$. If so, this should be an affordable proposition for those willing to start their biofeedback training or studies on the brain workings. With our device, you can take a look on how your brainwaves look like, and how you can influence them during particular situations.
What we consider as possible way of improving a design is to apply the other types of filters – especially high pass filter should bring better stability (give better protection against saturation).
Active virtual mass with adjustable gain of attenuating common noises (OP-amp D on picture 7) could improve stability of whole system.
Operating time on one battery pack should be measured but during a few hours of testing it did not need charging
Analog Design Contest was a great opportunity for us to improve our engineering skills and experience a unique adventure of discovering human brain. Texas Instruments Sampling Program gave us a chance to build a device based on TI’s components in a very fast and convenient way.
7. FUTURE PLANS
Studying human brain is a ‘never ending story’ which means that development of this device will be continued in many different ways. These may go in the following directions:
• an additional input for stimulator (sound, visual or from other source) enabling a start of studies of the brain evoked potentials, for example – P300
• change an alphanumeric LCD to a graphic screen and use it for displaying EEG signal or visual stimulation
• based on this device we would like to build a portable version for mobile training in a bus or a park
• idea of active, “dry” electrodes is worth considering. This will improve SNR and there will be no need to use a conductive gel.
Picture 15. Signal and spectrogram below (Brain Bay). Electrodes connected occipaly. Eyes open (left picture) and eyes closed (right picture) with high amplitude of alpha waves – 10Hz