proposed acquisition of penn and phipps
TRANSCRIPT

Proposed Acquisition of Penn and Phipps Hong Kong and Singapore: 4 - 8 May 2018

Important Notice
DBS Bank Ltd. was the Sole Financial Adviser and Issue Manager for the initial public offering of Manulife US Real Estate
Investment Trust (“Offering”). DBS Bank Ltd., China International Capital Corporation (Singapore) Pte. Limited, Credit Suisse
(Singapore) Limited and Deutsche Bank AG, Singapore Branch were the Joint Bookrunners and Underwriters for the Offering.
This presentation is for information purposes only and does not constitute or form part of an offer, invitation or solicitation of any offer
to purchase or subscribe for any securities of Manulife US REIT in Singapore or any other jurisdiction nor should it or any part of it
form the basis of, or be relied upon in connection with, any contract or commitment whatsoever. The value of units in Manulife US
REIT (“Units”) and the income derived from them may fall as well as rise. The Units are not obligations of, deposits in, or guaranteed
by the Manager, DBS Trustee Limited (as trustee of Manulife US REIT) or any of their respective affiliates. The past performance of
Manulife US REIT is not necessarily indicative of the future performance of Manulife US REIT.
This presentation may contain forward-looking statements that involve risks and uncertainties. Actual future performance, outcomes
and results may differ materially from those expressed in forward-looking statements as a result of a number of risks, uncertainties
and assumptions. These forward-looking statements speak only as at the date of this presentation. No assurance can be given that
future events will occur, that projections will be achieved, or that assumptions are correct. Representative examples of these factors
include (without limitation) general industry and economic conditions, interest rate trends, cost of capital and capital availability,
competition from similar developments, shifts in expected levels of office rental revenue, changes in operating expenses, property
expenses, governmental and public policy changes and the continued availability of financing in the amounts and the terms
necessary to support future business.
Investors are cautioned not to place undue reliance on these forward-looking statements, which are based on current view of
management on future events.
Holders of Units (“Unitholders”) have no right to request that the Manager redeem or purchase their Units while the Units are listed.
It is intended that Unitholders may only deal in their Units through trading on Singapore Exchange Securities Trading Limited (the
“SGX-ST”). Listing of the Units on the SGX-ST does not guarantee a liquid market for the Units.
2

Contents
Introduction to Acquisition
Appendix
Conclusion
Key Rationale
3

Introduction to Acquisition Phipps, Atlanta

Solidifying the Portfolio
5
Acquisition of Sponsor’s Assets - Total Purchase Price US$387.0 million
Long WALE
High Occupancy
Strong Economic
Fundamentals
Live, Work, Play
Investment Criteria
10.0 years2
Phipps Tower, Atlanta (Phipps)
97.3%2
Desirable work location, high-end
retail, hotels and deluxe residential
10th largest economy in U.S.
Class A Trophy/Class A Assets
5th largest economy in U.S.
Centre of U.S government drawing major
corporations and global agencies
97.2%1
6.8 years1
Trophy
Source: JLL Independent Market Research Report, March 2018
Data as at 31 Dec 2017
(1) As at 31 Mar 2018, the WALE and occupancy rate was 6.6 years and 97.2% respectively
(2) As at 31 Mar 2018, the WALE and occupancy rate was 9.8 years and 97.4% respectively
1750 Pennsylvania Ave,
Washington, D.C. (Penn)
Click to watch video!
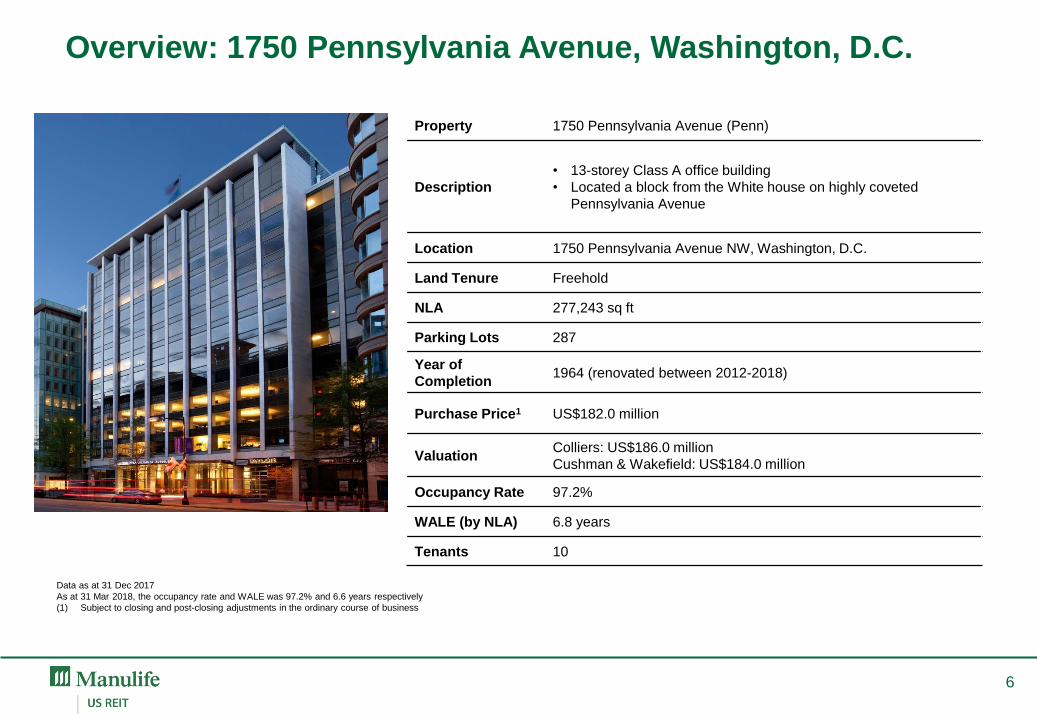
Property 1750 Pennsylvania Avenue (Penn)
Description
• 13-storey Class A office building
• Located a block from the White house on highly coveted
Pennsylvania Avenue
Location 1750 Pennsylvania Avenue NW, Washington, D.C.
Land Tenure Freehold
NLA 277,243 sq ft
Parking Lots 287
Year of
Completion 1964 (renovated between 2012-2018)
Purchase Price1 US$182.0 million
Valuation Colliers: US$186.0 million
Cushman & Wakefield: US$184.0 million
Occupancy Rate 97.2%
WALE (by NLA) 6.8 years
Tenants 10
Data as at 31 Dec 2017
As at 31 Mar 2018, the occupancy rate and WALE was 97.2% and 6.6 years respectively
(1) Subject to closing and post-closing adjustments in the ordinary course of business
1
6
Overview: 1750 Pennsylvania Avenue, Washington, D.C.
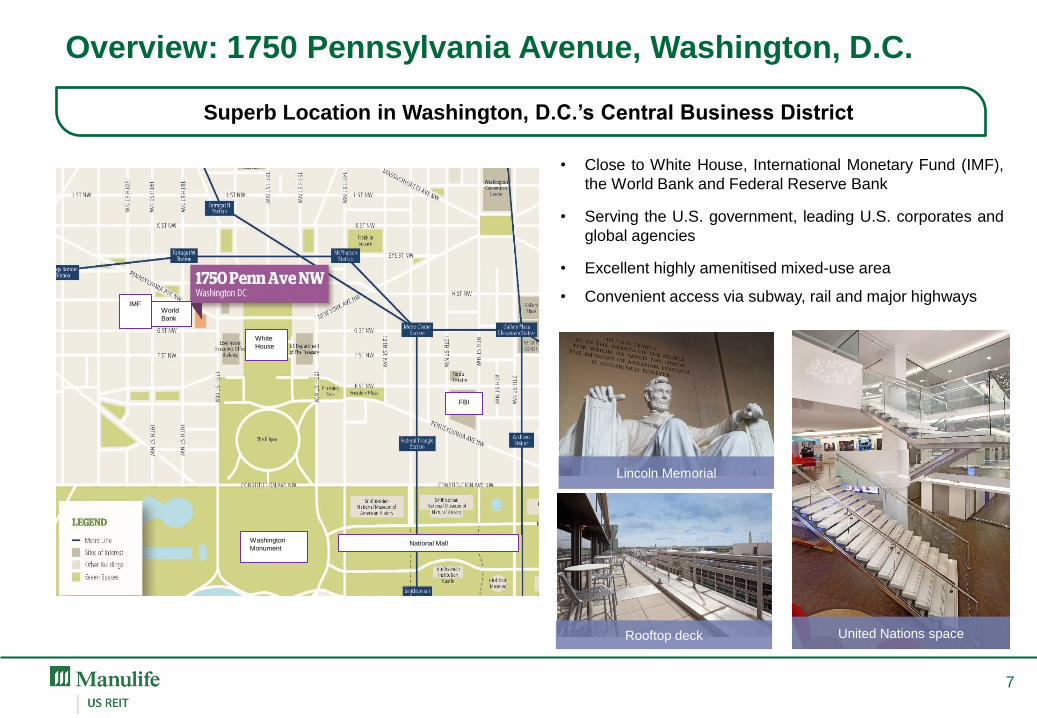
• Close to White House, International Monetary Fund (IMF),
the World Bank and Federal Reserve Bank
• Serving the U.S. government, leading U.S. corporates and
global agencies
• Excellent highly amenitised mixed-use area
• Convenient access via subway, rail and major highways
Overview: 1750 Pennsylvania Avenue, Washington, D.C.
Superb Location in Washington, D.C.’s Central Business District
United Nations space
Lincoln Memorial
White
House
IMF
FBI
National Mall Washington
Monument
World
Bank
7
Rooftop deck

Tenants Profile % of Gross Rental Income
U.S. Department Of Treasury Government agency that manages the finances of the U.S. Federal Government. 41.7%
United Nations Foundation Global organisation - fosters global peace, prosperity and justice. 37.4%
U.S. Chemical Safety Board Independent federal agency charged with investigating chemical accidents. 4.8%
United States Postal Service Mail processing and delivery services to individuals and businesses 2.3%
AOL Leading source of news, opinion entertainment and digital information. 6.3%
Board of Regents of the
University Texas Governing body for the University of Texas system. 4.4%
VIPS Catering Catering company servicing the surrounding area and special events. 1.0%
Taylor Gourmet Food service company servicing various areas in the CBD. 0.9%
General Nutrition
Corporation U.S. company selling health and nutrition related products. 0.7%
Export-Import Bank of India Export finance institution providing financial services in India. 0.5%
Total 100.0%
86.2% of Tenants are Defensive High Quality Government and Global Agencies
Data as at 31 Dec 2017
Tenants by Gross Rental Income
8
Overview: 1750 Pennsylvania Avenue, Washington, D.C.

Long WALE of 6.8 years; Minimal Expiries before 2022
Lease Expiry Profile (%)
~US$6.0 million of asset enhancement in the last six years
Over 90.0% by NLA expiring in 2022 and beyond
Leases with built-in rental escalations, typically mid-term or annual
Passing gross rent of US$48.90 psf vs market gross rent of US$55.00 psf
Data as at 31 Dec 2017
0.5 0.0
7.2
2.2
44.7 45.4
0.5 0.0
7.3
2.3
41.7
48.2
2018 2019 2020 2021 2022 2023 andbeyond
NLA Gross Rental Income
9
Overview: 1750 Pennsylvania Avenue, Washington, D.C.

Property Phipps Tower (Phipps)
Description
• 19-storey Trophy office building
• LEED-CS Gold Certification
• High-end “Live, work, play” environment
Location 3438 Peachtree Road, Atlanta, Georgia
Land Tenure Leasehold1 (with rights to acquire Freehold)
NLA 475,091 sq ft
Parking Lots 1,150
Year of
Completion 2010
Purchase Price2 US$205.0 million
Valuation Colliers: US$210.2 million
Cushman & Wakefield: US$208.2 million
Occupancy Rate 97.3%
WALE (by NLA) 10.0 years
Tenants 9
Overview: Phipps Tower, Atlanta
Data as at 31 Dec 2017
As at 31 Mar 2018, the occupancy rate and WALE was 97.4% and 9.8 years respectively
(1) The property is held in a leasehold until the end of 2020 to afford it certain real estate tax advantages but will be converted to a freehold for a nominal sum of US$100.0 thereafter. For more details, see Acquisition
Announcement on 13 Apr 2018
(2) Subject to closing and post-closing adjustments in the ordinary course of business
10

Strongest Office Submarket; High-End “Live, Work, Play” Environment
• Surrounded by ~2.5 million sq ft of retail space, 5-star
hotels and deluxe residential
• Direct access to largest luxury mall in Atlanta, Phipps
Plaza – Louis Vuitton, Tiffany, Gucci, Fendi, Omega
• Excellent connectivity to major highways and train stations
Covered pedestrian to adjacent
Phipps Plaza
Tenant space
Phipps Plaza - luxury mall
On-site cafe
Overview: Phipps Tower, Atlanta
11

Tenants Profile % of Gross Rental Income
Carter’s
(NYSE:CRI) Major American designer and marketer of children's apparel – OshKosh B’gosh. 64.6%
Northwestern Mutual Financial representative, providing a wide range of financial products and
services. 12.6%
CoStar
(NASDAQ:CSGP) Commercial real estate information and marketing provider. 9.9%
Daugherty Business
Solutions
Provides business technology consulting services to local and state
governments, organisations and Fortune 500 companies. 3.8%
Speakeasy Communication Provides personal growth, communication development and consulting services
worldwide. 3.6%
Cornerstone Investment Employee-owned registered investment advisor. 2.3%
Government of Japan Consulate-General of Japan. 2.3%
Quantum National Bank Community bank, locally owned and operated. 0.4%
Carole Parks Catering services company. 0.1%
Total2 99.6%
High Occupancy Rate of 97.3%1 with Strong Tenant Base
Data as at 31 Dec 2017
(1) Excluding a lease with H.I.G. Atlanta, Inc. which expired on 28 Feb 2018
(2) JHUSA operates a property management office in Phipps, and accounts for the remaining 0.4% of the Gross Rental Income, but is not listed as a tenant
Tenants by Gross Rental Income1
Overview: Phipps Tower, Atlanta
12

Long WALE of 10.0 years; Minimal Expiries before 2023
Lease Expiry Profile (%)
Over 90% by NLA and GRI expiring in 2023 and beyond
Majority of leases with built-in rental escalations, typically mid-term or periodic
Passing net rent of US$22.20 psf vs market net rent of US$30.00 psf
Data as at 31 Dec 2017
Overview: Phipps Tower, Atlanta
0.7 0.5 2.1 3.8 0.0
92.9
0.8 0.4 2.3 4.2 0.0
92.3
2018 2019 2020 2021 2022 2023 andbeyond
NLA Gross Rental Income
13

Key Rationale

Key Rationale
Landmark Assets and Exposure to Prime Office Submarkets 1
Fortifying Trade Sectors and Quality of Tenants 2
Delivering Returns through Accretive Acquisitions 4
Strengthening Portfolio by Lengthening Lease Expiries 3
15

Nation’s Capital, Government Hub, Heart of CBD
1 Washington, D.C.: Conquering the Capital
Source: JLL Independent Market Research Report, March 2018
Epi-centre of power and influence
• Hosts 176 foreign embassies
• HQ for many global firms, trade unions, non-profit
companies and professional associations
• One of the strongest cities in the world:
Highest educated population in U.S.
2nd highest median household income in U.S.
Highest level of consumer expenditure in U.S.
Excellent transportation
• 3 major airports:
Regan International Airport
Dulles International Airport
Thurgood Marshall Baltimore - Washington
International Airport
• Efficient road network for easy access to city
• Amtrak train connects Washington to Baltimore,
Philadelphia, New Jersey, New York City and Boston
Jefferson Memorial
16
White House

Preeminent Commercial District Commands Higher Rentals
Demographics (2017)
D.C. U.S.
Population 6.1 million 327.4 million
Median Household
Income US$95,843 US$55,775
CBD Washington, D.C.: Exposure to Prime Office Submarket CBD Washington, D.C.
1
• White House, World Bank and International
Monetary Fund anchors submarket
• Pennsylvania Avenue - preferred address for
high-profile law firms, global agencies and
political think tanks
• Wide variety of restaurants, luxury shops, hotels,
sports and cultural entertainment
• CBD is fully built out with development focus on
repositioning Class B/C buildings to Trophy/Class
A with asking rents of ~US$68.00 psf
• 10-year average vacancy rate of 10.7% - lowest
in the city
• Rental rates are ~50.0% higher in D.C.’s CBD vs
overall D.C.
Source: JLL Independent Market Research Report, March 2018
17
38.3 38.0 38.7 38.4 40.6 41.3
56.4 54.6 56.7 56.5 62.7 63.4
15.2% 16.1%
17.3% 17.0% 16.9% 16.6%
13.2% 12.8%
11.3% 10.1% 9.9% 10.0%
0.0%
5.0%
10.0%
15.0%
20.0%
0.0
10.0
20.0
30.0
40.0
50.0
60.0
70.0
2012 2013 2014 2015 2016 2017
Vacancy
Rate
(%
)
Annual R
ent
(US
$ p
er
sqft)
Washington, D.C., Overall Rents (LHS) CBD (Washington, D.C.), Overall Rents (LHS)
Washington, D.C., Vacancy Rate (RHS) CBD (Washington, D.C.), Vacancy Rate (RHS)

International Gateway - Headquarters for 15 Fortune 500 Firms
Big business
• 10th largest economy in U.S.
• 15 Fortune 500 companies
• Average ~85,000 jobs created annually
• Lowest cost of doing business among 50 largest
Metropolitan Statistical Area in U.S.
• Dynamic and affluent workforce
Median household income above U.S. average
Ranked 4th nationally in annual population growth
35.8 median age compared to 37.9 U.S. average
37.7% of population has a bachelor’s degree or
higher
• Atlanta’s Hartsfield-Jackson International Airport -
world’s busiest airport, serving ~100 million passengers
annually
1 Atlanta: Economic Centre of Southeast U.S.
Source: JLL Independent Market Research Report, March 2018
18
Mercedes Stadium
Atlanta

Atlanta: Exposure to Strongest Office Submarket Buckhead Atlanta
Demographics (2017)
Atlanta U.S.
Population 5.8 million 327.4 million
Median Household
Income US$62,613 US$55,775
Lower Vacancy and Higher Rentals
1
Great connectivity
• Direct access to highways
• Trains run directly to Midtown and Downtown
Atlanta
• 20 mins by car to Atlanta’s Hartsfield-Jackson
International Airport
Desirable high-end location
• Highly sought after by young professionals and
senior executives for high-end “live, work, play”
• Traditionally commands highest office rents in
Atlanta
• Rents growing 58.4% faster than the broader
market since 2012
• Overall vacancy rate 14.8% is lower than Atlanta’s
average 17.5%
Source: JLL Independent Market Research Report, March 2018
19
20.1 21.2 21.5 22.8 23.7 25.6 26.9 27.4 28.6
31.9 33.5 35.7
21.5% 20.4%
19.4%
17.1% 17.1% 17.5%
20.1%
16.7%
15.2%
12.3% 12.0%
14.8%
0.0%
5.0%
10.0%
15.0%
20.0%
25.0%
0.0
5.0
10.0
15.0
20.0
25.0
30.0
35.0
40.0
2012 2013 2014 2015 2016 2017
Vacancy
Rate
(%
)
Annual R
ent
(US
$ p
er
sqft)
Atlanta Overall Rents (LHS) Buckhead Class A Rents (LHS)
Atlanta Overall, Vacancy Rate (RHS) Buckhead, Vacancy Rate (RHS)

Legal Services 20.4%
Finance and Insurance 20.4%
Retail Trade 16.2%
Management and Consulting Services 5.4%
Public Administration
5.4%
Real Estate 4.1%
Grant Giving 3.9%
Arts and Entertainment 3.3%
Administrative 3.0%
Healthcare 2.8%
Accounting, Tax and Payroll Services 2.2%
Manufacturing 2.2%
Advertising and Related Services 1.9%
Transportation and Warehousing 1.8%
Architectural and Related Services 1.2%
Others 3.2%
Legal Services 26.0%
Finance and Insurance 23.6%
Retail Trade 11.0%
Management and Consulting Services 5.8%
Arts and Entertainment 4.2%
Real Estate 3.8%
Administrative 3.8%
Healthcare 3.6%
Accounting, Tax and Payroll Services 2.8%
Manufacturing 2.8%
Information 2.5%
Advertising and Related Services 2.5%
Transportation and Warehousing 2.3%
Architectural and Related Services
1.6%
Public Administration 0.6%
Grant Giving 0.2%
Others 2.9%
Enlarged Portfolio Trade Sectors by GRI Current Portfolio Trade Sectors by GRI
Data as at 31 Dec 2017
Improve tenant diversification from current portfolio
Significantly increased exposure to Retail Trade, Public Administration and Grant Giving
High exposure to quality tenants
Fortifying Trade Sectors and Quality of Tenants 2
20

Current Portfolio
Tenants % Gross Rental
Income
Kilpatrick Townsend 6.7%
TCW Group 6.4%
Hyundai Motor Finance 5.8%
The Children’s Place 5.4%
Quinn Emanuel Trial Lawyers 4.5%
Amazon 4.4%
Quest Diagnostics 3.5%
Gibson Dunn 3.2%
LA Fitness 3.0%
Rabo Support Services, Inc 3.0%
Total Top 10 Tenants 45.9%
Enlarged Portfolio as at 31 Dec 2017
Tenants % Gross Rental
Income
Carter’s 7.4%
Kilpatrick Townsend 5.2%
TCW Group 5.0%
Hyundai Motor Finance 4.5%
The Children’s Place 4.3%
U.S. Department of Treasury 4.2%
United Nations Foundation 3.7%
Quinn Emanuel Trial Lawyers 3.5%
Amazon 3.5%
Quest Diagnostics 2.8%
Total Top 10 Tenants 44.1%
2
Acquisition Introduces Three New Quality Tenants into Top 10 Tenants
Fortifying Trade Sectors and Quality of Tenants
21
Data as at 31 Dec 2017

2.6
9.4 9.2 7.1
17.8
53.9
2.5
12.2 9.5
6.8
18.0
51.0
2018 2019 2020 2021 2022 2023 andbeyond
Net Lettable Area Gross Rental Income
2.2
7.5 8.2 6.3
17.5
58.3
2.1
9.6 8.5 6.0
18.3
55.5
2018 2019 2020 2021 2022 2023 andbeyond
Net Lettable Area Gross Rental Income
Strengthening Portfolio Resilience by Lengthening Lease
Expiries
Lengthen WALE from 5.7 to 6.3 years by NLA
Current Portfolio Lease Expiries Profile (%)
Data as at 31 Dec 2017
Enlarged Portfolio Lease Expiries Profile (%)
3
22

Acquired at 1.8% Discount to Valuation1; DPU Accretion of 1.4%2
5.77
5.85
Pre-Acquisition Post-Acquisition
Illustrative Purpose:
FY2017 Pro Forma DPU Accretion3
(1) Based on the average valuation of US$394.2 million of two independent appraisals
(2) Based on closing price of US$0.92 as at 10 Apr 2018
(3) The illustration FY2017 Pro Forma DPU assumes the acquisitions costs (excluding acquisition fees) is funded through combination of debt and issuance of capital market instruments such as perpetual securities.
Refer to the announcement dated 13 Apr 2018 for details of the Pro Forma financial effects of the Acquisitions
(4) Assuming total Acquisition cost is funded through a combination of drawdown of loan facilities of US$176.0 million and the issuance of perpetual securities of US$220.0 million. On a pro forma basis, the debt
leverage ratio of Manulife US REIT as at 31 Dec 2017 would have increased from 33.7% to 36.2% after the Acquisition and the issuance of the perpetual securities
4 Delivering Returns through Accretive Acquisitions
23
FY2017
Pre-Acquisition
Pro Forma FY2017
Post-Acquisition
Distributable Income (US$ m) 46.7 47.5
DPU (US cents) 5.77 5.85
DPU Yield2 (%) 6.27 6.36
NAV (US$ m) 852.1 855.0
NAV per Unit (US$) 0.82 0.82
Gearing (%) 33.7 36.24
Capital Management Strategy:
Increase financial flexibility
Unencumber properties
Lengthen debt maturity
Diversify sources of funding
Long-term capital structure target Equity: 50% to 60%
Debt: 35% to 40%
Perpetual: 5% to 10%

Peachtree, Atlanta, Georgia
Conclusion Penn, Washington

Expanding Beyond - Fortifying the Portfolio
25
Figueroa, Michelson, Peachtree
AUM US$777.5m
Growing from Strength to Strength
Plaza US$115.0m
Exchange US$315.1m
Penn US$182.0m
Phipps US$205.0m Jun 2017
Sep 2017
Apr 2018
May 2016
As at 31 Mar 2018 Pre-
Acquisitions
AUM US$1.3 bil
NLA 3.0 mil sq ft
WALE 5.7 years
Occupancy 95.8%
Post-
Acquisitions
US$1.7 bil
3.7 mil sq ft
6.2 years
96.1%
Approvals Required at EGM
26
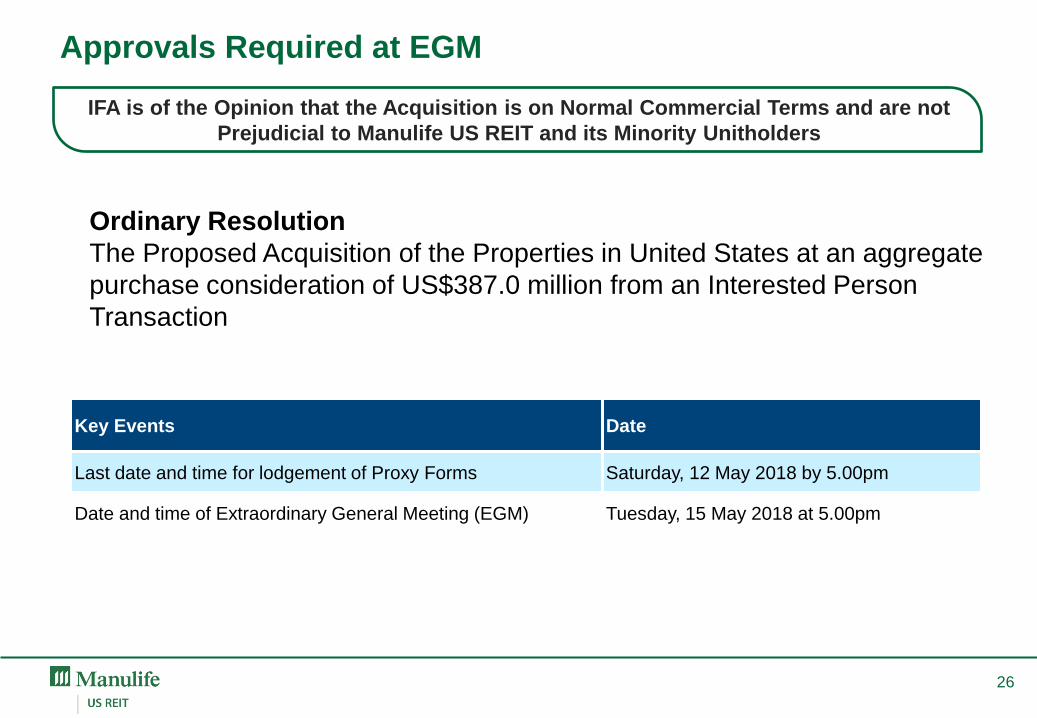
IFA is of the Opinion that the Acquisition is on Normal Commercial Terms and are not
Prejudicial to Manulife US REIT and its Minority Unitholders
Ordinary Resolution
The Proposed Acquisition of the Properties in United States at an aggregate
purchase consideration of US$387.0 million from an Interested Person
Transaction
Key Events Date
Last date and time for lodgement of Proxy Forms Saturday, 12 May 2018 by 5.00pm
Date and time of Extraordinary General Meeting (EGM) Tuesday, 15 May 2018 at 5.00pm

Appendix Penn, Washington

1Q 2018 Financial Performance
28
For period
1 Jan to 31 Mar
1Q 2018
(US$’000)
1Q 2017
(US$’000)
Change
(%)
Gross Revenue1
• Rental and Other Income
• Recoveries Revenue
31,153
25,552
5,601
19,833
14,663
5,170
57.1
74.3
8.3
Net Property Income2 19,650 12,763 54.0
Net Income3 11,534 8,505 35.6
Distributable Income 15,633 10,413 50.1
Distribution per Unit (DPU)
restated for Rights Issue
(US cents)4
1.51 1.52 (0.7)5
DPU (US cents) 1.51 1.65 (8.5)6
(1) The gross revenue was higher than 1Q 2017 largely due to the revenue contribution from the acquisitions of Plaza and Exchange, partially offset by lower income from Michelson and Figueroa
(2) Net property income was higher than 1Q 2017 largely due to higher net property income contribution from Plaza and Exchange
(3) Net income was higher than 1Q 2017 mainly due to higher net property income
(4) DPU has been restated for the Rights Issue, through which 299,288,423 Units were issued on 25 Oct 2017 (“Rights Issue”)
(5) 1Q 2018 DPU is lower largely due to lower income from Figueroa and Michelson resulting from lower occupancies in these properties and higher income taxes in 1Q 2018 compared to 1Q 2017. This was offset
by strong earnings from Plaza and Exchange properties acquired on 19 Jul 2017 and 31 Oct 2017, respectively, and therefore providing further diversification benefits to the portfolio
(6) This is largely due to the enlarged Unit base in relation to the Rights Issue
28

Healthy Balance Sheet
As at 31 Mar 2018
(US$ million)
Investment Properties 1,315.4
Total Assets 1,355.5
Borrowings 458.61
Total Liabilities 516.1
Net Asset Attributable to Unitholders 839.4
Net Asset Value (NAV) per Unit (US$) 0.812
Adjusted NAV per Unit (US$) 0.793
29
(1) Net of upfront debt-related unamortised transaction costs of US$3.3 million.
(2) NAV decreased from US$0.82 (as at 31 Dec 2017) to US$0.81 (as at 31 Mar 2018) largely due to payment of distribution on 29 Mar 2018.
(3) Excluding distributable income.

30
Proactive Capital Management
Established a US$1.0 billion Multicurrency Debt Issuance Programme1
As at 31 Mar 2018
Gross Borrowings US$461.9 million
Gearing Ratio2 34.1%
Weighted Average
Interest Rate 2.83% p.a.
Debt Maturity
(weighted average) 3.2 years
Interest Coverage3 4.7 times
(1) Announced on 13 Apr 2018
(2) Based on gross borrowings as percentage of total assets
(3) Based on net income before finance expenses, taxes and net fair value change in investment properties, over finance expenses
108.5 Figueroa
0
50
100
150
200
2019 2020 2021 2022
US$ million
67.3
Peachtree
121.0
Michelson
165.1
40.0
Plaza
35.7% 26.2% 23.5% 14.6%
125.1
Exchange
Debt Maturity Profile

Diversified Portfolio
31
Portfolio Summary as at 31 Mar 2018
Total NLA 2,984,578 sq ft
WALE by (NLA) 5.7 years
Occupancy 95.8%1
Land Tenure 100% freehold
No. of Tenants 101
Figueroa 25%
Michelson 26%
Peachtree 15%
Plaza 9%
Exchange 25%
US$1,315.4 m2
Portfolio
Valuation
(1) Committed occupancy
(2) Based on appraisals as at 31 Dec 2017 and after capitalisation of capital expenditures, tenant improvement allowances and leasing cost

32
First Class Portfolio of Trophy / Class A Assets
NLA 461,525 sq ft
Property Value US$118.0 m
Occupancy Rate 98.9%
WALE (by NLA) 8.1 Years
NLA 730,823 sq ft
Property Value US$334.8 m
Occupancy Rate 98.3%
WALE (by NLA) 6.5 Years
Plaza
Exchange
NLA 701,978 sq ft
Property Value US$326.3 m
Occupancy Rate 93.0%
WALE (by NLA) 4.7 Years
NLA 532,663 sq ft
Property Value US$342.1 m
Occupancy Rate 96.5%
WALE (by NLA) 4.2 Years
NLA 557,589 sq ft
Property Value US$194.2 m
Occupancy Rate 92.7%
WALE (by NLA) 5.6 Years
Figueroa
Michelson
Peachtree
Data as at 31 Mar 2018
Please refer to the website for the video of properties
Click to watch property video!

1.9
10.0 9.5 6.8
17.9
53.9
2.5
7.1 9.2
7.1
17.8
56.3
2018 2019 2020 2021 2022 2023 and beyond
Gross Rental Income Net Lettable Area
Favourable Lease Profile with WALE of 5.7 Years
33
Lease Expiry Profile as at 31 Mar 2018 (%)
56.3% of Leases by NLA Expiring in 2023 and Beyond

Quality, Diversified Tenant Base Across Multiple Sectors
34
Top 10 Tenants by Gross Rental Income (GRI)
Gross Rental Income Breakdown by
Trade Sector
No Tenant Contributing more than
6.3% of Income
Legal Services 25.6%
Finance and Insurance 23.7%
Retail Trade 11.0%
Management and Consulting Services 5.9%
Arts and Entertainment 4.2%
Real Estate 3.8%
Administrative 3.8%
Healthcare 3.6%
Accounting, Tax and Payroll Services 2.8%
Manufacturing 2.8%
Information 2.5%
Advertising and Related Services 2.5%
Transportation and Warehousing 2.4%
Architectural and Related Services
1.7%
Public Administration 0.6%
Grant Giving 0.2%
Others 2.9%
Tenant Sector
Leased
Area
(sq ft)
% of GRI
TCW Group Finance and Insurance 188,835 6.3%
Kilpatrick Townsend Legal Services 206,226 6.1%
Hyundai Motor Finance Finance and Insurance 96,921 5.7%
The Children’s Place Retail Trade 197,949 5.4%
Amazon Retail Trade 129,259 4.5%
Quinn Emanuel Legal Services 126,505 4.5%
Quest Diagnostics Health Care 131,612 3.5%
Gibson, Dunn Legal Services 77,677 3.2%
LA Fitness Arts and Entertainment 91,023 3.0%
Rabo Support Services Management and Consulting 73,248 3.0%
Total Top 10 Tenants 1,319,255 45.2% Data as at 31 Mar 2018

Office Market Overview
35
Market
Rentable
Building
Area1
(mil sq ft)
Vacancy1
(%)
Gross
Asking
Rent1
(US$)
Net
Absorption1
(‘000 sq ft)
12 Month
Rent
Growth2
(%)
New
Properties
Under
Construction
(‘000 sq ft)
Property
Name
Delivery
Year
Downtown Los
Angeles 40.1 14.3 43.10 (3.5) 3.5 0 N/A N/A
Irvine,
Orange County 14.4 17.2 35.75 21.8 3.4 0 N/A N/A
Midtown
Atlanta 16.9 10.1 36.92 (14.2) 6.4
277 NCR 2018
343 Ponce 2019
760 Coda 2019
352 Anthem 2020
Meadowlands3 3.5 14.44 29.39 0 (0.1) 0 N/A N/A
Hudson
Waterfront5 18.9 16.3 41.40 (195.5) (0.1) 0 N/A N/A
Source: CoStar Market Analysis & Forecast – As at 16 April 2018
(1) Class A inventory
(2) All building classes
(3) Secaucus is within the Meadowlands submarket
(4) Vacancy and availability include old and uncomparable buildings where else Plaza’s competitive set has vacancy rate of only 6%
(5) Jersey City is within the Hudson Waterfront submarket
Limited New Supply in 2018

36
Portfolio Overview
Figueroa Michelson Peachtree Plaza Exchange
Location Los Angeles Irvine Atlanta Secaucus Jersey City
Property Type Class A Trophy Class A Class A Class A
Completion Date 1991 2007 1991 1985 1988
Acquisition Date 20 May 2016 20 May 2016 20 May 2016 19 Jul 2017 31 Oct 2017
Last Refurbishment 2015 - 2015 2016 -
Property Value2 326.3 342.1 194.2 118.0 334.8
Occupancy (%) 93.0 96.5 92.7 98.9 98.3
NLA (sq ft) 701,978 532,663 557,589 461,525 730,823
No. of Tenants 29 15 25 7 25
Avg Gross Rent
(US$ psf p.a.) 39.53 49.98 32.05 30.09 39.45
WALE (by NLA) 4.7 years 4.2 years 5.6 years 8.1 years 6.5 years
Lease Expiry (by NLA): 2018 3.5% 2.2% 0% 0.0% 5.0%
2019 2.2% 29.8% 4.0% 0.0% 2.0%
2020 2.8% 10.0% 9.7% 22.1% 6.1%
2021 13.0% 0.8% 4.6% 0.0% 12.5%
2022 30.5% 25.1% 11.2% 2.7% 15.3%
2023 and beyond 48.0% 32.1% 70.5% 75.2% 59.1%
Data as at 31 Mar 2018
Please refer to the website for the video of properties

Tax Structure1
No 30%2 withholding tax on interest and principal on
shareholder’s loan - US Portfolio Interest
Exemption Rule
Zero tax in Singapore - Foreign sourced income
not subject to tax
Distribution from US to Singapore through
combination of dividends, and/or interest
payments and principal repayments on
shareholder loans
No single investor to hold more than 9.8% (including
the sponsor) - ‘Widely Held3’ rule for REITs in US
Manager will actively manage to minimise or pay no
dividends from Parent U.S. REIT to Equity SPV
37
Singapore
Manulife
Sponsor Unitholders
(9.8% limit)
100%
100% Wholly-owned
U.S.
Equity SPV
Parent U.S.
REIT
Subs8
Dividends6
0% Tax
100%
Loans
Interest & Principal7
Properties Figueroa, Michelson, Peachtree, Plaza, Exchange
Shareholder Loan
SPVs4
Barbados Entities5
Barbados 100% Wholly-owned
(1) As at 1 January 2018. Please refer to the SGX announcement dated 2 January 2018 titled “Redemption of Preferred
Shares by U.S. REITs and Proposed Establishment of Wholly-Owned Entities” for details of the restructuring undertaken by
MUST
(2) For U.S. and non U.S. persons filing valid tax forms
(3) No less than 5 persons holding 50% of company
(4) There are three wholly-owned Shareholder Loan SPVs, each of which has made equity investments in two wholly-owned
Barbados entities which had formed a Barbados Limited Partnership
(5) The Barbados Limited Partnerships have extended loans to the Parent U.S. REIT and the interest income on the loans is
taxed in Barbados
(6) Subject to 30% withholding tax
(7) Principal repayments are not subject to U.S. withholding taxes. Interest payments are not subject to U.S. withholding taxes
assuming Unitholders qualify for portfolio interest exemption and provide appropriate tax certifications, including an
appropriate IRS Form W-8
(8) Each Sub holds an individual property

Thank You
For enquiries, please contact: Ms Caroline Fong, Head of Investor Relations
Direct: (65) 6801 1066 / Email: [email protected]
MANULIFE US REAL ESTATE INVESTMENT TRUST
51 Bras Basah Road, #11-00 Manulife Centre, Singapore 189554
http://www.manulifeusreit.sg