provincial treasury 2016/17 annual performance plan
TRANSCRIPT

Page 1 of 20
PROVINCIAL TREASURY
2016/17 ANNUAL PERFORMANCE PLAN
TECHNICAL INDICATOR DESCRIPTIONS

Page 2 of 20
CONTENTS
ITEM Page number
ACRONYMS 3-5
PROGRAMME 1: ADMINISTRATION 6-7
PROGRAMME 2: SUSTAINABLE RESOURCE MANAGEMENT 8-11
PROGRAMME 3: ASSET AND LIABILITY MANAGEMENT 12-15
PROGRAMME 4: FINANCIAL GOVERNANCE 16-17
PROGRAMME 5: MUNICIPAL FINANCE MANAGEMENT 18-20

Page 3 of 20
ACRONYMS
AFS Annual Financial Statement
BAS Basic Accounting System
CASP Comprehensive Agricultural Support Programme
CFO Chief Financial Officer
CFS Combined Financial Statements
CoE Compensation of Employees
DERO District Economic Review and Outlook
EHW Employee Health and Wellness
EPRE Estimates of Provincial Revenue and Expenditure
FASSET Finance and Accounting Services Sector Education and Training Authority
FSGDS Free State Growth and Development Strategy
GDP Gross Domestic Product
HCT Hematocrit
IFS Interim Financial Statement
IMF International Monetary Fund
IYM In Year Monitoring
IT Information Technology

Page 4 of 20
KCM Key Control Matrix
LOGIS Logistical Information System
KPI
MEC
Key Performance Indicators
Member of the Executive Council
MFMA Municipal Finance Management Act
MPAT Management Performance Assessment Tool
mSCOA Municipal Standard Chart of Accounts
MTBPS
MTEF
Medium Term Budget Policy Statement
Medium Term Expenditure Framework
MTSF Medium Term Strategic Framework
MSP Municipal Support Programme
NDP National Development Plan
NERSA National Energy Regulator of South Africa
NGP New Growth Plan
NSDS National Skills Development Strategy
OHS Occupational Health and Safety
PAM Physical Asset Management
PERO Provincial Economic Review and Outlook
PERSAL Personnel and Salary Administration System

Page 5 of 20
PES Provincial Equitable Share
PFMA Public Finance Management Act
PI Performance Indicator
PPI Programme Performance Indicator
POR Provincial Own Revenue
PPP Public, Private Partnerships
PRF Provincial Revenue Fund
PSETA Public Service Sector Education and Training Authority
REA Revenue Enhancement Allocation
SCM Supply Chain Management
SITA State Information Technology Agency
SLA Service Level Agreements
PROGRAMME 1: ADMINISTRATION
Indicator Title Short Definition Purpose/ Importance Source/ evidence Method of
Calculation
Data
Limitations
Type of
Indicator Calculation Type
Reporting
Cycle
New Indi-
cator
Desired
Performance
Indicator
Responsibility

Page 6 of 20
Indicator Title Short Definition Purpose/ Importance Source/ evidence Method of
Calculation
Data
Limitations
Type of
Indicator Calculation Type
Reporting
Cycle
New Indi-
cator
Desired
Performance
Indicator
Responsibility
1.1 Findings on Interim
Financial
Statements
Number of Provincial
Treasury findings on
Interim Financial
Statements
Provincial Treasury assesses
Interim Financial Statements to
enable departments to improve
on the quality of its annual
financial statements.
If the department can reduce
the number of findings, it could
contribute to achieving an
unqualified audit opinion by the
AGSA
Provincial Treasury
IFS assessment
reports
Average of the
number of
findings for the
three quarters
None
Outcome/I
mpact
Cumulative Quarterly Yes Lower
CFO
1.2 Accuracy and
completeness of
interim IFS work-
file
Provincial Treasury
assessment score on
accuracy and
completeness of IFS
work-file
The work file is supporting
documents to the IFS.
Provincial Treasury assesses
accuracy and completeness
against a checklist of
supporting documents required.
Compliance with these
requirements assists in
improving the quality of
financial statements
Provincial Treasury
IFS assessment
reports
Average of the
assessment
score for three
quarters
None
Outcome
Cumulative Quarterly Yes Higher
CFO
1.3 Monthly and
Quarterly KCM
assessment
Percentage of Key
Control Indicators at level
4 score on Provincial
Treasury KCM
assessment for monthly
and quarterly assessment
The indicator measures the
extent to which the department
complies with PFMA and
related requirements as
assessed by Provincial Treasury
through the Key Control Matrix
KCM assessment
reports Averages of the
monthly and
quarterly
assessments
None
Outcome
Non-Cumulative Quarterly Yes Higher
CFO
1.4 Percentage of
invoices paid within
30 days
Percentage of invoices
paid within 30 days of
receipt of a legitimate
invoice. The indicator is
demand driven and a
target can therefore not be
set in actual numbers
The indicator measures the
extent to which all unopposed
invoices (opposed invoices
refers to invoices returned to
suppliers as a result of errors or
inconsistencies on them) are
paid within 30 days. It is
important for small businesses
that government pays its
suppliers within 30 days
Payment reports
Number of
unopposed
invoices paid
within 30 days
as a % of total
number of
unopposed
invoices
received due for
payment during
the reporting
period
Accuracy of
information
captured
Impact Non-Cumulative Quarterly No On target
CFO

Page 7 of 20
Indicator Title Short Definition Purpose/ Importance Source/ evidence Method of
Calculation
Data
Limitations
Type of
Indicator Calculation Type
Reporting
Cycle
New Indi-
cator
Desired
Performance
Indicator
Responsibility
2.1 Compliance with
the NSDS III
Framework
The extent to which the
department complies with
the requirements of the
NSDS III Framework
The indicator shows the
department’s level of
compliance with regard to the
requirements of the NSDS III
Framework in terms of the
development and submission of
the FASSET and PSETA WSP,
reporting on interns and
experiential learners, part-time
bursaries and spending of the
1% of personnel cost allocated
to training
Workplace Skills
Plan
Progress reports
Number of
areas complied
to as a
percentage of
the total number
of requirements
Accuracy of
records
Output Cumulative
Quarterly Yes On-target
SEM: Corporate
Services
2.2 Compliance with
the EHW Strategic
Framework
The extent to which the
department complies with
the requirements of the 4
pillars of the EHW
Strategic Framework
The indicator shows the
department’s level of
compliance with regard to the
requirements of the EHW
Strategic Framework with
regard to the HIV and AIDS
reporting, health assessment,
OHS and wellness reports
Reports Number of
areas complied
to as a
percentage of
the total number
of requirements
Accuracy of
records
Output Cumulative Quarterly Yes On-target
SEM: Corporate
Services
2.3 Number of days
taken to resolve
disciplinary cases
Average number of days
taken to resolve
disciplinary cases
To comply with Labour
Relations act, PFMA, Public
Service Act and Basic
Employment Act etc.
Management report
on disciplinary cases Total number of
days, from the
date when a
disciplinary
case is instituted
against an
employee until
it is finalised, of
all cases
finalised during
the reporting
period divided
by the number
of cases
None
Outcome
Non- Cumulative Quarterly No Lower
SEM: Corporate
Services

Page 8 of 20
PROGRAMME 2: SUSTAINABLE RESOURCE MANAGEMENT
Indicator Title Short Definition Purpose/ Importance Source/ evidence Method of
Calculation
Data
Limitations
Type of
Indicator
Calculation
Type
Reporting
Cycle
New Indi-
cator
Desired
Performance
Indicator
Responsibility
3.1 Economic research
papers
Number of research papers
completed in line with set
scientific standards
High quality research to
enhance inclusive economic
growth and development in the
Free State
Research papers
based on secondary
data from various
databases (e.g.
StatsSA, IHS-
Global Insight,
World Bank, IMF,
African
Development Bank,
South African
Reserve Bank,
National Treasury,
etc.) and research
papers.
Primary data
collected from
surveys, interviews,
etc.
Simple Count Lack of relevant
data at sub-
national level,
poor response
rate on
questionnaires
Output Non-Cumulative Annually No Higher SM: Economic
Analysis
3.2 Publications
Timeous Publication of
the:
PERO
DERO
MTBPS
PERO provides an overview of
the state of the economy, on the
global, national and provincial
sphere.
DERO provides an overview of
the state of municipal district
economy.
MTBPS is a mid-year review
of budget implementation and a
pre-cursor to the next budget, it
includes a review of
macroeconomic forecasts, mid-
year analysis of expenditure
and revenue as well as policy
changes
Publications based
on secondary data
from various
databases (e.g.
StatsSA, IHS-
Global Insight,
World Bank, IMF,
African
Development Bank,
South African
Reserve Bank,
National treasury,
etc.) and research
papers.
Primary data
collected from
surveys, interviews,
etc.
Simple Count Depend on
timely release of
data by various
institutions.
Output Cumulative Annually No On-target SM: Economic
Analysis
3.3 Quarterly Labour
Market Review
Bulletin
Quarterly Labour Market
Review Bulletins
published online according
to set standards
To inform and keep up-to-date
all relevant stakeholders on
current issues in the provincial
Labour Market
Quarterly Labour
Review bulletins
based on secondary
data from StatsSA’s
QLFS, IHS-Global
Insight. Primary
data collected from
surveys, interviews,
etc.
Simple Count Depend on
timely release of
data by StatsSA
Output Non-Cumulative Quarterly No On-target SM: Economic
Analysis

Page 9 of 20
Indicator Title Short Definition Purpose/ Importance Source/ evidence Method of
Calculation
Data
Limitations
Type of
Indicator
Calculation
Type
Reporting
Cycle
New Indi-
cator
Desired
Performance
Indicator
Responsibility
4.1 Revenue base
(Estimates / targets)
Credible revenue targets
for departments
To indicate revenue estimation
for financial years ahead. This
makes provisions for better
planning
Targets/estimates
for MTEF period
agreed with
departments
Simple Count Credibility of
the targets
depends on the
accuracy of
IYM reports
Output Non-Cumulative Annually
No On-target
SM: Fiscal Policy
4.2 Monthly performance
reports on revenue
Monthly Analysis reports
on Own Revenue collected
Monitors the performance of
departments on revenue
collection. This allows for
early detection of poor
performance and timely
intervention of Treasury
Monthly analysis
report based on
departmental
reports
Simple Count Accuracy of
IYM, IRM and
BAS reports
Output Cumulative Monthly No On-target
SM: Fiscal Policy
4.3 Monthly performance
reports on revenue
Monthly Analysis reports
on spending on REA
Projects
Monitors the performance of
departments on spending on
REA projects. This allows for
early detection of poor
performance and timely
intervention of Treasury
Monthly analysis
report based on
departmental
reports
Simple Count Accuracy of
IYM, IRM and
BAS reports
Output Cumulative Monthly No On-target
SM: Fiscal Policy
5.1 Monthly performance
reports on conditional
grants
Monthly reports on
spending on Conditional
Grants
Monitors the performance of
departments on spending of
grants. This allows for early
detection of poor performance
and timely intervention of
Treasury
Monthly analysis
report based on
departmental
reports
Simple Count Accuracy of
IYM, IRM and
BAS reports
Output Cumulative Monthly No On-target
SM: Fiscal Policy
5.2 Quarterly financial
performance reports
Financial performance of
Public Entities evaluated
on quarterly basis
To monitor and evaluate
spending performance against
budgets and thus effective use
of resources
Quarterly spending
performance reports
Simple Count The quality of
monitoring
reports depend
on the accuracy
of reports
received
Output Cumulative Quarterly No Higher
SM: Fiscal Policy
5.3 Appropriation Bill Appropriation Bill
developed to appropriate
money from the Provincial
Revenue Fund for the
requirements of the
Province
To appropriate money from the
Provincial Revenue fund as the
Constitution requires that
money may be withdrawn from
the Provincial Revenue Fund
only in terms of an
appropriation by an Act of the
Provincial Legislature
Appropriation Bill Simple Count None
Output Non-Cumulative Annually No On-target SM: Budget
Management

Page 10 of 20
Indicator Title Short Definition Purpose/ Importance Source/ evidence Method of
Calculation
Data
Limitations
Type of
Indicator
Calculation
Type
Reporting
Cycle
New Indi-
cator
Desired
Performance
Indicator
Responsibility
5.4 Adjustment
Appropriation Bill
Adjustment Appropriation
Bill developed to
appropriate adjusted
amounts of money for the
requirements of the
Province
To appropriate adjusted funds
from the Provincial Revenue
fund as the Constitution
requires that money may be
withdrawn from the Provincial
Revenue Fund only in terms of
an appropriation by an Act of
the Provincial Legislature
Adjustment
Appropriation Bill
Simple Count None Output Non-Cumulative Annually No On-target SM: Budget
Management
5.5 Reports on funded
priorities
Produce quarterly reports
on funded priorities
To track expenditure as well as
progress made on the
implementation of sector
specific priorities
Report on
expenditure and
progress with
priorities
Simple Count The quality of
the report
depends on the
accuracy of
information
from
departments
Output Cumulative Quarterly No Higher
SM: Budget
Management
5.6 Reports on spending
on Personnel
Analysis reports on
spending on Personnel by
provincial departments
To track spending on Personnel
by provincial departments
Report on spending
on Personnel by
provincial
departments
Simple Count The quality of
the report
depends on the
accuracy and
availability of
data from
departments
Output Cumulative Quarterly Yes Higher
SM: Budget
Management
5.7 In-Year Monitoring
Model assessment
reports
Monthly assessment
reports produced in terms
of the In-Year Monitoring
Model
To assess and monitor projected
expenditure against actual
expenditure and to identify
early challenges as well as
providing National Treasury
with an Expenditure Analysis
Report
Provincial
Preliminary
Expenditure
Analysis reports
and pre-audited
data files submitted
to National
Treasury
Simple Count The quality of
the report
depends on the
accuracy and
availability of
data from
departments
Output Cumulative Monthly No On-target SM: Public Finance
5.8
Infrastructure
expenditure
assessment report
Quarterly assessments
reports prepared in terms
of the infrastructure model
To assess and monitor projects
against actual expenditure in
line with project status to
identify early challenges
Data files submitted
to national Treasury
Simple Count None Output Cumulative Quarterly No On-target SM: Public Finance
6.1 Reports on
Infrastructure site
visits conducted
Consolidated report on
infrastructure sites/projects
visited
To monitor if progress is made
with the implementation of
infrastructure projects
Infrastructure site
visit reports
Simple Count The accuracy of
the report
depends on the
accuracy of
reported
information
Output Cumulative Quarterly No Higher SM: Public Finance

Page 11 of 20
Indicator Title Short Definition Purpose/ Importance Source/ evidence Method of
Calculation
Data
Limitations
Type of
Indicator
Calculation
Type
Reporting
Cycle
New Indi-
cator
Desired
Performance
Indicator
Responsibility
6.2 Quarterly
infrastructure, review
meetings
Infrastructure delivery
reviews meetings
conducted
To monitor the progress made
by relevant departments on
infrastructure delivery and the
institutionalisation of the IDIP
within these departments
Attendance
Registers and
minutes/report
Simple Count None
Output Cumulative Quarterly No Higher SM: Public Finance
6.3 Evaluation of
planning documents
for departments
Evaluation report on
infrastructure planning
documents of departments
To ensure that IDMS
implementation documents
adhere to the required standards
an d quality as prescribed by
NT for incentive grant
allocation
Evaluation Report Simple Count None
Output Non-Cumulative Annually Yes Higher SM: Public Finance
7.1 Annual review of the
settlement limit and
bridging finance
Annual review of bridging
finance and settlement
limits
To ensure that the Province has
access to adequate temporary
bridging finance
MEC approval for
the bridging finance
Simple Count
No specific
limitations
Output
Non-Cumulative
Annually
No
On-target
SM: Public Finance
7.2 Monitoring of SLA
with provincial
banker through
monthly meetings
Monthly monitoring of
provincial banker in line
with the SLA through
monthly meetings
To find solutions to banking
challenges experienced by
provincial departments and
provincial treasury
Attendance
registers/Minutes of
meetings
Simple Count None Output Cumulative Monthly No On-target SM: Public Finance
7.3 Reconciliations
between Provincial
Revenue Fund and
PMGs
Monthly reconciliation of
financial information
between Provincial
Revenue Fund and
Provincial Departments
To reconcile the movement of
funds between the Provincial
Revenue Fund and Provincial
Departments (payments and
receipts)
Monthly
departmental
reconciliations
between PMS and
Exchequer accounts
Simple Count No specific
limitations
Output Non-Cumulative Annually Yes On-target
SM: Public Finance

Page 12 of 20
PROGRAMME 3: ASSET AND LIABILITY MANAGEMENT
Indicator Title Short Definition Purpose/ Importance Source/ evidence Method of
Calculation
Data
Limitations
Type of
Indicator
Calculation
Type
Reporting
Cycle
New
Indi-
cator
Desired
Performance
Indicator
Responsibility
8.1 SCM monitoring
reports
Reports on compliance
with the SCM prescripts,
practices and systems
.
To assess departments’
compliance with the SCM
prescripts, practices and
systems and provide them with
feedback and recommendations
in order to improve compliance
SCM Assessment
Reports
Simple Count
None
Output
Cumulative
Quarterly No On-target
SM: Asset
Management
8.2 PPP monitoring
reports
Consolidated reports
produced on progress
reported ito PPP projects.
To report on the status of PPP
projects in the province ito
progress against project plans,
challenges experienced and the
department’s response to the
challenges
Consolidated
reports on progress
with PPP projects
Simple Count The accuracy of
the report
depends on the
accuracy of data
received from
departments
Output Cumulative Quarterly No Higher SM: Asset
Management
8.3 Reports on
assessment of
transversal contracts
Report on progress with
arranging of transversal
contracts and monitoring
of those already in place
To monitor progress with
putting transversal contracts in
place and the extent to which
departments report on and
make use of transversal
contracts
Status report
Simple Count
None
Output
Cumulative Quarterly No Higher
SM: Asset
Management
8.4 Reports on payment
of invoices within 30
days
Report on number of
legitimate invoices from
suppliers reported as not
paid within 30 days by
departments and public
entities
To monitor compliance to TR
8.2.3 and Instruction Note
34/2012 to settle accounts
within required timeframes
Payment analysis
based on BAS and
LOGIS payment
reports and
monthly reports
from departments
and entities
Simple Count
Accuracy
depends on the
correctness of
information on
the systems and
reported by
departments and
public entities
Output
Cumulative Monthly No On-target
SM: Asset
Management
8.5 SCM Forums
Number of supply chain
management forums
conducted
To create a platform for sharing
information and best practices
within SCM
Attendance
Registers
Simple Count
None
Output
Cumulative Quarterly No Higher
SM: Asset
Management
8.6 SCM training
sessions
Number of training
sessions conducted
To monitor skills development
initiatives to ensure adequate
skills and capacity within SCM
in the Province
Attendance
Registers
Simple Count
None
Output
Cumulative Quarterly No Higher
SM: Asset
Management

Page 13 of 20
Indicator Title Short Definition Purpose/ Importance Source/ evidence Method of
Calculation
Data
Limitations
Type of
Indicator
Calculation
Type
Reporting
Cycle
New
Indi-
cator
Desired
Performance
Indicator
Responsibility
8.7 Assessment of
Annual Procurement
Plans
Report on Assessment of
Annual Procurement
Plans
Provincial Treasury assesses
departments’ Annual
Procurement Plans to ensure
compliance and improve the
quality thereof.
Annual
Procurement Plans
Report
Simple Count
None
Output
Non-Cumulative Annually Yes On-target
SM: Asset
Management
9.1 Physical asset
monitoring reports
Physical asset monitoring
reports produced on
Physical Asset
Management (PAM)
practices in the Province
To monitor and evaluate
internal control systems of
departments and public entities
with regard to physical asset
management
Monitoring reports Simple Count
None
Output
Cumulative Quarterly No Higher
SM: Asset
Management
9.2 Reports for
assessment of Interim
and draft Financial
Statements on assets
Report for assessment of
Interim and draft financial
statements produced to
promote quality financial
statements
To assess the integrity of
information reported by
department and ensure that the
correct amounts are disclosed
in the interim financial
statements
Interim and draft
Financial
Statements Reports
Simple Count
None Output Cumulative Quarterly Yes On-target SM: Asset
Management
9.3 Report on follow up
of Prior Year asset
audit issues
Analysis on Prior Audit
issues raised by the
AGSA
To monitor whether all issues
raised by the Auditor General
has been addressed and
whether it is cleared prior to
auditing the current financial
year
Review of
departmental
responses to
exceptions as per
Remedial Action
Plans
Simple Count
None
Output
Cumulative Quarterly No Higher
SM: Asset
Management
9.4 PAM Forums Number of forums held to
improve physical asset
management in
departments and public
entities
To assist departments and
public entities to enhance and
improve asset management
through capacity building
Attendance
Registers and
agendas
Simple Count
None
Output
Cumulative Quarterly
No Higher SM: Asset
Management
9.5 PAM training
sessions
Number of training
sessions held to improve
physical asset
management in
departments and public
entities
To assist departments and
public entities to enhance and
improve asset management
through capacity building
Attendance
Registers
Simple Count
None
Output
Cumulative Annually No Higher
SM: Asset
Management
9.6 PAM-Inventory
monitoring reports
Reports on visits to
departments and public
entities to monitor
inventory management
To assist departments and
public entities to enhance
sound practices on inventory
management. The reports
assist Provincial Treasury to
identify shortcomings and
develop appropriate
interventions
Inventory
monitoring reports
Simple Count
None
Output
Cumulative Quarterly
Yes On-target
SM: Asset
Management

Page 14 of 20
Indicator Title Short Definition Purpose/ Importance Source/ evidence Method of
Calculation
Data
Limitations
Type of
Indicator
Calculation
Type
Reporting
Cycle
New
Indi-
cator
Desired
Performance
Indicator
Responsibility
9.7 PAM Quarterly
LOGIS Asset
Compliance Report
Report on departments
and public entities’
compliance with regard to
PAM LOGIS Asset
To identify asset register
weaknesses and assist
departments and public entities
to correct identified errors prior
to external audit visits
LOGIS Asset
Compliance Report
Simple Count
None
Output
Cumulative Quarterly
Yes On-target
SM: Asset
Management
10.1 Percentage of
working hours that
BAS Terminal
Servers are available
The indicator refers to the
availability and stability
of the BAS terminal
servers as a percentage of
normal working hours
To measure the extent to which
the BAS terminal servers are
available for Free State BAS
users to logon to the BAS
system
Up-time/ down
time monitoring
register
The availability of
the BAS terminal
server is checked
twice a day by
logging on to
verify that it is
online. Up- and
downtime is
recorded in a
register. These
records form the
basis from which
uptime is
calculated.
Uptime (x) is
calculated by
deducting the total
no of hours
downtime (y) for
a month from the
total number of
normal working
hours in the
month (z) and
dividing it by the
total number of
working hours (z)
multiply by 100,
i.e.
X= (z – y)/z *100
Downtime could
be experienced
in between
verification
logons/ loggings
Output Cumulative
Quarterly No Higher
SM: SIFS

Page 15 of 20
Indicator Title Short Definition Purpose/ Importance Source/ evidence Method of
Calculation
Data
Limitations
Type of
Indicator
Calculation
Type
Reporting
Cycle
New
Indi-
cator
Desired
Performance
Indicator
Responsibility
10.2 Technical and
functional response
time
Respond to requests for
technical and functional
support to Provincial
Departments within 8
working hours.
Support is provided with
regard to the BAS,
LOGIS and PERSAL
systems. This could
include, but is not limited
to, User Creation, User
Deletion, User
Amendments, Printer
Creation, Printer Deletion,
Printer Amendments,
Terminal Server Password
Resets; LU (mainframe)
Registration for PERSAL
Users
The exact nature of the
support provided depends
on the request that the
user registers
The indicator measures the
extent to which the department
is able to ensure that logged
calls are responded to within
acceptable timeframes
i-Request reports
(Statistics
report/register)
The number of
requests/calls
responded to
within 8 working
hours is calculated
as a percentage of
the total number
of calls logged to
determine the
overall percentage
for responses
within 8 working
hours
Accuracy
depends on
availability of
the network and
accuracy of
logging calls
Output Cumulative
Quarterly No Higher
SM: SIFS
10.3 Training of officials
on functional use of
Transversal Systems
in the province
Number of users trained
on Transversal Systems
(BAS, PERSAL and
LOGIS)
This indictor is demand
driven and the actual
number of users trained
depend on nominations
from departments
To have competent Transversal
Systems users,
Minimisation of risks
Effective utilization of the
system
Obtain 100% compliance on
the utilization of the system
Training statistics
report / system
attendance
report/register
Simple Count
None Output Cumulative Quarterly No On-target SM: SIFS

Page 16 of 20
PROGRAMME 4: FINANCIAL GOVERNANCE
Indicator Title Short Definition Purpose/ Importance Source/ evidence Method of
Calculation
Data
Limitations
Type of
Indicator
Calculation
Type
Reporting
Cycle
New
Indi-
cator
Desired
Performance
Indicator
Responsibility
11.1
Formal training
sessions to build
capacity
Provide structured training
to build and maintain
accounting capacity in
Provincial Departments
and Entities on accounting
practices.
To increase skills and
knowledge of relevant officials
to enhance the quality of
financial reporting
Attendance registers/
Presentations
Simple Count
None
Output
Cumulative
Quarterly
No
Higher
SM: Accounting
Services
11.2 Interim and draft
annual financial
statements
assessments
Consolidated reports on
interim and draft annual
financial statements
assessments produced to
promote quality financial
statements that should
leads to unqualified audit
opinions by the AGSA
To comply with Provincial
Treasury mandate to promote
enforcement of section
18(2)(b) of the PFMA and
identify capacity/ support
required to be addressed to
ensure complete and quality
financial reporting
Financial Statement
Assessment report
Simple Count
None
Output Cumulative
Quarterly No
On-target
SM: Accounting
Services
11.3 Consolidated annual
financial statements
and Annual Report
Compilation and timely
submission of the quality
Annual Consolidated
Financial Statements for
the Province in respect of
departments and entities.
• Draft CFS by 30 June
• Final CFS by 31 August
• Annual Report by 31
October
To comply with Provincial
Treasury mandate to promote
enforcement of section 19 of
the PFMA
Consolidated Annual
Financial statements
and Annual report
Simple Count
None
Output
Cumulative
Quarterly
No
On-target
SM: Accounting
Services
11.4 Key Control Matrix Consolidated Key Control
Matrix (KCM) assessment
reports produced
regarding departments
and entities’ to promote
compliance with
legislative requirements
To comply with Provincial
Treasury mandate to promote
enforcement of relevant
legislative requirements and
identify capacity /support
required to enhance sound
financial management, service
delivery and improve future
audit outcomes
Consolidated KCM
reports
Simple Count
None Output
Cumulative
Quarterly No
On-target
SM: Accounting
Services
12.1 Risk Management
and Fraud Risk
Assessment
Compliance Reports
Bi-annual consolidated
assessment report
produced for departments
and public entities
regarding compliance with
Risk Management
Framework and Fraud
Risk Assessments
To comply with Provincial
Treasury mandate to promote
enforcement with legislative
requirements, identify capacity
/support required and
ultimately increasing the level
of compliance with the risk
management framework and
enhance prevention of fraud
Bi-Annual
consolidated Risk
Management and
Fraud Risk
Assessments KPI
Reports
Simple Count None Output Cumulative Bi-Annually No On-target
SM: Provincial
Risk Management
and Internal Audit
Page 17 of 20
Indicator Title Short Definition Purpose/ Importance Source/ evidence Method of
Calculation
Data
Limitations
Type of
Indicator
Calculation
Type
Reporting
Cycle
New
Indi-
cator
Desired
Performance
Indicator
Responsibility
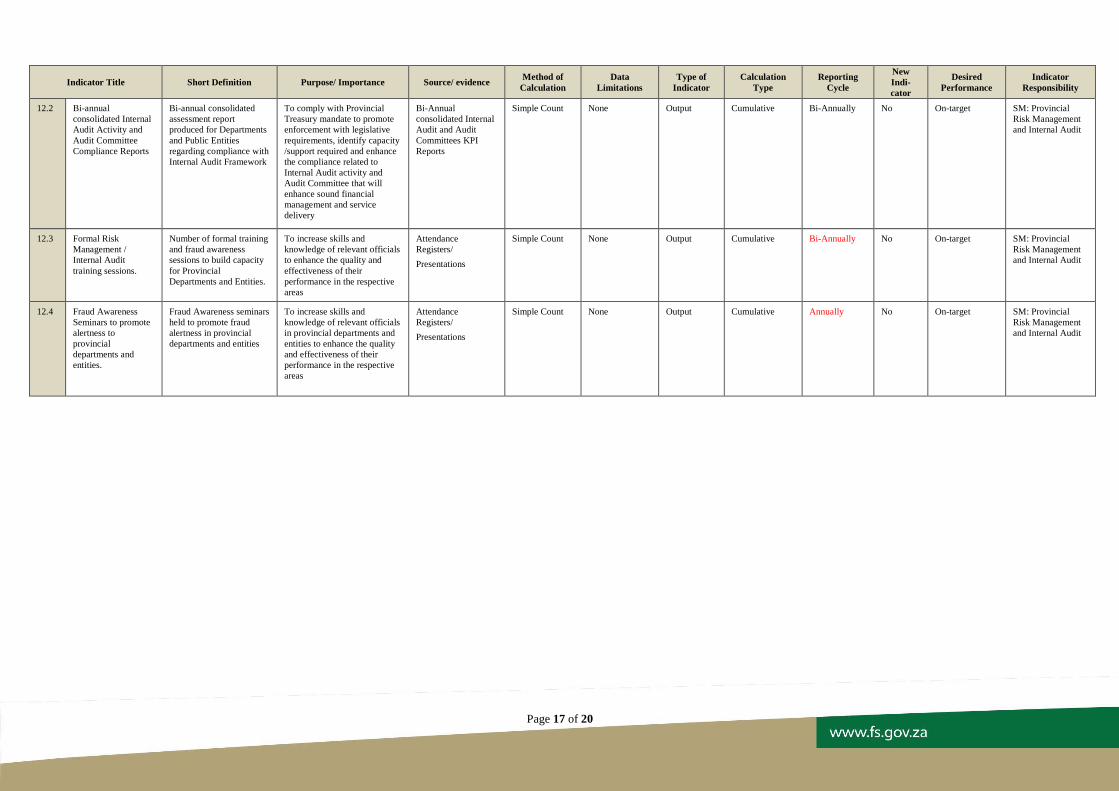
12.2 Bi-annual
consolidated Internal
Audit Activity and
Audit Committee
Compliance Reports
Bi-annual consolidated
assessment report
produced for Departments
and Public Entities
regarding compliance with
Internal Audit Framework
To comply with Provincial
Treasury mandate to promote
enforcement with legislative
requirements, identify capacity
/support required and enhance
the compliance related to
Internal Audit activity and
Audit Committee that will
enhance sound financial
management and service
delivery
Bi-Annual
consolidated Internal
Audit and Audit
Committees KPI
Reports
Simple Count None Output Cumulative Bi-Annually No On-target
SM: Provincial
Risk Management
and Internal Audit
12.3 Formal Risk
Management /
Internal Audit
training sessions.
Number of formal training
and fraud awareness
sessions to build capacity
for Provincial
Departments and Entities.
To increase skills and
knowledge of relevant officials
to enhance the quality and
effectiveness of their
performance in the respective
areas
Attendance
Registers/
Presentations
Simple Count None Output Cumulative Bi-Annually No On-target
SM: Provincial
Risk Management
and Internal Audit
12.4 Fraud Awareness
Seminars to promote
alertness to
provincial
departments and
entities.
Fraud Awareness seminars
held to promote fraud
alertness in provincial
departments and entities
To increase skills and
knowledge of relevant officials
in provincial departments and
entities to enhance the quality
and effectiveness of their
performance in the respective
areas
Attendance
Registers/
Presentations
Simple Count None Output Cumulative Annually No On-target
SM: Provincial
Risk Management
and Internal Audit

Page 18 of 20
PROGRAMME 5: MUNICIPAL FINANCE MANAGEMENT
Indicator Title Short Definition Purpose/ Importance Source/ evidence Method of
Calculation
Data
Limitations
Type of
Indicator
Calculation
Type
Reporting
Cycle
New
Indi-
cator
Desired
Performance
Indicator
Responsibility
13.1
Budget analysis
Assessment of Draft and
Final Budgets received on
credibility and compliance
with MFMA regulations
The indicator assesses
Municipalities’, which
submitted budgets to Provincial
Treasury, for compliance to
Treasury and Budgeting
regulations
Consolidated
reports
Simple Count
None Output Cumulative Bi-Annually No On-target All SM in MFM
13.2 Compliance with
Section 71 reporting
Quarterly publication of
Section 71 reports for local
government and legislature
To track the level of compliance
in terms of implementation of
municipal budgets
Compliance reports Simple Count None Output Cumulative Quarterly No Higher All SM in MFM
13.3 NERSA applications Municipalities supported
through working sessions
with NERSA on NERSA
applications
To assist municipalities to
adhere to NERSA requirements
through filling of D-forms on
tariffs for the financial year
Agenda/
Attendance
Register
Simple Count None Output Cumulative Annually Yes Higher All SM in MFM
13.4 Debtors and creditors Municipalities supported on
debtors and creditors, to
address debt reduction and
payment to bulk service
providers
Support provided to
municipalities entails
conducting reconciliation
sessions with relevant
municipalities and
government departments to
discuss challenges and
possible solutions with regard
to outstanding debt
Support to municipalities to
reduce the outstanding debt
owed to municipalities by
government departments
Agenda/
Attendance
Register
Simple Count None Output Cumulative Annually No Higher All SM in MFM
13.5 mSCOA training mSCOA capacity building Training to enable municipal
officials to implement mSCOA
standards
Attendance
Registers / Training
report
Simple Count None
Output
Cumulative Bi-Annually Yes Higher All SM in MFM
13.6 mSCOA assessment mSCOA readiness
assessment
To track progress on
municipalities’ readiness to
implement mSCOA
Assessment reports Simple Count None
Output
Cumulative Quarterly Yes Higher All SM in MFM
13.7 mSCOA support plan Implementation of mSCOA
support plan
To track progress on
implementation of mSCOA
support plan
Progress report Simple Count None Output Cumulative Quarterly Yes Higher All SM in MFM

Page 19 of 20
Indicator Title Short Definition Purpose/ Importance Source/ evidence Method of
Calculation
Data
Limitations
Type of
Indicator
Calculation
Type
Reporting
Cycle
New
Indi-
cator
Desired
Performance
Indicator
Responsibility
14.1 Audit action plans and
Key controls
Municipalities monitored on
Audit action plans and 5 key
controls
To monitor whether all issues
raised by the Auditor General
have been addressed and
whether it is cleared prior to
auditing the current financial
year
Review of
municipal
responses to
exceptions as per
Remedial Action
Plans
Simple Count
None
Output
Cumulative Quarterly Yes Higher
All SM in MFM
14.2 Review of Mid-year
financial statements
Report on the review of mid-
year financial statements of
municipalities submitted to
Provincial Treasury for
review
Assessment of submitted
financial statements and
feedback to municipalities
Consolidated
Report on review of
mid-year to
Provincial Treasury
and feedback to
municipalities
Simple Count
None
Output Non-
Cumulative
Annually No On-target
All SM in MFM
14.3 MSP Reports Reports on Municipal
Support programme
To track progress on
improvement of audits and
hands-on support to address
issues of skills shortage,
financial statements, assets and
other challenges
Consolidated report Simple Count
None
Output Non-
Cumulative
Bi-Annually Yes On-target
SM: IGR
14.4 SCM practitioners
training
Training of SCM
practitioners, bid committee
members, Section 32
committee members and
Internal Auditors on
irregular; unauthorised and
wasteful expenditure
Measures the Provincial
Treasury’s initiatives to improve
the skills levels of municipal
officials in order to improve
compliance with MFMA and
related legislation
Attendance
Registers / Training
report
Simple Count None
Output
Cumulative Quarterly No Higher SM: Supply Chain
Management and
Compliance
15.1
SCM toolkit training SCM toolkit training sessions The indicator measures
Provincial Treasury’s efforts to
enable SCM practitioners to
fully utilise the SCM toolkit in
order to improve SCM practices
at municipalities
Attendance
Registers / Training
report
Simple Count
None Output Cumulative Quarterly No Higher SM: Supply Chain
Management and
Compliance
15.2 CFO forums Chief Financial Officers’
forums
To create a platform for sharing
information and best practices
on sound Financial Management
Attendance
Registers / Forum
reports
Simple Count
None Output Cumulative Bi-Annually Yes Higher SM: Supply Chain
Management and
Compliance
16.1 Municipalities
assessed and supported
on Internal Audit and
Risk Management
Reports issued on
municipalities assessed to
improve functionality and
efficiency of internal audit,
risk management, audit
committee and risk
management committee
Report to Management on the
level of improved compliance on
applicable legislations.
Evaluation
templates and
supporting evidence
collected from the
Internal Auditors at
the municipalities
Simple Count None
submission of
the evidence
by the
municipalities
Output Cumulative Annually No Higher
SM: Mun Internal
Audit & Risk
Management

Page 20 of 20
Indicator Title Short Definition Purpose/ Importance Source/ evidence Method of
Calculation
Data
Limitations
Type of
Indicator
Calculation
Type
Reporting
Cycle
New
Indi-
cator
Desired
Performance
Indicator
Responsibility
16.2 Internal Audit and
Risk Management
training
Internal Audit and Risk
Management training
sessions held
To provide training to
municipalities on Internal Audit
and Risk Management
Attendance
Registers / Training
report
Simple Count
None Output Cumulative Bi-Annually
No Higher SM: Mun Internal
Audit & Risk
Management
16.3 Fraud Awareness
Seminars
Fraud Awareness seminars
held to promote fraud
alertness in municipalities
To increase skills and
knowledge of relevant officials
in municipalities to enhance the
quality and effectiveness of their
performance in the respective
areas
Attendance
Registers
/Presentations
Simple Count None Output Cumulative Annually
No On-target
All SM in MFM