psychological correlates of university students...
TRANSCRIPT

Psychological Correlates of University Students’ Academic Performance:A Systematic Review and Meta-Analysis
Michelle RichardsonUniversity College London
Charles AbrahamUniversity of Exeter
Rod BondUniversity of Sussex
A review of 13 years of research into antecedents of university students’ grade point average (GPA)scores generated the following: a comprehensive, conceptual map of known correlates of tertiary GPA;assessment of the magnitude of average, weighted correlations with GPA; and tests of multivariatemodels of GPA correlates within and across research domains. A systematic search of PsycINFO andWeb of Knowledge databases between 1997 and 2010 identified 7,167 English-language articles yielding241 data sets, which reported on 50 conceptually distinct correlates of GPA, including 3 demographicfactors and 5 traditional measures of cognitive capacity or prior academic performance. In addition, 42non-intellective constructs were identified from 5 conceptually overlapping but distinct research do-mains: (a) personality traits, (b) motivational factors, (c) self-regulatory learning strategies, (d) students’approaches to learning, and (e) psychosocial contextual influences. We retrieved 1,105 independentcorrelations and analyzed data using hypothesis-driven, random-effects meta-analyses. Significant aver-age, weighted correlations were found for 41 of 50 measures. Univariate analyses revealed thatdemographic and psychosocial contextual factors generated, at best, small correlations with GPA.Medium-sized correlations were observed for high school GPA, SAT, ACT, and A level scores. Threenon-intellective constructs also showed medium-sized correlations with GPA: academic self-efficacy,grade goal, and effort regulation. A large correlation was observed for performance self-efficacy, whichwas the strongest correlate (of 50 measures) followed by high school GPA, ACT, and grade goal.Implications for future research, student assessment, and intervention design are discussed.
Keywords: student, grade point average, self-efficacy, goal, meta-analysis
The psychology of individual differences originated in attemptsto predict scholastic performance. Binet and Simon’s (1916) workshowed that children’s individual cognitive capacities explainedvariability in educational performance and, in doing so, laid thefoundations for extensive research into intelligence and intelli-gence testing (Neisser et al., 1996). Theoretical debate focused onthe psychological nature of intelligence, and applied researchexplored how differences in intelligences can be most usefullyassessed (e.g., Carpenter, Just, & Shell, 1990; Gardner, 1983;
Spearman, 1927). Subsequent research has identified a variety ofindividual differences that predict scholastic performance andprompted construction of a wide range of assessment instruments.Yet this diverse literature has not clarified how and to what extentseparate measures of academic potential are related. Greater con-ceptual and methodological integration would help focus futureresearch questions and facilitate optimal assessment of students’academic potential. In order to achieve this objective we reviewed13 years of research into correlates of tertiary-level academicperformance, where “tertiary-level” refers to postsecondary, un-dergraduate university, or college education. We investigated (a)which individual differences are associated with better perfor-mance, (b) how strong these associations are, and (c) whether aparsimonious evidence-based, additive model of predictors can beconstructed.
Distinct strands of evidence indicate that predictions of aca-demic performance may be more accurate if they are based onassessment of a variety of individual differences, not just ofpast achievement and cognitive capacity. First, in tertiary edu-cation, student selection procedures reduce variation in intelli-gence scores, especially at selective institutions (Furnham,Chamorro-Premuzic, & McDougall, 2002). Consequently, atthis level, factors others than intelligence may be critical toaccurate prediction of performance. Second, and more gener-ally, research has identified a variety of non-intellective factors
Michelle Richardson, Centre for Outcomes Research and Effectiveness,University College London, London, United Kingdom; Charles Abraham,Peninsula College of Medicine and Dentistry, University of Exeter, Exeter,United Kingdom; Rod Bond, School of Psychology, University of Sussex,Falmer, United Kingdom.
This research was funded by the Economic and Social Research Coun-cil, United Kingdom. The preparation of this paper was partially supportedby the U.K. National Institute for Health Research (NIHR). However, theviews expressed are those of the authors and not necessarily those of theNIHR or the U.K. Department of Health. We thank Louisa Pavey forconducting data extraction used to assess interrater reliability.
Correspondence concerning this article should be addressed to MichelleRichardson, Centre for Outcomes Research and Effectiveness (CORE),Research Department of Clinical, Education and Health Psychology, Uni-versity College London, 1-19 Torrington Place, London WC1E 7HB,United Kingdom. E-mail: [email protected]
Psychological Bulletin © 2012 American Psychological Association2012, Vol. 138, No. 2, 353–387 0033-2909/12/$12.00 DOI: 10.1037/a0026838
353

associated with academic performance. For example, Ackermanand Heggestad (1997) provided an informative analysis ofrelationships between intelligence, personality, and interests;Poropat (2009) demonstrated that academic performance isassociated with five-factor personality traits. The latter reviewshowed that the relation between conscientiousness and aca-demic performance was largely independent of intelligence andthat when academic performance at secondary level (i.e., highschool) was controlled, conscientiousness added as much to theprediction of tertiary academic performance as did intelligence.Less stable tendencies including motivation, self-regulatorylearning strategies, and learning styles have also been found topredict academic performance, controlling for the effects ofintelligence and personality (e.g., Chamorro-Premuzic, & Furn-ham, 2008; for a review, see Robbins et al., 2004).
In addition, traditional tests of cognitive ability have limitations.Following the construction of the Stanford–Binet intelligence test(Terman, 1916), the Scholastic Aptitude Test was developed in1925. This test is now referred to as the SAT and is the mostwidely used, standardized, college admissions test in North Amer-ica (Everson, 2002). Yet, doubts have been raised regarding cul-tural and socioeconomic biases in the SAT and, in a more recenttest of academic reasoning, the ACT (e.g., Zwick, 2004). Incombination, these findings suggest that development of compre-hensive, accurate, predictive models of academic performancenecessitates a broader representation of student capacities andtendencies. We aimed to provide a foundation for such work bypresenting an integrative overview of the evidence supporting awide range of predictors of tertiary educational performance. Ourresearch focused on individual differences that have the potentialto enhance the prediction of academic performance over and abovelevels achieved by traditional measures of intelligence or cognitivecapacity.
Measuring Student Performance
Predicting performance depends on being able to assess it.Tertiary (i.e., undergraduate university) students’ performanceis usually expressed in terms of grade point average (GPA), thatis, the mean of marks from weighted courses contributing toassessment of the final degree. GPA is the key criterion forpostgraduate selection and graduate employment and is predic-tive of occupational status (Strenze, 2007). As such, it is anindex of performance directly relevant to training and employ-ment opportunities (Plant, Ericsson, Hill, & Asberg, 2005) andis meaningful to students, universities, and employers alike.GPA is also an objective measure with good internal reliabilityand temporal stability (e.g., Bacon & Bean, 2006; Kobrin,Patterson, Shaw, Mattern, & Barbuti, 2008). GPA is not withoutlimitations, with questions of reliability and validity arising asa result of grade inflation (Johnson, 2003) and institutionalgrading differences (Didier, Kreiter, Buri, & Solow, 2006).Nonetheless, no other measure of tertiary academic perfor-mance rivals the measurement utility of GPA. For example,behavioral measures such as time spent studying appear to beunrelated to or weakly associated with GPA (rs range from�.02 to .12), regardless of assessment method (e.g., number ofhours studied or time diaries; Hill, 1990; Schuman, Walsh, &Olson, 1985) or performance criterion (e.g., cumulative GPA or
course GPA). Unsurprisingly then, GPA is the most widelystudied measure of tertiary academic performance, which weused as the primary outcome measure in this study.
Traditional Correlates of GPA: SAT, ACT,Intelligence, High School GPA, and A Level Points
Measures of SAT, ACT (originally the abbreviation of Ameri-can College Testing), and high school GPA are central to univer-sity admissions in North America. Test developers conceptualizedthe SAT as a test of scholastic aptitude, and concordance studiesshow that the SAT and ACT are highly correlated (Dorans, Lyu,Pommerich, & Houston, 1997). There is considerable conceptualand empirical overlap between these measures of scholastic apti-tude and more general measures of intelligence (e.g., Raven’sAdvanced Progressive Matrices; Frey & Detterman, 2004; Raven,Raven, & Court, 1998). Surprisingly, however, studies have notincluded measures of intelligence together with SAT/ACT assess-ments when predicting GPA, making it difficult to determinewhether these scholastic assessments add to, or substitute for, thepredictive power of intelligence tests in relation to academicperformance.
Despite differences in course content and grading criteria, highschool GPA is a stronger predictor of university GPA than is eitherthe SAT or the ACT. All three measures have been found toexplain independent variation in GPA (Bridgeman, Pollack, &Burton, 2004; Ramist, Lewis, & McCamley-Jenkins, 2001), col-lectively accounting for approximately 25% of the variance (Ma-thiasen, 1984; Mouw & Khanna, 1993; Robbins et al., 2004).Hence, substantial variance is unexplained.
In Europe, there is no standardized university admission proce-dure (equivalent to SAT/ACT), but assessment of secondaryschool performance is normally central to student selection. In theUnited Kingdom, for example, the advanced general certificate ofeducation (A level examinations) is usually taken at age 18 and isequivalent to high school GPA. The number of cross-subject Alevel points attained is the key entry criterion for most U.K.universities. A weighted mean r of .28 between A level points anddegree classification has been reported (Peers & Johnston, 1994),although few studies of this relation have been conducted recently.
We refer to such established measures of academic potential andcognitive ability as “traditional” correlates of GPA to indicate thatthe incremental predictive utility of other (non-intellective) factorsshould be demonstrated while controlling for these widely usedassessments. Thus, in the model tested here, we included fivetraditional correlates of GPA: SAT, ACT, intelligence, high schoolGPA, and A level points.
Psychological Correlates of GPA: A Brief Overview
Intelligence tests (e.g., Harris, 1940; Neisser et al., 1996) reflectcognitive capacities, including the ability to represent and manip-ulate abstract relations (Carpenter et al., 1990). Such measuresassess what an individual can do. Other correlates of GPA mayclarify how individuals are likely to use their intellectual capacities(Barrick, Mount, & Strauss, 1993; Busato, Prins, Elshout, & Ha-maker, 1998). Identification of such non-intellective antecedentsof academic performance has proliferated over the past 10–15years (e.g., Eccles & Wigfield, 2002). We review this research
354 RICHARDSON, ABRAHAM, AND BOND
across 13 years (1997–2010), presenting a five-domain frameworkwithin which nontraditional correlates of GPA can be organized.
Many studies have assessed the role of personality in academicperformance (Poropat, 2009). Dispositional personality traits areassumed, like intelligence, to exert a constant influence overperformance across situations. Such traits are, in part, geneticallymediated and remain relatively stable over time (for a conceptualreview, see Murphy & Alexander, 2000). For example, intelli-gence scores have heritability estimates ranging from .50 to .80(Plomin, 2001); parallel estimates of .72 have been reported forconscientiousness (Riemann, Angleitner, & Strelau, 1997).
Research has also highlighted the importance of domain-specific, motivational contributions to academic performance (Pin-trich, 2004). Such research demonstrates that performance-relevant beliefs, values, and goals are “dynamic and contextuallybound and that learning strategies can be learned and broughtunder the control of the student” (Duncan & McKeachie, 2005, p.117). As Zimmerman (1989) noted, self-regulated learners are“meta-cognitively, motivationally, and behaviourally active partic-ipants in their own learning process” (p. 4). Consequently, modelsof academic performance may have to encompass expectancies,motivation, goals, and use of self-regulatory learning strategies(Eccles & Wigfield, 2002; Robbins et al., 2004). Unlike intelli-gence and personality, these predictors are more malleable andcontext sensitive (e.g., Carver & Scheier, 1981; Wolters, Pintrich,& Karabenick, 2003).
Research into students’ approaches to learning (SAL; e.g.,Biggs, 1987), developed using phenomenological methods, hasacknowledged the impact of motivational and cognitive processeson learning (e.g., Diseth, Pallesen, Brunborg, & Larsen, 2010).Such research has resulted in overarching characterizations ofstudents’ learning styles (e.g., surface vs. deep) that imply partic-ular constellations of motivation and self-regulatory control. Inpractice, however, students’ performance may depend on changingcombinations of motives and self-regulatory strategies across dif-ferent tasks and contexts (Pintrich, 2004). Consequently, con-structs drawn from motivational and self-regulatory research mayfacilitate more detailed and flexible characterizations of predictorsof scholastic performance than SAL categorizations.
In addition, academic performance may be determined by orga-nizational features of learning institutions and the interaction be-
tween individual learners and their learning context (Bean, 1980;Tinto, 1975). Tinto’s work highlighted the role of institutionalcharacteristics in shaping students learning and reducing studentdropout, and later models (e.g., Bean, 1985) emphasized the me-diating role of psychological responses to contextual influences inoptimizing academic performance. In general, institutional char-acteristics and contextual influences have been assessed in termsof learners’ perceptions of their environment and their psycholog-ical responses to learning contexts.
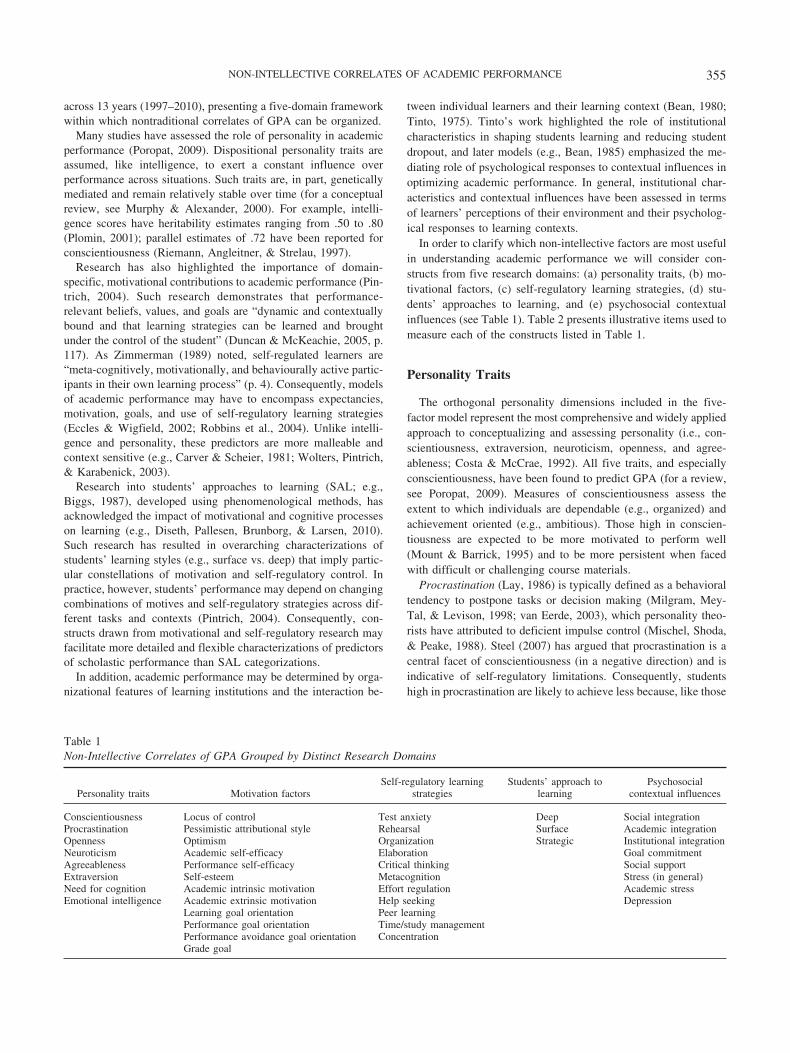
In order to clarify which non-intellective factors are most usefulin understanding academic performance we will consider con-structs from five research domains: (a) personality traits, (b) mo-tivational factors, (c) self-regulatory learning strategies, (d) stu-dents’ approaches to learning, and (e) psychosocial contextualinfluences (see Table 1). Table 2 presents illustrative items used tomeasure each of the constructs listed in Table 1.
Personality Traits
The orthogonal personality dimensions included in the five-factor model represent the most comprehensive and widely appliedapproach to conceptualizing and assessing personality (i.e., con-scientiousness, extraversion, neuroticism, openness, and agree-ableness; Costa & McCrae, 1992). All five traits, and especiallyconscientiousness, have been found to predict GPA (for a review,see Poropat, 2009). Measures of conscientiousness assess theextent to which individuals are dependable (e.g., organized) andachievement oriented (e.g., ambitious). Those high in conscien-tiousness are expected to be more motivated to perform well(Mount & Barrick, 1995) and to be more persistent when facedwith difficult or challenging course materials.
Procrastination (Lay, 1986) is typically defined as a behavioraltendency to postpone tasks or decision making (Milgram, Mey-Tal, & Levison, 1998; van Eerde, 2003), which personality theo-rists have attributed to deficient impulse control (Mischel, Shoda,& Peake, 1988). Steel (2007) has argued that procrastination is acentral facet of conscientiousness (in a negative direction) and isindicative of self-regulatory limitations. Consequently, studentshigh in procrastination are likely to achieve less because, like those
Table 1Non-Intellective Correlates of GPA Grouped by Distinct Research Domains
Personality traits Motivation factorsSelf-regulatory learning
strategiesStudents’ approach to
learningPsychosocial
contextual influences
Conscientiousness Locus of control Test anxiety Deep Social integrationProcrastination Pessimistic attributional style Rehearsal Surface Academic integrationOpenness Optimism Organization Strategic Institutional integrationNeuroticism Academic self-efficacy Elaboration Goal commitmentAgreeableness Performance self-efficacy Critical thinking Social supportExtraversion Self-esteem Metacognition Stress (in general)Need for cognition Academic intrinsic motivation Effort regulation Academic stressEmotional intelligence Academic extrinsic motivation Help seeking Depression
Learning goal orientation Peer learningPerformance goal orientation Time/study managementPerformance avoidance goal orientation ConcentrationGrade goal
355NON-INTELLECTIVE CORRELATES OF ACADEMIC PERFORMANCE
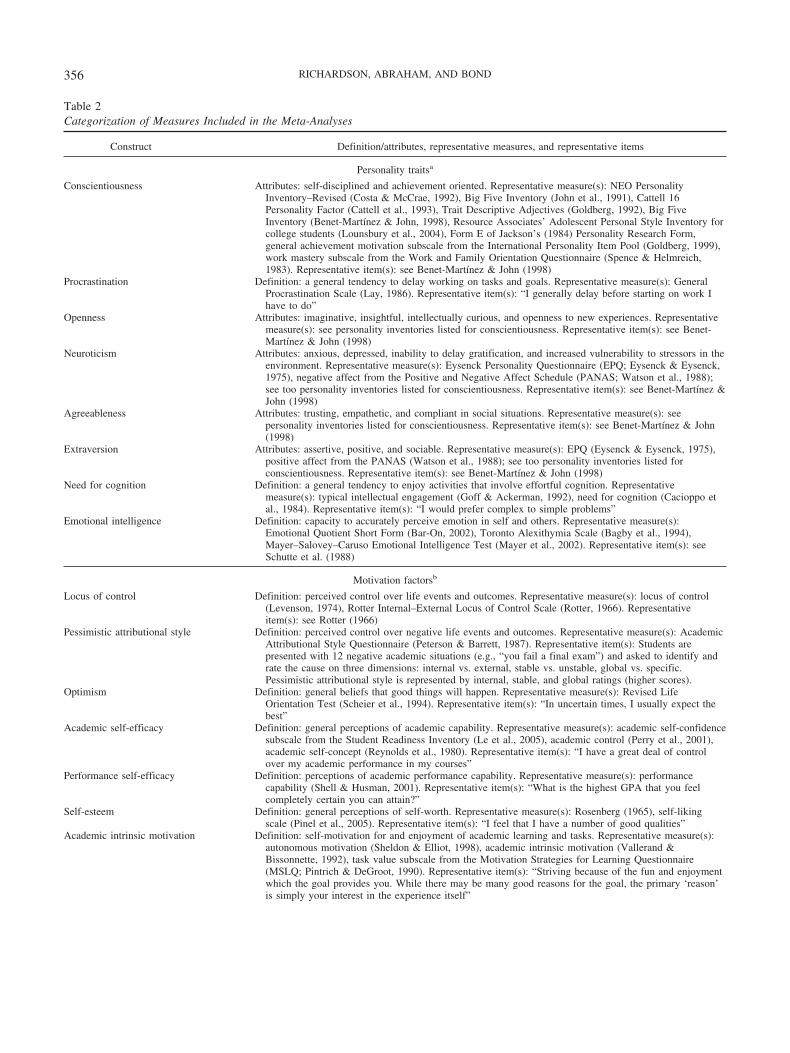
Table 2Categorization of Measures Included in the Meta-Analyses
Construct Definition/attributes, representative measures, and representative items
Personality traitsa
Conscientiousness Attributes: self-disciplined and achievement oriented. Representative measure(s): NEO PersonalityInventory–Revised (Costa & McCrae, 1992), Big Five Inventory (John et al., 1991), Cattell 16Personality Factor (Cattell et al., 1993), Trait Descriptive Adjectives (Goldberg, 1992), Big FiveInventory (Benet-Martınez & John, 1998), Resource Associates’ Adolescent Personal Style Inventory forcollege students (Lounsbury et al., 2004), Form E of Jackson’s (1984) Personality Research Form,general achievement motivation subscale from the International Personality Item Pool (Goldberg, 1999),work mastery subscale from the Work and Family Orientation Questionnaire (Spence & Helmreich,1983). Representative item(s): see Benet-Martınez & John (1998)
Procrastination Definition: a general tendency to delay working on tasks and goals. Representative measure(s): GeneralProcrastination Scale (Lay, 1986). Representative item(s): “I generally delay before starting on work Ihave to do”
Openness Attributes: imaginative, insightful, intellectually curious, and openness to new experiences. Representativemeasure(s): see personality inventories listed for conscientiousness. Representative item(s): see Benet-Martınez & John (1998)
Neuroticism Attributes: anxious, depressed, inability to delay gratification, and increased vulnerability to stressors in theenvironment. Representative measure(s): Eysenck Personality Questionnaire (EPQ; Eysenck & Eysenck,1975), negative affect from the Positive and Negative Affect Schedule (PANAS; Watson et al., 1988);see too personality inventories listed for conscientiousness. Representative item(s): see Benet-Martınez &John (1998)
Agreeableness Attributes: trusting, empathetic, and compliant in social situations. Representative measure(s): seepersonality inventories listed for conscientiousness. Representative item(s): see Benet-Martınez & John(1998)
Extraversion Attributes: assertive, positive, and sociable. Representative measure(s): EPQ (Eysenck & Eysenck, 1975),positive affect from the PANAS (Watson et al., 1988); see too personality inventories listed forconscientiousness. Representative item(s): see Benet-Martınez & John (1998)
Need for cognition Definition: a general tendency to enjoy activities that involve effortful cognition. Representativemeasure(s): typical intellectual engagement (Goff & Ackerman, 1992), need for cognition (Cacioppo etal., 1984). Representative item(s): “I would prefer complex to simple problems”
Emotional intelligence Definition: capacity to accurately perceive emotion in self and others. Representative measure(s):Emotional Quotient Short Form (Bar-On, 2002), Toronto Alexithymia Scale (Bagby et al., 1994),Mayer–Salovey–Caruso Emotional Intelligence Test (Mayer et al., 2002). Representative item(s): seeSchutte et al. (1988)
Motivation factorsb
Locus of control Definition: perceived control over life events and outcomes. Representative measure(s): locus of control(Levenson, 1974), Rotter Internal–External Locus of Control Scale (Rotter, 1966). Representativeitem(s): see Rotter (1966)
Pessimistic attributional style Definition: perceived control over negative life events and outcomes. Representative measure(s): AcademicAttributional Style Questionnaire (Peterson & Barrett, 1987). Representative item(s): Students arepresented with 12 negative academic situations (e.g., “you fail a final exam”) and asked to identify andrate the cause on three dimensions: internal vs. external, stable vs. unstable, global vs. specific.Pessimistic attributional style is represented by internal, stable, and global ratings (higher scores).
Optimism Definition: general beliefs that good things will happen. Representative measure(s): Revised LifeOrientation Test (Scheier et al., 1994). Representative item(s): “In uncertain times, I usually expect thebest”
Academic self-efficacy Definition: general perceptions of academic capability. Representative measure(s): academic self-confidencesubscale from the Student Readiness Inventory (Le et al., 2005), academic control (Perry et al., 2001),academic self-concept (Reynolds et al., 1980). Representative item(s): “I have a great deal of controlover my academic performance in my courses”
Performance self-efficacy Definition: perceptions of academic performance capability. Representative measure(s): performancecapability (Shell & Husman, 2001). Representative item(s): “What is the highest GPA that you feelcompletely certain you can attain?”
Self-esteem Definition: general perceptions of self-worth. Representative measure(s): Rosenberg (1965), self-likingscale (Pinel et al., 2005). Representative item(s): “I feel that I have a number of good qualities”
Academic intrinsic motivation Definition: self-motivation for and enjoyment of academic learning and tasks. Representative measure(s):autonomous motivation (Sheldon & Elliot, 1998), academic intrinsic motivation (Vallerand &Bissonnette, 1992), task value subscale from the Motivation Strategies for Learning Questionnaire(MSLQ; Pintrich & DeGroot, 1990). Representative item(s): “Striving because of the fun and enjoymentwhich the goal provides you. While there may be many good reasons for the goal, the primary ‘reason’is simply your interest in the experience itself”
356 RICHARDSON, ABRAHAM, AND BOND

Table 2 (continued)
Construct Definition/attributes, representative measures, and representative items
Academic extrinsic motivation Definition: learning and involvement in academic tasks for instrumental reasons (e.g., to satisfy others’expectations). Representative measure(s): academic extrinsic motivation (Vallerand & Bissonnette, 1992),controlled motivation (Sheldon & Elliot, 1998). Representative item(s): “Striving because somebody elsewants you to or thinks that you ought to, or because you’ll get something from somebody if you do.That is, you probably wouldn’t strive for this if you didn’t get some kind of reward, praise or approvalfor it”
Learning goal orientation Definition: learning to develop new knowledge, mastery, and skills. Representative measure(s): Button etal. (1996); Elliot & Church (1997); Harackiewicz et al. (1997); Roedel et al. (1994); Vandewalle (1997);intrinsic learning subscale from the MSLQ (Pintrich & DeGroot, 1990). Representative item(s): “I wantto learn as much as possible in this class,” “In a class like this, I prefer course material that reallychallenges me so I can learn new things”
Performance goal orientation Definition: achievement striving to demonstrate competence relative to others. Representative measure(s):Button et al. (1996); Elliot & Church (1997); Harackiewicz et al. (1997); Roedel et al. (1994);Vandewalle (1997); extrinsic motivation subscale from the MSLQ (Pintrich & DeGroot, 1990).Representative item(s): “I want to do well in this class to show my ability to my family, friends,advisors, or others,” “I am motivated by the thought of outperforming my peers in this class”
Avoidance goal orientation Definition: avoidance of learning activities that may lead to demonstration of low ability and achievement.Representative measure(s): Button et al. (1996); Elliot & Church (1997); Harackiewicz et al. (1997);Roedel et al. (1994); Vandewalle (1997). Representative item(s): “My fear of performing poorly in thisclass is often what motivates me,” “I just want to avoid doing poorly in this class”
Grade goal Definition: self-assigned minimal goal standards (in this context, GPA). Representative measure(s): self-assigned goals (Locke & Latham, 1990), grade expectation (Lane & Gibbons, 2007). Representativeitem(s): “What is the minimum (i.e., the least you would be satisfied with) percentage grade goal for thenext test (on a scale of 0% to 100%)?”
Self-regulatory learning strategies
Test anxiety Definition: negative emotionality relating to test-taking situations. Representative measure(s): State–TraitAnxiety Inventory (Spielberger et al., 1970), test anxiety subscale from the MSLQ (Pintrich & DeGroot,1990), anxiety subscale from the Learning and Study Strategy Inventory (LASSI; Weinstein et al.,1987). Representative item(s): see http://www.hhpublishing.com/_assessments/LLO/scales.html andCrede & Phillips (2011)
Rehearsal Definition: learning through repetition. Representative measure(s): rehearsal subscale from the MSLQ(Pintrich & DeGroot, 1990). Representative item(s): see Crede & Phillips (2011)
Organization Definition: capacity to select key pieces of information during learning situations. Representativemeasure(s): selecting main ideas subscale from the LASSI (Weinstein et al., 1987), organization subscalefrom the MSLQ (Pintrich & DeGroot, 1990). Representative item(s): see http://www.hhpublishing.com/_assessments/LLO/scales.html and Crede & Phillips (2011)
Elaboration Definition: capacity to synthesize information across multiple sources. Representative measure(s):information processing subscale from the LASSI (Weinstein et al., 1987), elaboration subscale from theMSLQ (Pintrich & DeGroot, 1990). Representative item(s): see http://www.hhpublishing.com/_assessments/LLO/scales.html and Crede & Phillips (2011)
Critical thinking Definition: capacity to critically analyze learning material Representative measure(s): critical thinkingsubscale from the MSLQ (Pintrich & DeGroot, 1990). Representative item(s): see Crede & Phillips(2011)
Metacognition Definition: capacity to self-regulate comprehension of one’s own learning. Representative measure(s): self-testing subscale from the LASSI (Weinstein et al., 1987), metacognition subscale from the MSLQ(Pintrich & DeGroot, 1990). Representative item(s): see http://www.hhpublishing.com/_assessments/LLO/scales.html and Crede & Phillips (2011)
Effort regulation Definition: persistence and effort when faced with challenging academic situations. Representativemeasure(s): motivation subscale from the LASSI (Weinstein et al., 1987), work drive (Lounsbury &Gibson, 2002), effort regulation subscale from the MSLQ (Pintrich & DeGroot, 1990). Representativeitem(s): see http://www.hhpublishing.com/_assessments/LLO/scales.html and Crede & Phillips (2011)
Help seeking Definition: tendency to seek help from instructors and friends when experiencing academic difficulties.Representative measure(s): seeking help from teacher (Larose & Roy, 1995), assistance from peers(Larose & Roy, 2005), help seeking subscale from the MSLQ (Pintrich & DeGroot, 1990).Representative item(s): see Crede & Phillips (2011)
Peer learning Definition: tendency to work with other students in order to facilitate one’s learning. Representativemeasure(s): peer learning subscale from the MSLQ (Pintrich & DeGroot, 1990). Representative item(s):“I try to work with other students from this class to complete the course assignments”
Time/study management Definition: capacity to self-regulate study time and activities. Representative measure(s): time managementsubscale from the LASSI (Weinstein et al., 1987), time/study environmental management subscale fromthe MSLQ (Pintrich & DeGroot, 1990). Representative item(s): see http://www.hhpublishing.com/_assessments/LLO/scales.html and Crede & Phillips (2011)
(table continues)
357NON-INTELLECTIVE CORRELATES OF ACADEMIC PERFORMANCE

low in conscientiousness, they are less likely to persist with chal-lenging work.
Students high in openness are expected to be more imaginativeand willing to consider new ideas. These students may be betterable to manage new learning essential to academic achievement(e.g., Vermetten, Lodewijks, & Vermunt, 2001; Zeidner & Mat-thews, 2000). Students high in openness and in agreeableness maybe more likely to attend classes consistently (Lounsbury, Sund-strom, Loveland, & Gibson, 2003), and those high in agreeable-ness may also show greater levels of cooperation with instructors,which could facilitate the process of learning (Vermetten et al.,2001). By contrast, neuroticism is associated with higher anxiety(e.g., Watson & Clark, 1984) and test anxiety (Steel, Brothen, &Wambach, 2001), which can compromise performance on testsand examinations (Pekrun et al., 2004; Zeidner & Matthews,
2000), as well as reduce motivation (Watson, 2000). Chamorro-Premuzic and Furnham (2002) found that students high in neurot-icism were more likely to be absent from examinations due toillness and noted that it is possible that poorer attendance, moregenerally, may also undermine academic performance among stu-dents high in neuroticism.
Extraversion implies greater sociability and activity levels. Stu-dents with extravert tendencies might be expected to achieve lowergrades because they are more distracted and more sociable thanstudents with introvert tendencies, who are likely to spend more oftheir time learning and consolidating knowledge (Rolfhus & Ack-erman, 1999). Thus, extraversion may limit students’ capacity toregulate their effort devoted to academic tasks (Bidjerano & Dai,2007). Moreover, extraverts have been found to reach cognitivedecisions prematurely (Matthews, 1997), which may curtail sys-
Table 2 (continued)
Construct Definition/attributes, representative measures, and representative items
Concentration Definition: capacity to remain attentive and task focused during academic tasks. Representative measure(s):quality of attention (Larose & Roy, 1995), concentration subscale from the LASSI (Weinstein et al.,1987). Representative item(s): see http://www.hhpublishing.com/_assessments/LLO/scales.html
Student approaches to learning
Deep approach to learning Definition: combination of deep information processing and a self (intrinsic) motivation to learn.Representative measure(s): Approaches to Studying Inventory (Entwistle & Ramsden, 1983), StudyProcess Questionnaire (Biggs, 1987). Representative item(s): see Fox et al. (2001)
Surface approach to learning Definition: combination of shallow information processing and an extrinsic motivation to learn.Representative measure(s): see measures listed for deep approach to learning. Representative item(s): seeFox et al. (2001)
Strategic approach to learning Definition: task-dependent usage of deep and surface learning strategies combined with a motivation forachievement. Representative measure(s): See measures listed for deep approach to learning.Representative item(s): see Fox et al. (2001)
Psychosocial contextual influences
Social integration Definition: perceived social integration and ability to relate to other students. Representative measure(s):interaction with peers (Roberts & Clifton, 1992), social integration (Baker & Siryk, 1984; Cabrera et al.,1993), social activity (Le et al., 2005). Representative item(s): “I find it easy to get to know otherpeople”
Academic integration Definition: perceived support from professors. Representative measure(s): interaction with professors(Roberts & Clifton, 1992), academic integration (Mannan, 2001). Representative item(s): “Professorstake a personal interest in helping me with my work”
Institutional integration Definition: commitment to the institution. Representative measure(s): academic integration (Pascarella &Terenzini, 1979), social connection (Le et al., 2005), institutional commitment (Baker & Siryk, 1984),College Adaptation Questionnaire (Crombag, 1968). Representative item(s): “I am confident that I madethe right decision in choosing to attend this university”
Goal commitment Definition: commitment to staying at university and obtaining a degree. Representative measure(s): CollegeStudent Inventory (Noel & Levitz, 1993), commitment to college (Le et al., 2005). Representativeitem(s): see Allen (1999) & Le et al. (2005)
Social support Definition: availability of social support from family members and/or significant others. Representativemeasure(s): availability of strong support person (Tracey & Sedlacek, 1984). Representative item(s): “IfI run into problems concerning school, I have someone who would listen to me and help me”
Stress (in general) Definition: overwhelming negative emotionality resulting from general life stressors. Representativemeasure(s): perceived stress scale (Cohen et al., 1983). Representative item(s): “In the past month, howoften have you felt that difficulties were piling up so high that you could not overcome them?”
Academic stress Definition: overwhelming negative emotionality resulting from academic stressors. Representativemeasure(s): intensity scale (Maslach & Jackson, 1981), perceived stress (Cabrera, 1988). Representativeitem(s): see Jaramillo & Spector (2004)
Depression Definition: low mood, pessimism, and apathy experienced over an extended length of time. Representativemeasure(s): Beck Depression Inventory (Beck et al., 1961). Representative item(s): see Beck et al.(1961)
a The self-control, independence, anxiety, extraversion, and tough mindedness traits from the 16PF were coded as conscientious, agreeableness, neuroticism,extraversion, and openness, respectively. b Consistent with Payne et al. (2007), when a two-dimensional measure of goal orientation was reported (e.g.,Button et al., 1996) the correlations involving performance goal orientation were coded as performance approach goal orientation.
358 RICHARDSON, ABRAHAM, AND BOND

tematic consideration and checking required by many academictasks.
Traits not easily encompassed by the five-factor model havebeen found to predict academic performance, in particular, needfor cognition (Cacioppo, Petty, & Kao, 1984) and emotional in-telligence (Mayer, Salovey, & Caruso, 2002). Higher need forcognition reflects greater intrinsic motivation to engage in effortfulcognitive processing, with higher scores linked to better academicoutcomes. The nomological network (Cronbach & Meehl, 1955) ofneed for cognition has not been specified, but this construct, whichoriginated in research into processes underpinning message accep-tance and persuasion, has many potential links. It is positivelyassociated with fluid intelligence, openness, low neuroticism, andgoal orientation (Fleischhauer et al., 2010) and may also be relatedto self-regulatory learning strategies including use of metacogni-tion, elaboration, and deep learning. Emotional intelligence hasbeen assessed in terms of abilities to perceive emotions accurately,understand emotion, and use emotion to facilitate thinking (Mayeret al., 2002). Emotional intelligence has also been assessed interms of happiness, stress tolerance, and self-regard (Bar-On,1997; Schutte et al., 1998). Both measures have been assessedalongside GPA; consequently, we treat emotional intelligence as aconstellation of emotional capacities and tendencies implyinggreater capacity to maintain positive emotion and interpret emo-tions in a manner that may facilitate learning and academic per-formance.
In all, we have identified eight distinct personality measures thatmay be associated with GPA. These are conscientiousness, open-ness, agreeableness, neuroticism, extraversion (the Big Five fac-tors), along with need for cognition, emotional intelligence, andprocrastination (which is closely related to conscientiousness).
Motivation Factors
Personality may affect achievement through motivation and, ofcourse, motivation may be measured directly (Phillips, Abraham,& Bond, 2003). There are many different theories of motivation(for a review, see Eccles & Wigfield, 2002), but only a limitednumber of motivational constructs has been repeatedly examinedin relation to GPA. We consider these in three groups: (a) attri-butions, optimism, pessimism, expectancies, and perceived con-trol; (b) sources of motivation; and (c) goal types.
Attributions, optimism, pessimism, expectancies, and per-ceived control. Attributions refer to the way people explaincausation (Heider, 1958; Weiner, 1986) and particularly, in thiscontext, students’ explanations of past academic failures. Somestudents tend to explain poor grades in terms of their own (inter-nal) failings, such as lack of effort and ability. Others tend toidentify external causes, such as bad luck or insufficient teaching.Consequently, we can assess students’ tendencies to make internalversus external attributions. Such tendencies are referred to aslocus of control (Rotter, 1966). In addition, attributions may differin their stability and globality. A pessimistic attribution style(Peterson, Vaillant, & Seligman, 1988) is characterized by inter-nal, stable (unchanging), and global (cross-situational) attributionsfor past failures (e.g., “I am stupid”). In contrast, optimistic stu-dents are likely to make external, unstable, and specific attribu-tions for past failures (e.g., “The examiner did not understand my
work”), and internal, stable, global attributions for past successes(e.g., “I am capable and smart”).
Outcome expectancies refer to perceptions of the associationbetween behavior and outcome (e.g., “My studying hard will leadto good grades”). Optimistic attributions are associated with morepositive outcome expectancies and stronger motivation (Abram-son, Metalsky, & Alloy, 1989). Outcome expectancies can bedistinguished from efficacy expectancies that refer to beliefs aboutpersonal capabilities (Bandura, 1997). This distinction is importantbecause some students may believe that effort leads to good gradesbut see themselves as lacking the skills necessary to mobilize sucheffort. Others may believe in their capacity for effortful study butbe uncertain whether such effort will lead to enhanced achieve-ment.
Students who believe that they have the skills and abilities tosucceed at academic tasks perform better than those with lowerefficacy expectancies (Bandura, 1997). Efficacy expectations forany particular performance depend on students’ experience withsimilar challenges. When challenges are familiar, students candraw upon past experiences to formulate expectations about spe-cific performances. This has been referred to as performanceself-efficacy. However, when challenges are unfamiliar, perfor-mance must be anticipated on the basis of more generalizedrepresentations of relevant competencies. This is referred to asacademic self-efficacy (Zimmerman, Bandura, & Martinez-Pons,1992).
Efficacy expectations refer to perceptions of personal capacitiesto perform. In contrast, self-esteem refers to the person’s self-worth. One may have low performance self-efficacy and still havehigh overall self-worth. Consequently, self-esteem can be regardedas a trait-like construct. However, following Eccles and Wigfield,(2002), we have categorized academic self-esteem as a motiva-tional construct because of its close links to academic attributionsand the evaluation of academic success among students. Accordingto self-worth theory (Covington, 1998), academic ability is a core,universal component of self-worth that individuals are motivatedto maintain. For example, attributing failure to a lack of effortprotects academic self-esteem but may also lead to a reduction ineffort owing to fear of failure. Moreover, as a result of suchattributional tendencies, students may differ in how much theyvalue academic achievement (Harter, 1998), and constructing amore positive academic self-concept is associated with enhancedachievement (Hattie, 1993).
Sources of motivation. Rather than characterizing how mo-tivated people are, self-determination theory (Ryan & Deci, 2000)distinguishes between sources of motivation, or reasons for taskengagement. The theory proposes that task engagement results insatisfaction of basic psychological needs, namely, autonomy, com-petence, and relatedness. Activities undertaken for pleasure inher-ent to the task (intrinsic motivation) are associated with optimalself-regulation involving autonomy and efficiency, whereas tasksengaged in for instrumental reasons, such as the offer of a rewardor avoidance of a punishment (extrinsic motivation), are linked tocontrolled motivation and volitional difficulties (deCharms, 1968).Self-determination theory proposes that intrinsic motivation isachieved and maintained through stimulating and challenging taskengagement in which the actor feels competent and autonomous.Such intrinsic motivation facilitates optimal learning, whereasextrinsic motivation may stifle motivation and performance.
359NON-INTELLECTIVE CORRELATES OF ACADEMIC PERFORMANCE

Goal types. The type of goal students pursue during academicstudy can affect their source and degree of motivation and, sub-sequently, their performance. It has been suggested, for example,that students’ motivation may be improved by focusing on effortand self-improvement (which are intrinsically motivated goals)rather than on achievement and competition (which are extrinsi-cally motivated goals; Covington, 1992). It is possible, therefore,to distinguish between students who are primarily oriented towardlearning goals and those who are most focused on performancegoals. Performance goals may be inherently extrinsically moti-vated but can have differing effects on performance depending onwhether they are performance approach goals, focused on antici-pation of positive achievement, or performance avoidance goals,directed toward escaping from anticipated failure or negative eval-uation (Elliot & Harackiewicz, 1996). Performance avoidancegoals have been found to be associated with reduced motivationand achievement (Elliot & Church, 1997), whereas performanceapproach goals may enhance academic motivation and evaluationof academic competence (Harackiewicz, Barron, Pintrich, Elliot,& Thrash, 2002). We distinguish between learning goal orienta-tion, performance goal orientation (referring to performance ap-proach goals), and performance avoidance goal orientation.
Goal theories (e.g., Locke & Latham, 1990) suggest that per-formance feedback is central to goal setting and goal striving. In anacademic context, performance feedback usually consists of gradesawarded for exams and assignments (Wood & Locke, 1987).Performance self-efficacy and grade expectancies are expected tostabilize as performance feedback is accumulated (Bandura, 1997;Lent & Brown, 2006) and, consequently, to be most stronglypredictive of GPA among experienced students (Pajares & Miller,1995). In this context we can define a grade goal (e.g., “I want toget 65% on this test”) as a specific performance goal based onprior feedback.
Overall, we have identified 12 distinct but closely related mo-tivational constructs that may be correlated with GPA: locus ofcontrol, pessimistic attributional style, optimism, performanceself-efficacy, academic self-efficacy, self-esteem, academic intrin-sic motivation, academic extrinsic motivation, learning goal ori-entation, performance goal orientation, performance avoidancegoal orientation, and grade goal.
Self-Regulatory Learning Strategies
Students regulate their cognitions, emotions, motivation behav-iors, and environment (Boekaerts & Corno, 2005). The motiva-tional factors we have considered do not encompass differencesbetween students in their typical use of self-regulatory learningstrategies. Yet the extent to which students employ such strategiesmay mediate (and moderate) the effects of dispositional charac-teristics (e.g., intellectual capacity and personality) and psychos-ocial contextual influences on academic performance.
Theorists have distinguished between motivation and volition,with motivation culminating in the formation of goals or behav-ioral intentions and volition guiding the translation of goals intoactions (Kuhl, 2000). According to Gollwitzer’s (1990) “rubicon”model, decisions about why one should act and where one shouldinvest effort are part of the goal-setting process that precedes goalcommitment. Once a goal has been formulated, goal strivingbegins. In this phase, regulatory processes focus on how to best
implement effort (Boekaerts & Corno, 2005). Students’ use ofdistinct self-regulatory strategies may render such post-motivational goal striving more or less effective, thereby predict-ing performance. Thus, assessment of self-regulatory strategiesmay facilitate greater accuracy in predicting academic perfor-mance (for reviews, see Pintrich, 2004; Wolters et al., 2003).
Pintrich’s (2004) model of self-regulated learning comprises themost comprehensive set of constructs assessing learning-related,self-regulatory strategies. Four areas of self-regulated learning areassessed: motivation/affect, cognition, behavior, and context. Thismodel has been assessed with the Motivated Strategies for Learn-ing Questionnaire (MSLQ). This multimeasure assessment toolincludes constructs discussed above but uses different labels todescribe some of these constructs. In particular, the MSLQ con-structs of intrinsic goals, extrinsic goals, task value, and self-efficacy map onto what we refer to as (a) learning goal orientation,(b) performance approach goal, (c) academic intrinsic motivation,and (d) academic self-efficacy, respectively.
The MSLQ also assesses test anxiety. This construct can beviewed as a trait related to neuroticism but can also be conceptu-alized as indicative of a specific form of affect control. Adoptingthe latter view, we grouped this construct with other self-regulatory capacities. In addition, the MSLQ measures control oflearning beliefs, but this construct has only rarely been included instudies assessing GPA and was, therefore, omitted from our anal-yses.
Cognitive strategies assessed by the MSLQ include rehearsal,elaboration, organization, and critical thinking, as well as moregeneral measures of metacognitive self-regulation (Pintrich, 2004).Rehearsal strategies include “shallow” learning techniques such asrote learning, which is learning through repetition, whereas orga-nization (e.g., note taking and organizing points meaningfully),elaboration (e.g., summarizing material using one’s own words),and critical thinking (e.g., questioning the validity of key texts andmaterials) reflect increasingly “deeper” learning strategies that areproposed to facilitate learning and achievement. Metacognitionrefers to a cluster of self-regulatory techniques utilized duringlearning (Wolters et al., 2003). These include planning (e.g.,setting learning goals), self-monitoring (e.g., of comprehension),and flexibility (e.g., selection and implementation of task-appropriate learning strategies).
Assessment of behavioral self-regulatory capacities (Pintrich,2004) includes a measure of effort regulation that encompassesself-management of motivation or persistence when challenged bydifficult work. Effort regulation is related to conscientiousness andacademic self-efficacy. Achievement motivation and effort regu-lation are closely related constructs and illustrate how differentlabels may be used for similar predictors of scholastic performancein different research domains, in this case, studies of personalitytraits versus self-regulatory capacities. Pintrich (2000) also iden-tified help seeking as a behavioral strategy encompassing “otherregulation” (i.e., the actions of teachers and peers; Ryan & Pin-trich, 1997; Wolters et al., 2003). Finally, the MSLQ includesmeasures of the regulation of the learning contexts (Pintrich, 2004)including a measure of peer learning, which involves talking topeers about their learning, whereas time/study management as-sesses use of study plans and the regulation of the learning envi-ronment (e.g., turning off the television while studying). Use of theMSLQ illustrates multimeasure research into the importance of
360 RICHARDSON, ABRAHAM, AND BOND
volitional control of action to students’ performance (Corno, 1989,1993; Kuhl, 2000; Wolters et al., 2003), but it is unclear whetherthis inventory is comprehensive or optimal in its selection ofpredictors.
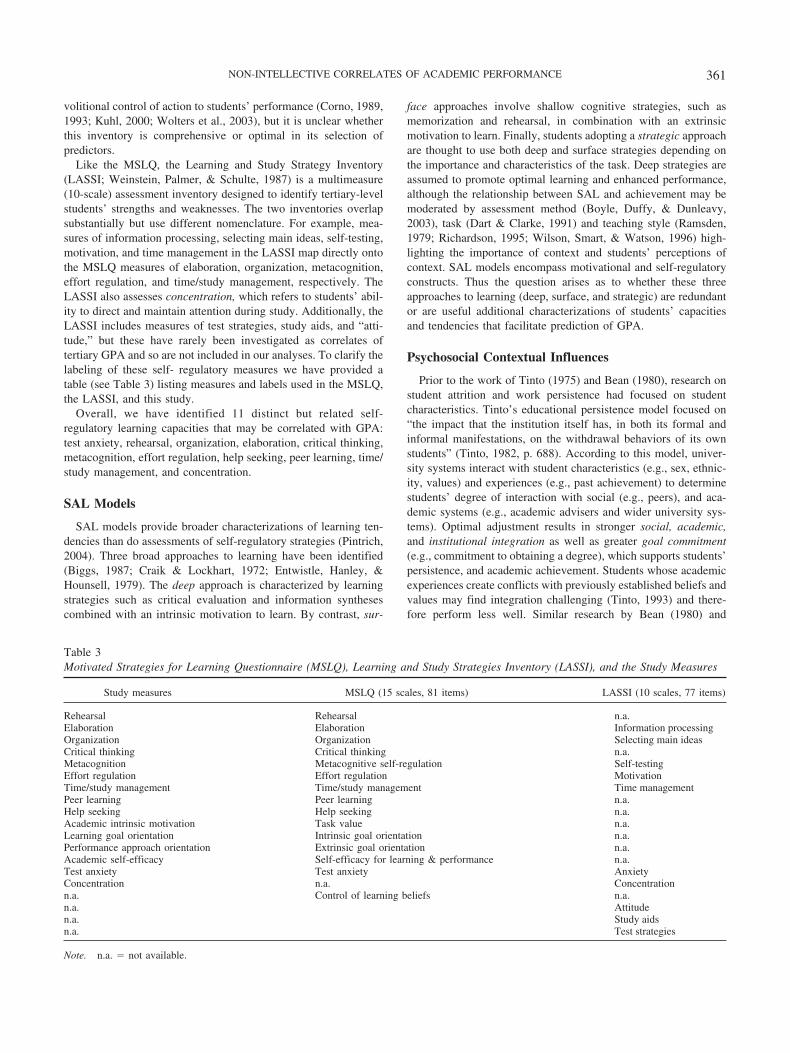
Like the MSLQ, the Learning and Study Strategy Inventory(LASSI; Weinstein, Palmer, & Schulte, 1987) is a multimeasure(10-scale) assessment inventory designed to identify tertiary-levelstudents’ strengths and weaknesses. The two inventories overlapsubstantially but use different nomenclature. For example, mea-sures of information processing, selecting main ideas, self-testing,motivation, and time management in the LASSI map directly ontothe MSLQ measures of elaboration, organization, metacognition,effort regulation, and time/study management, respectively. TheLASSI also assesses concentration, which refers to students’ abil-ity to direct and maintain attention during study. Additionally, theLASSI includes measures of test strategies, study aids, and “atti-tude,” but these have rarely been investigated as correlates oftertiary GPA and so are not included in our analyses. To clarify thelabeling of these self- regulatory measures we have provided atable (see Table 3) listing measures and labels used in the MSLQ,the LASSI, and this study.
Overall, we have identified 11 distinct but related self-regulatory learning capacities that may be correlated with GPA:test anxiety, rehearsal, organization, elaboration, critical thinking,metacognition, effort regulation, help seeking, peer learning, time/study management, and concentration.
SAL Models
SAL models provide broader characterizations of learning ten-dencies than do assessments of self-regulatory strategies (Pintrich,2004). Three broad approaches to learning have been identified(Biggs, 1987; Craik & Lockhart, 1972; Entwistle, Hanley, &Hounsell, 1979). The deep approach is characterized by learningstrategies such as critical evaluation and information synthesescombined with an intrinsic motivation to learn. By contrast, sur-
face approaches involve shallow cognitive strategies, such asmemorization and rehearsal, in combination with an extrinsicmotivation to learn. Finally, students adopting a strategic approachare thought to use both deep and surface strategies depending onthe importance and characteristics of the task. Deep strategies areassumed to promote optimal learning and enhanced performance,although the relationship between SAL and achievement may bemoderated by assessment method (Boyle, Duffy, & Dunleavy,2003), task (Dart & Clarke, 1991) and teaching style (Ramsden,1979; Richardson, 1995; Wilson, Smart, & Watson, 1996) high-lighting the importance of context and students’ perceptions ofcontext. SAL models encompass motivational and self-regulatoryconstructs. Thus the question arises as to whether these threeapproaches to learning (deep, surface, and strategic) are redundantor are useful additional characterizations of students’ capacitiesand tendencies that facilitate prediction of GPA.
Psychosocial Contextual Influences
Prior to the work of Tinto (1975) and Bean (1980), research onstudent attrition and work persistence had focused on studentcharacteristics. Tinto’s educational persistence model focused on“the impact that the institution itself has, in both its formal andinformal manifestations, on the withdrawal behaviors of its ownstudents” (Tinto, 1982, p. 688). According to this model, univer-sity systems interact with student characteristics (e.g., sex, ethnic-ity, values) and experiences (e.g., past achievement) to determinestudents’ degree of interaction with social (e.g., peers), and aca-demic systems (e.g., academic advisers and wider university sys-tems). Optimal adjustment results in stronger social, academic,and institutional integration as well as greater goal commitment(e.g., commitment to obtaining a degree), which supports students’persistence, and academic achievement. Students whose academicexperiences create conflicts with previously established beliefs andvalues may find integration challenging (Tinto, 1993) and there-fore perform less well. Similar research by Bean (1980) and
Table 3Motivated Strategies for Learning Questionnaire (MSLQ), Learning and Study Strategies Inventory (LASSI), and the Study Measures
Study measures MSLQ (15 scales, 81 items) LASSI (10 scales, 77 items)
Rehearsal Rehearsal n.a.Elaboration Elaboration Information processingOrganization Organization Selecting main ideasCritical thinking Critical thinking n.a.Metacognition Metacognitive self-regulation Self-testingEffort regulation Effort regulation MotivationTime/study management Time/study management Time managementPeer learning Peer learning n.a.Help seeking Help seeking n.a.Academic intrinsic motivation Task value n.a.Learning goal orientation Intrinsic goal orientation n.a.Performance approach orientation Extrinsic goal orientation n.a.Academic self-efficacy Self-efficacy for learning & performance n.a.Test anxiety Test anxiety AnxietyConcentration n.a. Concentrationn.a. Control of learning beliefs n.a.n.a. Attituden.a. Study aidsn.a. Test strategies
Note. n.a. � not available.
361NON-INTELLECTIVE CORRELATES OF ACADEMIC PERFORMANCE
colleagues (Bean & Metzner, 1985; Elkins, Braxton, & James,2000; Metzner & Bean, 1987; Stoecker, Pascarella, & Wolfle,1988) highlighted external influences on integration, such as fam-ily support, finances, and hours of paid employment. These con-textual influences are thought to shape students’ responses touniversity life, including affective responses such as stress anddepression, in addition to goal commitment and value assessmentsthat in turn, affect integration and academic performance.
We have identified eight psychosocial contextual influences. Theseinclude three aspects of organizational integration: social, academic,and institutional integration plus five other factors: goal commitment,social support, general stress, academic stress, and depression.
Demographic Correlates of GPA: Age, Sex, andSocioeconomic Status
Population demographics and political positions on higher educa-tion have changed over time in the United States and Europe, resultingin more diverse student populations. It is important, therefore, toexplore the role of demographic influences on academic achievement.Recent trends show that, on average, students from higher socioeco-nomic backgrounds and women attain higher GPAs than do theirrespective counterparts (e.g., Dennis, Phinney, & Chuateco, 2005;LaForge & Cantrell, 2003; Robbins et al., 2004; Smith & Naylor2001). Higher socioeconomic status may facilitate effective academicand social adaption to university settings; however, questions remainabout the gender gap in performance with course selection, assess-ment methods, and psychological characteristics identified as possibleinfluences. Older students are also expected to adapt better to univer-sity situations (Clifton, Perry, Roberts, & Peter, 2008) but mixedfindings are reported. Some studies have shown that older studentsachieve higher GPAs (Clifton et al., 2008; Etcheverry, Clifton, &Roberts, 2001), whereas others have failed to observe this association(Farsides & Woodfield, 2007; Ting & Robinson, 1998). Conse-quently, we included age, sex, and socioeconomic status in ouranalyses.
Which Correlates of GPA Are Most Important?
Previous reviews have considered predictors of undergraduateGPA drawing upon subsets of the literature we have considered.The most comprehensive study, by Robbins et al. (2004), revieweda range of motivational, skill, and contextual factors. They foundthat achievement motivation, here referred to as effort regulation(Pintrich, 2004), and academic self-efficacy were the best predic-tors of GPA and that women students and those from highersocioeconomic status backgrounds attained high GPA scores.
In a meta-analysis of relationships between five-factor person-ality traits and GPA, O’Connor and Paunonen (2007) reported asmall to medium effect size for conscientiousness and very smalleffects for extraversion, neuroticism, openness, and agreeableness.This pattern was largely confirmed in a comprehensive Five-Factor meta-analysis by Poropat (2009), who also found supportfor a predictive role for conscientiousness over and above that ofintelligence. Similarly, a review by Steel (2007) found that pro-crastination was moderately and negatively associated with GPA.Measures of need for cognition and emotional intelligence havealso been shown to have small effects on GPA (Cacioppo & Petty,1982; Parker, Duffy, Wood, Bond, & Hogan, 2005).
Evidence for other academic goals and GPA is less clear. Areview by Payne, Youngcourt, and Beaubien (2007) found a verysmall negative relation between performance avoidance goals andGPA and little evidence of a relation between performance ap-proach goals and GPA. Yet, in a similar review, Linnenbrink-Garcia, Tyson, and Patall (2008) found evidence of small positiverelationships between GPA and both performance approach goalsand learning goals. Still, Pekrun, Elliot, and Maier (2009) con-cluded that the effect of learning goals is weak and may disappearwith control of the effects of other academic goals.
The Present Study
Our review identified five traditional correlates of tertiary GPA(intelligence, SAT, ACT, high school GPA, and A level points)and three demographic factors (sex, age, and socioeconomic sta-tus). In addition, we identified 42 non-intellective constructs thathave been identified as potentially useful correlates of tertiaryGPA. We grouped these into five conceptually overlapping re-search areas: personality traits (8 constructs), motivational factors(12 constructs), self-regulatory learning strategies (11 constructs),students’ approaches to learning (3 constructs), and psychosocialcontextual influences (8 constructs; see Table 1). As the directionof an effect cannot be reliably inferred from cross-sectional mea-surement, study design was explored as a moderator (i.e., prospec-tive design measuring the predictor prior to the assessment of GPAvs. cross-sectional association at the same point in time).
This diverse literature raises a series of questions answerable byquantitative analysis: (a) how strong are the univariate associationsbetween these diverse constructs and GPA? (b) are observedcorrelations moderated by cross-sectional versus prospective studydesigns? (c) which constructs are most important within the fiveresearch domains we have identified? (d) do non-intellective con-structs explain additional variance in GPA controlling for tradi-tional correlates (as defined above)? and (e) can we construct acomprehensive but parsimonious model of factors that moststrongly influence university students’ academic attainment?
Method
Searches and Inclusion Criteria
We undertook a systematic search in stages to locate primaryarticles. Search terms contained adjectives or derivatives of deter-minants, academic achievement, and undergraduate student thatwere combined with a series of Boolean and/or operators andasterisk wildcards (see Table 4). These combinations were used tosearch PsycINFO and the Web of Knowledge databases between1997 and 2010. Only English language journals were considered;studies conducted outside Europe or North America were excludedbecause so few studies were located. This search yielded in total7,167 records that were exported into a reference citation managerwhere titles and abstracts were screened for relevance.
At Stage 2, studies were included if they reported an associationbetween a measure of GPA and a measure of at least one non-intellective construct listed in Table 2. At Stage 3, ancestry(searching the references of included articles) and descendancy(searching articles citing included articles using Web of Knowl-edge) searches were conducted to locate further primary articles of
362 RICHARDSON, ABRAHAM, AND BOND

potential relevance. These were then screened using the Stage 2inclusion criterion. This process continued cyclically until no newarticles emerged. More than 400 papers were read. However,relevant data were not obtainable for many. After duplicate datasets were excluded, this process generated 217 papers that con-tained 241 unique data sets (55 in Europe and 186 in NorthAmerica).
The effect size r was used to represent the direction and strengthof associations between GPA and its correlates because it is themost common effect size measure used in studies of academicperformance. GPA measures included students’ overall degreemarks, quarter, semester, course, or test marks. We also recordeddemographic constructs (age, sex, and socioeconomic status) andintellective constructs (SAT, ACT, A level points, high schoolGPA, and general intelligence) when these were reported. Wheredata were missing, study authors were contacted; if they did notrespond, we used available statistics, such as t, F, or �2 values, toderive r wherever possible (for formulas, see, e.g., Hunter &Schmidt, 1990). Papers from which data were extracted aremarked with an asterisk in the reference section.
Measures and Data Extraction
Measures of cumulative GPA over semesters or years (GPAcum)provide the most reliable proxy of undergraduate achievement,whereas measures of GPA over a shorter time span (e.g., a singlecourse or test situation; GPAcourse) contain less information. Toobtain a reliability coefficient for GPAcourse, we meta-analysed rsbetween GPAcum and GPAcourse. Results showed a true scorecorrelation of .59 (k � 9, N � 1,581) for GPAcum/GPAcourse
combinations. Consequently, we assigned a reliability coefficientof 1 to measures of GPAcum and a coefficient of .6 to measures ofGPAcourse.
Table 2 shows representative measures and items used to assessthe 42 non-intellective constructs considered in this study. Wherestandardized measures were not used, data were coded only ifillustrated items or clear definitions that corresponded to the def-initions listed in Table 2 were provided. In combination with thedemographic (age, sex, and socioeconomic status) and traditionalconstructs (SAT, ACT, high school GPA, and intelligence), weconsidered 50 constructs. Measures of socioeconomic status typ-ically assessed income and educational levels (e.g., Robbins, Al-len, Casillas, Peterson, & Le, 2006), whereas intelligence was
measured with validated assessment instruments such as the re-vised Wechsler Adult Intelligence Scale (Wechsler, 1981).
We coded the following data from each primary article wherepresent:
1. Full reference details
2. Study location (Europe/North America)
3. GPA type (GPAcum/GPAcourse)
4. Constructs
5. Internal reliability of constructs
6. Correlation type
7. Correlation effect size and direction
8. Effect size N
9. Study design (prospective/cross-sectional/mixed/notknown)
Correlations were reverse scored where necessary, so that higherscores represented higher levels of the defined construct. Weextracted prospective data when possible and identify them withthe abbreviation pro; we identify concurrent data as cs (cross-sectional). For some correlations the data were a mixture of cross-sectional and prospective data (e.g., where cumulative GPA was acombination of future and past behavior), identified as mixed. Inother studies it was not possible to determine the design from thereport. In these cases the data are identified as notk (not known).We collated information on study design for non-intellective fac-tors only, given that traditional correlates and demographic infor-mation were generally retrospective rather than self-reported inreal time. Measures of intelligence constitute an exception, but it iswell known that test scores are fairly stable over time (Jones &Bayley, 1941).
Following Hunter and Schmidt’s (2004) recommendations,no more than two conceptually equivalent construct/GPA com-binations from any one study entered the analysis. When threeor more measures of GPA criterion and/or conceptually equiv-alent constructs were reported, we combined data to create acomposite. Where multiple measures of GPA were not inde-pendent, only the most reliable measure of GPA (i.e., GPAcum)was extracted. In such instances, composite correlations werecalculated where possible, using Hunter and Schmidt’s (2004)formula; otherwise, correlations were averaged. The sample Nwas reported in all cases (Hunter & Schmidt, 2004). Whenpsychological composites were calculated we used theSpearman–Brown formula (see Hunter & Schmidt, 2004) tocalculate corresponding internal reliabilities; we also averagedthe reliabilities of averaged correlations. All remaining corre-lations were either bivariate rs as reported in the original sourceor data that were transformed into a correlation coefficient frominformation contained in the report. We recorded correspondingalpha reliability coefficients wherever possible. When reliabil-ity estimates were not provided, such information was obtainedfrom the inventories’ manuals and/or previous articles that had
Table 4Search Terms Used in the Meta-Analysis
The following search terms were used:“undergraduate student”
(Freshman or undergraduate� or sophomore�) or (junior student�) or(senior student�) or (upper division student�) or (universitystudent�)
“academic achievement”(GPA or GPAs or grade or grades or mark or marks) or (academic
outcome�) or (grade point average�) or (academic achievement�) or(academic performance�) or (associate� degree�) or (collegeperform�) or (college achievement�)
“determinants”(determin� or factor or factors or variabl� or parameter� or reason� or
caus� or correlat� or antecedent� or predictor or predictors)
363NON-INTELLECTIVE CORRELATES OF ACADEMIC PERFORMANCE

reported the reliability of corresponding scales. The reliabilityof traditional intellective variables (SAT, ACT, A level points,high school GPA, and intelligence) was assumed to be 1 unlessinformation contained in the report stated otherwise.
Interrater Reliability
Prior to analysis, 54 (22%) distinct data sets were selected atrandom and coded by two independent, doctoral psychology stu-dents according to the construct definitions provided in Table 2.Constructs were identified as being present or absent for each dataset, resulting in 54 kappa scores. Perfect agreement is indicated bya score of 1.0. Observed scores ranged from .62–1.0, with 47/54(87%) recorded as 1.0.
Analytic Strategy
We tested hypotheses in three analytic steps. First, meta-analyses were conducted to generate average weighted correlations(r�) between GPA and each other separate construct. Second, weconducted moderator analyses using study design (prospective vs.cross-sectional) where sufficient data were available. Third, weconducted a series of regression analyses to test which particularconstructs (for which data were available) were the best predictorsof GPA. GPA was regressed onto all relevant constructs withineach of the five non-intellective domains. We also conductedregression analyses to explore which of the best predictors of GPA(for which data were available) explained variation over and abovethe traditional assessment methods already used in practice. Col-leges in North America typically use either the SAT or the ACT,so these were treated as a single construct in the regression modelsalongside high school GPA. A further regression model examineda cross-domain integrative model of academic performance thatincluded the most significant measures of GPA.
Meta-Analyses
Meta-analyses were conducted with a random effects model,because accumulated evidence suggested heterogeneity in effectsizes (National Research Council, 1992) and we wished to drawinferences beyond the particular set of studies included in theanalysis (Borenstein, Hedges, Higgins, & Rothstein, 2010; Hedges& Vevea, 1998). Following Hedges and Olkin (1985), we con-ducted analyses on correlations transformed into Fisher’s z; wethen back-transformed results, such as means and the limits ofconfidence intervals, so that they could be expressed in terms of r.I2 and Q statistics were calculated to assess the residual variance.Cochran’s (1954) Q statistic reflects the total amount of variancein the meta-analysis, whereas Higgins and Thompson’s (2002) I2
value indexes the proportion of variance due to between-studydifferences. Unlike the Q statistic, it is not sensitive to the numberof associations considered. A statistically significant Q statisticindicates substantial heterogeneity, whereas I2 values range from 0to 100%. It has been suggested that values of 25%, 50%, and 75%indicate low, moderate, and high heterogeneity, respectively (Hig-gins, Thompson, Deeks, & Altman, 2003). In addition, rho corre-lations were calculated in which observed correlations were cor-rected for reliability in both the GPA criterion and the predictorvariable, with data analyzed with the Hunter and Schmidt (2004)
approach. We also calculated credibility intervals of 80% aroundthe mean rho correlations (Hunter & Schmidt, 2004) to assess thevalidity of generalizing from calculated mean effects.
Our analyses were inspected after the removal of outliers andinfluential cases to identify when our conclusions would besubstantially altered by their omission. Following Viechtbauerand Cheung (2010), we drew on three indices: studentizeddeleted residuals; DFFITS, and Cook’s distance. Viechtbauerand Cheung provided some rules of thumb for instances inwhich the effect of possible outliers or influential cases mayrequire further scrutiny. For the studentized deleted residuals,they suggested that finding more than k/10 residuals greaterthan �1.96 would be unusual. For the DFFITSi measure, Viech-tbauer (2011) suggested that, for a random effects model, avalue greater than 3�1/�k–1), where k is the number of effects,requires closer inspection. For the Cook’s distance measure, hesuggested inspecting cases where the resulting value exceedsthe value of �2, df � 1, that cuts off 0.5 in the lower tail area.We have used all three criteria in evaluating the effect ofoutlying studies on our results.
Publication of statistically significant results is more probable(e.g., Greenwald, 1975), increasing the likelihood of Type I errorsand an overestimation of the mean effect size in meta-analysis. Toexamine this potential bias, we applied Duval and Tweedie’s(2000) “trim-and-fill” procedure, which first estimates the numberof studies that may be missing due to publication bias. Missingstudies are subsequently imputed and the effect size recalculated.For all analyses, we used the package Metafor in R (Viechtbauer,2010), Field and Gillett’s (2010) macros, and Cheung’s (2009)LISREL syntax generator.
Results
Data Description
In total, 1,105 independent correlations were analyzed (911relating to non-intellective constructs, 59 to demographics, and135 to traditional constructs; i.e., SAT, ACT, high school GPA, Alevel points, and intelligence). Of these, 768 and 337 were corre-lations with measures of GPAcum and GPAcourse, respectively. Ofthe non-intellective associations, 400 were prospective, 228 werecross-sectional, and 108 were of mixed design. We could notdetermine the design of 175 additional correlations. Table 5 detailsthe design and GPA criterion information for each construct sep-arately.
Meta-analyses of the following constructs were based on five orfewer independent correlations: U.K. A level points, need forcognition, performance self-efficacy, peer learning, and academic-related stress (Ns ranged from 933 to 1,418; ks from 4 to 5). Othercorrelations were based on good sample sizes (Ns ranged from1,026 to 75,000) drawn from larger numbers of samples (ks rangedfrom 6 to 69).
Table 6 presents the meta-analytic results for each correlateand includes details of sample size (N) and the number ofindependent correlation coefficients (k) upon which each meanor weighted correlation is based. For each construct, we reportthe mean, weighted correlation (r�) and corresponding 95%confidence intervals (CIs), I2, and Q statistics. The rho (�)correlations are reported together with 80% credibility intervals
364 RICHARDSON, ABRAHAM, AND BOND
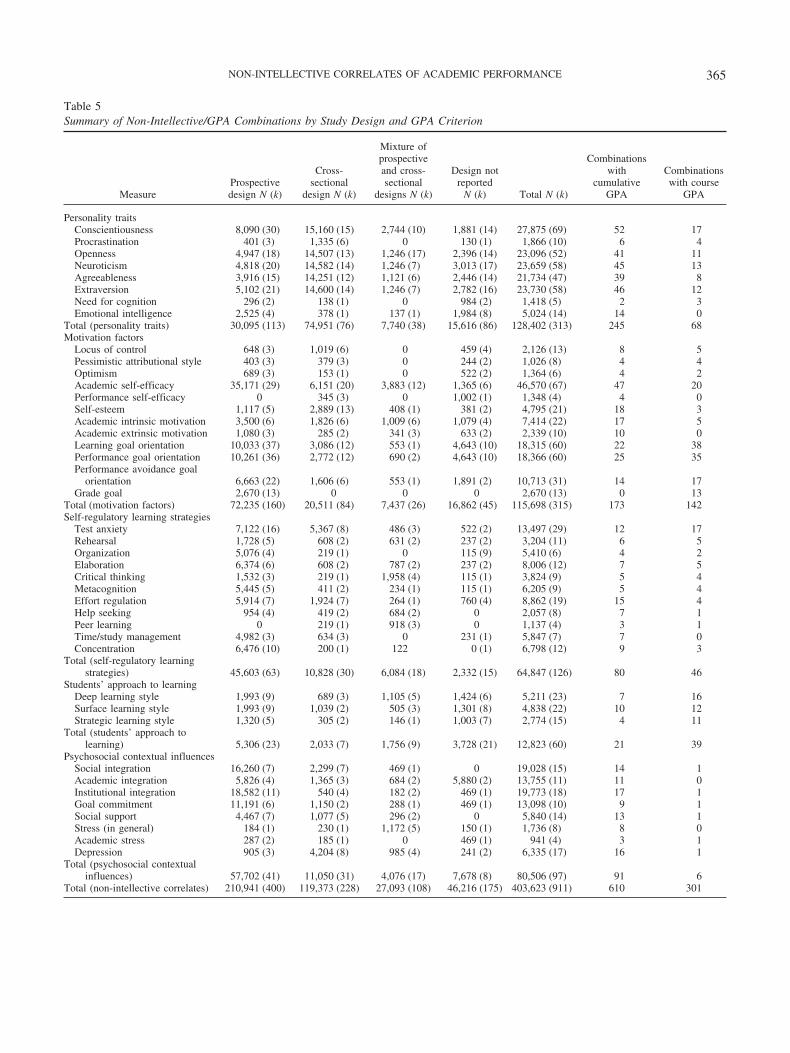
Table 5Summary of Non-Intellective/GPA Combinations by Study Design and GPA Criterion
MeasureProspectivedesign N (k)
Cross-sectional
design N (k)
Mixture ofprospectiveand cross-sectional
designs N (k)
Design notreported
N (k) Total N (k)
Combinationswith
cumulativeGPA
Combinationswith course
GPA
Personality traitsConscientiousness 8,090 (30) 15,160 (15) 2,744 (10) 1,881 (14) 27,875 (69) 52 17Procrastination 401 (3) 1,335 (6) 0 130 (1) 1,866 (10) 6 4Openness 4,947 (18) 14,507 (13) 1,246 (17) 2,396 (14) 23,096 (52) 41 11Neuroticism 4,818 (20) 14,582 (14) 1,246 (7) 3,013 (17) 23,659 (58) 45 13Agreeableness 3,916 (15) 14,251 (12) 1,121 (6) 2,446 (14) 21,734 (47) 39 8Extraversion 5,102 (21) 14,600 (14) 1,246 (7) 2,782 (16) 23,730 (58) 46 12Need for cognition 296 (2) 138 (1) 0 984 (2) 1,418 (5) 2 3Emotional intelligence 2,525 (4) 378 (1) 137 (1) 1,984 (8) 5,024 (14) 14 0
Total (personality traits) 30,095 (113) 74,951 (76) 7,740 (38) 15,616 (86) 128,402 (313) 245 68Motivation factors
Locus of control 648 (3) 1,019 (6) 0 459 (4) 2,126 (13) 8 5Pessimistic attributional style 403 (3) 379 (3) 0 244 (2) 1,026 (8) 4 4Optimism 689 (3) 153 (1) 0 522 (2) 1,364 (6) 4 2Academic self-efficacy 35,171 (29) 6,151 (20) 3,883 (12) 1,365 (6) 46,570 (67) 47 20Performance self-efficacy 0 345 (3) 0 1,002 (1) 1,348 (4) 4 0Self-esteem 1,117 (5) 2,889 (13) 408 (1) 381 (2) 4,795 (21) 18 3Academic intrinsic motivation 3,500 (6) 1,826 (6) 1,009 (6) 1,079 (4) 7,414 (22) 17 5Academic extrinsic motivation 1,080 (3) 285 (2) 341 (3) 633 (2) 2,339 (10) 10 0Learning goal orientation 10,033 (37) 3,086 (12) 553 (1) 4,643 (10) 18,315 (60) 22 38Performance goal orientation 10,261 (36) 2,772 (12) 690 (2) 4,643 (10) 18,366 (60) 25 35Performance avoidance goal
orientation 6,663 (22) 1,606 (6) 553 (1) 1,891 (2) 10,713 (31) 14 17Grade goal 2,670 (13) 0 0 0 2,670 (13) 0 13
Total (motivation factors) 72,235 (160) 20,511 (84) 7,437 (26) 16,862 (45) 115,698 (315) 173 142Self-regulatory learning strategies
Test anxiety 7,122 (16) 5,367 (8) 486 (3) 522 (2) 13,497 (29) 12 17Rehearsal 1,728 (5) 608 (2) 631 (2) 237 (2) 3,204 (11) 6 5Organization 5,076 (4) 219 (1) 0 115 (9) 5,410 (6) 4 2Elaboration 6,374 (6) 608 (2) 787 (2) 237 (2) 8,006 (12) 7 5Critical thinking 1,532 (3) 219 (1) 1,958 (4) 115 (1) 3,824 (9) 5 4Metacognition 5,445 (5) 411 (2) 234 (1) 115 (1) 6,205 (9) 5 4Effort regulation 5,914 (7) 1,924 (7) 264 (1) 760 (4) 8,862 (19) 15 4Help seeking 954 (4) 419 (2) 684 (2) 0 2,057 (8) 7 1Peer learning 0 219 (1) 918 (3) 0 1,137 (4) 3 1Time/study management 4,982 (3) 634 (3) 0 231 (1) 5,847 (7) 7 0Concentration 6,476 (10) 200 (1) 122 0 (1) 6,798 (12) 9 3
Total (self-regulatory learningstrategies) 45,603 (63) 10,828 (30) 6,084 (18) 2,332 (15) 64,847 (126) 80 46
Students’ approach to learningDeep learning style 1,993 (9) 689 (3) 1,105 (5) 1,424 (6) 5,211 (23) 7 16Surface learning style 1,993 (9) 1,039 (2) 505 (3) 1,301 (8) 4,838 (22) 10 12Strategic learning style 1,320 (5) 305 (2) 146 (1) 1,003 (7) 2,774 (15) 4 11
Total (students’ approach tolearning) 5,306 (23) 2,033 (7) 1,756 (9) 3,728 (21) 12,823 (60) 21 39
Psychosocial contextual influencesSocial integration 16,260 (7) 2,299 (7) 469 (1) 0 19,028 (15) 14 1Academic integration 5,826 (4) 1,365 (3) 684 (2) 5,880 (2) 13,755 (11) 11 0Institutional integration 18,582 (11) 540 (4) 182 (2) 469 (1) 19,773 (18) 17 1Goal commitment 11,191 (6) 1,150 (2) 288 (1) 469 (1) 13,098 (10) 9 1Social support 4,467 (7) 1,077 (5) 296 (2) 0 5,840 (14) 13 1Stress (in general) 184 (1) 230 (1) 1,172 (5) 150 (1) 1,736 (8) 8 0Academic stress 287 (2) 185 (1) 0 469 (1) 941 (4) 3 1Depression 905 (3) 4,204 (8) 985 (4) 241 (2) 6,335 (17) 16 1
Total (psychosocial contextualinfluences) 57,702 (41) 11,050 (31) 4,076 (17) 7,678 (8) 80,506 (97) 91 6
Total (non-intellective correlates) 210,941 (400) 119,373 (228) 27,093 (108) 46,216 (175) 403,623 (911) 610 301
365NON-INTELLECTIVE CORRELATES OF ACADEMIC PERFORMANCE
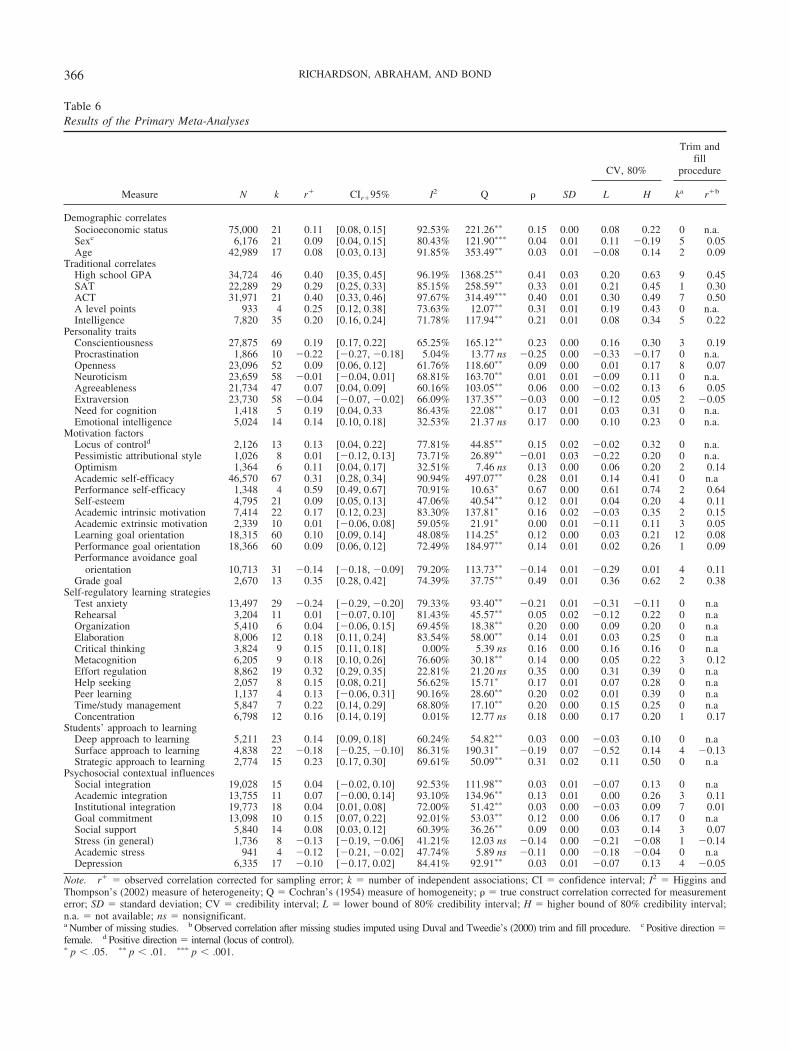
Table 6Results of the Primary Meta-Analyses
Measure N k r� CIr�95% I2 Q � SD
CV, 80%
Trim andfill
procedure
L H ka r�b
Demographic correlatesSocioeconomic status 75,000 21 0.11 [0.08, 0.15] 92.53% 221.26�� 0.15 0.00 0.08 0.22 0 n.a.Sexc 6,176 21 0.09 [0.04, 0.15] 80.43% 121.90��� 0.04 0.01 0.11 �0.19 5 0.05Age 42,989 17 0.08 [0.03, 0.13] 91.85% 353.49�� 0.03 0.01 �0.08 0.14 2 0.09
Traditional correlatesHigh school GPA 34,724 46 0.40 [0.35, 0.45] 96.19% 1368.25�� 0.41 0.03 0.20 0.63 9 0.45SAT 22,289 29 0.29 [0.25, 0.33] 85.15% 258.59�� 0.33 0.01 0.21 0.45 1 0.30ACT 31,971 21 0.40 [0.33, 0.46] 97.67% 314.49��� 0.40 0.01 0.30 0.49 7 0.50A level points 933 4 0.25 [0.12, 0.38] 73.63% 12.07�� 0.31 0.01 0.19 0.43 0 n.a.Intelligence 7,820 35 0.20 [0.16, 0.24] 71.78% 117.94�� 0.21 0.01 0.08 0.34 5 0.22
Personality traitsConscientiousness 27,875 69 0.19 [0.17, 0.22] 65.25% 165.12�� 0.23 0.00 0.16 0.30 3 0.19Procrastination 1,866 10 �0.22 [�0.27, �0.18] 5.04% 13.77 ns �0.25 0.00 �0.33 �0.17 0 n.a.Openness 23,096 52 0.09 [0.06, 0.12] 61.76% 118.60�� 0.09 0.00 0.01 0.17 8 0.07Neuroticism 23,659 58 �0.01 [�0.04, 0.01] 68.81% 163.70�� 0.01 0.01 �0.09 0.11 0 n.a.Agreeableness 21,734 47 0.07 [0.04, 0.09] 60.16% 103.05�� 0.06 0.00 �0.02 0.13 6 0.05Extraversion 23,730 58 �0.04 [�0.07, �0.02] 66.09% 137.35�� �0.03 0.00 �0.12 0.05 2 �0.05Need for cognition 1,418 5 0.19 [0.04, 0.33 86.43% 22.08�� 0.17 0.01 0.03 0.31 0 n.a.Emotional intelligence 5,024 14 0.14 [0.10, 0.18] 32.53% 21.37 ns 0.17 0.00 0.10 0.23 0 n.a.
Motivation factorsLocus of controld 2,126 13 0.13 [0.04, 0.22] 77.81% 44.85�� 0.15 0.02 �0.02 0.32 0 n.a.Pessimistic attributional style 1,026 8 0.01 [�0.12, 0.13] 73.71% 26.89�� �0.01 0.03 �0.22 0.20 0 n.a.Optimism 1,364 6 0.11 [0.04, 0.17] 32.51% 7.46 ns 0.13 0.00 0.06 0.20 2 0.14Academic self-efficacy 46,570 67 0.31 [0.28, 0.34] 90.94% 497.07�� 0.28 0.01 0.14 0.41 0 n.aPerformance self-efficacy 1,348 4 0.59 [0.49, 0.67] 70.91% 10.63� 0.67 0.00 0.61 0.74 2 0.64Self-esteem 4,795 21 0.09 [0.05, 0.13] 47.06% 40.54�� 0.12 0.01 0.04 0.20 4 0.11Academic intrinsic motivation 7,414 22 0.17 [0.12, 0.23] 83.30% 137.81� 0.16 0.02 �0.03 0.35 2 0.15Academic extrinsic motivation 2,339 10 0.01 [�0.06, 0.08] 59.05% 21.91� 0.00 0.01 �0.11 0.11 3 0.05Learning goal orientation 18,315 60 0.10 [0.09, 0.14] 48.08% 114.25� 0.12 0.00 0.03 0.21 12 0.08Performance goal orientation 18,366 60 0.09 [0.06, 0.12] 72.49% 184.97�� 0.14 0.01 0.02 0.26 1 0.09Performance avoidance goal
orientation 10,713 31 �0.14 [�0.18, �0.09] 79.20% 113.73�� �0.14 0.01 �0.29 0.01 4 0.11Grade goal 2,670 13 0.35 [0.28, 0.42] 74.39% 37.75�� 0.49 0.01 0.36 0.62 2 0.38
Self-regulatory learning strategiesTest anxiety 13,497 29 �0.24 [�0.29, �0.20] 79.33% 93.40�� �0.21 0.01 �0.31 �0.11 0 n.aRehearsal 3,204 11 0.01 [�0.07, 0.10] 81.43% 45.57�� 0.05 0.02 �0.12 0.22 0 n.aOrganization 5,410 6 0.04 [�0.06, 0.15] 69.45% 18.38�� 0.20 0.00 0.09 0.20 0 n.aElaboration 8,006 12 0.18 [0.11, 0.24] 83.54% 58.00�� 0.14 0.01 0.03 0.25 0 n.aCritical thinking 3,824 9 0.15 [0.11, 0.18] 0.00% 5.39 ns 0.16 0.00 0.16 0.16 0 n.aMetacognition 6,205 9 0.18 [0.10, 0.26] 76.60% 30.18�� 0.14 0.00 0.05 0.22 3 0.12Effort regulation 8,862 19 0.32 [0.29, 0.35] 22.81% 21.20 ns 0.35 0.00 0.31 0.39 0 n.aHelp seeking 2,057 8 0.15 [0.08, 0.21] 56.62% 15.71� 0.17 0.01 0.07 0.28 0 n.aPeer learning 1,137 4 0.13 [�0.06, 0.31] 90.16% 28.60�� 0.20 0.02 0.01 0.39 0 n.aTime/study management 5,847 7 0.22 [0.14, 0.29] 68.80% 17.10�� 0.20 0.00 0.15 0.25 0 n.aConcentration 6,798 12 0.16 [0.14, 0.19] 0.01% 12.77 ns 0.18 0.00 0.17 0.20 1 0.17
Students’ approach to learningDeep approach to learning 5,211 23 0.14 [0.09, 0.18] 60.24% 54.82�� 0.03 0.00 �0.03 0.10 0 n.aSurface approach to learning 4,838 22 �0.18 [�0.25, �0.10] 86.31% 190.31� �0.19 0.07 �0.52 0.14 4 �0.13Strategic approach to learning 2,774 15 0.23 [0.17, 0.30] 69.61% 50.09�� 0.31 0.02 0.11 0.50 0 n.a
Psychosocial contextual influencesSocial integration 19,028 15 0.04 [�0.02, 0.10] 92.53% 111.98�� 0.03 0.01 �0.07 0.13 0 n.aAcademic integration 13,755 11 0.07 [�0.00, 0.14] 93.10% 134.96�� 0.13 0.01 0.00 0.26 3 0.11Institutional integration 19,773 18 0.04 [0.01, 0.08] 72.00% 51.42�� 0.03 0.00 �0.03 0.09 7 0.01Goal commitment 13,098 10 0.15 [0.07, 0.22] 92.01% 53.03�� 0.12 0.00 0.06 0.17 0 n.aSocial support 5,840 14 0.08 [0.03, 0.12] 60.39% 36.26�� 0.09 0.00 0.03 0.14 3 0.07Stress (in general) 1,736 8 �0.13 [�0.19, �0.06] 41.21% 12.03 ns �0.14 0.00 �0.21 �0.08 1 �0.14Academic stress 941 4 �0.12 [�0.21, �0.02] 47.74% 5.89 ns �0.11 0.00 �0.18 �0.04 0 n.aDepression 6,335 17 �0.10 [�0.17, 0.02] 84.41% 92.91�� 0.03 0.01 �0.07 0.13 4 �0.05
Note. r� � observed correlation corrected for sampling error; k � number of independent associations; CI � confidence interval; I2 � Higgins andThompson’s (2002) measure of heterogeneity; Q � Cochran’s (1954) measure of homogeneity; � � true construct correlation corrected for measurementerror; SD � standard deviation; CV � credibility interval; L � lower bound of 80% credibility interval; H � higher bound of 80% credibility interval;n.a. � not available; ns � nonsignificant.a Number of missing studies. b Observed correlation after missing studies imputed using Duval and Tweedie’s (2000) trim and fill procedure. c Positive direction �female. d Positive direction � internal (locus of control).� p � .05. �� p � .01. ��� p � .001.
366 RICHARDSON, ABRAHAM, AND BOND

(CVs); finally, based on r�, an estimation of the number ofstudies missing due to publication bias is reported and, wherethis is greater than 0, the corresponding adjusted effect size isalso reported. Figure 1 details r� and corresponding 95% CIs ofthe 42 non-intellective constructs.
We applied Cohen’s (1992) useful guidelines on interpretationof the magnitude of sample-weighted average correlations (r�).According to Cohen, r� � .10 is small, r� � .30 is medium, andr� � .50 is large.
Demographics (Sex, Age, Socioeconomic Status) andTraditional Factors (SAT, ACT, High School GPA, ALevel Points, and Intelligence)
Correlations between GPA and socioeconomic background, sex,and age indicated that, in general, students from higher socioeco-nomic backgrounds (r� � .11, 95% CI [.08, .15]), older students
(r� � .08, 95% CI [.03, .13]), and female students (r� � .09, 95%CI [.04, .15]) obtained higher grades. These demographic effectsize estimates were small.
Measures of high school GPA (r� � .40, 95% CI [.35, .45]),SAT (r� � .29, 95% CI [.25, .33]), and ACT (r� �. 40, 95% CI[.33, .46]) were, as expected, positive and medium-sized correlatesof GPA. A level points in the United Kingdom (r� � .25, 95% CI[.12, .38]) and measures of general intelligence (r� � .20, 95% CI[.16, .24]) revealed small, positive, average correlations with GPA.
Personality Traits
As expected, conscientiousness, (r� � .19, 95% CI [.17, .22])was the strongest correlate of GPA among the Big Five personalityfactors. None of the remaining Big Five Factors were importantcorrelates of GPA (agreeableness, r� � .07, 95% CI [.04, .09];openness, r� � 09, 95% CI [06, .12]; extraversion, r� � �.04,
Figure 1. Results of the primary meta-analyses for the non-intellective correlates of GPA: r� and 95%confidence intervals.
367NON-INTELLECTIVE CORRELATES OF ACADEMIC PERFORMANCE

95% CI [�.07, �.02]; neuroticism, r� � �.01, 95% CI [�.04,.01]). CIs for neuroticism crossed zero.
Need for cognition (r� �.19, 95% CI [.04, .33]) and emo-tional intelligence (r� � .14, 95% CI [.10, .18]) showed smallpositive, significant correlations with GPA, whereas procrasti-nation was found to have a small, negative, average correlationwith GPA (r� � �.22, 95% CI [ �.27, �.18]).
Motivation Factors
Measures of optimism, locus of control, and self-esteem werefound to have small correlations with GPA (r� � .11, 95% CI [.04,.17]; r�� .13, 95% CI [.04, .22]; r�� .09, 95% CI [.05, .13],respectively), whereas pessimistic attributional style (for negativeacademic events) was unrelated to GPA (r� � .01, 95% CI [�.12,.13]). With the exception of pessimistic attributional style, CIintervals did not cross zero, indicating that these effects werestatistically different from zero.
As expected, academic intrinsic motivation (r� � .17, 95% CI[.12, .23]) was a small, significant, positive correlate of GPA,whereas academic extrinsic motivation (r� � .01, 95% CI [�.06,.08]) was not significantly associated with GPA. Learning goalorientation (r� � .10, 95% CI [.09, .13]) and performance goalorientation (r� � .09, 95% CI [.06, .12]) were found to have small,positive correlations with GPA, whereas performance avoidancegoal orientation showed, as expected, a small negative associationwith GPA (r� � �.14, 95% CI [�.18, �.09]). Medium correla-tions were observed between GPA and academic self-efficacy(r� � .31, 95% CI [.28, .34]) and grade goal (r� � .35, 95% CI[.28, .42]). Grade goal was the second largest correlate of GPA.Performance self-efficacy was strongly associated with GPA (r�
� .59, 95% CI [.49, .67]), comprising the largest effect observed.
Self-Regulatory Learning Strategies
Four information processing strategies that represent deep learn-ing—namely, metacognition (r� � .18, 95% CI [.10, .26]), criticalthinking (r� � .15, 95% CI [.11, .18]), elaboration (r� � .18, 95%CI [.11, .24]), and concentration (r� � .16, 95% CI [.14, .19])—were found to have small, significant, positive correlations withGPA. In contrast, measures of organization and rehearsal learningwere not significantly associated with GPA (r� � .04, 95% CI[�.06, .15] and r�� .01, 95% CI [�.07, .10], respectively).
Considering measures of behavioral self-regulation, we foundthat time/study management, (r� � .22, 95% CI [.14, .29]), helpseeking (r� � .15, 95% CI [.08, .21]), and peer learning (r� � .13,95% CI [�.06, .31]) were small positive correlates of GPA,although the CI intervals around peer learning crossed zero. Effortregulation (r� � .32, 95% CI [.29, .35]) showed a medium,positive correlation with GPA, whereas test anxiety (r� � �.24,95% CI [�.29, �.20]) showed a small, negative correlation withGPA.
Students’ Approaches to Learning
The relation between surface learning and GPA was small andnegative (r� � �.18, 95% CI [ �.25, �.10]), whereas deep (r� �.14, 95% CI [.09, .18]) and strategic (r� � .23, 95% CI [.17, .30])
approaches to learning were found to have small, positive associ-ations with GPA.
Psychosocial Contextual Influences
Goal commitment was the strongest correlate of GPA fromTinto’s (1975) student dropout model but was found to have onlya small, positive association with GPA (r� � .15, 95% CI [.07,.22]). Social (r� � .04, 95% CI [�.02, .10]), academic (r� � .07,95% CI [�.00, .14]), and institutional (r� � .04, 95% CI [.01,.08]) integration showed very small associations, with CIs forsocial and academic integration crossing zero, indicating that theseeffects were not significant. Measures of psychological health andsocial support were correlated with GPA in the expected directionwith small, negative effects of general stress (r� � �.13, 95% CI[�.19, �.06]) and academic stress, (r� � �.12, 95% CI [�.21,�.02]) and a small, positive effect of social support (r� � .08,95% CI [.03, .12). Depression was found to have a small, negativeassociation (r� � �.10, 95% CI [�.17, .02]) that was not statis-tically significant, as indicated by the CI’s crossing of zero.
Outliers and Influential Cases
The number of outliers did not exceed k/10 (rounded up tothe nearest integer value) in any of our analyses. When eitherthe DFFITS value was greater than 3�1/�k–1) or the Cook’sdistance exceeded �2, df � 1, we reconducted the analysis torecalculate the average effect size with that study excluded. Anal-yses were reconducted for 22 of the 50 constructs; for all exceptone analysis, only one outlier had to be excluded according tothese criteria. In that analysis, two outliers were excluded, sepa-rately. The effect of excluding the outlier was trivial in all but oneanalysis. The average correlation computed excluding the outlierdid not differ by more than 0.05 from that obtained with the outlierincluded, and in none of these cases did this small discrepancyaffect the direction or effect size interpretation. In one analysis (thepeer learning/GPA combination), the discrepancy was a littlelarger than the others (.08), but this association was nonsignificantwith and without outliers, as indicated by CIs that crossed zero.
Publication Bias
Duval and Tweedie’s trim and fill analyses led to a difference 0.05 in two of the 50 constructs tested, ACT (r� � .40 before andr� � .50 after 7 missing studies imputed) and metacognition (r �.18 before and r� � .12 after 3 missing studies imputed), indicat-ing that publication bias may be a problem for these measures,leading to an underestimation of the effect of ACT and an over-estimation of the effect of metacognition on GPA. Because mostcolleges accept SAT and/or ACT scores, following Robbins et al.(2004) these measures were combined (r� � .34, 95% CI [.30,.38]) in the cross-domain multivariate models (see below). In thecombined SAT/ACT measure, r� � .41 after 14 missing studieswere imputed.
Moderator Analyses
Nine of 42 non-intellective constructs obtained a nonsignificantr� as indicated by CIs that crossed zero (neuroticism, pessimisticattributional style, academic extrinsic motivation, rehearsal, orga-
368 RICHARDSON, ABRAHAM, AND BOND

nization, peer learning, social integration, academic integration,and depression). Of the remaining non-intellective constructs, withthe exception of procrastination, emotional intelligence, optimism,critical thinking, effort regulation, concentration, stress (in gen-eral), and academic stress, the associated Q statistics were signif-icant, and I2 values large. Additionally, the credibility intervalsaround the rho correlations were relatively wide, indicating sub-stantial variation in the individual correlations across the studies.Study design (prospective vs. cross-sectional measurement) wasexamined as a potential moderator, where there was heterogeneityacross studies and sufficient data (k 4 in each subgroup) tosupport these analyses (Borenstein, Hedges, Higgins, & Rothstein,2009). Sufficient data for 14 constructs were available.
For the moderation analyses, subgroup analysis was per-formed by grouping the associations by study design (prospec-tive vs. cross-sectional measurement) and assessing heteroge-neity between groups using the between-group Q statisticwithin a mixed effects model. Results revealed no moderatingeffect for the relations between GPA and conscientiousness,neuroticism, openness, agreeableness, performance goal orien-tation, avoidance goal orientation, test anxiety, social integra-tion, or social support. Significant between-group Q statisticswere found for relationships between GPA and extraversion,academic self-efficacy, self-esteem, learning goal orientation,and academic intrinsic motivation. Table 7 presents the findingsof the moderator analyses. For extraversion a lower weightedaverage correlation was obtained in cross-sectional studies thanin prospective studies (mean difference � .08, between-groupQ � 7.14, p � .01); however, the CI intervals in the cross-sectional subgroup crossed zero, making these effects difficultto interpret. As expected, significantly lower weighted averageeffect size estimates were obtained for prospective versus cross-sectional studies for relations between GPA and academic self-efficacy (mean difference � .13, between-group Q � 15.80,p � .001), self-esteem (mean difference � .11, between-groupQ � 7.27, p � .01), learning goal orientation (mean differ-ence � .06, between-group Q � 4.49, p � .05), and academic
intrinsic motivation (mean difference � .14, between-groupQ � 7.15, p � .01). However, with the exception of academicself-efficacy and learning goal orientation, the CI intervalscrossed zero in the prospective subgroups, limiting interpreta-tion of these findings.
Regression Analyses
Cheung and Chan’s (2005, 2009) two-stage structural equationmodeling (TSSEM) was used to examine regression models withineach domain (i.e., personality, motivation, self-regulatory learning,students’ approaches to learning, and psychosocial contextual in-fluences). Stage 1 estimates the pooled correlation matrix and itsasymptotic covariance matrix; Stage 2 fits the proposed model tothe pooled correlation matrix. Where constructs obtained a signif-icant r� .10 with GPA and where relevant data were reported inthe primary manuscripts, multivariate models were conducted.Table 8 reports the beta coefficients and model statistics for theregression analyses. The table also reports the number of matriceson which each analysis was based and how many of these con-tained data for all focal constructs. The pooled correlation matricescan be obtained from the first author on request.
Personality trait regression models. Four trait measuresobtained r� .10 (conscientiousness, procrastination, need forcognition, and emotional intelligence), although no study reporteddata including all of these measures. However, data for conscien-tiousness/ procrastination, conscientiousness/need for cognition,and conscientiousness/emotional intelligence combinations wereavailable. Conscientiousness ( � .13) and procrastination ( ��.17) accounted for 7% of the variance in GPA, whereas both (a)conscientiousness ( � .17) and need for cognition ( � .09) and(b) conscientiousness ( � .18) and emotional intelligence ( �.11) accounted for 5% of the variation in GPA.
Motivation factors regression model. Seven constructs ob-tained r� .10: locus of control, optimism, academic self-efficacy, performance self-efficacy, academic intrinsic motivation,avoidance goal orientation, and grade goal. No studies contained
Table 7Moderator Analyses: Prospective vs. Cross-Sectional Non-Intellective/GPA Associations
Measure N k r� CIr�95% Between-group Q
Extraversion (all) 19,702 35 �0.04 [�0.07, 0.01] 7.14��
Extraversion (prospective) 5,102 21 �0.08 [�0.12, �0.04]Extraversion (cross-sectional) 14,600 14 0.00 [�0.04, 0.05]
Academic self-efficacy (all) 41,322 49 0.25 [0.23, 0.28] 15.80���
Academic self-efficacy (prospective) 35,171 29 0.23 [0.20, 0.26]Academic self-efficacy (cross-sectional) 6,151 20 0.36 [0.30, 0.41]
Self-esteem (all) 4,006 18 0.07 [0.03, 0.11] 7.27��
Self-esteem (prospective) 1,117 5 0.01 [�0.05, 0.07]Self-esteem (cross-sectional) 2,889 13 0.12 [0.07, 0.17]
Learning goal orientation (all) 13,119 49 0.10 [0.07, 0.12] 4.49�
Learning goal orientation (prospective) 10,033 37 0.09 [0.06, 0.11]Learning goal orientation (cross-sectional) 3,086 12 0.15 [0.10, 0.21]
Academic intrinsic motivation (all) 5,326 12 0.19 [0.15, 0.23] 7.15��
Academic intrinsic motivation (prospective) 3,500 6 0.07 [�0.03, 0.16]Academic intrinsic motivation (cross-sectional) 1,826 6 0.21 [0.17, 0.26]
Note. r� � observed correlation corrected for sampling error; k � number of independent associations; CI � confidence interval; Q � Cochran’s (1954)measure of homogeneity.� p � .05. �� p � .01. ��� p � .001.
369NON-INTELLECTIVE CORRELATES OF ACADEMIC PERFORMANCE

all seven measures, but a model including three constructs (locusof control, academic self-efficacy, and grade goal) was tested. Inthis model 14% of the variance in GPA was explained, with smallbeta coefficients for locus of control ( � .02) and larger coeffi-cients for academic self-efficacy ( � .10) and grade goals ( �.31).
Self-regulatory learning strategies regression model.Among the self-regulatory strategies, test anxiety, along withseveral cognitive (elaboration, critical thinking, metacognition,and concentration) and behavioral (effort regulation, help seeking,and time/study management) constructs, obtained an r� .10. Nostudy included all of these measures, but a model combiningcognitive and behavioral constructs could be tested. Results showthat effort regulation ( � .32) was the strongest predictor of GPA,whereas betas for the remaining factors ranged from .02 to .07,collectively accounting for 11% of the variance.
Students’ approaches to learning regression model. Allthree constructs concerning students’ approach to learning met theinclusion criteria. The following beta coefficients were obtainedfor deep ( � .06), surface ( � �.14), and strategic ( � .23)learning; combined, these accounted for 9% of the variance.
Psychosocial contextual influences regression model. Ofthe psychosocial contextual constructs, stress (in general), stressrelating to academia, and goal commitment obtained r�s .10;however, no study contained all three constructs, so no model wastested.
Cross-Domain Regression Models
We tested a cross-domain model in three stages. First, thepredictive utility (meant here in a statistical sense) of each relevantnon-intellective predictor was examined separately, after control-ling for the traditional correlates (high school GPA and SAT/
ACT). Second, we entered non-intellective predictors into a hier-archical regression model in separate steps in accordance with atheoretically specified model proposing that more global and in-variant personality traits influence behavior through proximal pro-cesses (Bermudez, 1999; Chen, Gully, Whiteman, & Kilcullen,2000; Lee, Sheldon, & Turban, 2003; Phillips & Gully, 1997;Roberts & Wood, 2006; Vallerand & Ratelle, 2002). Third, wetested this hierarchical regression model again after adding SAT/ACT and high school GPA.
Five psychological constructs (conscientiousness, academic self-efficacy, grade goals, test anxiety, and effort regulation) were in-cluded because (a) their average relation with GPA was relativelystrong, (b) they were identified as important predictors in the within-group analyses, and (c) there were sufficient data available to testthese associations.
Table 9 shows the intercorrelations between these constructs, GPA,SAT/ACT, and high school GPA. Table 10 shows that conscientious-ness ( � .14), effort regulation ( � .22), test anxiety ( � �.13),academic self-efficacy ( � .18), and grade goal ( � .17) were each,individually, significant predictors of GPA in separate regressionscontrolling for high school GPA and SAT/ACT.
In building the hierarchical regression model, we initially enteredconscientiousness, followed by the more situated, proximal measureof effort regulation. Test anxiety, academic self-efficacy, and gradegoals were then added sequentially. Conscientiousness explained sig-nificant variance, but the coefficient was reduced in size after effortregulation was added to the model. In addition to effort regulation, testanxiety, academic self-efficacy, and grade goal accounted for a uniqueproportion of variance in GPA collectively, accounting for 20% of thevariance.
Table 11 shows the results of this regression model after firstcontrolling for traditional correlates by entering high school GPA
Table 8Within Domain Regression Models of Academic Achievement
Variable
Personality Motivation
Self-regulatorylearningstrategies
Students’approaches to
learning
C; procrastinationC; need forcognition
C; emotionalintelligence
Locus of controla;ASE; grade goal
E; CT; MC; ER;HS; T/SM
Deep; surface;strategic
.13��� .17��� .18��� .02��� .04��� .06���
�.17��� .09��� .11��� .10��� .06��� �.14���
n.a. n.a. n.a. .31��� .07��� .23���
n.a. n.a. n.a. n.a. .32��� n.a. n.a. n.a. n.a. n.a. .05��� n.a. n.a n.a n.a n.a. .02��� n.a. n.a. n.a. n.a. n.a. n.a. n.a.R2 .07 .05 .05 .14 .11 .09No. correlation matrices 78 73 76 86 40 24No. correlation matrices including
all focal independent variables 2 1 6 1 1 5
Note. Cheung and Chan’s (2005, 2009) two-stage analyses take into account the varying number of studies and sample sizes; thus, no single N is usedin the analyses. For each data set that entered the analyses a correlation matrix including the relevant constructs was produced. These were then combinedto generate a pooled correlation matrix to which the proposed model was fitted; constructs entered the model in the order that they are listed. C �conscientiousness; ASE � academic self-efficacy; E � elaboration; CT � critical thinking; MC � metacognition; ER � effort regulation; HS � helpseeking; T/SM � time/study management; n.a. � not available.a Positive direction � internal (locus of control).��� p � .001.
370 RICHARDSON, ABRAHAM, AND BOND

and SAT/ACT as an initial step, followed by the non-intellectiveconstructs in the order specified above. High school GPA andSAT/ACT collectively explained 22% of the variance in GPA.Addition of these traditional correlates reduced the effects of testanxiety and academic self-efficacy to nonsignificance and that ofgrade goal to marginal statistical significance. In the final model,after removing conscientiousness and test anxiety, measures ofeffort regulation ( � .17), academic self-efficacy ( � .11), andgrade goal ( � .08) explained an additional 6% of the varianceover and above high school GPA and SAT/ACT, so that thefour-step model (including SAT/ACT and high school GPA, effortregulation, academic self-efficacy, and grade goal) accounted for28% of the variance in GPA.
We conducted the same models again, first using the SAT/ACTscore adjusted for possible publication bias (r� � .41) and secondcontrolling for high school GPA and SAT only. The effect of gradegoals was reduced to nonsignificance ( � .06) controlling for theadjusted SAT/ACT score; otherwise, the pattern of results remainedthe same. The effect of grade goals was restored ( � .10) in themodel controlling for SAT and high school GPA. Self-efficacy ( �.13) and effort regulation ( � .15) retained statistical significance.
Discussion
This review synthesized 13 years of research into the antecedents ofuniversity students’ grade point average (GPA) scores. We read morethan 400 papers, which yielded 241 data sets including correlationsbetween tertiary GPA and 50 conceptually distinct constructs. In
addition to three demographic factors (age, sex, and socioeconomicstatus) and five traditional measures of cognitive capacity or prioracademic performance (SAT, ACT, intelligence, high school GPA,and A level points), 42 distinct non-intellective constructs were iden-tified. A conceptual analysis of theoretical models and hypothesesunderpinning studies of non-intellective constructs highlighted fiveconceptually overlapping but broadly distinct research domains,namely, investigations of personality traits, motivational factors, self-regulatory learning strategies, students’ approaches to learning, andpsychosocial contextual influences. In the discussion below, we (a)review the magnitude of average, weighted correlations with tertiaryGPA both within and across these five research domains; (b) examinemoderation of such associations by cross-sectional versus prospectivestudy design; (c) consider multivariate models accounting for cumu-lative variance within research domains; (d) discuss cross-domain,multivariate models of tertiary students’ potential and the implicationsfor development of assessment inventories; (e) compare our findingsto those of pervious reviews; (f) identify limitations of this review; (g)reflect on the design and evaluation of interventions to optimizetertiary student potential; and (h) highlight key conclusions for re-search and practice.
Magnitude of Average, Weighted, BivariateCorrelations With Tertiary GPA
Drawing upon 1,105 independent correlations, our hypotheses-driven, random effects, meta-analyses revealed that 41 of 50constructs were significantly associated with GPA. Consistent with
Table 9Mean Intercorrelations Between Variables Included in Cross Domain Model
Variable 1 2 3 4 5 6 7 8
1. GPA — 27,875 (69) 13,497 (29) 8,862 (19) 46,570 (67) 2,670 (13) 54,260 (50) 34,724 (46)2. Conscientiousness .19 — 749 (3) 2,188 (8) 1,267 (5) 487 (2) 2,083 (8) 2,196 (8)3. Test anxiety �.24 �.02 — 4,805 (1) 725 (4) 599 (3) 2,649 (5) 4,942 (2)4. Effort regulationa .32 .53 �.15 — 244 (2) 177 (1) 2,654 (4) 4,805 (1)5. Academic self-efficacy .31 .23 �.48 .30 — 453 (3) 10,362 (7) 5,890 (9)6. Grade goal .35 .14 �.30 .34 .40 — 588 (3) 108 (1)7. SAT/ACTb .34 �.05 �.16 .03 .31 .37 — 8,579 (17)8. High school GPA .40 .21 �.23 .37 .21 .37 .24 —
Note. Lower diagonal triangle: mean correlations (r�) among variables; upper diagonal triangle: sample size and number of samples (in parentheses) fromwhich the means were derived. GPA � grade point average.a Data for the effort regulation/grade goal combination were obtained from an unpublished study conducted at the university of the third author becausethese data were unavailable in the reviewed studies. b SAT and ACT scores were combined for the primary cross-domain analyses.
Table 10Regression Models Examining the Predictive Validity of Non-Intellective Correlates of Grade Point Average (GPA) Controlling forHigh School GPA and SAT/ACT Scores
Variable entered Conscientiousness Effort
regulation Test
anxiety Academic self-
efficacy Grade goal
Step 1SAT/ACT .27��� .27��� .25��� .21��� .21���
High school GPA .31��� .25��� .31��� .31��� .29���
Focal non-intellective predictor .14��� .22��� �.13��� .18��� .17���
R2 24 26 24 25 25Model F 66.26��� 74.59��� 65.25��� 69.96��� 67.34���
��� p � .001.
371NON-INTELLECTIVE CORRELATES OF ACADEMIC PERFORMANCE

previous findings (e.g., Smith & Naylor, 2001), female students,older students, and those from higher socioeconomic backgroundsobtained higher GPAs; however, these effects were small (r�s �.08–.11).
Measures of general intelligence had a small positive associa-tion with GPA but, confirming previous findings (e.g., Robbins etal., 2004), high school GPA, SAT, and ACT were medium-sized(or nearly so) positive correlates (r�s �.29–.40). Interestingly,ACT was a stronger predictor of GPA than of SAT, especially afterimputation of missing studies due to potential publication bias;further research including examination of unpublished literature isneeded to validate this finding.
In U.K. data, a small correlation was observed between A levelpoints and university GPA (r� � .25), again reflecting previousfindings (Peers & Johnston, 1994). It may be that use of morestandardized national assessments (than in North America) and higheroverall grade attainment has attenuated the school–university perfor-mance association in the United Kingdom (McDonald, Newton,Whetton, & Benfield, 2001).
Focusing on the largest, average non-intellective correlates byresearch domain, we found that, of eight personality measures,procrastination (negatively correlated), conscientiousness, andneed for cognition were the largest, albeit small, correlates of GPA(r�s � .19–.22). Next, among 12 motivational factors, mediumpositive correlations were observed for academic self-efficacy(r� � .31) and grade goal (r� � .35), whereas a large positivecorrelation was found for performance self-efficacy (r� � .59).Performance self-efficacy and grade goal were the strongest of the42 non-intellective associations tested. Of 11 measures of self-regulatory capacities, only effort regulation obtained a medium-sized association (r� �.32), with test anxiety being the nextstrongest correlate (r� � �.24).
Small average correlations were observed for measures of threeapproaches to learning, with strategic (r� � .23) and surfacelearning (r� � �.18) having the strongest effects. Of the eightpsychosocial contextual factors, measures of goal commitment,general stress, and academic stress obtained the largest, albeitsmall, average correlations (r�s � .15, �.13, �.12, respectively).
Discounting small correlations, performance self-efficacy, gradegoal, effort regulation, and academic self-efficacy emerged as thestrongest correlates of tertiary GPA, alongside traditional assess-ments of cognitive capacity and previous performance. This pat-tern of findings emphasizes the importance of specific, potentiallymodifiable cognitions and self-regulatory competencies. Measuresof relatively more stable individual characteristics (e.g., intelli-gence, conscientiousness, procrastination), approaches to studentlearning (superficial, deep, or strategic), and psychosocial contex-tual factors (e.g., general and academic stress) were not found tohave medium or large average correlations with GPA.
Small correlations can, however, be important, especially if theyrepresent population-relevant effects. Consequently, models ofGPA antecedents should not necessarily overlook the 22 small-sized correlates identified here (see Table 2 for definitions). Forclarity, these are listed by research domain below.
1. Personality traits: procrastination (negatively correlated),conscientiousness, need for cognition, and emotional in-telligence.T
able
11H
iera
rchi
cal
Reg
ress
ion
Mod
elE
xam
inin
gth
eIn
crem
enta
lV
alid
ity
Est
imat
esof
Non
-Int
elle
ctiv
eC
orre
late
son
Gra
deP
oint
Ave
rage
Bef
ore
and
Aft
erC
ontr
olli
ngfo
rH
igh
Scho
olG
PA
and
SAT
/AC
TSc
ores
Var
iabl
een
tere
d
(M
odel
with
out
cons
cien
tious
ness
and
test
anxi
ety)
Step
1SA
T/A
CT
.26�
��
.27�
��
.28�
��
.26�
��
.24�
��
.22�
��
.21�
��
Hig
hsc
hool
GPA
.34�
��
.31�
��
.25�
��
.23�
��
.24�
��
.22�
��
.23�
��
Step
2C
onsc
ient
ious
ness
.19�
��
(.14
���)
.03
ns(.
05ns
)05
ns(.
06ns
).0
2ns
(.04
ns)
.04
ns(.
05ns
)n.
a.St
ep3
Eff
ort
regu
latio
n.3
1���
(.19
���)
.27�
��
(.18
���)
.23�
��
(.16
���)
.18�
��
(.15
��)
.20�
��
(.17
���)
Step
4T
est
anxi
ety
�.2
0���
(�.1
2��)
�.1
1��
(�.0
8�)
�.0
9�(�
.07
ns)
n.a.
Step
5A
cade
mic
self
-eff
icac
y.1
9���
(.09
�)
.14�
(.07
ns)
.16�
�(.
11��)
Step
6G
rade
goal
.20�
��
(.08
†)
.22�
��
(.08
�)
R2
.22
.04
(.24
).1
0(.
27)
.14
(.28
).1
6(.
28)
.20
(.29
).1
9(.
28)
�F
89.7
8���
23.4
5���
(15.
17���)
46.6
0���
(20.
41���)
28.0
4���
(10.
85��)
16.3
4���
(4.3
8�)
25.7
2���
(3.6
0†)
28.6
7���
(4.1
6�)
Mod
elF
89.7
8���
23.4
5���
(66.
26���)
35.8
8���
(56.
35���)
34.3
0���
(47.
96���)
30.4
4���
(41.
91���)
30.4
6���
(35.
73���)
48.7
7���
(49.
03���)
Not
e.N
�62
8.C
oeff
icie
nts
cont
rolli
ngfo
rhi
ghsc
hool
GPA
and
SAT
/AC
Tar
ere
port
edin
pare
nthe
ses.
n.a.
�no
tav
aila
ble;
ns�
nons
igni
fica
nt.
†p
�.0
7.�
p�
.05.
��
p�
.01.
���
p�
.001
.
372 RICHARDSON, ABRAHAM, AND BOND

2. Motivational factors: locus of control, optimism, aca-demic intrinsic motivation, learning goal orientation, andavoidance goal orientation (negatively correlated).
3. Self-regulatory learning strategies: elaboration, criticalthinking, use of metacognition, help seeking, time/studymanagement, concentration, and test anxiety (negativelycorrelated).
4. Approaches to learning: having a strategic, deep, or sur-face (negatively correlated) approach.
5. Psychosocial contextual influences: goal commitment,experiencing general stress or stress relating to universitywork (both negatively correlated).
Whether these small associations are of practical importance to theassessment of university students’ potential or whether the designof cost-effective interventions to optimize such potential is viablewill probably depend on the extent to which they uniquely explainvariance in GPA over and above medium and large correlates.
Moderation by Study Design
Available data strictly limited the extent to which we could testmoderation effects. Cross-sectional correlations were found tooverestimate associations with GPA, compared to prospective testsof academic self-efficacy and learning goal orientation. The samepattern was found for self-esteem and academic intrinsic motiva-tion, although confidence intervals crossed zero in the prospectivesubgroup. Cross-sectional studies of the extraversion–GPA rela-tion appeared to underestimate the predictive capacity of thispersonality trait (relative to prospective studies), but confidenceintervals in the cross-sectional subgroup crossed zero. These find-ings emphasize the importance of measuring predictors of aca-demic GPA using prospective (rather than cross-sectional or ret-rospective) designs.
Within-Domain Multivariate Models
Where possible, we conducted regression analyses to explorethe extent to which multivariate models explained cumulativevariance in GPA within the five identified research domains.Procrastination, arguably a facet of conscientiousness (Steel,2007), explained somewhat greater variance in GPA than didconscientiousness itself, suggesting that procrastination may beprimarily, although not necessarily exclusively, responsible for theeffect of conscientiousness on tertiary GPA. These measures com-bined accounted for 7% of the variance. Two separate modelsrevealed that need for cognition and emotional intelligence ex-plained additional variance controlling for conscientiousness. Bothmodels accounted for 5% of the variance in GPA. Althoughpersonality measures showed only small-sized associations withGPA, these results demonstrate that traits other than those speci-fied by the five-factor model may be important to assessing stu-dents’ potential.
A model of three motivational constructs (academic self-efficacy, grade goal, and locus of control) explained 14% ofvariance in GPA, with grade goal being the strongest predictor,followed by academic self-efficacy. Locus of control was not a
useful predictor in this multivariate model, underlining the impor-tance of goal setting and self-efficacy.
In the self-regulatory learning domain, a model including sixbehavioral and cognitive learning strategies accounted for 11% ofthe variance. Effort regulation was the strongest predictor, fol-lowed by metacognition; the remaining measures (elaboration,critical thinking, help seeking, and time/study management) hadnegligible effects.
The three learning styles—deep, strategic, and surface (nega-tively correlated)—accounted for 9% of the variance and werefound to be independent of one another in a multivariate model.Strategic and surface learning were identified as the strongestpredictors.
Collectively, these within-domain, multivariate models indicatethat, in addition to the four medium-sized non-intellective corre-lates of GPA (i.e., effort regulation, academic self-efficacy, per-formance self-efficacy, and grade goals), aspects of conscientious-ness, procrastination, need for cognition, emotional intelligence,metacognition, deep, surface, and strategic learning styles may beindependent predictors of GPA.
Cross-Domain Multivariate Models and AssessmentInventories
Ideally we would have drawn upon multiple, multivariate, pro-spective studies including the strongest correlates of tertiary GPA.Over 13 years of research, however, few such studies have beenreported. Consequently, our cross-domain regression analyseswere severely limited. We conclude that available data do notpermit testing of a comprehensive and parsimonious model offactors that most strongly influence university students’ academicattainment (the fifth research challenge we identified). Conse-quently, at present, construction of integrative, cross-domain, the-ories modeling predictors of GPA lacks empirical foundation.
Our analysis indicated that, combined, measures of effort reg-ulation, test anxiety, academic self-efficacy, and grade goal ac-counted for 20% of the variance in GPA. This figure is comparablewith the 22% of variance explained by high school GPA andSAT/ACT. After controlling for traditional intellective constructsan additional 6% of the variance in GPA was explained by effortregulation, academic self-efficacy, and grade goals. Conscientious-ness and test anxiety did not explain additional variance. Whentraditional predictors were excluded, grade goal was the strongestpredictor among non-intellective measures; however, controllingfor SAT/ACT and high school GPA, effort regulation became thestrongest predictor and test anxiety was reduced to nonsignifi-cance. This emergence of effort regulation may emphasize theimportance of students’ volitional capacities in addition to perfor-mance-related cognitions (Gollwitzer, 1990; Kuhl, 2000). Aca-demic self-efficacy and grade goal measures may be stronglyshaped by performance feedback (Locke & Latham, 1990), which,in academia, is mainly constituted by grade attainment on assign-ments and exams (Wood & Locke, 1987). Consequently, thesecognitions are expected to stabilize with university experience andto have greater predictive validity once skills and performancelevels are established (Bandura, 1997; Lent & Brown, 2006). Theupshot may be that self-efficacy and grade goal measures are moreclosely related to measures of cognitive ability (e.g., SAT/ACT)than is effort regulation. If so, this could limit the effectiveness of
373NON-INTELLECTIVE CORRELATES OF ACADEMIC PERFORMANCE

interventions focusing on grade goal setting and academic self-efficacy enhancement, but experimental data are needed to testthese hypotheses.
Crucially, the effect of performance-related cognitions (includ-ing grade goals and academic self-efficacy) and that of specificself-regulatory learning and motivational constructs are likely tobe more strongly related with more narrowly defined achievementoutcomes, such as task or test achievement (Judge, Jackson, Shaw,Scott, & Rich, 2007), than with more global indexes of GPA (e.g.,course and cumulative GPA). As such, these current data are likelyto underestimate the impact of these influences on academicachievement. Further prospective research is needed to explore thishypothesis.
The additional variance in GPA explained by effort regulation,academic self-efficacy, and grade goal may be augmented by otherconstructs we could not include. For example, we could notinclude performance self-efficacy (the largest average bivariatecorrelate of GPA) in cross-domain models, so the relationshipbetween these self-predictions of grade attainment and more gen-eral measures of academic self-efficacy remains unclear. Simi-larly, evaluation of the theoretical and practical importance of the22 small-sized correlates identified here requires further multivar-iate, prospective research. For example, the effects of learningstyles—which, arguably, assess more stable aspects of motivationand self-regulatory capacities—may be mediated by more specificmotivation and self-regulatory constructs (e.g., critical thinking,elaboration, metacognition).
Despite the limitations of the available evidence, practical im-plications are evident. Our results indicate that a combination ofmotivation (academic self-efficacy, performance efficacy, gradegoal) and self-regulatory capacity (effort regulation) predicts ter-tiary GPA. Table 3 shows how measures in two current multimea-sure assessment inventories, the MSLQ and LASSI, map ontoconstructs included in our analyses (as listed in Table 1). TheMSLQ includes two of the four strongest correlates identified here(academic self-efficacy and effort regulation), whereas only effortregulation is included in the LASSI. Of the 22 small correlates ofGPA identified in the current review, eight are included in theMSLQ and five are included in the LASSI. The LASSI comprisesmainly cognitive (e.g., elaboration) and behavioral (e.g., effortregulation) self-regulatory learning strategies, whereas equal em-phasis is given to self-regulatory learning and motivational factorsin the MSLQ. Our findings strongly suggest that inclusion offurther measures, especially performance-related cognitions, couldenhance the predictive utility of these tests. Different sets ofconstructs may be important to (a) the assessment and (b) theenhancement of students’ potential, because even when cognitionsor capacities cannot be easily modified they may add to theprediction of students’ performance. This may be especially infor-mative in countries and places where cognitive-ability-based as-sessments are not routinely employed in tertiary-level education(e.g., in the United Kingdom). Therefore, inventories of psychos-ocial factors may be particularly helpful in identifying studentswho might benefit from interventions that target improved learningand performance.
Development of an improved multimeasure assessment instru-ment would provide more parsimonious and reliable assessmentsfor students and teachers. Moreover, administration of such aninstrument among large, representative student samples in pro-
spective studies could greatly advance theory development in thisfield.
Comparison With Previous Reviews
Our results confirmed Robbins et al.’s (2004) conclusions thateffort regulation and academic self-efficacy are important corre-lates of tertiary GPA. In addition, the data show that cognitionsspecific to academic performance (i.e., performance self-efficacyand grade goal) were the strongest correlates of GPA. The datathus emphasize the importance of goal setting and task-specificself-efficacy.
In a meta-analytic review of the five-factor model of personalityand academic performance, Poropat (2009) found that conscien-tiousness was the only useful predictor of tertiary GPA, controllingfor high school GPA (also see O’Connor & Paunonen, 2007). Ourresults support this conclusion, emphasizing that procrastinationmay be especially handicapping for tertiary-level students. How-ever, our findings also highlight the potential influence of non-five-factor traits, specifically, need for cognition and emotionalintelligence, which explained unique variance in GPA, controllingfor conscientiousness.
Poropat (2009) found that conscientiousness added slightlymore to GPA prediction than did intelligence and concluded thatconscientiousness was a “comparatively important predictor” (p.330). Yet in our cross-domain model, combining correlates iden-tified by Robbins et al. (2004) and Poropat, conscientiousness didnot add to the variance explained. The effect of conscientiousnesswas attenuated once effort regulation was added to the model. Alarge correlation was observed between conscientiousness andeffort regulation (r� � .53), suggesting a potential mediationmodel (Richardson & Abraham, 2009). Future studies could prof-itably explore whether effort regulation is most usefully concep-tualized as self-regulatory strategy (as in our review) or regardedas a domain-specific facet of conscientiousness. The latter pro-posal is consistent with Roberts and Wood’s (2006) neo-socioanalytic theory, which provides a distal-proximal frameworkfor integrating personality, motivation, and ability factors at dif-ferent levels of abstraction. Such distal-proximal, cross-domain,construct relationships can be specified when constructs are cor-related and defined so as to relate to common, theoretically spec-ified mechanisms (Roberts & Wood, 2006). Future multivariate,prospective studies are required to test such models.
Contrary to previous reviews of goal orientation (e.g., Payne etal., 2007), our results indicate that performance avoidance goals(not learning orientation goals) are most strongly related to GPA.Consistent with Payne et al. (2007), performance approach orien-tation was found to be a relatively unimportant predictor. Recentresearch has indicated that associations with goal orientation con-structs differ depending on the measures employed and the so-ciodemographic characteristics of the sample. Measures of perfor-mance-approach goal orientation comprising mainly normativelyreferenced measures have been found to be positively correlatedwith GPA, whereas measures composed mainly of appearance andevaluative items are negatively correlated (Hulleman, Schrager,Bodmann, & Harackiewicz, 2010). We concur with Hulleman etal.’s call for greater theory–measurement consistency. Our attemptto integrate this literature has highlighted how a lack of correspon-dence between theoretically specified mechanisms and corre-
374 RICHARDSON, ABRAHAM, AND BOND

sponding measures impedes evidence synthesis and may slow theresolution of key research questions.
Limitations of This Review
Systematic search techniques were employed to overcome theproblem of selection bias, but, unavoidably, five of the univariateanalyses were based on five or fewer independent correlations, sorestricting the generalizability of findings. The decision to includeonly published studies could have artificially inflated effect sizeestimates (Rosenthal, 1979), but with the exception of two mea-sures, namely, ACT and metacognition, Duval and Tweedie’s(2000) trim and fill analysis indicated that, in general, publicationbias is not a problem for these data.
Range restriction was not coded, so findings may generalizeonly to students already at university. This coincides with the aimof developing assessment instruments for university students, butfindings may not be directly applicable to university admissionsdecisions. Moreover, few studies sampled students in their firstyear, so the feasibility of long-range GPA prediction, includingthat focusing on university applicants, remains to be demonstratedby future, prospective studies.
Insufficient data prevented examination of additional method-ological and theoretical moderators including student characteris-tics (e.g., race, age, sex, socioeconomic status), performance cri-terion (e.g., test score and coursework grade), and contextualfactors (e.g., institutional type). Many confidence intervals andcritical values were wide or crossed zero, so the identification ofmoderators is an important goal for future research.
Regression analyses examining the relative contribution of non-intellective factors required synthesizing correlation matrices de-spite substantial missing data. Few studies included all the inde-pendent variables, and many included only one. Substantialmissing data in pooled correlation matrices are likely to result inbias, especially where, under a random effects model, variability inpopulation effect sizes is expected. However, the magnitude anddirection of this bias and the effects on the regression analysescannot be determined.
Our review and the specification of mechanistic models of tertiary-level students’ performance are limited by the nature of theoreticaland empirical work in this area. A wide range of constructs has beeninvestigated in small subsets in many separate studies. Constructsappear to have been defined by researchers working in particulardomains, for example, those focusing on motivational or person-ality theories, without specification of cross-domain mechanisms.Thus, there is considerable conceptual and item-content overlapacross measures. Our evidence synthesis was also hampered by useof variable descriptions of the same constructs across studies.Moreover, several separate measures have been used to assesssome constructs (see Table 2), with only a few derived from arigorous psychometric development process. Overall, the currentrange of potential antecedents of tertiary GPA is indicative of aproliferation of measures representing fewer underlying mechanis-tic constructs, making theoretical integration difficult (Eccles &Wigfield, 2002). We conclude that the challenge for researchers inthis field is to distill available constructs and measures into aparsimonious, mechanistic model of antecedents of tertiary-levelacademic achievement represented by reliable, standardized mea-
sures that enable short- and long-term prediction of universityperformance.
Developing Interventions to Enhance UniversityStudents’ Performance
Until theoretical models are supported by prospective and ex-perimental data, the design of interventions to optimize students’performance will remain a project of invention rather than appliedscience. Nonetheless, the research reviewed here suggests somepotentially effective strategies.
Measures of students’ grade goals were among the largestcorrelates of GPA, suggesting that goal-setting interventions couldbe effective. Goal theory (Locke & Latham, 1990) recommendssetting goals that are specific, challenging, and located within timeand context. In a brief goal-setting intervention, Latham andBrown (2006) reported that GPA was significantly higher amongstudents who set their own learning goals than students who setdistal performance goals. However, students who set proximalgoals (including grade goals), in addition to distal outcome goals,achieved higher GPAs than those who set only distal goals or thosewho were urged to do their best. Students might also be encour-aged to set goals relating to other correlates (e.g., goals relating tohelp seeking from teachers, avoiding procrastination, or establish-ing study routines).
Goal setting may also boost effort regulation (another of thestrongest correlates) in the form of plans to persist when tasks aredifficult. Even if effort regulation and test anxiety are conceptu-alized as traits rather than learned competencies, evidence suggeststhat personality traits may be modifiable (e.g., Mroczek & Spiro,2003) and lower level dispositions may be more malleable (Rob-erts & Wood, 2006). Hence, interventions to boost effort regula-tion and to develop self-management competencies to reduce testanxiety may be effective, especially if targeted on the basis ofstudent screening.
Academic and performance self-efficacy were important predic-tors. Self-efficacy enhancement may be an especially importanttarget because self-efficacy beliefs are partially mediated by mea-sures of grade goal (Chen et al., 2000) and are deemed to bemodifiable at a relatively low cost. Bandura (1997) specified fourmethods for raising self-efficacy, including the facilitation of vi-carious learning, mastery experiences, reattribution of responses tophysiological sensations, and persuasive communication. Moredetailed specifications of effective self-efficacy enhancement tech-niques are available (Abraham, 2012; Ashford, Edmunds, &French, 2010). Teachers’ behaviors are likely to be important forboosting and maintaining students’ self-efficacy. Setting gradedtasks, providing feedback on successful performance, and lower-ing students’ anxiety and stress about coursework, exams, andpresentations promote mastery experiences and thereby increaseself-efficacy (Stock & Cervone, 1990).
Interventions early in students’ university career may be mosteffective because the strongest correlates identified here, perfor-mance self-efficacy and grade goals, are likely to be more fluidduring the early stages of skill development (Chen et al., 2000;Lent & Brown, 2006). However, the malleability of these keycorrelates of performance remains to be established by interven-tion trials. For example, if grade goal is dependent on previousfeedback, which, in turn, is predicted by cognitive ability, setting
375NON-INTELLECTIVE CORRELATES OF ACADEMIC PERFORMANCE

grade targets may not be an effective performance-enhancementtechnique. This remains an empirical question.
Multifaceted interventions may be more effective (Hattie,Biggs, & Purdie, 1996), but interventions targeting specific cog-nitive changes—for example, elevated grade goals, increased ef-fort regulation, reduced test anxiety, reduced procrastination, andenhanced self-efficacy—could be more cost effective. Moreover,experimental evaluation of such interventions with appropriatemeasurement of potentially mediating constructs would provideempirical tests of hypothesized relationships between key predic-tors of tertiary GPA, thereby advancing our understanding ofunderlying mechanisms.
Finally, although caring for students’ well-being is a worthwhileaim in itself, our results suggest that performance-focused inter-ventions are more likely to enhance students’ academic achieve-ment (e.g., reducing text anxiety rather than more general coun-seling or stress management services).
Conclusions
This review of 13 years of research into the correlates oftertiary-level GPA highlights the wealth of theoretical elaborationand empirical testing that has been devoted to understanding whysome undergraduates perform better than others. We hope that ourintegration and synthesis of this work will provide a foundation formore focused research and intervention. To this end, we concludewith four recommendations for future research.
Defining measures. Theoretical and intervention develop-ment will be best served by cross-domain collaboration to teststandardized, reliable measures derived from clearly specifiedprocess models. We recommend that researchers work towardestablishment of distinct constructs identified by consensuallyaccepted labels and measured with scales that have been tested fortheir psychometric properties. We believe that this focus wouldresult in identification of fewer key predictors of GPA.
The present findings suggest improvements to current assess-ment inventories, in particular, inclusion of the strongest correlatesof tertiary GPA. Whether or not key correlates of GPA are subjectto effective intervention, they may be useful, independent predic-tors of subsequent performance.
Conducting multivariate prospective studies. Further pro-spective studies testing multivariate models with large samples areneeded. Ideally, these would include applicants (before arrival)and first-year students followed up through their student careers.Such studies should control for prior educational attainment (atschool) and include a range of previously tested cross-domainpredictors. Neo-socioanalytic theory, goal theory, and social cog-nitive theory provide useful theoretical frameworks upon whichintegrative model testing could be based. It is also critical thatresearch reports provide sufficient detail to facilitate exact repli-cation and allow synthesis of findings in meta-analyses. Suchresearch has the capacity to clarify the strongest predictors con-trolling for a range of correlates and so identify mediating pro-cesses.
Exploring moderators. Equal attention should be paid toidentification of conditions that facilitate operation of predictivemodels of tertiary-level achievement. Research on methodologicaland theoretical moderating factors exploring when and for whom
particular processes or changes influence academic achievementwould be theoretically and practically informative.
Testing specific, process-focused interventions. Finally,our review and others have identified a series of potentially mod-ifiable medium-to-large correlates of tertiary GPA, in particular,academic and performance self-efficacy, grade goal setting, andeffort regulation. It would be valuable to have experimental dataon how easily such cognitions and self-regulatory capacities can bechanged, as well as for whom, over what time period, and to whatextent do such changes impact on GPA scores. Investment inprecisely targeted, theoretically based, interventions could helpstudents optimize their potential and would provide empirical testsof proposed process models of tertiary achievement.
References
References marked with an asterisk indicate studies included in themeta-analysis.
Abraham, C. (2012). Mapping change mechanisms and behaviour changetechniques: A systematic approach to promoting behaviour changethrough text. In C. Abraham & M. Kools (Eds.), Writing health com-munication: An evidence-based guide for professionals (pp. 99–116).London, England: Sage.
Abramson, L. Y., Metalsky, G. I., & Alloy, L. B. (1989). Hopelessnessdepression: A theory-based subtype of depression. Psychological Re-view, 96, 358–372. doi:10.1037/0033-295X.96.2.358
Ackerman, P. L., & Heggestad, E. D. (1997). Intelligence, personality, andinterests: Evidence for overlapping traits. Psychological Bulletin, 121,219–245. doi:10.1037/0033-2909.121.2.219
*Allen, D. (1999). Desire to finish college: An empirical link betweenmotivation and persistence. Research in Higher Education, 40, 461–485. doi:10.1023/A:1018740226006
*Andrews, B., & Wilding, J. M. (2004). The relation of depression andanxiety to life-stress and achievement in students. British Journal ofPsychology, 95, 509–521. doi:10.1348/0007126042369802
Ashford, S., Edmunds, J., & French, D. (2010). What is the best way tochange self-efficacy to promote lifestyle and recreational physical ac-tivity? A systematic review with meta-analysis. British Journal ofHealth Psychology, 15, 265–288. doi:10.1348/135910709X461752
*Awad, G. H. (2007). The role of racial identity, academic self-concept,and self-esteem in the prediction of academic outcomes for AfricanAmerican students. Journal of Black Psychology, 33, 188–207. doi:10.1177/0095798407299513
Bacon, D. R., & Bean, B. (2006). GPA in research studies: An invaluablebut neglected opportunity. Journal of Marketing Education, 28, 35–42.doi:10.1177/0273475305284638
Bagby, R. M., Parker, J. D. A., & Taylor, G. J. (1994). The twenty-itemToronto Alexithymia Scale—I: Item selection and cross-validation ofthe factor structure. Journal of Psychosomatic Research, 38, 23–32.doi:10.1016/0022-3999(94)90005-1
Baker, R. W., & Siryk, B. (1984). Measuring adjustment to college.Journal of Counseling Psychology, 31, 179–189. doi:10.1037/0022-0167.31.2.179
*Baker, S. R. (2003). A prospective longitudinal investigation of socialproblem-solving appraisals on adjustment to university, stress, health,and academic motivation and performance. Personality and IndividualDifferences, 35, 569–591. doi:10.1016/S0191-8869(02)00220-9
*Bandalos, D. L., Finney, S. J., & Geske, J. A. (2003). A model of statisticsperformance based on achievement goal theory. Journal of EducationalPsychology, 95, 604–616. doi:10.1037/0022-0663.95.3.604
Bandura, A. (1997). Self-efficacy: The exercise of control. New York, NY:Freeman.
*Barchard, K. A. (2003). Does emotional intelligence assist in the predic-
376 RICHARDSON, ABRAHAM, AND BOND

tion of academic success? Educational and Psychological Measurement,63, 840–858. doi:10.1177/0013164403251333
Bar-On, R. (1997). Emotional Quotient Inventory: Technical manual.Toronto, Ontario, Canada: Multi-Health Systems.
Bar-On, R. (2002). Bar On Emotional Quotient Short Form (EQ-i:Short):Technical manual. Toronto, Ontario, Canada: Multi-Health Systems.
Barrick, M. R., Mount, M. K., & Strauss, J. P. (1993). Conscientiousnessand performance of sales representatives: Test of the mediating effectsof goal setting. Journal of Applied Psychology, 78, 715–722. doi:10.1037/0021-9010.78.5.715
*Barron, K. E., & Harackiewicz, J. M. (2003). Revisiting the benefits ofperformance-approach goals in the college classroom: Exploring the roleof goals in advanced college courses. International Journal of Educa-tional Research, 39, 357–374. doi:10.1016/j.ijer.2004.06.004
*Bauer, K. W., & Liang, Q. (2003). The effect of personality and pre-college characteristics on first year activities and academic performance.Journal of College Student Development, 44, 277–290.
Bean, J. P. (1980). Dropouts and turnover: The synthesis and test of acausal model of student attrition. Research in Higher Education, 12,155–187. doi:10.1007/BF00976194
Bean, J. P. (1985). Interaction effects based on class level in an explanatorymodel of college student dropout syndrome. American EducationalResearch Journal, 22, 35–64. doi:10.2307/1162986
Bean, J. P., & Metzner, B. S. (1985). A conceptual model of nontraditionalundergraduate student attrition. Review of Educational Research, 55,485–540. doi:10.2307/1170245
Beck, A. T., Ward, C. H., Mendelson, M., Mock, J., & Erbaugh, J. (1961).An inventory for measuring depression. Archives of General Psychiatry,4, 561–571. Retrieved from http://archpsyc.ama-assn.org/contents-by-date.0.dtl
*Beck, H. P., & Davidson, W. D. (2001). Establishing an early warningsystem: Predicting low grades in college students from Survey of Aca-demic Orientations scores. Research in Higher Education, 42, 709–723.Retrieved from http://www.springer.com/education�%26�language/higher�education/journal/11162
Benet-Martınez, V., & John, O. P. (1998). Los Cinco Grandes acrosscultures and ethnic groups. Multitrait–multimethod analyses of the BigFive in Spanish and English. Journal of Personality and Social Psychol-ogy, 75, 729–750. doi:10.1037/0022-3514.75.3.729
Bermudez, J. (1999). Personality and health-protective behaviour. Euro-pean Journal of Personality, 13, 83–103. doi:10.1002/(SICI)1099-0984(199903/04)13:2�83::AID-PER3383.0.CO;2-M
*Beyers, W., & Goossens, L. (2002). Concurrent and predictive validity ofthe Student Adaptation to College Questionnaire in a sample of Euro-pean freshman students. Educational and Psychological Measurement,62, 527–538. doi:10.1177/00164402062003009
*Bidjerano, T., & Dai, D. Y. (2007). The relationship between the Big-Fivemodel of personality and self-regulated learning strategies. Learning andIndividual Differences, 17, 69–81. doi:10.1016/j.lindif.2007.02.001
Biggs, J. B. (1987). The Learning Process Questionnaire (LPQ): Manual.Hawthorn, Victoria, Australia: Australian Council for Educational Re-search.
Binet, A., & Simon, T. (1916). The development of intelligence in children(E. S. Kit, Trans.). Baltimore, MD: Williams & Wilkins.
*Black, A. E., & Deci, E. L. (2000). The effects of instructors’ autonomysupport and students’ autonomous motivation on learning organic chem-istry: A self-determination theory perspective. Science Education, 84,740–756. doi:10.1002/1098-237X(200011)
*Bodmann, S., Hulleman, C. S., & Harackiewicz, J. M. (2008). Achieve-ment goal systems: An application of goal systems theory to achieve-ment goal research. International Review of Social Psychology, 21,71–96.
Boekaerts, M., & Corno, L. (2005). Self-regulation in the classroom: A
perspective on assessment and intervention. Applied Psychology, 54,199–231. doi:10.1111/j.1464-0597.2005.00205.x
Borenstein, M., Hedges, L., Higgins, J., & Rothstein, H. (2009). Introduc-tion to meta-analysis. Chichester, England: Wiley.
Borenstein, M., Hedges, L., Higgins, J., & Rothstein, H. (2010). A basicintroduction to fixed-effect and random-effects models for meta-analysis. Research Synthesis Methods, 1, 97–111. doi:10.1002/jrsm.12
*Bors, D. A., Vigneau, F. O., & Lalande, F. (2006). Measuring the need forcognition: Item polarity, dimensionality, and the relation with ability.Personality and Individual Differences, 40, 819–828. doi:10.1016/j.paid.2005.09.007
Boyle, E. A., Duffy, T., & Dunleavy, K. (2003). Learning styles and academicoutcome: The validity and utility of Vermunt’s Inventory of Learning Styles ina British higher education setting. British Journal of Educational Psychology,73, 267–290. doi:10.1348/00070990360626976
*Brackett, M. A., Mayer, J. D., & Warner, R. M. (2004). Emotionalintelligence and its relation to everyday behaviour. Personality andIndividual Differences, 36, 1387–1402. doi:10.1016/S0191-8869(03)00236-8
Bridgeman, B., Pollack, J., & Burton, N. (2004). Understanding what SATReasoning Test scores add to high school grades: A straightforwardapproach (College Board Rep. No. 2004–4). Retrieved from http://professionals.collegeboard.com/profdownload/pdf/041434RDCBR04 –4dc.pdf
*Bridges, K. R. (2001). Using attributional style to predict academicperformance: How does it compare to traditional methods? Personalityand Individual Differences, 31, 723–730. doi:10.1016/S0191-8869(00)00174-4
*Brockelman, K. F. (2009). The interrelationship of self-determination,mental illness, and grades among university students. Journal of CollegeStudent Development, 50, 271–286.
*Brown, C., Garavalia, L. S., Fritts, M. L. H., & Olson, E. A. (2006).Computer science majors: Sex role orientation, academic achievement,and social cognitive factors. Career Development Quarterly, 54, 331–345.
*Buddington, S. A. (2002). Acculturation, psychological adjustment(stress, depression, self-esteem) and the academic achievement of Ja-maican immigrant college students. International Social Work, 45, 447–464. doi:10.1177/00208728020450040401
Busato, V. V., Prins, F. J., Elshout, J. J., & Hamaker, C. (1998). Therelation between learning styles, the Big Five personality traits andachievement motivation in higher education. Personality and IndividualDifferences, 26, 129–140. doi:10.1016/S0191-8869(98)00112-3
*Busato, V. V., Prins, F. J., Elshout, J. J., & Hamaker, C. (2000). Intel-lectual ability, learning style, personality, achievement motivation andacademic success of psychology students in higher education. Person-ality and Individual Differences, 29, 1057–1068. doi:10.1016/S0191-8869(99)00253-6
Button, S. B., Mathieu, J. E., & Zajac, D. M. (1996). Goal orientation inorganizational research: A conceptual and empirical foundation. Orga-nizational Behavior and Human Decision Processes, 67, 26–48. doi:10.1006/obhd.1996.0063
*Byrne, M., Flood, B., & Willis, P. (2002). The relationship betweenlearning approaches and learning outcomes: A study of Irish accountingstudents. Accounting Education, 11, 27– 42. doi:10.1080/09639280210153254
Cabrera, A. F. (1988). Students’ Experiences Survey. Houston, TX: Uni-versity of Houston.
Cabrera, A. F., Nora, A., & Castaneda, M. B. (1993). College persistence:Structural equation modeling test of an integrated model of studentretention. Journal of Higher Education, 64, 123–139. doi:10.2307/2960026
Cacioppo, J. T., & Petty, R. E. (1982). The need for cognition. Journal of
377NON-INTELLECTIVE CORRELATES OF ACADEMIC PERFORMANCE

Personality and Social Psychology, 42, 116–131. doi:10.1037/0022-3514.42.1.116
Cacioppo, J. T., Petty, R. E., & Kao, C. F. (1984). The efficient assessmentof need for cognition. Journal of Personality Assessment, 48, 306–307.doi:10.1207/s15327752jpa4803_13
*Cano, F., & Berben, A. B. G. (2009). University students’ achievementgoals and approaches to learning in mathematics. British Journal ofEducational Psychology, 79, 131–153. doi:10.1348/000709908x314928
*Carden, R., Bryant, C., & Moss, R. (2004). Locus of control, test anxiety,academic procrastination, and achievement among college students.Psychological Reports, 95, 581–582. doi:10.2466/PR0.95.6.581-582
Carpenter, P. A., Just, M. A., & Shell, P. (1990). What one intelligence testmeasures: A theoretical account of the processing in the Raven Progres-sive Matrices Test. Psychological Review, 97, 404–431. doi:10.1037/0033-295X.97.3.404
Carver, C. S., & Scheier, M. F. (1981). A control-systems approach tobehavioral self-regulation. In L. Wheeler (Ed.), Review of personalityand social psychology (Vol. 2, pp. 107–140). Beverly Hills, CA: Sage.
*Cassidy, S., & Eachus, P. (2000). Learning style, academic belief sys-tems, self-report student proficiency and academic achievement inhigher education. Educational Psychology, 20, 307–320. doi:10.1080/713663740
Cattell, R. B., Cattell, A. K., & Cattell, H. E. (1993). Sixteen PersonalityFactor Questionnaire (5th ed.). Champaign, IL: Institute for Personalityand Ability Testing.
*Ceyhan, E., Ceyhan, A. A., & Kurtyilmaz, Y. (2005). Depression amongTurkish female and male university students. Social Behavior and Per-sonality, 33, 329–339. doi:10.2224/sbp.2005.33.4.329
*Chamorro-Premuzic, T. (2006). Creativity versus conscientiousness:Which is a better predictor of student performance? Applied CognitivePsychology, 20, 521–531. doi:10.1002/acp.1196
Chamorro-Premuzic, T., & Furnham, A. (2002). Neuroticism and “specialtreatment” in examinations. Social Behavior and Personality, 30, 807–811. doi:10.2224/sbp.2002.30.8.807
*Chamorro-Premuzic, T., & Furnham, A. (2003a). Personality predictsacademic performance: Evidence from two longitudinal university sam-ples. Journal of Research in Personality, 37, 319–338. doi:10.1016/S0092-6566(02)00578-0
*Chamorro-Premuzic, T., & Furnham, A. (2003b). Personality traits andacademic examination performance. European Journal of Personality,17, 237–250. doi:10.1002/per.473
Chamorro-Premuzic, T., & Furnham, A. (2008). Personality, intelligenceand approaches to learning as predictors of academic examination per-formance. Personality and Individual Differences, 44, 1596–1603. doi:10.1016/j.paid.2008.01.003
*Chamorro-Premuzic, T., Furnham, A., & Ackerman, P. L. (2006). Incre-mental validity of the Typical Intellectual Engagement Scale as predictorof different academic performance measures. Journal of PersonalityAssessment, 87, 261–268. doi:10.1207/s15327752jpa8703_07
*Chamorro-Premuzic, T., Quiroga, M. A., & Colom, R. (2009). Intellectualcompetence and academic performance: A Spanish study. Learning andIndividual Differences, 19, 486–491. doi:10.1016/j.lindif.2009.05.002
*Chapell, M. S., Blanding, Z. B., Silverstein, M. E., Takahashi, M.,Newman, B., Gubi, A., & McCann, N. (2005). Test anxiety and aca-demic performance in undergraduate and graduate students. Journal ofEducational Psychology, 97, 268–274. doi:10.1037/0022-0663.97.2.268
*Chapman, B. P., & Hayslip, B. (2005). Incremental validity of a measureof emotional intelligence. Journal of Personality Assessment, 85, 154–169. doi:10.1207/s15327752jpa8502_08
*Chen, G., Gully, S. M., Whiteman, J. A., & Kilcullen, R. N. (2000).Examination of relationships among trait-like individual differences,state-like individual differences, and learning performance. Journal ofApplied Psychology, 85, 835–847. doi:10.1037/0021-9010.85.6.835
*Cheng, W., & Ickes, W. (2009). Conscientiousness and self-
motivation as mutually compensatory predictors of university-levelGPA. Personality and Individual Differences, 47, 817– 822. doi:10.1016/j.paid.2009.06.029
Cheung, M. W. L. (2009). TSSEM: A LISREL syntax generator fortwo-stage structural equation modeling (Version 1.11) [Computer soft-ware and manual]. Retrieved from http://courses.nus.edu.sg/course/psycwlm/internet/tssem.zip
Cheung, M. W. L., & Chan, W. (2005). Meta-analytic structural equationmodeling: A two-stage approach. Psychological Methods, 10, 40–64.doi:10.1037/1082-989X.10.1.40
Cheung, M. W. L., & Chang, W. (2009). A two-stage approach to synthe-sizing covariance matrices in meta-analytic structural equation model-ing. Structural Equation Modeling, 16, 28 –53. doi:10.1080/10705510802561295
*Choi, J. N., & Moran, S. V. (2009). Why not procrastinate? Developmentand validation of a new active procrastination scale. Journal of SocialPsychology, 149, 195–212. doi:10.3200/SOCP.149.2.195-212
*Choi, N. (2005). Self-efficacy and self-concept as predictors of collegestudents’ academic performance. Psychology in the Schools, 42, 197–205. doi:10.1002/pits.20048
*Christensen, L. M. (2009). Enhancing law school success: A study of goalorientations, academic achievement and the declining self-efficacy ofour law students. Law & Psychology Review, 33, 57–92. Retrieved fromhttp://lawteaching.org/articles/fulltext/201005-enhancinglawschoolsuccess
*Chu, A. H. C., & Choi, J. N. (2005). Rethinking procrastination: Positiveeffects of “active” procrastination behavior on attitudes and perfor-mance. Journal of Social Psychology, 145, 245–264. doi:10.3200/SOCP.145.3.245-264
*Church, M. A., Elliot, A. J., & Gable, S. L. (2001). Perceptions ofclassroom environment, achievement goals, and achievement outcomes.Journal of Educational Psychology, 93, 43–54. doi:10.1037/0022-0663.93.1.43
*Clifton, R. A., Perry, R. P., Roberts, L. W., & Peter, T. (2008). Gender,psychosocial dispositions and the academic achievement of collegestudents. Research in Higher Education, 49, 684–703. doi:10.1007/s11162-008-9104-9
Cochran, W. G. (1954). The combination of estimates from differentexperiments. Biometrics, 10, 101–129.
Cohen, J. (1992). A power primer. Psychological Bulletin, 112, 155–159.doi:10.1037/0033-2909.112.1.155
Cohen, S., Kamarck, T., & Mermelstein, R. (1983). A global measure ofperceived stress. Journal of Health and Social Behavior, 24, 385–396.doi:10.2307/2136404
*Cokley, K. (2000). An investigation of academic self-concept and itsrelationship to academic achievement in African American college stu-dents. Journal of Black Psychology, 26, 148 –164. doi:10.1177/0095798400026002002
*Cole, B., Matheson, K., & Anisman, H. (2007). The moderating role ofethnic identity and social support on relations between well-being andacademic performance. Journal of Applied Social Psychology, 37, 592–615. doi:10.1111/j.1559-1816.2007.00176.x
*Conard, M. A. (2006). Aptitude is not enough: How personality andbehavior predict academic performance. Journal of Research in Person-ality, 40, 339–346. doi:10.1016/j.jrp.2004.10.003
Corno, L. (1989). Self-regulated learning: A volitional analysis. In B. J.Zimmerman & D. H. Schunk (Eds.), Self-regulated learning and aca-demic achievement: Theory, research and practice (pp. 111–141). NewYork, NY: Springer-Verlag.
Corno, L. (1993). The best-laid plans: Modern conceptions of volition andeducational research. Educational Researcher, 22, 14–22. doi:10.2307/1176169
Costa, P. T., Jr., & McCrae, R. R. (1992). NEO-PI–R professional manual.Odessa, FL: Psychological Assessment Resources.
*Cote, J. E., & Levine, C. (1997). Student motivations, learning environ-
378 RICHARDSON, ABRAHAM, AND BOND
ments, and human capital acquisition: Toward an integrated paradigm ofstudent development. Journal of College Student Development, 38,229–243.
Covington, M. V. (1998). The will to learn. New York, NY: CambridgeUniversity Press.
Covington, M. V. (1992). Making the grade: A self-worth perspective onmotivation and school reform. New York, NY: Cambridge UniversityPress.
Craik, F. I. M., & Lockhart, R. S. (1972). Levels of processing: Aframework for memory research. Journal of Verbal Learning and VerbalBehavior, 11, 671–684. doi:10.1016/S0022-5371(72)80001-X
*Crede, M., & Niehorster, S. (2009). Individual difference influences onself-focused and other-focused counterproductive student behaviors.Personality and Individual Differences, 47, 769–776. doi:10.1016/j.paid.2009.06.018
Crede, M., & Phillips, L. A. (2011). A meta-analytic review of theMotivated Strategies for Learning Questionnaire. Learning and Individ-ual Differences, 21, 337–346. doi: 10.1016/j.lindif.2011.03.002
Crombag, H. F. M. (1968). Studie motivatie en studie attitude [Studymotivation and study attitude]. Groningen, the Netherlands: Walters.
Cronbach, L. J., & Meehl, P. E. (1955). Construct validity in psychologicaltests. Psychological Bulletin, 52, 281–302. doi:10.1037/h0040957
*Daniels, L. M., Haynes, T. L., Stupnisky, R. H., Perry, R. P., Newall,N. E., & Pekrun, R. (2008). Individual differences in achievement goals:A longitudinal study of cognitive, emotional, and achievement out-comes. Contemporary Educational Psychology, 33, 584 – 608. doi:10.1016/j.cedpsych.2007.08.002
*Daniels, L. M., Pekrun, R., Stupnisky, R. H., Haynes, T. L., Perry, R. P.,& Newall, N. E. (2009). A longitudinal analysis of achievement goals:From affective antecedents to emotional effects and achievement out-comes. Journal of Educational Psychology, 101, 948–963. doi:10.1037/a0016096
Dart, B. C., & Clarke, J. A. (1991). Helping students become betterlearners: A case study in teacher education. Higher Education, 22,317–335. doi:10.1007/BF00132294
*Day, E. A., Radosevich, D. J., & Chasteen, C. S. (2003). Construct- andcriterion-related validity of four commonly used goal orientation instru-ments. Contemporary Educational Psychology, 28, 434 – 464. doi:10.1016/S0361-476X(02)00043-7
deCharms, R. (1968). Personal causation: The internal affective determi-nants of behavior. New York, NY: Academic.
*Dennis, J. M., Phinney, J. S., & Chuateco, L. I. (2005). The role ofmotivation, parental support, and peer support in the academic successof ethnic minority first-generation college students. Journal of CollegeStudent Development, 46, 223–236. doi:10.1353/csd.2005.0023
Didier, T., Kreiter, C., Buri, R., & Solow, C. (2006). Investigating theutility of a GPA institutional adjustment index. Advances in HealthScience Education, 11, 145–153. doi:10.1007/s10459-005-0390-0
*Diefendorff, J. M. (2004). Examination of the roles of action-state orien-tation and goal orientation in the goal-setting and performance process.Human Performance, 17, 375–395. doi:10.1207/s15327043hup1704_2
*Diseth, A. (2002). The relationship between intelligence, approaches tolearning and academic achievement. Scandinavian Journal of Educa-tional Research, 46, 219–230. doi:10.1080/00313830220142218
*Diseth, A. (2003). Personality and approaches to learning as predictors ofacademic achievement. European Journal of Personality, 17, 143–155.doi:10.1002/per.469
*Diseth, A. (2007a). Approaches to learning, course experience and ex-amination grade among undergraduate psychology students: Testing ofmediator effects and construct validity. Studies in Higher Education, 32,373–388. doi:10.1080/03075070701346949
*Diseth, A. (2007b). Students’ evaluation of teaching, approaches to learn-ing, and academic achievement. Scandinavian Journal of EducationalResearch, 51, 185–204. doi:10.1080/00313830701191654
*Diseth, A., & Kobbeltvedt, T. (2010). A mediation analysis of achieve-ment motives, goals, learning strategies, and academic achievement.British Journal of Educational Psychology, 80, 671–687. doi:10.1348/000709910x492432
*Diseth, A., & Martinsen, O. (2003). Approaches to learning, cognitivestyle, and motives as predictors of academic achievement. EducationalPsychology, 23, 195–207. doi:10.1080/01443410303225
*Diseth, A., Pallesen, S., Brunborg, G. S., & Larsen, S. (2010). Academicachievement among first semester undergraduate psychology students:The role of course experience, effort, motives and learning strategies.Higher Education, 59, 335–352. doi:10.1007/s10734-009-9251-8
*Dompnier, B., Darnon, C., & Butera, F. (2009). Faking the desire to learn:A clarification of the link between mastery goals and academic achieve-ment. Psychological Science, 20, 939 –943. doi:10.1111/j.1467-9280.2009.02384.x
Dorans, N. J., Lyu, C. F., Pommerich, M., & Houston, W. M. (1997).Concordance between ACT assessment and recentered SAT I sumscores. College and University, 73, 24–35.
Duff, A. (1999). Access policy and approaches to learning. AccountingEducation, 8, 99–110. doi:10.1080/096392899330955
*Duff, A., Boyle, E., Dunleavy, K., & Ferguson, J. (2004). The relationshipbetween personality, approach to learning and academic performance.Personality and Individual Differences, 36, 1907–1920. doi:10.1016/j.paid.2003.08.020
Duncan, T. G., & McKeachie, W. J. (2005). The making of the MotivatedStrategies for Learning Questionnaire. Educational Psychologist, 40,117–128. doi:10.1207/s15326985ep4002_6
*Durik, A. M., Lovejoy, C. M., & Johnson, S. J. (2009). A longitudinalstudy of achievement goals for college in general: Predicting cumulativeGPA and diversity in course selection. Contemporary Educational Psy-chology, 34, 113–119. doi:10.1016/j.cedpsych.2008.11.002
Duval, S., & Tweedie, R. L. (2000). Trim and fill: A simple funnel-plot–based method of testing and adjusting for publication bias in meta-analysis. Biometrics, 56, 455– 463. doi:10.1111/j.0006-341X.2000.00455.x
Eccles, J. S., & Wigfield, A. (2002). Motivational beliefs, values, andgoals. Annual Review of Psychology, 53, 109 –132. doi:10.1146/annurev.psych.53.100901.135153
*Eisenberg, D., Golberstein, E., & Hunt, J. B. (2009). Mental health andacademic success in college. B.E. Journal of Economic Analysis &Policy, 9(1), Article 40. doi:10.2202/1935-1682.2191
*Elias, S. M., & Loomis, R. J. (2002). Utilizing need for cognition andperceived self-efficacy to predict academic performance. Journal ofApplied Social Psychology, 32, 1687–1702. doi:10.1111/j.1559-1816.2002.tb02770.x
Elkins, S. A., Braxton, J. M., & James, G. W. (2000). Tinto’s separationstage and its influence on first-semester college student persistence.Research in Higher Education, 41, 251–268. doi:10.1023/A:1007099306216
Elliot, A. J., & Church, M. A. (1997). A hierarchical model of approachand avoidance achievement motivation. Journal of Personality andSocial Psychology, 72, 218–232. doi:10.1037/0022-3514.72.1.218
*Elliot, A. J., & Church, M. A. (2003). A motivational analysis of defen-sive pessimism and self-handicapping. Journal of Personality, 71, 369–396. doi:10.1111/1467-6494.7103005
Elliot, A. J., & Harackiewicz, J. M. (1996). Approach and avoidanceachievement goals and intrinsic motivation: A mediational analysis.Journal of Personality and Social Psychology, 70, 461– 475. doi:10.1037/0022-3514.70.3.461
*Elliot, A. J., McGregor, H. A., & Gable, S. (1999). Achievement goals,study strategies, and exam performance: A mediational analysis. Journalof Educational Psychology, 91, 549 –563. doi:10.1037/0022-0663.91.3.549
Entwistle, N. J., Hanley, M., & Hounsell, D. (1979). Identifying distinctive
379NON-INTELLECTIVE CORRELATES OF ACADEMIC PERFORMANCE

approaches to studying. Higher Education, 8, 365–380. doi:10.1007/BF01680525
Entwistle, N. J., & Ramsden, P. (1983). Understanding student learning.London, England: Croom Helm.
*Eppler, M. A., Carsen-Plentl, C., & Harju, B. L. (2000). Achievementgoals, failure attributions, and academic performance in nontraditionaland traditional college students. Journal of Social Behavior and Per-sonality, 15, 353–372.
*Eppler, M. A., & Harju, B. L. (1997). Achievement motivation goals inrelation to academic performance in traditional and nontraditional col-lege students. Research in Higher Education, 38, 557–573. doi:10.1023/A:1024944429347
*Etcheverry, E., Clifton, R. A., & Roberts, L. W. (2001). Social capital andeducational attainment: A study of undergraduates in a faculty of edu-cation. Alberta Journal of Educational Research, 47, 24–39.
Everson, H. T. (August 2002). Innovation and change in the SAT: A designframework for future college admission tests. Retrieved from http://www.collegeboard.com/prod_downloads/about/association
Eysenck, H. J., & Eysenck, S. B. G. (1975). Manual of the EysenckPersonality Questionnaire. London, England: Hodder & Stoughton.
*Farsides, T., & Woodfield, R. (2007). Individual and gender differencesin “good” and “first-class” undergraduate degree performance. BritishJournal of Psychology, 98, 467–483. doi:10.1348/000712606X150246
*Fass, M. E., & Tubman, J. G. (2002). The influence of parental and peerattachment on college students’ academic achievement. Psychology inthe Schools, 39, 561–573. doi:10.1002/pits.10050
*Fazio, N. M., & Palm, L. J. (1998). Attributional style, depression, andgrade point averages of college students. Psychological Reports, 83,159–162. doi:10.2466/PR0.83.5.159-162
*Fenollar, P., Roman, S., & Cuestas, P. J. (2007). University students’academic performance: An integrative conceptual framework and em-pirical analysis. British Journal of Educational Psychology, 77, 873–891. doi:10.1348/000709907X189118
Field, A. P., & Gillett, R. (2010). How to do a meta-analysis. BritishJournal of Mathematical and Statistical Psychology, 63, 665–694. doi:10.1348/000711010X502733
*Finney, S. J., & Schraw, G. (2003). Self-efficacy beliefs in collegestatistics courses. Contemporary Educational Psychology, 28, 161–186.doi:10.1016/S0361-476X(02)00015-2
Fleischhauer, M., Enge, S., Brocke, B., Ullrich, J., Strobel, A., & Strobel,A. (2010). Same or different? Clarifying the relationship of need forcognition to personality and intelligence. Personality and Social Psy-chological Bulletin, 36, 82–96. doi:10.1177/0146167209351886
Fox, R. A., McManus, I. C., & Winder, B. C. (2001). The Shortened StudyProcess Questionnaire: An investigation of its structure and longitudinalstability using confirmatory factor analysis. British Journal of Educa-tional Psychology, 71, 511–530. doi:10.1348/000709901158659
*French, B. F., Immekus, J. C., & Oakes, W. C. (2005). An examination ofindicators of engineering students’ success and persistence. Journal ofEngineering Education, 94, 419–425.
Frey, M. C., & Detterman, D. K. (2004). Scholastic assessment or g? Therelationship between the SAT and general cognitive ability. Psycholog-ical Science, 15, 373–378. doi:10.1111/j.0956-7976.2004.00687.x
*Furnham, A., & Chamorro-Premuzic, T. (2004). Personality and intelli-gence as predictors of statistics examination grades. Personality andIndividual Differences, 37, 943–955. doi:10.1016/j.paid.2003
*Furnham, A., Chamorro-Premuzic, T., & McDougall, F. (2002). Person-ality, cognitive ability, and beliefs about intelligence as predictors ofacademic performance. Learning and Individual Differences, 14, 47–64.doi:10.1016/j.lindif.2003.08.002
Gardner, H. (1983). Frames of mind: The theory of multiple intelligences.New York, NY: Basic Books.
*Gaston-Gayles, J. L. (2004). Examining academic and athletic motivation
among student athletes at a Division 1 university. Journal of CollegeStudent Development, 45, 75–83. doi:10.1353/csd.2004.00057
*George, D., Dixon, S., Stansal, E., Gelb, S. L., & Pheri, T. (2008). Timediary and questionnaire assessment of factors associated with academicand personal success among university undergraduates. Journal ofAmerican College Health, 56, 706–715. doi:10.3200/jach.56.6.706-715
*Gerardi, S. (2005). Self-concept of ability as a predictor of academicsuccess among urban technical college students. Social Science Journal,42, 295–300. doi:10.1016/j.soscij.2005.03.007
*Gijbels, D., Van de Watering, G., Dochy, F., & Van den Bossche, P.(2005). The relationship between students’ approaches to learning andthe assessment of learning outcomes. European Journal of Psychologyof Education, 20, 327–341. doi:10.1007/BF03173560
Goff, M., & Ackerman, P. (1992). Personality–intelligence relations: As-sessment of typical intellectual engagement. Journal of EducationalPsychology, 84, 537–552. doi:10.1037/0022-0663.84.4.537
Goldberg, L. R. (1992). The development of markers for the Big-Fivefactor structure. Psychological Assessment, 4, 26–42. doi:10.1037/1040-3590.4.1.26
Goldberg, L. R. (1999). A broad-bandwidth, public domain, personalityinventory measuring the lower-level facets of several five-factor models.In I. Mervielde, I. Deary, F. De Fruyt, & F. Ostendorf (Eds.), Personalitypsychology in Europe (Vol. 7, pp. 7–28). Tilburg, the Netherlands:Tilburg University Press.
Gollwitzer, P. (1990). Action phases and mind-sets. In E. T. Higgins &R. M. Sorrentino (Eds.), Handbook of motivation and cognition (Vol. 2,pp. 53–92). New York, NY: Guilford Press.
*Gore, P. A. (2006). Academic self-efficacy as a predictor of collegeoutcomes: Two incremental validity studies. Journal of Career Assess-ment, 14, 92–115. doi:10.1177/1069072705281367
*Gramzow, R. H., Elliot, A. J., Asher, E., & McGregor, H. A. (2003).Self-evaluation bias and academic performance: Some ways and somereasons why. Journal of Research in Personality, 37, 41–61. doi:10.1016/S0092-6566(02)00535-4
*Grant, H., & Dweck, C. S. (2003). Clarifying achievement goals and theirimpact. Journal of Personality and Social Psychology, 85, 541–553.doi:10.1037/0022-3514.85.3.541
*Gray, E. K., & Watson, D. (2002). General and specific traits of person-ality and their relation to sleep and academic performance. Journal ofPersonality, 70, 177–206. doi:10.1111/1467-6494.05002
Greenwald, A. G. (1975). Consequences of prejudice against the nullhypothesis. Psychological Bulletin, 82, 1–20. doi:10.1037/h0076157
*Grzegorek, J. L., Slaney, R. B., Franze, S., & Rice, K. G. (2004).Self-criticism, dependency, self-esteem, and grade point average satis-faction among clusters of perfectionists and nonperfectionists. Journal ofCounseling Psychology, 51, 192–200. doi:10.1037/0022-0167.51.2.192
*Halamandaris, K. F., & Power, K. G. (1999). Individual differences,social support and coping with the examination stress: A study of thepsychosocial and academic adjustment of first year home students.Personality and Individual Differences, 26, 665–685. doi:10.1016/S0191-8869(98)00172-X
*Hall, C. W., Smith, K. M., & Chia, R. (2002). Relationship betweenmetacognition and affective variables in college achievement. NationalSocial Science Journal, 19, 43–50.
*Hall, N. C. (2008). Self-regulation of primary and secondary control inachievement settings: A process model. Journal of Social and ClinicalPsychology, 27, 1126–1164. doi:10.1521/jscp.2008.27.10.1126
*Hall, N. C., Perry, R. P., Ruthig, J. C., Hladkyj, S., & Chipperfield, J. G.(2006). Primary and secondary control in achievement settings: A lon-gitudinal field study of academic motivation, emotions, and perfor-mance. Journal of Applied Social Psychology, 36, 1430–1470. doi:10.1111/j.0021-9029.2006.00067.x
*Harackiewicz, J. M., Barron, K. E., Carter, S. M., Lehto, A. T., & Elliot,A. J. (1997). Predictors and consequences of achievement goals in the
380 RICHARDSON, ABRAHAM, AND BOND
college classroom: Maintaining interest and making the grade. Journalof Personality and Social Psychology, 73, 1284–1295. doi:10.1037/0022-3514.73.6.1284
Harackiewicz, J. M., Barron, K. E., Pintrich, P. R., Elliot, A. J., & Thrash,T. M. (2002). Revision of achievement goal theory: Necessary andilluminating. Journal of Educational Psychology, 94, 638–645. doi:10.1037//0022-0663.94.3.638
*Harackiewicz, J. M., Barron, K. E., Tauer, J. M., Carter, S. M., & Elliot,A. J. (2000). Short-term and long-term consequences of achievementgoals: Predicting interest and performance over time. Journal of Edu-cational Psychology, 92, 316–330. doi:10.1037/0022-0663.92.2.316
*Harackiewicz, J. M., Barron, K. E., Tauer, J. M., & Elliot, A. J. (2002).Predicting success in college: A longitudinal study of achievement goalsand ability measures as predictors of interest and performance fromfreshman year through graduation. Journal of Educational Psychology,94, 562–575. doi:10.1037/0022-0663.94.3.562
*Harackiewicz, J. M., Durik, A. M., Barron, K. E., Linnenbrink-Garcia, L.,& Tauer, J. M. (2008). The role of achievement goals in the developmentof interest: Reciprocal relations between achievement goals, interest, andperformance. Journal of Educational Psychology, 100, 105–122. doi:10.1037/0022-0663.100.1.105
Harris, D. (1940). Factors affecting college grades: A review of theliterature, 1930 –1937. Psychological Bulletin, 37, 125–166. doi:10.1037/h0055365
Harter, S. (1998). The development of self-representations. In W. Damon(Series Ed.) & N. Eisenberg (Vol. Ed.), Handbook of child psychology(5th ed., Vol. 3, pp. 553–557) New York, NY: Macmillan.
Hattie, J., Biggs, J., & Purdie, N. (1996). Effects of learning skills inter-ventions on student learning: A meta-analysis. Review of EducationalResearch, 66, 99–136. doi:10.2307/1170605
Hattie, J. A. (1993). Measuring the effects of schooling. SET, 2, 1–4.Hedges, L. V., & Olkin, I. (1985). Statistical methods for meta-analysis.
Orlando, FL: Academic Press.Hedges, L. V., & Vevea, J. L. (1998). Fixed and random effects models in
meta-analysis. Psychological Methods, 3, 486–504. doi:10.1037//1082-989X.3.4.486
Heider, F. (1958). The psychology of interpersonal relations. New York,NY: Wiley.
*Heikkila, A., & Lonka, K. (2006). Studying in higher education: Students’approaches to learning, self-regulation, and cognitive strategies. Studiesin Higher Education, 31, 99–117. doi:10.1080/03075070500392433
*Hickman, G. P., Toews, M. L., & Andrews, D. W. (2001). The differentialinfluence of authoritative parenting on the initial adjustment of male andfemale traditional college freshmen. Journal of the First-Year Experi-ence & Students in Transition, 13, 23–46.
*Higgins, D. M., Peterson, J. B., Pihl, R. O., & Lee, A. G. M. (2007).Prefrontal cognitive ability, intelligence, Big Five personality, and theprediction of advanced academic and workplace performance. Journal ofPersonality and Social Psychology, 93, 298–319. doi:10.1037/0022-3514.93.2.298
Higgins, J. P. T., & Thompson, S. G. (2002). Quantifying heterogeneity inmeta-analysis. Statistics in Medicine, 21, 1539–1558. doi:10.1002/sim.1186
Higgins, J. P. T., Thompson, S. G., Deeks, J. J., & Altman, D. G. (2003).Measuring inconsistency in meta-analyses. BMJ, 327, 557–560.
Hill, L., Jr. (1990). Effort and reward in college: A replication of somepuzzling findings. Journal of Social Behavior and Personality, 5, 151–161.
*Hirschfeld, R. R., Lawson, L., & Mossholder, K. W. (2004). Moderators of therelationship between cognitive ability and performance: General versus context-specific achievement motivation. Journal of Applied Social Psychology, 34,2389–2409. doi:10.1111/j.1559-1816.2004.tb01983.x
*Hong, E. (1999). Test anxiety, perceived test difficulty, and test perfor-
mance: Temporal patterns of their effects. Learning and IndividualDifferences, 11, 431–447. doi:10.1016/S1041-6080(99)80012-0
*Hoskins, S. L., & van Hooff, J. C. (2005). Motivation and ability: Whichstudents use online learning and what influence does it have on theirachievement? British Journal of Educational Technology, 36, 177–192.doi:10.1111/j.1467-8535.2005.00451.x
*Howell, A. J. (2009). Flourishing: Achievement-related correlates ofstudents’ well-being. Journal of Positive Psychology, 4, 1–13. doi:10.1080/17439760802043459
*Hsieh, P., Sullivan, J. R., & Guerra, N. S. (2007). A closer look at collegestudents: Self-efficacy and goal orientation. Journal of Advanced Aca-demics, 18, 454–476. Retrieved from http://www.jaa.uconn.edu/
*Hull-Blanks, E., Kurpius, S. E. R., Befort, C., Sollenberger, S., Nicpon,M. F., & Huser, L. (2005). Career goals and retention-related factorsamong college freshmen. Journal of Career Development, 32, 16–30.doi:10.1177/0894845305277037
*Hulleman, C. S., Durik, A. M., Schweigert, S. A., & Harackiewicz, J. M.(2008). Task values, achievement goals, and interest: An integrativeanalysis. Journal of Educational Psychology, 100, 398 – 416. doi:10.1037/0022-0663.100.2.398
Hulleman, C. S., Schrager, S. M., Bodmann, S. M., & Harackiewicz, J. M.(2010). A meta-analytic review of achievement goal measures: Differentlabels for the same constructs or different constructs with similar labels?Psychological Bulletin, 136, 422–449. doi:10.1037/a0018947
Hunter, J. E., & Schmidt, F. L. (1990). Methods of meta-analysis: Cor-recting error and bias in research findings. London, England: Sage.
Hunter, J. E., & Schmidt, F. L. (2004). Methods of meta-analysis: Cor-recting error and bias in research findings (2nd ed.). Newbury Park,CA: Sage.
*Huws, N., Reddy, P. A., & Talcott, J. B. (2009). The effects of faking onnon-cognitive predictors of academic performance in university stu-dents. Learning and Individual Differences, 19, 476–480. doi:10.1016/j.lindif.2009.04.003
Jackson, D. N. (1984). Personality Research Form manual. Port Huron,MI: Research Psychologists Press.
*Jagacinski, C. M., Kumar, S., Boe, J. L., Lam, H., & Miller, S. A. (2010).Changes in achievement goals and competence perceptions across thecollege semester. Motivation and Emotion, 34, 191–204. doi:10.1007/s11031-010-9165-x
*Jaramillo, F., & Spector, P. E. (2004). The effect of action orientation onthe academic performance of undergraduate marketing majors. Journalof Marketing Education, 26, 250–260. doi:10.1177/0273475304268780
John, O. P., Donahue, E. M., & Kentle, R. L. (1991). The Big FiveInventory—Versions 4a and 54. Berkeley: University of California,Institute of Personality and Social Research.
Johnson, V. E. (2003). Grade inflation: A crisis in college education. NewYork, NY: Springer-Verlag.
*Jones, E. (2008). Predicting performance in first-semester college basicwriters: Revisiting the role of self-beliefs. Contemporary EducationalPsychology, 33, 209–238. doi:10.1016/j.cedpsych.2006.11.001
Jones, H. E., & Bayley, N. (1941). The Berkeley Growth Study. ChildDevelopment, 12, 167–173. doi:10.2307/1125347
Judge, T. A., Jackson, C., Shaw, J. C., Scott, B. A., & Rich, B. L. (2007).Self-efficacy and work-related performance: The integral role of indi-vidual differences. Journal of Applied Psychology, 92, 107–127. doi:10.1037/0021-9010.92.1.107
*Justice, E. M., & Dornan, T. M. (2001). Metacognitive differences be-tween traditional-age and nontraditional-age college students. Adult Ed-ucation Quarterly, 51, 236–249. doi:10.1177/074171360105100305
*Kahn, J. H., & Nauta, M. M. (2001). Social–cognitive predictors offirst-year college persistence: The importance of proximal assessment.Research in Higher Education, 42, 633– 652. doi:10.1023/A:1012225510213
*Kaufman, J. C., Agars, M. D., & Lopez-Wagner, M. C. (2008). The role
381NON-INTELLECTIVE CORRELATES OF ACADEMIC PERFORMANCE

of personality and motivation in predicting early college academicsuccess in non-traditional students at a Hispanic-serving institution.Learning and Individual Differences, 18, 492– 496. doi:10.1016/j.lindif.2007.11.004
*Kern, C. W., Fagley, N. S., & Miller, P. M. (1998). Correlates of collegeretention and GPA: Learning and study strategies, testwiseness, atti-tudes, and ACT. Journal of College Counseling, 1(1), 26–34.
*Kim, Y. K., & Sax, L. J. (2009). Student–faculty interaction in researchuniversities: Differences by student gender, race, social class, and first-generation status. Research in Higher Education, 50, 437–459. doi:10.1007/s11162-009-9127-x
*King, A. R. (2000). Relationships between CATI personality disordervariables and measures of academic performance. Personality and In-dividual Differences, 29, 177–190. doi:10.1016/S0191-8869(99)00186-5
*Klassen, R. M., Ang, R. P., Chong, W. H., Krawchuk, L. L., Huan, V. S.,Wong, I. Y. F., & Yeo, L. S. (2010). Academic procrastination in twosettings: Motivation correlates, behavioral patterns, and negative impactof procrastination in Canada and Singapore. Applied Psychology, 59,361–379. doi:10.1111/j.1464-0597.2009.00394.x
*Klassen, R. M., Krawchuk, L. L., & Rajani, S. (2008). Academic pro-crastination of undergraduates: Low self-efficacy to self-regulate pre-dicts higher levels of procrastination. Contemporary Educational Psy-chology, 33, 915–931. doi:10.1016/j.cedpsych.2007.07.001
*Klein, H. J., & Lee, S. (2006). The effects of personality on learning: Themediating role of goal setting. Human Performance, 19, 43–66. doi:10.1207/s15327043hup1901_3
*Klein, H. J., Noe, R. A., & Wang, C. W. (2006). Motivation to learn andcourse outcomes: The impact of delivery mode, learning goal orienta-tion, and perceived barriers and enablers. Personnel Psychology, 59,665–702. doi:10.1111/j.1744-6570.2006.00050.x
*Kluemper, D. H., Little, L. M., & Degroot, T. (2009). State or trait:Effects of state optimism on job-related outcomes. Journal of Organi-zational Behavior, 30, 209–231. doi:10.1002/job.591
Kobrin, J. L., Patterson, B. F., Shaw, E. J., Mattern, K. D., & Barbuti, S. M.(2008). Validity of the SAT for predicting first-year college grade pointaverage. New York, NY: College Board.
*Komarraju, M., Karau, S. J., & Schmeck, R. R. (2009). Role of the BigFive personality traits in predicting college students’ academic motiva-tion and achievement. Learning and Individual Differences, 19, 47–52.doi:10.1016/j.lindif.2008.07.001
*Komarraju, M., Musulkin, S., & Bhattacharya, G. (2010). Role ofstudent–faculty interactions in developing college students’ academicself-concept, motivation, and achievement. Journal of College StudentDevelopment, 51, 332–342.
Kuhl, J. (2000). A functional-design approach to motivation and self-regulation: The dynamics of personality systems interactions. In M.Boekaerts, P. Pintrich, & M. Zeidner (Eds.), The handbook of self-regulation (pp. 111–169). San Diego, CA: Academic Press.
*LaForge, M. C., & Cantrell, S. (2003). Explanatory style and academicperformance among college students beginning a major course of study.Psychological Reports, 92, 861–865. doi:10.2466/PR0.92.3.861-865
*Lane, D. J., & Gibbons, F. X. (2007). Social comparison and satisfaction:Students’ reactions after exam feedback predict future academic perfor-mance. Journal of Applied Social Psychology, 37, 1363–1384. doi:10.1111/j.1559-1816.2007.00216.x
*Larose, S., Robertson, D. U., Roy, R., & Legault, F. (1998). Non-intellectual learning factors as determinants for success in college.Research in Higher Education, 39, 275–297. doi:10.1023/A:1018776917403
Larose, S., & Roy, R. (1995). Test of reactions and adaptation in college(TRAC): A new measure of learning propensity for college students.Journal of Educational Psychology, 87, 293–306. doi:10.1037/0022-0663.87.2.293
Latham, G. P., & Brown, T. C. (2006). The effect of learning vs. outcome
goals on self-efficacy, satisfaction and performance in an MBA pro-gram. Applied Psychology, 55, 606 – 623. doi:10.1111/j.1464-0597.2006.00246.x
Lay, C. H. (1986). At last, my research article on procrastination. Journalof Research in Personality, 20, 474 – 495. doi:10.1016/0092-6566(86)90127-3
Le, H., Casillas, A., Robbins, S. B., & Langley, R. (2005). Motivationaland skills, social, and self-management predictors of college outcomes:Constructing the Student Readiness Inventory. Educational and Psycho-logical Measurement, 65, 482–508. doi:10.1177/0013164404272493
*Leach, C. W., Queirolo, S. S., DeVoe, S., & Chemers, M. (2003).Choosing letter grade evaluations: The interaction of students’ achieve-ment goals and self-efficacy. Contemporary Educational Psychology,28, 495–509. doi:10.1016/S0361-476X(02)00058-9
*Lee, C., Tinsley, C., & Bobko, P. (2003). Cross-cultural variance in goalorientations and their effects. Applied Psychology, 52, 272–297. doi:10.1111/1464-0597.00135
*Lee, F. K., Sheldon, K. M., & Turban, D. B. (2003). Personality and thegoal-striving process: The influence of achievement goal patterns, goallevel, and mental focus on performance and enjoyment. Journal ofApplied Psychology, 88, 256–265. doi:10.1037/0021-9010.88.2.256
Lent, R. W., & Brown, S. D. (2006). On conceptualizing and assessingsocial cognitive constructs in career research: A measurement guide.Journal of Career Assessment, 14, 12–35. doi:10.1177/1069072705281364
Levenson, H. (1974). Activism and powerful others: Distinctions withinthe concept of internal–external control. Journal of Personality Assess-ment, 38, 377–383.
Linnenbrink-Garcia, L., Tyson, D. F., & Patall, E. A. (2008). When areachievement goal orientations beneficial for academic achievement? Acloser look at moderating factors. International Review of Social Psy-chology, 21, 19–70.
Locke, E. A., & Latham, G. P. (1990). A theory of goal setting and taskperformance. Englewood Cliffs, NJ: Prentice Hall.
*Lockett, C. T., & Harrell, J. P. (2003). Racial identity, self-esteem, andacademic achievement: Too much interpretation, too little supportingdata. Journal of Black Psychology, 29, 325–336. doi:10.1177/0095798403254216
Lounsbury, J. W., & Gibson, L. W. (2002). Personal Style Inventory: Awork-based personality measurement system. Knoxville, Tennessee: Re-source Associates.
*Lounsbury, J. W., Huffstetler, B. C., Leong, F. T., & Gibson, L. W.(2005). Sense of identity and collegiate academic achievement. Journalof College Student Development, 46, 501–514. doi:10.1353/csd.2005.0051
Lounsbury, J. W., Saudargas, R. A., & Gibson, L. W. (2004). An investi-gation of personality traits in relation to intention to withdraw fromcollege. Journal of College Student Development, 45, 517–534. doi:10.1353/csd.2004.0059
*Lounsbury, J. W., Sundstrom, E., Loveland, J. M., & Gibson, L. W.(2003). Intelligence, “Big Five” personality traits, and work drive aspredictors of course grade. Personality and Individual Differences, 35,1231–1239. doi:10.1016/S0191-8869(02)00330-6
Mannan, M. A. (2001). An assessment of the academic and social integra-tion as perceived by the students in the University of Papua New Guinea.Higher Education, 41, 283–298.
*Martin, J. H., Montgomery, R. L., & Saphian, D. (2006). Personality,achievement test scores, and high school percentile as predictors ofacademic performance across four years of coursework. Journal ofResearch in Personality, 40, 424–431. doi:10.1016/j.jrp.2005.02.001
Maslach, C., & Jackson, S. (1981). The measurement of experiencedburnout. Journal of Organizational Behavior, 2, 99–113. doi:10.1002/job.4030020205
382 RICHARDSON, ABRAHAM, AND BOND

Mathiasen, R. E. (1984). Predicting college academic achievement: Aresearch review. College Student Journal, 18, 380–386.
Matthews, G. (1997). Extraversion, emotion and performance: Acognitive-adaptive model. In G. Matthews (Ed.), Cognitive scienceperspectives on personality and emotion (pp. 339–342). Amsterdam, theNetherlands: Elsevier.
Mayer, J. D., Salovey, P., & Caruso, D. R. (2002). Mayer–Salovey–CarusoEmotional Intelligence Test (MSCEIT) user’s manual. Toronto, Ontario,Canada: Multi-Health Systems.
McDonald, A., Newton, P., Whetton, C., & Benfield, P. (2001). Aptitudetesting for university entrance: A literature review. Slough, England:National Foundation for Educational Research.
*McIlroy, D. (2000). An evaluation of the factor structure and predictiveutility of a test anxiety scale with reference to students’ past performanceand personality indices. British Journal of Educational Psychology, 70,17–32. doi:10.1348/000709900157949
*McIlroy, D., & Bunting, B. (2002). Personality, behavior, and academicachievement: Principles for educators to inculcate and students to model.Contemporary Educational Psychology, 27, 326 –337. doi:10.1006/ceps.2001.1086
*McKenzie, J., Taghavi-Khonsary, M., & Tindell, G. (2000). Neuroticismand academic achievement: The Furneaux Factor as a measure of aca-demic rigour. Personality and Individual Differences, 29, 3–11. doi:10.1016/S0191-8869(99)00170-1
Metzner, B. S., & Bean, J. P. (1987). The estimation of a conceptual modelof non-traditional undergraduate student attrition. Research in HigherEducation, 27, 15–38. doi:10.1007/BF00992303
Milgram, N., Mey-Tal, G., & Levison, Y. (1998). Procrastination, generalized orspecific, in college students and their parents. Personality and Individual Dif-ferences, 25, 297–316. doi:10.1016/S0191-8869(98)00044-0
Mischel, W., Shoda, Y., & Peake, P. K. (1988). The nature of adolescentcompetencies predicted by preschool delay of gratification. Journal ofPersonality and Psychology, 57, 358 –367. doi:10.1037/0022-3514.54.4.687
*Mobley, M., Slaney, R. B., & Rice, K. G. (2005). Cultural validity of theAlmost Perfect Scale–Revised for African American college students.Journal of Counseling Psychology, 52, 629–639. doi:10.1037/0022-0167.52.4.629
*Moon, S. M., & Illingworth, A. J. (2005). Exploring the dynamic natureof procrastination: A latent growth curve analysis of academic procras-tination. Personality and Individual Differences, 38, 297–309. doi:10.1016/j.paid.2004.04.009
*Morganson, V. J., Jones, M. P., & Major, D. A. (2010). Understandingwomen’s underrepresentation in science, technology, engineering, andmathematics: The role of social coping. Career Development Quarterly,59, 169–179.
Mount, M. K., & Barrick, M. R. (1995). Manual for the Personal Char-acteristics Inventory. Libertyville, IL: Wonderlic.
Mouw, J. T., & Khanna, R. K. (1993). Prediction of academic success: Areview of the literature and some recommendations. College StudentJournal, 27, 328–336.
Mroczek, D. K., & Spiro, A., III. (2003). Modeling interindividual changein personality traits: Findings from the normative aging study. Journalsof Gerontology: Series B: Psychological Sciences and Social Sciences,58, P153–P165. Retrieved from http://www.bu.edu/lab/Publications/Mroczek_Spiro_2003_Modeling.pdf
Murphy, P. K., & Alexander, P. (2000). A motivated exploration ofmotivation terminology. Contemporary Educational Psychology, 25,3–53. doi:10.1006/ceps.1999.1019
*Murray, C., & Wren, C. T. (2003). Cognitive, academic, and attitudinalpredictors of the grade point averages of college students with learningdisabilities. Journal of Learning Disabilities, 36, 407–415. doi:10.1177/00222194030360050201
*Musch, J., & Broder, A. (1999). Test anxiety versus academic skills: A
comparison of two alternative models for predicting performance in astatistics exam. British Journal of Educational Psychology, 69, 105–116.doi:10.1348/000709999157608
*Musgrave-Marquart, D., Bromley, S. P., & Dalley, M. B. (1997). Person-ality, academic attribution, and substance use as predictors of academicachievement in college students. Journal of Social Behavior and Per-sonality, 12, 501–511.
National Research Council. (1992). Combining information: Statisticalissues and opportunities for research. Washington, DC: National Acad-emy Press.
Neisser, U., Boodo, G., Bouchard, T. J., Boykin, A. W., Brody, N., Ceci,S. J., . . . Urbina, S. (1996). Intelligence: Knowns and unknowns. Amer-ican Psychologist, 51, 77–101. doi:10.1037/0003-066X.51.2.77
*Neuville, S., Frenay, M., Schmitz, J., Boudrenghien, G., Noel, B., &Wertz, V. (2007). Tinto’s theoretical perspective and expectancy-valueparadigm: A confrontation to explain freshmen’s academic achievement.Psychologica Belgica, 47(1–2), 31–50.
*Newsome, S., Day, A. L., & Catano, V. M. (2000). Assessing thepredictive validity of emotional intelligence. Personality and IndividualDifferences, 29, 1005–1016. doi:10.1016/S0191-8869(99)00250-0
*Nguyen, N. T., Larry, C. A., & Fraccastoro, K. (2005). Personalitypredicts academic performance: Exploring the moderating role of gen-der. Journal of Higher Education and Policy Management, 27, 105–117.doi:10.1080/13600800500046313
Noel, L., & Levitz, P. (1993). The RMS technical guide (pp. 165–184).*Noftle, E. E., & Robins, R. W. (2007). Personality predictors of academic
outcomes: Big Five correlates of GPA and SAT scores. Journal ofPersonality and Social Psychology, 93, 116–130. doi:10.1037/0022-3514.93.1.116
*Nonis, S. A., & Hudson, G. I. (2006). Academic performance of collegestudents: Influence of time spent studying and working. Journal ofEducation for Business, 81, 151–159. doi:10.3200/JOEB.81.3.151-159
*Nonis, S. A., & Wright, D. (2003). Moderating effects of achievementstriving and situational optimism on the relationship between ability andperformance outcomes of college students. Research in Higher Educa-tion, 44, 327–346. doi:10.1023/A:1023029815944
*Nordstrom, C. R., & Segrist, D. J. (2009). Predicting the likelihood ofgoing to graduate school: The importance of locus of control. CollegeStudent Journal, 43, 200–206.
O’Connor, M. C., & Paunonen, S. V. (2007). Big Five personality predic-tors of post-secondary academic performance. Personality and Individ-ual Differences, 43, 971–990. doi:10.1016/j.paid.2007.03.017
*O’Connor, R. M., & Little, I. S. (2003). Revisiting the predictive validityof emotional intelligence: Self-report versus ability-based measures.Personality and Individual Differences, 35, 1893–1902. doi:10.1016/S0191-8869(03)00038-2
*Okun, M. A., & Finch, J. F. (1998). The Big Five personality dimensionsand the process of institutional departure. Contemporary EducationalPsychology, 23, 233–256. doi:10.1006/ceps.1996.0974
*Page, S., & Alexitch, L. R. (2003). Learning- and grade-orientation, sex,and prediction of self-reported academic performance. PsychologicalReports, 92, 320–324. doi:10.2466/PR0.92.1.320-324
Pajares, F., & Miller, M. D. (1995). Mathematics self-efficacy and math-ematics performance: The need for specificity of assessment. Journal ofCounseling Psychology, 42, 190–198. doi:10.1037//0022-0167.42.2.190
*Parker, J. D. A., Austin, E. J., Hogan, M. J., Wood, L. M., & Bond, B. J.(2005). Alexithymia and academic success: Examining the transitionfrom high school to university. Personality and Individual Differences,38, 1257–1267. doi:10.1016/j.paid.2004.08.008
*Parker, J. D. A., Duffy, J., Wood, L. M., Bond, B. J., & Hogan, M. J.(2005). Academic achievement and emotional intelligence: Predictingthe successful transition from high school to university. Journal of theFirst-Year Experience & Students in Transition, 17, 67–78.
*Parker, J. D. A., Hogan, M. J., Eastabrook, J. M., Oke, A., & Wood, L. M.
383NON-INTELLECTIVE CORRELATES OF ACADEMIC PERFORMANCE

(2004). Emotional intelligence and academic success: Examining thetransition from high school to university. Personality and IndividualDifferences, 36, 163–172. doi:10.1016/S0191-8869(03)00076-X
Pascarella, E. T., & Terenzini, P. T. (1979). Interaction effects in Spadyand Tinto’s conceptual models of college attrition. Sociology of Educa-tion, 57, 197–210. doi:10.doi:10.2307/2112401
*Pastor, D. A., Barron, K. E., Miller, B. J., & Davis, S. L. (2007). A latent profileanalysis of college students’ achievement goal orientation. Contemporary Ed-ucational Psychology, 32, 8–47. doi:10.1016/j.cedpsych.2006. doi:10.003
*Paunonen, S. V., & Ashton, M. C. (2001). Big Five predictors of aca-demic achievement. Journal of Research in Personality, 35, 78–90.doi:10.1006/jrpe.2000.2309
Payne, S. C., Youngcourt, S. S., & Beaubien, J. M. (2007). A meta-analyticexamination of the goal orientation nomological net. Journal of AppliedPsychology, 92, 128–150. doi:10.1037/0021-9010.92.1.128
Peers, I. S., & Johnston, M. (1994). Influence of learning context on therelationship between A-level attainment and final degree performance:A meta-analytical review. British Journal of Educational Psychology,64, 1–18.
*Pekrun, R., Elliot, A. J., & Maier, M. A. (2009). Achievement goals andachievement emotions: Testing a model of their joint relations withacademic performance. Journal of Educational Psychology, 101, 115–135. doi:10.1037/a0013383
*Pekrun, R., Goetz, T., Daniels, L. M., Stupnisky, R. H., & Perry, R. P.(2010). Boredom in achievement settings: Exploring control-value an-tecedents and performance outcomes of a neglected emotion. Journal ofEducational Psychology, 102, 531–549. doi:10.1037/a0019243
*Pekrun, R., Goetz, T., Perry, R. P., Kramer, K., Hochstadt, M., &Molfenter, S. (2004). Beyond test anxiety: Development and validationof the Test Emotions Questionnaire (TEQ). Anxiety, Stress & Coping,17, 287–316. doi:10.1080/10615800412331303847
*Perry, R. P., Hladkyj, S., Pekrun, R. H., Clifton, R. A., & Chipperfield,J. G. (2005). Perceived academic control and failure in college students:A three-year study of scholastic attainment. Research in Higher Educa-tion, 46, 535–569. doi:10.1007/s11162-005-3364-4
*Perry, R. P., Hladkyj, S., Pekrun, R. H., & Pelletier, S. T. (2001).Academic control and action control in the achievement of collegestudents: A longitudinal field study. Journal of Educational Psychology,93, 776–789. doi:10.1037//0022-0663.93.4.776
Peterson, C., & Barrett, L. C. (1987). Explanatory style and academicperformance among university freshman. Journal of Personality andSocial Psychology, 53, 603–607. doi:10.1037/0022-3514.53.3.603
Peterson, C., Vaillant, G. E., & Seligman, M. E. P. (1988). Pessimisticexplanatory style is a risk factor for physical illness: A thirty-five-yearlongitudinal study. Journal of Personality and Social Psychology, 55,23–27. doi:10.1037/0022-3514.55.1.23
*Peterson, C. H., Casillas, A., & Robbins, S. B. (2006). The StudentReadiness Inventory and the Big Five: Examining social desirability andcollege academic performance. Personality and Individual Differences,41, 663–673. doi:10.1016/j.paid.2006.03.006
*Phillips, J. M., & Gully, S. M. (1997). Role of goal orientation, ability,need for achievement, and locus of control in the self-efficacy andgoal-setting process. Journal of Applied Psychology, 82, 792–802. doi:10.1037//0021-9010.82.5.792
*Phillips, P., Abraham, C., & Bond, R. (2003). Personality, cognition, anduniversity students’ examination performance. European Journal ofPersonality, 17, 435–448. doi:10.1002/per.488
*Phinney, J. S., Dennis, J. M., & Gutierrez, D. M. (2005). College orien-tation profiles of Latino students from low socioeconomic backgrounds:A cluster analytic approach. Hispanic Journal of Behavioral Sciences,27, 387–408. doi:10.1177/0739986305280692
*Pinel, E. C., Warner, L. R., & Chua, P. P. (2005). Getting there is onlyhalf the battle: Stigma consciousness and maintaining diversity in higher
education. Journal of Social Issues, 61, 481–506. doi:10.1111/j.1540-4560.2005.00417.x
Pintrich, P. R. (2000). An achievement goal theory perspective on issues inmotivation terminology, theory, and research. Contemporary Educa-tional Psychology, 25, 92–104. doi:10.1006/ceps.1999.1017
Pintrich, P. R. (2004). A conceptual framework for assessing motivationand self-regulated learning in college students. Educational PsychologyReview, 16, 385–407. doi:10.1007/s10648-004-0006-x
Pintrich, R. R., & DeGroot, E. V. (1990). Motivational and self-regulatedlearning components of classroom academic performance. Journal ofEducational Psychology, 82, 33–40. doi:10.1037//0022-0663.82.1.33
Plant, E. A., Ericsson, K. A., Hill, L., & Asberg, K. (2005). Why study time doesnot predict grade point average across college students: Implications of delib-erate practice for academic performance. Contemporary Educational Psychol-ogy, 30, 96–116. doi:10.1016/j.cedpsych.2004.06.001
Plomin, R. (2001). The genetics of G in human and mouse. Nature ReviewsNeuroscience, 2, 136–141. doi:10.1038/35053584
Poropat, A. E. (2009). A meta-analysis of the five-factor model of person-ality and academic performance. Psychological Bulletin, 135, 322–338.doi:10.1037/a0014996
*Pulford, B. D., & Sohal, H. (2006). The influence of personality on HEstudents’ confidence in their academic abilities. Personality and Indi-vidual Differences, 41, 1409–1419. doi:10.1016/j.paid.2006.05.010
*Radosevich, D. J., Vaidyanathan, V. T., Yeo, S. Y., & Radosevich, D. M.(2004). Relating goal orientation to self-regulatory processes: A longi-tudinal field test. Contemporary Educational Psychology, 29, 207–229.doi:10.1016/S0361-476X
Ramist, L., Lewis, C., & McCamley-Jenkins, L. (2001). Using achievementtests/SAT II subject tests to demonstrate achievement and predict collegegrades: Sex, language, ethnic, and parental education groups (CollegeBoard Research Rep. No. 2001–5). New York, NY: College Board.
Ramsden, P. (1979). Student learning and perceptions of the academicenvironment. Higher Education, 8, 411–427. doi:10.1007/BF01680529
Raven, J., Raven, J. C., & Court, J. H. (1998). Raven manual: Section 1.General overview. Oxford, England: Oxford Psychologists Press.
Reynolds, W. M., Ramirez, M. P., Magrina, A., & Allen, J. E. (1980).Initial development and validation of the Academic Self-Concept Scale.Educational and Psychological Measurement, 40, 1013–1016. doi:10.1177/001316448004000428
*Richard, E. M., Diefendorff, J. M., & Martin, J. H. (2006). Revisiting thewithin-person self-efficacy and performance relation. Human Perfor-mance, 19, 67–87. doi:10.1207/s15327043hup1901_4
Richardson, J. T. E. (1995). Mature students in higher education: II. An investi-gation of approaches to studying and academic performance. Studies in HigherEducation, 20, 5–17. doi:10.1080/03075079512331381760
*Richardson, J. T. E. (2003). Approaches to studying and perceptions ofacademic quality in a short web-based course. British Journal of Edu-cational Technology, 34, 433–442. doi:10.1111/1467-8535.00340
*Richardson, J. T. E. (2007). Motives, attitudes and approaches to studyingin distance education. Higher Education, 54, 385–416. doi:10.1007/s10734-006-9003-y
*Richardson, M., & Abraham, C. (2009). Conscientiousness and achieve-ment motivation predict performance. European Journal of Personality,23, 589–605. doi:10.1002/per.732
*Ridgell, S. D., & Lounsbury, J. W. (2004). Predicting academic success:General intelligence, “Big Five” personality traits, and work drive.College Student Journal, 38, 607–619.
Riemann, R., Angleitner, A., & Strelau, J. (1997). Genetic and environ-mental influences on personality: A study of twins reared together usingthe self-and peer report NEO–FFI scales. Journal of Personality, 65,449–475.
*Robbins, S. B., Allen, J., Casillas, A., Peterson, C. H., & Le, H. (2006).Unraveling the differential effects of motivational and skills, social, andself-management measures from traditional predictors of college out-
384 RICHARDSON, ABRAHAM, AND BOND

comes. Journal of Educational Psychology, 98, 598–616. doi:10.1037/0022-0663.98.3.598
Robbins, S. B., Lauver, K., Le, H., Davis, D., Langley, R., & Carlstrom, A.(2004). Do psychosocial and study skill factors predict college out-comes? A meta-analysis. Psychological Bulletin, 130, 261–288. doi:10.1037/0033-2909.130.2.261
Roberts, B. W., & Wood, D. (2006). Personality development in thecontext of the neo-socioanalytic model of personality. In D. K. Mroczek& T. D. Little (Eds.), Handbook of personality development (pp. 11–39).Mahwah, NJ: Erlbaum.
Roberts, L. W., & Clifton, R. A. (1992). Measuring the affective quality oflife of university students: The validation of an instrument. SocialIndicators Research, 27, 113–137. doi:10.1007/BF00300557
*Rode, J. C., Mooney, C. H., Arthaud-Day, M. L., Near, J. P., Baldwin,T. T., Rubin, R. S., & Bommer, W. H. (2007). Emotional intelligenceand individual performance: Evidence of direct and moderated effects.Journal of Organizational Behavior, 28, 399–421. doi:10.1002/job.429
*Rode, J. C., Mooney, C. H., Arthaud-Day, M. L., Near, J. P., Rubin, R. S.,Baldwin, T. T., & Bommer, W. H. (2008). An examination of thestructural, discriminant, nomological, and incremental predictive valid-ity of the MSCEIT� V2.0. Intelligence, 36, 350–366. doi:10.1016/j.intell.2007.07.002
Roedel, T., Schraw, G., & Plake, B. S. (1994). Validation of a measure of learningand performance goal orientations. Educational and Psychological Measure-ment, 54, 1013–1021. doi:10.1177/0013164494054004018
Rolfhus, E. L., & Ackerman, P. L. (1999). Assessing individual differencesin knowledge: Knowledge structures and traits. Journal of EducationalPsychology, 91, 511–526. doi:10.1037/0022-0663.91.3.511
Rosenberg, M. (1965). Society and the adolescent self-image. Princeton,NJ: Princeton University Press.
Rosenthal, R. (1979). The “file drawer problem” and tolerance for nullresults. Psychological Bulletin, 86, 638 – 641. doi:10.1037//0033-2909.86.3.638
Rotter, J. (1966). Generalized expectancies for internal versus externalcontrol of reinforcement. Psychological Monographs, 80(1, Whole No.609), 1–28.
*Rowe, J. E., & Lockhart, L. K. (2005). Relationship of cognitive attribu-tional style and academic performance among a predominantly Hispaniccollege student population. Individual Differences Research, 3, 136–139.
*Rowe, J. W. K. (2002). First year engineering students’ approaches tostudy. International Journal of Electrical Engineering Education, 39,201–209. Retrieved from http://www.manchesteruniversitypress.co.uk/journals/journal.asp?id�11
*Rugsaken, K. T., Roberston, J. A., & Jones, J. A. (1998). Using theLearning and Study Strategies Inventory scores as additional predictorsof student academic performance. National Academic Advising Associ-ation Journal, 18, 20–26.
*Ruthig, J. C., Haynes, T. L., Perry, R. P., & Chipperfield, J. G. (2007).Academic optimistic bias: Implications for college student performanceand well-being. Social Psychology of Education, 10, 115–137. doi:10.1007/s11218-006-9002-y
*Ruthig, J. C., Haynes, T. L., Stupnisky, R. H., & Perry, R. P. (2009).Perceived academic control: Mediating the effects of optimism andsocial support on college students’ psychological health. Social Psychol-ogy of Education, 12, 233–249. doi:10.1007/s11218-008-9079-6
*Ruthig, J. C., Perry, R. P., Hall, N. C., & Hladkyj, S. (2004). Optimismand attributional retraining: Longitudinal effects on academic achieve-ment, test anxiety, and voluntary course withdrawal in college students.Journal of Applied Social Psychology, 34, 709–730. doi:10.1111/j.1559-1816.2004.tb02566.x
*Ruthig, J. C., Perry, R. P., Hladkyj, S., Hall, N. C., Pekrun, R., &Chipperfield, J. G. (2008). Perceived control and emotions: Interactive
effects on performance in achievement settings. Social Psychology ofEducation, 11, 161–180. doi:10.1007/s11218-007-9040-0
Ryan, A. M., & Pintrich, P. R. (1997). “Should I ask for help?” The roleof motivation and attitudes in adolescents’ help seeking in math class.Journal of Educational Psychology, 89, 329–341. doi:10.1037/0022-0663.89.2.329
Ryan, R. M., & Deci, E. L. (2000). Self-determination theory and thefacilitation of intrinsic motivation, social development, and well-being.American Psychologist, 55, 68–78. doi:10.1037/0003-066X.55.1.68
*Sandler, M. E. (2000). Career decision-making self-efficacy, perceivedstress, and an integrated model of student persistence: A structural modelof finances, attitudes, behavior, and career development. Research inHigher Education, 41, 537–580. doi:10.1023/A:1007032525530
Scheier, M. F., Carver, C. S., & Bridges, M. W. (1994). Distinguishingoptimism from neuroticism (and trait anxiety, self-mastery, and self-esteem): A re-evaluation of the Life Orientation Test. Journal of Per-sonality and Social Psychology, 67, 1063–1078. doi:10.1037/0022-3514.67.6.1063
Schuman, H., Walsh, E., & Olson, C. (1985). Effort and reward: Theassumption that college grades are affected by the quantity of study.Social Forces, 63, 945–966. doi:10.2307/2578600
*Schutte, N. S., Malouff, J. M., Hall, L. E., Haggerty, D. J., Cooper, J. T.,Golden, C. J., & Dornheim, L. (1998). Development and validation of ameasure of emotional intelligence. Personality and Individual Differ-ences, 25, 167–177. doi:10.1016/S0191-8869(98)00001-4
*Senko, C., & Miles, K. M. (2008). Pursuing their own learning agenda:How mastery-oriented students jeopardize their class performance. Con-temporary Educational Psychology, 33, 561–583. doi:10.1016/j.cedpsych.2007.12.001
Sheldon, A. J., & Elliot, K. M. (1998). Not all personal goals are personal:Comparing autonomous and controlled reasons for goals as predictors ofeffort and attainment. Personality and Social Psychology Bulletin, 24,546–557. doi:10.1177/0146167298245010
*Shell, D. F., & Husman, J. (2001). The multivariate dimensionality ofpersonal control and future time perspective beliefs in achievement andself-regulation. Contemporary Educational Psychology, 26, 481–506.doi:10.1006/ceps.2000.1073
*Shim, S., & Ryan, A. (2005). Changes in self-efficacy, challenge avoid-ance, and intrinsic value in response to grades: The role of achievementgoals. Journal of Experimental Education, 73, 333–349. doi:10.3200/JEXE.73.4.333-349
*Simons, J., Dewritte, S., & Lens, W. (2004). The role of different typesof instrumentality in motivation, study strategies, and performance:Know why you learn, so you’ll know what you learn! British Journal ofEducational Psychology, 74, 343–360. doi:10.1348/0007099041552314
*Smith, A., & Lalonde, R. N. (2003). “Racelessness” in a Canadiancontext? Exploring the link between Black students’ identity, achieve-ment, and mental health. Journal of Black Psychology, 29, 142–164.doi:10.1177/0095798403029002002
Smith, J., & Naylor, R. (2001). Determinants of degree performance in UKuniversities: A statistical analysis of the 1993 student cohort. OxfordBulletin of Economics and Statistics, 63, 29–60. doi:10.1111/1468-0084.00208
*Soares, A. P., Guisande, M. A., Almeida, L. S., & Paramo, M. F. (2009).Academic achievement in first-year Portuguese college students: Therole of academic preparation and learning strategies. International Jour-nal of Psychology, 44, 204–212. doi:10.1080/00207590701700545
Spearman, C. (1927). The abilities of man. London, England: Macmillan.Spence, J. T., & Heilmreich, R. L. (1983). Achievement-related motives
and behaviors. In J. T. Spence (Ed.), Achievement and achievementmotives (pp. 1–67). San Francisco, CA: Free Press.
Spielberger, C. D., Gorsuch, R. L., & Lushene, R. E. (1970). Manual forthe State–Trait Anxiety Inventory. Palo Alto, CA: Consulting Psychol-ogists Press.
385NON-INTELLECTIVE CORRELATES OF ACADEMIC PERFORMANCE

*Spitzer, T. M. (2000). Predictors of college success: A comparison oftraditional and nontraditional age students. Journal of Student AffairsResearch and Practice, 38, 82–98. Retrieved from http://journals.naspa.org/
Steel, P. (2007). The nature of procrastination: A meta-analytic and theo-retical review of quintessential self-regulatory failure. PsychologicalBulletin, 133, 65–94. doi:10.1037/0033-2909.133.1.65
*Steel, P., Brothen, T., & Wambach, C. (2001). Procrastination and per-sonality, performance, and mood. Personality and Individual Differ-ences, 30, 95–106. doi:10.1016/S0191-8869(00)00013-1
Stock, J., & Cervone, D. (1990). Proximal goal setting and self-regulatoryprocesses. Cognitive Therapy and Research, 14, 483–498. doi:10.1007/BF01172969
Stoecker, J., Pascarella, E. T., & Wolfle, L. M. (1988). Persistence inhigher education: A 9-year test of a theoretical model. Journal ofCollege Student Development, 29, 196–209. Retrieved from http://www.jcsdonline.org/
*Stoynoff, S. (1997). Factors associated with international students’ aca-demic achievement. Journal of Instructional Psychology, 24, 56–68.
*Strage, A., & Brandt, T. S. (1999). Authoritative parenting and collegestudents’ academic adjustment and success. Journal of EducationalPsychology, 9, 146–156. doi:10.1037/0022-0663.91.1.146
Strenze, T. (2007). Intelligence and socioeconomic success: A meta-analytic review of longitudinal research. Intelligence, 35, 401–426.doi:10.1016/j.intell.2006.09.004
*Struthers, C. W., Perry, R. P., & Menec, V. H. (2000). An examination ofthe relationship among academic stress, coping, motivation, and perfor-mance in college. Research in Higher Education, 41, 581–592. doi:10.1023/A:1007094931292
*Stupnisky, R. H., Renaud, R. D., Daniels, L. M., Haynes, T. L., & Perry,R. P. (2008). The interrelation of first-year college students’ criticalthinking disposition, perceived academic control, and academic achieve-ment. Research in Higher Education, 49, 513–530. doi:10.1007/s11162-008-9093-8
*Sullivan, H. W., Worth, K. A., Baldwin, A. S., & Rothman, A. J. (2006).The effect of approach and avoidance referents on academic outcomes:A test of competing predictions. Motivation and Emotion, 30, 156–163.doi:10.1007/s11031-006-9027-8
*Svanum, S., & Bigatti, S. M. (2006). The influences of course effort andoutside activities on grades in a college course. Journal of CollegeStudent Development, 47, 564–576. doi:10.1353/csd.2006.0063
Terman, L. M. (1916). The measurement of intelligence: An explanation ofand a complete guide for the use of the Stanford revision and extensionof the Binet–Simon Intelligence Scale. Boston, MA: Houghton Mifflin.
*Thelwell, R. C., Lane, A. M., & Weston, N. J. V. (2007). Mood states,self-set goals, self-efficacy and performance in academic examinations.Personality and Individual Differences, 42, 573–583. doi:10.1016/j.paid.2006.07.024
*Thomas, C. R., & Gadbois, S. A. (2007). Academic self-handicapping:The role of self-concept clarity and students’ learning strategies. BritishJournal of Educational Psychology, 77, 101–119. doi:10.1348/000709905X79644
*Tice, D. M., & Baumeister, R. F. (1997). Longitudinal study of procras-tination, performance, stress, and health: The costs and benefits ofdawdling. Psychological Science, 8, 454 – 458. doi:10.1111/j.1467-9280.1997.tb00460.x
*Ting, S. M. R. (1997). Estimating academic success in the 1st year ofcollege for specially admitted White students: A model of combiningcognitive and psychosocial predictors. Journal of College Student De-velopment, 38, 401–409. Retrieved from http://www.jcsdonline.org/
*Ting, S. M. R. (2001). Predicting academic success of first-year engi-neering students from standardized test scores and psychosocial vari-ables. International Journal of Engineering Education, 17, 75–80.
*Ting, S. M. R., & Robinson, T. L. (1998). First-year academic success: A
prediction combining cognitive and psychosocial variables for Cauca-sian and African American students. Journal of College Student Devel-opment, 39, 599–610. doi:10.http://www.jcsdonline.org/
Tinto, V. (1975). Dropout from higher education: A theoretical synthesis ofrecent research. Review of Educational Research, 45, 95–112. doi:10.2307/1170024
Tinto, V. (1982). Limits of theory and practice in student attrition. Journalof Higher Education, 53, 687–700. doi:10.2307/1981525
Tinto, V. (1993). Leaving college: Rethinking the causes and cures ofstudent attrition (2nd ed.). Chicago, IL: University of Chicago Press.
Tracey, T. J., & Sedlacek, W. E. (1984). Noncognitive variables in pre-dicting academic success by race. Measurement and Evaluation inGuidance, 16, 172–178.
*Trockel, M. T., Barnes, M. D., & Egget, D. L. (2000). Health-relatedvariables and academic performance among first-year college students:Implications for sleep and other behaviours. Journal of American Col-lege Health, 49, 125–131. doi:10.1080/07448480009596294
Vallerand, R. J., & Bissonnette, R. (1992). Intrinsic, extrinsic, and amoti-vational styles as predictors of behavior: A prospective study. Journal ofPersonality, 60, 599–620. doi:10.1111/j.1467-6494.1992.tb00922.x
Vallerand, R. J., & Ratelle, C. (2002). Intrinsic and extrinsic motivation: Ahierarchical model. In E. L. Deci & R. M. Ryan (Eds.), Handbook ofself-determination research (pp. 37–63). Rochester, NY: University ofRochester Press.
Vandewalle, D. M. (1997). Development and validation of a work domainachievement goals instrument. Educational and Psychological Measure-ment, 8, 995–1015. doi:10.1177/0013164497057006009
van Eerde, W. (2003). A meta-analytically derived nomological network ofprocrastination. Personality and Individual Differences, 35, 1401–1418.doi:10.1016/S0191-8869(02)00358-6
Vermetten, Y. J., Lodewijks, H. G., & Vermunt, J. D. (2001). The role ofpersonality traits and goal orientations in strategy use. ContemporaryEducational Psychology, 26, 149–170. doi:10.1006/ceps.1999.1042
*Verner-Filion, J., & Gaudreau, P. (2010). From perfectionism to academicadjustment: The mediating role of achievement goals. Personality andIndividual Differences, 49, 181–186. doi:10.1016/j.paid.2010.03.029
Viechtbauer, W. (2010). Conducting meta-analyses in R with the metaforpackage. Journal of Statistical Software, 36(3), 1–48. Retrieved fromhttp://www.jstatsoft.org/v36/i03/
Viechtbauer, W. (2011). The “metaphor” reference manual. Retrievedfrom http://cran.r-project.org/web/packages/metafor/metafor.pdf
Viechtbauer, W., & Cheung, M. W.-L. (2010). Outlier and influencediagnostics for meta-analysis. Research Synthesis Methods, 1, 112–125.doi:10.1002/jrsm.11
*Vogt, C. M., Hocevar, D., & Hagedorn, L. S. (2007). A social cognitiveconstruct validation: Determining women’s and men’s success in engi-neering programs. Journal of Higher Education, 78, 337–364. doi:10.1353/jhe.2007.0019
*Vukman, K. B., & Licardo, M. (2010). How cognitive, metacognitive,motivational and emotional self-regulation influence school perfor-mance in adolescence and early adulthood. Educational Studies, 36,259–268. doi:10.1080/03055690903180376
*Vuong, M., Brown-Welty, S., & Tracz, S. (2010). The effects of self-efficacy on academic success of first-generation college sophomorestudents. Journal of College Student Development, 51, 50–64.
*Wagerman, S. A., & Funder, D. C. (2007). Acquaintance reports ofpersonality and academic achievement: A case for conscientiousness.Journal of Research in Personality, 41, 221–229. doi:10.1016/j.jrp.2006.03.001
Watson, D. (2000). Mood and temperament. New York, NY: GuilfordPress.
Watson, D., & Clark, L. A. (1984). Negative affectivity: The disposition toexperience aversive emotional states. Psychological Bulletin, 96, 465–490. doi:10.1037/0033-2909.96.3.465
386 RICHARDSON, ABRAHAM, AND BOND

Watson, D., Clark, L. A., & Tellegen, A. (1988). Development and vali-dation of brief measures of positive and negative affect: The PANASscales. Journal of Personality and Social Psychology, 54, 1063–1070.doi:10.1037/0022-3514.54.6.1063
*Webb, T. L., & Sheeran, P. (2005). Integrating concepts from goaltheories to understand the achievement of personal goals. EuropeanJournal of Social Psychology, 35, 69–96. doi:10.1002/ejsp.233
Wechsler, D. (1981). WAIS–R manual: Wechsler Adult IntelligenceScale—Revised. New York, NY: Psychological Corporation.
Weiner, B. (1986). An attributional theory of motivation and emotion. NewYork, NY: Springer-Verlag.
Weinstein, C., Palmer, A. C., & Schulte, D. R. (1987). Learning and StudyStrategy Inventory (LASSI). Clearwater, FL: H&H.
*Wilding, J., & Andrews, B. (2006). Life goals, approaches to study andperformance in an undergraduate cohort. British Journal of EducationalPsychology, 76, 171–182. doi:10.1348/000709904X24726
Wilson, K. L., Smart, R. M., & Watson, R. J. (1996). Gender differencesin approaches to learning in first year psychology students. BritishJournal of Educational Psychology, 66, 59–71. doi:10.1111/j.2044-8279.1966.tb01176.x
*Wintre, M. G., & Sugar, L. A. (2000). Relationships with parents,personality, and the university transition. Journal of College StudentDevelopment, 41, 202–214.
*Wintre, M. G., & Yaffe, M. (2000). First-year students’ adjustment touniversity life as a function of relationships with parents. Journal ofAdolescent Research, 15, 9–37. doi:10.1177/0743558400151002
Wolters, C., Pintrich, P., & Karabenick, S. (March, 2003). Assessingacademic self-regulated learning. Paper presented at Indicators of Pos-itive Development Conference sponsored by Child Trends, Washington,DC.
*Wolters, C. A. (1998). Self-regulated learning and college students’regulation of motivation. Journal of Educational Psychology, 90, 224–235. doi:10.1037/0022-0663.90.2.224
Wood, R., & Locke, E. (1987). The relation of self-efficacy and gradegoals to academic performance. Educational and Psychological Mea-surement, 47, 1013–1024. doi:10.1177/0013164487474017
*Woodfield, R., Jessop, D., & McMillan, L. (2006). Gender differences inundergraduate attendance rates. Studies in Higher Education, 31, 1–22.doi:10.1080/03075070500340127
*Yee, P. L., Pierce, G. R., Ptacek, J. T., & Modzelesky, K. L. (2003).Learned helplessness attributional style and examination performance:Enhancement effects are not necessarily moderated by prior failure.Anxiety, Stress & Coping, 16, 359 –373. doi:10.1080/0003379031000140928
*Zajacova, A., Lynch, S. M., & Espenshade, T. J. (2005). Self-efficacy,stress, and academic success in college. Research in Higher Education,46, 677–706. doi:10.1108/09513540910970511
Zeidner, M., & Matthews, G. (2000). Intelligence and personality. In R.Sternberg (Ed.), Handbook of intelligence (2nd ed., pp. 581–610). NewYork, NY: Cambridge University Press.
Zimmerman, B. J. (1989). Models of self-regulated learning and academicachievement. In B. J. Zimmerman & D. H. Schunk (Eds.), Self-regulatedlearning and academic achievement: Theory, research and practice (pp.1–25). New York, NY: Springer-Verlag.
Zimmerman, B. J., Bandura, A., & Martinez-Pons, M. (1992). Self-motivation for academic attainment: The role of self-efficacy beliefs andpersonal goal setting. American Educational Research Journal, 29,663–676. doi:10.3102/00028312029003663
Zwick, R. (2004). Is the SAT a “wealth test?” The link between educationalachievement and socioeconomic status. In R. Zwick (Ed.), Rethinkingthe SAT (pp. 203–216). New York, NY: Routledge Falmer
Received December 18, 2009Revision received November 7, 2011
Accepted November 14, 2011 �
387NON-INTELLECTIVE CORRELATES OF ACADEMIC PERFORMANCE