psychophysics of reading: i. normal vision · advantages of allowing for easy ......
TRANSCRIPT
Psychophysics of Reading: I. 1
PSYCHOPHYSICS OF READING: I. NORMAL VISION1 GORDON E. LEGGE, DENIS G. PELLI, GARY S. RUBIN and MARY M. SCHLESKE Abstract-This paper is about the visual requirements for reading with normal vision. It is the first in a series devoted to the psychophysics of reading with normal and low vision. We have measured reading rates for text scanned across the face of a TV monitor while varying parameters that are important in current theories of pattern vision. Our results provide estimates of the stimulus parameters required for optimal reading of scanned text. We have found that maximum reading rates are achieved for characters subtending 0.3° to 2°. Contrast polarity (black-on-white vs white-on-black text) has no effect. Reading rate increases with field size, but only up to 4 characters, independent of character size. When text is low-pass spatial-frequency filtered, reading rate increases with bandwidth, but only up to two cycles/character, independent of character size. When text is matrix sampled, reading rate increases with sample density, but only up to a critical sample density which depends on character size. The critical sample density increases from about 4 x 4 samples/character for 0.1° characters to more than 20 x 20 samples/character for 24° characters. We suggest that one spatial-frequency channel suffices for reading. INTRODUCTION Common visual tasks such as reading or visual guidance of walking require us to analyze impressive amounts of information at high rates. Yet, we do so effortlessly. How can we study the basic visual processes that underlie the performance of these tasks? A strategy that has been successful in basic studies of vision has been to vary some critical stimulus parameter (such as luminance or contrast) to find a threshold value required for the observer to perform a simple task. The results of such studies have been used to infer properties of the visual mechanisms underlying performance of the task. We have used a similar strategy to study the more complex visual task of reading. For example, we have found that the critical spatial-frequency bandwidth required for reading is about two cycles per character. We take this result to suggest that only one spatial-frequency channel is required for reading. We have used psychophysical methods in this way to study the stimulus parameters required for reading. Where possible, we have tried to relate our results to known properties of vision. Reading is a crucial component of full participation in society. People who are deprived of immediate and convenient access to the printed word because of low vision are correspondingly handicapped. It has been estimated (National Society to Prevent Blindness, 1977) that about 2 million Americans have severely impaired vision, that is, cannot read a newspaper at a normal reading distance, even with glasses. A major purpose of our research is to investigate how visual disabilities of different kinds affect reading performance. To achieve this purpose, we must first understand how visual factors limit reading performance with normal vision. This is the subject of the present paper. In the accompanying paper (Legge et al., 1985), the results of comparable
1 Reprinted from Vision Research, Vol. 25, No. 2, pp. 239-252, 1985.
Psychophysics of Reading: I. 2
measurements on a group of low-vision observers will be reported. The third paper in this series (Pelli et al., 1985) describes a new reading aid for the partially sighted based on these findings. We began by developing a suitable psychophysical procedure for measuring reading performance. In our procedure, observers are required to read aloud individual lines of text that are scanned across the face of a television monitor. The scanning rate is increased until the observer begins to make mistakes. Reading rate, in words per minute, is computed after correction for errors. At some scanning rate, the reading rate is maximal. This maximal reading rate can be measured as a function of any stimulus or observer variable. This procedure has the advantages of allowing for easy experimental control of stimulus parameters and straightforward measurement of reading performance. Moreover, the reading of scanned text is similar to the way many partially sighted people read when they manually scan text across the screen of a closed-circuit TV magnifier or a high-power optical magnifier. The procedure has two major disadvantages. First, it relies on oral reading rather than the more common silent reading. Second, it measures performance for text scanned across the field whereas everyday reading involves the scanning of the eyes across stationary text. However, we have conducted control experiments in which observers read scanned or stationary text silently. Only in the case of our "window" experiment do we feel that our method is likely to yield findings having important differences from everyday reading. Methods similar to ours have been used in the past to study properties of normal reading (Newman, 1966; Bouma and de Voogd, 1974) and low-vision reading (Krischer and Meissen, 1983; Goodrich et al., 1977). In this paper we report the effects on reading of character size, sample density, blur (spatial-frequency bandwidth), number of characters in the field, and contrast polarity. In the following paragraphs we briefly discuss the significance of these variables for reading and our reasons for studying them. Character size Little attention has been given to the effects of angular character size on reading rate. This is sur-prising in light of the importance attached to the role of bar width (or spatial frequency) in recent studies of pattern vision. We can be sure that reading rate deteriorates for very small characters approaching the acuity limit of about 5' arc (20/20 Snellen letters are 5' wide). But at what letter size does performance begin to decline? Is there an optimal character size, or is performance independent of character size over a large range of size? How does performance fare with very large characters, greater than 5°? The last question is particularly pertinent to low vision where large magnification is often necessary before any reading is possible. Tinker (1963, Chap. 7) reported very small differences in reading speed for several sizes of newspaper type. He did not control viewing distance so we do not know the angular subtense of his characters. Howell and Kraft (1960) measured the legibility of alphanumeric symbols for four letter sizes ranging from 6' to 37' arc. They found optimal legibility for 26' (0.4°) characters. Bouma et al. (1982) measured oral reading rates for text whose characters ranged in size from 0.3° to 2.8°. They found a slight increase in reading rate with increased character size. None of these studies has thoroughly documented the role of character size in reading. We measured reading rates for character sizes from 3.6' to 24°, a 400:1 range.
Psychophysics of Reading: I. 3
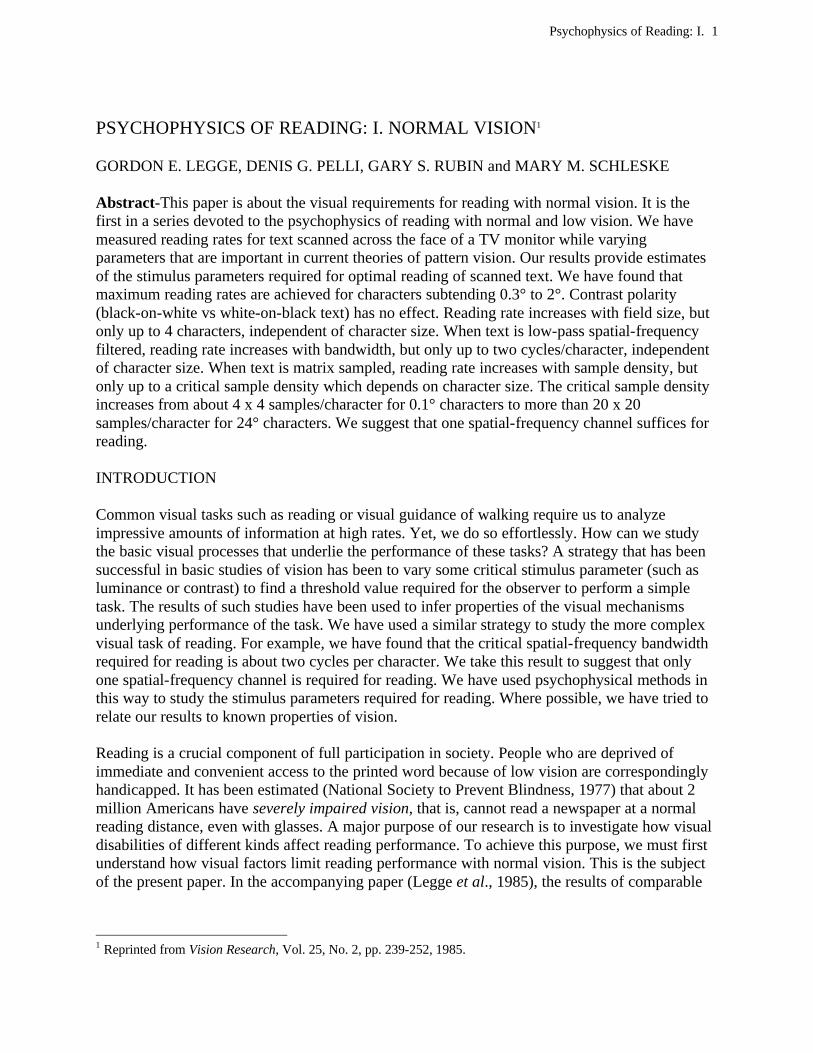
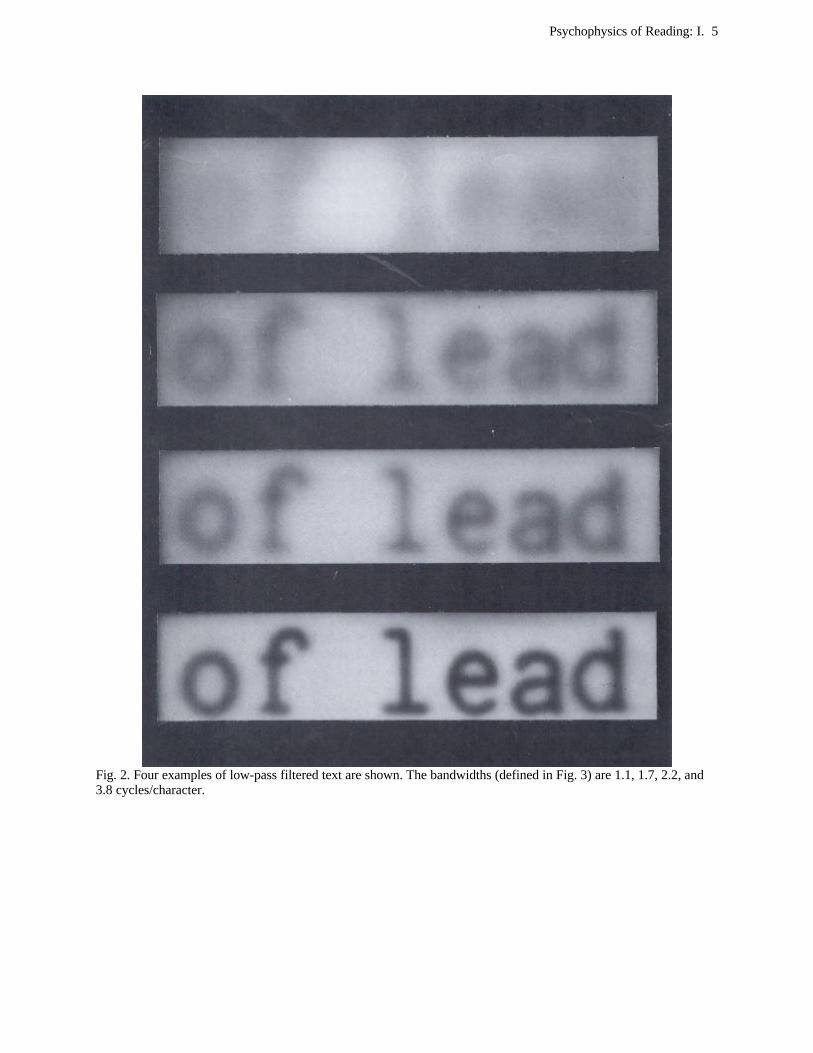
How much visual information is required to read? We examined this question by reducing the amount of visual information in three ways: by matrix sampling, by blurring, and by "windowing" (restricting the number of characters simultaneously visible). Matrix sampling Matrix displays depict visual information, such as pictures or text, by reproducing an array of samples from the original image. For example, a halftone photograph in a newspaper might be composed of 25 x 25 white and black dots per cm². In Fig. 1 four examples of sampling are shown for the same line of text. The sample densities range from about 2.8 x 2.8 to 11 x 11 samples/character. By varying the sample density the amount of visual information available to the observer can be controlled. However, the static illustrations in Fig. 1 do not reveal the dynamic character of our displays. In our experiments the sampling grid was fixed relative to the TV monitor while the text drifted by, like the headlines in Times Square, New York City. By determining the minimum sample densities required for optimal reading rate we hope to provide guidelines for the design of inexpensive, low-resolution, reading aids for the partially sighted. In a similar fashion, television engineers have been interested in establishing minimum resolution (and bandwidth) for the transmission and display of TV images (see, e.g. Pearson, 1975). Sample densities of about 11 x 11 samples/character have been found necessary for reliable identification of individual stationary letters (Arps et al., 1969) or words (Erdmann and Neal, 1968). According to Shurtleff (1967), 5-12 raster lines per character are required for high legibility with TV displays. However, these studies are difficult to evaluate because the angular sizes of letters at the observer's eyes were usually not specified. For recognition of geometric symbols, Hemingway and Erickson (1969) found a trade-off between angular subtense and the number of raster lines per symbol, suggesting the importance of visual angle. We measured the effects of matrix sampling on reading over a wide range of character sizes. Blur Blurring with a ground-glass diffuser may be described as low-pass spatial-frequency filtering. The bandwidth of the filter can be specified in cycles per picture width. When we increase the blur we decrease the bandwidth (see Fig. 2). We can determine the minimum bandwidth which allows reading at near maximal rates. We call this the "critical" bandwidth. Knowledge of the critical bandwidth may help us to understand the role of spatial frequency selective mechanisms in the reading process. Moreover, blur plays an important role in several forms of low vision, e.g. cataract, keratoconus, and corneal scarring. Limitations imposed by blur are critical to the understanding of low-vision reading. Ginsburg (1978) prepared pictures of single letters that were spatial-frequency filtered. He demonstrated that legibility required bandwidths in the range 1.5-3 cycles per character width. We measured critical bandwidths for reading to see whether such low bandwidths would apply to this more complex task. Once again, we varied character size over a wide range.
Psychophysics of Reading: I. 4
Fig. 1. Four examples of sampled text are shown. The sample densities are about 2.8 x 2.8, 5.6 x 5.6, 11 x 11 and 22 x 22 samples/character. In these examples, both the text and the sampling grid are stationary. In our experiments, the text was scanned behind the sampling grid.
Psychophysics of Reading: I. 5
Fig. 2. Four examples of low-pass filtered text are shown. The bandwidths (defined in Fig. 3) are 1.1, 1.7, 2.2, and 3.8 cycles/character.
Psychophysics of Reading: I. 6
"Windows" We limited the number of characters simultaneously visible on the screen, i.e. the window width. How large a window is required for optimal reading? What is the smallest window for which reading is still possible? Answers to these questions are important for the design of low-vision reading aids and for the understanding of limitations imposed by retinal-field loss. Poulton (1962) measured error rates for reading through a window (a long one-character-high hole in an opaque card) scanned across a typewritten line. When replotted as reading rate (i.e. scanning rate times proportion correct) Poulton's data show that reading rate is proportional to window width up to a critical window width of 7-8 characters. Taenzer (1970) and Bertora (see Taenzer, 1972) reported a few measurements of reading of text displayed on an array of lights analogous to the array of tactile vibrators of the OPTACON (OPtical to TActile CONverter) which was the primary topic of their articles. Taenzer (1970) found reading rate increased proportionally when he increased window width from 0.75 to 1.1 character. Bertora allowed the subjects to control the scanning rate and used windows 0.75, 1.5, and 2.25 characters wide. Extrapolation of the curve he fit to his data suggests that asymptotic reading rate would be achieved for windows about 3.4 characters wide. Newman (1966) used movie film to scan text across a screen at 10 frames/sec. Each frame contained from 1 to 8 characters. The scan rate was controlled by presenting the same frame successively from 1 to 5 times. Unfortunately, his fastest scan rate was insufficient to locate maximum reading rates for any but the smallest windows, so we cannot infer critical window widths from Newman's data. By comparison, studies of everyday reading, in which saccadic eye movements control the point of fixation, indicate that reading speed increases as field size is increased up to 4 characters to the left of fixation and 15 characters to the right of fixation (Rayner and Bertera, 1979; Rayner et al., 1980). Although not definitive, the Poulton, Taenzer, and Newman studies suggest that the critical window widths for the reading of scanned text are less than those for everyday reading. We examined this point in detail by measuring reading rates as a function of window width for windows from 0.25 to 20 characters wide. Contrast polarity Contrast is undoubtedly an important parameter in reading. A detailed report on this topic will appear in a later paper in this series. In the present paper, we deal only with contrast polarity, that is, white-on-black vs black-on-white text. It is known that some low-vision observers prefer white-on-black print (Sloan, 1977). In many cases this preference is probably related to abnormal light scatter in the eye. On the other hand, there have been several reports of small advantages in reading performance in normal reading for black-on-white print, especially for small letters. For a review see Tinker (1963, Chap 9). The difference for normal observers may be related to the level of illumination. Wilcox (1932) showed that a minimum-separable measure of acuity had a different dependence on luminance for white bars on dark backgrounds than for dark bars on white backgrounds. Recent interest in contrast polarity centers on alternatives for the presentation of text on video-display terminals. Bauer and Cavonious (1980) found slightly lower error rates in character recognition and detection-of-discrepancy tasks for observers who
Psychophysics of Reading: I. 7
worked with black-on-white compared with white-on-black video-display terminals. In several of our experimental conditions we compared reading performance for the two contrast polarities. METHOD Apparatus The display was a Visualtek Model MV-2 Miniviewer2 closed-circuit TV system. When text appeared on the screen it was either white letters on a black background, or black letters on a white background. In both cases, contrast exceeded 94%, and the bright parts of the field had a luminance of about 300 cd/m². The screen was masked to an aperture 25 cm wide by 7 cm high, through which a single line of text was scanned during a trial. Text, printed on cards, was placed flat on a movable platform beneath the TV camera. A motor, pulleys, and rubber belts pulled the platform along a track so that the text swept beneath the camera's field of view. Linearity of the sweep was checked photometrically on the TV screen, and found to be within ± 5%. A single scan could be triggered with a button press, and its speed was controlled by adjusting a potentiometer that regulated the voltage driving the motor. The period of the sweep, in seconds, could be read from a digital timer. (In some early experiments, a mirror-galvanometer was used to scan the text across the camera's field of view.) Throughout this paper, character size and character width mean the center-to-center spacing of the characters, i.e. the width of one character space. The text was printed with a carbon ribbon in a Diablo Elite 12 type font in both upper and lower case. This font has serifs and uniform pitch. The text was prepared with left and right justification on 80-character lines. Spaces were added between words, where necessary, to fill out lines of text. Text was selected from materials designed to test reading ability (Turner, 1978; McCall and Crabbs, 1979; Schmelzer et al., 1980) and ranged in difficulty from Grade 4 to secondary school levels. In all cases, care was taken to ensure that the level of difficulty of the text did not exceed the reading level of the observer. For most conditions, the zoom lens on the TV camera was set so that 10 character spaces occupied the 25-cm screen width. In one experiment, the size of characters on the screen was reduced by adjusting the zoom lens on the camera so that 20 character spaces would fit within the 25-cm wide aperture. The angular subtense of the characters was controlled by varying the viewing distance, taking care to refract observers appropriately where necessary. In a control experiment, text was photographically reproduced on large white cards. There were 12 lines of black text on each card, and each line was 40 characters long. The cards were illuminated to 200 cd/m², and viewed from a distance of 25, 200, or 1200 cm. For the 25 cm viewing condition the cards were mounted on a curved frame so that the text remained a constant distance from the observer's eyes as she turned her head to read. During the experimental sessions, the room lights were turned off. Stray light from the lamp that illuminated the text was blocked from the observer. 2 Manufactured by Visualtek, 1610-26th Street, Santa Monica, CA.
Psychophysics of Reading: I. 8
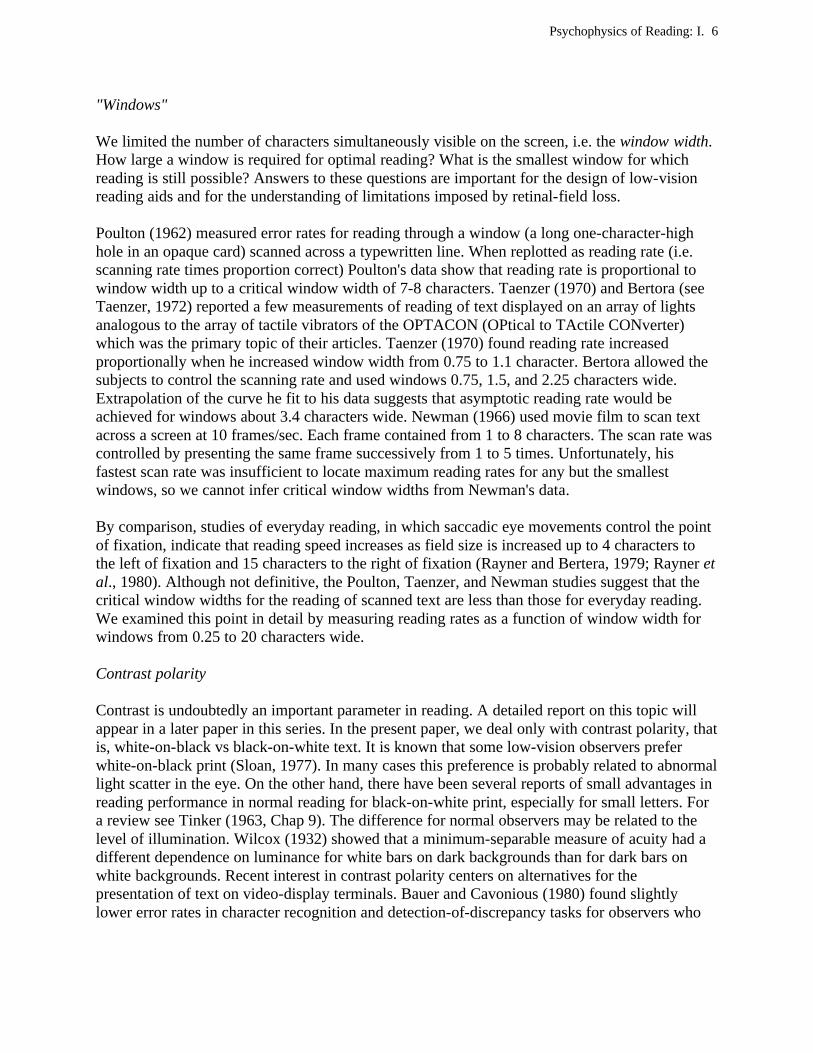
To create a matrix display, an opaque, black acetate sheet with a regular array of transparent holes was placed over the TV screen. The sample density associated with the matrix display is designated N x N samples/character, indicating that the array consisted of N holes horizontally per character space (usually 2.5 cm), and the same density vertically. Different acetate sheets contained arrays of different sample densities. In Fig. 1, the same line of text is shown four times, with four different sample densities. (During the actual experiments, only one line of text was visible at a time.) The sheet was oriented so that the axes of nearest-neighbor holes were 45° from the horizontal, as shown in Fig. 1. Our sample densities ranged from 1.4 x 1.4 to 22 x 22 samples/character in factors of about 2. We also examined the effects of blur on reading performance. Blur was introduced by interposing a diffuser (a 25-cm horizontal by 12.5-cm vertical sheet of ground glass) between the observer and the TV screen. The amount of blur was determined by the distance of the diffuser from the screen and was adjusted by means of a manual, screw-driven positioner. A similar optical display, using rear-projection screen material instead of ground glass as the diffuser, was described by Carlson and Heyman (1979). The modulation transfer function (MTF) of the diffuser was measured with a slit telephotometer (UDT 80X Opto-meter) as follows. High contrast sine-wave gratings were displayed on a CRT (Joyce Electronics, P-31 phosphor). The diffuser was positioned between the photometer and CRT, and the contrast of the grating was measured as a function of grating spatial frequency and diffuser-to-display distance. These contrasts were compared with contrasts measured in the absence of the diffuser.
Fig. 3. Modulation transfer functions for diffuser. Modulation transfer of the ground-glass diffuser is plotted as a function of spatial frequency (in cycles/em). Data are shown for five diffuser-to-CRT optical distances. Optical distances are measured from the diffusing surface of the ground glass to the CRT phosphor. Smooth curves, differing only by horizontal shifts, have been fit to the data by eye. The radial bandwidth of the diffuser is defined for each distance as the spatial frequency at which the smooth curve has declined to 1/e, indicated by the horizontal dashed line. As a fraction of the 1/e bandwidth, the half-amplitude and half-power bandwidths are 0.76 and 0.48, respectively. The MTF of the diffuser is shown in Fig. 3 for several diffuser-to-CRT distances. The curves fit to the data are identical in shape, but differ from one another by horizontal shifts. The shape was determined by shifting the data for each diffuser-to-CRT distance horizontally into superposition.
Psychophysics of Reading: I. 9
A smooth curve was fit to the shifted data by eye. This curve was used as a template for each of the curves in Fig. 3. Since the diffuser acted as a radially-symmetric, low-pass filter, we can characterize the amount of blur by the radial bandwidth of the filter. As a measure of bandwidth, we used the spatial frequency at which the MTF has declined to 1/e. We also measured the effect of window width, that is, the number of character spaces visible on the screen. This variable was manipulated by occluding appropriate portions of the 25-cm horizontal aperture on the display. Our window widths varied from 0.25 to 20 characters in factors of about 2. Procedure At the beginning of a reading trial, the first letter of a line of text was visible at the right margin of the display. After giving a warning, the experimenter pressed a button which initiated a sweep of a line of text across the screen. The sweep terminated when the last character on the line disappeared at the left margin. The observer was required to read the line of text aloud. The experimenter counted the number of erroneous or missed words with the aid of a fair copy. Then reading rate was computed as the product of scanning rate, in words/minute, and the proportion of words correctly identified. A single reading-rate measure was based on performance on two lines of text, both presented with the same scanning rate. Two procedures were used to collect the reading rate data. The first used a method of constant stimuli. The percentage of words correctly read was recorded for each of a set of scanning rates. Scanning rates were selected to span a range from perfect reading (100% correct) to ineffective reading. Reading rate was then computed for each scanning rate. The second method used an adjustment procedure. The experimenter adjusted the scanning rate until one was found for which the observer made a small number of errors. Control experiments were conducted in which observers read scanned or stationary text silently. For the scanned text, the experimenter adjusted the scanning rate until the observer reported that the text was being presented at the fastest rate that could be read without skimming or skipping words. For the stationary conditions, the experimenter gave a warning signal, then uncovered six lines of text on the large card. The observer indicated when she had completed reading the lines. To compute reading rates, it was assumed that all words were correctly read. Occasionally, during the silent reading experiments, the observers were asked to paraphrase the lines of text just read, which they did without difficulty. In a typical experimental session, reading rates were obtained from one observer while one stimulus parameter was varied, e.g. reading rate as a function of sample density, with other stimulus properties held constant. A typical session took about 2 hours. At least two separate measures of reading rate were taken for every observer for every condition in which they participated. Geometric means are plotted in the figures. Observers
Psychophysics of Reading: I. 10
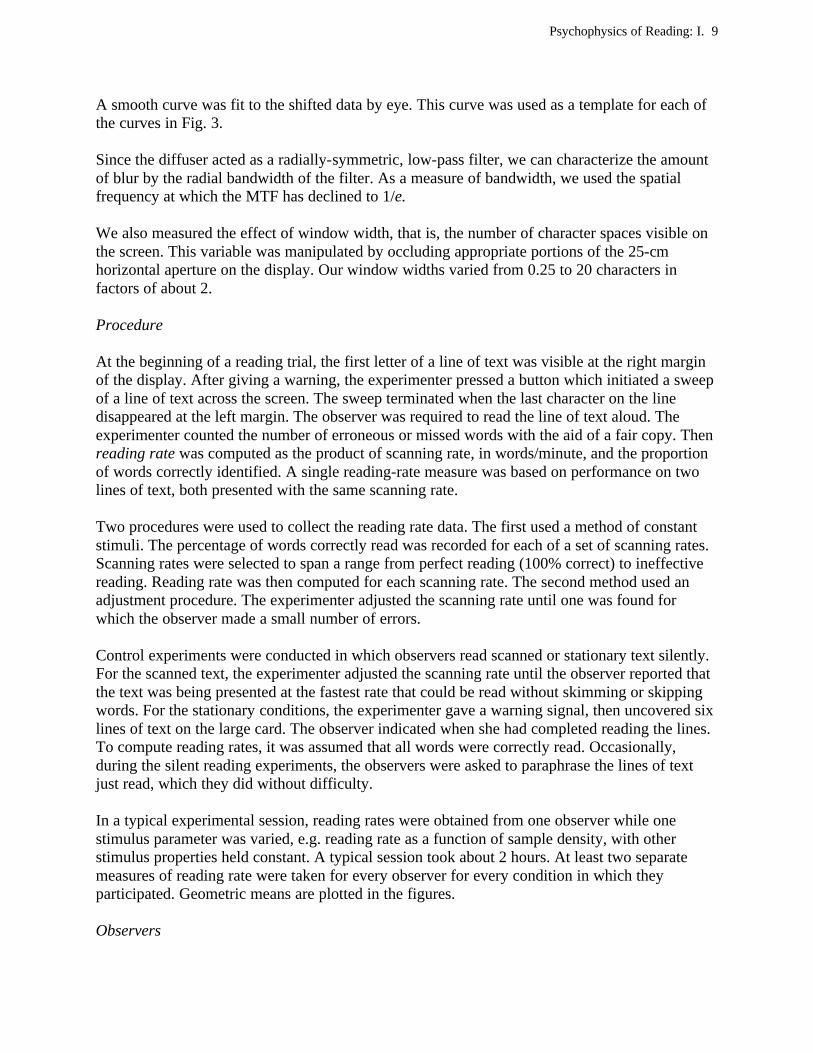
Six observers participated in the experiments. Five were emmetropic, and one wore contact lenses to correct a moderate myopia. Each had 20/20 acuity or better, and had extensive practice with the reading task. All were college students in their twenties. For some viewing distances, spectacle lenses were worn to aid accommodation. RESULTS AND DISCUSSION Scanning rate and reading rate There is a very sharp transition from nearly perfect reading to ineffective reading as scanning rate increases. In Fig. 4(a), data are shown for observer K.S. in three conditions. The horizontal axis is scanning rate in words/minute, representing the rate at which text was scanned across the screen. The vertical axis is the percentage of words correctly read. The three psychometric functions refer to conditions that varied in the density of matrix sampling, all with 6° characters. The two sets of overlapping data on the right are for sample densities of 22 x 22 samples/character, and for text presented in the absence of matrix sampling. K.S. read perfectly for scanning rates up to about 230 words/minute, but for scanning rates of about 300 words/minute, she dropped below 50% correct. For coarser sampling, 5.6 x 5.6 samples/character, K.S. read perfectly only for scanning rates up to about 145 words/minute. Psychometric functions like those in Fig. 4(a) are typical of all of our observers in all conditions tested: perfect reading up to a critical scanning rate and a precipitous decline in performance for faster scanning rates. For very rapid scans, the observers often finished speaking well after the scan was terminated. However, none reported any difficulty remembering the text to be spoken. A control experiment was conducted to determine whether reading rates might somehow be limited by the requirement that each word be spoken aloud. An observer read aloud 50 lines of text that were scanned at a rate that produced about three errors per line (about 250 words/minute for this observer). The experimenter noted where errors occurred in each line. The frequency of errors was compiled for each five-letter interval across the 80-character line. If memory limitations played a significant role in constraining reading performance, then one would expect errors to occur more often towards the end of the line than towards the beginning. However the distribution of errors did not differ significantly from a uniform distribution (X² test; P > 0.5).
Psychophysics of Reading: I. 11
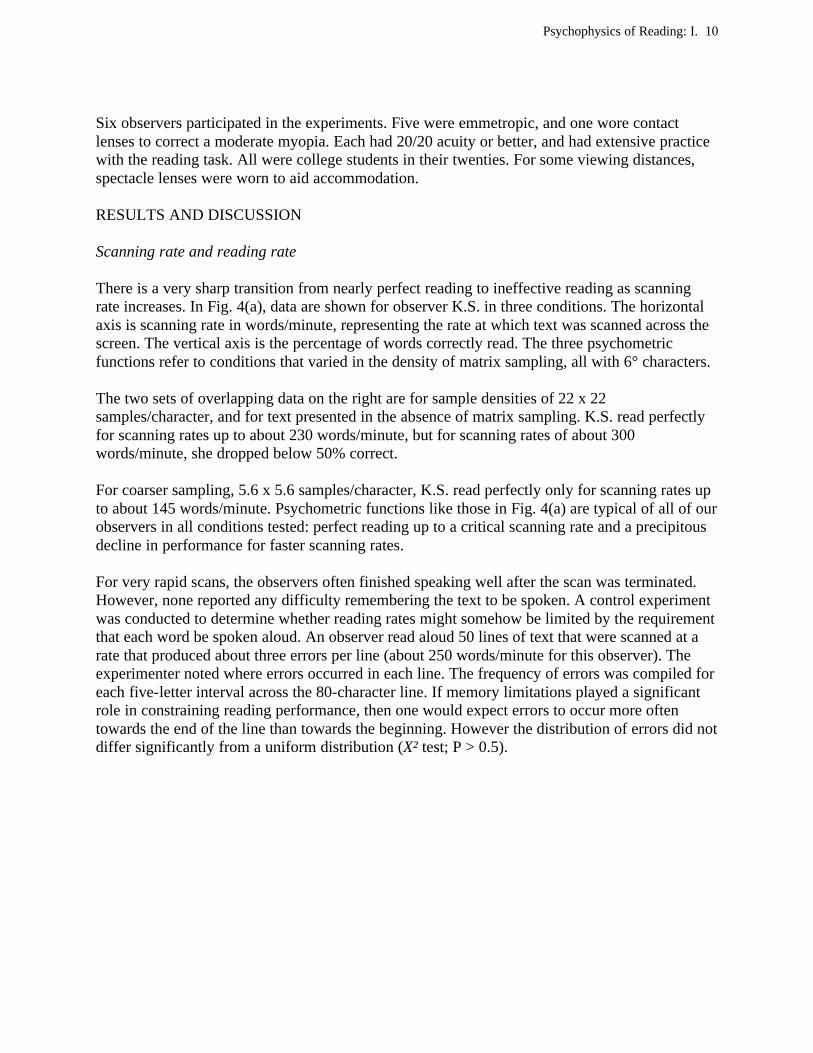
Fig. 4. Reading accuracy as a function of scanning rate. (a) Percentage of words correctly read is plotted as a function of scanning rate for observer K.S. Data for sample densities of 5.6 x 5.6 and 22 x 22 samples/character are shown, as well as data collected in the absence of a sampling grid. The horizontal solid line at 100% correct represents perfect reading. (b) The data of panel (a) have been replotted as reading rate vs scanning rate. Reading rate is the product of scanning rate and proportion correct. The diagonal solid line represents perfect reading. In Fig. 4(b), the data of Fig. 4(a) have been transformed to reading rate as a function of scanning rate. Reading rate, in words per minute, is the product of scanning rate and proportion correct. It is a measure of reading performance that represents the number of words correctly read per minute. The functions in Fig. 4(b) have relatively sharp peaks, indicating that there is a narrow range of scanning rates for which maximum reading can be achieved for a given set of stimulus conditions. At low scanning rates, reading is perfect, and reading rate equals the scanning rate of the stimulus. At higher scanning rates, reading breaks down, and a high proportion of errors results as the text is rapidly scanned through the field of view. We discovered that the maximal reading rate, represented by the peaks of functions like those in Fig. 4(b), provides a robust measure of reading performance for a given set of stimulus conditions. We used this measure in most of our experiments. It is not necessary to measure entire psychometric functions to obtain this maximal reading rate. Instead, the experimenter adjusts the scanning rate until the observer makes a nonzero, but low proportion of errors. Because the transition from errorless to ineffective reading is so sudden, the critical scanning rate is quite easy to find. Once the appropriate scanning rate has been located, reading rate is just the scanning rate multiplied by the proportion of words correctly read. This
Psychophysics of Reading: I. 12
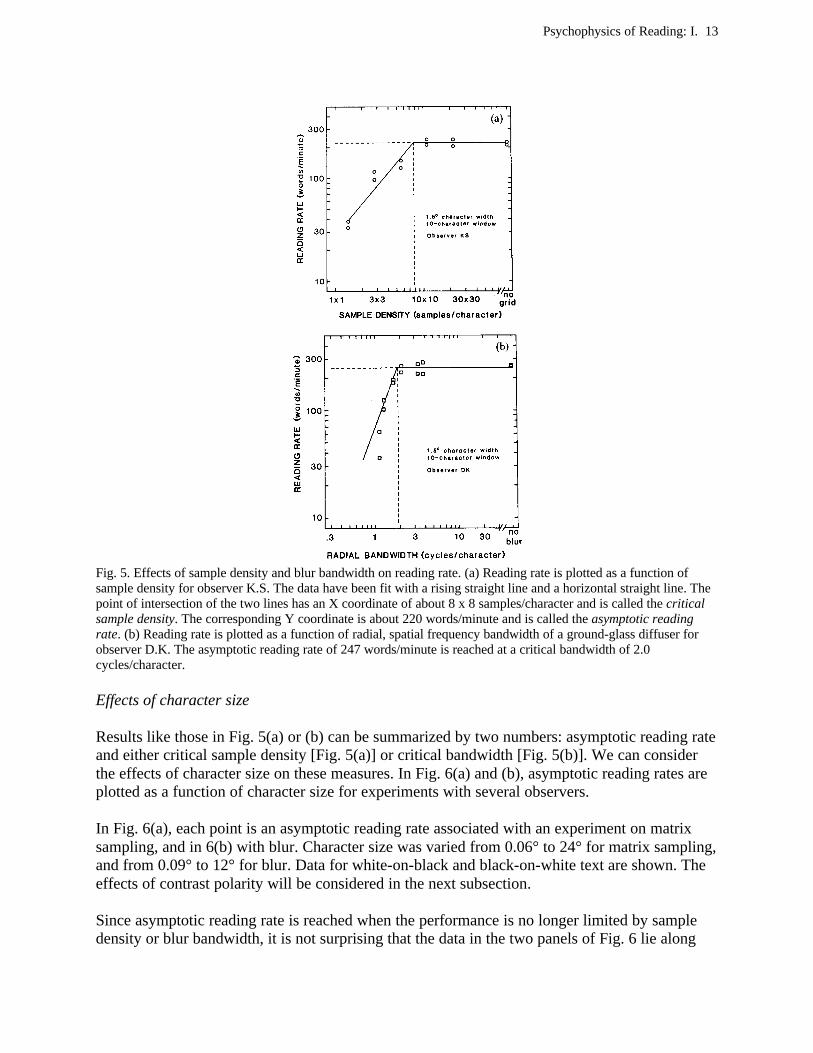
reading rate measure (maximal reading rate for all scanning rates) appears as the dependent variable in the remainder of the figures of this paper. In every case, observers were given enough practice with the stimuli to reach stable performance. Effects of sample density and spatial frequency bandwidth on reading rate For matrix sampling, an opaque plastic sheet with a regular matrix of transparent, circular holes was placed over the display. Figure 5(a) shows the dependence of reading rate on sample density for observer K.S. for 1.5° characters. We have found that we can fit most graphs of reading rate vs sample density by a two-limbed function, containing a rising straight line and a horizontal straight line. Such two-limbed fits (Hinkley, 1969, 1971) allow us to summarize the graph by the coordinates of the point of intersection of the two lines. The X-coordinate of this point will be called the critical sample density. The Y-coordinate will be called the asymptotic reading-rate. The critical sample density is the minimum density required for nearly optimal reading. The asymptotic reading rate is a measure of optimal performance. In Fig. 5(a), the critical sample density for K.S. is about 8 x 8 samples/character, and the corresponding asymptotic reading rate is about 220 words/minute. The slope of the straight line through the data below the critical sample density is 1. For some cases, reading performance declined more rapidly than shown in this figure. In general, there was considerable variability in the value of this slope. Variability in performance was particularly marked for very low sample densities. For densities as low as 2.8 x 2.8 samples/character, the motion of the text behind the sampling grid sometimes allowed for nonzero reading rates; on other occasions, nothing could be read. Furthermore the rising straight line segment is often not a good fit to the data. Nevertheless, it is still adequate to accurately determine the location of the critical point, which is our primary interest. We found little variation in the values of the critical sample density and asymptotic reading rate across observers and for repeated measurements with the same observer. We also used a sheet of ground glass as a diffuser to blur the text. The observers read text through the diffuser, which acted as a low-pass spatial-frequency filter. Figure 5(b) presents the results of an experiment with observer D.K. for 1.5° characters. Reading rate is plotted as a function of the radial bandwidth (see Method) in cycles/character of the spatial frequency filter. Excluding the leftmost points at a bandwidth of 1.1 cycles/character, the data can again be fit by a rising straight line and a horizontal straight line. We found that fits of this sort provided good descriptions of our blur data. In this case, the X-coordinate of the point of intersection of the two lines will be called the critical bandwidth. The critical bandwidth is the minimum spatial-frequency bandwidth required for nearly optimal reading. In Fig. 5(b), the critical bandwidth is 2.0 cycles/character, for which D.K.'s asymptotic reading rate was 247 words/minute.
Psychophysics of Reading: I. 13
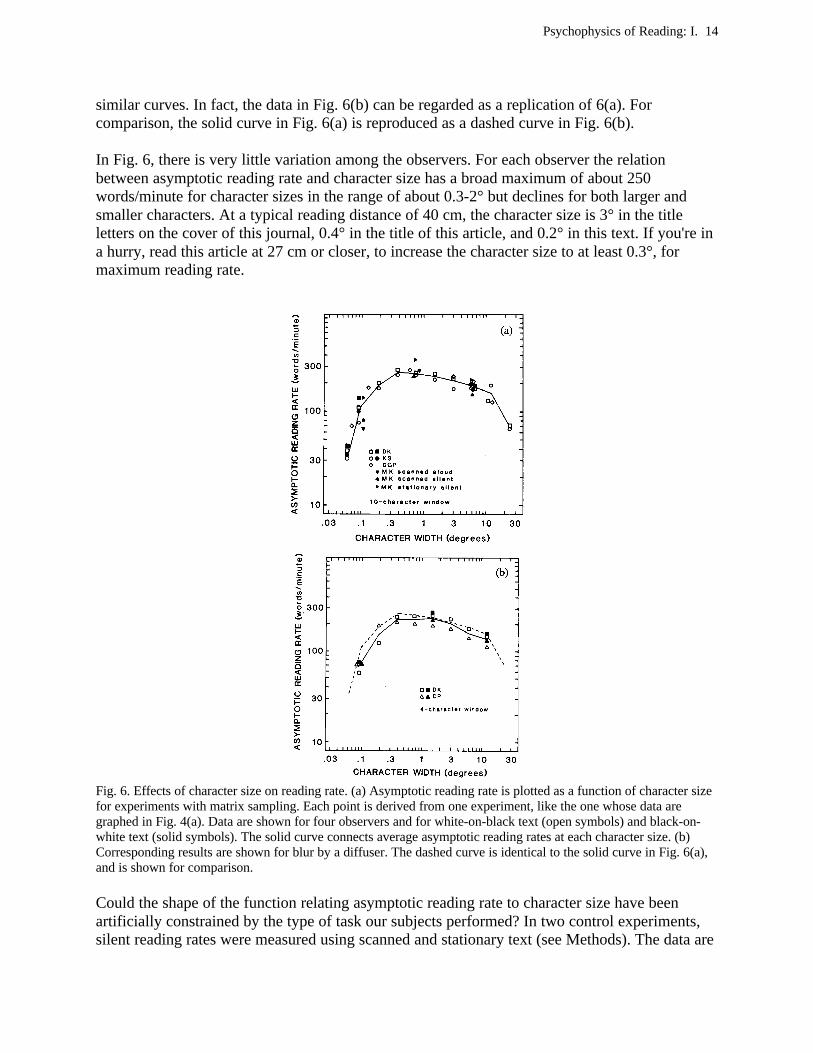
Fig. 5. Effects of sample density and blur bandwidth on reading rate. (a) Reading rate is plotted as a function of sample density for observer K.S. The data have been fit with a rising straight line and a horizontal straight line. The point of intersection of the two lines has an X coordinate of about 8 x 8 samples/character and is called the critical sample density. The corresponding Y coordinate is about 220 words/minute and is called the asymptotic reading rate. (b) Reading rate is plotted as a function of radial, spatial frequency bandwidth of a ground-glass diffuser for observer D.K. The asymptotic reading rate of 247 words/minute is reached at a critical bandwidth of 2.0 cycles/character. Effects of character size Results like those in Fig. 5(a) or (b) can be summarized by two numbers: asymptotic reading rate and either critical sample density [Fig. 5(a)] or critical bandwidth [Fig. 5(b)]. We can consider the effects of character size on these measures. In Fig. 6(a) and (b), asymptotic reading rates are plotted as a function of character size for experiments with several observers. In Fig. 6(a), each point is an asymptotic reading rate associated with an experiment on matrix sampling, and in 6(b) with blur. Character size was varied from 0.06° to 24° for matrix sampling, and from 0.09° to 12° for blur. Data for white-on-black and black-on-white text are shown. The effects of contrast polarity will be considered in the next subsection. Since asymptotic reading rate is reached when the performance is no longer limited by sample density or blur bandwidth, it is not surprising that the data in the two panels of Fig. 6 lie along
Psychophysics of Reading: I. 14
similar curves. In fact, the data in Fig. 6(b) can be regarded as a replication of 6(a). For comparison, the solid curve in Fig. 6(a) is reproduced as a dashed curve in Fig. 6(b). In Fig. 6, there is very little variation among the observers. For each observer the relation between asymptotic reading rate and character size has a broad maximum of about 250 words/minute for character sizes in the range of about 0.3-2° but declines for both larger and smaller characters. At a typical reading distance of 40 cm, the character size is 3° in the title letters on the cover of this journal, 0.4° in the title of this article, and 0.2° in this text. If you're in a hurry, read this article at 27 cm or closer, to increase the character size to at least 0.3°, for maximum reading rate.
Fig. 6. Effects of character size on reading rate. (a) Asymptotic reading rate is plotted as a function of character size for experiments with matrix sampling. Each point is derived from one experiment, like the one whose data are graphed in Fig. 4(a). Data are shown for four observers and for white-on-black text (open symbols) and black-on-white text (solid symbols). The solid curve connects average asymptotic reading rates at each character size. (b) Corresponding results are shown for blur by a diffuser. The dashed curve is identical to the solid curve in Fig. 6(a), and is shown for comparison. Could the shape of the function relating asymptotic reading rate to character size have been artificially constrained by the type of task our subjects performed? In two control experiments, silent reading rates were measured using scanned and stationary text (see Methods). The data are
Psychophysics of Reading: I. 15
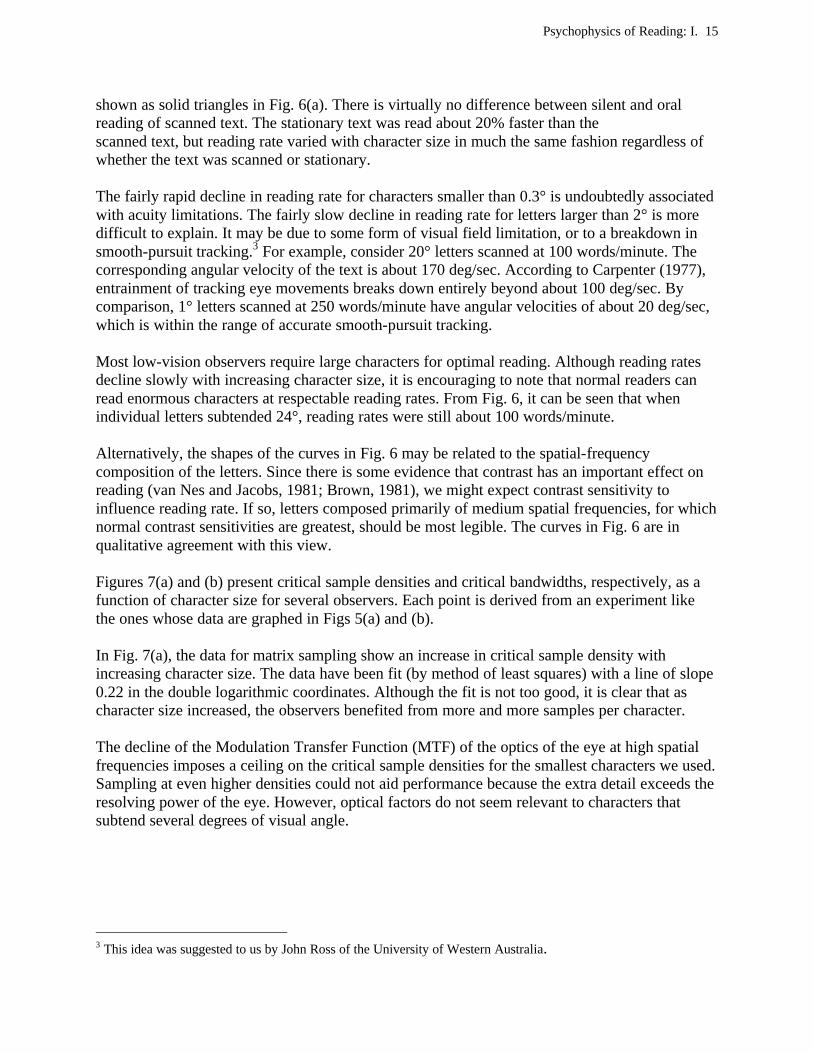
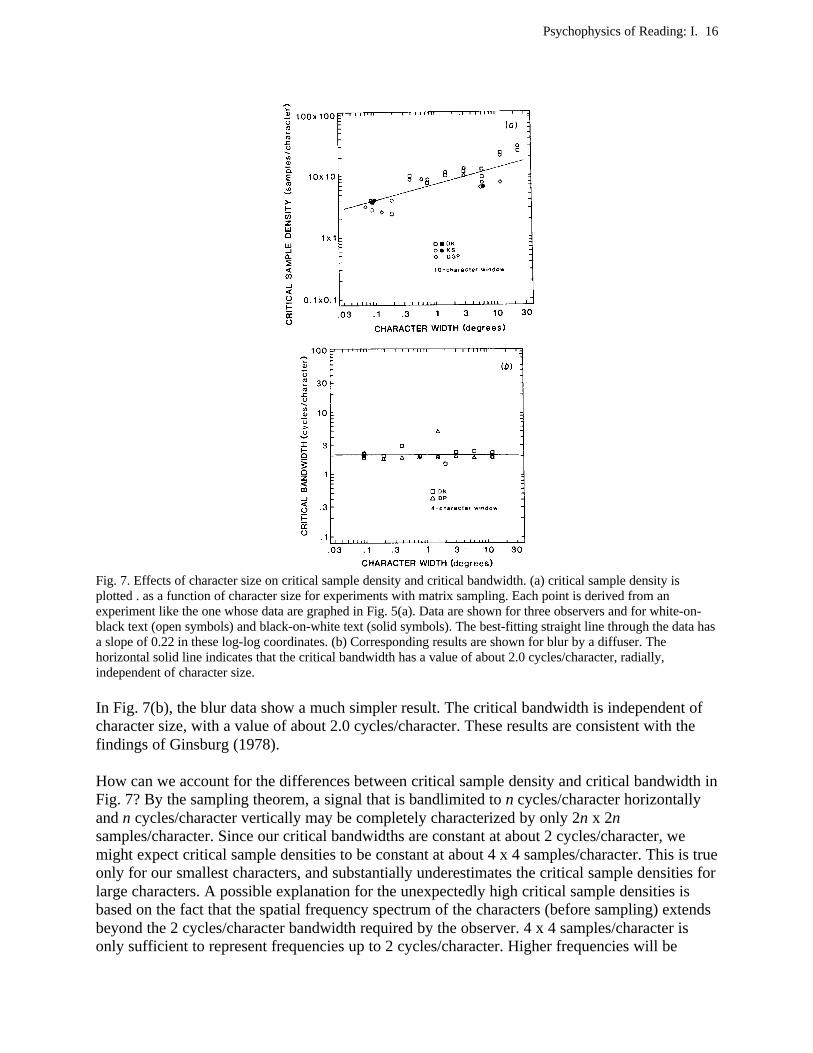
shown as solid triangles in Fig. 6(a). There is virtually no difference between silent and oral reading of scanned text. The stationary text was read about 20% faster than the scanned text, but reading rate varied with character size in much the same fashion regardless of whether the text was scanned or stationary. The fairly rapid decline in reading rate for characters smaller than 0.3° is undoubtedly associated with acuity limitations. The fairly slow decline in reading rate for letters larger than 2° is more difficult to explain. It may be due to some form of visual field limitation, or to a breakdown in smooth-pursuit tracking.3 For example, consider 20° letters scanned at 100 words/minute. The corresponding angular velocity of the text is about 170 deg/sec. According to Carpenter (1977), entrainment of tracking eye movements breaks down entirely beyond about 100 deg/sec. By comparison, 1° letters scanned at 250 words/minute have angular velocities of about 20 deg/sec, which is within the range of accurate smooth-pursuit tracking. Most low-vision observers require large characters for optimal reading. Although reading rates decline slowly with increasing character size, it is encouraging to note that normal readers can read enormous characters at respectable reading rates. From Fig. 6, it can be seen that when individual letters subtended 24°, reading rates were still about 100 words/minute. Alternatively, the shapes of the curves in Fig. 6 may be related to the spatial-frequency composition of the letters. Since there is some evidence that contrast has an important effect on reading (van Nes and Jacobs, 1981; Brown, 1981), we might expect contrast sensitivity to influence reading rate. If so, letters composed primarily of medium spatial frequencies, for which normal contrast sensitivities are greatest, should be most legible. The curves in Fig. 6 are in qualitative agreement with this view. Figures 7(a) and (b) present critical sample densities and critical bandwidths, respectively, as a function of character size for several observers. Each point is derived from an experiment like the ones whose data are graphed in Figs 5(a) and (b). In Fig. 7(a), the data for matrix sampling show an increase in critical sample density with increasing character size. The data have been fit (by method of least squares) with a line of slope 0.22 in the double logarithmic coordinates. Although the fit is not too good, it is clear that as character size increased, the observers benefited from more and more samples per character. The decline of the Modulation Transfer Function (MTF) of the optics of the eye at high spatial frequencies imposes a ceiling on the critical sample densities for the smallest characters we used. Sampling at even higher densities could not aid performance because the extra detail exceeds the resolving power of the eye. However, optical factors do not seem relevant to characters that subtend several degrees of visual angle.
3 This idea was suggested to us by John Ross of the University of Western Australia.
Psychophysics of Reading: I. 16
Fig. 7. Effects of character size on critical sample density and critical bandwidth. (a) critical sample density is plotted . as a function of character size for experiments with matrix sampling. Each point is derived from an experiment like the one whose data are graphed in Fig. 5(a). Data are shown for three observers and for white-on-black text (open symbols) and black-on-white text (solid symbols). The best-fitting straight line through the data has a slope of 0.22 in these log-log coordinates. (b) Corresponding results are shown for blur by a diffuser. The horizontal solid line indicates that the critical bandwidth has a value of about 2.0 cycles/character, radially, independent of character size. In Fig. 7(b), the blur data show a much simpler result. The critical bandwidth is independent of character size, with a value of about 2.0 cycles/character. These results are consistent with the findings of Ginsburg (1978). How can we account for the differences between critical sample density and critical bandwidth in Fig. 7? By the sampling theorem, a signal that is bandlimited to n cycles/character horizontally and n cycles/character vertically may be completely characterized by only 2n x 2n samples/character. Since our critical bandwidths are constant at about 2 cycles/character, we might expect critical sample densities to be constant at about 4 x 4 samples/character. This is true only for our smallest characters, and substantially underestimates the critical sample densities for large characters. A possible explanation for the unexpectedly high critical sample densities is based on the fact that the spatial frequency spectrum of the characters (before sampling) extends beyond the 2 cycles/character bandwidth required by the observer. 4 x 4 samples/character is only sufficient to represent frequencies up to 2 cycles/character. Higher frequencies will be
Psychophysics of Reading: I. 17
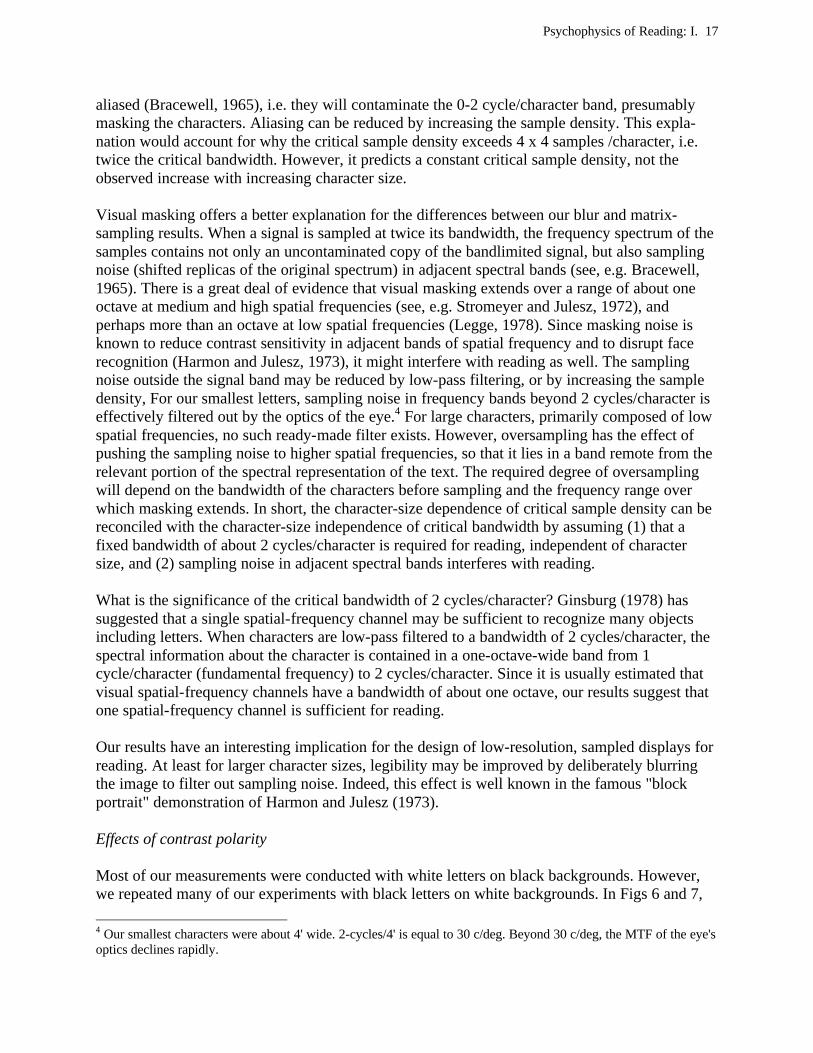
aliased (Bracewell, 1965), i.e. they will contaminate the 0-2 cycle/character band, presumably masking the characters. Aliasing can be reduced by increasing the sample density. This expla-nation would account for why the critical sample density exceeds 4 x 4 samples /character, i.e. twice the critical bandwidth. However, it predicts a constant critical sample density, not the observed increase with increasing character size. Visual masking offers a better explanation for the differences between our blur and matrix-sampling results. When a signal is sampled at twice its bandwidth, the frequency spectrum of the samples contains not only an uncontaminated copy of the bandlimited signal, but also sampling noise (shifted replicas of the original spectrum) in adjacent spectral bands (see, e.g. Bracewell, 1965). There is a great deal of evidence that visual masking extends over a range of about one octave at medium and high spatial frequencies (see, e.g. Stromeyer and Julesz, 1972), and perhaps more than an octave at low spatial frequencies (Legge, 1978). Since masking noise is known to reduce contrast sensitivity in adjacent bands of spatial frequency and to disrupt face recognition (Harmon and Julesz, 1973), it might interfere with reading as well. The sampling noise outside the signal band may be reduced by low-pass filtering, or by increasing the sample density, For our smallest letters, sampling noise in frequency bands beyond 2 cycles/character is effectively filtered out by the optics of the eye.4 For large characters, primarily composed of low spatial frequencies, no such ready-made filter exists. However, oversampling has the effect of pushing the sampling noise to higher spatial frequencies, so that it lies in a band remote from the relevant portion of the spectral representation of the text. The required degree of oversampling will depend on the bandwidth of the characters before sampling and the frequency range over which masking extends. In short, the character-size dependence of critical sample density can be reconciled with the character-size independence of critical bandwidth by assuming (1) that a fixed bandwidth of about 2 cycles/character is required for reading, independent of character size, and (2) sampling noise in adjacent spectral bands interferes with reading. What is the significance of the critical bandwidth of 2 cycles/character? Ginsburg (1978) has suggested that a single spatial-frequency channel may be sufficient to recognize many objects including letters. When characters are low-pass filtered to a bandwidth of 2 cycles/character, the spectral information about the character is contained in a one-octave-wide band from 1 cycle/character (fundamental frequency) to 2 cycles/character. Since it is usually estimated that visual spatial-frequency channels have a bandwidth of about one octave, our results suggest that one spatial-frequency channel is sufficient for reading. Our results have an interesting implication for the design of low-resolution, sampled displays for reading. At least for larger character sizes, legibility may be improved by deliberately blurring the image to filter out sampling noise. Indeed, this effect is well known in the famous "block portrait" demonstration of Harmon and Julesz (1973). Effects of contrast polarity Most of our measurements were conducted with white letters on black backgrounds. However, we repeated many of our experiments with black letters on white backgrounds. In Figs 6 and 7,
4 Our smallest characters were about 4' wide. 2-cycles/4' is equal to 30 c/deg. Beyond 30 c/deg, the MTF of the eye's optics declines rapidly.
Psychophysics of Reading: I. 18
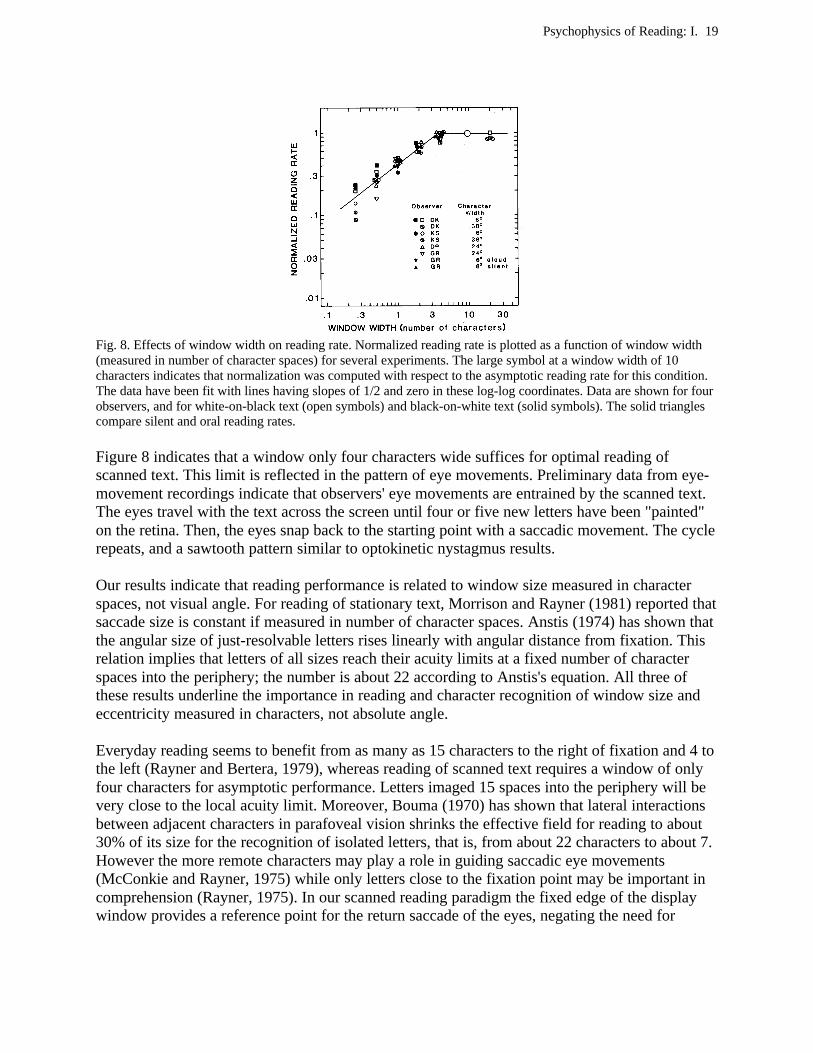
data are plotted for both contrast polarities (see also Fig. 8 below). We found no systematic effect of contrast polarity. The same conclusion does not hold for low-vision observers (Legge et al., 1985). Effects of window width In the experiments discussed so far, the display was always 10 character spaces wide. We also measured reading rate as a function of window width, specified in character spaces. Reduced windows were achieved by occluding portions of the screen. Figure 8 presents data from several experiments. For each, the sample density was fixed at 22 x 22 samples/character, but many character sizes were used, as indicated on the figure. For each set of data, reading rate has been normalized by the reading rate for a 10-character window, and is plotted as a function of window width-. When the data were scaled in this way, the results of most experiments were very similar, as demonstrated by the clusters of symbols on the graph. (Some of the symbols have been slightly displaced laterally to reduce overlap.) Reading rate increased with window width up to about four characters, after which it increased no further. The rising portion of the curve was fit by a line with slope 1/2 in log-log coordinates, representing a square-root dependence of reading rate on window width. Our data indicate that the two-limbed fit in Fig. 8 applies across a range of character sizes and both contrast polarities. In a control experiment, silent and oral reading rates were compared for 6° black-on-white characters viewed through 1-, 4-, and 10-character windows. The results are shown as filled triangles in Fig. 8. The silent reading rates (up-pointing triangles) and the oral reading rates (down-pointing triangles) have the same dependence on window width. The results were more scattered when reading rate was measured as a function of window width for text sampled below its critical density. Here, the slope of the rising portion of the curve tended to be steeper, and observers often could not read with very narrow windows. Results of Taenzer and Bertora (Taenzer, 1970, 1972) are consistent with ours, over their narrow range of window widths. Poulton's (1962) critical window widths of 7 or 8 are nearly twice ours. Although his procedure differed from ours in a number of ways, we are not certain of the reasons for the different result. In Fig. 8, it is interesting to note that reading was feasible for 0.5-character windows, and sometimes even for 0.25-character windows. Reading with such narrow fields was possible only for moving text that was scanned past the slit. In low-vision reading, fields may often be limited, either due to retinal damage, or to optical limitations in magnifying devices. Thus, the results of Fig. 8 are encouraging. With only 1-character windows, reading rates for normal observers were down only about a factor of two from maximum levels. For example, a normal observer with a 10-character-window reading rate of about 200 words/minute could still read about 100 words/ minute when the window was just one character wide.
Psychophysics of Reading: I. 19
Fig. 8. Effects of window width on reading rate. Normalized reading rate is plotted as a function of window width (measured in number of character spaces) for several experiments. The large symbol at a window width of 10 characters indicates that normalization was computed with respect to the asymptotic reading rate for this condition. The data have been fit with lines having slopes of 1/2 and zero in these log-log coordinates. Data are shown for four observers, and for white-on-black text (open symbols) and black-on-white text (solid symbols). The solid triangles compare silent and oral reading rates. Figure 8 indicates that a window only four characters wide suffices for optimal reading of scanned text. This limit is reflected in the pattern of eye movements. Preliminary data from eye-movement recordings indicate that observers' eye movements are entrained by the scanned text. The eyes travel with the text across the screen until four or five new letters have been "painted" on the retina. Then, the eyes snap back to the starting point with a saccadic movement. The cycle repeats, and a sawtooth pattern similar to optokinetic nystagmus results. Our results indicate that reading performance is related to window size measured in character spaces, not visual angle. For reading of stationary text, Morrison and Rayner (1981) reported that saccade size is constant if measured in number of character spaces. Anstis (1974) has shown that the angular size of just-resolvable letters rises linearly with angular distance from fixation. This relation implies that letters of all sizes reach their acuity limits at a fixed number of character spaces into the periphery; the number is about 22 according to Anstis's equation. All three of these results underline the importance in reading and character recognition of window size and eccentricity measured in characters, not absolute angle. Everyday reading seems to benefit from as many as 15 characters to the right of fixation and 4 to the left (Rayner and Bertera, 1979), whereas reading of scanned text requires a window of only four characters for asymptotic performance. Letters imaged 15 spaces into the periphery will be very close to the local acuity limit. Moreover, Bouma (1970) has shown that lateral interactions between adjacent characters in parafoveal vision shrinks the effective field for reading to about 30% of its size for the recognition of isolated letters, that is, from about 22 characters to about 7. However the more remote characters may play a role in guiding saccadic eye movements (McConkie and Rayner, 1975) while only letters close to the fixation point may be important in comprehension (Rayner, 1975). In our scanned reading paradigm the fixed edge of the display window provides a reference point for the return saccade of the eyes, negating the need for
Psychophysics of Reading: I. 20
peripherally imaged letters. This interpretation is bolstered by the evidence in Fig. 6 that reading of stationary text is only 20% faster than reading of scanned text. The average word length in our text was 4.1 characters, virtually identical to the critical window width we measured. Perhaps the critical window width is determined by average word length. Since average word length is about 4 or 5 characters for most English texts, we would expect little variation in critical window width with text. In an informal survey we found that the average word length ranged from about 4.0 characters for Grade 4-6 text to 4.8 characters for a sample from Scientific American. Kuèera and Francis (1967) reported an average word length of 4.7 characters for a comprehensive sample of adult reading materials. Other factors We have performed limited experiments to check for effects of some other stimulus variables. Monocular vs binocular viewing. For most experiments, observers viewed the display binocularly. However, binocular reading was compared with monocular reading (fellow eye occluded) in one experiment with observers D.G.P. and G.R. Reading rate was measured as a function of sample density for 3° and 6° letters. No systematic differences were found. Photopic luminance. In another experiment, observer D.G.P. wore goggles in which neutral density filters were mounted. Reading rate was measured as a function of the luminance of white letters on a dark background. A period of dark adaptation preceded each measurement. The characters subtended 6°. Over three log units of luminance, 0.3 to 300 cd/m², reading rate increased from 110 words/minute to 190 words/minute. Tinker (1963, Chapter 12) also reported small increases in reading rate with increased illumination (above a critical illumination of about 40 1x), provided that the observer was well adapted to the prevailing light level. Text characteristics. Although most of our measurements were conducted with texts of similar difficulty and style (see Method), in some of our pilot studies, we varied content of the text and minor details of the psychophysical procedure such as number of characters per line of text. None of these factors had important effects on the results. We believe that our results are robust, and insensitive to factors such as these. All of the major results have been borne out in replication checks conducted at intervals of several months. SUMMARY AND CONCLUDING REMARKS We may summarize our results concerning the reading of scanned text by normal observers as follows: (1) When the rate at which text is scanned through the visual field is increased, reading remains essentially perfect until some critical scanning rate is reached. For faster sweeps, reading soon breaks down. (2) Maximum reading rates are achieved for characters subtending 0.3-2° of visual angle. There is a relatively rapid decline in reading rate for letters smaller than 0.3°, probably related to acuity
Psychophysics of Reading: I. 21
limitations. There is a gradual decline for letters larger than 2°, which may be due to speed limitations in the smooth-pursuit eye-movement system. (3) When text is low-pass spatial-frequency filtered (blurred), reading is slowed only if the bandwidth is below a critical bandwidth of about 2 cycles/character. This critical value is independent of character size. These results suggest that only one spatial-frequency channel may be required for reading. (4) When text is subjected to matrix sampling, reading is slowed only if the sample density is below some critical value. This critical value depends on character subtense, ranging from about 4 x 4 samples/character for characters near the resolution limit to about 20 x 20 samples/character for very large characters. The dependence of critical sample density on character size may be related to the masking effects of sampling noise. (5) A window that limits the number of characters simultaneously visible slows reading only if it is less than four characters wide, independent of character size. The critical value of four may be related to the decline in retinal resolution away from the point of fixation. (6) Contrast polarity has little effect on reading by normal observers. These results may be regarded as boundary conditions for studying low vision. It would be unreasonable to expect low-vision observers to read faster than normal observers. However, it is encouraging to find that the fundamental characteristics of a low-vision reading aid-large characters, few visible at a timeare consistent with reading rates of 100 words/minute or more. The results of this paper may have practical implications for the design of low-resolution displays for reading. In order to read scanned text, a display need represent only four character spaces with a resolution of about 10 x 10 samples/character (an upper bound for characters in the optimal size range of 0.3° to 2°) or a bandwidth of 2 cycles/character, radially. Such a display could be read over a wide range of viewing distances and could have either contrast polarity. The display would need only 16 x 4 samples if it were suitably blurred (i.e. removing all spatial frequencies above 2 cycles/character, radially). Whereas monochrome television has a bandwidth of about 4 MHz, such a low-resolution display, operating at the same frame rate as a normal TV, would have a bandwidth of only 1 kHz. Telephone transmission of the spoken word uses a 3 kHz bandwidth, three times larger. Sperling (1980) and Pearson (1981) have applied a similar analysis to the visual requirements for reading of American and British Sign Languages. In the accompanying paper, the methods of this paper are extended to the study of reading by a group of low-vision observers. Acknowledgements-We wish to thank Mervyn Bergman for his invaluable technical assistance, and Daniel Kersten for innumerable helpful observations. Our interest in the effects of matrix sampling was inspired, in part, by John Ross. We are indebted to him for helpful comments and suggestions. Ervin Hafter alerted us to the possible connection between the critical window width and average word length. The research was supported by Public Health Service Grant EY02934 to GEL. DGP was supported by Grant EY04432 during the writing of this paper. Some
Psychophysics of Reading: I. 22
of the results in this paper were reported at the 2nd International Conference on Visual Psychophysics and Medical Imaging held in Brussels, July 1981. REFERENCES Anstis S. M. (1974) A chart demonstrating variations in acuity with retinal position. Vision Res. 14, 589-592. Arps R. B., Erdmann R. L., Neal A. S. and Schlaepfer C. F. (1969) Character legibility vs. resolution in image processing of printed matter. I.E.E.E. Trans. Man-Machine Systems MMS-10, 66-71, Bauer D. and Cavonius C. R. (1980) Improving the legibility of video display units through contrast reversal. In Ergonomic Aspects of Video Display Terminals (Edited by Grandjean E. and Vigliani E.) pp. 137-142. Taylor & Francis, London. Bouma H. (1970) Interaction effects in parafoveal letter recognition. Nature 226, 177-178. Bouma H., Legein Ch. P., Melotte H. E. M. and Zabel L. (1982) Is large print easy to read? Oral reading rate and word recognition of elderly subjects. IPO Annual Progress Report 17, 84-90. Bouma H, and de Voogd A. H. (1974) On the control of eye saccades in reading. Vision Res. 14, 273-284. Bracewell R. (1965) The Fourier Transform and Its Applications. McGraw-Hill, New York. Brown B. (1981) Reading performance in low vision patients: relation to contrast and contrast sensitivity. Am. J. Optom. Physiol. Opt. 58, 218-226. Carlson C. R. and Heyman R. M. (1979) A large format optical display for the generation of generalized psychophysical stimuli. Vision Res. 19, 99-103. Carpenter R. H. S. (1977) Movements of the Eyes. Pion, London. Erdmann R. L. and Neal A. S. (1968) Word legibility as a function of letter legibility with word size, word familiarity and resolution as parameters. J. appl. Psychol. 52, 403-409. Ginsburg A. P. (1978) Visual Information Processing Based on Spatial Filters Constrained by Biological Data. Vols I and II, Ph.D. Thesis, Cambridge University, in Aerospace Medical Research Laboratory Report AMRL-TR-78-129, Wright-Patterson AFB, OH. Goodrich G. L., Mehr E. B., Quillman R. D., Shaw H. K. and Wiley J. K. (1977) Training and practice effects in performance with low-vision aids: a preliminary study. Am. J. Optom. Physiol. Opt. 54, 312-318.
Psychophysics of Reading: I. 23
Harmon L. D. and Julesz B. (1973) Masking in visual recognition: effects of two-dimensional filtered noise. Science 189, 1194-1197. Hemingway J. C. and Erickson R. A. (1969) Relative effects of raster scan lines and image subtense on symbol legibility on television. Human Factors 11, 331-338. Hinkley D. V. (1969) Inference about the intersection in two-phase regression. Biometrika 56, 495-504. Hinkley D. V. (1971) Inference in two-phase regression. J. Am. Stat. Assoc. 66, 736-743. Howell W. and Kraft C. (1960) Size, blur, and contrast as variables affecting the legibility of alphanumeric symbols on radar-type displays. WADC Technical Report 59-536, Wright-Patterson AFB, OH, Krischer C. C. Meissen R. (1983) Reading speed under real and simulated visual impairment. J. Visual Impairment Blindness 77, 386-388. Kuèera H. and Francis W. N. (1967) Computational Analysis of Present-day American English. Brown Univ. Press, Providence, RI. Legge G. E. (1978) Sustained and transient mechanisms in human vision: temporal and spatial properties. Vision Res. 18, 69-81. Legge G. E., Rubin G. S., Pelli D. G. and Schleske M. M. (1985) Psychophysics of reading-II. Low vision. Vision Res. 25, 253-266. McCall W. A. and Crabbs L. M. (1979) Standard Test Lessons in Reading, 4th edn. Teachers College Press, New York. McConkie G. W. and Rayner K. (1975) The span of the effective stimulus during a fixation in reading. Percept. Psychophysics. 17, 578-586. Morrison R. E. and Rayner K. (1981) The saccade size in reading depends upon character spaces and not visual angle. Percept. Psychophys. 30, 395-396. National Society to Prevent Blindness (1977) Update on estimated blindness and visual problems in the United States. Sight-Saving Rev. 47, 85. van Nes F. L. and Jacobs J. C. (1981) The effects of contrast on letter and word recognition. IPO Annual Progress Reports 16, 72-80. Newman E. B. (1966) The speed of reading when the span of letters is restricted. Am. J. Psychol. 79, 272-278. Pearson D. E. (1975) Transmission and Display of Pictorial Information. Pentech Press, London.
Psychophysics of Reading: I. 24
Pearson D. E. (1981) Visual communication systems for the deaf. I.E.E.E. Trans. Communications COM-29, 1986-1992. Pelli D. G., Legge G. E. and Schleske M. M. (1985) Psychophysics of reading. III. A fiberscope low vision reading aid. Invest. Ophthal Visual Sci. In press. Poulton E. C. (1962) Peripheral vision, refractoriness and eye movements in fast oral reading. Br J. Psychol. 53, 409-419. Rayner K. (1975) The perceptual span and peripheral cues in reading. Cognitive Psychol. 7, 65-81. Rayner K. and Bertera J. H. (1979) Reading without a fovea. Science 206, 468-470. Rayner K., Well A. D. and Pollatsek A. (1980) Asymmetry of the effective visual field in reading. Percept. Psychophys. 27, 537-544. Schmelzer R., Christian W. and Browning W. (1980) Reading and Study Skills, Book 2. Twin Oaks, Re Hoboth, MA. Shurtleff D. A. (1967) Studies in television legibility. Information Disp. 4, 40-45. Sloan L. L. (1977) Reading Aids for the Partially Sighted: A Systematic Classification and Procedure for Prescribing. Williams & Wilkins, Baltimore, MD. Sperling G. (1980) Bandwidth requirements for video transmission of American sign language and finger spelling. Science 210, 797-799. Stromeyer C. F. III and Julesz B. (1972) Spatial frequency masking in vision: critical bands and spread of masking. J. opt. Soc. Am. 62, 1221-1232. Taenzer J. C. (1970) Visual word reading. IEEE Trans. Man-Machine Systems. MMS-11, 44-53. Taenzer J. C. (1972) An information processing model for visual and tactile reading. Perception 1, 147-160. Tinker M. A. (1963) Legibility of Print. Iowa State University Press, Ames. Turner D. R. (1978) The New High School Equivalency Diploma Tests. Arco, New York. Wilcox W. W. (1932) The basis of the dependence of visual acuity on illumination. Proc. natn. Acad. Sci., U.S.A. 18, 47-56.