public disclosure authorized accelerating mini- grid ...documents.worldbank.org/curated/en/... ·...
TRANSCRIPT
iAccelerating Mini-Grid Deployment in Sub-Saharan Africa: Lessons from Tanzania
WRI.ORG
ACCELERATING MINI-GRID DEPLOYMENT IN SUB-SAHARAN AFRICALessons from Tanzania
LILY ODARNO, ESTOMIH SAWE, MARY SWAI, MANENO J.J. KATYEGA AND ALLISON LEE
Pub
lic D
iscl
osur
e A
utho
rized
Pub
lic D
iscl
osur
e A
utho
rized
Pub
lic D
iscl
osur
e A
utho
rized
Pub
lic D
iscl
osur
e A
utho
rized

Design and layout by:Jenna [email protected]

iiiAccelerating Mini-Grid Deployment in Sub-Saharan Africa: Lessons from Tanzania
TABLE OF CONTENTS1 Foreword
3 Preface
5 Executive Summary
13 Introduction
19 Overview of Mini-Grids in Tanzania
39 The Institutional, Policy, and Regulatory Framework for Mini-Grids in Tanzania
53 Mini-Grid Ownership and Operational Models
65 Planning and Securing Financing for Mini-Grid Projects
79 How Are Mini-Grids Contributing to Rural Development?
83 Conclusions and Recommendations
86 Appendix A: People Interviewed for This Report
88 Appendix B: Small Power Producers That Signed Small Power Purchase Agreements and Submitted Letters of Intent
90 Appendix C: Policies, Strategies, Acts, Regulations, Technical Standards, and Programs, Plans, and Projects on Mini-Grids
94 Abbreviations
95 Glossary
96 Bibliography
99 Endnotes

WRI.org iv

1Accelerating Mini-Grid Deployment in Sub-Saharan Africa: Lessons from Tanzania
More than half of the 1 billion people in the world without electricity live in Sub-Saharan Africa, and rapid population growth is projected to outpace electric grid expansion. For communities across the region, a consistent and affordable supply of electricity can open new possibilities for socioeconomic progress. Mini-grids—electrical generation and distribution systems of less than 10 megawatts—can play a role. These decentralized technologies are expected to bring power to 140 million Africans by 2040.
Tanzania is a regional leader in mini-grid development. In 2008, it adopted a groundbreaking mini-grid policy and regulatory framework to encourage investment in the sector. Since then, the number of mini-grids in the country has doubled. The national utility (TANESCO), private businesses, faith-based organizations, and local communities now own and operate more than 100 mini-grid systems. Energy leaders across the region can learn from the country’s experience.
This report is the first major survey of Tanzania’s mini-grid sector. In it, we shed light on lessons from Tanzania that can help accelerate mini-grid deployment across countries in Sub-Saharan Africa. Our analysis points to three key actions for governments and practitioners across the continent:
▪ Create an adaptive and responsive policy approach: In 2015, Tanzania revamped its 2008 framework to create better market conditions for renewable energy. By shifting from a technology-neutral feed-in tariff system to one that is technology-specific, regulators are encouraging developers to invest in renewable energy mini-grids.
▪ Focus on the entire mini-grid ecosystem: Developing mini-grids involves navigating various permitting requirements beyond the electricity sector: environmental clearances, business licenses, siting approvals, and others. Delays in obtaining such clearances and permits can stall progress and slow down deployment.
In Tanzania, a slow environmental clearance procedure delayed the deployment of some mini-grids despite a streamlined regulatory process.
▪ Invest in both qualitative and quantitative assessments of the development impacts of mini-grids: While we can document the scaling of mini-grid deployment in Tanzania, the evidence on the impacts of mini-grids on local development is anecdotal. To make the linkages between mini-grids and development clearer and encourage further investment, mini-grid developers must build an analysis of development impacts into mini-grid project design. Developers can partner with academic institutions and other research agencies to conduct such analyses.
This comprehensive study will be valuable to the large and growing community that is banking on mini-grids to transform energy access in Africa: government officials and regulators; entrepreneurs and private investors; and multilateral, bilateral, and philanthropic funders. Key recommendations, such as streamlining the permitting process and creating a central database on the status of mini-grid initia-tives, could provide an action check list for those who wish to accelerate mini-grid development.
Mini-grids have potential to be a transformative solution for communities across Sub-Saharan Africa. New technologies, innovative finance mod-els, informed investors, and ambitious government targets are aligning to make rapid growth possible. Now is the time for the region’s energy leaders to review experience to date and act.
FOREWORD
Andrew SteerPresident World Resources Institute

WRI.org 2
3Accelerating Mini-Grid Deployment in Sub-Saharan Africa: Lessons from Tanzania
Meeting the goal of universal access to modern energy in Sub-Saharan Africa remains a key challenge for the first half of the 21st Century. Only 37 percent of Africans had access to electricity in 2015, with marked disparities between urban and rural areas. Nevertheless, a handful of African countries have begun to show steady progress and have largely embraced multiple supply solutions—from conventional grid systems to emerging technologies in mini-grids and solar home systems. This report, which lays out the development of a mini-grid program of Tanzania led by the Rural Energy Agency (REA), delves deep into one such solution.
The REA, under the guidance of the Ministry of Energy and Minerals, began an ambitious work program in 2005 to increase electrification by any means in rural areas and sought to encourage private participation however possible. The Energy and Water Utility Regulatory Agency (EWURA) has proven an effective partner by creating the enabling environment through standardized regulations for small power projects and mini grids considering the interests of the private developers, the national utility TANESCO, and the financiers towards the delivery of electricity services. The outcomes are now eminently visible—a recent survey carried out by the National Bureau of Statistics with support from REA has estimated that about 33 percent of the nation’s population have access to electricity in their homes: 25 percent of those gain access from grid or mini-grid electricity and another 8 percent access electricity through solar systems.
We will continue to work closely with Tanzania in its ambitious and multifaceted National Rural Electrification Program. The quest toward universal access to modern energy will require a concerted effort from both public and private players as well as a steady flow of accurate information on the latest policies and programs. This report, prepared by TATEDO and WRI and supported by the World Bank, is an excellent source of information on the current state of the mini-grid sector in Tanzania, the factors contributing to its success to date, and the agenda that still lies ahead. We hope that other readers will find it to be as useful as we have in providing insight into mini-grids in Tanzania and learning from the lessons of its experience.
PREFACE
Sudeshna Ghosh BanerjeePractice Manager, East Africa Africa Energy and Extractives Practice World Bank

WRI.org 4

5Accelerating Mini-Grid Deployment in Sub-Saharan Africa: Lessons from Tanzania
EXECUTIVE SUMMARYMini-grids—electrical generation and distribution systems of less
than 10 megawatts (MW)— will be key to accelerating access to
modern energy services in Sub-Saharan Africa. Electricity from
mini-grids can serve an estimated 140 million rural Africans by
2040 if 100,000–200,000 mini-grids are built.
HIGHLIGHTS

WRI.org 6
The Rural Energy Challenge More than 1 billion people currently lack access to electricity services; more than half of them live in Sub-Saharan Africa (IEA 2016). Most governments and communities in the region have looked to the central grid as the primary choice for electrification. However, technological improvement is enabling decentralized options, such as mini-grids, to emerge as complementary sources of electricity.
Mini-grids—electrical generation and distribution systems of less than 10 megawatts (MW)—represent a relatively rapid means of providing electricity to rural centers that are far from grid infrastructure and unlikely to be connected in the short or medium term. Unlike small solar home systems, which generally provide power for lighting, mobile phone charging and appliances like fans and televisions, mini-grids can provide electricity for productive uses, such as grain milling, and they can be built in ways that allow for connection to a centralized grid. These advantages have led the International Energy Agency (IEA) to project that mini-grids and stand-alone off-grid systems will play a key role in extending electricity services in rural Africa.
Electricity from mini-grids can serve an estimated 140 million rural Africans by 2040 if 100,000–200,000 mini-grids are built (IEA 2014a; UN 2015a). Building this many mini-grids may be difficult, however, partly because of lack of information. Even in Tanzania, a regional leader in mini-grid development, knowledge about the number, distribution, and generating capacity of mini-grids is limited. Valuable lessons can be learned from the development of mini-grids in the country, especially following the regulatory reforms undertaken since 2008. Expanding mini-grids to more rural areas in Sub-Saharan Africa will depend, in part, on sharing information and experience on what has worked and what has not.
▪ Distributed energy technologies such as mini-grids will be key to accelerating access to modern energy services in Sub-Saharan Africa.
▪ Limited experience and knowledge of mini-grids have slowed their adoption and scale-up in the region.
▪ Successful implementation of mini-grids requires the right technology, access to financing, an appropriate policy and regulatory environment, and an effective business model.
▪ Tanzania’s experience with targeted policy and regulatory reform offers instructive lessons for governments and practitioners across Sub-Saharan Africa interested in implementing this electrification option.
HIGHLIGHTS

7Accelerating Mini-Grid Deployment in Sub-Saharan Africa: Lessons from Tanzania
About This Report This report documents the status of and experiences with mini-grid systems in Tanzania. It sheds light on the experiences of small power producers operating mini-grids, explains the choices they make regarding different technologies and business ownership models, and evaluates how these choices are working out in practice. The report identifies a number of success factors in mini-grid development and operation, highlights challenges that impede progress, and recommends actions to streamline and accelerate the development of mini-grids in Tanzania. It is based on primary and secondary research, including interviews with representatives from government, the public utility, the Rural Energy Agency, mini-grid developers, funding partners, and villagers in Tanzania. The evidence presented can inform policymakers, development partners, and other stakeholders in Sub-Saharan African countries who wish to develop their own strategies for mini-grid development.
Key FindingsDistribution of Mini-Grids Tanzania has at least 109 mini-grids, with installed capacity of 157.7 MW (exact figures are not known, because some small systems may not have registered). They serve about 184,000 customers. Sixteen of these plants are connected to the national grid; the remaining 93 operate as isolated mini-grids. Not all the installed capacity goes to customer connections; some is sold to the national utility, the Tanzania Electric Supply Company (TANESCO).
Hydro is the most common technology (49 mini-grids), although the 19 fossil fuel systems account for 93 percent of customer connections and almost half of total installed capacity. Tanzania has 25 biomass mini-grids, and 13 solar mini-grids (10 of them small donor-funded, community-owned demonstration projects). There are no wind mini-grids in Tanzania (Figure ES-1).
Figure ES-1 | Distribution of Number of Mini-Grids in Tanzania, by Installed Capacity and Energy Source, 2016
Sources: TANESCO 1983; Kjelstrom et. al. 1992; UNIDO 2013; Sarakikya et. al. 2015; and interviews with staff of Kongwa. Leganga, Mawengi, Mwenga, and TANWAT (mini-grids) and the Ministry of Energy and Minerals, the Rural Energy Agency, SESCOM, and TANESCO conducted between February and May 2016.
<10 10–99.9 100–999.9 1,000–10,000
Num
ber o
f Min
i-Grid
s
Installed Capacity in (kW)
35
30
25
20
15
10
5
0
Hybrid
Fossil fuel
Solar
Biomass
Hydro
WRI.org 8
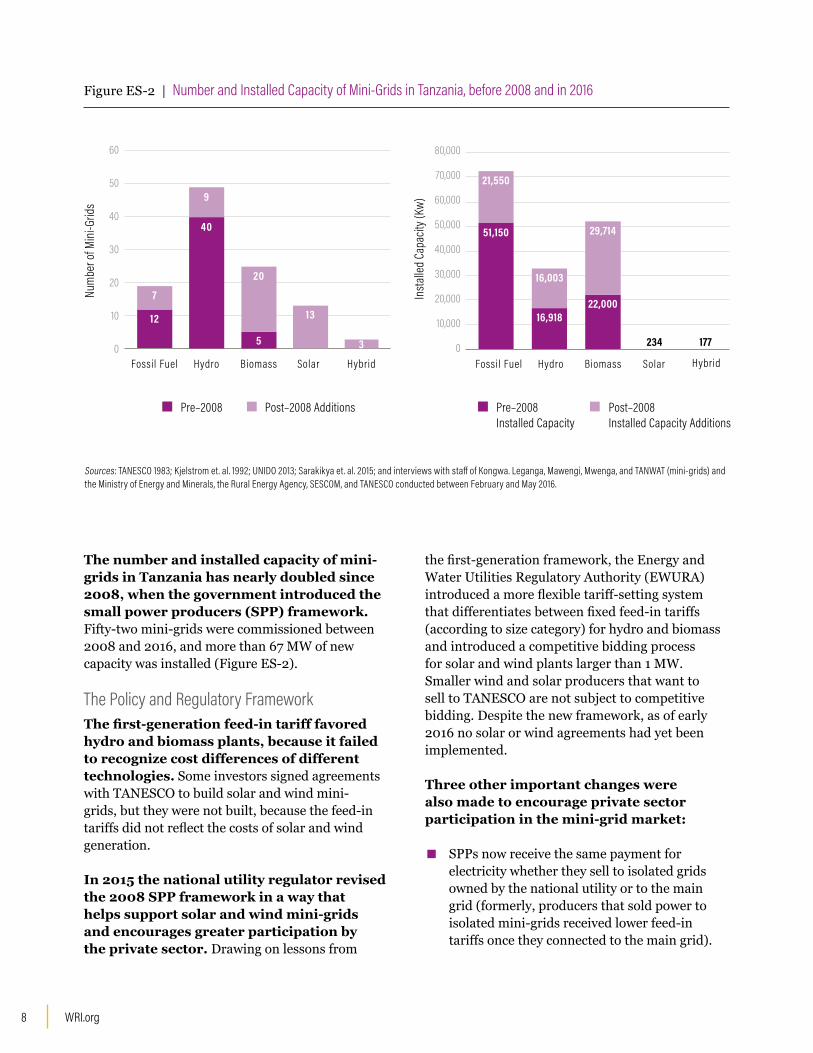
The number and installed capacity of mini-grids in Tanzania has nearly doubled since 2008, when the government introduced the small power producers (SPP) framework. Fifty-two mini-grids were commissioned between 2008 and 2016, and more than 67 MW of new capacity was installed (Figure ES-2).
The Policy and Regulatory FrameworkThe first-generation feed-in tariff favored hydro and biomass plants, because it failed to recognize cost differences of different technologies. Some investors signed agreements with TANESCO to build solar and wind mini-grids, but they were not built, because the feed-in tariffs did not reflect the costs of solar and wind generation.
In 2015 the national utility regulator revised the 2008 SPP framework in a way that helps support solar and wind mini-grids and encourages greater participation by the private sector. Drawing on lessons from
the first-generation framework, the Energy and Water Utilities Regulatory Authority (EWURA) introduced a more flexible tariff-setting system that differentiates between fixed feed-in tariffs (according to size category) for hydro and biomass and introduced a competitive bidding process for solar and wind plants larger than 1 MW. Smaller wind and solar producers that want to sell to TANESCO are not subject to competitive bidding. Despite the new framework, as of early 2016 no solar or wind agreements had yet been implemented.
Three other important changes were also made to encourage private sector participation in the mini-grid market:
▪ SPPs now receive the same payment for electricity whether they sell to isolated grids owned by the national utility or to the main grid (formerly, producers that sold power to isolated mini-grids received lower feed-in tariffs once they connected to the main grid).
Figure ES-2 | Number and Installed Capacity of Mini-Grids in Tanzania, before 2008 and in 2016
Sources: TANESCO 1983; Kjelstrom et. al. 1992; UNIDO 2013; Sarakikya et. al. 2015; and interviews with staff of Kongwa. Leganga, Mawengi, Mwenga, and TANWAT (mini-grids) and the Ministry of Energy and Minerals, the Rural Energy Agency, SESCOM, and TANESCO conducted between February and May 2016.
Fossil Fuel
Num
ber o
f Min
i-Grid
s
60
50
40
30
20
10
0
7
Biomass
20
5
Solar
13
Hybrid
3
Hydro
9
40
12
Insta
lled
Capa
city (
Kw)
HybridFossil Fuel Biomass SolarHydro
80,000
70,000
60,000
50,000
40,000
30,000
20,000
10,000
0
21,550
51,150
16,003
29,714
22,000
234 177
16,918
Pre–2008 Post–2008 Additions Pre–2008 Installed Capacity
Post–2008 Installed Capacity Additions

9Accelerating Mini-Grid Deployment in Sub-Saharan Africa: Lessons from Tanzania
▪ The eligible project size was reduced from 1,000 kW to 100 kW, enabling smaller producers to sell to TANESCO.
▪ The price of the feed-in tariff is now pegged to the U.S. dollar. The change benefits mini-grid sponsors and developers that raise debt finance in dollars but can have negative implications for TANESCO, which now must absorb the cost of inflation.
Ownership and Operational Models Mini-grid owners and operators in Tanzania include the national utility, private commercial entities, faith-based organizations, and communities. Fossil fuel mini-grids owned and run by TANESCO all operate on the utility model. The same nationwide tariffs that TANESCO charges its grid-connected customers apply to its mini-grid customers. Private entities usually sell power to TANESCO and to retail customers. Mini-grids developed by faith-based organizations have been successful operationally, but few are financially self-sufficient. Community models have had mixed success.
Planning and Financing Mini-Grid Development Acquiring clearances and registrations from multiple institutions in the project development process is cumbersome and can slow project development. The SPP framework streamlined the licensing and tariff-setting procedures with the national energy
regulator, but the planning process for mini-grids remains complicated: A typical mini-grid project may involve up to 13 steps from inception to commissioning. Clearances and decision-making processes involve multiple institutions outside the energy sector; some regulatory procedures (such as obtaining environmental clearances) can require many months. Streamlining regulatory clearance procedures that lie outside the purview of the energy sector will be important to ensure a smooth planning process for mini-grids.
Securing financing for mini-grid development is challenging, partly because of the inherent weaknesses of mini-grid financial models and partly because of risk perceptions. The government, supported by development partners, has created financial mechanisms to address bottlenecks in the project development process. Under the World Bank–supported Tanzania Energy Development and Access Project (TEDAP), the Tanzania Rural Energy Agency offered matching and performance grants to mini-grid projects. The World Bank also established a $23 million credit line to the government-owned Tanzania Investment Bank for on-lending to local commercial banks as 15-year loans. Although a few projects have used this arrangement to fund construction, most developers have been unable to access these loans. Other international donors have supported mini-grid development activities through the Tanzanian government, but developers remain wary of the unknown risks of investing in mini-grids.
Securing financing for mini-grid development is challenging, partly because of the inherent
weaknesses of mini-grid financial models and partly because of risk perceptions.

WRI.org 10
Local commercial banks have been hesitant to offer credit facilities to local mini-grid developers. Most mini-grid developers in Tanzania that obtained local finance were foreign-owned businesses. Commercial banks cite the limited availability of funds and the poor quality of documentation submitted by local developers as reasons for not extending credit to local actors. Bank financing is likely to remain limited unless financial risk guarantees are provided.
Impact on DevelopmentAnecdotal evidence from five case studies suggests that mini-grids are improving the lives of rural people. In one project, support from an Italian NGO, paired with electricity from the mini-grid, contributed to the start of several new enterprises, including sunflower oil pressing, mechanical workshops, poultry farming, and fruit processing. Financing from savings and credit cooperative societies (SACCOs) and village community banks enabled residents to develop small and medium-size enterprises, contributing to sustained demand for electricity and rural development. Improved lighting and electricity services helped rural residents start small businesses, increased access to information
(including market prices) via information and communication technologies, and improved social services provided by schools and clinics.
RecommendationsFive recommendations emerge from this report:
▪ Build up knowledge about mini-grid experiences. Understanding what makes mini-grids succeed (or fail) can be extremely helpful to countries across Sub-Saharan Africa. Committing resources to understanding these dynamics would be valuable.
▪ Make information about mini-grids available to relevant actors. The national utility regulator, the REA, and other relevant authorities should continue efforts to make relevant information available to developers and project sponsors. Information on energy resources (quality, abundance, location); funding sources; and mini-grid operational performance would be useful. The REA could establish and maintain a comprehensive database of mini-grids, which could be hosted on Tanzania’s Mini-Grid Information Portal.

11Accelerating Mini-Grid Deployment in Sub-Saharan Africa: Lessons from Tanzania
▪ Simplify the mini-grid planning process and improve coordination. The benefits of streamlined licensing and tariff-setting procedures should not be undermined by cumbersome clearance and permit processes outside of the energy sector. The REA, TANESCO, and the Ministry of Energy and Minerals could work together to ensure that these steps in the planning process do not hinder progress. One option to consider would be shifting responsibility for site selection, initial studies, and clearances to the REA and TANESCO and inviting developers to build, own, and operate mini-grids. Alternatively, the REA and TANESCO could develop mini-grids themselves and lease them to the private sector.
▪ Build capacity, particularly locally. Mini-grid developers need to be able to develop and submit bankable proposals and implement mini-grid projects successfully. Capacity building is also key to the success of the competitive bidding arrangement under the small power production framework.
▪ Understand the development impacts of mini-grids. Most of the information on the socioeconomic impacts of mini-grids
in Tanzania is anecdotal. More systematic qualitative and quantitative studies would help inform rural development programs and energy access strategies. Research on the impact of different business models and financing interventions would be useful.
The benefits of streamlined licensing
and tariff-setting procedures should
not be undermined by cumbersome clearance
and permit processes outside of the energy sector.


13Accelerating Mini-Grid Deployment in Sub-Saharan Africa: Lessons from Tanzania
CHAPTER 1
INTRODUCTIONAccess to modern energy is critical for reducing poverty
and creating the conditions for economic growth (IEA 2011).
Electrification is central to most aspects of human welfare,
including access to water, agricultural productivity, health care,
education, job creation, and environmental sustainability.

WRI.org 14
The majority of households, small- and medium-size enterprises, and institutions in rural Sub-Saharan Africa lack access to reliable electricity and spend much of their resources on poor-quality substitutes. In many countries national utilities lack the resources to finance centralized grid extensions to remote areas of the country, where low levels of electricity consumption and limited ability to pay for service in rural areas often make these extensions uneconomic (Tenenbaum et al. 2014).
Globally, the energy sector is facing new challenges and opportunities, many of which have implications for the future of traditional grid infrastructure. The deployment of newer technologies (such as solar photovoltaic [PV]), the trend toward distributed
generation, and policy shifts that encourage cleaner energy are creating new ways in which electricity sector planners can meet energy access goals (Jairaj et al. 2016).
In Africa consensus has formed that decentralized energy provision must complement centralized grid expansion efforts if countries are to meet their energy access targets (Tenenbaum et al. 2014). The International Energy Agency (IEA) projects that mini-grids (see Box 1.1) and stand-alone off-grid systems will play key roles in extending electricity to many rural areas in Africa that do not have access to national grids. It estimates that 140 million of the projected 315 million rural Africans who will gain access to electricity by 2040 will be served by mini-grids. Achieving this level of access will require 100,000–200,000 mini-grids (IEA 2014a; UN 2015a).
There is limited experience in Sub-Saharan Africa in developing and implementing mini-grids at scale. Local knowledge and capacity are lacking in terms of choosing the technology, crafting sustainable and scalable business models, and creating enabling policy/financial environments. A few countries, including Tanzania (Box 1.2), have had some successes in creating attractive policy environments and regulatory frameworks for mini-grids, and some small power producers (SPPs) have generated investor interest. The time is right to document the progress that has been made, so that Tanzania’s experience can benefit mini-grid stakeholders both inside the country and in other countries in the region.
A mini-grid can be defined as one or more electricity generators, and sometimes storage systems, connected to a distribution network serving multiple customers. Mini-grids can provide electricity at the local level using isolated distribution networks. They can accelerate access to electricity in remote rural communities that would otherwise have to wait years, if not decades, for a grid connection. Mini-grids typically provide higher levels of energy service than solar home systems. They can operate as isolated grids or be connected to a central grid.
BOX 1.1 | WHAT IS A MINI-GRID?

15Accelerating Mini-Grid Deployment in Sub-Saharan Africa: Lessons from Tanzania
Study Objectives and Structure of the ReportThis report documents the status of and experiences with mini-grid systems in Tanzania. It sheds light on the experiences of SPPs operating mini-grids, explains the choices they make regarding different technologies and business ownership models, and evaluates how these choices are working out in practice. The report identifies a number of success factors in mini-grid development and operation, highlights challenges that impede progress, and recommends actions to streamline and accelerate the development of mini-grids in Tanzania.
The target audience is policymakers and development partners in Tanzania and elsewhere in the region who are seeking to pursue rural electrification and rural development through mini-grid systems. The report should also be of interest to other stakeholders, including developers, private investors, commercial banks, owner-operators, and local energy planners.
The report is organized as follows. This chapter describes the nature of the rural energy challenge facing Tanzania and the likely role of mini-grids in extending electricity access in the country. It outlines the approach and methodology used to develop the information base underlying this report. Chapter 2 presents quantitative information on the distribution, number, size, and technological characteristics of mini-grids in Tanzania. Chapter 3 documents the key institutions, policies, regulations, and policy reforms that affect the development of mini-grids in Tanzania and describes how mini-grids have been implemented under different regimes. Chapter 4 provides a guide to the various business (ownership) models used in mini-grid operations and identifies some of the factors that appear to lead to success or failure. Chapter 5 describes the planning process and the funds and financial mechanisms used to promote mini-grid development and operation. Chapter 6 shows how mini-grids contribute to rural development. Chapter 7 presents the report’s conclusions and recommendations.
Study Approach and MethodologyThis report is based on both primary and secondary data and information on mini-grids in Tanzania. It draws on four sources:
1. An extensive review of energy and related policies, acts, regulations, strategies, programs, and monitoring mechanisms relevant to mini-grids. Materials were obtained from government officials, mini-grid operators, and other stakeholders in Tanzania.
2. A review of the mini-grid literature, focusing on experiences in Sub-Saharan Africa and Tanzania. The approach was shaped by Building Energy Access Markets: A Value Chain Analysis of Key Energy Market Systems, developed by the European Union Energy Initiative Partnership Dialogue Facility, in partnership with Practical Action Consulting (EUEI PDF 2015).
3. Interviews with government officials and other stakeholders, including personnel from government ministries and agencies; mini-grid developers and operators; representatives of development partners, faith-based organizations, civil society organizations, and business entities; and community members (Appendix A lists the people interviewed).
Small power producers (SPPs) in Tanzania are not synonymous with mini-grids, as defined here. SPPs generate up to 10MW of export capacity and sell to an off-taker. The off-taker can be a corporate customer, the national grid, a TANESCO-owned mini-grid, or retail consumers via their own small power distributor network.
Small power distributors operate localized, low- to medium-voltage distribution networks. They can generate their own power or purchase power from other sources.
A mini-grid both generates and distributes power to multiple customers.
BOX 1.2 | A NOTE ON TERMINOLOGY: SMALL POWER PRODUCERS, SMALL POWER DISTRIBUTORS, AND MINI-GRIDS

WRI.org 16
4. Field visits to five mini-grid project sites:
□ Kongwa village, in the Matombo ward in the Morogoro Region. This 32 kW biomass gasifier plant was installed and is owned by the Indian company Husk Power Systems.
□ Leganga village, in the Kongwa District, a 15 kilowatt peak (kWp) containerized solar system. Leganga is one of 10 villages served by containerized solar systems funded by the Austrian government. The plant is owned by the village community and serves 25 households and 35 commercial and institutional users.
□ The Lupande, Madunda, and Mawengi (LUMAMA) community, in Mawengi village in the Ludewa District.1 This 300 kW hydro mini-grid was funded by grants from the European Union and the Italian government, as well as financing from Tanzania’s Rural Energy Agency (REA) and the Roman Catholic dioceses of Njombe. The plant, which is operated, managed, and partially owned by the community, serves more than 1,500 residents as well as commercial and industrial users.
□ Mwenga village in the Mufindi District. This 4 MW hydro plant was funded by public and commercial sources. It is owned by the Rift Valley Energy Company. It serves 3,500 households, providing back-up power to the Mufindi Tea Factory and its housing estate and selling power to the national grid.
□ Tanganyika Wattle Company (TANWAT), in Njombe township, a 2.5 MW biomass combined heat and power plant. The plant uses wattle-tree residues to generate process steam for tannin production and electricity. Daily electricity production is about 24,000 kWh, enough to power the industrial operations, the company’s office, and a housing estate. About one-third of the electricity generated is sold to the national grid.
The field visits included guided interviews with mini-grid managers, operators, technicians, and customers. They yielded quantitative and qualitative data on how the mini-grids were initiated, implemented, and managed; who was included/excluded during implementation and why; users’ perceptions of the quality, reliability, and adequacy of the electricity services provided; and other information. Information from the field visits was cross-checked and validated by stakeholder interviews with government officials working at various levels. The quantitative data collected were compiled into a database on mini-grids in Tanzania, which forms the foundation of the analysis presented in this report.
LimitationsThe information in this report is not comprehensive, for several reasons:
▪ Before passage of the 2008 Electricity Act, mini-grid operators were not required to register their projects—and even after the 2008 small power producer (SPP) framework was instituted, only projects over 1MW were required to formally register. Mini-grids that did not register are not covered in this study.
▪ The operational status of some mini-grids is not known, because the study team was unable visit all 109 mini-grids.
▪ Power output, connection, and consumption data could not be obtained on many small hydro mini-grids owned by faith-based organizations and on small diesel and biomass mini-grids. The number of connections identified is therefore not a comprehensive figure, as the study team was unable to obtain information on several mini-grids.
▪ Information on financing sources and types of capital could not be obtained for some mini-grids.
▪ Information on plant commissioning dates could not be obtained for some mini-grids.

17Accelerating Mini-Grid Deployment in Sub-Saharan Africa: Lessons from Tanzania


19Accelerating Mini-Grid Deployment in Sub-Saharan Africa: Lessons from Tanzania
CHAPTER 2
OVERVIEW OF MINI-GRIDS IN TANZANIAMini-grids provided the first electricity in Tanzania (in colonial
days) and continue to supply many rural enterprises and
isolated communities.

WRI.org 20
Energy Access in TanzaniaTanzania enjoys political stability and saw economic growth rates of about 7 percent over the past decade. Social well-being indicators (education, health, nutrition, employment) improved during this period, but poverty remains widespread, particularly in rural areas, where three-quarters of the population lives. Approximately 28 percent of the country’s inhabitants live below the poverty line.2
Given the country’s young demographic profile, Tanzania will experience rapid population growth in coming years. According to the national census (www.nbs.go.tz), the population was 44.9 million in 2012, with an annual growth rate of 2.9 percent. Based on this growth rate, the population at the end of 2016 is estimated at 50.3 million. The United Nations’ median population projection is more than 82 million by 2030 (UN 2015b).
Continued economic and population growth will create strong demand for electricity. According to the International Energy Agency (IEA 2014b), demand in Tanzania could rise by an annual average rate of 6.6 percent between 2012 and 2040.3
Providing access to electricity remains a major challenge. Ninety percent of the energy consumed in Tanzania comes from biomass; only 1.5 percent comes from electricity (URT 2015b). As of 2014, less than 20 percent of the population had access to electricity, with a dramatic difference between urban areas (43 percent access) and rural areas (6 percent access).4
The challenges facing Tanzania’s energy sector are similar to the challenges facing other countries in Sub-Saharan Africa. The national utility, the Tanzania Electric Supply Company (TANESCO), struggles to maintain financial solvency. Tanzania’s electricity sector is largely vertically integrated: TANESCO owns the majority of generation assets and all transmission and distribution assets. As part of its Electricity Supply Industry Reform Strategy 2014–2025, Tanzania plans to unbundle its electricity sector and separate TANESCO’s generation, transmission, and distribution functions, eventually privatizing some components. These reforms are driven by the Tanzanian Development Vision, which seeks to make Tanzania a middle-income country by 2025.
▪ Mini-grids provided the first electricity in Tanzania (in colonial days) and continue to supply many rural enterprises and isolated communities. Developers have favored technologies that have proven to be robust and cost-effective.
▪ Hydro mini-grids are the most common type of mini-grids, but fossil fuel and biomass systems dominate installed capacity. Hydro is expected to remain the dominant technology if current financing support is maintained.
▪ Diesel and natural gas mini-grids (all owned by the Tanzania Electric Supply Company [TANESCO]) account for the vast majority of mini-grid customers.
▪ Diesel and natural gas plants are large (average 3.8 MW) and relatively inexpensive to install, but they need frequent maintenance and spare parts that are not readily available in rural areas.
▪ Hydro mini-grids are smaller (average 672 kW), and most of them are run-of-river installations. They are expensive to build but long-lived and relatively inexpensive to operate.
▪ Most biomass plants (average 2.1 MW) are commercially owned units powering wood or sugar mills and supplying other users in the vicinity. They are moderately inexpensive to build and maintain, but fuel supply and preparation can be challenging.
▪ Consumers are familiar with stand-alone solar home systems; they are less familiar with larger solar mini-grid systems that provide services to a cluster of users. Solar mini-grids remain mostly at the demonstration stage.
▪ Numerous small, informal diesel mini-grids exist. They supply small clusters of households all over the country and are not captured in formal records.
KEY TAKEAWAYS

21Accelerating Mini-Grid Deployment in Sub-Saharan Africa: Lessons from Tanzania
The government of Tanzania considers rural electrification a key element for accelerating economic and social development. Given the country’s large size and low rural population density and the challenges facing the existing grid infrastructure, extension of the national grid to many isolated rural areas is not economically feasible in the short or even medium term. The grid, which provides approximately 1,438 MW of installed generation capacity (of a total 1,564 MW), serves only about 18 percent of the population (9 million people) (URT 2013).
In its Rural Electrification Investment Prospectus Tanzania estimates that about half the rural population may be more cost-effectively served by decentralized options than by centralized grid expansion (AfDB 2015). Small power producers (SPPs) contributed only about 2 percent of total installed generation capacity in 2012(URT 2013). Based on the data in this report, mini-grids provide about 157.7 MW of installed capacity and serve about 184,000 customers. Despite their modest contribution, they offer a promising contribution to Tanzania’s energy future.
Mini-Grids since Colonial Times Mini-grids have existed in Tanzania since colonial times. Electrification began with development of decentralized (isolated) diesel mini-grids in Dar es Salaam, Dodoma, Tabora, and Kigoma townships, beginning in 1908. A hydro mini-grid was constructed at Ngaresero village in Loliondo in 1928 (the plant no longer exists). During the late 1950s and 1960s, the Pangani Falls hydropower project brought electricity to a small number of townships.
In the 1970s, mini-grids were extended to Dar es Salaam and other towns to form the nascent national grid. Today about three-quarters of regional townships are connected to the grid. However, only 3,000 of 15,000 Tanzania’s villages have been connected.5
After independence, in 1961, the government built diesel mini-grids in many rural areas as part of its program to electrify isolated regional and district townships and promote national industrialization. The choice of diesel mini-grids was dictated at least
in part by low initial costs rather than long-term economic considerations or the kind of resources available in the area.
The private sector has long used mini-grids to support its industrial operations and the communities near them. In colonial times, mining companies located far from the national grid established mini-grids to provide electricity for the Mwadui diamond mine in Maganzo Shinyanga, the Saza gold mine in Chunya, and the Uruwira lead and gold mine in Mpanda, for example. Agricultural industries such as the cotton ginneries in the Mwanza, Shinyanga, and Tabora regions; the coconut plant on Mafia Island; and the tea factories in Mwakaleli, Mufindi, and Lushoto, to mention only a few, established diesel mini-grids.
Distribution and Characteristics of Mini-Grids At the beginning of 2016, mainland Tanzania had at least 109 mini-grids located in 21 regions, with total installed capacity of 157.7 MW and connections to at least 183,705 customers (Figure 2.1 and Table 2.1). Only 16 (15 percent) were connected to the national grid; 93 (85 percent) operated as isolated mini-grids. (Figure 2.2)
At the beginning of 2016, mainland
Tanzania had at least 109 mini-grids located
in 21 regions, with total installed capacity
of 157.7 MW and connections to at least
183,705 customers.

WRI.org 22
Figure 2.1 | Location of Mini-Grids in Tanzania
Esri, HERE, DeLorme, MapmyIndia, © OpenStreetMap contributors, and the GIS user community
KIGOMA
IRINGA
SONGEA
DODOMA
MUSOMA
MWANZA
SHINYANGA ARUSHA MOSHI
TABORA
MOROGORO
SUMBAWANGA
MBEYA
BUKOBA
TANGA
MTWARA
ZANZIBAR CITY
DAR ES SALAAM
Mini-Grid Type
BiomassFossil FuelHybridSolar HydroExisting Transmission
Legend
Kilometers Datum: WGS840 50 100 200 300 400
Source: World Resources Institute and TANESCO, National Grid System Map (2015).
Note: Map shows only 107 mini-grids; geographic coordinates of 2 mini-grids could not be obtained. Data are accurate as of February 2016.

23Accelerating Mini-Grid Deployment in Sub-Saharan Africa: Lessons from Tanzania
Before the establishment of the 2008 SPP framework (described in Chapter 3), mini-grids were not required to register their operations. As a result, many small hydro mini-grids owned by faith-based organizations are not licensed or registered. Data on them are therefore not available. Most of these plants produce less than 200 kW. Data are also missing on small diesel and biomass plants.
Comprehensive data are not available on the number of connections for each mini-grid; these figures must thus be interpreted with care. The nature of the off-taker affects the number of connections and installed capacity. For example, Table 2.1 suggests that fossil fuel mini-grids have many more connections than hydro and biomass combined, even though they have similar installed capacities, possibly because large biomass and hydro plants sell electricity to the grid and tend to serve larger commercial retail customers (accounting for the smaller number of total connections).
Table 2.1 | Installed Capacity and Number of Connections of Tanzania’s Mini-Grids, by Energy Source, 2016
ENERGY SOURCE
NUMBER OF PLANTS INSTALLED CAPACITY (KW)
GRID-CONNECTED ISOLATED TOTAL TOTAL MEAN NUMBER OF
CONNECTIONS
Fossil fuels 0 19 19 72,700 3,826 170,065
Hydro 9 40 49 32,921 672 11,925
Solar 0 13 13 234 18 1,153
Biomass 7 18 25 51,714 2,069 562
Wind 0 0 0 0 0 0
Hybrida 0 3 3 177 59 —
All 16 93 109 157,746 1,447 183,705
Sources: TANESCO 1983; Kjelstrom et. al. 1992; UNIDO 2013; Sarakikya et. al. 2015; and interviews with staff of Kongwa. Leganga, Mawengi, Mwenga, and TANWAT (mini-grids) and the Ministry of Energy and Minerals, the Rural Energy Agency, SESCOM, and TANESCO conducted between February and May 2016.
Note: a. Hybrid systems serve more than 300 people. — Not available.
Figure 2.2 | Number of Mini-Grids in Tanzania, by Energy Source, 2016
Sources: TANESCO 1983; Kjelstrom et. al. 1992; UNIDO 2013; Sarakikya et. al. 2015; and interviews with staff of Kongwa. Leganga, Mawengi, Mwenga, and TANWAT (mini-grids) and the Ministry of Energy and Minerals, the Rural Energy Agency, SESCOM, and TANESCO conducted between February and May 2016.
0
10
20
30
40
50
60
Numb
er of
Mini
–Grid
s
Hydro
Grid-Connected Isolated
9
40
Solar
13
Fossil fuels
19
Hybrid3
Biomass
7
18

WRI.org 24
Table 2.2 and Figure 2.3 break down the number of mini-grids in Tanzania by size. Before 2015 only mini-grids with installed capacity of more than 1,000 kW could apply for standardized small power producer purchase agreements (SPPAs) to sell power to TANESCO. In 2015 the threshold was lowered to 100 kW; the upper bound is 10,000 kW (see Chapter 3 for more information on the regulatory reforms of 2008 and 2015). Generally, fossil fuel, biomass, and hydro plants are larger than solar or hybrid plants.
Hydro systems dominate in terms of the number of mini-grids, accounting for 45 percent of the total. Biomass and fossil fuel systems are next (22.9 percent and 17.4 percent, respectively); solar mini-grids account for 11.9 percent; and hybrid systems account for just 2.8 percent of the number of mini-grids in the country. Systems in the 10–100 kW range are the most common (30.3 percent), followed by systems generating 1,000–10,000 kW (27.5 percent), 100–1,000 kW (24.8 percent), and less than 10 kW (17.4 percent).
Table 2.2 | Number of Mini-Grids in Tanzania, by Installed Capacity and Energy Source, 2016 (kW, except where otherwise indicated)
INSTALLED CAPACITY HYDRO BIOMASS FOSSIL
FUELS SOLAR HYBRID TOTAL SHARE OF TOTAL (PERCENT)
Less than 10 2 15 0 2 0 19 17.4
10–99.9 18 1 0 11 3 33 30.3
100–999.9 23 1 3 0 0 27 24.8
1,000–10,000 6 8 16 0 0 30 27.5
All 49 25 19 13 3 109 100.0
Share of total (percent) 45.0 22.9 17.4 11.9 2.8 100.0
Sources: TANESCO 1983; Kjelstrom et. al. 1992; UNIDO 2013; Sarakikya et. al. 2015; and interviews with staff of Kongwa. Leganga, Mawengi, Mwenga, and TANWAT (mini-grids) and the Ministry of Energy and Minerals, the Rural Energy Agency, SESCOM, and TANESCO conducted between February and May 2016.
Figure 2.3 | Distribution of Number of Mini-Grids in Tanzania, by Installed Capacity and Energy Source, 2016
Sources: TANESCO 1983; Kjelstrom et. al. 1992; UNIDO 2013; Sarakikya et. al. 2015; and interviews with staff of Kongwa. Leganga, Mawengi, Mwenga, and TANWAT (mini-grids) and the Ministry of Energy and Minerals, the Rural Energy Agency, SESCOM, and TANESCO conducted between February and May 2016.
Numb
er of
Mini
–Grid
s
0
5
10
15
20
25
30
35
<10 10–99.9 100–999.9 1,000–10,000
Installed capacity in (kW)
Hydro Biomass Solar
Fossil Fuel Hybrid
25Accelerating Mini-Grid Deployment in Sub-Saharan Africa: Lessons from Tanzania
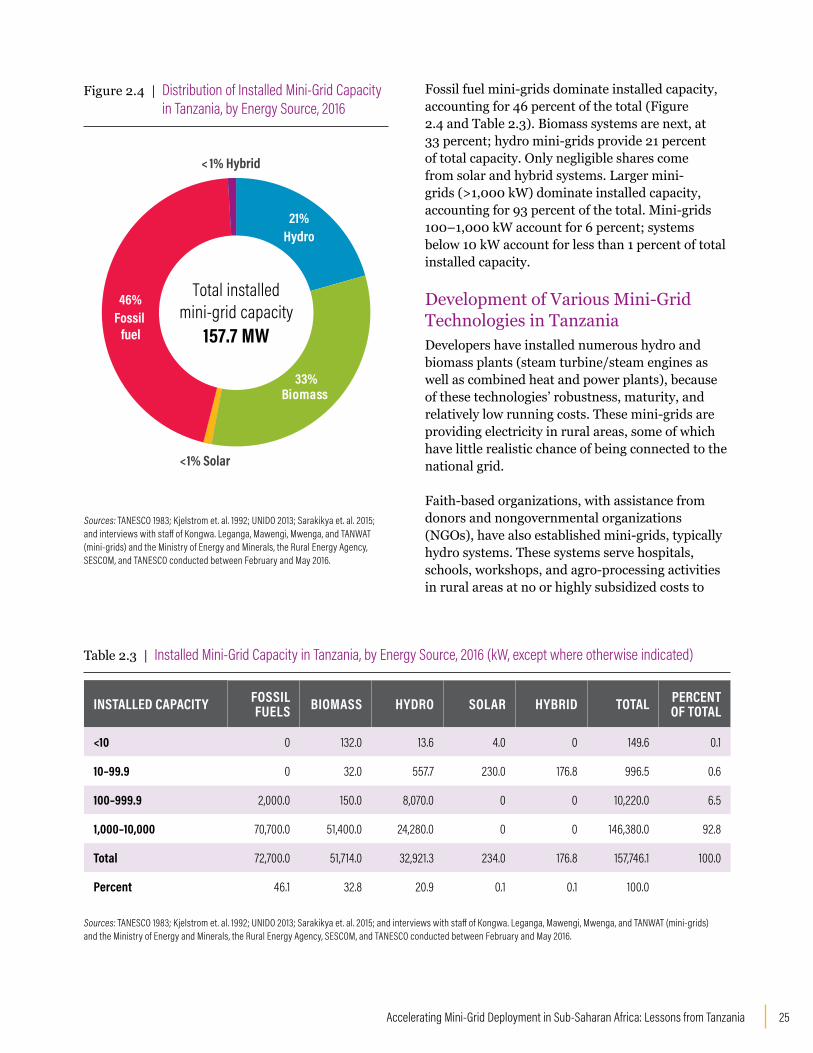
Fossil fuel mini-grids dominate installed capacity, accounting for 46 percent of the total (Figure 2.4 and Table 2.3). Biomass systems are next, at 33 percent; hydro mini-grids provide 21 percent of total capacity. Only negligible shares come from solar and hybrid systems. Larger mini-grids (>1,000 kW) dominate installed capacity, accounting for 93 percent of the total. Mini-grids 100–1,000 kW account for 6 percent; systems below 10 kW account for less than 1 percent of total installed capacity.
Development of Various Mini-Grid Technologies in TanzaniaDevelopers have installed numerous hydro and biomass plants (steam turbine/steam engines as well as combined heat and power plants), because of these technologies’ robustness, maturity, and relatively low running costs. These mini-grids are providing electricity in rural areas, some of which have little realistic chance of being connected to the national grid.
Faith-based organizations, with assistance from donors and nongovernmental organizations (NGOs), have also established mini-grids, typically hydro systems. These systems serve hospitals, schools, workshops, and agro-processing activities in rural areas at no or highly subsidized costs to
Table 2.3 | Installed Mini-Grid Capacity in Tanzania, by Energy Source, 2016 (kW, except where otherwise indicated)
INSTALLED CAPACITY FOSSIL FUELS BIOMASS HYDRO SOLAR HYBRID TOTAL PERCENT
OF TOTAL
<10 0 132.0 13.6 4.0 0 149.6 0.1
10–99.9 0 32.0 557.7 230.0 176.8 996.5 0.6
100–999.9 2,000.0 150.0 8,070.0 0 0 10,220.0 6.5
1,000–10,000 70,700.0 51,400.0 24,280.0 0 0 146,380.0 92.8
Total 72,700.0 51,714.0 32,921.3 234.0 176.8 157,746.1 100.0
Percent 46.1 32.8 20.9 0.1 0.1 100.0
Sources: TANESCO 1983; Kjelstrom et. al. 1992; UNIDO 2013; Sarakikya et. al. 2015; and interviews with staff of Kongwa. Leganga, Mawengi, Mwenga, and TANWAT (mini-grids) and the Ministry of Energy and Minerals, the Rural Energy Agency, SESCOM, and TANESCO conducted between February and May 2016.
Figure 2.4 | Distribution of Installed Mini-Grid Capacity in Tanzania, by Energy Source, 2016
Sources: TANESCO 1983; Kjelstrom et. al. 1992; UNIDO 2013; Sarakikya et. al. 2015; and interviews with staff of Kongwa. Leganga, Mawengi, Mwenga, and TANWAT (mini-grids) and the Ministry of Energy and Minerals, the Rural Energy Agency, SESCOM, and TANESCO conducted between February and May 2016.
21%Hydro
33%Biomass
<1% Solar
46%Fossil
fuel
< 1% Hybrid
Total installedmini-grid capacity
157.7 MW

WRI.org 26
consumers. In the Southern Highlands, faith-based organizations have installed hydro mini-grids using the cross-flow Ossberger turbine, manufactured in Germany.
The oldest operational hydro plant, at Mamba Mission in the Katavi Region, was installed in 1932. Another technology that has survived for many years is steam power, demonstrated by engines at the TANWAT, TPC, Kilombero, Mtibwa, and Kagera sugar mills. The TANWAT plant was installed in 1957. Some steam engines at the sugar mills were installed during colonial times; others were installed during the 1960s. Advanced technology steam turbines began to replace the TANWAT and sugar mill steam engines in the late 1990s; the replacement process is ongoing.
Fossil fuel mini-grids comprise 46 percent of the total 157.7 MW installed mini-grid capacity in the country and provide electricity to 93 percent of known mini-grid customers.
The choice of energy source has widened as new technologies have become available and more affordable. Mini-grids powered by renewable energy sources account for 54 percent of installed mini-grid capacity and provide electricity to about 7 percent of known mini-grid customers. Renewable energy mini-grids can accelerate electrification in remote rural communities, particularly in areas with limited access to consistent fuel supply and spare parts needed to maintain fossil fuel technologies.
The government and donors sometimes influence the choice of technology. For example, although a subtransmission line from the main grid was located only 4 kilometers away, a government demonstration project funded by the European Union and the government of Austria led to the installation of a 15 kilowatt peal (kWp) containerized solar system in Leganga village.6
Developers also influence these decisions. For example, the Indian company Husk Power Systems installed a 32 kW biomass gasifier plant in the villages of Malolo, Nyakagomba, and Kongwa, using gasifiers manufactured in India.7 It has extensive experience with the technology, having installed more than 100 gasifier plants in India and four in Uganda.
Developers of mini-grid systems based on renewable energy must shop around overseas for equipment and expertise. Developers of diesel systems can more easily find equipment and technicians in Tanzania, although the availability of spare parts in rural areas remains limited. Web-based information sources are growing, and developers are increasingly making use of information from development partners and from the experiences of mini-grids in operation. A recently established mini-grid information portal (www.minigrids.go.tz), development of which was supported by the International Finance Corporation, provides detailed information on licensing, financing, relevant literature, and a GIS resource/siting map (under development). The portal is maintained by a working group that includes members from the Ministry of Energy and Minerals, the Rural Energy Agency, the Energy and Water Utilities Regulatory Authority (EWURA), the National Environment Management Council, the Tanzania Renewable Energy Association, the Tanzania Bureau of Standards, and TANESCO.
The following sections provide more detailed information on the development of and experiences with each of these mini-grid technologies.
Fossil Fuel Mini-Grids Fossil fuel mini-grid technologies in Tanzania are fueled by diesel, gasoline (petrol), and natural gas.8 The national utility owns 19 fossil fuel mini-grids in the western, southern, and southeastern parts of the country (Figure 2.5). Seventeen of the plants run on diesel and two on natural gas. Diesel mini-grids are often the preferred option for off-grid electrification, because they are inexpensive to procure, have short lead times, are modular, and are easy to site and relocate. Local vendors are widespread throughout the country, and there is an ample inventory of spare parts in large cities. Many technicians know how to operate and maintain diesel systems, because similar technology is used in grain and vegetable oil mills. Traditionally, this technology was used before connection to the grid; the mini-grids were then relocated when the grid arrived.

27Accelerating Mini-Grid Deployment in Sub-Saharan Africa: Lessons from Tanzania
Diesel-generating sets (gensets) are also installed at some renewable energy mini-grids and by large consumers on the national grid, who use them as standby facilities. One example is TANWAT’s 2.5 MW biomass mini-grid, which has two 300 kW diesel gensets to provide back-up power to key installations when the national grid and their
own power plants fail. Diesel systems can also be quickly started and stopped, which is useful for meeting fluctuations in demand, as is common in commercial applications. In contrast, solid biomass plants, such as steam turbines, take a long time to cool down after stopping and require a long time to restart.
Figure 2.5 | Location of Fossil Fuel Mini-Grids in Tanzania
Esri, HERE, DeLorme, MapmyIndia, © OpenStreetMap contributors, and the GIS user community
KIGOMA
IRINGA
SONGEA
DODOMA
MUSOMA
MWANZA
SHINYANGA ARUSHA MOSHI
TABORA
MOROGORO
SUMBAWANGA
MBEYA
BUKOBA
TANGA
MTWARA
ZANZIBAR CITY
DAR ES SALAAM
Kilometers Datum: WGS840 50 100 200 300 400
Mini-Grid Type
Fossil FuelExisting Transmission
Legend
Source: World Resources Institute and TANESCO, National Grid System Map (2015).
Note: Data are accurate as of February 2016.

WRI.org 28
Diesel mini-grids have utilization factors of about 40 percent for village and district township networks and 50 percent for regional township networks. Low utilization factors are typical of plants in areas without large industrial customers, but it is also a consequence of the high cost and/ or low availability of fuel, spare parts, and competent staff.9
A number of small, informal (unlicensed/unregistered) diesel mini-grids also exist. They supply small clusters of households all over the
country. The utilization factors of such plants can be as low as 20 percent, because, being expensive to run, they operate for just a few hours during the night or for special purposes, such as charging batteries and phones, pumping water, and entertainment.
Fossil fuel mini-grid technology can be very expensive to operate and maintain, and the plants have shorter lifespans (10–15 years) than mini-grids based on renewable technologies. Tanzania provides no subsidies for fossil fuels. Fuel and spare parts are widely available in urban areas, but they must be imported and are therefore expensive; regardless of price, they are not readily available in remote rural areas. Maintenance of diesel mini-grids therefore tends to be patchy and inadequate, leading to less reliable power supply. When circumstances permit—the level of demand is high enough and the distance of the load center from the grid short enough—diesel mini-grids are often replaced by grid extension or mini-grids that are less expensive to run, such as natural gas or renewable energy systems. Diesel gensets are expensive to operate and not cost-competitive with renewable energy technologies over the plant lifetime.
Hydro Mini-GridsHydropower is electrical power harnessed by water wheels or turbines from the potential energy of falling water (e.g., waterfalls) or the kinetic energy of running water. Most of Tanzania’s 49 hydro mini-grid plants are located in the Southern Highlands (Njombe, Iringa, Mbeya, Rukwa, and Ruvuma) (Figure 2.6). Others are in the north (Kilimanjaro and Lake Manyara) and west (the Lake Rukwa and Lake Tanganyika basins). Lake Rukwa and Lake Tanganyika are located in the Great East African Rift Valley, where the topography and hydrology are suitable for hydropower development. A few hydro mini-grids are located outside the East African Rift Valley (e.g., plants in the Lindi, Mtwara, and Tanga regions). Most hydro mini-grids are 100–1,000 kW and serve local communities and in some cases the grid.
Hydro mini-grids are constructed either as run-of-river plants or with reservoirs. In Tanzania most are run-of-river plants, because of the higher initial costs associated with reservoirs. A mini-grid with

29Accelerating Mini-Grid Deployment in Sub-Saharan Africa: Lessons from Tanzania
a reservoir is Nyumba ya Mungu (8 MW), located in Kilimanjaro; mini-grids with daily and weekly pondages (small storage reservoirs on run-of-river plants) are Matembwe (150 kW) and Ikondo (83 kW), located in Njombe, and Bomang’ombe (250 kW), located in Iringa. Hydro mini-grids
may be classified according to whether they are operational only during the rainy season (seasonal) or throughout the year (perennial). Most hydro mini-grids in Tanzania are perennial, although generation during the dry season is usually lower than in the wet season.
Figure 2.6 | Location of Hydro Mini-Grids in Tanzania
Esri, HERE, DeLorme, MapmyIndia, © OpenStreetMap contributors, and the GIS user communityKilometers Datum: WGS84
0 50 100 200 300 400
HydroExisting Transmission
Legend
KIGOMA
IRINGA
SONGEA
DODOMA
MUSOMA
MWANZA
SHINYANGA ARUSHA MOSHI
TABORA
MOROGORO
SUMBAWANGA
MBEYA
BUKOBA
TANGA
MTWARA
ZANZIBAR CITY
DAR ES SALAAM
Mini-Grid Type
Source: World Resources Institute and TANESCO, National Grid System Map (2015).
Note: Data are accurate as of February 2016.

WRI.org 30
Hydro mini-grids are robust and durable, with lifespans of 40–100 years, depending on the component parts. Their use is dictated by the waterfall height and flow regime of the river being harnessed as well as the size of the load center and the distance from the water source to the load center. If hydro plants are well designed and there is adequate water flow to meet energy load demands, they require little maintenance, with only scheduled visits for cleaning of intakes, lubrication of moving parts, and data recording. Utilization rates of hydro mini-grids are typically 40–50 percent, depending on the demand profile of the area, the plant’s availability, and the ability of the river flow regime to match plant requirements.
Environmental and climate change factors affect hydro mini-grids. Bush fires, deforestation, and poor agricultural practices upstream can contribute to silting and debris accumulation at the intakes. Water consumption upstream—especially during the dry season—greatly affects the flow needed for power generation. If the flow is low, load shedding has to be practiced to avoid plant shutdown. Sometimes the plant must be shut down if the available river flow is not adequate to run an
individual turbine at more than 40 percent of its capacity, in order to avoid cavitations or turbulence in the water wheel that can damage it.10 At the time of the authors’ visit to the Lupande, Madunda, and Mawengi (LUMAMA) hydro mini-grid, for instance, one turbine was running at less than 40 percent capacity, because the plant operators were not sufficiently aware of the risk presented by cavitation. The LUMAMA area is also prone to lightning strikes, which not only curtail the quality and reliability of the power supply but also involve frequent replacement of failed lightning arresters, contributing to high operating costs.
Despite such issues, hydro mini-grids plants are relatively trouble-free in their operations compared with diesel plants. Some plants owned by faith-based organizations and manned by local artisans and technicians have been operating for more than 50 years and are still running smoothly.
Hydro mini-grids generally have long lead times and are very expensive to build. However, the plants have low operating costs. Total costs are highly dependent on the location. The greater the distance between the point of mini-grid power generation and consumers, the more infrastructure is required to deliver the electricity. Such plans may not therefore be the least-cost option in areas where the consumer is far from the water source.
Hydro mini-grid technology leads in terms of both the numbers of mini-grid plants under construction and the numbers that are planned in Tanzania (see Appendix B). Among the feasibility studies benefitting from matching grants, hydro mini-grids are the dominant technology. These trends are expected to continue if current financing support is maintained.
Biomass Mini-GridsTanzania has 25 biomass mini-grids (Box 2.1 and Figure 2.7). About a third are 1–17 MW in size and sell in bulk to TANESCO (via the national grid or isolated mini-grids).11
Solid biomass mini-grids have existed since colonial times, typically in industrial applications. Steam engine plants fueled by bagasse (the dry, fibrous residue remaining after extraction of juice from sugar cane stalks) were common at the
Hydro mini-grid technology leads in
terms of both the numbers of mini-grid plants under
construction and the numbers that are
planned in Tanzania.

31Accelerating Mini-Grid Deployment in Sub-Saharan Africa: Lessons from Tanzania
sugar refineries of TPC at Moshi, Kilombero, and Mtibwa and, after independence, Kagera. They were also used in wood-based industries like the Tanganyika Wattle Company (TANWAT). Most of these sugar and wood plants have now replaced their steam engines with high-pressure steam turbines, realizing substantial increases in capacity
and energy generation from the same amount of feedstock. The installed capacities of these plants are TPC 17.5 MW, Kilombero 10.5 MW, Kagera 5 MW, Mtibwa 4 MW, and TANWAT 2.5 MW.12 The sugar refineries and TANWAT plants are combined heat and power plants, which generate process steam for sugar refining and tannin production,
Figure 2.7 | Location of Biomass Mini-Grids in Tanzania
Esri, HERE, DeLorme, MapmyIndia, © OpenStreetMap contributors, and the GIS user community
KIGOMA
IRINGA
SONGEA
DODOMA
MUSOMA
MWANZA
SHINYANGA ARUSHA MOSHI
TABORA
MOROGORO
SUMBAWANGA
MBEYA
BUKOBA
TANGA
MTWARA
ZANZIBAR CITY
DAR ES SALAAM
Mini-Grid Type
BiomassExisting Transmission
Legend
Kilometers Datum: WGS840 50 100 200 300 400
Source: World Resources Institute and TANESCO, National Grid System Map (2015).
Note: Data are accurate as of February 2016.

WRI.org 32
respectively, as well as electricity. With the exception of the Kagera Sugar Mill, these biomass plants are connected to the grid. Other biomass installations include a 1.5 MW steam turbine plant at Sao Hill (wood industry) and the recently completed Ngombeni steam turbine plant at Mafia, with installed capacity of 1.4 MW.
Combined heat and power as well as traditional steam turbines are robust, commercially proven technologies that are moderate in their complexity and operating demands. Plants have an approximate lifetime of 20–25 years and require about two years for planning and construction. Fuel preparation and storage is cumbersome if feedstock is not available from sources nearby. Biomass quality depends on the heat and water content of feedstock, as well as the size of the feedstock being transported for combustion. Hardwood, wattle, coconut shells, and corn cobs are examples of high-fuel-content feedstocks for steam turbine plants. Soft wood and bagasse are relatively low-fuel-content feedstocks. Full-time technicians and artisans are required at
the plant to undertake fuel preparation, stocking, combustion process and combustion residue off-loading, water and steam system maintenance, electricity generation, and quality assurance.
Biomass plant utilization factors are higher than for diesel or hydro mini-grids. They average 50–60 percent and could be higher if bagasse plants were not seasonal. Sugar cane harvesting in Tanzania involves controlled burning; in the process a significant proportion of feedstock is wasted and carbon dioxide is emitted. The process could be improved if controlled burning could be avoided by using combine harvester technology, practiced in countries such as Brazil. This technology automates cutting, threshing, and cleaning grains and produces waste material such as chaff.
During the 1980s, small gas engines running on producer gas or syngas from wood, charcoal, and agricultural residues were built in Kiru Valley at Babati as demonstration projects. These plants are no longer running, because of low efficiency, high outage rates, and high demand for spare parts and maintenance.
New biomass gasification plants are operating at Kongwa village in Matombo and Malolo village in the Morogoro Region, as well as Nyakagomba village in the Geita Region. New plants in the development pipeline at Tunduru and Kigoma will use either gas/gasoline (petrol) engines that run on 100 percent producer gas or diesel engines that run on producer gas blended with up to 50 percent of diesel fuel. These plants have moderate initial costs and a lifetime of about 10 years. Operations and Management (O&M) are resource intensive, and the plants are often unable to run continuously for 24 hours; capacity utilization is about 20–40 percent. This technology is still at the demonstration stage.
The new biomass gasification plant at Kongwa village in Matombo was installed by Husk Power, an Indian company with long experience with gasifiers. There is room to expand and connect more households and institutions, because the plant is currently operating below capacity. However, the high cost of fuel feedstock (rice husks) and water for the plant is a challenge. The availability of power is sometimes poor, because of the limitations of the technology and poor maintenance as a result of the lack of well-trained plant operators.
Biofuel: Liquid fuel derived from biomass material. Can be used to power engines that generate electricity.
Biogas: Gas produced from the anaerobic digestion of organic materials. Can be burned directly for use in cooking, purified to produce gas with a higher methane content or burned to generate thermal electricity.
Biomass gasification: Process of converting solid biomass fuel into a combustible gas, known as producer gas or synthesis gas (syngas), through a sequence of thermal chemical reactions. Gas can be used in internal combustion engines.
Solid biomass direct combustion (thermal): Burning of solid material from living or recently living tissue, typically plants, to generate heat to turn a steam turbine, which then produces electricity. Steam turbine technology involves energy losses, as only a portion of the energy generated is converted to electricity; the remaining energy is lost as waste heat. Combined heat and power technology harnesses waste heat from thermal electricity generation for productive use.
BOX 2.1 | TYPES OF BIOMASS TECHNOLOGIES

33Accelerating Mini-Grid Deployment in Sub-Saharan Africa: Lessons from Tanzania
The Mkonge System Company has installed a 150 kW biogas-fueled internal combustion engine plant at Hale Muheza Tanga. In addition, a 450 cubic meter biogas plant is fuelling a 16 kVA genset producing electricity at Msoga village in the Coast Region. The lifetime of these plants is about five years; O&M costs are moderate, but the process, in particular fuel preparation, is cumbersome. Biogas fuel must be treated to be free of corrosive gases, including sulfur and moisture. During plant operation, maintaining consistency of gaseous fuel—the same heat content, pressure, and moisture content—is a challenge. Plant utilization capacity can be as low as 30–40 percent. The Tanzania Traditional Energy Development Organization (TaTEDO), an NGO involved in developing, promoting, and scaling up modern energy access in rural areas, has installed internal combustion engines powered by liquid biofuel from jatropha oil.13 The project was implemented with assistance from the European Union and the Dutch NGO Humanist Institute for Cooperation with Developing Countries (Hivos).14 The engines can run on either straight vegetable oil (SVO) or diesel; as such they are flex-fuel, not hybrid systems. Sixteen such plants, referred to as Energy Services Platforms (ESPs) or Multi-Functional Platforms (MFPs), have been installed in villages in the Kilimanjaro, Tanga, Shinyanga, Mwanza, Geita, Tabora, and Arusha regions.15 The plants are connected to a distribution network and provide electricity to households, businesses, and public institutions. They are also used for battery charging and direct mechanical power for grain milling, oil pressing, dehusking, and water pumping.
With support from the European Union and Hivos, TaTEDO has also installed 18 MFPs in villages in the Shinyanga, Kilimanjaro, and Simiyu regions. They provide only mechanical power and have not been connected to mini-grids, though connection is technically possible.
MFPs are popular because of their multiple functionality. They could be promoted as hybrid plants, in combination with solar generators, to reduce solar end-use energy costs as well as to address issues of intermittency of supply.Fuel derived from dedicated biofuel crops, as
opposed to byproducts such as bagasse, can involve land use, community rights, and environmental pollution issues (Searchinger and Heimlich 2015). MFPs use vegetable oil fuel derived from seeds from jatropha plants, which are traditionally grown as protective hedges for small-scale farms and animal stables in Tanzania. With the introduction of MFPs, small-scale farmers intercropped jatropha with other crops, avoiding the problems associated with large-scale bio-fuel farming.
Installation costs of biomass plants are high, but O&M costs can be moderate relative to fossil fuel mini-grids, depending on the availability of feedstock fuel for power generation and the costs of fuel collection and preparation. Biomass and biofuel feedstock is generally much less expensive than imported diesel fuel, and steam turbine plants provide less expensive electricity than diesel plants. In the case of plants fueled by bagasse and wattle-wood residues, where electricity is a byproduct of sugar refining and tannin production, respectively, electricity generation costs are normally lower than at either diesel or solar mini-grids.
O&M, delivered energy costs, and plant lifetimes of MFP plants resemble those for diesel mini-grids, with the exception of fuel costs. Vegetable oil is normally not cheap, except when processed from jatropha. The availability of vegetable oil is seasonal and therefore a challenge.
Steam turbines and combined heat and power constitute robust, established technologies that are appropriate where inexpensive, abundant high-quality feedstock is available. The development of small-scale biomass plants will depend on improvements in gasifier and biogas technologies, which are currently at the demonstration stage. Developers in Tanzania are promoting these technologies through pilot electrification projects. SPP developers in Tunduru, Kigoma, and Kasulu are developing modern gasification projects to run on bamboo biomass. A project in Uchindile village, in the Mufindi Region, would run on wood residues (small steam turbine plants of 15–20 kW).16 Monitoring is required to establish the reliability and cost-effectiveness of these plants.

WRI.org 34
Solar Mini-GridsAlthough the cost of solar is falling, solar mini-grids in Tanzania remain largely at the demonstration stage, funded by donor governments and participating developers (Figure 2.8).17 With donor funding, 10 villages received a total of 14 containerized 15 kWp solar units, installed in 2014
and 2015 in the districts of Kongwa Dodoma, Uyui Tabora, and Mlele Katavi; six villages received one solar container each and four villages received two containers each. Each containerized solar system can supply 60 households with power. The units are powering 812 households, 27 faith-based organizations, 8 dispensaries, 6 schools, and 200 streetlights. Success has been mixed (Box 2.2).
Figure 2.8 | Location of Solar Mini-Grids in Tanzania
Esri, HERE, DeLorme, MapmyIndia, © OpenStreetMap contributors, and the GIS user community
0 100 200 300 40050Kilometers
KIGOMA
IRINGA
SONGEA
DODOMA
MUSOMA
MWANZA
SHINYANGA ARUSHA MOSHI
TABORA
MOROGORO
SUMBAWANGA
MBEYA
BUKOBA
TANGA
MTWARA
ZANZIBAR CITY
DAR ES SALAAM
Mini-Grid Type
Solar Existing Transmission
Legend
Source: World Resources Institute and TANESCO, National Grid System Map (2015).
Note: Coordinates for one solar mini-grid could not be obtained. Data are accurate as of February 2016.

35Accelerating Mini-Grid Deployment in Sub-Saharan Africa: Lessons from Tanzania
If solar mini-grids are well designed, their maintenance requirements are relatively light, as are costs related to network O&M and customer service. Lifetimes are 20 years for the panels, 5–10 years for inverters, and 3–4 years for the batteries.
The costs of solar panels are decreasing; other system costs, such as batteries, inverters, and installation, may not be falling as quickly. O&M costs are very low. Maintenance largely involves batteries, inverters, and regulators, which fail because of poor-quality components. Although maintenance cannot be neglected, maintenance costs are too low to be a major obstacle to deployment.
If costs continue to decrease, solar mini-grids are likely to grow as the technology of choice for most small consumers in remote areas. Until recently, one obstacle to more rapid deployment of small solar systems was the level of standardized power purchase tariffs (SPPTs), which were too low to reflect the costs to developers. Relatively large solar plants were proposed for installation at Mpanda (1 MW), Sumbawanga (2 MW), and Kigoma (2–5 MW) but stalled because of the constraints of low approved tariffs. If constructed, these plants will be connected to fossil fuel mini-grids owned by TANESCO. The regulatory reforms of 2015, which set feed-in tariffs for solar and wind mini-grids according to a competitive bidding process, may encourage more solar projects (see Chapter 3).
Wind Mini-Grids As of May 2016, there were no operational wind mini-grids in Tanzania, although many stand-alone rural windmills (kinetic/mechanical) are used for water pumping. As with solar mini-grids, the 2008 feed-in tariffs were not attractive enough for developers.
The location of wind power is site specific, dictated by the availability of adequate wind (usually indicated by one to two years of quality data collected from a 30–50 meter mast at the site) and distance to the load center. Installation costs for wind plants are high, but O&M costs are moderate. As with solar technology, wind technology costs are falling. Few prefeasibility studies for wind mini-grids are currently underway in Tanzania. Most of the ones being conducted are in the Rift Valley area.
Hybrid Mini-GridsHybrid systems use two or more energy sources to supply a network. Using a combination of generation sources (e.g., solar and diesel) increases the reliability of electricity supply, but hybrid systems are typically more complex than single-source systems to manage.
Only three hybrid mini-grid systems are known to be operating in Tanzania (Figure 2.9):
▪ The Space Engineering Company of Tanzania has installed a 25 kWp solar and 32 kW biomass
The project in Leganga village is handicapped by uncertainty regarding future connection to the grid, which is only 4 kilometers away. More villagers need to connect to the mini-grid system if it is to expand its network, generate more revenue, and promote rural development. The interim community’s electricity committee has proven ineffective in collecting revenues and ensuring a sustained program of electrification. Poor metering via load limiters (devices used to control the amount of power distributed to a customer and ensure that customers receive only the power they pay for) rather than total consumption is responsible for wasteful use of electricity. One solution to wasteful use might be for the village to undertake demand-side management, including efficiency measures, prepayment metering, and/or innovative payment systems via pay-as-you-go, which would allow the same plant to serve more customers.
Single-phase power supply and limited plant capacity constrain some important economic village activities, such as grain milling, welding, and other power-intensive activities. Single-phase power can run motors of up to about five horsepower. It is adequate for most small customers, including homes and nonindustrial businesses. Three-phase power is used in manufacturing and larger businesses. It is expensive to convert from single-phase to three-phase power, but three-phase allows for less expensive wiring and lower voltages, making it safer and less expensive to run.
BOX 2.2 | MIXED SUCCESS WITH CONTAINERIZED SOLAR UNITS IN LEGANGA VILLAGE

WRI.org 36
gasifier hybrid system in the Mbozi District, in the Mbeya Region.
▪ TaTEDO, in collaboration with Husk Power, has installed an 8.8 kW diesel/(SVO) MFP connected to a 20 kW gasifier running on producer gas at Nyakagomba village, in the Geita District.
▪ In 2015 Ukara Island commissioned a 30 kVA (24 kW) diesel and 60 kWp solar hybrid system, with a 7-kilometer network and 250 customer connections. The plant is providing reliable electricity on an isolated small island in Lake Victoria.
Figure 2.9 | Location of Hybrid Mini-Grids in Tanzania
Esri, HERE, DeLorme, MapmyIndia, © OpenStreetMap contributors, and the GIS user community
KIGOMA
IRINGA
SONGEA
DODOMA
MUSOMA
MWANZA
SHINYANGA ARUSHA MOSHI
TABORA
MOROGORO
SUMBAWANGA
MBEYA
BUKOBA
TANGA
MTWARA
ZANZIBAR CITY
DAR ES SALAAM
Kilometers Datum: WGS840 50 100 200 300 400
Mini-Grid Type
HybridExisting Transmission
Legend
Source: World Resources Institute and TANESCO, National Grid System Map (2015).
Note: Coordinates for the third hybrid mini-grid could not be obtained. Data are accurate as of February 2016.

37Accelerating Mini-Grid Deployment in Sub-Saharan Africa: Lessons from Tanzania
A fourth hybrid system is at the planning stage: Sustainable Energy Services Company Limited (SESCOM), a subsidiary of TaTEDO, and the Husk Power Company of Tanzania are collaborating to install a 20 kW gasifier and 20 kW solar hybrid system at Kibindu village, in the Coast Region.
As technology continues to develop, hybrid systems may become more attractive. Their most valuable role will likely be to address the problem of
intermittent supply from renewable energy sources caused by, for example, seasonal river flow, daily wind and solar variations, and seasonality in the availability of biomass feedstock.18
Summary of Mini-Grid Technologies: Costs, Outlook, and ConclusionsTable 2.4 Summarizes the cost variations and outlook of the different mini-grid technologies discussed above.
Table 2.4 | Costs, Lifespans, and Outlooks for Various Mini-Grid Technologies
TECHNOLOGY COST LIFESPAN OUTLOOK
CAPITAL OPERATIONS AND MAINTENANCE
Fossil fuels Low High (fuel and spare parts)
Short Diesel likely to continue as technology of choice in larger mini-grid installations over short term, because of familiarity with technology and availability of spare parts, at least near townships. Where available, natural gas is less expensive than other fossil fuels; advanced steam turbines running on biomass represent attractive alternative option in isolated areas where it is available.
Hydro High to very high
Low Long Likely to remain very attractive option for isolated locations where water resources are suitable. Currently preferred technology among mini-grids under construction or planned, a trend that is likely to continue as long as financing is available for initial installation.
Biomass High Moderate (because of cost of feedstock)
Long Steam engine and turbine systems, including combined heat and power cogeneration, are robust and commercially proven technologies. Advanced technology steam turbines are proving attractive for larger industrial applications in isolated areas. Gasifier and biogas technologies are still at demonstration stage; outlook for small biomass plants depends on continued improvements in these technologies. Biofuel outlook uncertain because of lack of track record; may have application as hybrid plants in combination with solar.
Solar High but falling rapidly
Very low Moderate Likely to become more widespread among small users in isolated areas if costs continue to fall. Feed-in tariff structure has failed to attract development of large scale solar mini-grids. Not yet clear whether new competitive bidding structure will be sufficient to encourage development.
Wind High but falling
Moderate Moderate Falling prices not yet sufficient to attract investors. Specific site requirements may also limit appeal. Outlook unclear.
Hybrid Moderate Moderate Moderate to long
Outlook unclear because of small number of hybrids operating (three) and short track record. Good option as back-up for intermittent renewable systems. More demonstration plants necessary.
Source: Authors’ compilation.
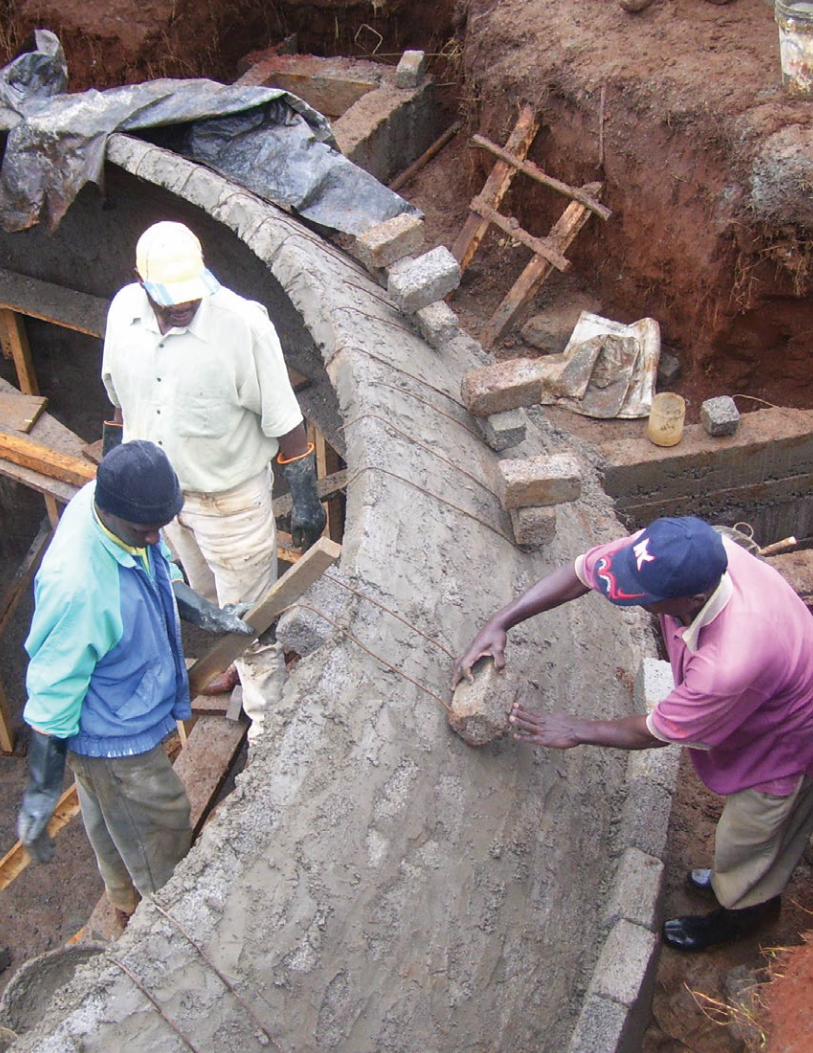
WRI.org 38

39Accelerating Mini-Grid Deployment in Sub-Saharan Africa: Lessons from Tanzania
CHAPTER 3
THE INSTITUTIONAL, POLICY, AND REGULATORY FRAMEWORK FOR MINI-GRIDS IN TANZANIAThe institutional, policy and regulatory framework for the energy
sector in Tanzania has been reformed since enactment of the
Electricity Act of 2008. Specific initiatives encourage private
participation in small power production and distribution.

WRI.org 40
From colonial times until after independence, the government was the sole participant in the electricity sector. The first national energy policy was developed in 1992, but the sector remained fully under government control. The revised energy policy of 2003 encouraged private sector participation in the sector, including private investments in renewable energy mini-grids. To enable such involvement, Tanzania enacted the Electricity Act of 2008, which superseded the Electricity Ordinance of 1931, last revised in 1957. It stipulates the commercial and legal provisions under which private sector participation can contribute to the development of the energy sector.
The Rural Energy Act (2005) was enacted to deal specifically with rural energy issues. It established the Rural Energy Agency (REA) as a government agency to deal with resource mobilization, investments, and promotion of renewable energy and electrification in rural areas and the Energy and Water Utilities Regulatory Authority (EWURA) as an autonomous authority to regulate the water and energy sectors. The Electricity Act gives EWURA authority to make rules that guide the activities, tariffs, interconnection processes and standards, electricity trading, distribution system, and operations and maintenance (O&M) of licensed players in the electricity sector, including small power producers (SPPs) operating mini-grids. Tanzania also established antitrust instruments such as the Fair Competition Tribunal to deal with mediation and resolution of matters related to fair trade, including the energy industry.
Mini-grids do not constitute a new electrification approach in Tanzania. What is new is the set of policy, regulatory, and financing mechanisms that aim to accelerate development of renewable energy mini-grids and their scale-up (see Appendix C for details on policies and regulations).
The Institutional FrameworkKey stakeholders in the electricity sector include government institutions, private sector operators, and nongovernmental organizations (NGOs), which cooperate to realize the development and scale-up of renewable mini-grids. Figure 3.1 illustrates the institutional framework. Box 3.1 outlines the main functions of each institution.
▪ The institutional, policy, and regulatory framework for the energy sector in Tanzania has been reformed since enactment of the Electricity Act of 2008. Specific initiatives encourage private participation in small power production and distribution.
▪ The number and installed capacity of mini-grids in the country have nearly doubled since 2008.
▪ The first-generation standardized power purchase tariffs (SPPTs) were technology neutral. They tended to discourage the development of solar and wind mini-grids, which have higher upfront costs than hydro and biomass mini-grids.
▪ Revisions to the SPPTs made in 2015 took into account different renewable technologies, plant sizes, and site-specific characteristics, providing a more accurate reflection of the cost differences of different technologies.
KEY TAKEAWAYS

41Accelerating Mini-Grid Deployment in Sub-Saharan Africa: Lessons from Tanzania
Figure 3.1 | Institutional Framework and Market Structure of the Tanzanian Electricity Sector
RURAL ENERGY AGENCY
Co-funding, capacity building, pre-investment
support
Stand–Alone Systems Service
Providers
Stand–Alone Systems
CustomersRetail Grid and Mini-Grid Customers
Small Power Producers/
Mini-grids Service Providers
TANESCO Imports
TANESCODistribution
Independent Power Producers
ENERGY AND WATER UTILITIES REGULATORY
AUTHORITY
MINISTRY OF ENERGY AND MINERALS
POLICY DIRECTION
STANDARDIZEDPOWER
PURCHASE AGREEMENT
ENFORCEMENTS
CUSTOMER COMPLAINTS
RETAIL TARIFF APPROVAL
SPPA, PPAS & BULK TARIFF APPROVAL, LICENSING
REGU
LATI
ONS
Source: Ministry of Energy and Minerals (2013b).

WRI.org 42
The Ministry of Energy and Minerals is responsible for formulating and articulating policies and strategies that create an enabling environment for various stakeholders to promote renewable energy.
The Energy and Water Utilities Regulatory Authority (EWURA) is an autonomous regulatory authority responsible for the technical and economic regulation of the electricity, petroleum, natural gas, and water sectors. It has the authority to issue, renew, and cancel licenses; establish standards for goods, services, and terms of supply; regulate rates and charges; make rules; facilitate resolution of complaints or disputes; and monitor sector performance related to investment levels, availability, quantity and standard of services, cost of services, and efficiency of production and distribution of services. The authority to make rules allows EWURA to develop guidelines and processes for small power producers and distributors, including those operating mini-grids. Rules address the activities of licensees, tariff and fee determinations, accounting and reporting standards, customer service and safety standards, and technical standards for interconnection, among others. EWURA’s authority over tariffs has important implications for the commercial viability of TANESCO as well as mini-grids. EWURA approves the tariffs TANESCO proposes to charge its customers. For mini-grids, EWURA is responsible for setting the feed-in tariffs under both the first and second SPP frameworks, as well as approving retail tariffs of SPPs above
100kW that sell directly to end-users (unless the SPP and consumer entity agree on a tariff under a power purchase agreement). Very small power producers (defined as below 100kW) are not required to adhere to these rules unless they choose to sell to the distribution network operator, in which case they must follow the outlined procedures.a
TANESCO is a vertically integrated public utility on the Tanzanian mainland. In addition to its own generation resources, it acts as a single buyer from independent power producers and SPPs and sells electricity to its own customers on the mainland and bulk power to the islands of Zanzibar and Pemba. TANESCO customers in rural areas are of two kinds: (a) customers connected to the national grid through grid extension (by TANESCO and the REA) under rural electrification programs and (b) customers served by isolated mini-grids developed by SPPs that later become connected to, and sell power to, the national grid and TANESCO-operated isolated grids. Some rural customers are supplied directly by SPPs. TANESCO is the country’s principal electricity generator, transmitter, and distributor (it is currently the sole licensed distribution network operator). It provides nearly 60 percent of the effective generating capacity of the national grid and is responsible for generation, transmission, and distribution, serving customers on the main grid and in 19 of its isolated grids.
The Rural Energy Agency (REA) is an autonomous body under the Ministry of Energy and Minerals that
became operational in October 2007. Its principal responsibilities are to (a) promote, stimulate, facilitate, and improve modern energy access in rural areas of mainland Tanzania in order to support economic and social development; (b) promote the rational and efficient production and use of energy and facilitate the identification and development of improved energy projects and activities in rural areas; (c) finance eligible rural energy projects through the Rural Electrification Fund; (d) prepare and review application procedures, guidelines, selection criteria, standards, and terms and conditions for the allocation of grants; (e) build capacity and provide technical assistance to project developers and rural communities; and (f) facilitate the preparation of bid documents for rural energy projects.
Independent power producers are private large plants (more than 10 MW) that sell power to the national grid. They include Symbion at Ubungo, IPTL at Tegeta, and Songas at Ubungo.
Small power producers (SPPs) are small independently operated power producers defined as having an export capacity of up to 10 MW. They may be private individuals, companies, cooperatives, or communities. SPPs sell power to TANESCO, into the national grid, to isolated grids, and/or directly to rural communities if they have a distribution network. They are classified by regulators based on their size, fuel used, and technology (see Appendix B).
BOX 3.1 | K EY STAKEHOLDERS IN PROMOTING, REGULATING, AND OPERATING MINI-GRIDS IN TANZANIA
a. The procedures are described in the following EWURA documents: Standardized Tariff Methodology for the Sale of Electricity to the Main Grid in Tanzania under Standardized Small Power Purchase Agreements (2008); Standardized Tariff Methodology for the Sale of Electricity to the Mini-Grids in Tanzania under Standardized Small Power Purchase Agreements (2009); Guidelines for Development of Small Power Projects (2011); The Standardized Small Power Purchase Tariff for 2014; Detailed Tariff Calculations for Year 2015 for the Sale of Electricity to the Mini-Grids in Tanzania (2015); and The (Revised) Electricity (Development of Small Power Projects) Rules (2015).

43Accelerating Mini-Grid Deployment in Sub-Saharan Africa: Lessons from Tanzania
The Policy and Regulatory FrameworkIn recognition of the role of the private sector and the opportunities to increase and diversify the energy supply, Tanzania has developed a comprehensive set of policies, supporting acts, and regulations to encourage private actors to develop small-scale distributed renewable energy resources. The SPP framework addresses some of the barriers that previously discouraged commercial or quasi-commercial mini-grid development.
The SPP framework incorporates feed-in tariffs (standardized power purchase tariffs [SPPTs] in the Tanzanian context) for SPPs that use renewable energy. Feed-in tariffs are tariff-support mechanisms often used to encourage renewable energy development by providing long-term price agreements that can provide a return on investment for developers that sell electricity to a central utility. In Tanzania EWURA determines these tariffs and sets the price at which TANESCO pays SPPs for electricity. SPPs may choose to sell electricity to TANESCO through interconnection with the grid or with a TANESCO-owned isolated mini-grid.
The agreement is laid out in a long-term contract (known as a standardized power purchase agreement [SPPA]) between the SPP and TANESCO. SPPTs and SPPAs enable the developer/sponsor to determine whether, given the tariff, it will be able to recoup its investment over the term of the power purchase agreement.
The regulatory process for SPP projects under EWURA has been streamlined and simplified. SPPs can obtain a provisional generation and distribution license that provides them with temporary exclusive use rights for three years, during which time they conduct preparatory assessments, studies, financial arrangements, land acquisitions, construction, and other activities leading to an application for a final license (SIDA/DfID 2015).
First- and Second-Generation Small Power Producers FrameworksFirst-Generation FrameworkThe first-generation SPP Framework was adopted in 2008. It outlined a clear process for the initiation, signing, and licensing of SPPs. It also enacted SPPAs and SPPTs for producers that chose to sell power to TANESCO. SPPAs could be applied for only in the case of projects of 1 MW or larger; they were signed for 15–25 years. SPPAs and SPPTs were created to minimize the time spent on negotiations between developers and TANESCO.
The first-generation framework distinguished the prices the SPP received for the sale of its electricity depending on who the off-taker was. The off-taker could be TANESCO through the main grid, TANESCO through an isolated mini-grid, and/or retail customers (Table 3.1).
Table 3.1 | Tariffs under the First-Generation Small Power Producers Framework
TYPE OF SALE APPLICABLE TARIFF
Wholesale to TANESCO main grid Feed-in tariff based on main grid cost avoided by TANESCO.
Wholesale to TANESCO isolated mini-grid Feed-in tariff based on mini-grid cost avoided by TANESCO.
Directly to retail customers Developer must submit application to EWURA for end-user (cost-based) tariff.
Sources: Adapted from EWURA (2011), Kahyoza and Greacen (2011), and Mtepa (2014).
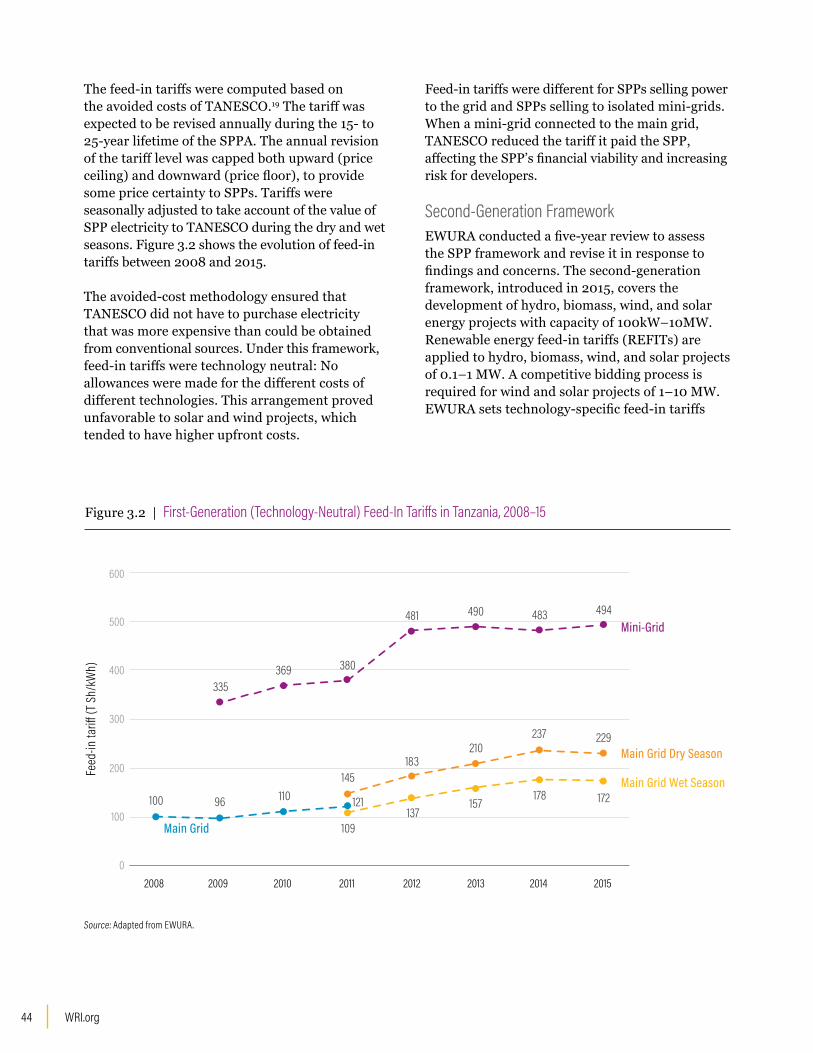
WRI.org 44
The feed-in tariffs were computed based on the avoided costs of TANESCO.19 The tariff was expected to be revised annually during the 15- to 25-year lifetime of the SPPA. The annual revision of the tariff level was capped both upward (price ceiling) and downward (price floor), to provide some price certainty to SPPs. Tariffs were seasonally adjusted to take account of the value of SPP electricity to TANESCO during the dry and wet seasons. Figure 3.2 shows the evolution of feed-in tariffs between 2008 and 2015.
The avoided-cost methodology ensured that TANESCO did not have to purchase electricity that was more expensive than could be obtained from conventional sources. Under this framework, feed-in tariffs were technology neutral: No allowances were made for the different costs of different technologies. This arrangement proved unfavorable to solar and wind projects, which tended to have higher upfront costs.
Feed-in tariffs were different for SPPs selling power to the grid and SPPs selling to isolated mini-grids. When a mini-grid connected to the main grid, TANESCO reduced the tariff it paid the SPP, affecting the SPP’s financial viability and increasing risk for developers.
Second-Generation FrameworkEWURA conducted a five-year review to assess the SPP framework and revise it in response to findings and concerns. The second-generation framework, introduced in 2015, covers the development of hydro, biomass, wind, and solar energy projects with capacity of 100kW–10MW. Renewable energy feed-in tariffs (REFITs) are applied to hydro, biomass, wind, and solar projects of 0.1–1 MW. A competitive bidding process is required for wind and solar projects of 1–10 MW. EWURA sets technology-specific feed-in tariffs
Figure 3.2 | First-Generation (Technology-Neutral) Feed-In Tariffs in Tanzania, 2008–15
Source: Adapted from EWURA.
Main Grid
Main Grid Dry Season
Main Grid Wet Season
Mini-Grid
121
183
100 96 110145
210237 229
109137
157178 172
335369 380
481 490 483 494
0
100
200
300
400
500
600
2008 2009 2010 2011 2012 2013 2014 2015
Feed
-in ta
ri� (T
Sh/
kWh)
Main Grid
Mini-Grid
Main Grid Dry Season
Main Grid Wet Season

45Accelerating Mini-Grid Deployment in Sub-Saharan Africa: Lessons from Tanzania
for small hydro and biomass projects based on the size of the plant (Table 3.2).
For 1–10 MW wind and solar projects, SPPTs will be determined by a project- or site-specific competitive bidding process, because EWURA expects technological progress to continue driving down the costs of wind turbines and solar plants. Wind and solar SPPs that produce less than 1 MW that want to sell to a distribution network operator are not subject to competitive bidding but will receive a tariff either set at a premium to the biomass tariff (500kW level) or determined by EWURA.
The same feed-in tariff applies whether SPPs sell power to the main grid or to isolated mini-grids, a change that addresses the previous problem of SPPs receiving lower tariffs upon interconnection to the main grid. The tariffs remain fixed for the 15- to 25-year life of the SPPA.
In another important change, second-generation tariffs are pegged to the U.S. dollar. The change helps developers obtain financing in U.S. dollars but may make it more difficult for mini-grids developers that obtain financing in Tanzanian shillings should the currency depreciate.
Table 3.2 | Tariffs for Biomass and Hydro Plants under the Second-Generation Small Power Producers Framework
INSTALLED CAPACITY (KW)
TARIFF ($/KWH)
HYDRO PLANT BIOMASS PLANT
100 0.155 No tariff
150 0.146 No tariff
200 0.141 0.179
250 0.140 No tariff
300 No tariff 0.169
400 No tariff 0.161
500 0.134 0.157
750 0.129 0.149
1,000 0.123 0.147
2,000 0.115 0.138
3,000 0.108 0.128
4,000 0.102 0.126
5,000 0.098 0.123
6,000 0.095 0.120
7,000 0.092 0.118
8,000 0.088 0.115
9,000 0.087 0.114
10,000 0.085 0.112
Source: EWURA, Electricity (Standardized Small Power Projects Tariff) Order, 2015.
The second-generation framework, introduced
in 2015, covers the development of hydro,
biomass, wind, and solar energy projects
with capacity of 100 kW–10 MW.

WRI.org 46
Table 3.3 summarizes how tariffs are determined for SPPs that intend to sell power to TANESCO (regardless of whether they also sell directly to customers) under the second-generation framework.
SPPs and small power distributors (SPDs) can also sell directly to retail customers. Direct end-user retail tariffs for projects below 1 MW (whether isolated or connected to the main grid) are based on cost plus regulation. SPPs may charge a cost-reflective tariff that incorporates a reasonable return on capital.
EWURA grants SPPs and SPDs the freedom to structure their prices in any way they choose. For example, SPPs can charge different tariffs for different customer categories, they can use different pricing structures, and they can use various technologies to measure and regulate consumer energy consumption. They can also
sell at the same price as the national uniform tariff. Tariffs can take the form of a charge per unit of energy consumed and/or a monthly service charge.20 In the case of large consumers, the tariff may involve additional demand charges.21 SPPs/SPDs are required to submit proposed tariffs to EWURA for approval. They must publicly notify customers about the proposed tariffs in both English and Kiswahili (though customer approval is not required).
The following are exceptions to the above:
▪ If the SPP/SPD signs a power purchase agreement directly with the customer in which both parties agree to the proposed tariffs, the SPP/SPD must submit copies of the documentation to EWURA, but it need not obtain EWURA approval.
Table 3.3 | Tariffs under the Second-Generation Framework for Small Power Producers Selling to TANESCO
TECHNOLOGY INSTALLED CAPACITY
LESS THAN 100 KW 100 KW–1,000 KW 1,000 KW–10,000 KW
Biomass Not bound by electricity rules set by EWURA. If they decide to opt in and also decide to sell wholesale to distribution network operator, small power producers (SPPs) must obtain letter of intent, power purchase agreement, and interconnection agreement. Standardized power purchase tariff (SPPTs) and small power purchase agreement (SPPAs) will apply to very small power producers unless EWURA creates separate tariffs specifically for them.
SPPT; applicable tariff depends on size of plant; feed-in tariffs start at 200 kW (see Table 3.2)
Hydro
Solar Feed-in tariffs determined by EWURA
OR
500 kW biomass tariff + 15 percent if connected to isolated mini-grid
500 kW biomass tariff + 5 percent if connected to main grid
Tariffs determined through competitive bidding
Wind Feed-in tariffs determined by EWURA
OR
500 kW biomass tariff + 15 percent if connected to isolated mini-grid
500 kW biomass tariff + 5 percent if connected to main grid
Tariffs determined through competitive bidding
Source: EWURA, Electricity (Standardized Small Power Projects Tariff) Order, 2015.
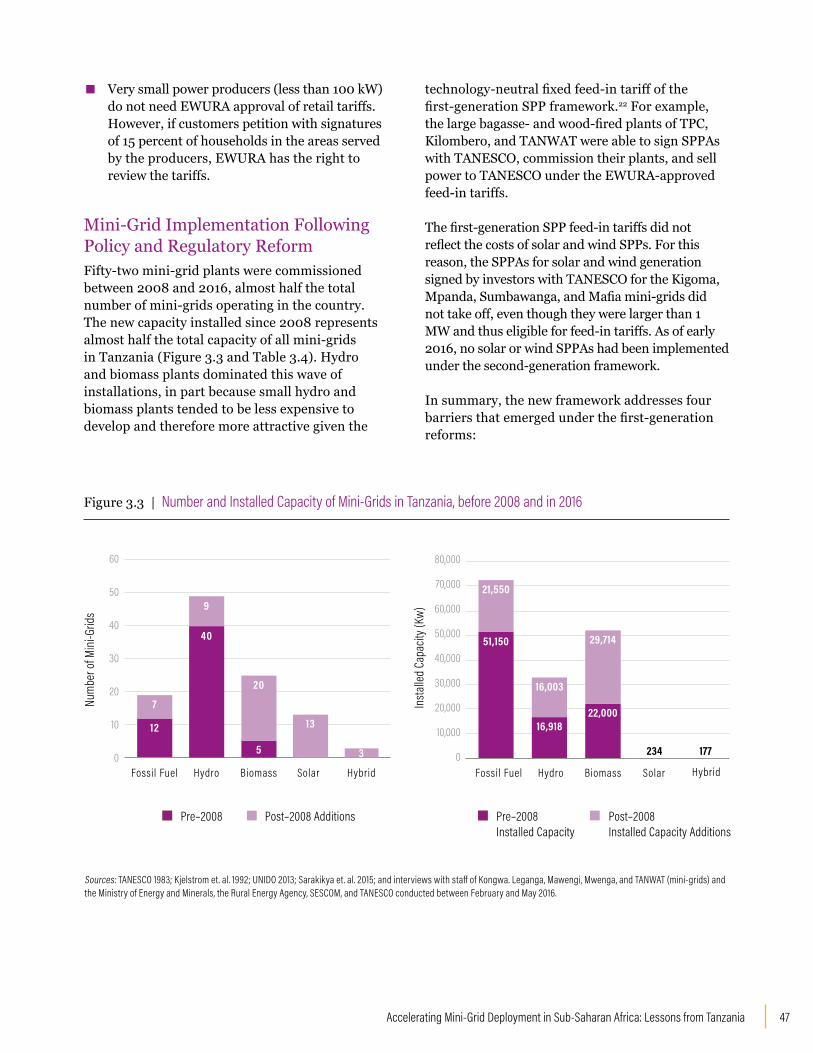
47Accelerating Mini-Grid Deployment in Sub-Saharan Africa: Lessons from Tanzania
▪ Very small power producers (less than 100 kW) do not need EWURA approval of retail tariffs. However, if customers petition with signatures of 15 percent of households in the areas served by the producers, EWURA has the right to review the tariffs.
Mini-Grid Implementation Following Policy and Regulatory Reform Fifty-two mini-grid plants were commissioned between 2008 and 2016, almost half the total number of mini-grids operating in the country. The new capacity installed since 2008 represents almost half the total capacity of all mini-grids in Tanzania (Figure 3.3 and Table 3.4). Hydro and biomass plants dominated this wave of installations, in part because small hydro and biomass plants tended to be less expensive to develop and therefore more attractive given the
technology-neutral fixed feed-in tariff of the first-generation SPP framework.22 For example, the large bagasse- and wood-fired plants of TPC, Kilombero, and TANWAT were able to sign SPPAs with TANESCO, commission their plants, and sell power to TANESCO under the EWURA-approved feed-in tariffs.
The first-generation SPP feed-in tariffs did not reflect the costs of solar and wind SPPs. For this reason, the SPPAs for solar and wind generation signed by investors with TANESCO for the Kigoma, Mpanda, Sumbawanga, and Mafia mini-grids did not take off, even though they were larger than 1 MW and thus eligible for feed-in tariffs. As of early 2016, no solar or wind SPPAs had been implemented under the second-generation framework.
In summary, the new framework addresses four barriers that emerged under the first-generation reforms:
Figure 3.3 | Number and Installed Capacity of Mini-Grids in Tanzania, before 2008 and in 2016
Sources: TANESCO 1983; Kjelstrom et. al. 1992; UNIDO 2013; Sarakikya et. al. 2015; and interviews with staff of Kongwa. Leganga, Mawengi, Mwenga, and TANWAT (mini-grids) and the Ministry of Energy and Minerals, the Rural Energy Agency, SESCOM, and TANESCO conducted between February and May 2016.
Fossil Fuel
Num
ber o
f Min
i-Grid
s
60
50
40
30
20
10
0
7
Biomass
20
5
Solar
13
Hybrid
3
Hydro
9
40
12
Insta
lled
Capa
city (
Kw)
HybridFossil Fuel Biomass SolarHydro
80,000
70,000
60,000
50,000
40,000
30,000
20,000
10,000
0
21,550
51,150
16,003
29,714
22,000
234 177
16,918
Pre–2008 Post–2008 Additions Pre–2008 Installed Capacity
Post–2008 Installed Capacity Additions

WRI.org 48
▪ Cost variation between hydro and biomass systems. Electricity costs for both technologies can vary greatly depending on the location of plants, their size, and the availability of fuel, among other factors. For example, the capital costs of hydro plants can be very high where the water source and demand center are far apart, as additional lines are required to transport the electricity. Biomass plants tend to benefit more from economies of scale as they increase in size. Feed-in tariffs account for these cost variations. By providing set tariffs (as opposed to annual revisions based on the distribution network operator’s avoided cost), the second-generation framework offers an additional measure of certainty to SPPs.
▪ Tension between incentivizing clean energy development and the ability of TANESCO to commit to paying set prices throughout the duration of the SPPA, especially if solar and wind costs decrease. The second-generation
framework introduces a competitive bidding process for solar and wind SPPs above 1 MW that allows TANESCO to purchase solar and wind electricity from least-cost providers. In theory, competitive bidding should encourage efficiency and reduce costs.
▪ Problems related to inflation and exchange rate fluctuations. Pegging feed-in tariffs to the U.S. dollar benefits mini-grid sponsors/developers who raise debt finance in U.S. dollars, because their revenue from the distribution network operator (TANESCO) is not affected by declines in the Tanzanian shilling. The removal of such foreign currency risk from the project makes the project more attractive. However, TANESCO must absorb the additional cost of depreciation of the shilling against the dollar.
▪ Too high a threshold for feed-in tariff eligibility. Reducing the threshold from 1 MW to 100 kW may allow some hydro mini-grids located
Table 3.4 | Establishment of Mini-Grids in Tanzania Following Small Power Producer Regulation of 2008
TECHNOLOGY NUMBER OF PLANTS INSTALLED CAPACITY (KW)
TOTAL COMMISSIONED SINCE 2008
PERCENT OF TOTAL TOTAL INSTALLED
SINCE 2008 PERCENT OF TOTAL
Fossil fuel 19 7 37 72,700 21,550 30
Hybrid 3 3 100 177 177 100
Nonrenewable subtotal 22 10 45 72,877 21,727 30
Hydro 49 9 18 32,921 16,003 49
Biomass 25 20 80 51,714 29,714 58
Solar 13 13 100 234 234 100
Renewable subtotal 87 42 48 84,869 45,951 54
Total 109 52 48 157,746 67,678 43
Sources: TANESCO 1983; Kjelstrom et. al. 1992; UNIDO 2013; Sarakikya et. al. 2015; and interviews with staff of Kongwa. Leganga, Mawengi, Mwenga, and TANWAT (mini-grids) and the Ministry of Energy and Minerals, the Rural Energy Agency, SESCOM, and TANESCO conducted between February and May 2016.
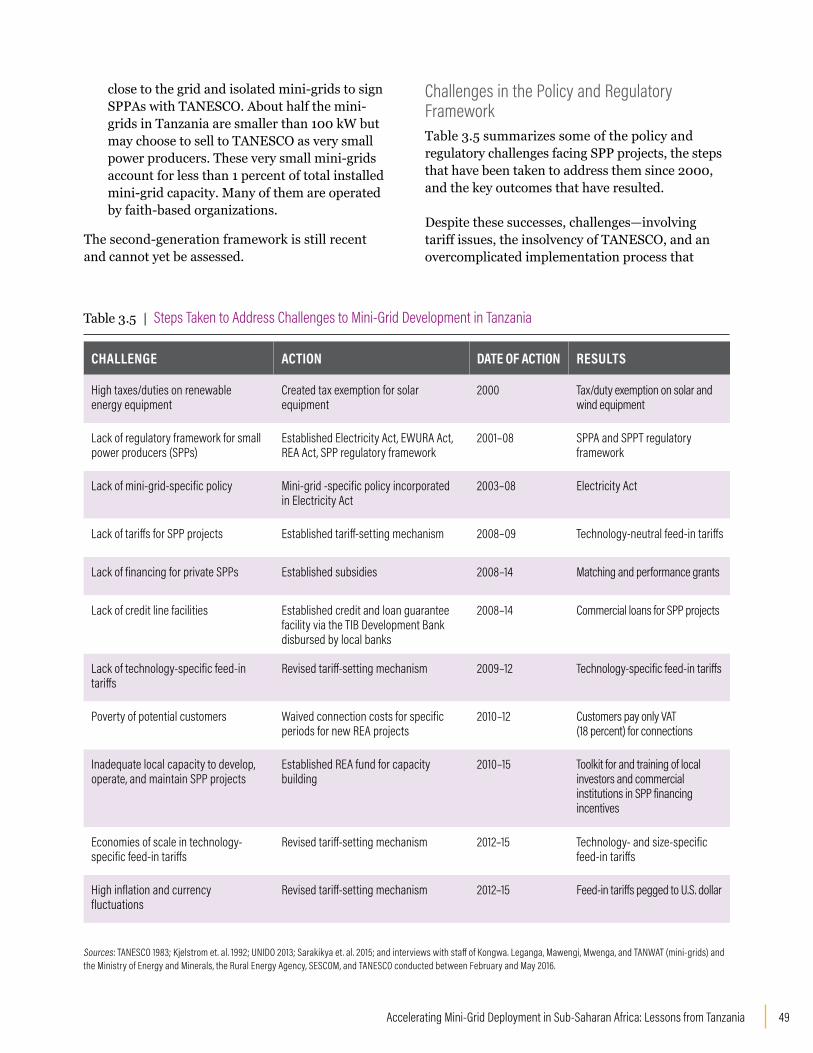
49Accelerating Mini-Grid Deployment in Sub-Saharan Africa: Lessons from Tanzania
close to the grid and isolated mini-grids to sign SPPAs with TANESCO. About half the mini-grids in Tanzania are smaller than 100 kW but may choose to sell to TANESCO as very small power producers. These very small mini-grids account for less than 1 percent of total installed mini-grid capacity. Many of them are operated by faith-based organizations.
The second-generation framework is still recent and cannot yet be assessed.
Challenges in the Policy and Regulatory Framework Table 3.5 summarizes some of the policy and regulatory challenges facing SPP projects, the steps that have been taken to address them since 2000, and the key outcomes that have resulted.
Despite these successes, challenges—involving tariff issues, the insolvency of TANESCO, and an overcomplicated implementation process that
Table 3.5 | Steps Taken to Address Challenges to Mini-Grid Development in Tanzania
CHALLENGE ACTION DATE OF ACTION RESULTS
High taxes/duties on renewable energy equipment
Created tax exemption for solar equipment
2000 Tax/duty exemption on solar and wind equipment
Lack of regulatory framework for small power producers (SPPs)
Established Electricity Act, EWURA Act, REA Act, SPP regulatory framework
2001–08 SPPA and SPPT regulatory framework
Lack of mini-grid-specific policy Mini-grid -specific policy incorporated in Electricity Act
2003–08 Electricity Act
Lack of tariffs for SPP projects Established tariff-setting mechanism 2008–09 Technology-neutral feed-in tariffs
Lack of financing for private SPPs Established subsidies 2008–14 Matching and performance grants
Lack of credit line facilities Established credit and loan guarantee facility via the TIB Development Bank disbursed by local banks
2008–14 Commercial loans for SPP projects
Lack of technology-specific feed-in tariffs
Revised tariff-setting mechanism 2009–12 Technology-specific feed-in tariffs
Poverty of potential customers Waived connection costs for specific periods for new REA projects
2010–12 Customers pay only VAT (18 percent) for connections
Inadequate local capacity to develop, operate, and maintain SPP projects
Established REA fund for capacity building
2010–15 Toolkit for and training of local investors and commercial institutions in SPP financing incentives
Economies of scale in technology-specific feed-in tariffs
Revised tariff-setting mechanism 2012–15 Technology- and size-specific feed-in tariffs
High inflation and currency fluctuations
Revised tariff-setting mechanism 2012–15 Feed-in tariffs pegged to U.S. dollar
Sources: TANESCO 1983; Kjelstrom et. al. 1992; UNIDO 2013; Sarakikya et. al. 2015; and interviews with staff of Kongwa. Leganga, Mawengi, Mwenga, and TANWAT (mini-grids) and the Ministry of Energy and Minerals, the Rural Energy Agency, SESCOM, and TANESCO conducted between February and May 2016.

WRI.org 50
involves different regulatory authorities and leads to delays in project completion—remain. Some important ones include the following:
▪ The TANESCO retail tariffs approved by EWURA are still not fully reflective of costs. This factor, along with rising costs, in part because of a changing generation mix, has contributed to TANESCO’s poor financial performance over the years. TANESCO struggles to meet its financial obligations, including those under SPPAs. This challenge has affected the Mwenga and TANWAT plants, to mention only two. In part to attract private investment and participation in the energy sector and in part to improve TANESCO’s financial position, the Ministry of Energy and Minerals developed and began implementing a strategic roadmap (2014–25) to restructure the power sector, including vertically and horizontally unbundling TANESCO. However, in the short to medium term, TANESCO’s difficulties meeting SPPA conditions makes the feed-in tariff framework less effective in attracting more interest in mini-grid development.
▪ Extending feed-in tariffs to a lower generation capacity (100 kW) encourages investment in smaller plants but has the unintended consequence of encouraging diseconomies of scale in the energy pricing system. Before 2008, small isolated mini-grid plants could be retired from service once they were connected to the main grid if they were considered too expensive to continue operating. Now, SPPAs must be honored for the duration of the contract. As SPPAs last 15–25 years, the long-term implication of diseconomies of scale need to
be evaluated, particularly in light of the long-term competitiveness of TANESCO to export to power pools in southern and eastern Africa.
▪ TANWAT and Mwenga SPPs complain of grid instabilities that affected their plants. When the grid is unstable, the operator often must disconnect plants; or grid instabilities may trigger disconnection safety mechanisms to protect power equipment. As a result, SPPs are forced to buy power from TANESCO to restart or synchronize their plants with the grid system. This point of high demand from the SPP can translate into expensive SPP bills under TANESCO’s “rachet clause,” a provision that allows TANESCO to bill demand charges at the rate associated with customers’ peak demand over the month plus 75 percent of the maximum demand over the preceding three months.
▪ A successful competitive bidding program will require sufficient competition between high-quality developers as well as clear processes for identifying and securing land for project sites. Competition from a larger pool of developers is needed in order for TANESCO and the proposed rural mini-grid customers to benefit from the competitive bidding process. The low capacity of local developers remains a challenge. Time-consuming procedures for siting mini-grids and securing land and necessary clearances may prevent the accelerated deployment of mini-grids.

51Accelerating Mini-Grid Deployment in Sub-Saharan Africa: Lessons from Tanzania
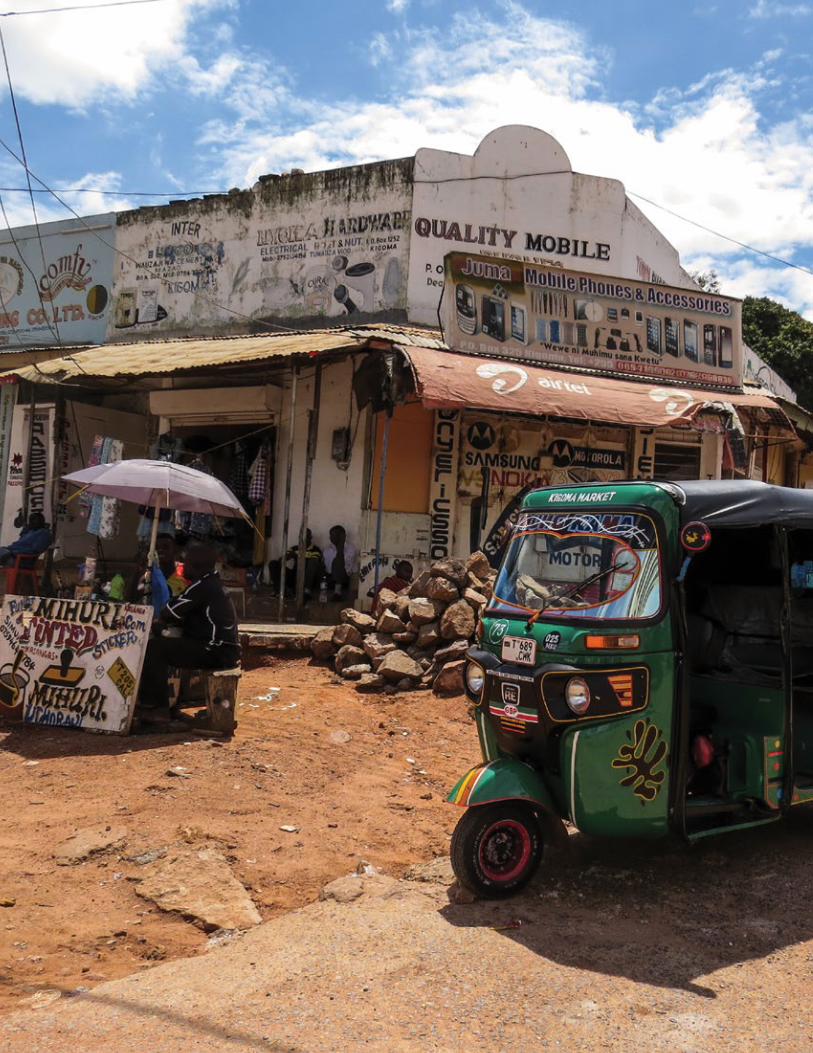
WRI.org 52

53Accelerating Mini-Grid Deployment in Sub-Saharan Africa: Lessons from Tanzania
CHAPTER 4
MINI-GRID OWNERSHIP AND OPERATIONAL MODELSMany practical difficulties stand in the way of the development and
scale-up of mini-grids. Mini-grids are often located in rural areas,
where technical and managerial capacity is often limited, spare
parts are not available, and electricity customers have limited ability
to pay, making it hard to collect revenues that match short-term and
long-term operating costs.

WRI.org 54
Innovative operational models that ensure sustainability of services over time are essential. A number of operational models for mini-grids have been tried or adapted. They include community, private, utility, and faith-based models (cooperative models were also tried but are no longer used). Most hydro mini-grids operate on a faith-based model, biomass plants and hybrid systems are privately owned, solar plants are community based, and diesel plants are utility owned and managed (Figure 4.1).
Mini-grids can price retail energy based on consumption (kWh), power demand magnitude (kVA per month), the number of appliances, a monthly service charge, or a combination of different methods. Mini-grids can choose from various options regarding when and how consumers can pay. Table 4.1 summarizes some of these options.
Hydro, biomass, and hybrid systems sell electricity on credit via credit-metering systems. Most solar mini-grids use load limiters, although a few use prepayment metering and pay-as-you-go payment systems. The utility model uses both prepayment and credit metering (Table 4.2 and Figure 4.2).
The following sections provide more detailed information, drawing on the experiences of selected plants managed under each of the four ownership models operating in Tanzania. Information is also provided on the cooperative model, which was tried during the 1990s but since been abandoned.
▪ Mini-grids in Tanzania operate under four models: community, private, utility, and faith-based ownership and operation.
▪ Community-based models have experienced mixed success with management, service delivery, and revenue collection. Community ownership and participation in project development and operations appears to be a key factor for sustainability.
▪ Larger privately owned mini-grids that are grid connected experience difficulties with delayed payment for bulk sales to the national utility. Household customers pay on time, but retail tariffs need to be high to cover long-term costs. Operations and maintenance costs of rural mini-grid networks run by TANESCO are high, but the utility is allowed to charge only a low “lifeline” tariff to rural customers. The lifeline tariff is cross-subsidized by tariffs to larger users, but they, too, fail to fully reflect costs.
▪ Mini-grids owned by faith-based organizations have operated for many years but are usually not financially self-sufficient.
KEY TAKEAWAYS
Innovative operational models that ensure
sustainability of services over time are
essential.

55Accelerating Mini-Grid Deployment in Sub-Saharan Africa: Lessons from Tanzania
Figure 4.1 | Ownership of Mini-Grids in Tanzania, by Energy Source, 2016
Sources: TANESCO 1983; Kjelstrom et. al. 1992; Sarakikya et. al. 2015; UNIDO 2013; interviews with staff of Kongwa, Leganga, Mawengi, Mwenga, and TANWAT (mini-grids) and Husk Power, the Ministry of Energy and Minerals, the REA, SESCOM, and TANESCO conducted between February and May 2016.
Hydro Biomass Solar Fossil fuel Hybrid
Perc
ent o
f all m
ini-g
rids
Faith–based
Utility
Private
Community
100
80
60
40
20
0
59
14
12
14
96
4
15
85
100 100
Table 4.1 | Mini-Grid Retail Tariff, Measurement, and Payment Options
ITEM OPTION
Tariff structure ▪ Flat-rate tariffs or subscription tariffs: Fixed monthly fee regardless of amount of energy used, as long as maxi-mum demand at any given time (load) does not exceed level set in subscription amount (e.g., price per month).
▪ Energy tariff: Price per unit of energy consumed (price/kWh).
▪ Service charge: Typically a flat monthly rate to cover costs incurred by electricity supplier for meter reading, billing, and related costs.
▪ Demand charge: Often expressed as price per kVA/month. Demand charges typically used for consumers that consume large amounts of electricity (e.g., commercial entities).
Financing and payment ▪ Credit: Customer consumes energy and then pays for it. Bill usually issued at end of month based on meter readings. Billed amount varies monthly.
▪ Prepaid: Customer purchases energy units in advance (e.g., at beginning of each month), via scratch cards, card tokens, cash at retail location with payment printouts, or mobile money.
▪ Pay-as-you-go: Customer purchases small amounts of prepaid electricity on ongoing basis.
▪ Prepaid and pay-as-you-go systems can be turned on and off remotely as electricity is purchased or used up.
Source: Tenenbaum et al. (2014) and Deshmukh et al. (2013).
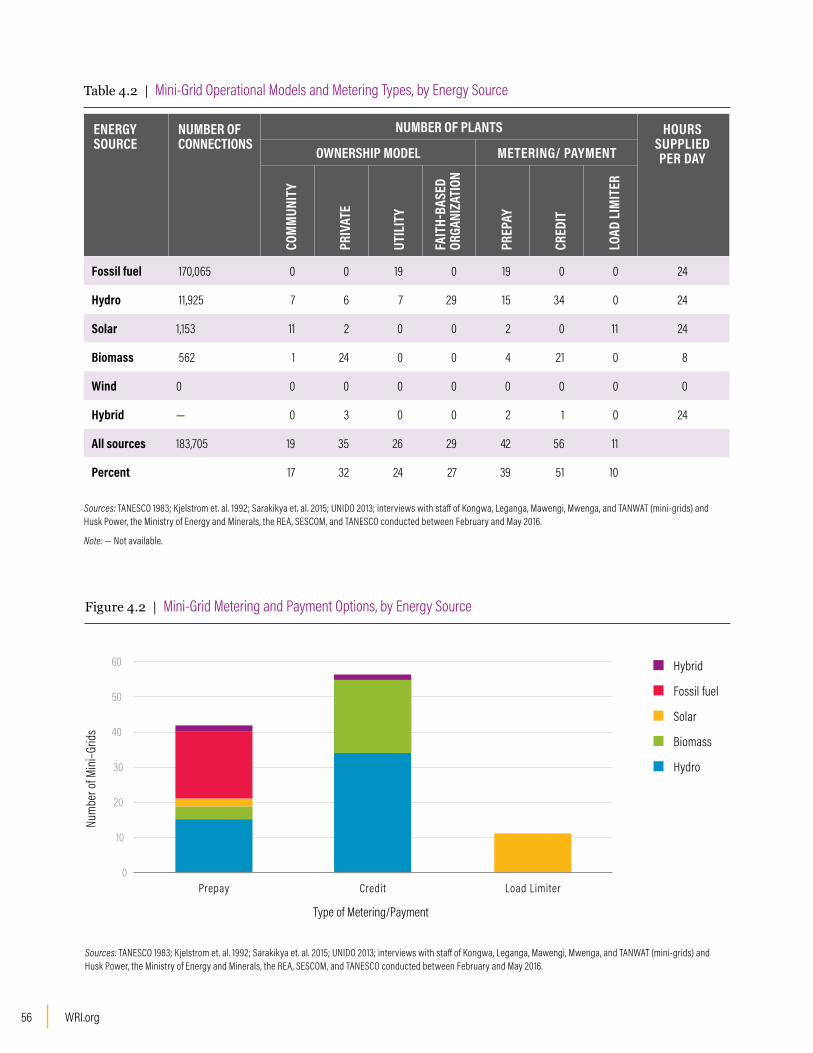
WRI.org 56
Table 4.2 | Mini-Grid Operational Models and Metering Types, by Energy Source
ENERGY SOURCE
NUMBER OF CONNECTIONS
NUMBER OF PLANTS HOURS SUPPLIED PER DAYOWNERSHIP MODEL METERING/ PAYMENT
COM
MUN
ITY
PRIV
ATE
UTIL
ITY
FAIT
H-BA
SED
ORGA
NIZA
TION
PREP
AY
CRED
IT
LOAD
LIM
ITER
Fossil fuel 170,065 0 0 19 0 19 0 0 24
Hydro 11,925 7 6 7 29 15 34 0 24
Solar 1,153 11 2 0 0 2 0 11 24
Biomass 562 1 24 0 0 4 21 0 8
Wind 0 0 0 0 0 0 0 0 0
Hybrid — 0 3 0 0 2 1 0 24
All sources 183,705 19 35 26 29 42 56 11
Percent 17 32 24 27 39 51 10
Sources: TANESCO 1983; Kjelstrom et. al. 1992; Sarakikya et. al. 2015; UNIDO 2013; interviews with staff of Kongwa, Leganga, Mawengi, Mwenga, and TANWAT (mini-grids) and Husk Power, the Ministry of Energy and Minerals, the REA, SESCOM, and TANESCO conducted between February and May 2016.
Note: — Not available.
Figure 4.2 | Mini-Grid Metering and Payment Options, by Energy Source
Sources: TANESCO 1983; Kjelstrom et. al. 1992; Sarakikya et. al. 2015; UNIDO 2013; interviews with staff of Kongwa, Leganga, Mawengi, Mwenga, and TANWAT (mini-grids) and Husk Power, the Ministry of Energy and Minerals, the REA, SESCOM, and TANESCO conducted between February and May 2016.
Num
ber o
f Min
i–Grid
s
0
10
20
30
40
50
60
Prepay Credit Load Limiter
Type of Metering/Payment
Hybrid
Fossil fuel
Solar
Biomass
Hydro

57Accelerating Mini-Grid Deployment in Sub-Saharan Africa: Lessons from Tanzania
Community-Based ModelA community-based business is one that is community owned, led, and controlled and reinvests any profits generated in the business or distributes them to community members. This operational model is being practiced by 19 mini-grids, including the LUMAMA hydro mini-grid in Ludewa and 10 villages served by containerized solar mini-grids. The plants and networks are owned by the communities they serve. A village electricity committee is elected by consumers and is responsible for managing the network. The committee has an elected chairperson, secretary, and treasurer. The elected committee’s tenure is three years.
The LUMAMA Hydro Mini-Grid
The LUMAMA 300 kW hydro mini-grid (in the Ludewa District, in the Njombe Region) was funded by a grant from the European Union and the government of Italy. It was built by ACRA–Centro Cooperazione Sviluppo of Italy, an NGO working to reduce poverty through sustainable, innovative, and cooperative solutions. The first unit was commissioned in 2009, the second in 2012. Villagers participated by donating their labor to dig holes and carry poles; they continue to undertake regular tree-clearing under distribution lines.
The plant is owned by the LUMAMA village community, consisting of electricity consumers; the Njombe Roman Catholic Diocese; and the European Committee for Training and Agriculture (CEFA),
an Italian NGO. Initially, the land for the site was owned by individual villagers; it is now owned by the village community. The village community has a board of directors with seven members. Five are elected by the community, one is from the district office, and one is from the diocese.
The community employs four staff—a manager, an accountant, and two technicians—who operate and maintain the network, collect revenue, and connect consumers. Consumers apply for service and pay to be connected. The payment modality for connection has changed over time. Initially, customers paid 20 percent of connection costs upfront, with the balance paid in installments. Later the upfront share was raised to 50 percent of connection costs. Currently, customers must pay 100 percent of service connection costs upfront, which amounts to at least T Sh 150,000), and possibly more, depending on the customer’s distance from the existing network and house wiring requirements. This change was made necessary by the failure of some customers to honor their installment payments; a few cases had to be resolved by village courts. As of early 2016, LUMAMA served 1,612 customers.
The village committee sets tariffs, which are supposed to recover the operations, maintenance, and replacement costs of the system. The tariffs are discussed and approved by all customers at an annual meeting. Table 4.3 shows the tariffs that went into effect in 2014.
Table 4.3 | Tariffs Charged by the LUMAMA Hydro Mini-Grid
TYPE OF CONSUMER SERVICE CHARGE (T SH/MONTH) ENERGY CHARGE (T SH/KWH)
Household 3,000 250
Institution 3,000 300
Grain-millers 6,000 400
Workshop, small-scale industry, oil-extraction mill
6,000 500
Source: Interviews with LUMAMA community members.
Note: Tariffs went into effect August 1, 2014.

WRI.org 58
As of February 2016, revenue collection was about T Sh 10 million a month (about $4,500), of which about T Sh 8.5 million (about $3,800) covered short-term costs. According to mini-grid personnel, this revenue is sufficient to cover the costs of staff salaries and minor equipment replacements, such as lightning arrestors, but is not enough to cover the costs of replacing major equipment, such as turbines, generators, or governor systems. To address this shortfall, LUMAMA plans to review tariffs, reduce operational costs, and increase the number of customers.
The Leganga Solar Mini-Grid The Leganga solar mini-grid was built by the Austrian company Electro-Merl and commissioned in 2015. It is owned by the village community. A village committee manages the system and collects revenue. The committee is elected at the annual general meeting for a tenure of three years; committee members do not belong to the village government. Village members also elect a chairperson, secretary, and treasurer of the committee. Operations and management (O&M) of the plant is undertaken by a competitively selected company (currently Electro-Merl), which is responsible for O&M of all 14 containerized solar mini-grids serving 10 villages in Dodoma, Katavi, and Tabora. The company has four staff: one manager and three technicians. Each technician is responsible for O&M of containerized systems in one of the three regions.
Initial tariffs were proposed by the Ministry of Energy and Minerals and reviewed by the village mini-grid committee, which proposed lower ones. They were approved at the village’s annual general meeting. A flat-rate tariff applies to various consumer groups (Table 4.4). All connections have load limiters. Cash payments are made to the village treasurer. The village committee specifies a time period within which the customer should pay. If payment is not received by the end of this period, the service line is disconnected and service is offered to another customer.
The Leganga project is not working out well, because of poor revenue collection. Customer revenues amounted to T Sh 1.16 million a month but, as of February 2016, revenue had been collected for only one month (July 2015). Election of the village committee was reportedly delayed, receipt books were lacking, and a bank account to handle deposit of collected revenue was not opened. The interim committee overstayed its term, in violation of community regulations, and had no mandate to manage the mini-grid. Some connected customers were unable to pay for electricity services and requested that service be terminated. Others questioned why they should pay for services from a plant that the government had donated to their village. All these factors appear to indicate villagers’ disinclination to pay for service.
Another challenge is that the plant is not adequate to meet demand. Many villagers remain on the
Table 4.4 | Monthly Tariffs Charged by the Leganga Solar Mini-Grid
TYPE OF CONSUMER
NUMBER OF CUSTOMERS
LOAD LIMITER RATING (W)
TARIFF (T SH)
PROPOSED BY MINISTRY OF ENERGY AND MINERALS
APPROVED BY VILLAGE
Household 25 100 5,000–10,000 3,000
Commercial entity 15 250 10,000–20,000 5,000
Institution 20 500 15,000–20,000 5,000
Source: Interviews with Leganga community members and Ministry of Energy and Minerals staff.
Note: Tariffs went into effect in May 2015.

59Accelerating Mini-Grid Deployment in Sub-Saharan Africa: Lessons from Tanzania
waiting list to be connected. Load limiters (100W for households, 250W for commercial customers, and 500W for institutions) appear to be rated higher than customers demand, and this type of metering does not encourage efficient use of electricity. If prepaid meters were installed and payments made by mobile money platforms using a real-time customer disconnection delivery model, usage would become more efficient, enabling the plant to connect more customers, which would improve its financial sustainability.
Private Business ModelA private business delivers goods or services to customers for a fee and is owned and operated with the intention of maximizing profits (which can be distributed to owners/shareholders and/or reinvested in the company). This operational business model is practiced by, among others, the Mwenga hydro mini-grid in the Mufindi District, in the Iringa Region; the Tanganyika Wattle Company (TANWAT) biomass mini-grid in Njombe Township, in the Njombe Region; and the Devergy pico-solar generator in Saadan village, in the Bagamoyo District, in the Coast Region.
The Mwenga Hydro Mini-GridThe 4 MW Mwenga hydro mini-grid is privately owned by the Rift Valley Energy Company, which is registered in Mauritius and has activities in Mauritius, Zimbabwe, and Tanzania. Commissioned in 2013, the mini-grid was funded by a grant from the European Union and the REA, a loan from a local commercial bank, and equity. O&M is undertaken by a full-time manager with a technical background and 16 staff, including 4 full-time power plant operators. The remaining employees are responsible for network expansion and O&M, including cutting trees under the power lines corridor. The staff is also responsible for connecting new customers and disconnecting customers who fail to pay.
The mini-grid charges two types of tariff and uses different metering and payment systems. It sells bulk power to TANESCO through the main grid at feed-in tariff rates. It charges the 3,500 customers living in the 14 villages connected to the plant’s mini-grid a monthly tariff of T Sh60/kWh (approved by
EWURA), cross-subsidizing these low retail tariffs with revenue from TANESCO sales. Metering to TANESCO is by a credit meter that is jointly read by both parties once a month. Following meter reading, an invoice is submitted to TANESCO that is supposed to be paid within an agreed period. Metering of customers in the 14 villages is by prepaid meters. Payment is by a scratch card system; disconnection is carried out by computer.
During times of load shedding in the Mufindi District, where the Mwenga mini-grid is located, the plant supplies power as a standby facility to the TANESCO Mufindi network and to the Mufindi Tea Factory (with demand of 500 kW) and its staff housing estate.23 During maintenance of the Mafinga–Iringa or Mufindi–Iringa lines, the Mwenga mini-grid provides an alternative source of power, considerably reducing outages in the network. The plant is located 165 kilometers from the main substation at Iringa. The facilities it serves—the villages, the tea factory, and tea factory housing estate—would suffer far more frequency and voltage fluctuations if the plant did not exist.
The mini-grid is facing a revenue-collection challenge. Payments by TANESCO are not forthcoming, because of the utility’s financial insolvency. In contrast, retail
During maintenance of the Mafinga–Iringa
or Mufindi–Iringa lines, the Mwenga mini-grid
provides an alternative source of power,
considerably reducing outages in the network.

WRI.org 60
customers in the 14 villages have been paying on time. Revenues are low, however, because Mwenga is charging retail customers a highly subsidized lifeline tariff of T Sh 60/kWh (which is lower than TANESCO’s cross-subsidized D1 tariff of T Sh 100/kWh, see Table 4.5). Revenue collection from retail sales alone cannot match the costs of providing services to the villages and would appear to be well below the level of commercial viability. Approximately 5 percent of the Mwenga plant’s electricity generation is sold directly to the village customers; the balance is sold to TANESCO. There are plans to establish a subsidiary company that will be dedicated to serving only rural consumers.
The main lessons from Mwenga are that (a) although village customers pay their bills on time, the revenue collected does not cover the costs of providing services unless the price increases and (b) sales to large customers—such as industry and the distribution network operator—using SPPTs can be profitable but only if paid on time. Mwenga could be financially sustainable if TANESCO paid its bills on time. Improving subsidized consumers’ end-use energy efficiency could lower the costs of serving them.
The TANWAT Biomass Mini-GridThe Tanganyika Wattle Company (TANWAT) is owned by KALDORA International Limited, a company registered in the British Virgin Islands. The TANWAT plant, commissioned in 1995, uses wattle-tree residues, collected from the farm, the tannin production factory, and the saw mill, as feedstock. Electricity is produced as a byproduct of tannin production. Daily electricity production is about 24,000 kWh, of which 16,000 kWh is consumed by the tannin and plywood factories, saw mill, wood pole treatment plant, office, and housing estate. The balance is sold to the distribution network operator via the SPPT tariff. The distribution network operator is metered by a credit meter, which is read monthly by both parties; the bill is supposed to be paid after a predetermined period of time. The factory, office, and housing estates constitute part of tanning production costs.
The TANWAT power plant employs 10 full- time staff.
The plant is not operating efficiently. Several major parts—including the injector, the de-aerator, the preheater, the cooling tower, and auxiliary equipment for the condenser—are defective and require repair or replacement. Spare parts are not available locally, and delivery time is two to three months. The current de-rated plant capacity is 1.2 MW, down from 2.5 MW when the plant was built. As a result, wood-residue feedstock has accumulated at the power plant; it generates less revenue when sold directly than when used to produce electricity.
Like Rift Valley Energy’s Mwenga plant, TANWAT is facing revenue problems because of TANESCO’s default on outstanding bill payments. The company has also been hit by stability problems with the national grid, which cause it to lose production. The plant has to import expensive power from TANESCO for start-up and synchronization to the grid.
The sustainability of this business model is questionable. TANWAT plans to expand the plant by 5–7 MW using gasifier technology. The upgrade is expected to make the plant more efficient and thus reduce O&M costs.
The Devergy Solar Mini-Grid The Italian company Devergy owns and operates a 2 kWp pico-solar generator in Saadan village in the Bagamoyo District. It supplies DC electricity to 100 customers using a prepayment metering system. The model involves clusters of five to six households served by an energy distribution box (“Enbox”), which consists of two 30-watt solar panels and a 0.5 kWh battery. All Enboxes are connected to a 24-volt DC bus (connector), which is metered and subjected to real-time monitoring. Customers prepay via cell phones. Tariffs are high, with the average bill about T Sh 11,000 a month (Greacen 2014). Given these high tariffs, the mini-grid supplies only better-off customers in this village.
Customers pay via an innovative pay-as-you–go system hosted by private regulated telephone system operators. M-Pesa, Airtel money, and Tigo-Pesa are mobile money services offered by three of the largest mobile network operators in Tanzania (Vodacom,

61Accelerating Mini-Grid Deployment in Sub-Saharan Africa: Lessons from Tanzania
Airtel, and Tigo, respectively). They allow users to deposit, withdraw, and transfer money and pay bills from their phones. Disconnection is undertaken by computer.
This model is financially sustainable, because it effectively collects revenue that covers its costs.
Utility-Based Model TANESCO, Tanzania’s national utility, owns and runs 17 diesel mini-grids in Kigoma, Rukwa, Ruvuma, and some parts of Lindi and Mtwara, ranging in size from 300 kW to 8,200 kW. It also owns and runs two natural gas mini-grids, at Lindi-Mtwara (17,750 kW) and Somanga-Kilwa (7,500 kW). In addition, it owns, operates, and manages an 840 kW hydro mini-grid at Uwemba, in the Njombe Region—a region that is also supplied by the national grid.
TANESCO tariffs are uniform throughout the country. They apply to all retail consumers who purchase electricity from TANESCO via the main grid or its mini-grids.
EWURA approves retail tariffs charged by TANESCO. TANESCO submits a tariff application to EWURA for review and a public hearing, in which the consumers’ consultative committee, the government’s consultative committee, and the general public participate. EWURA then makes a decision to approve a tariff based on the cost of service by the utility.
TANESCO may submit an application to EWURA for tariff review or adjustment whenever there are significant economic or operational changes that affect its cost recovery (e.g., a rise in fossil fuel costs in global markets or major currency fluctuations). Table 4.5 shows the current tariffs in use.
Tariffs T1–T3 subsidize the D1 lifeline tariff. This model is risky because the subsidy for the lifeline tariff depends upon EWURA’s approval of the T1–T3 cost-reflective tariffs as well as efficient revenue collection from these customers. It also requires TANESCO to implement cost-cutting strategies in its operations and energy-efficiency programs in its service delivery. For several years, TANESCO has
Table 4.5 | TANESCO Tariffs Charged to All Retail Customers
TARIFF DESCRIPTION SERVICE CHARGE (T SH/MONTH)
ENERGY CHARGE (T SH/KWH)
DEMAND CHARGE (T SH/KVA/MONTH)
D1 Low voltage (230V) consumption of less than 75 kWh
0 100 0
T1 Low voltage (230–400V) consumption of more than 75 kWh
5,520 306 0
T2 Low voltage (400V) demand of less than 500 kVA per month, consumption of more than 7,500 kWh
14,223 205 15,504
T3 MV Medium-voltage supply at 11/33 kV, demand of more than 500 kVA per month, consumption in kWh
16,769 163 13,200
T3 HV High-voltage supply at 132/220 kV, demand in kVA per month, consumption in kWh
0 159 16,550
Source: TANESCO Marketing Department (2016).
Note: Tariffs were in effect between 2015 and 2016.

WRI.org 62
not been fully recovering its O&M costs. It appears that the panterritorial tariffs it charges are not cost-reflective and contribute to the utility’s poor financial performance, including its inability to meet obligations to SPPs. O&M costs of rural networks borne by TANESCO are high. The problem is that there is no transparent mechanism by which the distribution network operator can establish the costs of operating the rural networks, because most rural customers are highly subsidized. Establishment of a subsidiary company under separate management, with cost and revenue accounting, could help establish the level of subsidies required to operate and maintain rural networks sustainably (the Rift Valley Energy Company has already opted to establish a subsidiary company that will deal with rural customers served directly by the mini-grid, as noted above).
Faith-Based ModelFaith-based mini-grids are owned by organizations such as churches, which usually highly subsidize their tariffs. They own at least 29 mini-grids in Tanzania (all hydro). They provide electricity for themselves and sell the excess at highly subsidized prices (nearly free) to villagers. Customers are not metered, and they do not pay for service line connections. Plants and distribution networks are built using grants from overseas donors. Most of the plants are unmanned; they are visited regularly by technicians from the organization, who take readings and provide maintenance.
The subsidized retail tariffs of faith-based models present challenges for providers that charge cost-reflective tariffs. During the early 1990s, TANESCO completed an 840 kW hydro mini-grid at Uwemba, where a 200 kW hydro mini-grid was already in existence (owned and operated by the Roman Catholic Diocese of Njombe). Faced with this competition, TANESCO could not connect new customers in the village until it waived connection charges (T Sh 177,000 in rural areas) and introduced a lifeline tariff.
Subsidized electricity can play a critical role in supporting economic activity. Increased economic activity can build and sustain the demand and rural incomes needed to support financially self-sufficient business models.
Cooperative Model A cooperative is a business or organization owned by and operated for the benefit of the people using its services. Rural members who pay membership fees typically receive an ownership share in the cooperative.
The cooperative model was used in the 1990s by four rural diesel mini-grids, in Urambo, Mbinga, Kasulu, and Kibondo. Each cooperative was run by an elected committee with a fixed term; the committees had a few employees, who operated and maintained the network, collected revenue, and connected new customers. Customers paid for membership, owned shares, and met the cost of service connections. Proposed tariffs were discussed and approved at annual meetings. Customers paid upfront; those who failed to pay were disconnected.
The Urambo cooperative was the only one to operate commercially for several years, charging relatively high tariffs (Gullbeg et al. 1999; Ilskog et al. 2005). At first, customers were not metered based on their usage; load limiters were installed at their premises, which served as the basis for the customer’s energy bills. This type of service delivery proved inefficient, because consumers had no incentive to undertake demand-side management. Load limiters were subsequently replaced by energy credit meters, and customers paid upfront at the beginning of the month for electricity to be consumed during the month. Costs were reconciled at the end of the month based on recorded meter readings. This payment model was maintained, and the cooperative performed well financially, able to pay for staff salaries and major and minor plant repairs and connect more customers.
Before the SPP framework came into effect, in 2008, Urambo was connected to the national grid, and the Mbinga, Kasulu, and Kibondo cooperatives were connected to mini-grids operated by TANESCO. Beginning in 2000, the four cooperatives were dissolved, replaced with the utility business model. The main factors that appear to have hindered their operation as cooperatives include a lack of innovative legal and regulatory mechanisms at the time, which may have shielded them from some of the costs (e.g., high fuel taxes); the lack of a regulatory body at the time to assist them; and cost-reflective tariffs charged
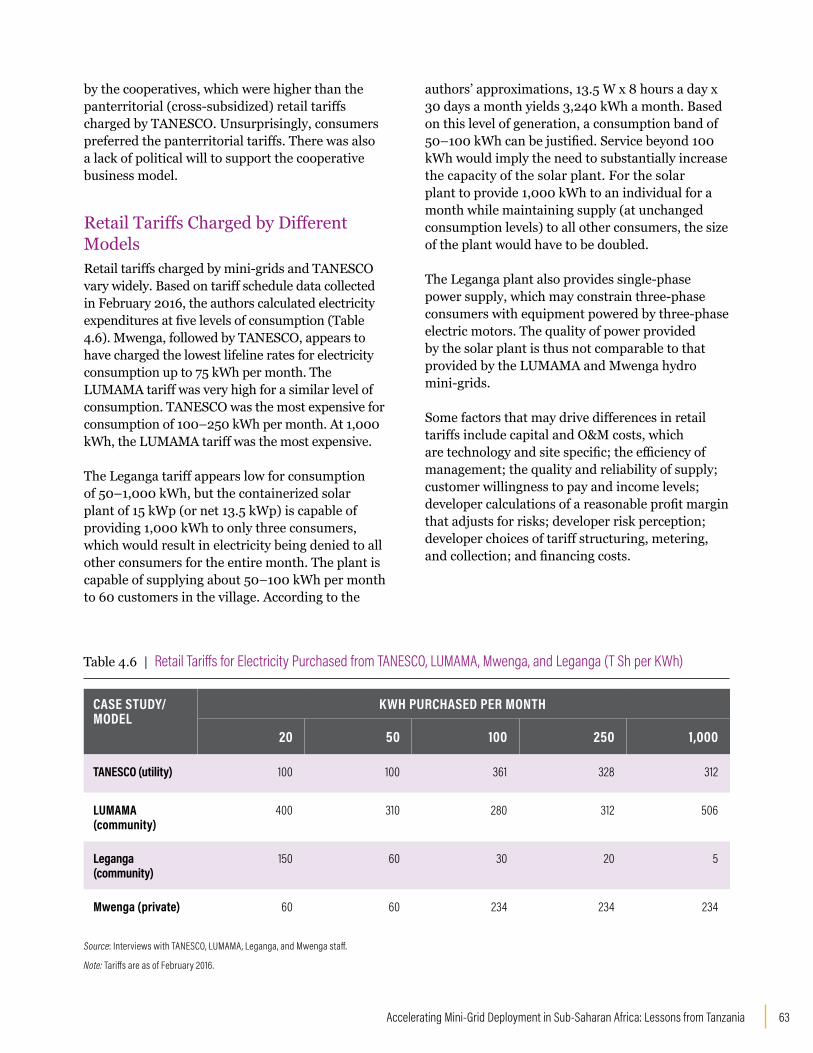
63Accelerating Mini-Grid Deployment in Sub-Saharan Africa: Lessons from Tanzania
by the cooperatives, which were higher than the panterritorial (cross-subsidized) retail tariffs charged by TANESCO. Unsurprisingly, consumers preferred the panterritorial tariffs. There was also a lack of political will to support the cooperative business model.
Retail Tariffs Charged by Different ModelsRetail tariffs charged by mini-grids and TANESCO vary widely. Based on tariff schedule data collected in February 2016, the authors calculated electricity expenditures at five levels of consumption (Table 4.6). Mwenga, followed by TANESCO, appears to have charged the lowest lifeline rates for electricity consumption up to 75 kWh per month. The LUMAMA tariff was very high for a similar level of consumption. TANESCO was the most expensive for consumption of 100–250 kWh per month. At 1,000 kWh, the LUMAMA tariff was the most expensive.
The Leganga tariff appears low for consumption of 50–1,000 kWh, but the containerized solar plant of 15 kWp (or net 13.5 kWp) is capable of providing 1,000 kWh to only three consumers, which would result in electricity being denied to all other consumers for the entire month. The plant is capable of supplying about 50–100 kWh per month to 60 customers in the village. According to the
authors’ approximations, 13.5 W x 8 hours a day x 30 days a month yields 3,240 kWh a month. Based on this level of generation, a consumption band of 50–100 kWh can be justified. Service beyond 100 kWh would imply the need to substantially increase the capacity of the solar plant. For the solar plant to provide 1,000 kWh to an individual for a month while maintaining supply (at unchanged consumption levels) to all other consumers, the size of the plant would have to be doubled.
The Leganga plant also provides single-phase power supply, which may constrain three-phase consumers with equipment powered by three-phase electric motors. The quality of power provided by the solar plant is thus not comparable to that provided by the LUMAMA and Mwenga hydro mini-grids.
Some factors that may drive differences in retail tariffs include capital and O&M costs, which are technology and site specific; the efficiency of management; the quality and reliability of supply; customer willingness to pay and income levels; developer calculations of a reasonable profit margin that adjusts for risks; developer risk perception; developer choices of tariff structuring, metering, and collection; and financing costs.
Table 4.6 | Retail Tariffs for Electricity Purchased from TANESCO, LUMAMA, Mwenga, and Leganga (T Sh per KWh)
CASE STUDY/MODEL
KWH PURCHASED PER MONTH
20 50 100 250 1,000
TANESCO (utility) 100 100 361 328 312
LUMAMA (community)
400 310 280 312 506
Leganga (community)
150 60 30 20 5
Mwenga (private) 60 60 234 234 234
Source: Interviews with TANESCO, LUMAMA, Leganga, and Mwenga staff.
Note: Tariffs are as of February 2016.

WRI.org 64

65Accelerating Mini-Grid Deployment in Sub-Saharan Africa: Lessons from Tanzania
CHAPTER 5
PLANNING AND SECURING FINANCING FOR MINI-GRID PROJECTSPublic and private sector funding for rural electrification
remains inadequate, but financial mechanisms have stimulated
investor activity and led to further commitments of funds from
development partners.

WRI.org 66
The Planning ProcessMini-grids often represent the only realistic means of providing electricity to villages that are not likely to be connected to the grid. They provide more power than solar home systems, which may provide little more than lighting and mobile phone charging (tier 1 and 2 level access). Mini-grids have sometimes been used to develop demand (pre-electrification) in remote areas, because they have the potential to offer higher tiers of energy access. When demand grows large enough, extension of the grid can be justified. During the 1960s, grid supply was limited to Tanga–Dar es Salaam. Today, about three-quarters of the Tanzania’s regional towns are connected to the national grid.24
The sources of financing also influence the siting of mini-grid projects. The government and donors are very influential in decisions to develop mini-grids rather than subtransmission systems. They have an interest in pilot or demonstration projects that test and disseminate new and renewable technologies or scale up commercially viable technologies. Such influence may be used to promote products and services supplied by the sponsors. For example, Leganga village is located only 4 kilometers from the Kongwa–Kiteto medium-voltage (MV) line. Subtransmission would appear to be a better option for the village. Lack of coordination among the parties—the Ministry of Energy and Minerals, the Rural Energy Agency (REA), and the donor/developer—and interest on the part of the donor contributed to the decision to develop a solar mini-grid rather than construct a subtransmission line from the national grid.
Environmental impact is not a major factor in mini-grid development. Environmental Impact Assessments of all electricity generation projects must be approved by the Ministry of Environment and the National Environment Management Council before the projects can be built; no projects have been rejected because of environmental aspects, in part because of the small scale of rural mini-grids.
To enhance national and regional-level planning efforts, the National Electrification Program Prospectus (2013–22, see Appendix C) was developed as a strategy document to inform and guide the government, the Ministry of Energy and Minerals, the REA, TANESCO, and development
▪ Financial support to small power providers (SPPs) through the Tanzania Energy Development and Access Project (TEDAP) and the Rural Energy Fund (REF) (matching grants, performance grants, TEDAP credit line through commercial banks) has financed the completion or initiation of 17 mini-grid projects in Tanzania since 2008. Using financing facilities outside the SPP framework, donors have funded another 35 mini-grids.
▪ Public and private sector funding for rural electrification remains inadequate, but financial mechanisms have stimulated investor activity and led to further commitments of funds from development partners.
▪ Planning for a new mini-grid project involves multiple institutions and multiple steps to obtain clearance for project development.
▪ Coordination among stakeholders and local capacity are often lacking, leading to delays and overreliance on imported equipment and expertise.
KEY TAKEAWAYS

67Accelerating Mini-Grid Deployment in Sub-Saharan Africa: Lessons from Tanzania
partners on least-cost electrification development options in Tanzania. The report recommends preparation of a rural electrification master plan as a follow-up measure. In October 2016, the consulting firm Multiconsult was selected through competitive bidding to prepare the five-year master plan.
Planning and building a mini-grid involves various institutions, including the Tanzania Investment Centre, the Ministry of Energy and Minerals, the REA, TANESCO, the National Environment Management Council, regional water basin offices, and local governments (Table 5.1). Lack of coordination among these institutions slows project implementation. Establishing a one-stop center where developers could access all the services provided by these institutions would be of value.
The major steps in planning and development small power producer projects involve:
▪ identifying a project
▪ resolving land and resource issues
▪ obtaining various consents and licenses
▪ financing
▪ construction
▪ testing and commissioning
▪ operating
▪ monitoring and reporting.
Consents include the following:
▪ land titles and leases
▪ resource rights (e.g., water rights)
▪ letters of intent from TANESCO
▪ business license tax registration
▪ building permits
▪ environmental and social clearances
▪ standardized power purchase agreements (SPPAs) with the distribution network operator and approval by the regulator
▪ generation, transmission, distribution, and supply licenses.
Planning and building a mini-grid involves various
institutions, including the Tanzania Investment
Centre, the Ministry of Energy and Minerals,
the REA, TANESCO, the National Environment Management Council, regional water basin
offices, and local governments.

WRI.org 68
Table 5.1 | Steps and Clearances in Developing a Mini-Grid Project in Tanzania
ACTIVITY APPROVALS/RESPONSIBILE AGENCY
Registration with the Tanzania Investment Centre (TIC)
▪ Investment facilitation
▪ Tax registration
▪ Land issues
▪ Business licensing and registration
▪ Immigration issues (for foreigners)
▪ Labor issues
▪ Follow-up services after registration with TIC
Project identification and promotion Project concept note developed and submitted to TIC, the Ministry of Energy and Minerals, the Rural Energy Agency, EWURA, and TANESCO
Land clearances Land lease or right of occupancy certificate from village/local government
Water issues Water rights from regional Water Basin Office (for hydro plants)
Letter of intent from TANESCOa TANESCO provides decision within 30 days of submission
Business license and tax registration Issued by Tanzania Revenue Authority
Initial studies (required within 12–24 months of letter of intent)
Feasibility study, including risk assessment and draft implementation plan, to confirm project’s techni-cal, economic, financial, environmental, and social soundness
Environmental clearance(required within 12–24 months of letter of intent)
Environmental and social impact assessment:
▪ Scoping report and terms of reference for full Environmental and Social Impact Assessment (ESIA) study submitted to National Environment Management Council (NEMC)
▪ ESIA study to be approved by Minister of Environment and NEMC
▪ Environmental Management Plan submitted before construction
▪ Environmental Management System for monitoring plant operation and impact
▪ Environmental clearance issued by NEMC
Building permit Issued by district or municipal council
25-year Small Power Purchase Agreement (SPPA) signed with distribution network operator
Requires developer to complete plant within 36 months, with possible one-year extension
Plant construction By developer
Electricity license from EWURA License covers electricity generation, transmission, distribution, and supply
Plant commission By EWURA
Source: Interviews with staff of TANESCO, EWURA, and the Rural Energy Agency.
Note: a. The letter of intent should indicate the investor’s name and address, the location of the planned SPP, the fuel type to be used, the size of the plant, its planned export capacity, and annual generation. Land rights (title deed or lease) and resource rights must be attached.

69Accelerating Mini-Grid Deployment in Sub-Saharan Africa: Lessons from Tanzania
Under the framework, project developers whose letters of intent receive approval from TANESCO are given 12 months to conduct initial project studies (e.g., feasibility studies, Environmental and Social Impact Assessment, Environmental Management Plan, Environmental Management System). When the studies are completed, the sponsors/developers sign an SPPA with TANESCO and obtain approval from EWURA. They are then given three years to construct and commission the plant. (For a listing of all projects commissioned, under construction, or planned, see Appendix B.)
Success Factors and ChallengesSeventeen projects have been commissioned or are under construction under the SPP framework. Some key success factors and challenges are described below.
Success Factors Most mini-grid projects are in rural areas, where it is important to include local stakeholders. District, ward, and village authorities and consumers should be fully involved in the decision-making process at all stages of project implementation. Local priorities—including affordable electricity, health and education services, access to water, added value for productive activities, and job and income generation—should be taken into consideration. Participation is necessary to win good will, buy-in, and full support for the project.
The planning and implementation process should clearly define the roles and responsibilities of all stakeholders. Communities should understand the benefits of mini-grid projects for the village as well as for individual households. Village ownership of the project is an important element in building long-term sustainability. Experience indicates that villagers need to be guided during project implementation in a way that allows them to acquire significant shares in the project, so that project revenues remain in the community, where they can contribute to poverty-reduction efforts.
ChallengesThe complexity of developing hydro, biomass, solar, wind, and hybrid mini-grids often means that projects rely on foreign equipment and experience. Planning and project development, from construction to commissioning, require expertise, equipment, and experience that are often not available locally. Project implementation requires consultants, contractors, and suppliers who are well established and have both the resources and the experience to bring projects to completion.
Lack of coordination among government institutions, as well as with donors, is one of the major obstacles to smooth planning of renewable energy mini-grids. Coordination at the village, district, and national level is essential when undertaking site identification and clearance, acquiring sites, conducting studies, prioritizing projects for implementation, and optimally allocating resources. In particular, procedures and regulations for site acquisition, studies, and authorization need to be improved. A helpful move would be to establish a central database for initiatives undertaken by mini-grid developers that describes the projects’ status.
Another obstacle to scaling up renewable energy mini-grids is the excessively long list of required steps and clearances in the planning and implementation process, some of which involve lengthy regulatory processes. For instance, after they submitted their Environmental and Social Impact Assessment reports for their projects at Mwenga and Malolo, it took the Rift Valley Energy and Husk Power Systems 10 months to obtain environmental clearance.
Costs of Mini-Grid Development Table 5.2 illustrates the costs of components of a distribution network, based on national standards for electrification projects.

WRI.org 70
Table 5.3 provides a hypothetical example of the costs associated with implementing a 2 MW hydro mini-grid. The number of customers a mini-grid can serve depends on the type of customer (residential, commercial, TANESCO). For example,
assuming 200 kW x 0.8 power factor x 0.4 load factor x 24 hours a day, a plant would generate 16,360 kWh a day. If average consumption were 50 kWh per month, the plant could serve up to 9,216 customers.
Table 5.2 | Costs of Components Needed to Install Mini-Grid Distribution Network in Tanzania, 2014 (U.S. dollars)
COMPONENT UNIT PRICE CIFa INSTALLATION COSTb TOTAL COST
33 kV line (per kilometer) 14,300 2,000 16,300
25 kVA transformer 8,100 138 8,340
50 kVA transformer 8,700 153 8,880
100 kVA transformer 11,900 185 12,100
200 kVA transformer 15,600 231 15,800
315 kVA transformer 18,500 346 18,900
0.4 kV line (ABC) (per kilometer) 10,900 2,240 13,200
0.2 kV line (ABC) (per kilometer) 6,000 1,960 8,030
3-phase service line +prepaid meter (30 meters) 520 17 538
1-phase service line + prepaid meter (30 meters) 195 14 209
Source: Authors, based on selected Rural Energy Agency projects.
Note: a. Cost, insurance, and freight at port of entry at Dar es Salaam.b. Includes in-country transport costs, which differ across the country. Figures are compiled from installation costs of several projects in one region of Tanzania.
Table 5.3 | Estimated Equipment Costs of Installing Hypothetical Hydro Mini-Grid in Tanzania
COMPONENT QUANTITY COMPONENT QUANTITY CIFa (US DOLLARS)
SUBTOTAL COST (US DOLLARS)
Hydro plant (MW) 2 2,200,000 4,400,000
Medium-voltage lines (kilometers) 4 16,300 65,200
Low-voltage lines (kilometers) 6 13,200 79,200
50 kVA transformers 4 8,880 35,520
Total 4,579,920
Source: Authors, based on selected Rural Energy Agency projects. a. Cost, insurance, and freight at port of entry at Dar es Salaam.

71Accelerating Mini-Grid Deployment in Sub-Saharan Africa: Lessons from Tanzania
Sources of Financing Contributions from many stakeholders are required to raise sufficient funds for electrification. The government established the Rural Energy Fund (REF) via the Rural Energy Act 2005 to provide grants to qualified project developers for project capital costs and technical assistance and to co-finance pilot projects.25 During 2007/08–2013/14, the fund raised T Sh 387.7 billion ($255 million), or an average of $36.4 million a year (Table 5.4 and Figure 5.1).26 Government funding (in the form of budget allocation and the electricity levy) accounted for approximately 70 percent of REF revenue over this period.
Most of the fund is used to finance subtransmission projects, which can connect more people at lower cost per customer. The REF also supports mini-grids in communities that would otherwise wait years for grid extension. The funds appear inadequate for a country with electrification levels as low as they are in Tanzania, however. The Ministry of Energy and Minerals notes that public and development partner funds are not sufficient to allow Tanzania to meet its social and economic goals under the Tanzania Development Vision 2025 (Ministry of Energy and Minerals 2014). The government has committed to power sector reforms in part to attract more private capital.
Table 5.4 | Sources of Funding of the Rural Energy Fund, 2007–14 (millions of T Sh, except where otherwise indicated)
SOURCE 2007/08 2008/09 2009/10 2010/11 2011/12 2012/13 2013/14 2007–14
Government budgetary allocation 11,600 12,100 22,100 14,700 56,500 43,800 40,800 201,500
Interest on investment 35 500 722 1370 3,400 7,350 4,480 17,900
Contribution by the Swedish International Development Cooperation Agency (SIDA
7,040 16,400 22,700 46,100
Contribution by the government of Norway 26,200 26,200
Electricity levy 8,300 14,600 11,000 28,600 5,950 68,500
Predestination inspection fee 5,431.5 19,076.6 2,934.6 27,442.7
Total 11,600 12,600 31,200 37,700 92,800 121,500 80,300 388,000
Total in millions of dollars 10.1 9.6 23.3 25.5 58.9 76.8 50.8 255
Source: REA (2013).
Note: Contributions from development partners represent only direct, disbursed funding to the Rural Energy Fund. Figures exclude grants from foundations, charities, and faith-based organizations that were provided directly to mini-grid developers.

WRI.org 72
Funding under the Small Power Producers Framework Commercial sources often consider financing rural electrification to be risky, because of a variety of factors, including unproven technology, lack of familiarity with the technology, and the low and variable incomes of many rural consumers. Energy access companies that have raised significant finance are typically foreign owned or managed and have the connections and resources to raise capital on the global market (Sanyal et al. 2016). Banks are often unwilling to lend to developers that cannot provide a strong track record of capacity, collateral, and other commercial requirements for rural electrification projects.
There are also structural weaknesses in the financial model of mini-grids, which tend to have high project and connection costs and low consumption per customer, making delivered energy costs high. Not all customers can afford the connection charges or ongoing payments, which can hamper project initiation and constrain the very development that would support and enable financially self-sustaining mini-grids. In light of these challenges, some community-owned mini-grids have experienced difficulties with revenue collection.
Figure 5.1 | Sources of Funding of the Rural Energy Fund
Source: See Table 5.4. Note: Percentages are based on funding for 2007-2014.
52%
7%
18%
7%
12%
5%
Predestination Inspection Fee
ElectricityLevy
Norway Contribution to REF
SIDA Contribution to REF
Interest on Investment
Government Budgetary Allocation
Total = T Sh 387.7 billion ($255 million)

73Accelerating Mini-Grid Deployment in Sub-Saharan Africa: Lessons from Tanzania
It is difficult for project sponsors/developers to establish the economic and financial viability of relatively small projects and to establish adequate collateral to obtain private funding. It can also be difficult to quantify intangible benefits, which might help attract complementary public funding. To date, there is still not much of a track record for obtaining commercial loans. Financing is still a major barrier to accelerating the development of mini-grids.
To address this barrier, the government of Tanzania, via the World Bank–funded Tanzania Energy Development and Access Project (TEDAP), developed financing arrangements in which some of the sources of funding listed in Table 5.4 were
used to assist project sponsors/developers through performance and matching grants and credit line facilities. The funds were coordinated, managed, and promoted by the REA, backed by various stakeholders, including EWURA.
These financial mechanisms, in conjunction with changes in regulation and falling costs for some mini-grid technologies, contributed to a surge of activity. Tables 5.5 and 5.6 describe the 17 projects that have been funded with financing support managed by the REA. Box 5.1 describes some of the funded projects.
The 109 mini-grids addressed in this study were financed in a variety of ways. Seventeen diesel and two natural gas mini-grids owned by TANESCO were funded by a government grant and low-interest loans from bilateral and multilateral institutions. Twenty-nine of 49 hydro mini-grids that are owned and operated by faith-based organizations in Southern Highlands, Ruvuma, and Mtwara regions were financed by grants from Europe. Ten of 13 solar mini-grids in the Dodoma, Katavi, and Tabora, regions received 100 percent grants from the Tanzanian government, which received a soft loan from the Austrian government. The other three mini-
grids, located in Arusha, Coast, and Tanga, received funding from other sources. Sixteen Multi-Functional Platform straight vegetable oil/diesel mini-grids constructed by TaTEDO obtained grants from the European Union and Hivos.
Other hydro mini-grids were funded by the Tanzanian government, the REA, private institutions, and development partners. Examples include the following:
▪ Mwenga Hydro, an affiliate of the Rift Valley Energy Company, obtained a performance grant from the Euro-pean Union and TEDAP that covered 48 percent of the plant; a loan
financed 27 percent and equity the remaining 25 percent. The loan has a maturity of 10 years, with two years’ grace period, and an interest rate of 13 percent; the interest rate during the grace period is capitalized, and the loan is to be repaid in constant annual amounts.
▪ LUMAMA obtained funding through a performance grant from the REA, the European Union and the government of Italy, and others donors, including the Diocese of the Njombe Roman Catholic Church.
▪ The Kinko pico-hydro minigrid obtained a grant from the United Nations Industrial Development Organization (UNIDO).
BOX 5.1 | FUNDING SOURCES OF MINI-GRIDS OPERATING IN TANZANIA

WRI.org 74
Matching GrantsMatching grants of up to $100,000 per project are available to sponsors/developers for undertaking initial project studies (feasibility and environmental studies as well as business plans). Between 2007 and June 2016, the REA issued more than $3.1 million in matching grants to 37 mini-grid developers, according to the agency. This funding
supported the development of more than 94 MW of installed mini-grid capacity and more than 52,500 customer connections. The program has led to five completed projects, including Yovi in Kilosa (0.9 MW) and Tulila in Songea (7.5 MW). Most of the remaining grantees have completed feasibility studies and are seeking investment.
Table 5.5 | Financing Sources of Completed Mini-Grid Projects in Tanzania under the Small Power Producers Framework
PROJECT ENERGY SOURCE INSTALLED CAPACITY (MW) CONNECTION SOURCE OF FUNDING
Andoya-AHECO Mbinga Hydro 1.0 Off grid ▪ World Bank via Rural Energy Agency (REA)
Ikondo Njombe Hydro 0.4 Grid
LUMAMA-Mawengi Hydro 0.3 Off grid ▪ Government of Italy
▪ European Union
▪ Intervita
▪ World Bank via REA
Maguta power project-Kilolo
Hydro 2.5 Grid ▪ World Bank via REA
Mwenga-Mufindi Hydro 4.0 Grid ▪ African-Caribbean-Pacific (ACP)-European Union
▪ REA
▪ Rift Valley Energy Company
▪ World Bank via REA
Ngombeni-Mafia Island Biomass 1.5 Off grid ▪ Department for International Development (DfID)
▪ World Bank via REA
TANWAT-Njombe Biomass 2.5 Grid ▪ Commonwealth Development Corporation/Department for International Development (DfID)
▪ World Bank
TPC-Moshi Biomass 17.5 (of which 9 exported)
Grid ▪ DANIDA
▪ World Bank
Tulila St. Agnes Chipole Songea
Hydro 7.5 Off grid ▪ World Bank via REA
Yovi Hydro-Kilosa Hydro 0.9 Grid ▪ European Union
Source: Interviews with Rural Energy Agency and TANESCO staff conducted between February and May 2016.

75Accelerating Mini-Grid Deployment in Sub-Saharan Africa: Lessons from Tanzania
Performance GrantsPerformance grants of $500 for each end-use connection are available to sponsors/developers. Between 2007 and June 2016, the REA provided performance grants to seven projects: Mwenga, in Mufindi (4 MW); Madege/Maguta, in Kilolo (2.4 MW); Mbagamao (Andoya), in Mbinga (1 MW); Isigula, in Ludewa (0.407 MW); Lupali, in Njombe (0.317 MW) ; LUMAMA, in Mawengi (0.3 MW); and Ikondo-Matembwe, in Njombe (0.08 MW). The projects at Andoya, Ikondo-Matembwe, Mwenga, and LUMAMA were completed and had connected 3,276 customers as of June 2016. In total these performance grants amounted to about $5.4 million.
Credit Line FacilitiesThe World Bank established a $23 million credit line in 2011 for long-term loans (up to 15 years) to the Tanzania Investment Bank, the country’s government-owned development bank (now known as TIB Development Bank), to be disbursed by local commercial banks. This type of on-lending
arrangement can help build the capacity of local commercial banks and increase their familiarity and comfort with financing renewable energy projects. This arrangement enabled project loans to Andoya, Mwenga, and Ngombeni of $5.43 million for construction. These projects have been completed. The REA also provided capacity building to local financial institutions participating in the credit line facility.
The Swedish International Development Agency (SIDA) and the U.K. Department for International Development (DfID) have committed financial support to the REF for implementation of the Sustainable Energy for All (SE4ALL) action agenda. SIDA committed about $12 million and DfID about $39 million for green mini-grids in Tanzania.27 The funding seeks to provide electricity access for at least 700,000 people (140,000 households), including 400,000 people (80,000 households) that will be reached through green mini- and micro-grids. The two institutions will also increase private sector investments in renewable off-grid systems and mini-grids. Of the Swedish funding,
Table 5.6 | Financing Sources of Mini-Grid Projects under Construction in Tanzania under the Small Power Producers Framework
PROJECT INSTALLED CAPACITY (MW) SOURCE OF FUNDING
Darakuta-Manyara 0.24 World Bank via the REA
EA Power Ltd-Tukuyu 10.0 World Bank via the REA
Ilungu ward project, Mbeya 5.0 —
Luswisi project-Ileje, Mbeya 4.7 World Bank via the REA
Mapembasi-Njombe 10.0 World Bank via the REA
Ninga-Njombe 4.0 European Union
Nkwilo-Sumbawanga 2.9 World Bank via the REA
Total capacity 32.84
Sources: Interviews with Rural Energy Agency and TANESCO staff conducted between February and May 2016.
Note: All projects are hydro. All projects except the Nkwilo-Sumbawanga are on grid. — Not available.

WRI.org 76
$10 million will be used primarily for on-grid electrification; the remaining $2 million and the $39 million from the United Kingdom will support private sector–led renewable energy investments (SIDA/DfID 2015). The distribution of these funds to off-grid investments will be under a results-based financing facility, which will consider the number of connections and the quality of service in distributing grants (REA 2016).
The World Bank has committed to support a $200 million renewable energy and rural electrification project for conventional grid extension and provide $75 million for mini-grid projects, the SPP credit line, and a risk mitigation facility.
Funding outside the Small Power Producers FrameworkOf the 52 mini-grids constructed since 2008, 35 did not receive financing through TEDAP or the REF. These projects are funded by donors. Examples include two gasifier mini-grids, one being constructed by the Sustainable Energy Services Company (SESCOM) in Kibindu village, through a grant from the U.S. African Development Fund (USADF) Power Africa Program, and another, being constructed by TaTEDO, ONGAWA, and Husk Power, in Biro village, through a grant from the Environmental and Energy Program, supported by the Finnish government.
Shortcomings of the Small Power Producer Funding SystemA number of challenges have been experienced in the course of implementing some of the new financing mechanisms for mini-grids in Tanzania. For example, some of the matching grants provided to potential project developers for initial studies were not used for the intended purposes, underscoring the need for stronger monitoring and evaluation (M&E).
In addition to M&E for grant use, there is also a need for M&E of product quality. Global experience establishes that M&E is a necessary
component for market development. Substandard and poor-quality products create risks of market spoilage and widespread mistrust in renewable technologies.
M&E is more feasible in some contexts than in others. In Bangladesh, for example, the country’s dense population, the smaller geographic span of the market, and the existence of a central institution (the Infrastructure Development Company Limited [IDCOL]) with the authority and resources to tie financing to product standards have contributed to the success of its M&E of a solar home system program (World Bank 2015).28 M&E may be much more challenging in Tanzania, given its large geographic area and dispersed population centers. Nonetheless, funding to support M&E will be necessary for market growth.
A number of developers that submitted feasibility studies and business plans to commercial banks were unsuccessful in obtaining credit. Most of those that succeeded were foreign developers. Some of the reasons cited by commercial banks for failure to grant financing included the limited funds available and the poor quality of the submitted documentation. Part of the problem may be inadequate experience on the part of some Tanzanian developers. Proper documentation and submission of requests to various financing institutions in acceptable formats are critical to obtaining funds. It may be necessary to devote more resources to building the capacity of local developers and institutions to do so.
Bank financing is likely to remain limited without financial risk guarantees. Potential developers and financial institutions are often unaware of the favorable regulatory framework for renewable energy mini-grids and the new financing arrangements that are available to them.

77Accelerating Mini-Grid Deployment in Sub-Saharan Africa: Lessons from Tanzania
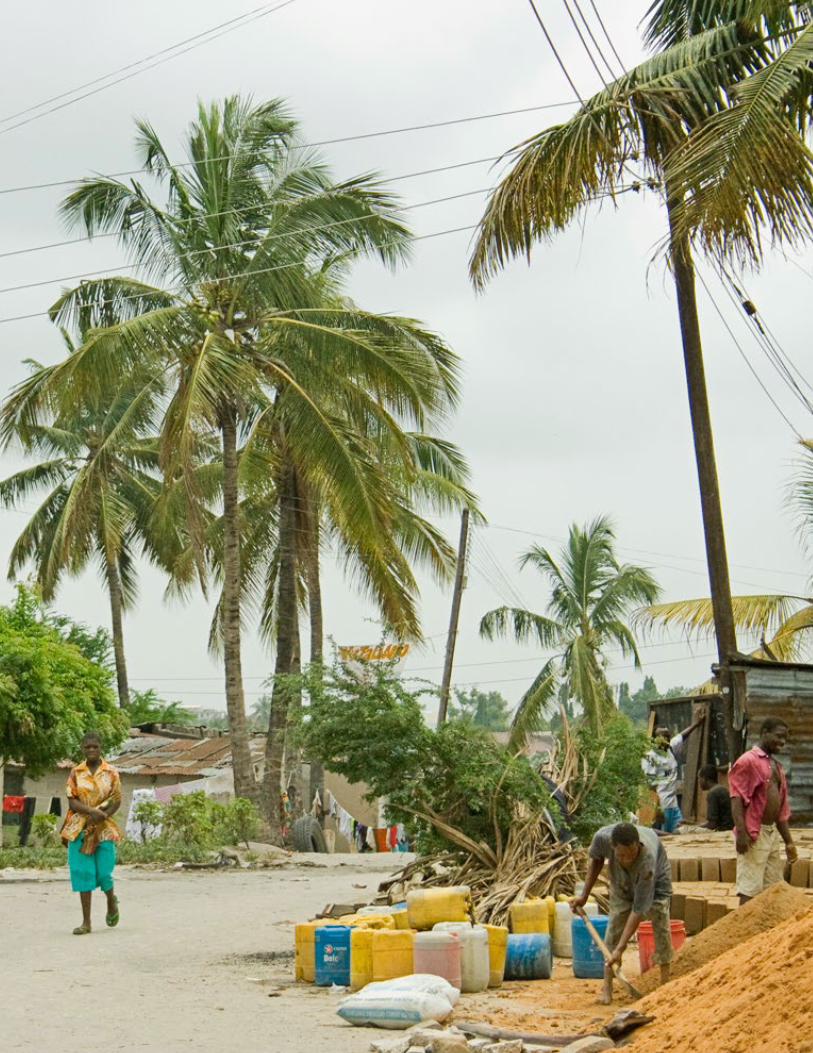
WRI.org 78
Photo FPO

79Accelerating Mini-Grid Deployment in Sub-Saharan Africa: Lessons from Tanzania
CHAPTER 6
HOW ARE MINI-GRIDS CONTRIBUTING TO RURAL DEVELOPMENT?Tanzania has established national goals in the context of the United
Nations’ Sustainable Energy for All (SE4ALL) initiative (URT 2015c).
These goals include increasing the share of the population with
electricity access to more than 75 percent and increasing the share
of renewable energy in total final energy consumption, including off-
grid generation, to more than 50 percent by 2030.29

WRI.org 80
Electrification is a critical component in the basic infrastructure that permits people to improve their quality of life. The site visits conducted for this report indicated that access to energy services has a huge influence on the lives of rural people. This brief assessment of some of the links between mini-grids and rural development draws on the experiences of villagers in LUMAMA and Mwenga, as well as relevant studies. It provides insights into the ways in which even small amounts of electric power promote local businesses, improve public services, and drive development.
Effect on Local Industries and Other Productive ActivitiesIn Mawengi village, electric lighting made possible by the LUMAMA plant extended working hours for barbers, butchers, and restaurant operators. These businesses increased the number of their customers and raised revenues; some of them expanded their businesses and others employed more staff. Improved lighting also encouraged new restaurants and other businesses to open.
New enterprises that were started with support from the Italian NGO ACRA-CCS included sunflower oil pressing, mechanical workshops, poultry farming, and fruit processing (Ahlborg 2015). Before electrification, villagers used to export sunflower seeds and import sunflower oil. Following electrification, they pressed their own sunflowers. The cake, a sunflower oil press byproduct, is a good animal feedstock. Its production improved animal husbandry.
Electricity supply also facilitated access to mobile phones, radios, TV, and the Internet. Access to modern communication has enabled farmers and rural businesses to receive accurate and current market prices. A study from Rungwe, Tanzania finds that people who used information and communications technology to access market information sold more produce and received higher prices (Mwakaje 2010).
Effect on Social and Public ServicesVillagers in LUMAMA and Mwenga reported that the quality of social services improved following electrification. Retention rates of medical staff and teachers in their villages rose, and health centers
were able to use electricity-consuming equipment like refrigerators and microscopes. Health centers confirm that lighting improved. According to villagers, better health services helped reduce child and maternal mortality and disease. Better lighting in schools facilitated increased study hours. Basic computer lessons can now be taught. Villagers report that electricity access facilitated improvements in literacy rates, performance on national examinations, gender equality, and women’s empowerment.
Effect on Sustained Demand for ElectricityIn LUMAMA, the NGO ACRA-CCS has assisted villagers establish income-generating activities that support the development of small and medium-size enterprises, which increases demand for electricity. Activities include tree-planting, dairy cattle farming, and sunflower cultivation. Financing for electricity access and equipment from savings and credit cooperative societies (SACCOs) and village community banks contributed to the expansion of grain mills and oil press mills and made the use of carpentry equipment possible.
Effect on the Long-Term Sustainability of Mini-Grid Services Water catchment protection and environment conservation are highly important for hydro mini-grids. Awareness campaigns have been conducted in LUMAMA villages to prevent bush fires and poor cultivation practices that result in silting of the hydro intake facilities and reduced river flows during the dry seasons. Villages that do not observe the agreed bylaws are denied electricity during the low-flow season.
Mini-grids in LUMAMA and Mwenga have good management and well-trained and committed staff that make sure the plants are in good operating condition and that there is an ample stock of spare parts at all time. Their operating models sustain efficient revenue collection. Environmental protection, good plant management, and efficient revenue collection are all necessary elements in promoting the long-term sustainability of mini-grid services and hence sustained long-term rural development.

81Accelerating Mini-Grid Deployment in Sub-Saharan Africa: Lessons from Tanzania

WRI.org 82

83Accelerating Mini-Grid Deployment in Sub-Saharan Africa: Lessons from Tanzania
CHAPTER 7
CONCLUSIONS AND RECOMMENDATIONSTanzania has at least 109 mini-grids, which serve about 184,000
customers in 21 regions.30 Nearly half of them were developed after
2008, when regulations and rules supporting small renewable
power project development came into effect.

WRI.org 84
This report reveals several findings about these mini-grids:
▪ Ninety-three percent of customers are served by 19 large fossil fuel mini-grids owned and operated by TANESCO, Tanzania’s parastatal electric utility. These mini-grids produce 46 percent of the 157.7 MW of total installed mini-grid capacity.
▪ Initial investment costs represent a hurdle for developers. Despite challenges maintaining plants and obtaining spare parts in remote areas, diesel mini-grids are an attractive choice, because of their relatively low capital costs, ability to generate power at any time, and well-understood technology
▪ No wind projects have been developed in Tanzania, and solar mini-grids are still at the demonstration stage. It will be important to assess whether the changes made in the second-generation small power producer (SPP) framework encourage renewable energy developers.31
▪ A diverse set of actors owns and operates mini-grids, but with the exception of hydro, technologies tend to be dominated by particular ownership models. Almost all biomass and hybrid mini-grids are privately owned, for example, and most solar mini-grids are community owned.
▪ Mini-grid providers use a variety of payment and metering systems. Prepayment models tend to be more effective at recovering revenue from retail customers.
▪ Many mini-grids appear to have operated well over many years. The operational models with the longest track record are the hydro mini-grids built mainly by faith-based organizations, the larger biomass plants built by commercial companies, and the fossil fuel plants owned by TANESCO. Newer operational models, such as community-based ownership and financially self-sustaining private ownership, appear to still be developing appropriate management, pricing, and payment structures.
▪ Revenue collection remains problematic, although new remote monitoring and payment technologies offer potential solutions. Cost-reflective tariffs, efficient metering, and revenue collection are key to sustainability.
▪ Integrated grid/off-grid planning will be critical to harness the benefits that both the grid and mini-grids can provide.
▪ The SPP framework appears to have encouraged mini-grid development to some extent. Most mini-grids developed since 2008 were biomass. Seventeen of the 52 mini-grids developed after 2008 were developed under the SPP framework.
Several challenges remain:
▪ TANESCO is financially insolvent, with consequences for mini-grid operators who sell to it.
▪ Cost-reflective retail tariffs charged by mini-grids are significantly higher than TANESCO’s cross-subsidized retail tariffs.
▪ The planning process for new mini-grids is long and complicated.
▪ Local expertise and capacity on mini-grid development and implementation are inadequate.

85Accelerating Mini-Grid Deployment in Sub-Saharan Africa: Lessons from Tanzania
▪ Government bodies, financial institutions, private developers, and donors do not always coordinate efficiently.
▪ The lack of easily accessible, comprehensive data on energy resources, funding sources, and operational results of mini-grids has hampered development.
Policy makers could consider the following actions to accelerate mini-grid deployment:
▪ Build up knowledge about mini-grid experiences. Formal records do not capture all mini-grids in operation in Tanzania. Studying the small mini-grids that are not registered could reveal useful lessons on how they operate outside the formal framework.
▪ Make information about mini-grids available to relevant actors. Tanzania has no readily accessible database on mini-grid technologies, sizes, costs, manufacturers, and adaptability to specific energy-demand situations. The Ministry of Energy and Minerals and other members of the task force responsible for maintaining the mini-grid information portal supported by the Scaling up Renewable Energy Program (SREP) might consider adding a database with information on detailed mini-grid characteristics to the portal. Parameters to monitor might include the following:
□ the number and location of mini-grids operating, under construction, and planned
□ the technology (fuel), installed capacity, plant availability, utilization factor, and number of connections of each mini-grid
□ construction and O&M costs
□ funding sources
□ tariff pricing, payment method, revenue collection, and disconnection rate
□ qualitative information on the quality of service and customer satisfaction
□ list of sites with high potential for mini-grid development and their characteristics.
▪ Improve coordination for mini-grid planning. The government of Tanzania should review and simplify the steps, procedures, and requirements in the mini-grid development planning process. In particular, intermediate steps, such as obtaining land, water, and environmental clearances, could be streamlined. Rather than have each developer go through the 13-step planning process for mini-grids, the Rural Energy Agency and TANESCO could take responsibility for coordinating site selection, initial studies, and required clearances and invite developers to build, own, and operate mini-grids. Delegating these project development steps to the actors best placed to implement them would help simplify the process and reduce transaction costs.
▪ Support capacity-building efforts, particularly at the local level. Support could focus on technical, business, and management skills that enable potential developers to conduct initial studies, draft business plans, and create documents that can secure financing. Capacity building should extend to project implementation, including the design, procurement, construction, and management of plants. A successful competitive bidding program requires sufficient competition between high-quality developers as well as clear processes for identifying and securing land for project sites. Local developers that lack capacity will not be able to participate in this competitive bidding process, reinforcing the need for local capacity building.
▪ Build a robust understanding of the development impacts of mini-grids. Most information about the impacts of mini-grids on development (including the information in this report) is anecdotal. More systematic qualitative and quantitative studies on the social and economic impact of mini-grids could help inform rural development programs and energy access strategies.

WRI.org 86
APPENDIX A: PEOPLE INTERVIEWED FOR THIS REPORT
TableA.1 | Officials Interviewed
INSTITUTION NAME TITLE
Energy and Water Utilities Regulatory Authority (EWURA)
Mr. Anastas Mbawala
Mr. John Mtengati
Mr. Msafiri Mtepa
Director, Electricity
Manager, Financial Analysis and Modeling
EWURA: Public hearing on competitive bidding for solar and wind projects
Mr. Felix Ngamlagosi World Bank via the REA
Husk Power Systems Mr. Anil
Mr. Adedotun Eyinade
Mr. Alexander Mwalyolyo
Mr. Swaibo
Senior Technician
Business Development Manager
Marketing Manager
Technician
Ministry of Energy and Minerals Mr. Jafari Chinjala
Mr. Antoni Kalomba
Mr. Paul Kiwele
Energy Officer
Energy Officer
Acting Assistant Commissioner, Renewable Energy
National Environment Management Council (NEMC)
Mr. James Ngeleja Energy Environment Advisor
Rural Energy Agency Mr. Gissima Hanga
Ms. Advera Mwijage
Director, Marketing Development and TechnologiesSenior Marketing and Energy Technologies Engineer
Swedish Embassy/Swedish International Development Cooperation Agency (SIDA)
Mr. Jorgen Ericksson
Mr. Stephen Mwakifamba
Energy Specialist
Program Officer for Energy, Development Cooperation Division
World Bank Ms. Jane Kibbassa
Dr. Richard Hosier
Senior Environment Officer
Senior Energy Specialist

87Accelerating Mini-Grid Deployment in Sub-Saharan Africa: Lessons from Tanzania
Table A.2 | Individuals Interviewed
NAME INSTITUTION/VILLAGE TITLE
Icra Ally Kongwa System Operator
Anderson Leganga Electricity Customer
David C. David Leganga Solar Technician
Joel Azaria Gomba Mwenga Operations Manager
Ally Hamisi Kongwa System Operator
Dismas Haule LUMAMA Chief Technician
Erick Haule LUMAMA Manager
Fedison Kilongani Leganga Committee Member
Antery A. Kiwale Tanganyika Wattle Company (TANWAT) Chief Forest Manager
Happy Machimbo Leganga Committee Member
Gayson Magati Kongwa Technician
Neema Mbagale Leganga Committee Secretary
Naftaeli TANWAT Power Plant Manager
Evodia Ngail LUMAMA Treasurer
Emelina Nyagalo Leganga Village Chairperson
Issa Ramadhan Kongwa System Operator
Amos Samwel Leganga Village government official
Kamal Tipathi TANWAT Chief Engineer
Baraka Ulinga Leganga Committee Member

WRI.org 88
APPENDIX B: SMALL POWER PRODUCERS THAT SIGNED SMALL POWER PURCHASE AGREEMENTS AND SUBMITTED LETTERS OF INTENT
Table B.1 | Small Power Producers That Signed Small Power Purchase Agreements
PRODUCER, LOCATION TECHNOLOGY
EXPECTED CAPACITY (MW)
LOCATIONDATE OF LETTER OF INTENT
DATE SMALL POWER PURCHASE AGREEMENT SIGNED
COMMISSIONING DATE
Andoya, Mbinga Hydro 1.0 Off grid September 22, 2010 February 25, 2013 March 19, 2015
Darakuta, Manyara
Hydro 0.24 Grid connection October 1, 2012 November 16, 2013 Commissioned
EA Power Ltd, Tukuyu
Hydro 10.0 Grid connection July 2, 2011 February 25, 2013 Expected by end of 2018
Ilungu ward project, Mbeya
Hydro 5.0 Grid connection December 31,2013 December 30, 2015 Expected by end of 2017
Luswisi project, Ileje, Mbeya
Hydro 4.7 Grid connection October 23, 2013 December 30, 2015 Expected by end of 2017
Maguta power project, Kilolo
Hydro 2.5 Grid connection October 23, 2013 December 30, 2015 Expected by end of 2017
Mapembasi, Njombe
Hydro 10.00 Grid connection June 25, 2010 January 15, 2014 Expected by end of 2018
Mwenga, Mufindi
Hydro 4.0 Grid connection n.a.— January 19, 2010 October 21, .2012
NextGen Solawazi, Kigoma
Solar 5.0 Off grid September 19, 2012 January16, 2013 Expected by October 2016
Ngombeni, Mafia Island
Biomass 1.5 Off grid n.a.— January 19, 2010 February 11, 2014
Nkwilo, Sumbawanga
Hydro 2.90 Off grid December 2, 2013 March 17, 2015 Expected by end of 2017
TANWAT, Njombe
Biomass 1.5 Grid connection n.a. — September 17, 2009 June 15, .2010
TPC, Moshi Biomass 9.0 Grid connection n.a. — October 6, 2009 September 13, 2010
Tulila, Songea Hydro 7.5 Off grid 05.07.2011 January 11, 2013 September 14, 2015
Yovi hydro, Kilosa
Hydro 0.90 Grid connection
31.12.2013 June 8, 2015 November 10, 2015
Source: TANESCO.
Note: Total capacity is 53.5 MW. — Not available.
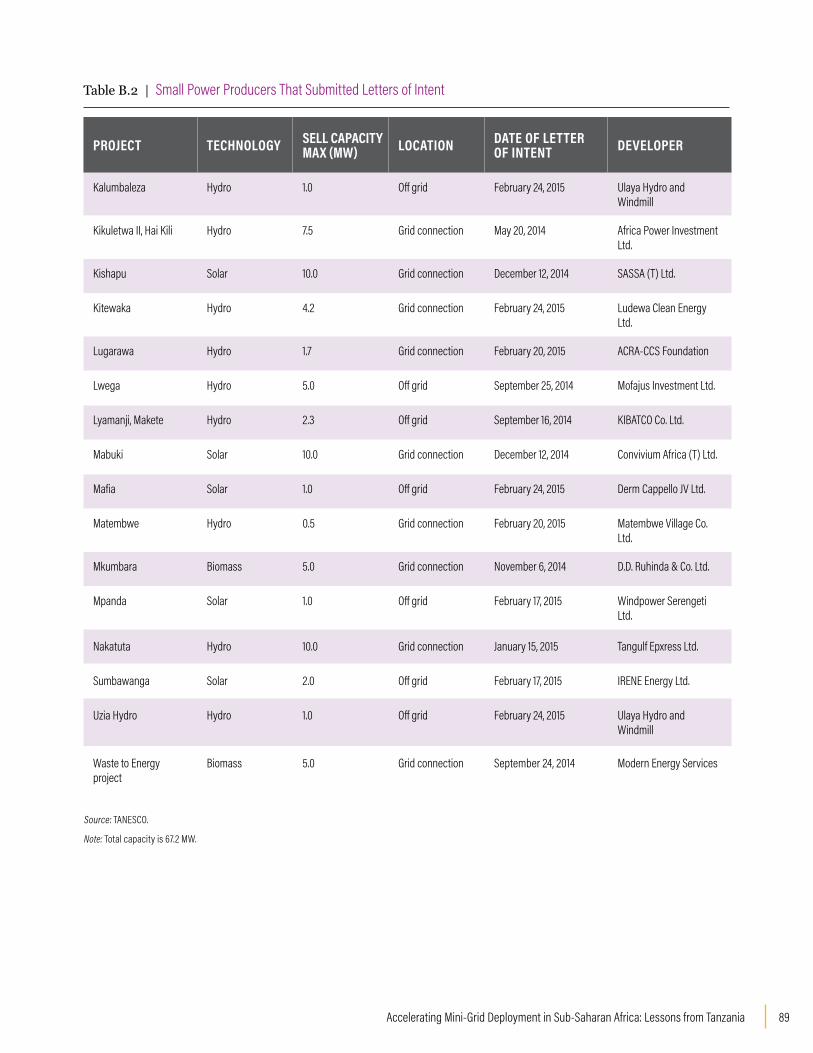
89Accelerating Mini-Grid Deployment in Sub-Saharan Africa: Lessons from Tanzania
Table B.2 | Small Power Producers That Submitted Letters of Intent
PROJECT TECHNOLOGY SELL CAPACITY MAX (MW) LOCATION DATE OF LETTER
OF INTENT DEVELOPER
Kalumbaleza Hydro 1.0 Off grid February 24, 2015 Ulaya Hydro and Windmill
Kikuletwa II, Hai Kili Hydro 7.5 Grid connection May 20, 2014 Africa Power Investment Ltd.
Kishapu Solar 10.0 Grid connection December 12, 2014 SASSA (T) Ltd.
Kitewaka Hydro 4.2 Grid connection February 24, 2015 Ludewa Clean Energy Ltd.
Lugarawa Hydro 1.7 Grid connection February 20, 2015 ACRA-CCS Foundation
Lwega Hydro 5.0 Off grid September 25, 2014 Mofajus Investment Ltd.
Lyamanji, Makete Hydro 2.3 Off grid September 16, 2014 KIBATCO Co. Ltd.
Mabuki Solar 10.0 Grid connection December 12, 2014 Convivium Africa (T) Ltd.
Mafia Solar 1.0 Off grid February 24, 2015 Derm Cappello JV Ltd.
Matembwe Hydro 0.5 Grid connection February 20, 2015 Matembwe Village Co. Ltd.
Mkumbara Biomass 5.0 Grid connection November 6, 2014 D.D. Ruhinda & Co. Ltd.
Mpanda Solar 1.0 Off grid February 17, 2015 Windpower Serengeti Ltd.
Nakatuta Hydro 10.0 Grid connection January 15, 2015 Tangulf Epxress Ltd.
Sumbawanga Solar 2.0 Off grid February 17, 2015 IRENE Energy Ltd.
Uzia Hydro Hydro 1.0 Off grid February 24, 2015 Ulaya Hydro and Windmill
Waste to Energy project
Biomass 5.0 Grid connection September 24, 2014 Modern Energy Services
Source: TANESCO.
Note: Total capacity is 67.2 MW.

WRI.org 90
National Policies That Affect Mini-Grid DevelopmentVarious national policies have implications for mini-grid development:
▪ Energy: The National Energy Policy of 2003 laid the foundation for promoting renewable energy sources and encouraging private sector participation in Tanzania. Energy Policy Statement No. 36 established norms, codes of practice, guidelines, and standards for facilitating and creating an enabling environment for sustainable development of renewable energy. This policy was replaced by the National Energy Policy of 2015, which seeks to facilitate the adoption of renewable energy technologies in order to increase their contribution to the electricity generation mix.
▪ Environment: The National Environmental Policy of 1997, which was revised in 2004, calls for the enactment of an environmental framework law and the establishment of environmental standards. It directs the undertaking of an Environmental and Social Impact Assessment (ESIA) as an instrument for achieving sustainable development. The National Environmental Policy of 2015 (draft) aims to promote diversified sources of energy by exploiting renewable energy sources.
▪ Water: The National Water Policy of 2002 seeks to put in place fair and equal procedures in access to and allocation of water resources, so that all social and economic activities are able to maximize their capacities.
▪ Land: The National Land Policy of 1997 aims to promote and ensure the land tenure system, in order to encourage the optimal use of land resources and facilitate broad-based social and economic development without upsetting or endangering the ecological balance of the environment.
▪ Forests: The National Forest Policy of 1998 seeks to enhance the contribution of the forest sector to the sustainable development of Tanzania and the conservation and management of its natural resources for the benefit of present and future generations.
▪ Investment: The National Investment Promotion Policy of 1996 encourages investment in the development of all possible commercial and alternative sources of energy, with emphasis on the use of domestic resources, with the aim of ensuring continuity of supplies.
▪ Gender: The National Gender Policy of 2002 aims at establishing strategies to eradicate poverty, with an emphasis on gender equality and equal opportunity for men and women to participate in development undertakings and to value the role played by each member of society.
Strategies That Support Mini-Grid DevelopmentThe National Energy Policy of 2003 is not adequately supported by clear strategies with targets, indicators, timelines, and a monitoring mechanism for effective implementation. However, a number of relevant international, national, and sectoral strategies contribute to the promotion and scaling up of renewable energy mini-grids.
International StrategiesSeveral international strategies have implications for mini-grid development:
▪ The Sustainable Energy for All (SE4ALL) initiative, established in September 2010, aims to achieve three interrelated goals by 2030: ensure universal access to modern energy services, double the rate of improvement in energy efficiency, and double the share of renewable energy in the global energy mix.
▪ Sustainable Development Goal (SDG) 7 is to “ensure access to affordable, reliable, sustainable, and modern energy for all.”
▪ The Paris Declaration recognizes that development of a low-carbon economy must be delivered through implementation of concrete projects at the local and national levels in renewable energies, energy security and energy efficiency, transportation and mobility, waste management, food security, and related economic sectors. Under the agreement, all countries are to prepare Nationally Determined Contributions (NDCs), which indicate how they plan to reduce greenhouse gas emissions. Tanzania’s NDC indicates that it will reduce its emissions by 10–20 percent by 2030 relative to the business as usual scenario of 138–153 million tonnes of carbon dioxide equivalent (MtCO2e).
National StrategiesTwo national strategies bear on mini-grid development:
▪ The Tanzania Development Vision 2025, released in 2000, envisages Tanzania becoming a middle-income country by 2025. It indicates that balancing human activities and environment should determine and shape decisions and actions.
▪ The National Strategy for Economic Growth and Reduction of Poverty, adopted in 2005, proposes strategies for reducing poverty and raising incomes and improving the quality of life and social well-being, governance, and accountability. The private sector is one of the actors identified for implementing the strategy. The government supports and encourages innovations, product development, quality and marketing strategies.
APPENDIX C: POLICIES, STRATEGIES, ACTS, REGULATIONS, TECHNICAL STANDARDS, AND PROGRAMS, PLANS, AND PROJECTS ON MINI-GRIDS

91Accelerating Mini-Grid Deployment in Sub-Saharan Africa: Lessons from Tanzania
Sectoral StrategiesThe following sectoral strategies have implications for mini-grid development:
▪ The National Climate Change Strategy, adopted in 2012, commits Tanzania to address climate change adaptation and participate in global efforts to reduce greenhouse gasses in the context of sustainable development.
▪ The Reducing Deforestation and Forest Degradation (REDD+) Strategy of 2013 aims at curbing deforestation. It seeks to guide the implementation and coordination of mechanisms required for Tanzania to benefit from a post-2012 internationally approved system for forest carbon trading, based on demonstrated emission reductions from deforestation and forest degradation.
▪ The Electricity Supply Industry Reform Strategy and Roadmap 2014–2025, issued in 2014, intends to diversify the sources of electricity generation to include natural gas, coal, hydro, uranium, and renewable energies to improve the security of supply.
▪ The Biomass Energy Strategy Tanzania (BEST), issued in 2014, seeks to ensure that biomass energy is sustainable along the entire value chain, including through forestry supply-side measures that ensure the sustainability of biomass energy supplies and improved efficiencies of biomass energy utilization.
▪ National Appropriate Mitigation Actions (under preparation) are voluntary country’s actions that curb greenhouse gases via a variety of measures, including renewable energy.
Acts, Regulations, and Rules Relevant to Mini-GridsThe Energy and Water Utilities Authority Acts of 2001 and 2006 established the Energy and Water Utilities Regulatory Authority (EWURA). It is empowered to:
▪ promote effective competition and economic efficiency
▪ protect consumer interests
▪ protect the financial viability of efficient suppliers
▪ promote the availability of regulated services for all consumers, including low-income, rural, and disadvantaged groups
▪ enhance public knowledge, awareness, and understanding of the regulated sectors.
▪ issue, renew, and cancel licenses for electricity generation, transmission, distribution, and supply as well as licenses for electrical installation contractors/wiremen and standby electricity generation power plants
▪ register power plants that are exempt from licensing.
In September 2008 EWURA approved standardized small power purchase agreements (SPPAs) and adopted the standardized tariff calculation methodology for the main grid. In June 2009 it approved a standardized tariff methodology and applicable tariff for sale of
electricity to mini-grids. Approval of SPPAs and the standardized tariff methodology aimed at promoting the development of renewable energy resources in Tanzania.
EWURA has also developed and put into operation rules regulating the electricity sector in mainland Tanzania. They include rules on transmission services (2011), distribution services (2011), generation services (2011), supply services (2013), licensing fees (2012),initiation of procurement of power projects (2014), development of small power projects (2014), and supply operations (2014).
Technical Standards for Mini-GridsA variety of technical standards affect mini-grids:
▪ The Tanzania Investment Act of 1997 established the Tanzania Investment Centre (TIC), with responsibilities for coordinating, promoting, and assisting investors and advising the government.
▪ The Occupation Health and Safety Act No. 5 of 2003 makes provisions for the safety, health, and welfare of people at work, including through the prevention of fires and the provision of first aid facilities.
▪ The Environmental Management Act of 2004 provides for the continued existence of the National Environment Management Council. It requires developers of projects, including mini-grids, to undertake environmental impact assessment studies at their own expense.
▪ The Rural Energy Act of 2005 established the Rural Energy Board, the Rural Energy Fund (REF), and the Rural Energy Agency (REA), which are responsible for promoting improved access to modern energy services in the rural areas of mainland Tanzania. The REF provides grants to TANESCO for rural grid distribution investments and to developers of renewable energy mini-grids.
▪ The Electricity Act of 2008 established a general framework for the powers of the Ministry of Energy and Minerals and EWURA and defined key parameters for EWURA with regard to tariff-setting criteria and procedures; criteria for awarding provisional and permanent licenses; monitoring and enforcement activities; requirements for ministerial plans and strategies for rural electrification; dispute resolution procedures; and a process for determining possible future reorganization of the electricity sector. It requires EWURA to pursue a light-handed approach to regulating small renewable energy projects.
▪ The Public Private Partnership Act, No. 18 of 2010 sets forth the responsibilities and obligations of the parties, penalties, remedies, financial management and control requirements, and dispute resolution. It established public-private partnership coordination units within the Tanzania Investment Centre and the Ministry of Finance.
▪ In January 2011, EWURA, in collaboration with the Tanzania Bureau of Statistics (TBS), TANESCO and the University of Dar es Salaam, established the Tanzania Standards on Power Quality of Supply and Services to supervise mini-grid distribution and supply activities in Tanzania The standards were launched in January, 2011.

WRI.org 92
Mini-Grid Plans, Programs, and ProjectsA number of plans, programs, and projects support and promote the implementation and financing of renewable energy mini-grids in Tanzania:
▪ The Scaling up Renewable Energy Program (SREP) Investment Plan (2013) supports the large-scale deployment of renewable energy in order to diversify the energy sector away from fossil fuels.
▪ The Renewable Energy for Rural Electrification (RERE) Program is a pilot program funded under the SREP. It includes three programs: a risk mitigation facility, a credit line facility, and a transaction advisory service facility. The project aims to continue public sector engagement by building a responsive and effective structure and engage the private sector on a large scale by supporting public-private partnerships in establishing off-grid and mini-grid enterprises. The proposed approach to implementation is through mini-grids 1000 kW–10 MW, micro-grids decentralized to remote areas, and sustainable solar packages for social institutions. The World Bank has committed to support a $200 million renewable energy project and rural electrification project, which tentatively includes a $75 million credit line, a risk mitigation facility, a project preparation facility, technical assistance, and funds for small power projects (SPPs).
▪ The United Republic of Tanzania National Electrification Program Prospectus (2013–22) supports the government’s electrification strategy through a cost-effective approach. It projects that by 2022 about 5,500 settlements will be electrified through the grid connection plan and 6,000 settlements through off-grid electrification and distributed technologies.
▪ The Tanzania Energy Development and Access Expansion Project (TEDAP), financed by the World Bank and the Global Environment Fund, aimed to increase electricity access in rural and peri-urban areas. It was implemented between 2008 and 2015 by TANESCO, the REA, and the Ministry of Energy and Minerals. The project expanded generation and distribution investments of TANESCO; developed, tested, and demonstrated new rural electrification approaches; and provided sectoral technical assistance. It assisted EWURA in developing regulations for SPPs and mini-grids and helping investors obtain matching and performance grants from the REA and a credit line to TIB that is disbursed by several local commercial banks for financing construction of mini-grids.
▪ The Lighting Rural Tanzania Competition, organized by the REA, attracts proposals mainly from domestically based firms. It has funded 45 projects, worth T Sh 8.3 billion. This initiative has contributed to the growth and expansion of local firms that provide energy solutions based on renewable energy technologies, especially solar. It appears to have increased the number of firms owned by local entrepreneurs.
▪ The REA, with the support of the United Nations Industrial Development Organization (UNIDO) promoted hydro mini- and micro-grids in Tanzania in support of rural electrification between 2012-2016.
▪ To implement SE4ALL, Tanzania has prepared an action agenda and investment prospectus with targets for its various goals (Table C.1).
Table C.1 | Tanzania’s SE4ALL Indicators
TARGET INDICATOR
Achieve universal access to modern energy services
▪ More than 75 percent of population with electricity access
▪ More than 75 percent of population with access to modern cooking solutions
Double global rate of improvement of energy efficiency
▪ Energy intensity reduced by 2.6 percent a year from average for 2001–10; target will reduce energy intensity by 41 percent by 2030
Double share of renewable energy in global energy mix
▪ More than 40 percent of power consumption from renewable energy
▪ More than 10 percent of heat consumption from renewable energy
Source: SE4ALL Action Plan (2015).

93Accelerating Mini-Grid Deployment in Sub-Saharan Africa: Lessons from Tanzania

WRI.org 94
ABBREVIATIONSDfID Department for International Development
EWURA Energy and Water Utilities Regulatory Authority
Hivos Humanist Institute for Cooperation with Develop-ing Countries
IEA International Energy Agency
kV kilovolt
kVA kilovolt amp
kWh kilowatt hour
kWp kilowatt peak
LUMAMA Lupande, Madunda, and Mawengi
M&E monitoring and evaluation
MFP Multi-Functional Platform
MW megawatt
NGO nongovernmental organization
O&M operations and maintenance
PV photovoltaic
REA Rural Energy Agency
REF Rural Energy Fund
SE4ALL Sustainable Energy for All
SESCOM Sustainable Energy Services Company
SPD small power distributor
SPP small power producer
SPPA standardized power purchase agreement
SPPT standardized power purchase tariff
SREP Scaling up Renewable Energy Program
SVO straight vegetable oil
T Sh Tanzanian shilling
TANESCO Tanzania Electric Supply Company
TANWAT Tanganyika Wattle Company
TaTEDO Tanzania Traditional Energy Development Organization
TEDAP Tanzania Energy Development and Access Expansion Project
TIC Tanzania Investment Centre
V volt

95Accelerating Mini-Grid Deployment in Sub-Saharan Africa: Lessons from Tanzania
GLOSSARY Bio-fuel: Any liquid fuel that contains energy derived from recently living organisms, mainly plants.
Biomass: Material of biological origin, derived from living or recently living tissue, typically plants (e.g., wood, agricultural products, animal products, and ocean plants) as well as their residues.
Combined heat and power (co-generation): Use of heat engine or power plant to generate electricity and useful heat at the same time.
Decentralized system: Electrical system that produces electricity for localized customers; it generates electricity close to where it will be used. Decentralized systems may or may not be connected to the grid. They are typically owned by nongovernmental entities, such as com-munity groups, cooperatives, or private actors. Stand-alone systems, such as solar home systems, and mini-grids are examples of decentral-ized systems. Distribution network operator: Distribution licensee operating a distribution network at 33kV or below. The operator can have its own generating plants and transmission network, undertake bulk power purchase from independent and small power producers and retail it to customers, and make bulk sales to small power distributors. In Tanza-nia TANESCO owns all centralized grid transmission and distribution in-frastructure on mainland Tanzania and is the sole distribution network operator. Planned reforms to the electricity sector may introduce other licensed distribution network operators.
Feed-in tariff: Tariff mechanism applicable to renewable energy gen-erators and co-generators, usually expressed in price per kWh. Feed-in tariffs set the off-taker price for certain types of energy over a set time period and typically incorporate a sustainable profit margin. They provide price certainty to generators who sell power to the national/main grid or mini-grid. In this report, the term is used interchangeably with standardized small power producers tariff (SPPT).
Independent power producers: Private producer that sells power in bulk to the national/main grid. The Tanzanian government categorizes projects larger than 10 MW of installed capacity as independent power producer.
Isolated system: Small electrical generation and distribution network that serves more than one customer and is not connected to the national grid.
Mini-grid: Small electrical generation and distribution network that serves more than one customer. This report defines mini-grids as below a threshold of 10 MW; most are smaller than 1 MW. Mini-grids can be isolated or connected to the national grid. They are usually owned or operated by a nongovernmental entity, such as a cooperative, com-munity group, or private actor. Some national utilities, like Tanzania’s TANESCO, also own and operate some mini-grids.
Power purchase agreement: Contract between power producer and power purchaser with provisions on rights and obligations of both parties, including the price and quantity of electricity to be exchanged, over a specified time period (years). In Tanzania a standardized small power purchase agreement is available to minimize lengthy negotia-tions between small power producers and TANESCO.
Small power distributors: Operators who undertake bulk purchase of power and retail it to customers in their networks. These distribu-tors can include small power producers with their own distribution networks.
Small power producers: Small independently operated power pro-ducers, defined in Tanzania as having export capacity of up to 10 MW. Small power producers (SPPs) are privately owned by individuals, a company, a cooperative, or a community. They sell power to the distri-bution network operator (TANESCO), isolated mini-grids, and/or directly to consumers (if they also have a distribution network). Regulators classify SPPs based on their size, fuel used, and technology applied.
Stand-alone system: Single-user generating system (e.g., wind-powered water pump, solar home system) that serves the needs of a single household, farm, or building and is not connected to the national grid or to a mini-grid.
Standardized small power purchase agreement: Standard, nonne-gotiable contract between a small power producer and a utility entity (TANESCO), prepared by the regulator, that specifies the rights and obligations of both parties, including the price and quantity of electric-ity to be sold. Standardized small power purchase agreements apply to power producers producing 100 kW–10 MW of power.
Standardized power purchase tariff: Fixed tariff (determined by the regulator) for mini-grids connected to and selling power to the main grid or to a TANESCO isolated mini-grid.

WRI.org 96
BIBLIOGRAPHYAfDB (African Development Bank). 2015. Renewable Energy in Africa: Tanzania Country Profile. Abidjan. http://www.afdb.org/fileadmin/uploads/afdb/Documents/Generic-Documents/Renewable_Energy_in_Africa_-_Tanzania.pdf.
Agarwal, A., D. Wood, and N. Rao. 2016. Impacts of Small-Scale Electricity Systems: A Study of Rural Communities in India and Nepal. Washington, DC: World Resources Institute. http://www.wri.org/publication/small-scale-electricity-systems.
Ahlborg, H. 2015. “Walking along the Lines of Power: A Systems Approach to Understanding Co-emergence of Society, Technology and Nature in Processes of Rural Electrification.” Chalmers University of Technology, Gothenburg, Sweden. http://publications.lib.chalmers.se/records/fulltext/215043/215043.pdf.
Bångens, L. 2012. A Solar PV Project as the Starting Point for Building Energy Markets for the Poor: Lessons Learned and Strategy for the Way Forward. Project Review, SIDA/MEM Solar PV Market Facilitation Project in Tanzania. https://www.scribd.com/document/243196942/A-solar-PV-project-as-the-starting-point-for-building-energy-markets-for-the-poor-lessons-learned-and-strategy-for-the-way-forward.
Bhattacharyya, S.C. 2014. “Viability of Off-Grid Electricity Supply Using Rice Husk: A Case Study from South Asia.” Institute of Energy and Sustainable Development, De Montfort University, Leicester, United Kingdom.
Bloomberg New Energy Finance, Lighting Global, and Global Off-Grid Lighting Association. 2016. Off-Grid Solar Market Trends Report 2016. February. https://www.lightingglobal.org/launch-of-off-grid-solar-market-trends-report-2016/.
Camco Clean Energy (Tanzania) Limited. 2014. Biomass Energy Strategy Tanzania (BEST): Tanzania Biomass Energy Strategy and Action Plan. Final Report. Dar es Salaam.
Deshmukh, R., J. Carvallo, and A. Gambhir. 2013. Sustainable Development of Renewable Energy Mini-Grids for Energy Access: A Framework for Policy Design. http://www.cleanenergyministerial.org/Portals/2/pdfs/Sustainable_Development_of_Renewable_Energy_Mini-grids_for_Energy_Access.pdf.
DfID (Department for International Development). 2010. “A Potential Role for Advance Market Commitments (AMCs) in Promoting Green Mini-Grids in Tanzania, Case Study Annex.” Prepared by Vivid Economics. http://www.vivideconomics.com/wp-content/uploads/2010/03/Tanzania_case_study.pdf.
EUEI PDF (European Union Energy Initiative Partnership Dialogue Facility). 2015. Building Energy Access Markets: A Value Chain Analysis of Key Energy Market Systems by Practical Action. Eschborn, Germany.
Gissima Nyamo-Hanga, B. 2013. “The Role of Rural Electrification in Poverty Reduction.” Paper presented at National Poverty Policy Week, November 25–27, Dar es Salaam.
Greacen, C. 2014. “Mini-Grid Systems on the Rise in Tanzania: Status of Implementation and Regulatory Framework Conditions.” Presentation at the workshop “Mini-Grid Systems: Reducing Risks and Costs through Anchor Customer Business Model,” Berlin. March 19, 2-14
Gulberg, M., M. Katyega, and B. Kjellstrom. 1999. “Local Management of Rural Power Supply in Tanzania: A New Approach in Tanzania.” EEDS 46, Energy, Environment and Development Series. Stockholm: Stockholm Environment Institute.
Hankins, M. 2009. Tanzania s Small-Hydro Energy Market, Target Market Analysis. Berlin: Deutsche Gesellschaft für Technische Zusammenarbeit (GTZ).
https://www.giz.de/fachexpertise/downloads/gtz2009-en-targetmarketanalysis-hydro-tanzania.pdf.
IEA (International Energy Agency). 2011. World Energy Outlook 2011: Energy for All—Financing Access for the Poor. Paris.
IEA. 2014a. Africa Energy Outlook: A Focus on Energy Prospects in Sub-Saharan Africa. Paris.
IEA. 2014b. World Energy Outlook 2014. Electricity Database. http://www.worldenergyoutlook.org/resources/energydevelopment/energyaccessdatabase/.
IEA. 2016. World Energy Outlook. Paris
IED (Innovation Energie Développement). 2013. Identifying the Gaps and Building the Evidence Base on Low Carbon Mini-Grids.” Support Study for DFID Low Carbon Mini-Grids. Final Report, November. Francheville, France.
Ilskog, E., B. Kjellstroem, M. Gulberg, M. Katyega, and W. Chambala. 2005. “Electrification Cooperatives Bring New Light to Rural Tanzania.” Energy Policy 33(10): 1299–1307.
INENSUS Gmbh and Terraprojects E.U. 2013. Feasibility Study: Electrification of Rural Communities in Tanzania with High Penetration of Renewable Energy Sources. Report GZ 2551-01/2013/5-WE/2013. Co-financed by the Australian Development Agency.
IRENA (International Renewable Energy Agency). 2016. Unlocking Renewable Energy Investment: The Role of Risk Mitigation and Structured Finance. Abu Dhabi. http://www.irena.org/DocumentDownloads/Publications/IRENA_Risk_Mitigation_and_Structured_Finance_2016.pdf.
Jairaj, B., S. Martin, J. Ryor, S. Dixit, A. Gambhir, A. Chunekar, R. Bharvirkar, G. Jannuzzi, S. Sukenaliev, and T. Wang. 2016. The Future Electricity Grid: Key Questions and Considerations for Developing Countries. Washington, DC: World Resources Institute. http://www.wri.org/sites/default/files/The_Future_Electricity_Grid.pdf.

97Accelerating Mini-Grid Deployment in Sub-Saharan Africa: Lessons from Tanzania
Kahyoza, N., and C. Greacen. 2011. “Tanzania’s Experience in Establishing a Regulatory System for Promoting Grid and Off-Grid Small Power Producers (SPPs).” Paper presented at the Africa Electrification Initiative practitioner workshop “Institutional Approaches to Electrification: The Experience of Rural Energy Agencies/Rural Energy Funds in Sub-Saharan Africa,” Dakar, November 14–16.
Kjellstrom, B., M. Katyega, H. Kadete, D. Noppen, and A. Mvungi. 1992. Rural Electrification in Tanzania: Past Experiences: New Approaches. EEDS 15, Energy, Environment and Development Series. Stockholm: Stockholm Environment Institute.
Ministry of Energy and Minerals. 2013. Joint Energy Sector Review (JESR) 2012/13. Updated Final Report. Dar es Salaam.
Ministry of Energy and Minerals. 2013a. Draft Subsidy Energy Policy. Dar es Salaam.
Ministry of Energy and Minerals. 2013b. Investment Plan for Tanzania: Scaling Up Renewable Energy Programmes. Dar es Salaam
Ministry of Energy and Minerals. 2014. United Republic of Tanzania: Electricity Supply Industry Reform Strategy and Roadmap 2014–2025. Dar es Salaam.
Ministry of Energy and Minerals, and Rural Electrification Agency. 2014. Operating Guidelines. Off-Grid Component of Tanzania Energy Development and Access Project. Dar es Salaam.
MVC (Matambwe Village Company). 2014. Initial Environmental Audit Report of Matambwe Micro-Hydropower Plant at Matambwe Village, Njombe District in Njombe Region. Report submitted to the National Environment Management Council (NEMC).)
Moner-Girona, M., R. Ghanadan, M. Solano-Peralta, I. Kougias, K. Bódis, T. Huld, and S. Szabó. 2015. “Adaptation of Feed-in-Tariff for Remote Mini-Grids: Tanzania as an Illustrative Case.” Renewable and Sustainable Energy Reviews 53: 306–18.
Morganti, N. 2015. “Social Enterprise and Renewable Energy: The Case of LUMAMA, Tanzania.” Presentation at the Social Enterprise World Forum, July 1–3, Milan. http://sewf2015.org/wp-content/uploads/2015/07/w20-morganti.pdf.
Mtepa, M. 2014. “Tanzania Case Study: Achievements and Challenges.” Presentation at the Third Gambia National Forum on “Policy on Small-Scale Renewable Energy Regulation,” June 18–19, Banjul, The Gambia.
Mwakaje, A.G. 2010. “Information and Communication Technology for Rural Farmers in Tanzania.” Journal of Information Technology Impact 10(2): 111–28.
Mwakapugi, A., W. Samji, and S. Smith. 2010. “The Potential for Job Creation and Productivity Gains through Expanded Electrification.” Special Paper 10/3. Dar es Salaam: Research on Poverty Alleviation (REPOA).
Palit, D., and G.K. Sarangi. “Renewable Energy–Based Rural Electrification: The Mini-Grid Experience from India.” Paper prepared for the Global Network on Energy for Sustainable Development. New Delhi: Energy and Resources Institute (TERI). https://www.scribd.com/doc/297771153/Renewable-energy-based-rural-electrification-The-mini-grid-experience-from-India.
Pendezza, J. 2014. “Non-Profit/For-Profit Partnerships in SHPP: CEFA’s Experiences and Perspectives in Tanzania.” Paper presented at the POWER-GEN Africa 2014 conference, March 17–19, Cape Town. Ranjit D., P.C. Juan, and G. Ashwin. 2013. “Sustainable Development of Renewable Energy Mini‐Grids for Energy Access: A Framework for Policy Design.” http://www.cleanenergyministerial.org/Portals/2/pdfs/Sustainable_Development_of_Renewable_Energy_Mini-grids_for_Energy_Access.pdf.
Raub, V. 2013. “Access to Basic Energy Services in Senegal: The Impacts of Improved Cooking Stoves and Rural Electrification on Women’s Needs.” http://www.peracod.sn/IMG/pdf/The_Impacts_of_Improved_Cooking_Stoves_and_Rural_Electrification_on_Women_s_Needs__Viviane_Raub_ENG.pdf.
REA (Rural Electrification Agency). 2012. Operating Guidelines, Credit Line, Tanzania Energy Development and Access Expansion Project (TEDAP)—Off Grid Component. Dar es Salaam.
REA. 2013. “Status of REA’s Activities, Future Programmes and Challenges.” Seminar on financing of proposed electrification program funded by the World Bank, December 10, Dar es Salaam.
REA. 2014. Operating Guidelines, Energy Small and Medium Enterprise Grant, Tanzania Energy Development and Access Expansion Project (TEDAP)—Off Grid Component. Dar es Salaam.
REA. 2015. “Energizing Rural Transformation.” Program Document on SIDA and DfID Financial Support to the Rural Energy Fund (REF). Revised Final Draft, June 8.
REA. 2016. “First Call: Invitation to Submit Applications for Results-Based Financing (RBF) Grants for Renewable Energy Investments in Green Mini and Micro Grids.” Ministry of Energy and Minerals,Dar es Salaam. http://www.ewura.go.tz/wp-content/uploads/2016/09/RBF-ONLINE-APPLICATION-GENERAL-INFORMATIONS-.pdf.
Sanyal, S., and P. Deka. 2015. Identifying Markets for Clean Energy Access in Tanzania Mainland. Hyderabad, India: Regain Paradise Research Consulting.
Sanyal, S., J. Prins, F. Visco, and A. Pinchot. 2016. Facilitating Investment for ‘Pay as You Go’ Energy Access: The Role of Development Finance Institutions in Stimulating Local Finance in Kenya and Tanzania. Washington, DC: World Resources Institute.
Sarakikya H., I. Ibrahim, and J. Kiplagat. 2015. “Renewable Energy Policies and Practice in Tanzania: Their contribution to Tanzania Economy and Poverty Alleviation,” International Journal of Energy and Power Engineering 4(6): 333–41.

WRI.org 98
Searchinger, T., and R. Heimlich. 2015. “Avoiding Bioenergy Competition for Food Crops and Land.” Working Paper, Installment 9 of Creating a Sustainable Food Future. Washington, DC: World Resources Institute.
SIDA (Swedish International Development Agency), and DfID (Department for International Development). 2015 Accelerating Mini-grid deployment for Energy Access.
TANESCO (Tanzania Electric Supply Company Limited). 1983. Power for the People. Dar es Salaam.
TaTEDO (Tanzania Traditional Energy Development Organization). 2006. 10 kW Pico Hydroelectric Plant in Kinko Village. Project Report. Dar es Salaam.
TaTEDO 2007. “70 kW Micro Hydroelectric Plant in Zege Village.” Business Plan. Dar es Salaam.
TaTEDO (Tanzania Traditional Energy Development Organization), and Hivos (Humanist Institute for Cooperation with Developing Countries). 2014. Presentation of Multi-functional Platform Project Report to the European Delegation, November 11, Dar es Salaam.
Tenenbaum, B., C. Greacen, T. Siyambalapitiya, and K. James. 2014. From the Bottom Up: How Small Power Producers and Mini-Grids Can Deliver Electrification and Renewable Energy in Africa. Washington, DC: World Bank.
Triodos Facet B.V. 2012. Toolkit on the Appraisal of Small Renewable Energy Projects: Tanzania Case Study. Report submitted to the World Bank and the Rural Energy Agency of Tanzania. Bunnik, the Netherlands.
Tsakhara, P. 2015. Presentation at the Tanzanian Solar PV-Hybrid Workshop, Berlin, March 16.
UN (United Nations). 2015a. Sustainable Energy for All (SE4ALL), Universal Energy Access. http://www.se4all.org.
UN. 2015b. World Population Prospects: The 2015 Revision, Key Findings and Advance Tables. New York: Department of Economic and Social Affairs, Population Division. https://esa.un.org/unpd/wpp/publications/files/key_findings_wpp_2015.pdf.
UNIDO (United Nations Industrial Development Organization), and ICSHP (International Center on Small Hydro Power). 2013. World Small Hydropower Development Report. Vienna and Hangzhou, China.
URT (United Republic of Tanzania), 2014. National Electrification Program Prospectus. Reported prepared by Innovation Energie Developpement, funded by Norwegian Agency for Development Cooperation Dar es Salaam.
URT. 2003. The National Energy Policy 2003. Ministry of Energy and Minerals, Dar es Salaam.
URT. 2005. The Rural Energy Act, 2005. Ministry of Energy and Minerals, Dar es Salaam.
URT. 2012. National Climate Change Strategy. Division of the Environment, Vice President’s Office, Dar es Salaam.
URT. 2013. Scaling Up Renewable Energy Program (SREP) Investment Plan for Tanzania. Report submitted to the SREP (Scaling Up Renewable Energy in Low-Income Countries Program) Sub-Committee, Strategic Climate Funds, Climate Investment Funds, World Bank, Washington, DC.
URT. 2015a. Draft National Energy Policy 2015. Ministry of Energy and Minerals, Dar es Salaam.
URT. 2015b. Tanzania’s SE4ALL Investment Prospectus. Draft. Ministry of Energy and Minerals, funded by the United Nations Development Programme (UNDP), Dar es Salaam.
Venugopal, S., and A. Srivastava. 2012. “Moving the Fulcrum: A Primer on Public Climate Financing Instruments Used to Leverage Private Capital.” Working Paper. Washington, DC: World Resources Institute.
Water and Land Centre Consult Company Ltd. 2015. JUMEME Environmental and Social Impact Assessment Report for the Hybrid Solar-Diesel Mini-Grid System Project (Cluster 1) on Ukara Island in Ukara Division, Ukerewe District, Mwanza Region, Tanzania. Dar es Salaam.
World Bank. 2015. Quality Assurance for Off-Grid Solar Home Systems: A Comparison of Strategies Employed by Lighting Global and the Bangladesh IDCOL Solar Home System Program. Washington, DC. https://www.lightingglobal.org/wp-content/uploads/2014/12/SHS-QA-Comparison-LightingGlobal-and-IDCOL.pdf.

99Accelerating Mini-Grid Deployment in Sub-Saharan Africa: Lessons from Tanzania
ENDNOTES1. LUMAMA was named after the original villages connected to
the mini-grid: Lupande, Madunda, and Mawengi. Seven other villages (Kiwe, Lufumbo, Madindu, Mapogoro, Mavala, Mdete, and Milo) have since have been connected.
2. World Bank Country Profile: Tanzania (http://www.worldbank.org/en/country/tanzania/overview, accessed June 30, 2016); World Bank, Global Poverty Working Group, 2011 data (http://data.worldbank.org/indicator/SI.POV.NAHC?locations=TZ)
3. IEA estimated a compound average annual growth rate of 6.6 percent for Mozambique and Tanzania. It did not disaggregate the two countries.
4. The Electricity Act 2014, the Electricity (Development of Small Power Projects) Rules, Supplement No. 14, Subsidiary Legislation.
5. “Status of Implementation of Rural Energy Projects in Tanzania,” press release, Rural Energy Agency. July 28, 2015.
6. Mobile and independent containerized systems are designed for use in remote locations. All system components (inverters, battery, charge controller, electric panels) are secured inside the container. The solar array can be installed on the container roof, avoiding the need for construction. Six villages in Tanzania received one containerized system each and four villages received two containerized systems each.
7. A gasifier is a plant consisting of an internal combustion engine (petrol/gasoline or diesel) fueled by gas that is generated by partial combustion of fuel (gasification), sometimes called producer gas or syngas.
8. A 6 MW mine mouth coal-fired plant at Kiwira is no longer operational.
9. Plant availability refers to the proportion of the year during which the plant is in operational condition and the fuel, spare parts, and staff to operate it are available.
10. Cavitations are phase changes that occur from pressure changes in a fluid that form bubbles, resulting in noise or vibration in the water column. The implosion of these bubbles against a solid surface, such as a hydraulic turbine, may cause erosion and lead to reductions in capacity and efficiency pressure. The parameters to control cavitation are pressure head, flow rate, and exit pressure of the liquid.
11. Information on the number of customers served via their own residential distribution networks was not available to the study team.
12. Southern Paper Mills at Mufindi has installed the largest biomass steam turbine plant in the country, with a capacity of 35 MW, but it is not operating, because of a fuel shortage.
13. Jatropha curcus is a species of flowering shrub whose seeds can be converted to oil for use as a diesel substitute.
14. Hivos is an international organization that seeks new solutions to persistent global issues. It is active in 33 countries in Africa, Asia, and Latin America.
15. One MFP at Nyakagomba Geita is a hybrid SVO/diesel and biomass gasifier.
16. Personal communication with engineer James Ngeleja of the National Environment Management Council (NEMC), January 25, 2016.
17. Solar homes systems have been used in rural areas to power schools, dispensaries, border posts, and single homes for years. They supply single buildings.
18. The Rift Valley Energy Company, which owns and operates a 4 MW hydro mini-grid in Mwenga, is considering installing a 10 MW wind converter that will supplement hydro mini-grid power during the dry season when river flows are low (personal communication with engineer Joel Azaria Gomba, February 22, 2016).
19. Avoided costs are the marginal costs (financial, social, and economic) a bulk power purchaser avoids by buying power (typically renewable) from a producer rather than generating the power itself from conventional sources. In Tanzania avoided costs are defined as the costs TANESCO avoids by purchasing power from an SPP as opposed to an independent power producer or generating from conventional sources (Tenenbaum et al. 2014).
20. Service charges in Tanzania refer to fees charged to customers for maintenance services, which include installation testing, meter test fees, and reconnection fees, among others. These charges cover the costs incurred by the electricity supplier for meter reading, billing, and related costs.
21. A demand charge, often expressed in price per kVA/month, is typically set according to the highest metered magnitude of electrical power used by the customer in a month. TANESCO customers in categories T2, T3a, and T3b pay demand charges as part of their monthly electricity bill (see table 4.5).

WRI.org 100
22. The 13 solar installations are a donor-funded demonstration project. Although they represent a very important step, their installed capacity is very small.
23. The tea factory is owned by Rift valley Company and is a distribution network operator customer.
24. Regional or provincial towns can be cities, municipalities or towns depending on the population, area covered, business status and other considerations.
25. Rural Energy Agency, “The Rural Energy Fund” (http://www.rea.go.tz/Projects/TheRuralEnergyFund/tabid/150/Default.aspx, accessed November 11, 2016).
26. The value of the Tanzanian shilling fell sharply against the U.S. dollar during this period.
27. A green mini-grid is a small renewable electrical generation and distribution network. The energy source can be mini/small hydro, biomass, solar, wind, geothermal, tidal and ocean wave power, or a hybrid system. The mini-grid can be isolated or connected to the national grid.
28. IDCOL is a government-owned financial institution that channels international capital to the renewable energy sector in Bangladesh.
29. For the purposes of these goals, Tanzania defines electricity access as connections (or the eequivalent for solar home systems, distributed power or non-metered mini-grids) as per the Multitier framework approach under the Global Tracking Framework (URT 2015c).
30. Under the 2008 framework, mini-grids that produced less than 1 MW of electricity were not required to be registered. There may therefore be other small mini-grids in Tanzania.
31. In June 2017, EWURA formerly released the third-generation small power producer framework.

101Accelerating Mini-Grid Deployment in Sub-Saharan Africa: Lessons from Tanzania
ACKNOWLEDGMENTSWe are pleased to acknowledge our institutional strategic partners, who provide core funding to WRI: Netherlands Ministry of Foreign Affairs, Royal Danish Ministry of Foreign Affairs, and Swedish International Development Cooperation Agency.
The authors would like to thank the many people who contributed thoughtful discussions and ideas that helped shape this report. We are particularly grateful to the staff of MEM, EWURA, TANESCO, NEMC, REA, World Bank and SIDA, Development Partners and mini-grid owners and operators in Tanzania for sharing their experiences and providing primary and secondary data for this report.
We gratefully acknowledge those who put time into reviewing drafts of the report and providing valuable feedback. Internal reviewers included Giulia Christianson, Sarah Martin, Peter Ndunda and Amala Devi. Exter-nal reviewers included Jeremy Foster (USAID), Kristine Bos (Mathemat-ica Policy Research), Duncan Chaplin (Mathematica Policy Research) Sanjoy Sanyal (formerly of New Ventures, India), Subodh Mathur (World Bank), Lennart Bangens (Chalmers University, Sweden) and Zeph Kivungi (formerly of HIVOS Nairobi regional office). We acknowledge the valuable insights of Richard Hosier of the World Bank. We are also grate-ful to Laura Malaguzzi Valeri of WRI for her guidance and support.
We would like to thank Andres Chamorro, Mimi Gong and Nara McCray for developing the maps for the report. We appreciate the assistance of Carin Hall, Carni Klirs and Daniel Melling with the publication process. Special thanks to Emily Matthews for substantive editing of initial drafts of the report and Barbara Karni for the final copyediting.
We gratefully acknowledge the Charles Stewart Mott Foundation for pro-viding financial support for the research that forms the foundation of this report. For more than four decades, the Mott Foundation’s Environment Program has supported stewardship of the world’s natural resources.
The production of this report was made possible by the financial support of the Energy Sector Management Assistance Program (ESMAP). ESMAP―a global knowledge and technical assistance program administered by the World Bank―assists low- and middle-income countries to increase their know-how and institutional capacity to achieve environmentally sustainable energy solutions for poverty reduction and economic growth. ESMAP is funded by Australia, Austria, Denmark, the European Commission, Finland, France, Germany, Iceland, Japan, Lithuania, Luxembourg, the Netherlands, Norway, the Rockefeller Foundation, Sweden, Switzerland, the United Kingdom, and the World Bank. ESMAP’s Global Facility on Mini Grids aims to accelerate mini grid expansion for low cost and timely access to electricity services in Sub-Saharan Africa, South and East Asia, and Small Island Developing States.

WRI.org 102
PHOTO CREDITS Cover photo TaTEDO; table of contents TaTEDO; foreword Matthieu Young/USAID; preface PRI’s The World; pg 4 Pierre-Yves Lablanche; pg 10 (left) Nikolaj F. Rasmussen; pg. 11 (left), 18 Russell Watkins/DFID; pg 11 (right) TaTEDO; pg 12 fabulousfabs; pg 14 (left) TaTEDO; pg 14 (right) TaTEDO; pg 17 jbdodane/Flickr; pg 28 P. Feiereisen; pg 38 SuSanA Secretariat; pg 51 Charles B. Niwagaba; pg 52 Brian Harries; pg 64 The Energy and Environment Partnership; pg 72 (left) TaTEDO; pg 72 (right) neiljs; pg 77 C. Rieck; pg 78 Frank Douwes; pg 81 John Hogg; pg. 82 Practical Action; pg 84 C. Rieck; pg 93 chmoss.
ABOUT WRIWorld Resources Institute is a global research organization that turns big ideas into action at the nexus of environment, economic opportunity and human well-being.
Our ChallengeNatural resources are at the foundation of economic opportunity and human well-being. But today, we are depleting Earth’s resources at rates that are not sustainable, endangering economies and people’s lives. People depend on clean water, fertile land, healthy forests, and a stable climate. Livable cities and clean energy are essential for a sustainable planet. We must address these urgent, global challenges this decade.
Our VisionWe envision an equitable and prosperous planet driven by the wise management of natural resources. We aspire to create a world where the actions of government, business, and communities combine to eliminate poverty and sustain the natural environment for all people.
Our Approach
COUNT ITWe start with data. We conduct independent research and draw on the latest technology to develop new insights and recommendations. Our rigorous analysis identifies risks, unveils opportunities, and informs smart strategies. We focus our efforts on influential and emerging economies where the future of sustainability will be determined.
CHANGE ITWe use our research to influence government policies, business strategies, and civil society action. We test projects with communities, companies, and government agencies to build a strong evidence base. Then, we work with partners to deliver change on the ground that alleviates poverty and strengthens society. We hold ourselves accountable to ensure our outcomes will be bold and enduring.
SCALE ITWe don’t think small. Once tested, we work with partners to adopt and expand our efforts regionally and globally. We engage with decision-makers to carry out our ideas and elevate our impact. We measure success through government and business actions that improve people’s lives and sustain a healthy environment.
ABOUT THE AUTHORSLily Odarno is an Associate with WRI’s energy Program.Contact: [email protected]
Estomih Sawe is the Executive Director of TaTEDO.Contact: [email protected]/[email protected]
Mary Swai is the Energy and Climate Change Program Manager of TaTEDOContact: [email protected]/[email protected]
Maneno J.J. Katyega is a Senior Adviser with TaTEDO.Contact: [email protected]
Allison Lee is a former Research Analyst with WRI’s Finance Center.Contact: [email protected]
ABOUT TaTEDOTanzania Traditional Energy Development Organization (TaTEDO) is a sustainable energy development organization based in Dar es salaam, Tanzania with zonal offices in Shinyanga and Moshi towns, implementing activities in more than 10 regions, 30 districts, and 70 villages in Tanzania. The organization has more than 20 years of experience actively involved in sustainable energy development projects and programs in rural areas. It is also hosting national and regional networks and is affiliated to several local and international sustainable energy development partners and networks. In this regard, TaTEDO executes its work based on the experience and knowledge drawn from such networks and partners at local, national, and international levels.

103Accelerating Mini-Grid Deployment in Sub-Saharan Africa: Lessons from Tanzania
Copyright 2017 World Resources Institute. This work is licensed under the Creative Commons Attribution 4.0 International License. To view a copy of the license, visit http://creativecommons.org/licenses/by/4.0/
Each World Resources Institute report represents a timely, scholarly treatment of a subject of public concern. WRI takes responsibility for choosing the study topics and guaranteeing its authors and researchers freedom of inquiry. It also solicits and responds to the guidance of advisory panels and expert reviewers. Unless otherwise stated, however, all the interpretation and findings set forth in WRI publications are those of the authors.
Maps are for illustrative purposes and do not imply the expression of any opinion on the part of WRI, concerning the legal status of any country or territory or concerning the delimitation of frontiers or boundaries.

WRI.org 104
10 G STREET NE SUITE 800WASHINGTON, DC 20002, USA+1 (202) 729-7600WWW.WRI.ORG ISBN 978-1-56973-923-5