public expose 2014 - chandra asri petrochemical · continue the feasibility study of the...
TRANSCRIPT

Public Expose 2015
PT Chandra Asri Petrochemical Tbk Jakarta, 8 June 2015

1. Company Profile
2. Operational & Financial Performance
3. Business Strategy
4. Cracker Expansion Updates
2

Company Profile (“CAP”)
The largest integrated producer of Olefins and Polyolefins in Indonesia.
Producing plastic raw materials and chemicals used in a variety of everyday consumer products (packaging, pipes, jerry cans, automotive, electronics, shoes, etc.).
Owns the only Naphtha Cracker, Styrene Monomer, and Butadiene plant in Indonesia.
One of two producers of Propylene (320KTA) & Polyethylene (336KTA) in Indonesia.
Sole producer of Ethylene (600KTA); and the largest Polypropylene producer (480KTA) in Indonesia.
Strategic/adjacent plant location with customers in the industrial estate of Cilegon-Merak.
Operates 3 Jetty with capacity of DWT 6K, 10K, and 80K within the plant complex to facilitate logistics.
Majority Shareholders, Barito Pacific Grup* (65.2%) and SCG Chemicals (30.5%) per 30 April 2015.
Integrated Petrochemical Complex
Styrene Monomer Plant Butadiene Plant
Naphtha Cracker Polypropylene Plant
Notes: (*) Including the ownership of Marigold Resources and Magna Resources. KTA: Kilo tonnes per annum; DWT: Dead-weight ton
1. Company Profile 2. Operational & Financial Performance 4. Cracker Expansion Updates
3. Business Strategy
3

Integrated Business Operations “Integrated business operations from upstream to downstream resulting in higher efficiency, lower costs, and value-added”.
New Generation Synthetic Rubber
Polypropylene Polyethylene
Styrene Monomer
Up
stre
am
Pe
tro
che
mic
al
Ethylene Propylene Py-Gas Mixed C4
Mid
stre
am
Pe
tro
chem
ical
Oil
& G
as
CAP Products Future products by SRI
Crude Oil
Diesel Kerosene Gasoline
Refinery
Naphtha Cracker
Naphtha LPG
Raffinate - 1 Butadiene
Condensate
CAP Facility Legend:
1. Company Profile 2. Operational & Financial Performance 4. Cracker Expansion Updates
3. Business Strategy
4

Integrated Business Operations (cont’d)
Notes: (1) LLDPE: Linear Low Density Polyethylene (2) HDPE: High Density Polyethylene
Homopolymer
Random
Copolymer
Impact (Block) Copolymer
Ethylene
Key Products Plant Main Process Key Markets
330 KTPA
600 KTPA
170 KTPA
100 KTPA
Propylene
320 KTPA
Py-Gas
280 KTPA
Crude C4
220 KTPA
Domestic
Export
Domestic
Domestic
Export
Export
Domestic
Export
Domestic
Naphtha Cracker
licensed by Lummus and
KBR. Polypropylene
W.R. Grace
480 KTPA
Styrene Monomer
Licensed by Mobil-Badger and Lummus
340 KTPA
LLDPE(1)
HDPE(2)
Polyethylene
Licensed by Univation
336 KTPA
Naphtha
1,700 KTPA
Butadiene
BASF/Lummus
100 KTPA
Improved margins along the integration of the production value chain
1. Company Profile 2. Operational & Financial Performance 4. Cracker Expansion Updates
3. Business Strategy
5

Strategic Location
“Adjacent and interlinked with
customer’s facilities (45 km Ethylene
pipeline)”.
1. Company Profile 2. Operational & Financial Performance 4. Cracker Expansion Updates
3. Business Strategy
6

1. Company Profile
2. Operational & Financial Performance
3. Business Strategy
4. Cracker Expansion Updates
7

78
89
99 94
74
2011 2012 2013 2014 1Q-2015
Ethylene
Plant Utilization Rate
Polyethylene, Polypropylene, Styrene Monomer, Butadiene
89
100 94 93 89 90
96 95 99 100
90 89 95
74
62
76 76 76 79
65
2011 2012 2013 2014 1Q-2015
Polyethylene Polypropylene Styrene Monomer Butadiene
Decrease in utilization rate particularly Ethylene was due to shutdowns that occurred during the period of 2014 and 1Q-2015.
Management will perform a Turn-Around Maintenance (TAM) namely routine maintenance to improve plant performance reliability in August-November this year.
TAM activity will be performed together with the Tie-in process in the framework of the completion of naphtha cracker expansion project.
1. Company Profile
2. Operational & Financial Performance 4. Cracker Expansion Updates
3. Business Strategy
8
(in %)

201
23
207
79
321
471
319
51
189
32
198
-
314
472
257
187
19 5
28 35
74
124
50
13
2013 2014 1Q-2015
596
325
212 216
317
458
322
58
561
296
181 185
311
477
250
179
109
59 38 36
74
118
52 16
2013 2014 1Q-2015
Production Volume Sales Volume
(in KT)
2013: 2,504 KT 2014: 2,440 KT 1Q-2015: 502 KT
2013: 1,672 KT 2014: 1,649 KT 1Q-2015: 348 KT
Notes: Butadiene plant first operate since September 2013.
1. Company Profile
2. Operational & Financial Performance 4. Cracker Expansion Updates
3. Business Strategy
9

1. Company Profile
2. Operational & Financial Performance 4. Cracker Expansion Updates
3. Business Strategy
Financial Highlights: Financial Position
31-Mar-2015 (US$ ‘000)
31-Dec-2014 (US$ ‘000)
Changes (%)
31-Dec-2013 (US$ ‘000)
Changes Yoy (%)
Cash and cash equivalents 182,159 207,939 -12.4 241,873 -14.0
Current Assets (exclude Cash and cash equivalents)
427,856 458,495 -6.7 569,810 -19.5
Non Current Assets 1,263,323 1,257,076 0.5 1,095,755 14.7
TOTAL ASSETS 1,873,338 1,923,510 -2.6 1,907,438 0.8
Current Liabilities 408,101 477,912 -14.6 617,699 -22.6
Non Current Liabilities 593,140 576,350 2.9 434,416 32.7
Equity 872,097 869,248 0.3 855,323 1.6
TOTAL LIABILITIES AND EQUITY 1,873,338 1,923,510 -2.6 1,907,438 0.8
10

Financial Highlights: Comprehensive Income
3M-2015 (US$ ‘000)
3M-2014 (US$ ‘000)
Changes (%)
FY-2014 (US$ ‘000)
FY-2013 (US$ ‘000)
Changes (%)
Net Revenues 357,933 641,726 -44.2 2,460,051 2,506,414 -1.8
Cost of Revenues 341,186 621,122 -45.1 2,342,587 2,408,370 -2.7
Gross Profit 16,747 20,604 -18.7 117,464 98,044 19.8
Operating Profit (Loss) (0,531) 3,124 -117.0 50,079 31,317 59.9
Profit (Loss) For The Year 2,849 487 485.0 18,246 11,030 65.4
EBITDA 31,299 25,936 20.7 133,762 107,180 24.8
Gross Profit Margin (%) 4.7 3.2 4.8 3.9
Operating Profit Margin (%) -0.1 0.5 2.0 1.2
Net Profit Margin (%) 0.8 0.1 0.7 0.4
EBITDA Margin (%) 8.7 4.0 5.4 4.3
1. Company Profile
2. Operational & Financial Performance 4. Cracker Expansion Updates
3. Business Strategy
11

Diverse Product Portfolio
Olefins Polyolefins Butadiene Styrene Monomer
Ethylene
Py-Gas
Propylene
Mixed C4 Polypropylene
Polyethylene
Established PT Synthetic Rubber Indonesia, JV between SMI and Michelin, to build Styrene Butadiene Rubber plant.
Net Revenues US$1,303 million
Net Revenues US$514 million
Net Revenues US$419 million
Net Revenues US$219 million
53% 21% 17%
Net Revenues FY-2014: US$2,460 million (100%)
9%
1. Company Profile
2. Operational & Financial Performance 4. Cracker Expansion Updates
3. Business Strategy
12

Net Revenues (million US$) & Gross Profit Margin (%)
2,506
2,460
3.9%
4.8%
0.0%
1.0%
2.0%
3.0%
4.0%
5.0%
6.0%
2,400
2,450
2,500
2,550
2013 2014
642
358 3.2%
4.7%
0.0%
1.0%
2.0%
3.0%
4.0%
5.0%
-
100
200
300
400
500
600
700
1Q-2014 1Q-2015
11
18
0.4%
0.7%
0.2%
0.3%
0.4%
0.5%
0.6%
0.7%
0.8%
0
4
8
12
16
20
2013 2014
Net Profit (million US$) & Net Profit Margin (%)
0.5
2.8
0.1%
0.8%
0.0%
0.2%
0.4%
0.6%
0.8%
1.0%
-
1.0
2.0
3.0
1Q-2014 1Q-2015
Financial Performance
1. Company Profile
2. Operational & Financial Performance 4. Cracker Expansion Updates
3. Business Strategy
13

1. Company Profile
2. Operational & Financial Performance
3. Business Strategy
4. Cracker Expansion Updates
14

1. Company Profile
2. Operational & Financial Performance 4. Cracker Expansion Updates 3. Business Strategy
Business Prospects
Ethylene Price Spreads Over Naphtha
"Profitability continued in line with the global economic recovery and improving demand for petrochemical products in 2015. In the medium term, profitability is likely to be stable in 2018-2019."
Source: Nexant, March 2015
15

1. Complete the naphtha cracker expansion project by ensuring the Tie-in process, the process of integrating the new naphtha cracker facility with the existing, to run smoothly and on schedule in August-November 2015.
2. Perform routine maintenance activity/Turn-Around Maintenance (TAM) of plant facilities to improve plant performance reliability to function optimally.
3. FID finalization of the construction of Styrene Butadiene Rubber (SBR) plant in the near term. SBR plant construction will start immediately with a production target/on-stream in 2017/2018.
4. Continue the Feasibility Study of the development of condensate splitter (mini refinery). This project will process 100 thousand barrels/day of condensate into naphtha, gas oil, jet fuel, diesel. With this project is expected to reduce the reliance on imported raw materials.
5. Perform energy cost reduction initiatives as well as the optimization of human capital through human resource development program based on competency.
2015 Key Strategic Initiatives
1. Company Profile
2. Operational & Financial Performance 4. Cracker Expansion Updates 3. Business Strategy
16

1. Company Profile
2. Operational & Financial Performance
3. Business Strategy
4. Cracker Expansion Updates
17
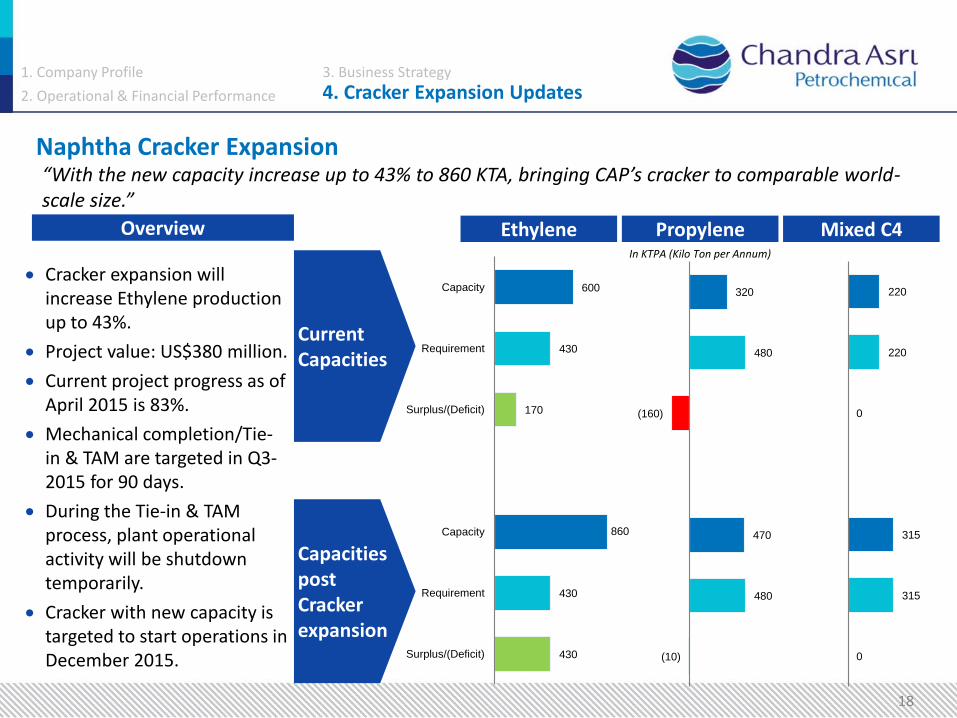
600
430
170
860
430
430
Capacity
Requirement
Surplus/(Deficit)
Capacity
Requirement
Surplus/(Deficit)
Overview
Cracker expansion will increase Ethylene production up to 43%.
Project value: US$380 million.
Current project progress as of April 2015 is 83%.
Mechanical completion/Tie-in & TAM are targeted in Q3-2015 for 90 days.
During the Tie-in & TAM process, plant operational activity will be shutdown temporarily.
Cracker with new capacity is targeted to start operations in December 2015.
Current Capacities
Capacities post Cracker expansion
Ethylene Propylene Mixed C4
18
320
480
(160)
470
480
(10)
220
220
0
315
315
0
In KTPA (Kilo Ton per Annum)
Naphtha Cracker Expansion “With the new capacity increase up to 43% to 860 KTA, bringing CAP’s cracker to comparable world-scale size.”
1. Company Profile
2. Operational & Financial Performance 4. Cracker Expansion Updates 3. Business Strategy

Naphtha Cracker Project Area Naphtha Cracker Project Area
1. Company Profile
2. Operational & Financial Performance 4. Cracker Expansion Updates 3. Business Strategy
19
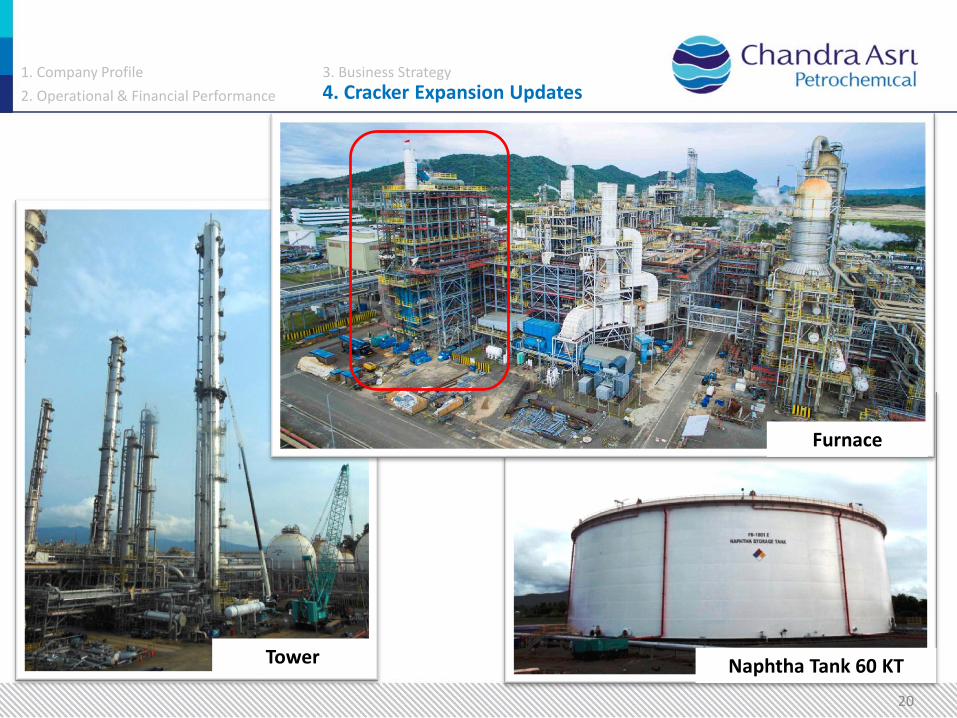
Naphtha Tank 60 KT
Furnace
Tower
1. Company Profile
2. Operational & Financial Performance 4. Cracker Expansion Updates 3. Business Strategy
20
Thank You
Disclaimer: Important Notice • This document was prepared solely and exclusively for the parties presently being invited for the purpose of discussion. Neither this document nor any
of its content may be reproduced, disclosed or used without the prior written consent of PT Chandra Asri Petrochemical Tbk. • This document may contain statements that convey future oriented expectations which represent the Company’s present views on the probable future
events and financial plans. Such views are presented on the basis of current assumptions, are exposed to various risks and are subject to considerable changes at any time. Presented assumptions are presumed correct, and based on the data available on the date, which this document is assembled. The company warrants no assurance that such outlook will, in part of as a whole, eventually be materialized. Actual results may diverge significantly from those projected. The information in this document is subject to change without notice, its accuracy is not verified or guaranteed, it may be incomplete or condensed and it may not contain all material information concerning the Company.
• None of the Company, PT Chandra Asri Petrochemical Tbk or any person connected with any of them accepts any liability whatsoever for any loss howsoever arising from any use of this document or its contents or otherwise arising in connection therewith.
Address: PT Chandra Asri Petrochemical Tbk Wisma Barito Pacific Tower A, Lt. 7 Jl. Let. Jend. S. Parman Kav. 62-63 Jakarta 11410
Contact: Investor Relations Email: [email protected] Tel: +62 21 530 7950 Fax: +62 21 530 8930
Visit our website at www.chandra-asri.com