public transportation’s role in responding to climate change · pdf filepublic...
TRANSCRIPT

Public Transportation’s Role in Responding to Climate Change
The Federal Transit Administration (FTA) collects and analyzes data from across the country on public trans-portation fuel use, vehicles deployed, rides taken, and other key metrics. These data, taken from the Na-tional Transit Database and combined with information from the U.S. Department of Energy and the U.S. Environmental Protection Agency, provides valuable insight into the impacts of automobile, truck, SUV, and public transportation travel on the production of greenhouse gas emissions. National level data show significant greenhouse gas emission savings by use of public transportation, which offers a low emissions alternative to driving. This paper presents an analysis of the data and frames it in a broader context. It concludes with a description of FTA actions that address climate change.
Based on an examination of FTA’s data and other academic, government, and industry sources, public transportation can reduce greenhouse gas emissions by:
• Providing a low emissions alternative to driving. • Facilitating compact land use, reducing the need to travel long distances. • Minimizing the carbon footprint of transit operations and construction.
Greenhouse Gas Sources: Vehicles and Carbon Dioxide
Carbon dioxide makes up 95% of all transportation-related greenhouse gas emissions. Cars, SUVs, and pickup trucks running on conventional gasoline, diesel, and other fuels emit carbon dioxide. Combined, these vehicles account for roughly two-thirds of transportation-related emissions, (see fig. 1) ranking transportation as the second largest source of total U.S. greenhouse gas emissions.
The Nobel Prize winning 2007 Intergovernmental Panel on Climate Change report concluded that green-house gas emissions must be reduced by 50% to 85% by 2050 in order to limit global warming to four degrees Fahrenheit, thereby avoiding many of the worst impacts of climate change.
Reducing greenhouse gas emissions from transportation will likely require a broad range of strategies, including increasing vehicle efficiency, lowering the carbon content of fuels, and reducing vehicle miles of travel. Public transportation can be one part of the solution.
U.S. Department of TransportationFederal Transit Administration
FIGURE 1 Transportation Accounts For 29% of U.S. Greenhouse Gas Emissions.
Source: U.S. Environmental Pro-tection Agency, Inventory of Greenhouse Gas Emis-sions and Sinks: 1990-2007, April 2009.
CARS, SUVs,AND PICKUPS
FREIGHTTRUCKS
AIRLINES
OTHER
6%
5%
TRANSPORTATIONELECTRICPOWER
INDUSTRY
INDUSTRY
33%
19%
1%
COMMERCIAL
RESIDENTIAL
AGRICULTURAL
U.S. TERRITORIES
UPDATED JANUARY 2010
29%
7%
57%20%
12%10%
1

Public Transportation Produces Lower Greenhouse Gas Emissions than Autos
National averages demonstrate that public trans-portation produces significantly lower greenhouse gas emissions per passenger mile than private ve-hicles (see Figure 2).1 Leading the way is heavy rail transit, such as subways and metros, which produce 76% less in greenhouse gas emissions per passen-ger mile than an average single-occupancy vehicle (SOV). Light rail systems produce 62% less and bus transit produces 33% less.2
Estimates are calculated from fuel usage and pas-senger mile data in the 2008 National Transit Data-base, standard emissions factors for different fuels are from the U.S. Department of Energy, and sub-re-gional electricity emissions factors are from the U.S. Environmental Protection Agency (see Appendix II: Methodology).
The environmental benefits of public transporta-tion vary based on the number of passengers per vehicle, the efficiency of the bus or train, and the type of fuel used (see Appendix I for estimates for transit agencies across the country).
The number of riders greatly impacts transit’s emissions savings.
The more passengers that are riding a bus or train, the lower the emissions per passenger mile. For in-
stance, U.S. bus transit, which has about a quarter (28%) of its seats occupied on average, emits an es-timated 33% lower greenhouse gas emissions per passenger mile than the average U.S. single occu-pancy vehicle. The savings increases to 82% for a typical diesel transit bus when it is full with 40 pas-sengers (see Figure 3).
What Individuals Can Do to Reduce their Carbon Footprint
Switching to riding public transportation is one of the most effective actions individuals can take to reduce their carbon footprint.
Car transportation alone accounts for 47% of the carbon foot-print of a typical American family with two cars—by far the largest source of household emissions and, as such, the larg-est target for potential reductions. (a) The average passenger car in the U.S. produces just under 1 pound of carbon dioxide per mile traveled.
If just one driver per household switched to taking public transportation for a daily commute of 10 miles each way, this would save 4,627 pounds of carbon dioxide per household per year—equivalent to an 8.1% reduction in the annual car-bon footprint of a typical American household. This benefit has a greater impact than other actions, such as replacing light bulbs with compact fluorescents (a 1.6% reduction based on 20 out of 25 light bulbs change) or adding R-40 insulation to a home attic (a 1.2% reduction). (b) Visit FTA’s carbon calculator at www.fta.dot.gov/sustainability to estimate how much you can reduce your carbon footprint by switching to public transportation.
(a) Godo Stoyke, The Carbon Buster’s Home Energy Handbook, 2007, pp22-23. (b) The Carbon Buster’s Home Energy Handbook, 2007, pp22-23
FIGURE 2 Estimated CO2 Emissions per Passenger Mile for Transit and Private Autos Source:See Appendix II for data sources and methodology.
The average passenger car in the United States produces just under one pound of carbon dioxide per mile traveled.
0.22
PrivateAuto
(SOV)
BusTransit
Heavy RailTransit
Light Rail Transit
CommuterRail
Van Pool Transit Average
Poun
ds C
O2 p
er P
asse
nger
Mile
0.330.36
0.22
0.64
0.96
0.45
bus transit
heavy rail
light ra
il
commuter rail
van pool
Average OccupancyFull Seats
0.85
0.96
0.59
0.24
0.64
0.180.23
0.11
0.36
0.14
0.33
0.10
0.22
0.12
AUTO PUBLIC TRANSPORTATION
SOV trip
trip to
work
general trip
4 person ca
rpool
2

With these data in mind, when expanding transit service as a greenhouse gas reduction strategy, communities would likely want to ensure that pas-senger loads are sufficient to achieve efficiencies over the alternative of driving.3 For example, the average 40-passenger diesel bus must carry a mini-mum of 7 passengers on board to be more efficient than the average single-occupancy vehicle. Simi-larly, the average heavy rail car would need to have at least 19% of seats full to exceed the efficiency of an automobile carrying an average passenger load.
quent stops in denser urban areas). In terms of ve-hicle efficiency for instance, many transit agencies are replacing older diesel buses with new hybrid-electric buses, which consume 15% to 40% less fuel, and consequently produce 15% to 40% fewer car-bon dioxide emissions.
Taking lifecycle emissions into account also shows emissions savings from transit.
Transit-based greenhouse gas emissions per pas-senger mile are significantly lower than those from driving, even taking into account emissions from construction, manufacture, and maintenance.
FIGURE 3 Estimated CO2 Emis-sions per Passenger Mile for Average and Full Occupancy
Sources: See Appendix II for data sources and methodology. Notes: The average number of passengers for private auto trips is 1.14 for work trips and 1.63 for general trips.
Power sources and vehicle efficiency also impact transit’s emissions.
Most rail transit systems are powered by electricity. Those relying on electricity from a low emissions source, such as hydroelectric, not surprisingly, have much lower emissions than those relying on elec-tricity from coal power plants. (See Appendix I for emissions factors). Rail vehicles also vary in terms of energy efficiency due to weight and engineering factors.
Emissions from bus systems vary due to the use of low carbon fuels, more energy efficient vehicles, and different operating environments (such as fre-
Life cycle emissions include a full accounting of all emissions generated over the full life of a trans-portation system. This includes emissions from building the highway or rail system, manufactur-ing the vehicles, maintaining the infrastructure and vehicles, producing and using the fuel, and eventually disposing of the vehicles and infrastruc-ture. The previous graphs only showed tailpipe emissions, or solely the emissions from burning fuel or generating electricity to move a vehicle.
Researchers at the University of California at Berkeley have developed a methodology for measuring life
bus transit
heavy rail
light ra
il
commuter rail
van pool
Average OccupancyFull Seats
0.85
0.96
0.59
0.24
0.64
0.180.23
0.11
0.36
0.14
0.33
0.10
0.22
0.12
AUTO PUBLIC TRANSPORTATION
SOV trip
trip to
work
general trip
4 person ca
rpool
3

cycle greenhouse gas emissions from cars and pub-lic transportation (see Figure 4).4 As transit systems vary greatly, the researchers chose a handful of sys-tems, including the San Francisco Bay Area’s heavy rail BART system and light rail Muni system, Califor-nia’s commuter rail system Caltrain, and Boston’s light rail Green Line. In a second study, they added analysis of New York City’s subway, the PATH system serving New York and New Jersey, and Chicago’s “L” and commuter rail. The researchers found that in-cluding full life cycle greenhouse gas emissions in-creased estimates by as much as 70% for autos, 40% for buses, 150% for light rail, and 120% for heavy rail.
While including emissions from construction of infrastructure has a larger impact on rail transit
from 120 to 230 grams, still offering a 55% and 62% savings over sedan and SUV travel, respectively.
Public Transportation Facilitates Compact Land Use, Which Plays a Role in Greenhouse Gas
Reductions
Public transportation reduces emissions by facilitat-ing higher density development, which conserves land and decreases the distances people need to travel to reach destinations. In many cases, higher density development would be more difficult with-out the existence of public transportation because more land would need to be devoted to parking and travel lanes. By facilitating higher density develop-ment, public transportation can shrink the footprint
than on automobiles, the results still show signifi-cant emissions savings from average occupancy rail and bus transit over average occupancy se-dans, SUVs, and pickups.5 The researchers found that including greenhouse gas emissions from construction and maintenance of the BART heavy rail transit system increases estimated green-house gas emissions per passenger mile from 64 grams to 140 grams, but that this still represents a 63% and 69% savings over travel by sedan and SUV, respectively. Similarly, emissions per passen-ger mile on Boston’s light rail Green Line increase
of an urban area and reduce overall trip lengths. In addition, public transportation supports increased foot traffic, street-level retail, and mixed land uses that enable a shift from driving to walking and bik-ing. Public transportation can also facilitate trip chaining, such as combining dry-cleaning pick-up, shopping, and other errands on the way home from a station. Finally, households living close to public transportation tend to own fewer cars on average, as they may not need a car for commuting and oth-er trips. A reduced number of cars per household tends to lead to reduced car use, and driving may cease to be the habitual choice for every trip.6
Multiple studies have quantified this relationship between public transportation, land use, and re-
FIGURE 4 Life Cycle Greenhouse Gas Emissions Source: Mikhail Chester and Arpad Horvath. Life-cycle Energy and Emissions Invento-ries for Motorcycles, Diesel Automobiles, School Buses, Electric Buses, Chicago Rail, and New York City Rail, 2009. http://escholarship.org/uc/item/6z37f2jr Note: The study uses average occupan-cies for these vehicles and systems.
...transit greenhouse gas emissions per passenger mile are still significantly lower than those from
driving, even taking into account emissions from construction, manufacturing, and maintenance.
0
100
200
300
400
500
600
700
Seda
n
SUV
Pick
up
Tran
sit B
us
Met
ro (S
FBA
BA
RT)
Ligh
t Rai
l (SF
Mun
i)
Com
mut
er R
ail (
SFBA
)
Ligh
t Rai
l (Bo
ston
Gre
en)
Elec
tric
Bus
Met
ro (N
YC)
Met
ro (N
Y/N
J PA
TH)
Ligh
t Rai
l (N
ewar
k)
Com
mut
er R
ail (
NYC
Are
a)
Com
mut
er R
ail (
Chic
ago)
Met
ro (C
hica
go)
Gra
ms
CO2
equi
vale
nt p
er P
asse
nger
Mile
Infrastructure
4

duction in travel. Studies show that for every addi-tional passenger mile traveled on public transporta-tion, auto travel declines by 1.4 to 9 miles.7 In other words, in areas served by public transportation, even non-transit users drive less because destina-tions are closer together. One study used modeling to isolate the effect of public transportation on driv-ing patterns (rather than that effect combined with denser land use creating a need for improved public transportation). That study, conducted by consult-ing firm ICF and funded through the Transit Cooper-ative Research Program (TCRP), found that each mile traveled on U.S. public transportation reduced driv-ing by 1.9 miles. It concluded that public transpor-tation reduces U.S. travel by an estimated 102.2 bil-lion vehicle miles traveled (VMT) each year, or 3.4% of annual U.S. VMT.8 Moreover, the report argued, by reducing congestion, transit lowers emissions from cars stuck in traffic. The Texas Transportation Institute’s 2007 Mobility Report estimates that by re-ducing congestion, transit saved an estimated 340 million gallons of fuel in 2005.9 Combining the emis-sions savings from passengers taking transit rather than driving, with VMT reduction due to transit’s impact on the built environment, and savings from reduced congestion due to transit, the ICF report finds that public transportation reduces carbon di-oxide emissions by 37 million metric tons annually. 10
Combining investment in public transportation with compact, mixed-use development around transit stations has a synergistic effect that amplifies the greenhouse gas reductions of each strategy. TCRP Report 128, “Effects of TOD on Housing, Parking and Travel,” surveyed 17 transit-oriented development (TOD) housing projects and found that these proj-ects averaged 44% fewer vehicle trips for a typical
weekday period than that estimated by the Institute of Transportation Engineers (ITE) manual for a typi-cal housing development.11 The weighted average differentials were even larger during peak periods – 49% lower rates during the A.M. peak and 48% lower rates during the P.M. peak.12 A study by the Center for Transit Oriented Development (CTOD) compared CO2 emissions per household based on location efficiency, as defined by access to rail tran-sit and neighborhood land use characteristics. The study found that, compared to the average metro-politan area household, households in transit zones that fell into the two middle categories of location efficiency produced 10% and 31% lower transporta-tion emissions, and households in the highest loca-tion efficient category produced 78% lower trans-portation emissions than the average metropolitan area household.13 A study published by the Urban Land Institute found that within areas of compact development, driving is reduced 20% to 40% com-pared to average U.S. development patterns.14 On a national scale, a recent Transportation Re-search Board report estimated that the reduction in vehicle miles traveled (VMT), energy use, and CO2 emissions resulting from more compact, mixed-use development would be in the range of less than 1% to 11% by 2050.15 A report by Cambridge Systemat-ics found that pursuing a combined land use, transit, and non-motorized transportation strategy bundle could reduce U.S. transportation greenhouse gas emissions by 9% at an aggressive level or 15% at a maximum deployment level. The study found that savings from reduced driving costs would outweigh implementation costs. (The study did not quantify other benefits and costs such as changes in envi-ronmental quality, public health, travel time, safety, and user fees.)16 Adding a strong price signal such as a VMT fee and varying car insurance rates by the number of miles driven would almost double the emission reductions.17
There are several examples in the United States of communities that are planning integrated pub-lic transportation and land use strategies in or-der to enhance quality of life, reduce congerstion, lower household transportation expenses, and re-duce greenhouse gas emissions as well. Salt Lake City is one example. Through a participatory pro-
FIGURE 5 Vehicle Trips per Day of Transit Oriented Development (TOD) Housing Sites versus Typical Housing Sites Source: TCRP 128: Effects of TOD on Housing, Parking and Travel, 2008.
Vehicle Trips per Day per Household
Typical Housing Sites
TOD Housing Sites 3.8
6.7
5

cess called “Envision Utah” residents of Salt Lake City chose between four alternative growth sce-narios. In the end, residents chose the scenario with growth focused into walkable, transit-oriented communities. Under this scenario, daily household VMT is ten miles lower than under the business as usual case, resulting in a significant drop in emis-sions. Salt Lake City is now building new light rail transit lines and clustering housing, jobs, and recre-ation around these lines in order to make the com-munity’s preferred scenario a reality.18
Denver, Portland, the Twin Cities, Washington, DC, and Dallas also provide examples of metropolitan areas aggressively pursuing transit-oriented devel-opment, yielding transportation, environmental, and economic benefits. California’s experience with a new state law, SB375, requiring integrated trans-portation and land use planning to reduce green-house gas emissions, will provide lessons for other states.
Public Transportation Providers Use Energy Conservation and Technology to Reduce
Emissions from Operations
Public transportation agencies across the country are taking actions to reduce the greenhouse gas intensity of their operations. Some agencies are building new administrative and maintenance fa-cilities to Leadership in Energy and Environmental Design (LEED) standards or higher. For instance, New York City Transit built a LEED certified mainte-nance facility that has fuel cell units, rooftop solar panels, natural lighting, and rain water storage to wash buses and cars. The agency is also reducing emissions from construction by using recycled con-tent in construction materials. Many agencies are
replacing older buses with new hybrid buses. In fact, 35% of buses on order by U.S. transit agencies are hybrid electric.19
Agencies are also using alternative fuels such as biodiesel and piloting hydrogen fuel cell buses, which produce zero emissions when the hydrogen is produced from a zero emission power source such as solar.
Most rail transit is powered by electricity, which of-fers efficiency improvements over internal combus-tion engines. Rail agencies are looking to further re-duce energy consumption by lowering the amount of electricity used in powering vehicles. In Phoenix, for example, the new light rail system uses regen-erative braking to lower electricity consumption.
As the electric power industry shifts to more renew-able sources of energy, as being mandated in sev-eral states, electric public transportation systems provide even more emissions reduction benefits. When the electricity is generated from a zero emis-sions source, such as wind, hydroelectric, nuclear, or solar, the public transportation systems that use these power sources are also zero emission.
Several transit agencies are installing on-site renew-able energy generation to power parts of their sys-tems. Boston’s transit agency is installing wind tur-bines, New York City Transit plans to harvest power from the tides by installing turbines in tidal waters, and Los Angeles Metro is installing solar panels on its properties.
The left photo shows an intersection near Central Pointe Station in Salt Lake City. The right photo shows the same intersection with proposed transit oriented development. Photo Credit: Reproduced from Envision Utah, Wasatch Front Transit Oriented Development Guidelines, 2002.
6

The Federal Transit Administration (FTA) works with public transportation providers and other key stakeholders to implement strategies that reduce greenhouse gas emissions from the trans-portation sector. FTA’s grants, technical assistance, research, and policy leadership all play a role in the agency’s efforts to address climate change.
FTA grows and sustains public transportation as a low-emission alternative to automobiles through the agency’s $10 billion a year grant programs. Over 1,500 transit agencies repre-senting every state in the country benefit from FTA grants. Agencies received an additional $8.4 billion infusion of support from the Ameri-can Recovery and Reinvestment Act (ARRA) of 2009, which provided funding for public trans-portation, among other job creating strategies.
In its grants, FTA seeks to give local communi-ties flexibility to implement the type of proj-ects that maximize transit’s potential to reduce greenhouse gas emissions. For instance, com-bining investment in public transportation with compact, mixed-use development around tran-sit stations has a synergistic effect that amplifies the greenhouse gas reductions of each strategy. To encourage these synergies, FTA’s grants can be used for “joint development,” or common use of property for both transit and non-transit pur-poses.20 This enables clustered development around transit. FTA’s grants can also fund bi-
cycle paths and sidewalks, helping residents bet-ter access transit and get around emissions free.21
Combating climate change is a key goal of the Sec-retary of Transportation’s signature livability initia-tive, of which FTA programs are a central element.According to Secretary LaHood, “livable commu-nities are mixed-use neighborhoods with highly-connected streets promoting mobility for all us-ers, whether they are children walking or biking to school or commuters riding transit or driving mo-tor vehicles. Benefits include improved traffic flow, shorter trip lengths, safer streets for pedestrians and cyclists, lower greenhouse gas emissions, reduced dependence on fossil fuels, increased trip-chaining, and independence for those who prefer not to or are unable to drive. In addition, investing in a ‘‘complete street’’ concept stimulates private-sector economic activity by increasing the viability of street-level retail small businesses and professional services, creating housing opportunities and extending the usefulness of school and transit facilities.”22
U.S. DOT, the U.S. Department of Housing and Ur-ban Development (HUD) and the U.S. Environ-mental Protection Agency (EPA) created a high-level interagency partnership to support these goals. The initiative is based on six principles:
• providing more transportation choices,• promoting equitable, affordable housing,• enhancing economic competitiveness,• supporting existing communities,• coordinating policies and leveraging investment, • valuing the uniqueness of communities and neighborhoods.
As part of the first batch of funding for the livabil-ity initiative, the Secretary announced $280 million in FTA bus and urban circulator grants targeted to projects that meet livability and sustainability crite-ria, including greenhouse gas reduction.23
In addition to FTA’s grant programs, FTA’s technical assistance is another key part of the agency’s ef-forts to respond to climate change. FTA’s technical
FTA Actions to Address Climate Change
Portland Streetcar (TriMet), Portland, Oregon
7
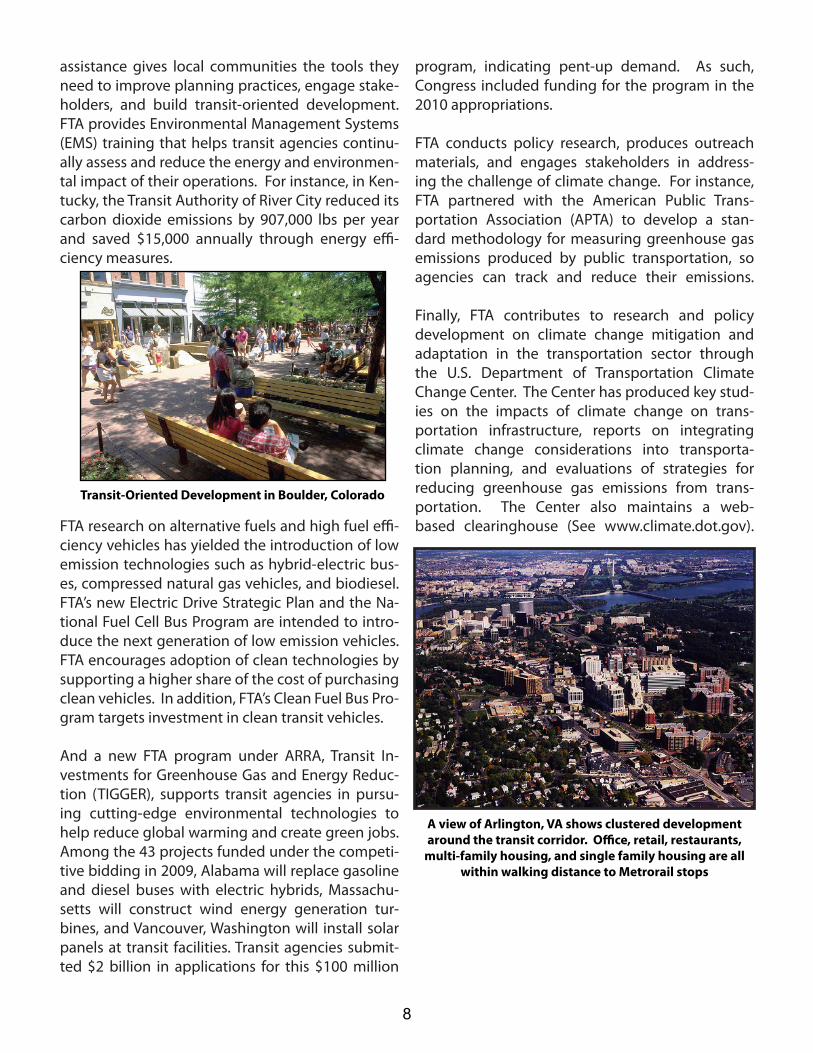
Transit-Oriented Development in Boulder, Colorado
assistance gives local communities the tools they need to improve planning practices, engage stake-holders, and build transit-oriented development. FTA provides Environmental Management Systems (EMS) training that helps transit agencies continu-ally assess and reduce the energy and environmen-tal impact of their operations. For instance, in Ken-tucky, the Transit Authority of River City reduced its carbon dioxide emissions by 907,000 lbs per year and saved $15,000 annually through energy effi-ciency measures.
FTA research on alternative fuels and high fuel effi-ciency vehicles has yielded the introduction of low emission technologies such as hybrid-electric bus-es, compressed natural gas vehicles, and biodiesel. FTA’s new Electric Drive Strategic Plan and the Na-tional Fuel Cell Bus Program are intended to intro-duce the next generation of low emission vehicles. FTA encourages adoption of clean technologies by supporting a higher share of the cost of purchasing clean vehicles. In addition, FTA’s Clean Fuel Bus Pro-gram targets investment in clean transit vehicles.
And a new FTA program under ARRA, Transit In-vestments for Greenhouse Gas and Energy Reduc-tion (TIGGER), supports transit agencies in pursu-ing cutting-edge environmental technologies to help reduce global warming and create green jobs. Among the 43 projects funded under the competi-tive bidding in 2009, Alabama will replace gasoline and diesel buses with electric hybrids, Massachu-setts will construct wind energy generation tur-bines, and Vancouver, Washington will install solar panels at transit facilities. Transit agencies submit-ted $2 billion in applications for this $100 million
program, indicating pent-up demand. As such, Congress included funding for the program in the 2010 appropriations.
FTA conducts policy research, produces outreach materials, and engages stakeholders in address-ing the challenge of climate change. For instance, FTA partnered with the American Public Trans-portation Association (APTA) to develop a stan-dard methodology for measuring greenhouse gas emissions produced by public transportation, so agencies can track and reduce their emissions.
Finally, FTA contributes to research and policy development on climate change mitigation and adaptation in the transportation sector through the U.S. Department of Transportation Climate Change Center. The Center has produced key stud-ies on the impacts of climate change on trans-portation infrastructure, reports on integrating climate change considerations into transporta-tion planning, and evaluations of strategies for reducing greenhouse gas emissions from trans-portation. The Center also maintains a web-based clearinghouse (See www.climate.dot.gov).
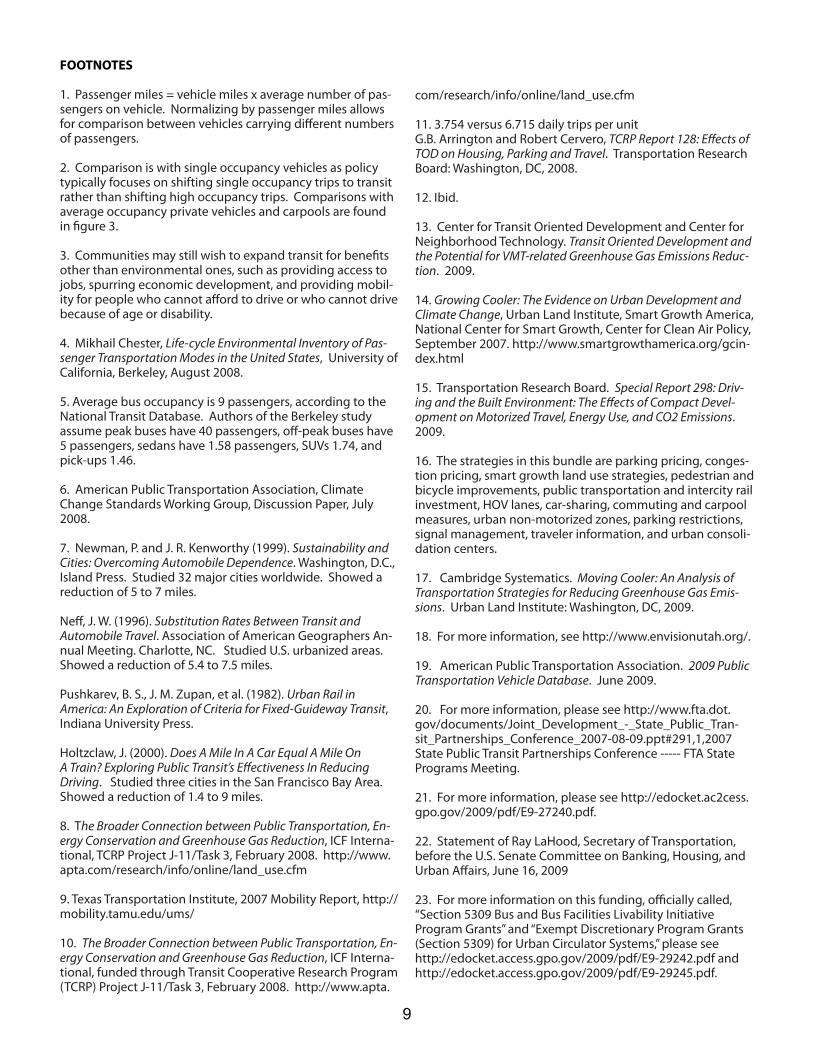
A view of Arlington, VA shows clustered development around the transit corridor. Office, retail, restaurants,
multi-family housing, and single family housing are all within walking distance to Metrorail stops
8
FOOTNOTES 1. Passenger miles = vehicle miles x average number of pas-sengers on vehicle. Normalizing by passenger miles allows for comparison between vehicles carrying different numbers of passengers. 2. Comparison is with single occupancy vehicles as policy typically focuses on shifting single occupancy trips to transit rather than shifting high occupancy trips. Comparisons with average occupancy private vehicles and carpools are found in figure 3. 3. Communities may still wish to expand transit for benefits other than environmental ones, such as providing access to jobs, spurring economic development, and providing mobil-ity for people who cannot afford to drive or who cannot drive because of age or disability.
4. Mikhail Chester, Life-cycle Environmental Inventory of Pas-senger Transportation Modes in the United States, University of California, Berkeley, August 2008. 5. Average bus occupancy is 9 passengers, according to the National Transit Database. Authors of the Berkeley study assume peak buses have 40 passengers, off-peak buses have 5 passengers, sedans have 1.58 passengers, SUVs 1.74, and pick-ups 1.46.
6. American Public Transportation Association, Climate Change Standards Working Group, Discussion Paper, July 2008.
7. Newman, P. and J. R. Kenworthy (1999). Sustainability and Cities: Overcoming Automobile Dependence. Washington, D.C., Island Press. Studied 32 major cities worldwide. Showed a reduction of 5 to 7 miles. Neff, J. W. (1996). Substitution Rates Between Transit and Automobile Travel. Association of American Geographers An-nual Meeting. Charlotte, NC. Studied U.S. urbanized areas. Showed a reduction of 5.4 to 7.5 miles.
Pushkarev, B. S., J. M. Zupan, et al. (1982). Urban Rail in America: An Exploration of Criteria for Fixed-Guideway Transit, Indiana University Press. Holtzclaw, J. (2000). Does A Mile In A Car Equal A Mile On A Train? Exploring Public Transit’s Effectiveness In Reducing Driving. Studied three cities in the San Francisco Bay Area. Showed a reduction of 1.4 to 9 miles.
8. The Broader Connection between Public Transportation, En-ergy Conservation and Greenhouse Gas Reduction, ICF Interna-tional, TCRP Project J-11/Task 3, February 2008. http://www.apta.com/research/info/online/land_use.cfm 9. Texas Transportation Institute, 2007 Mobility Report, http://mobility.tamu.edu/ums/
10. The Broader Connection between Public Transportation, En-ergy Conservation and Greenhouse Gas Reduction, ICF Interna-tional, funded through Transit Cooperative Research Program (TCRP) Project J-11/Task 3, February 2008. http://www.apta.
com/research/info/online/land_use.cfm
11. 3.754 versus 6.715 daily trips per unitG.B. Arrington and Robert Cervero, TCRP Report 128: Effects of TOD on Housing, Parking and Travel. Transportation Research Board: Washington, DC, 2008.
12. Ibid.
13. Center for Transit Oriented Development and Center for Neighborhood Technology. Transit Oriented Development and the Potential for VMT-related Greenhouse Gas Emissions Reduc-tion. 2009. 14. Growing Cooler: The Evidence on Urban Development and Climate Change, Urban Land Institute, Smart Growth America, National Center for Smart Growth, Center for Clean Air Policy, September 2007. http://www.smartgrowthamerica.org/gcin-dex.html
15. Transportation Research Board. Special Report 298: Driv-ing and the Built Environment: The Effects of Compact Devel-opment on Motorized Travel, Energy Use, and CO2 Emissions. 2009.
16. The strategies in this bundle are parking pricing, conges-tion pricing, smart growth land use strategies, pedestrian and bicycle improvements, public transportation and intercity rail investment, HOV lanes, car-sharing, commuting and carpool measures, urban non-motorized zones, parking restrictions, signal management, traveler information, and urban consoli-dation centers.
17. Cambridge Systematics. Moving Cooler: An Analysis of Transportation Strategies for Reducing Greenhouse Gas Emis-sions. Urban Land Institute: Washington, DC, 2009.
18. For more information, see http://www.envisionutah.org/.
19. American Public Transportation Association. 2009 Public Transportation Vehicle Database. June 2009.
20. For more information, please see http://www.fta.dot.gov/documents/Joint_Development_-_State_Public_Tran-sit_Partnerships_Conference_2007-08-09.ppt#291,1,2007 State Public Transit Partnerships Conference ----- FTA State Programs Meeting.
21. For more information, please see http://edocket.ac2cess.gpo.gov/2009/pdf/E9-27240.pdf. 22. Statement of Ray LaHood, Secretary of Transportation, before the U.S. Senate Committee on Banking, Housing, and Urban Affairs, June 16, 2009
23. For more information on this funding, officially called, “Section 5309 Bus and Bus Facilities Livability Initiative Program Grants” and “Exempt Discretionary Program Grants (Section 5309) for Urban Circulator Systems,” please see http://edocket.access.gpo.gov/2009/pdf/E9-29242.pdf and http://edocket.access.gpo.gov/2009/pdf/E9-29245.pdf.
9

10

Appendix I Estimated Carbon Dioxide Emissions per Passenger Mile for U.S. Transit Systems,
2008Listed by system type in order of total passenger miles. See Appendix II for data sources and methodology.
Average U.S. Single Occupany Vehicle: 0.964 pounds CO2/passenger mile
Heavy Rail Systems
State Heavy Rail Common Name
Pounds CO2 /
passenger mile
% of total heavy rail passenger
miles traveled in the U.S.
KWH/ seat mile (Efficiency
of Vehicle)
Average % of seats full
(Ridership)
Pounds CO2/MWH for eGRID subregion
(carbon content)
NY New York City Subway 0.147 59.3% 0.107 59% 815
DC Washington Metro 0.347 9.7% 0.101 33% 1,139
CA San Francisco BART 0.085 8.6% 0.069 32% 399*
IL Chicago “L” 0.573 7.0% 0.133 36% 1,538
GA Atlanta MARTA 0.245 3.5% 0.064 39% 1,490
MA Boston “T” 0.336 3.3% 0.167 46% 928
PA Philadelphia SEPTA 0.374 2.5% 0.151 46% 1,139
NJ New Jersey PATH 0.302 2.1% 0.249 94% 1,139
CA Los Angeles Metro 0.282 1.3% 0.248 64% 724
FL Miami-Dade Transit 0.656 0.8% 0.137 28% 1,319
NJ New Jersey PATCO 0.519 0.6% 0.128 28% 1,139
MD Baltimore Metro 0.919 0.4% 0.137 17% 1,139
OH Cleveland Rapid 0.805 0.3% 0.168 32% 1,538
NY Staten Island Railway 0.346 0.3% 0.110 26% 815
National Average Weighted by Passenger Miles 0.224 99.7% 0.109 47%
Source: Calculated from Federal Transit Administration 2008 National Transit Database (NTD), U.S. Department of Energy carbon dioxide conversion factors, U.S. Environmental Protection Agency eGRID.
Note: Energy data not available for the privately operated Tren Urbano system in Puerto Rico.Note: This paper uses the Climate Registry General Reporting Protocol method for determining the emissions factors for purchased electricity. That method is to use the eGRID subregion data published by the U.S. Environmental Protection Agency unless electricity is purchased directly from a generation source with a known emissions factor. The calculations for all of the transit systems in this paper use the eGRID subregion emissions factors with the exception of the BART system. The BART system purchases electricity directly rather than through the general subregion grid. As such, BART was able to provide an emissions factor specific to the electricity it purchases, 399 pounds per megawatt hour, which was used in the calculations rather than the eGRID factor for its subregion of 724 pounds per megawatt hour. The system specific factor yields .085 pounds CO2 per passenger mile for the BART system while the subregion eGRID factor yields 0.155 pounds CO2 per passenger mile. This changes the national average only slightly, from 0.230 to 0.224 pounds CO2 per passenger mile.
11

Light Rail Systems
State Transit AuthorityPounds CO2 / passenger
mile
% of total light rail
passenger miles traveled
in the U.S.
KWH/ seat mile
(Efficiency of Vehicle)
Average % of seats full(Ridership)
Pounds CO2/MWH for eGRID subregion
(carbon content)
CA Los Angeles County Metropolitan Transportation Authority 0.219 14.7% 0.138 46% 724.12
CA San Diego Metropolitan Transit System 0.146 9.9% 0.081 40% 724.12
OR Tri-County Metropolitan Transportation District of Oregon 0.213 9.3% 0.106 45% 902.24
MA Massachusetts Bay Transportation Authority 0.266 9.0% 0.208 73% 927.68
TX Dallas Area Rapid Transit 0.534 7.3% 0.162 40% 1324.35
MO Bi-State Development Agency 0.284 6.9% 0.083 30% 1019.74
CO Denver Regional Transportation District 0.683 6.4% 0.081 22% 1883.08
CA San Francisco Municipal Railway 0.299 6.4% 0.166 40% 724.12
CA Sacramento Regional Transit District 0.338 4.1% 0.146 31% 724.12
NJ New Jersey Transit Corporation (privately operated) 0.560 4.0% N/A* 33% 1139.07
PA Southeastern Pennsylvania Transportation Authority 0.557 3.5% 0.184 38% 1139.07
UT Utah Transit Authority 0.260 3.4% 0.111 38% 902.24
MN Metro Transit 0.422 2.9% 0.109 47% 1821.84
CA Santa Clara Valley Transportation Authority 0.381 2.6% 0.123 23% 724.12
MD Maryland Transit Administration 0.627 2.6% 0.126 23% 1139.07
PA Port Authority of Allegheny County 1.371 1.6% 0.259 29% 1537.82
TX Metropolitan Transit Authority of Harris County, Texas 0.312 1.4% 0.110 47% 1324.35
OH The Greater Cleveland Regional Transit Authority 0.912 0.9% 0.188 32% 1537.82
NY Niagara Frontier Transportation Authority 0.390 0.7% 0.192 35% 720.8
NJ New Jersey Transit Corporation (directly operated) 0.635 0.7% 0.172 31% 1139.07
NC Charlotte Area Transit System 0.394 0.6% 0.156 45% 1134.88
LA New Orleans Regional Transit Authority 0.325 0.4% 0.067 21% 1019.74
CA North County Transit District 0.474 0.4% N/A* 36%
WA Central Puget Sound Regional Transit Authority 0.411 <0.1% 0.148 33% 902.24
TN Memphis Area Transit Authority 3.209 <0.1% 0.103 5% 1510.44
FL Hillsborough Area Regional Transit Authority 1.241 <0.1% 0.177 19% 1318.57
WAKing County Department of Transportation - Metro Transit Division
1.301 <0.1% 0.357 25% 902.24
AR Central Arkansas Transit Authority 1.837 <0.1% 0.160 9% 1019.74
WI Kenosha Transit 4.266 <0.1% 0.228 8% 1537.82
National 0.365 100.0% 0.126 37%
Source: Calculated from Federal Transit Administration 2008 National Transit Database (NTD), U.S. Department of Energy carbon dioxide conversion factors, U.S. Environmental Protection Agency eGRID.
*New Jersey Transit Corporation in Newark, NJ and North County Transit District in Oceanside, CA do not have values listed for kilowatt hours per seat mile because the former uses both electricity and diesel and the latter uses diesel.
Note: There are two separate entries for New Jersey Transit Corporation as one entry contains the data for the directly operated portion of the system and the other contains the data for the privately operated portion of the system. Note: Six of the twenty-nine light rail systems, representing less than two percent of all U.S. light rail passenger travel, have carbon dioxide emissions per passenger mile greater than single occupancy cars.
12
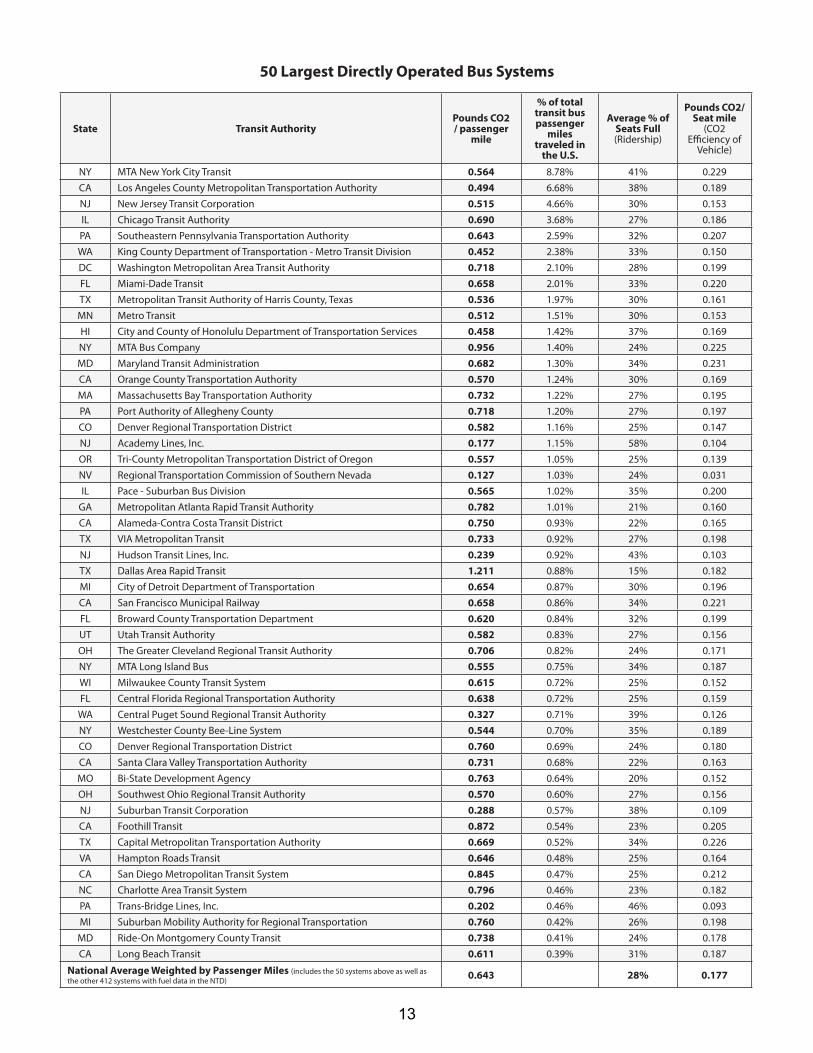
50 Largest Directly Operated Bus Systems
State Transit AuthorityPounds CO2 / passenger
mile
% of total transit bus passenger
miles traveled in
the U.S.
Average % of Seats Full(Ridership)
Pounds CO2/ Seat mile
(CO2 Efficiency of
Vehicle)
NY MTA New York City Transit 0.564 8.78% 41% 0.229CA Los Angeles County Metropolitan Transportation Authority 0.494 6.68% 38% 0.189NJ New Jersey Transit Corporation 0.515 4.66% 30% 0.153IL Chicago Transit Authority 0.690 3.68% 27% 0.186PA Southeastern Pennsylvania Transportation Authority 0.643 2.59% 32% 0.207WA King County Department of Transportation - Metro Transit Division 0.452 2.38% 33% 0.150DC Washington Metropolitan Area Transit Authority 0.718 2.10% 28% 0.199FL Miami-Dade Transit 0.658 2.01% 33% 0.220TX Metropolitan Transit Authority of Harris County, Texas 0.536 1.97% 30% 0.161MN Metro Transit 0.512 1.51% 30% 0.153HI City and County of Honolulu Department of Transportation Services 0.458 1.42% 37% 0.169NY MTA Bus Company 0.956 1.40% 24% 0.225MD Maryland Transit Administration 0.682 1.30% 34% 0.231CA Orange County Transportation Authority 0.570 1.24% 30% 0.169MA Massachusetts Bay Transportation Authority 0.732 1.22% 27% 0.195PA Port Authority of Allegheny County 0.718 1.20% 27% 0.197CO Denver Regional Transportation District 0.582 1.16% 25% 0.147NJ Academy Lines, Inc. 0.177 1.15% 58% 0.104OR Tri-County Metropolitan Transportation District of Oregon 0.557 1.05% 25% 0.139NV Regional Transportation Commission of Southern Nevada 0.127 1.03% 24% 0.031IL Pace - Suburban Bus Division 0.565 1.02% 35% 0.200
GA Metropolitan Atlanta Rapid Transit Authority 0.782 1.01% 21% 0.160CA Alameda-Contra Costa Transit District 0.750 0.93% 22% 0.165TX VIA Metropolitan Transit 0.733 0.92% 27% 0.198NJ Hudson Transit Lines, Inc. 0.239 0.92% 43% 0.103TX Dallas Area Rapid Transit 1.211 0.88% 15% 0.182MI City of Detroit Department of Transportation 0.654 0.87% 30% 0.196CA San Francisco Municipal Railway 0.658 0.86% 34% 0.221FL Broward County Transportation Department 0.620 0.84% 32% 0.199UT Utah Transit Authority 0.582 0.83% 27% 0.156OH The Greater Cleveland Regional Transit Authority 0.706 0.82% 24% 0.171NY MTA Long Island Bus 0.555 0.75% 34% 0.187WI Milwaukee County Transit System 0.615 0.72% 25% 0.152FL Central Florida Regional Transportation Authority 0.638 0.72% 25% 0.159
WA Central Puget Sound Regional Transit Authority 0.327 0.71% 39% 0.126NY Westchester County Bee-Line System 0.544 0.70% 35% 0.189CO Denver Regional Transportation District 0.760 0.69% 24% 0.180CA Santa Clara Valley Transportation Authority 0.731 0.68% 22% 0.163MO Bi-State Development Agency 0.763 0.64% 20% 0.152OH Southwest Ohio Regional Transit Authority 0.570 0.60% 27% 0.156NJ Suburban Transit Corporation 0.288 0.57% 38% 0.109CA Foothill Transit 0.872 0.54% 23% 0.205TX Capital Metropolitan Transportation Authority 0.669 0.52% 34% 0.226VA Hampton Roads Transit 0.646 0.48% 25% 0.164CA San Diego Metropolitan Transit System 0.845 0.47% 25% 0.212NC Charlotte Area Transit System 0.796 0.46% 23% 0.182PA Trans-Bridge Lines, Inc. 0.202 0.46% 46% 0.093MI Suburban Mobility Authority for Regional Transportation 0.760 0.42% 26% 0.198
MD Ride-On Montgomery County Transit 0.738 0.41% 24% 0.178CA Long Beach Transit 0.611 0.39% 31% 0.187
National Average Weighted by Passenger Miles (includes the 50 systems above as well as the other 412 systems with fuel data in the NTD) 0.643 28% 0.177
13
Source: Calculated from Federal Transit Administration 2008 National Transit Database (NTD) and U.S. Department of Energy carbon dioxide conversion factors.
Note: Seven percent of bus passenger miles are on systems that did not report fuel data to the NTD (fuel reporting is optional for privately operated systems). The list above is of the 50 largest bus systems with fuel data in the NTD by passenger miles, which account for 69 percent of all transit bus passenger miles traveled in the United States and reported in the NTD. Data for the entire list of 462 bus systems with fuel data is available from FTA but is not listed here due to space constraints. The national averages shown at the bottom of the table as well as earlier in the graphs include all 412 bus systems reporting fuel data.
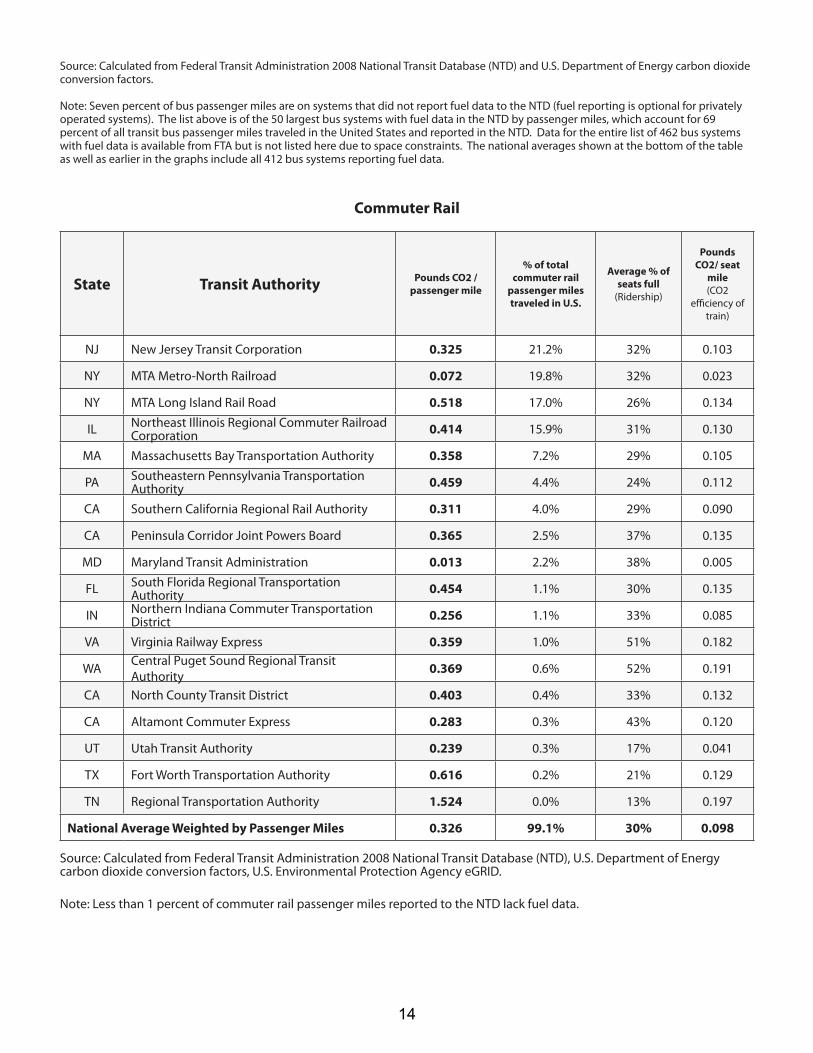
Commuter Rail
State Transit Authority Pounds CO2 / passenger mile
% of total commuter rail
passenger miles traveled in U.S.
Average % of seats full
(Ridership)
Pounds CO2/ seat
mile(CO2
efficiency of train)
NJ New Jersey Transit Corporation 0.325 21.2% 32% 0.103
NY MTA Metro-North Railroad 0.072 19.8% 32% 0.023
NY MTA Long Island Rail Road 0.518 17.0% 26% 0.134
IL Northeast Illinois Regional Commuter Railroad Corporation 0.414 15.9% 31% 0.130
MA Massachusetts Bay Transportation Authority 0.358 7.2% 29% 0.105
PA Southeastern Pennsylvania Transportation Authority 0.459 4.4% 24% 0.112
CA Southern California Regional Rail Authority 0.311 4.0% 29% 0.090
CA Peninsula Corridor Joint Powers Board 0.365 2.5% 37% 0.135
MD Maryland Transit Administration 0.013 2.2% 38% 0.005
FL South Florida Regional Transportation Authority 0.454 1.1% 30% 0.135
IN Northern Indiana Commuter Transportation District 0.256 1.1% 33% 0.085
VA Virginia Railway Express 0.359 1.0% 51% 0.182
WA Central Puget Sound Regional Transit Authority 0.369 0.6% 52% 0.191
CA North County Transit District 0.403 0.4% 33% 0.132
CA Altamont Commuter Express 0.283 0.3% 43% 0.120
UT Utah Transit Authority 0.239 0.3% 17% 0.041
TX Fort Worth Transportation Authority 0.616 0.2% 21% 0.129
TN Regional Transportation Authority 1.524 0.0% 13% 0.197
National Average Weighted by Passenger Miles 0.326 99.1% 30% 0.098 Source: Calculated from Federal Transit Administration 2008 National Transit Database (NTD), U.S. Department of Energy carbon dioxide conversion factors, U.S. Environmental Protection Agency eGRID.
Note: Less than 1 percent of commuter rail passenger miles reported to the NTD lack fuel data.
14

Van Pool
State Transit AuthorityPounds CO2 / passenger
mile
% of total van pool
passenger miles
traveled in U.S.
Average % of seats full(Ridership)
Pounds CO2/ seat mile
(CO2 efficiency of vehicle)
UT Utah Transit Authority 0.149 7.2% 52% 0.077WA King County Department of Transportation - Metro Transit
Division 0.246 6.2% 59% 0.144
IL Pace - Suburban Bus Division 0.345 4.8% 48% 0.166WA Ben Franklin Transit 0.155 4.5% 75% 0.116AZ Phoenix - VPSI, Inc. 0.216 3.5% 55% 0.120
CT Greater Hartford Ridesharing Corporation - The Rideshare Company 0.280 3.3% 54% 0.151
TX Dallas Area Rapid Transit 0.174 2.9% 79% 0.137GA Marietta - VPSI, Inc. 0.195 2.9% 40% 0.078
WA Pierce County Transportation Benefit Area Authority 0.228 2.8% 52% 0.119
TX Dallas - VPSI, Inc. 0.218 2.6% 60% 0.131WA Intercity Transit 0.157 2.5% 76% 0.119
WA Snohomish County Public Transportation Benefit Area Corporation 0.239 2.4% 53% 0.126
CA Kings County Area Public Transit Agency 0.267 2.3% 40% 0.108VA Greater Richmond Transit Company 0.174 1.8% 62% 0.108HI Honolulu - VPSI, Inc. 0.276 1.6% 55% 0.152NC Charlotte Area Transit System 0.199 1.4% 57% 0.113
NC Research Triangle Regional Public Transportation Authority 0.128 1.4% 88% 0.113
CO Denver Regional Transportation District 0.214 1.4% 48% 0.103FL Miami Lakes - VPSI, Inc. 0.200 1.3% 60% 0.119IA Des Moines Area Regional Transit Authority 0.209 1.2% 56% 0.117AK VPSI, Anchorage 0.220 0.8% 53% 0.117VA Hampton Roads Transit 0.187 0.8% 74% 0.139FL Space Coast Area Transit 0.646 0.7% 62% 0.403WA Kitsap Transit 0.283 0.7% 49% 0.138GA Georgia Regional Transportation Authority 0.238 0.7% 51% 0.120TX Capital Metropolitan Transportation Authority 0.385 0.6% 39% 0.150GA Douglas County Rideshare 0.271 0.6% 39% 0.105WA Spokane Transit Authority 0.270 0.5% 45% 0.120WA Skagit Transit 0.177 0.5% 63% 0.112WA Yakima Transit 0.152 0.5% 67% 0.102TN Regional Transportation Authority 0.099 0.4% 83% 0.082FL County of Volusia, VOTRAN 0.203 0.4% 83% 0.167CT 2Plus Partners in Transportation, Inc 0.575 0.3% 74% 0.428MO Kansas City Area Transportation Authority 0.268 0.3% 60% 0.161MI Interurban Transit Partnership 0.262 0.2% 63% 0.164FL Lee County Transit 0.103 0.1% 58% 0.059WI Milwaukee County Transit System 0.190 0.1% 66% 0.125PA Centre Area Transportation Authority 0.155 0.1% 71% 0.111VT Chittenden County Transportation Authority 0.135 0.1% 65% 0.087TX Corpus Christi Regional Transportation Authority 0.141 0.0% 79% 0.112SC Santee Wateree Regional Transportation Authority 0.191 0.0% 46% 0.087PA York County Transportation Authority 0.179 0.0% 94% 0.169WA Link Transit 0.299 0.0% 120% 0.359MI Kalamazoo Metro Transit System 0.288 0.0% 20% 0.056
National Average Weighted by Passenger Miles 0.223 66.5% 56% 0.124
Source: Calculated from Federal Transit Administration 2008 National Transit Database (NTD) and U.S. Department of Energy carbon dioxide conversion factors.
Note: 43 percent of van pool passenger miles reported to the NTD lack fuel data.
15

Other ModesThe transit modes below represent less than 3 percent of U.S. transit passenger miles, and other than demand response, are generally specific to limited
geographic areas.
State NamePounds CO2 /
passenger mile
% of total U.S. transit passenger
miles
Average % of seats
full(Ridership)
Pounds CO2/
MWH for subregion
(Carbon content)
lbs CO2/ Seat mile(CO2 efficiency of
vehicle)
Automated GuidewayFL Miami-Dade Transit 1.088 0.02% 55% 1319 0.596FL Jacksonville Transportation Authority 6.093 <0.01% 6% 1319 0.336MI Detroit Transportation Corporation 2.025 0.01% 18% 1563 0.362
Alaska RailroadAK Alaska Railroad Corporation 1.124 <0.01% 30% 0.342
Cable CarCA San Francisco Municipal Railway 0.314 0.02% 61% 724 0.192
Ferry BoatWA Kitsap Transit 1.252 <0.01% 19% 0.235WA Pierce County Ferry Operations 1.746 <0.01% 17% 0.294WA Washington State Ferries 2.123 0.34% 30% 0.629ME Casco Bay Island Transit District 3.073 <0.01% 13% 0.392NY MTA Metro-North Railroad 4.896 <0.01% 21% 1.007NY New York City Department of Transportation 0.864 0.19% 24% 0.210NJ Port Authority Trans-Hudson Corporation 3.989 0.01% 12% 0.488NY BillyBey Ferry Company, LLC 4.248 0.01% 13% 0.533NJ Port Imperial Ferry Corporation, NY Waterway 2.295 0.03% 18% 0.406VA Hampton Roads Transit 3.061 <0.01% 15% 0.471GA Chatham Area Transit Authority 4.660 <0.01% 11% 0.525PR Maritime Transportation Authority of Puerto Rico 2.214 0.03% 36% 0.790
LA Crescent City Connection Division - Louisiana Department of Transportation 8.567 <0.01% 11% 0.971
TX Corpus Christi Regional Transportation Authority 2.775 <0.01% 16% 0.437
HI City and County of Honolulu Department of Transportation Services 3.099 <0.01% 15% 0.462
CA Golden Gate Bridge, Highway and Transportation District 1.599 0.04% 27% 0.427
CA City of Alameda Ferry Services 2.325 0.01% 21% 0.492
Inclined PlanePA Cambria County Transit Authority 8.934 <0.01% 35% 1139 3.147
PA Port Authority of Allegheny County (directly operated) 3.220 <0.01% 20% 1538 0.632
PA Port Authority of Allegheny County (privately operated) 4.166 <0.01% 18% 1538 0.745
TN Chattanooga Area Regional Transportation Authority 0.380 <0.01% 51% 1510 0.195
MonorailWA City of Seattle - Seattle Center Monorail Transit 0.190 0.00% 24% 902 0.046
PublicoPR Department of Transportation and Public Works 0.318 0.26% 34% 0.109
Trolley BusWA King County Department of Transportation - Metro 0.388 0.07% 29% 902 0.111MA Massachusetts Bay Transportation Authority 0.778 0.01% 33% 928 0.256PA Southeastern Pennsylvania Transportation 0.709 <0.01% 37% 1139 0.259OH Greater Dayton Regional Transit Authority 0.882 0.02% 18% 1538 0.162CA San Francisco Municipal Railway 0.234 0.20% 32% 724 0.074
Demand Response National Average 3.100 1.57% 12% 0.364 Note: Ferry boats are particularly challenging to compare directly to emissions from an equivalent number of miles in an automobile as ferries often carry automobiles as well as passengers and often allow for a much shorter route across a body of water rather than a circuitous route by land. Demand response consists largely of paratransit services for persons with disabilities, and is not typically conducted for environmental purposes, but rather for social and equity purposes. Trolley bus may be instructive for systems considering electrifying their buses. Note the large range in carbon efficiency, depending on carbon content of the electricity, ridership, and efficiency of the vehicle.
16

Definitions of Transit Modes
Bus: A transit mode comprised of rubber-tired passenger vehicles operating on fixed routes and schedules over roadways. Vehicles are powered by diesel, gasoline, battery, or alternative fuel engines contained within the vehicle.
Heavy Rail: A transit mode that is an electric railway with the capacity for a heavy volume of traffic. It is characterized by high speed and rapid acceleration passenger rail cars operating singly or in multi-car trains on fixed rails, separate rights-of-way from which all other vehicular and foot traffic are excluded, sophisticated signaling, and high platform loading.
Light Rail: A transit mode that typically is an electric railway with a light volume traffic capacity compared to heavy rail. It is characterized by passenger rail cars operating singly (or in short, usually two car, trains) on fixed rails in shared or exclusive right-of-way, low or high platform loading, and vehicle power drawn from an overhead electric line via a trolley or a pantograph.
Commuter Rail: A transit mode that is an electric or diesel propelled railway for urban passenger train service consisting of local short distance travel operating between a central city and adjacent suburbs.
Vanpool: A transit mode comprised of vans, small buses and other vehicles operating as a ride sharing arrangement, providing transportation to a group of individuals traveling directly between their homes and a regular destination within the same geographical area.
Alaska Railroad: In recognition of the special Federal relationship with the Alaska railroad (AR), a segment of the passenger service portion of the Alaska railroad (AR) is considered to be eligible for certain FTA funding under the Fixed Guideway Modernization program. The service encompasses only those lines operating within the Anchorage, Alaska, urbanized area (UZA) where passenger service is provided and only includes car miles for passenger cars; car miles for freight cars are specifically excluded.
Automated Guideway: A transit mode that is an electric railway (single or multi-car trains) of guided transit vehicles operating without vehicle operators or other crew onboard the vehicle. Service may be on a fixed schedule or in response to a passenger activated call button. Automated Guideway (AG) transit includes personal rapid transit, group rapid transit, and people mover systems.
Cable Car: A transit mode that is an electric railway with individually controlled transit vehicles attached to a moving cable located below the street surface and powered by engines or motors at a central location, not onboard the vehicle.
Ferryboat: A transit mode comprised of vessels carrying passengers and / or vehicles over a body of water that are generally steam or diesel powered.
Inclined Plane: A transit mode that is a railway operating over exclusive right-of-way (ROW) on steep grades (slopes) with powerless vehicles propelled by moving cables attached to the vehicles and powered by engines or motors at a central location not onboard the vehicle. The special tramway type of vehicles have passenger seats that remain horizontal while the undercarriage (truck) is angled parallel to the slope.
Distribution of Public Transportation
Passenger Miles, 2008
Total 2008 public transportation passenger miles: 54 billion. Other: ferryboat, publico, trolleybus, automated guideway,
cable car, Alaska Railroad, inclined plane, monorail. Source: National Transit Database, 2008
Monorail: A transit mode that is an electric railway of guided transit vehicles operating singly or in multi-car trains. The vehicles are suspended from or straddle a guideway formed by a single beam, rail or tube.
Publico: A transit mode comprised of passenger vans or small buses operating with fixed routes but no fixed schedules. Publicos (PB) are a privately owned and operated public transit service which is market oriented and unsubsidized, but regulated through a public service commission, state or local government. Publicos (PB) are operated under franchise agreements, fares are regulated by route and there are special insurance requirements. Vehicle capacity varies from eight to 24, and the vehicles may be owned or leased by the operator.
Trolleybus: A transit mode comprised of electric rubber-tired passenger vehicles, manually steered and operating singly on city streets. Vehicles are propelled by a motor drawing current through overhead wires via trolleys, from a central power source not onboard the vehicle.
Demand Response: A transit mode comprised of passenger cars, vans or small buses operating in response to calls from passengers or their agents to the transit operator, who then dispatches a vehicle to pick up the passengers and transport them to their destinations.
Other1%
Heavy Rail31%
CommuterRail
21%Bus40%
Van Pool2%
Light Rail4%
DemandResponse
2%
17

18

Appendix II: Data Sources and Methodology
Pounds of carbon dioxide emissions per passenger mile is calculated using the following formula:lbs CO2 / passenger mile = units of fuel used x (lbs CO2 / unit of fuel) / passenger miles
Transit energy and passenger mile dataThe Federal Transit Administration’s National Transit Database (NTD) provides data on fuel and electricity used in powering transit vehicles such as buses and trains, number of people riding, and distances traveled for each transit system. The analysis uses passenger mile data, vehicle capacity data, and energy data in Tables 17 and 19, as well as their associated database files, of the most recent full set of annual data available, the 2008 National Transit Database, http://www.ntdprogram.gov/ntdprogram/data.htm.
Energy data is available for 96% of passenger miles reported in the NTD. Transit agencies are not required to report energy usage from privately operated services, though some do so voluntarily.
Seat miles traveled is calculated by multiplying vehicle revenue miles by average seating capacity, as reported in the 2008 National Transit Database. Average percent of seats full is calculated by dividing seat miles by passenger miles.
Conversion factorsFor fuels such as diesel, gasoline, and compressed natural gas, the total quantity of each fuel type was multiplied by the standard CO2 emissions factor provided by the Department of Energy to obtain pounds of CO2 produced.
Almost all heavy and light rail transit systems, such as subways and streetcars, are powered by electricity. For these systems, the level of carbon dioxide emissions depends on the types of power plants supplying the electricity (coal, gas, nuclear, hydroelectric, wind, etc.). The calculations in this publication use the carbon dioxide emissions per megawatt hour for the power supplied to the electrical grid in the particular subregion in which the transit agency operates. The data is from the U.S. Environmental Protection Agency’s Emissions & Generation Resource Integrated Database (eGRID) 2007 v1.1, published in April 2009 and available at http://cfpub.epa.gov/egridweb/ghg.cfm. Sub-region emission factors are used rather than state level emission factors as regional power grids do not correspond with state lines. In addition, using the eGRID sub-region data rather than the state level data is recommended by the Climate Registry General Reporting Protocol, Chapter 14, http://www.theclimateregistry.org/downloads/GRP.pdf.
Private carThe average fuel economy for the in-use fleet of all light-duty vehicles (cars, SUVs, and pick-up trucks) is 20.3 miles per gallon according to EPA data. See “Emission Facts: Greenhouse Gas Emissions from a Typical Passenger Vehicle, EPA420-F-05-004, February 2005, http://www.epa.gov/OMS/climate/420f05004.htm. Gasoline releases 19.564 pounds of carbon dioxide per gallon burned according to the U.S. Department of Energy, Energy Information Administration, Voluntary Reporting of Greenhouse Gases Program, Fuel and Energy Source Codes and Emission Coefficients, http://www.eia.doe.gov/oiaf/1605/coefficients.html. Therefore, for each mile traveled driving alone, 0.964 pounds of carbon dioxide (19.564/20.3), or about 1 pound, is released into the atmosphere.
According to the 2001 National Household Transportation Survey, the average private auto work and general purpose trips have 1.14 and 1.63 passengers, respectively. These load factors are used for calculating greenhouse gas emissions per passenger mile for private auto work and general trips.
19

FOR MORE INFORMATION, PLEASE SEE: http://www.fta.dot.gov/sustainability Author: Tina Hodges Office of Budget and Policy Federal Transit Administration, U.S. DOT [email protected]
Editing/Design:Jarrett Stoltzfus, Office of Research, Demonstration and Innovation Federal Transit Administration, U.S. DOT
This document is disseminated under the sponsorship of the Department of Transportation in the interest of information exchange. The United States Government assumes
no liability for its contents or use thereof. The United States Government does not endorse products of manufacturers. Trademarks or manufacturer’s names appear herein
only because they are considered essential to the objective of this document.
JANUARY 2010