publications - brown university planetary geosciences · ... james w. head , laura kerber2, david...
TRANSCRIPT

Global inventory and characterization of pyroclasticdeposits on Mercury: New insights into pyroclasticactivity from MESSENGER orbital dataTimothy A. Goudge1, James W. Head1, Laura Kerber2, David T. Blewett3, Brett W. Denevi3,Deborah L. Domingue4, Jeffrey J. Gillis-Davis5, Klaus Gwinner6, Jörn Helbert6, Gregory M. Holsclaw7,Noam R. Izenberg3, Rachel L. Klima3, William E. McClintock7, Scott L. Murchie3, Gregory A. Neumann8,David E. Smith9, Robert G. Strom10, Zhiyong Xiao10,11, Maria T. Zuber9, and Sean C. Solomon12,13
1Department of Geological Sciences, Brown University, Providence, Rhode Island, USA, 2Laboratoire de MétéorologieDynamique, Centre National de la Recherche Scientifique, Université Pierre et Marie Curie, Institut Pierre-Simon Laplace,Paris, France, 3The Johns Hopkins University Applied Physics Laboratory, Laurel, Maryland, USA, 4Planetary Science Institute,Tucson, Arizona, USA, 5Hawai‘i Institute of Geophysics and Planetology, University of Hawai‘i at Mānoa, Honolulu, Hawaii,USA, 6Institute of Planetary Research, Deutsches Zentrum für Luft- und Raumfahrt, Berlin, Germany, 7Laboratory forAtmospheric and Space Physics, University of Colorado Boulder, Boulder, Colorado, USA, 8Solar System Exploration Division,NASA Goddard Space Flight Center, Greenbelt, Maryland, USA, 9Department of Earth, Atmospheric and Planetary Sciences,Massachusetts Institute of Technology, Cambridge, Massachusetts, USA, 10Lunar and Planetary Laboratory, University ofArizona, Tucson, Arizona, USA, 11Planetary Science Institute, China University of Geosciences, Wuhan, China, 12Departmentof Terrestrial Magnetism, Carnegie Institution of Washington, Washington, District of Columbia, USA, 13Lamont-DohertyEarth Observatory, Columbia University, Palisades, New York, USA
Abstract We present new observations of pyroclastic deposits on the surface of Mercury from dataacquired during the orbital phase of the MErcury Surface, Space ENvironment, GEochemistry, and Ranging(MESSENGER) mission. The global analysis of pyroclastic deposits brings the total number of such identifiedfeatures from 40 to 51. Some 90% of pyroclastic deposits are found within impact craters. The locations ofmost pyroclastic deposits appear to be unrelated to regional smooth plains deposits, except some depositscluster around the margins of smooth plains, similar to the relation between many lunar pyroclastic depositsand lunar maria. A survey of the degradation state of the impact craters that host pyroclastic depositssuggests that pyroclastic activity occurred on Mercury over a prolonged interval. Measurements of surfacereflectance by MESSENGER indicate that the pyroclastic deposits are spectrally distinct from theirsurrounding terrain, with higher reflectance values, redder (i.e., steeper) spectral slopes, and a downturn atwavelengths shorter than ~400 nm (i.e., in the near-ultraviolet region of the spectrum). Three possible causesfor these distinctive characteristics include differences in transition metal content, physical properties (e.g.,grain size), or degree of space weathering from average surface material on Mercury. The strength of thenear-ultraviolet downturn varies among spectra of pyroclastic deposits and is correlated with reflectance atvisible wavelengths. We suggest that this interdeposit variability in reflectance spectra is the result of eithervariable amounts of mixing of the pyroclastic deposits with underlying material or inherent differences inchemical and physical properties among pyroclastic deposits.
1. Introduction
Multispectral images of Mercury acquired during three flybys by the MErcury Surface, Space ENvironment,GEochemistry, and Ranging (MESSENGER) spacecraft [Solomon et al., 2008] revealed a number of sites on thesurface that were identified as pyroclastic deposits formed through explosive volcanic processes [Head et al.,2008, 2009;Murchie et al., 2008; Robinson et al., 2008; Blewett et al., 2009; Kerber et al., 2009, 2011]. These sitesare all characterized by high-reflectance deposits with diffuse borders that are approximately centered onirregularly shaped, rimless pits. The deposits have a “red” spectral slope (i.e., reflectance increases withincreasing wavelength) [Blewett et al., 2009; Kerber et al., 2009, 2011]. The central pits are interpreted to be thesource vents for the pyroclastic deposits [Kerber et al., 2011].
GOUDGE ET AL. ©2014. American Geophysical Union. All Rights Reserved. 635
PUBLICATIONSJournal of Geophysical Research: Planets
RESEARCH ARTICLE10.1002/2013JE004480
Key Points:• We expand the catalog of pyroclasticdeposits on Mercury from 40 to 51
• Stratigraphic relationships suggestemplacement over a prolonged interval
• Deposits exhibit distinct spectralsignatures with interdeposit variability
Correspondence to:T. A. Goudge,[email protected]
Citation:Goudge, T. A., et al. (2014), Globalinventory and characterization of pyro-clastic deposits on Mercury: Newinsights into pyroclastic activity fromMESSENGER orbital data, J. Geophys. Res.Planets, 119, 635–658, doi:10.1002/2013JE004480.
Received 4 JUL 2013Accepted 5 FEB 2014Accepted article online 12 FEB 2014Published online 28 MAR 2014

These pyroclastic deposits provide insight into the abundances, composition, and distribution of volatiles inMercury’s interior [Kerber et al., 2009; Zolotov, 2011]. Moreover, their presence constitutes an importantconstraint on the formation of the inner solar system, because Mercury’s crust and mantle are not as volatiledepleted as predicted by most earlier formation models for the innermost planet [Cameron, 1985; Benz et al.,1988; Boynton et al., 2007; Solomon et al., 2007; Kerber et al., 2009, 2011]. The possibility of explosive volcanismon Mercury had been suggested on the basis of analysis of Mariner 10 images [e.g., Rava and Hapke, 1987;Robinson and Lucey, 1997], but the large number of deposits identified from flyby images [Kerber et al., 2011]was surprising, and the distribution and geological setting of these deposits yielded new and important cluesto Mercury’s complex geologic evolution.
FromMercury Dual Imaging System (MDIS) [Hawkins et al., 2007] images acquired during MESSENGER’s threeflybys of Mercury, Kerber et al. [2011] compiled a catalog of 40 pyroclastic deposits. The deposits are primarilylocated on the floors of impact craters and along the rim of the Caloris impact basin [Kerber et al., 2011].Deposits were identified by high-reflectance, spectrally red terrain surrounding irregularly shaped, rimlesspits. The radial extent of 35 of the 40 deposits was found to range from ~7 to 71 km [Kerber et al., 2011].Together with a ballistic trajectory model, these radial extents were used to estimate the volatile contentneeded to emplace pyroclastic material to these distances from the source vent. Calculations indicatedvolatile contents of ~1600–16,000 ppm CO (or an equivalent amount of other volatile species) [Kerber et al.,2011], figures far larger than those previously hypothesized for Mercury’s interior [e.g., Boynton et al., 2007;Kerber et al., 2011]. Kerber et al. [2011] also used MDIS color images to show that none of the identifiedpyroclastic deposits displays a 1000 nm absorption feature in its reflectance spectrum that would beindicative of a crystal field effect produced by octahedrally coordinated Fe2+ bound in the structure of silicateminerals [Burns, 1993a].
Although MESSENGER flyby data were sufficient to recognize many of the pyroclastic deposits on Mercury[Head et al., 2008, 2009;Murchie et al., 2008; Robinson et al., 2008; Blewett et al., 2009; Kerber et al., 2009, 2011],the insertion of the MESSENGER spacecraft into orbit about Mercury on 18 March 2011 has provided imagesat higher spatial resolution and with more complete spatial coverage than were available during the threeflybys, as well as such additional global data sets as spectral reflectance and topography. In this paper, we useorbital observations to augment the earlier catalog of pyroclastic deposits developed by Kerber et al. [2011]and to characterize those deposits in greater detail. Specific goals of this analysis are (1) to determine themorphometry of the vents associated with the pyroclastic deposits, (2) to assess whether these depositstend to occur in specific settings or in association with specific geologic units, (3) to estimate the relative ageof these deposits and their associated pyroclastic activity, and (4) to further our understanding of the spectralcharacteristics of the pyroclastic deposits.
2. Data Sets Used
To address the goals of this study, we used three data sets from instruments on the MESSENGER spacecraft.The distribution and the morphometry of the deposits and associated vents were investigated with narrow-angle camera (NAC) and wide-angle camera (WAC) images obtained with MDIS. The spatial resolution of theutilized images ranged from ~15 to 200m/pixel for the NAC and ~60 to 500m/pixel for the WAC. Becauseof MESSENGER’s highly eccentric orbit and high northern periapsis [Solomon et al., 2007], the spatialresolution of MDIS NAC and WAC images depend on latitude; images at high northern latitudes havemarkedly higher spatial resolution than images of the southern hemisphere. However, a global campaignof mapping the surface of Mercury at ~250m/pixel with MDIS has been completed, and the global MDISNAC- and WAC-derived mosaic at ~250m/pixel was also utilized in this study when no images of higherresolution were available. Analyzed MDIS NAC, WAC, and mosaic images were geographically referencedusing the U.S. Geological Survey’s Integrated Software for Imagers and Spectrometers. These data werethen analyzed in Environmental Systems Research Institute’s ArcMap geographic information systemsoftware, which allows for coregistration of an array of data sets.
Vent depths were determined from topographic profiles obtained with the Mercury Laser Altimeter (MLA)instrument [Cavanaugh et al., 2007]. The MLA instrument measures the range from the MESSENGERspacecraft to a point on the surface of Mercury, with a footprint diameter of ~15–100m and an along-trackspacing of ~400m [Cavanaugh et al., 2007; Zuber et al., 2012]. The topographic datum for analyzed MLA data
Journal of Geophysical Research: Planets 10.1002/2013JE004480
GOUDGE ET AL. ©2014. American Geophysical Union. All Rights Reserved. 636
is a sphere of radius 2440 km. MLA has a range precision (i.e., shot-to-shot vertical precision) of <1m undernadir-viewing conditions, and the accuracy of the topography with respect to Mercury’s center of mass is<20m [Cavanaugh et al., 2007; Zuber et al., 2012].
Individual MLA measurements of elevation were analyzed alongside coregistered MDIS images to obtaintopographic information for the pyroclastic source vents. Although MLA profile measurements have beeninterpolated to produce gridded topographic data sets, the resolution of the gridded dada is insufficientfor measuring features of small areal extent. Whereas the along-track spacing of MLA footprints remainsrelatively constant at ~400m [Cavanaugh et al., 2007; Zuber et al., 2012], the track-to-track spacing increaseswith increasing distance fromMESSENGER’s periapsis latitude, and there is little southern hemisphere coverageby MLA because the spacecraft altitude is too high for laser ranging [Cavanaugh et al., 2007; Solomon et al.,2007]. Available MLA profiles across individual pyroclastic source vents are therefore sparse at this time.
The spectral reflectance of pyroclastic deposits was investigated with two data sets. MDIS WAC eight-filtercolor images were used to assess the general spectral signature of the pyroclastic deposits. Although theMDIS WAC camera has 11 color filters, with band centers ranging from ~430 to 1010 nm [Hawkins et al., 2007],the mapping phase of MESSENGER’s primary orbital mission concentrated on the acquisition of a globalmosaic of eight-filter color images, obtained with band pass filters that have wavelength centers at ~430, 480,560, 630, 750, 830, 900, and 1000 nm [Hawkins et al., 2007]. All analyzed MDIS color images werephotometrically corrected using the Hapke model of Domingue et al. [2010, 2011], which normalizes the datato an incidence angle of 30°, an emission angle of 0°, and a phase angle of 30°. The high spatial resolution ofMDIS color images provides an excellent basis for locating and identifying the boundaries of pyroclasticdeposits [e.g., Blewett et al., 2009; Kerber et al., 2009, 2011], but the low spectral resolution is not as favorablefor detailed spectral characterization.
To perform such analyses, higher spectral resolution data from the Visible and Infrared Spectrograph (VIRS)portion of the Mercury Atmospheric and Surface Composition Spectrometer (MASCS) instrument [McClintockand Lankton, 2007] were analyzed. VIRS is a point spectrometer with a 0.023° field of view that collectsreflectance data from the surface of Mercury across the wavelength range ~300–1450 nm at a spectralresolution of ~5 nm [McClintock and Lankton, 2007]. VIRS has two spectral channels, one in the ultraviolet (UV)to visible (VIS) region from ~300 to 1050 nm, and one in the near-infrared (NIR) region from ~850 to 1450 nm.Because the NIR channel of the VIRS instrument is susceptible to noise at the elevated temperaturesexperienced on Mercury’s dayside, however, only data from the UV–VIS channel of the VIRS instrumentwere analyzed here. The analyzed MASCS data were converted to reflectance using the techniquesdescribed in detail by Holsclaw et al. [2010], and a first-order photometric correction was applied asdescribed by Izenberg et al. [2014], which normalizes the MASCS data to incidence and emission angles of45° and a phase angle of 90°.
3. Update to the Global Catalog of Pyroclastic Deposits
To build on the global catalog of pyroclastic deposits presented by Kerber et al. [2011], we examined MDISNAC and WAC images from the first 10months of MESSENGER’s orbital mission phase to seek evidence forrimless depressions that could be source vents for pyroclastic deposits [Kerber et al., 2009, 2011]. Identifiedcandidate pyroclastic vents were studied with individual MDIS WAC eight-filter color images to determinetheir spectral signature.
In order to be added to the global catalog of pyroclastic deposits, newly identified candidate vents hadto exhibit two distinct spectral characteristics associated with pyroclastic deposits previously identifiedon Mercury: (1) they must be associated with a high-reflectance deposit having diffuse boundaries and(2) they must have a red spectral signature compared with surrounding terrain [Head et al., 2008, 2009;Murchie et al., 2008; Robinson et al., 2008; Blewett et al., 2009; Kerber et al., 2009, 2011] (e.g., Figure 1).These criteria also help to distinguish the identified candidate vents from collapse pit features, whichhave a similar morphology to the pyroclastic source vents but may be linked to endogenic activityunrelated to pyroclastic volcanism [e.g., Gillis-Davis et al., 2009]. Furthermore, it is important to notethat any pyroclastic deposit that has had its associated source vent buried by younger material (e.g.,volcanic flows or crater ejecta) would not be identified in this work. Such deposits could potentially be
Journal of Geophysical Research: Planets 10.1002/2013JE004480
GOUDGE ET AL. ©2014. American Geophysical Union. All Rights Reserved. 637

identified from global MDIS color mosaics, in a manner similar to the technique employed by Kerberet al. [2011].
With these criteria, 10 newly identified pyroclastic deposits and corresponding source vents were addedto the global catalog (Figure 2), along with the pyroclastic deposit located in the Tyagaraja crateridentified by Blewett et al. [2011], bringing the total in the catalog to 51 deposits. The earlier conventionfor naming pyroclastic deposits [Kerber et al., 2011] was followed with the newly identified deposits(Table 1). As with the previous catalog [Kerber et al., 2011], the current catalog shows that pyroclasticdeposits are relatively evenly distributed across the surface of Mercury and display minimal regionalclustering (Figure 2). However, there does appear to be some degree of local clustering of pyroclasticdeposits along the southern rim of the Caloris impact basin (Figure 2, cyan circle) as well as in and aroundlarge impact craters, such as Praxiteles (Figure 2, orange arrow) and Lermontov (Figure 2, green arrow)[Head et al., 2008, 2009; Murchie et al., 2008; Kerber et al., 2011]. Furthermore, all of the newly identifiedpyroclastic deposits are located in the interiors of impact craters and basins, with the exception of theN Rachmaninoff deposit, which is located in cratered terrain north of the Rachmaninoff basin. This
Figure 2. Locations of the 40 previously identified pyroclastic deposits (red circles) [Kerber et al., 2011], the 10 pyroclasticdeposits newly identified here (yellow circles), and the Tyagaraja pyroclastic deposit (purple circle) [Blewett et al., 2011]. Anapproximate outline of Caloris basin is shown with a cyan dashed line, the location of Lermontov crater is indicated by agreen arrow, and the location of Praxiteles crater is indicated by an orange arrow. The background is the MDIS-derivedglobal mosaic introduced in Figure 1.
Figure 1. (a) Two newly identified pyroclastic deposits on the floor of Kipling crater (~160 km in diameter, centered at�18.5°N, 71.5°E) (Table 1). The vent at left center (white arrow) in the image is associated with the Kipling W deposit,and the upper vent (red arrow) is associated with the Kipling N deposit. Approximate vent outlines are indicated by dashedorange lines. MDIS NAC image EN9221974660M overlaid on a global mosaic obtained from MDIS NAC and WAC imageswith an average resolution of 250m per pixel. (b) False-color MDISWAC eight-band color image, for which red (R), green (G),and blue (B) are wavelengths 996.8 nm, 749 nm, and 430 nm, respectively; the “red” spectral signature of the Kipling N andW deposits is evident. The false-color image is from MDIS WAC images EW0221845266I–EW0221845286G, overlaid on theMDIS-derived global mosaic. North is up in both images.
Journal of Geophysical Research: Planets 10.1002/2013JE004480
GOUDGE ET AL. ©2014. American Geophysical Union. All Rights Reserved. 638

distribution of deposits is consistent with the conclusion of Kerber et al. [2011] that pyroclasticdeposits “are located principally on the floors of craters, along rims of craters, and along the edge ofthe Caloris basin.”
4. Orbital Observations of Pyroclastic Deposits
Building on the earlier work of Kerber et al. [2011], we have analyzed the morphometry, global distribution,geologic associations, relative ages, and spectral characteristics of the pyroclastic deposits and associatedsource vents with the data sets described above.
4.1. Morphometry of the Source Vents and Pyroclastic Deposits
Three main aspects of morphometry were assessed in this study: source vent area, area of the associatedpyroclastic deposits, and source vent depth. Areas of pyroclastic deposits were calculated for the 11 newlyidentified deposits, and source vent areas and depths were calculated for a subset of the entire catalog (i.e.,both new and old source vents) from available MDIS and MLA data.4.1.1. Areas of Source Vents and DepositsBoundaries of source vents and pyroclastic deposits were mapped using MDIS NAC and WAC images. Areas
were calculated from maps in a sinusoidalequal-area projection, which preserves area.High-resolution NAC and WAC images arenot available for every vent at theillumination geometries most favorable formapping topographic lows (such as thesource vents), so we elected to map only 23of the 51 source vents. The 23 mappedsource vents have areas that range from ~60to 800 km2 (Table 2).
Areas for the 11 new pyroclastic depositswere mapped from MDIS WAC eight-filtercolor images on the basis of the high-reflectance and spectrally red signatures ofthe deposits. The newly identified depositshave a range of areas of ~480–4500 km2
(Table 1), values that fall within the range ofdeposit areas mapped by Kerber et al. [2011].As described by Kerber et al. [2011], thesedeposit sizes are large compared withthose on the Moon and are even largerthan their lunar counterparts when scaledfor differences in surface gravitationalacceleration. The larger pyroclastic deposits
Table 1. Names, Locations, and Deposit Areas of Newly Identified Pyroclastic Deposits
Deposit Name Latitude (°N) Longitude (°E) Deposit Area (km2) Reference
Kipling N �18.45 72.03 936 This work.Kipling W �19.21 71.43 1109 This work.Kipling S �21.16 72.40 1956 This work.N Rachmaninoff 36.10 57.30 4273 This work.Tolstoj E �16.70 �161.70 4525 This work.Tolstoj S �21.13 �163.02 524 This work.Tolstoj SE �19.88 �161.14 512 This work.Tyagaraja 3.75 �148.88 498 Blewett et al. [2011]Unnamed crater 6 58.80 �32.90 1352 This work.Unnamed crater 7 32.40 88.20 1383 This work.Unnamed crater 8 �45.04 �167.60 484 This work.
Table 2. Measured Vent Areas for Selected Pyroclastic Source Vents
Deposit Name Vent Area (km2) Reference
Beckett 253 Kerber et al. [2011]Geddes 488 Pashai et al. [2010];
Kerber et al. [2011]Gibran 666 Kerber et al. [2011]Glinka 199 Kerber et al. [2011]Hemingway 148 Kerber et al. [2011]Kipling W 405 This work.Kipling S 245 This work.Lermontov NE 79 Kerber et al. [2011]Mistral NW 87 Kerber et al. [2011]N Rachmaninoff 711 This work.NE Derzhavin 339 Kerber et al. [2011]NE Rachmaninoff 794 Kerber et al. [2011]Picasso 653 Kerber et al. [2011]Praxiteles NE 127 Kerber et al. [2011]Praxiteles SW 237 Kerber et al. [2011]RS-03 297 Kerber et al. [2011]RS-05 356 Kerber et al. [2011]Scarlatti 483 Kerber et al. [2011]To Ngoc Van 327 Kerber et al. [2011]Tolstoj E 149 This work.Tolstoj S 61 This work.Unnamed crater 1 176 Kerber et al. [2011]Unnamed crater 5a 329 Kerber et al. [2011]
Journal of Geophysical Research: Planets 10.1002/2013JE004480
GOUDGE ET AL. ©2014. American Geophysical Union. All Rights Reserved. 639

on Mercury suggest that the erupting magma at the time of emplacement of these deposits hadvolatile contents that generally exceeded those of lunar magmas [Kerber et al., 2011].4.1.2. Vent DepthsOf the 51 identified pyroclastic deposits (Figure 2), as of this writing only six have been profiled by MLA(e.g., Figures 3a and 3b). Topographic profiles across these six vents show that the vent depths range from
~1.2 to 2.4 km (Table 3), with a mean depth of1.8 km and a standard deviation of 0.4 km.The depths for the pyroclastic source ventsindicated by MLA topographic data are inagreement with the depths of rimlessdepressions, both with and without identifiedpyroclastic deposits, determined from stereo-derived topography [Gwinner et al., 2012].The relatively narrow range of depths of~1.2–2.4 km suggests either that the
Figure 3. Topographic profiles of representative pyroclastic source vents on Mercury and the Moon. North is up in allimages. (a) The To Ngoc Van pyroclastic source vent on Mercury at 52.8°N, �111.6°E [Kerber et al., 2011]. The locus of anMLA topographic profile is indicated by the orange line, overlaid on the MDIS-derived global mosaic introduced in Figure 1.(b) MLA topographic profile of the To Ngoc Van vent along the line indicated in Figure 3a. The vent depth is ~2.1 km. Theprofile is from MLASCIRDR1105170905, and the topographic datum is a sphere of radius 2440 km. Vertical exaggeration is~12.5:1. (c) The Orientale dark mantling deposit source vent [Head et al., 2002]. The location of a Lunar Orbiter Laser Altimeter(LOLA) topographic profile is indicated by the orange line. The image is from a Lunar Reconnaissance Orbiter Camera globalmosaic at a resolution of 100m/pixel [Robinson et al., 2010]. (d) LOLA [Smith et al., 2010] topographic profile along the lineindicated in Figure 3c. The vent depth is ~2.6 km. The profile is from LOLARDR_092020648, and the topographic datum isthe gravitational equipotential surface evaluated at a radius of 1737.4 km from the spherical harmonic representation ofthe gravity field, evaluated to degree and order 60, given by Mazarico et al. [2012]. Vertical exaggeration is ~12.5:1.
Table 3. Measured Source Vent Depths for Pyroclastic DepositsWith MLA Coverage
Deposit Name Vent Depth (km) Reference
Gibran 1.5 Kerber et al. [2011]NE Derzhavin 1.7 Kerber et al. [2011]NE Rachmaninoff 2.4 Kerber et al. [2011]RS-02 1.2 Kerber et al. [2011]Scarlatti 1.8 Kerber et al. [2011]To Ngoc Van 2.1 Kerber et al. [2011]
Journal of Geophysical Research: Planets 10.1002/2013JE004480
GOUDGE ET AL. ©2014. American Geophysical Union. All Rights Reserved. 640

formation mechanism may control the final depth of the vent, or that these six data points do not span thefull range of depth values.
4.2. Geologic Associations of Pyroclastic Deposits
An important aspect of the global distribution of these pyroclastic deposits is their association with differentterrains and geologic features. The pyroclastic deposits typically occurwithin impact craters [Kerber et al., 2011];46 of 51 (~90%) deposits occur in such settings. This strong correlation suggests a possible genetic linkbetween impact cratering and the pyroclastic deposits.
We have also investigated the relation between pyroclastic deposits and the smooth plains depositsmapped byDenevi et al. [2013] (Figure 4). Denevi et al. [2013] interpreted the majority of smooth plains units to bevolcanic in origin, and so an assessment of the relation between pyroclastic and plains deposits may elucidateaspects of the volcanological evolution of Mercury. On global to regional scales, most pyroclastic deposits aredistant from smooth plains, but some pyroclastic deposits are found around the margins of smooth plainsunits, as earlier noted byDenevi et al. [2013]. The only large smooth plains unit to contain a pyroclastic depositin its interior is the expanse of circum-Caloris plains to the north of the Caloris basin (Figure 4).
4.3. Relative Timing of Pyroclastic Activity
To assess the relative timing of the pyroclastic activity associated with these 51 pyroclastic deposits, each ofthe source vents was examined for crosscutting relationships. We found distinct crosscutting relationships at14 pyroclastic source vents, and possible but less clear crosscutting relationships at 12 additional pyroclasticsource vents. These relationships fall into three main categories. The first category is crosscutting by asecondary crater chain, a situation observed at only one site, the Praxiteles SW vent (Figure 5). The secondarycrater chain crosscutting the Praxiteles SW vent can be traced back to the fresh, rayed impact crater Hokusai(~114 km in diameter, centered at 57.8°N, 16.9°E), which is located in the northern smooth plains [Head et al.,2011] at a distance of ~2600 km.
The second type of relationship observed is crosscutting by contractional tectonic features (i.e., wrinkleridges or lobate scarps). Clear relationships are observed at the NE Derzhavin (Figure 6a) and Glinka(Figure 6b) source vents, and more ambiguous relationships are observed at two other pyroclastic sourcevents, those associated with unnamed crater 1 (Figure 6c) and Geddes crater (Figure 6d) [Pashai et al., 2010;Kerber et al., 2011].
Lobate scarps are thought to be an expression of surface-breaking thrust faults [e.g., Strom et al., 1975;Watters et al., 1998]. At the NE Derzhavin site, the formation of Victoria Rupes appears to have caused thewall slump feature observed in the western portion of the NE Derzhavin vent (Figure 6a, yellow arrow). Ascrustal material was thrust over the vent during formation of Victoria Rupes, the vent may have provided
Figure 4. Distribution of pyroclastic deposits (as in Figure 1) compared with the distribution of smooth plains depositsmapped by Denevi et al. [2013] (blue regions). Note that the pyroclastic deposits are either distant from or located onthe margins of the smooth plains units. The background is the MDIS-derived global mosaic introduced in Figure 1.
Journal of Geophysical Research: Planets 10.1002/2013JE004480
GOUDGE ET AL. ©2014. American Geophysical Union. All Rights Reserved. 641

accommodation space, permitting thecollapse of a portion of the leadingedge of the scarp into the vent. At theGlinka site, the lobate scarp is clearlyobserved to cut across the source ventrim as well as the vent floor (Figure 6b,yellow arrow). At unnamed crater 1[Kerber et al., 2011], no definitivecrosscutting relationship is observed,although there may be an indicationthat the vent interior is crosscut by theassociated scarp (Figure 6c, yellowarrow), an observation that ishindered by shadowing in theavailable NAC image. Similarly, at theGeddes site, the crisp morphology ofthe scarp (Figure 6d, red arrows) maysuggest that it was not blanketed bypyroclastic material; however, nodefinitive crosscutting relationship isobservable.
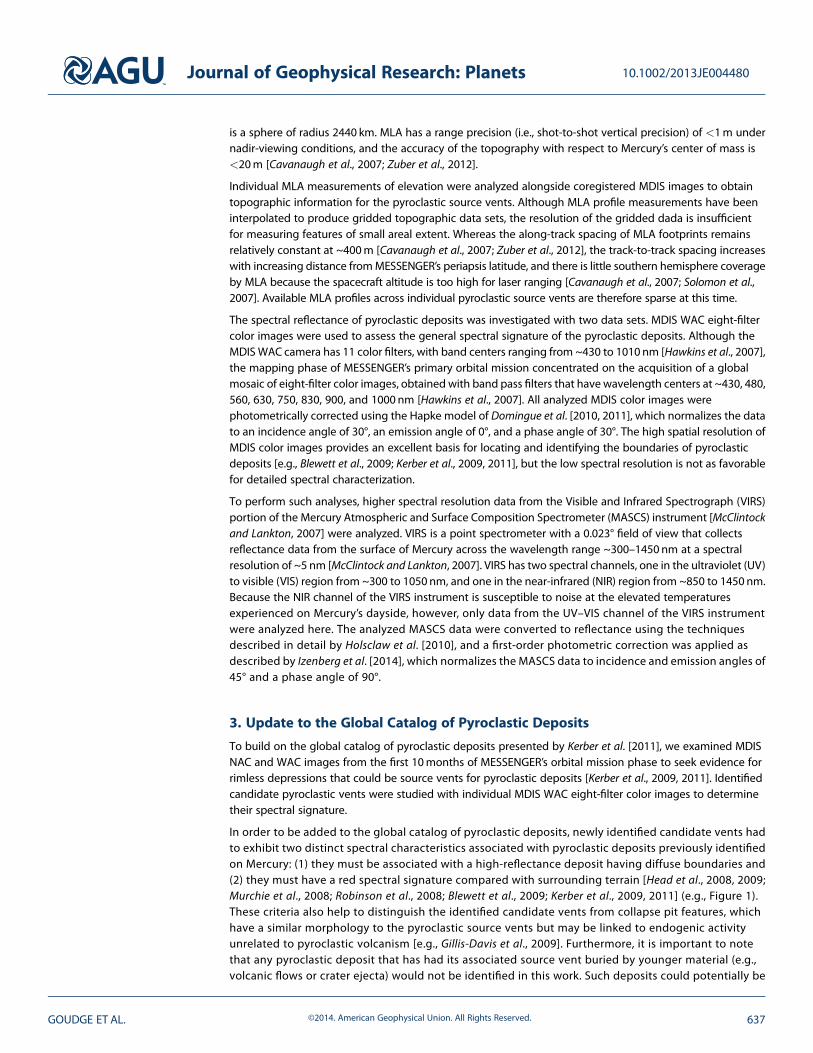
The third type of crosscuttingrelationship is between pyroclasticdeposits and hollows, which are smalldepressions (on the order of tens to afew thousands of meters in diameter)with high-reflectance interiors andsurrounding “halos” characterized byrelatively “blue” spectra (i.e., reflectanceincreases less steeply with wavelength)[Blewett et al., 2011, 2013; Thomas et al.,2014]. At 11 of the 51 pyroclasticdeposits, hollows clearly crosscut thepyroclastic vents and deposits (e.g.,Figure 7, orange arrows), whereasanother 11 of the pyroclastic depositsare possibly crosscut by hollows, withconfirmation hindered by imageresolution. In all cases for whichadequate data exist, hollows appear topostdate the pyroclastic activity. It isalso important to note that 29 of the51 pyroclastic deposits show noassociation with hollows, and hollowsare also found in many locationswhere there are no pyroclastic deposits[Blewett et al., 2011, 2013; Thomaset al., 2014].
To supplement crosscutting andstratigraphic relationships, planetary surfaces are commonly dated in both relative and absolute termsfrom the size-frequency distribution of superposed impact craters and a known or estimated impact craterproduction function [e.g., Hartmann, 1966, 1977; Neukum et al., 1975]. However, dating pyroclasticdeposits with such a method is not straightforward because the deposits are surficial and mantle the
Figure 5. A secondary crater chain from the Hokusai impact crater cross-cuts the Praxiteles SW pyroclastic deposit and source vent at 26.0°N, �60.3°E[Kerber et al., 2011]. North is up in both images. (a) Context image showingthe Praxiteles SW pyroclastic deposit and source vent (approximate ventoutline is indicated by dashed orange line) and the crosscutting secondarycrater chain (indicated by white arrows). Mosaic of MDIS NAC imagesEN0223745081M, EN0223745074M, and EN0223745067M overlaid on theMDIS-derived global mosaic introduced in Figure 1. (b) Close-up view ofthe Praxiteles SW pyroclastic deposit source vent. Trend of crosscuttingsecondary crater chain is indicated by a cyan ellipse. Mosaic of MDIS NACimages EN0223745081M, EN0223745074M, and EN0223745067M.
Journal of Geophysical Research: Planets 10.1002/2013JE004480
GOUDGE ET AL. ©2014. American Geophysical Union. All Rights Reserved. 642

underlying terrain, so it can be difficult to determine whether a crater is superposed on the pyroclasticdeposit or the underlying surface. Further, the unconsolidated nature of the pyroclastic deposits can affectthe size and preservation of impact craters [e.g., Lucchitta and Schmitt, 1974]. Moreover, the areas of thepyroclastic deposits are typically small, limiting the statistical precision of crater size-frequencydistributions. These complications effectively prevent the derivation of relative or absolute crater retentionages for individual pyroclastic deposits.
Nonetheless, the fact that ~90% of these deposits occur within large impact craters can be used to assess theirrelative age. Large craters on the surface of Mercury are commonly degraded as a result of modification byseveral processes, including volcanism, tectonic deformation, emplacement of impact ejecta, and the formationof superposed craters [e.g., Spudis and Guest, 1988; Watters et al., 2009; Prockter et al., 2010, 2012; Baker et al.,2011]. Therefore, assessing the degradation state of the host craters for the 46 pyroclastic deposits containedwithin them can offer some insight into their relative timing. Such an assessment was performed in this analysiswith the qualitative classification of crater degradation, regarded as a proxy for relative crater age, of Spudis andGuest [1988]. Each crater that hosts a pyroclastic deposit was examined in MDIS images and assigned a craterdegradation state. Those crater degradation classes are divided by geologic era [Spudis and Guest, 1988], and
Figure 6. Crosscutting relationships between pyroclastic source vents and contractional tectonic structures, indicated byred arrows. North is up in all images. (a) Victoria Rupes (red arrows) crosscuts the NE Derzhavin pyroclastic source ventat 48.3°N,�33.8°E [Kerber et al., 2011]. The yellow arrow indicates the slump feature caused by thrusting of material over theNE Derzhavin vent depression. Mosaic of MDIS NAC images EN0221237588M, EN0221237609M, and EN0221237630Moverlaid on the MDIS-derived global mosaic introduced in Figure 1. (b) A lobate scarp (red arrows) crosscuts the Glinkapyroclastic source vent at 15.0°N, �112.4°E [Kerber et al., 2011]. The scarp clearly cuts the Glinka vent rim at the pointindicated by the yellow arrow. Mosaic of MDIS NAC images EN0242295873M and EN0242295825M overlaid on the globalmosaic. (c) A lobate scarp (red arrows) crosscuts the pyroclastic source vent in unnamed crater 1 at 22.0°N,�67.5°E [Kerberet al., 2011]. The scarp may crosscut the interior of the source vent at the location indicated by the yellow arrow. Mosaic ofMDIS NAC images EN0239163782M, EN0223745181M, and EN0223745173M and MDIS WAC image EW0238909186G. (d)A lobate scarp (red arrows) crosscuts the Geddes pyroclastic deposit source vent at 27.2°N, �29.5°E [Pashai et al., 2010;Kerber et al., 2011]. MDIS NAC image EN0221107380M overlaid on the global mosaic.
Journal of Geophysical Research: Planets 10.1002/2013JE004480
GOUDGE ET AL. ©2014. American Geophysical Union. All Rights Reserved. 643
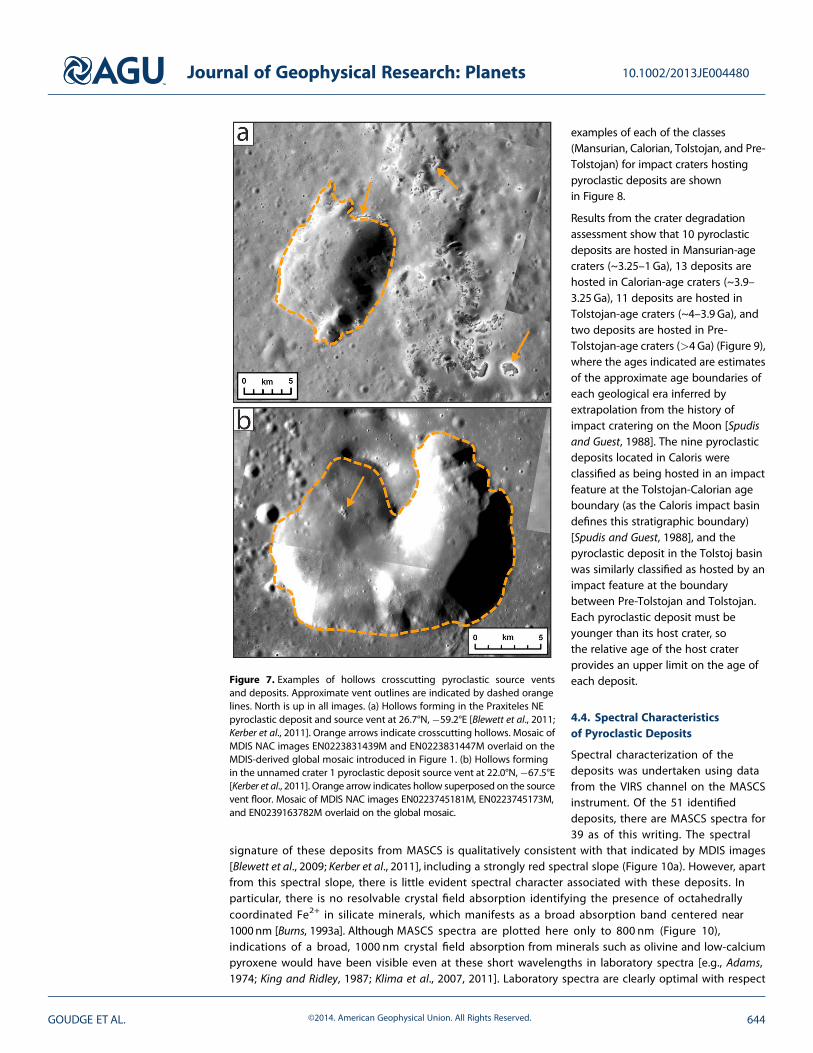
examples of each of the classes(Mansurian, Calorian, Tolstojan, and Pre-Tolstojan) for impact craters hostingpyroclastic deposits are shownin Figure 8.
Results from the crater degradationassessment show that 10 pyroclasticdeposits are hosted in Mansurian-agecraters (~3.25–1Ga), 13 deposits arehosted in Calorian-age craters (~3.9–3.25Ga), 11 deposits are hosted inTolstojan-age craters (~4–3.9 Ga), andtwo deposits are hosted in Pre-Tolstojan-age craters (>4Ga) (Figure 9),where the ages indicated are estimatesof the approximate age boundaries ofeach geological era inferred byextrapolation from the history ofimpact cratering on the Moon [Spudisand Guest, 1988]. The nine pyroclasticdeposits located in Caloris wereclassified as being hosted in an impactfeature at the Tolstojan-Calorian ageboundary (as the Caloris impact basindefines this stratigraphic boundary)[Spudis and Guest, 1988], and thepyroclastic deposit in the Tolstoj basinwas similarly classified as hosted by animpact feature at the boundarybetween Pre-Tolstojan and Tolstojan.Each pyroclastic deposit must beyounger than its host crater, sothe relative age of the host craterprovides an upper limit on the age ofeach deposit.
4.4. Spectral Characteristicsof Pyroclastic Deposits
Spectral characterization of thedeposits was undertaken using datafrom the VIRS channel on the MASCSinstrument. Of the 51 identifieddeposits, there are MASCS spectra for39 as of this writing. The spectral
signature of these deposits from MASCS is qualitatively consistent with that indicated by MDIS images[Blewett et al., 2009; Kerber et al., 2011], including a strongly red spectral slope (Figure 10a). However, apartfrom this spectral slope, there is little evident spectral character associated with these deposits. Inparticular, there is no resolvable crystal field absorption identifying the presence of octahedrallycoordinated Fe2+ in silicate minerals, which manifests as a broad absorption band centered near1000nm [Burns, 1993a]. Although MASCS spectra are plotted here only to 800 nm (Figure 10),indications of a broad, 1000 nm crystal field absorption from minerals such as olivine and low-calciumpyroxene would have been visible even at these short wavelengths in laboratory spectra [e.g., Adams,1974; King and Ridley, 1987; Klima et al., 2007, 2011]. Laboratory spectra are clearly optimal with respect
Figure 7. Examples of hollows crosscutting pyroclastic source ventsand deposits. Approximate vent outlines are indicated by dashed orangelines. North is up in all images. (a) Hollows forming in the Praxiteles NEpyroclastic deposit and source vent at 26.7°N,�59.2°E [Blewett et al., 2011;Kerber et al., 2011]. Orange arrows indicate crosscutting hollows. Mosaic ofMDIS NAC images EN0223831439M and EN0223831447M overlaid on theMDIS-derived global mosaic introduced in Figure 1. (b) Hollows formingin the unnamed crater 1 pyroclastic deposit source vent at 22.0°N,�67.5°E[Kerber et al., 2011]. Orange arrow indicates hollow superposed on the sourcevent floor. Mosaic of MDIS NAC images EN0223745181M, EN0223745173M,and EN0239163782M overlaid on the global mosaic.
Journal of Geophysical Research: Planets 10.1002/2013JE004480
GOUDGE ET AL. ©2014. American Geophysical Union. All Rights Reserved. 644
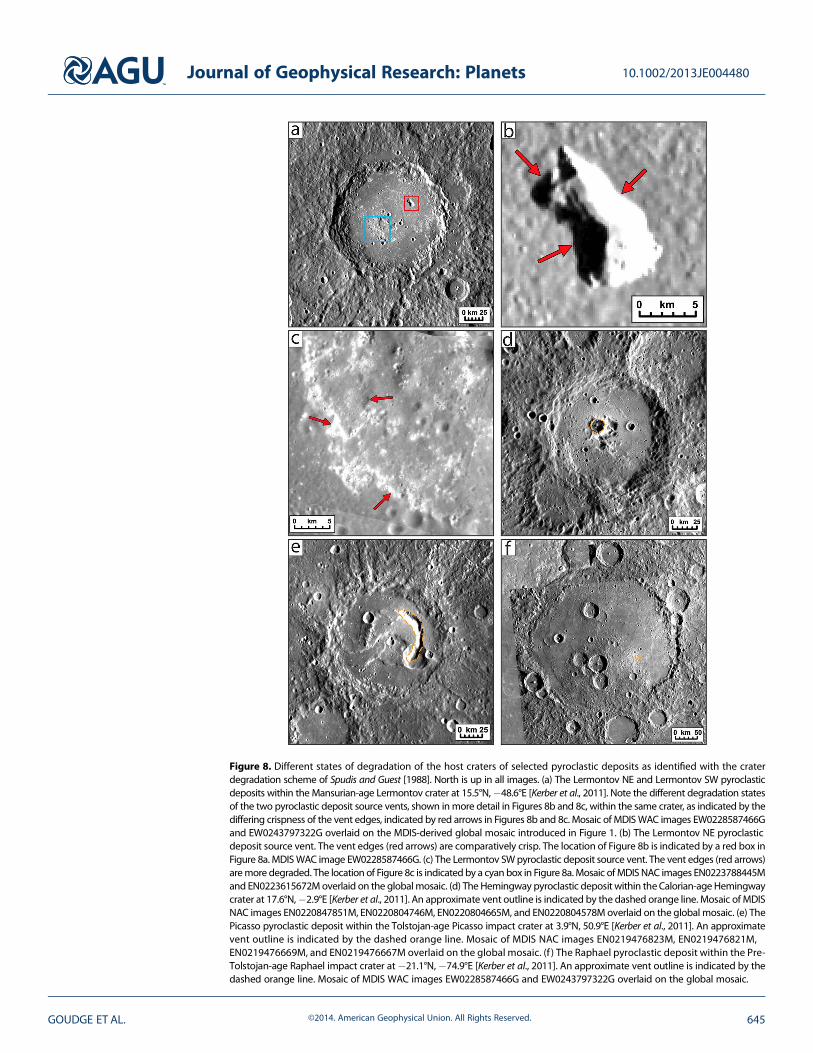
Figure 8. Different states of degradation of the host craters of selected pyroclastic deposits as identified with the craterdegradation scheme of Spudis and Guest [1988]. North is up in all images. (a) The Lermontov NE and Lermontov SW pyroclasticdeposits within the Mansurian-age Lermontov crater at 15.5°N,�48.6°E [Kerber et al., 2011]. Note the different degradation statesof the two pyroclastic deposit source vents, shown inmore detail in Figures 8b and 8c, within the same crater, as indicated by thediffering crispness of the vent edges, indicated by red arrows in Figures 8b and 8c. Mosaic of MDISWAC images EW0228587466Gand EW0243797322G overlaid on the MDIS-derived global mosaic introduced in Figure 1. (b) The Lermontov NE pyroclasticdeposit source vent. The vent edges (red arrows) are comparatively crisp. The location of Figure 8b is indicated by a red box inFigure 8a. MDISWAC image EW0228587466G. (c) The Lermontov SWpyroclastic deposit source vent. The vent edges (red arrows)aremore degraded. The location of Figure 8c is indicated by a cyan box in Figure 8a.Mosaic ofMDISNAC images EN0223788445Mand EN0223615672Moverlaid on the globalmosaic. (d) The Hemingway pyroclastic deposit within theCalorian-ageHemingwaycrater at 17.6°N,�2.9°E [Kerber et al., 2011]. An approximate vent outline is indicated by the dashed orange line. Mosaic of MDISNAC images EN0220847851M, EN0220804746M, EN0220804665M, and EN0220804578M overlaid on the global mosaic. (e) ThePicasso pyroclastic deposit within the Tolstojan-age Picasso impact crater at 3.9°N, 50.9°E [Kerber et al., 2011]. An approximatevent outline is indicated by the dashed orange line. Mosaic of MDIS NAC images EN0219476823M, EN0219476821M,EN0219476669M, and EN0219476667M overlaid on the global mosaic. (f ) The Raphael pyroclastic deposit within the Pre-Tolstojan-age Raphael impact crater at�21.1°N,�74.9°E [Kerber et al., 2011]. An approximate vent outline is indicated by thedashed orange line. Mosaic of MDIS WAC images EW0228587466G and EW0243797322G overlaid on the global mosaic.
Journal of Geophysical Research: Planets 10.1002/2013JE004480
GOUDGE ET AL. ©2014. American Geophysical Union. All Rights Reserved. 645

to high signal-to-noise ratios, typically no mixing of different phases, and no space weathering, all ofwhich are in contrast to the spacecraft data analyzed here; however, no broad absorption featurecentered near 1000 nm is evident in the analyzed spectra. This observation is also consistent withprevious findings [Blewett et al., 2009; Kerber et al., 2011].
A common technique when looking at spectra of planetary surfaces is to ratio the data to spectrally neutralbackground terrain [e.g.,McCord et al., 1972, 1981]. This technique brings out the spectral diversity in an areaof interest and accentuates any potential spectral features or absorptions and has been used previously forMASCS spectral analysis [McClintock et al., 2008; Izenberg et al., 2014]. Each of the spectra from the 39pyroclastic deposits with MASCS coverage was ratioed to a spectrum from a nearby region exterior to thepyroclastic deposit but acquired during the same orbit (Figures 10b and 10c).
The exterior spectra used for ratioing were manually examined and selected on the basis of theirsimilarity in absolute reflectance and spectral shape to the average MASCS/VIRS global spectralsignature [Izenberg et al., 2014], which is an average of all MASCS/VIRS spectra from the primary and firstextended missions of the MESSENGER spacecraft that satisfy the following restrictions: incidenceangle< 70°, emission angle< 80°, phase angle< 95°, detector temperature< 35°C, and number ofspectra in the observation> 20. The spectral detector pixels were also binned by four for this meanspectrum from the VIS detector [Izenberg et al., 2014]. The similarity to the MASCS/VIRS global averagespectrum was assessed by examining the ratio of the exterior spectra to the global average and searchingfor spectra with values of approximately 1 across the wavelength range of interest (i.e., 300–800 nm).
Figure 9. Results of the survey of host crater morphology for the 46 pyroclastic deposits located within impact craters.Shown are the major periods in Mercury’s global stratigraphy [Spudis and Guest, 1988] and an approximate geologicaltimescale for Mercury, modified from Head et al. [2007], on the left, and the number of pyroclastic deposits that arecontained within host craters that have a degradation state comparable with craters from each geologic period as definedby Spudis and Guest [1988]. The nine deposits that fall at the Tolstojan-Calorian boundary are the nine deposits containedwithin the Caloris basin (which defines this stratigraphic boundary), and the deposit at the boundary between the Pre-Tolstojan and the Tolstojan is contained within the Tolstoj basin (which defines this stratigraphic boundary). Note theapproximately even distribution of pyroclastic deposits hosted within older impact craters (e.g., Tolstojan) and youngerimpact craters (e.g., Mansurian).
Journal of Geophysical Research: Planets 10.1002/2013JE004480
GOUDGE ET AL. ©2014. American Geophysical Union. All Rights Reserved. 646
Although different spectra were used for determining the ratioed reflectance from each pyroclastic deposit,all of these ratios approximate a ratio to the global average MASCS/VIRS spectrum [Izenberg et al., 2014]. Aplot of the average of the 39 denominator spectra with 1-standard-deviation bounds (Figure 10b) shows thatthere is minimal variability among denominator spectra, and thus the adopted procedure allows forinterdeposit comparison of ratioed reflectance spectra.
From the spectral ratioing technique,the pyroclastic deposits are seen againto be spectrally redder than theirsurrounding terrain (Figure 10c).However, the steepness of the slope ofthe ratioed spectra is variable. Somedeposits have a weakly red slopewhereas some have a strongly redslope in the ratioed data; slopevalues over visible wavelengths inthe ratioed spectra range over anorder of magnitude (Figure 10c).Additionally, all of the pyroclasticdeposits, with the exception of theunnamed crater 4 deposit [Kerberet al., 2011], have mean ratioedreflectance values >1 across thewavelength region ~300–800 nm,
Figure 10. Example MASCS spectra of 15 pyroclastic deposits showing the general spectral characteristics of these deposits.(a) Geometrically corrected reflectance spectra for 15 different pyroclastic deposits, as well as the average of the 39 spectra ofsurrounding terrain used for ratioing (black line; see also Figure 10b). Note that all the spectra have higher reflectance and asteeper spectral slope than the average spectrum of surrounding terrain. MASCS orbit numbers for the plotted spectra arelisted in Table 4. (b) Plot of the average of the 39 spectra of terrain surrounding the pyroclastic deposits (thick black line).Shaded area indicates the 1-standard-deviation bounds on this average. Note the relatively narrow range for spectra of sur-roundings. (c) RatioedMASCS spectra for the 15 pyroclastic deposits shown in Figure 10a. The reference spectrum in each caseis that of surrounding terrain that has a spectrum near the global average for Mercury [Izenberg et al., 2014] obtained duringthe same orbit. Note the range in spectral characteristics, although all deposits have a red spectral slope and variable degreesof a turndown in the UV. Spectra are offset for clarity.
Table 4. MASCS Orbit Numbers for the Spectra Displayed in Figure 10
Deposit Name Orbit Number Reference
Geddes ORB_11274_091908 Kerber et al. [2011]Glinka ORB_11312_221408 Kerber et al. [2011]Hemmingway ORB_12073_223244 Kerber et al. [2011]Lermontov SW ORB_11247_091659 Kerber et al. [2011]Mistral SE ORB_11103_161453 Kerber et al. [2011]NE Derzhavin ORB_11099_154240 Kerber et al. [2011]Picasso ORB_11257_165554 Kerber et al. [2011]Praxiteles NE ORB_11106_043345 Kerber et al. [2011]Rachmaninoff SE ORB_11226_085956 Kerber et al. [2011]Raphael ORB_11109_122433 Kerber et al. [2011]RS-04c ORB_11359_131457 Kerber et al. [2011]To Ngoc Van OB2_12123_230528 Kerber et al. [2011]Tyagaraja ORB_11346_063128 Blewett et al. [2011]Unnamed crater 2 ORB_11346_012509 Kerber et al. [2011]Unnamed crater 5a ORB_11336_233947 Kerber et al. [2011]
Journal of Geophysical Research: Planets 10.1002/2013JE004480
GOUDGE ET AL. ©2014. American Geophysical Union. All Rights Reserved. 647

again indicating that they are brighter than the surrounding terrain (Figure 10a). The mean relativereflectance value for the unnamed crater 4 deposit is slightly less than 1, but this deposit appearsbrighter than the surrounding terrain in MDIS eight-filter color images, so this low relative reflectancevalue may be due to the precise location of the MASCS footprint in relation to the pyroclastic deposititself (i.e., the footprint may include both portions of the bright pyroclastic deposit and darkersurrounding material). Alternatively, this observation may be the result of the specific choice ofbackground terrain used in ratioing for this individual deposit.
In addition to the red spectral slope, for many of the ratioed spectra there appears to be a downturn inthe ratioed reflectance values at ultraviolet wavelengths, shortward of ~400nm (Figure 10c). The UV downturnis seen with varying degrees of strength in the ratioed reflectance data (Figure 10c). To quantify this spectralfeature, we define the spectral parameter
UVdepth ¼ Depth300 þ Depth325 þ Depth350; (1)
which uses the formulations
Depth300 ¼ R 401ð Þ½ �– 401� 303½ � VISslope� �
= R 303ð Þ½ �; (2)
Depth325 ¼ R 401ð Þ½ �– 401� 324½ � VISslope� �
= R 324ð Þ½ �; (3)
Depth350 ¼ R 401ð Þ½ �– 401� 350½ � VISslope� �
= R 350ð Þ½ �; (4)
and
VISslope ¼ R 550ð Þ½ � � R 750ð Þ½ �f g= 550� 750f g; (5)
where R(λ) is the ratioed reflectance value at the wavelength λ given in nanometers. To avoid spuriousresults from channel-to-channel instrument noise, a running average of ratioed reflectance values fromthree adjacent spectral channels was used in calculating the parameters in the above expressions,with the averages centered on the wavelengths listed in equations (2)–(5). The spectral parametergiven by equation (1) approximately maps the fractional strength of the UV downturn in the ratioedspectral data by calculating the ratio of the expected ratioed reflectance value at 300, 325, and350 nm from the visible wavelength slope (VISslope) to the actual ratioed reflectance value at thesewavelengths. Spectra with stronger UV downturns (i.e., steeper UV slopes) will have a higher UVdepthparameter value.
With this UVdepth parameter, we have classified the MASCS spectra of the pyroclastic deposits into fourspectral types, types I to IV (Figure 11). These types were distinguished on the basis of the mean (μUV) andstandard deviation (σUV) of the calculated UVdepth values (~3.11 and 0.08, respectively):
For type I;UVdepth < μUV � σUV
For type II;μUV � σUV ≤ UVdepth < μUV
For type III;μUV ≤ UVdepth < μUV þ σUV
For type IV;μUV þ σUV ≤ UVdepth
Type I spectra typically have a red spectral slope and minimal UV downturn, type II spectra typically have aslightly redder spectral slope with a weak UV downturn, type III spectra typically have a still redder spectralslope and a clear UV downturn, and type IV spectra typically have the steepest red spectral slope and thestrongest UV downturn (Figure 11). The absolute reflectance values for these four types also increases fromtype I to type IV (Figure 11), and plotting the UVdepth parameter versus absolute reflectance at 700 nm (i.e.,unratioed reflectance) shows a clear positive correlation (Figure 12). This relationship is approximately linear(with a squared correlation coefficient r2 = 0.61), suggesting that the process that contributes to a weakerUV downturn also results in a darkening of the deposit material.
Journal of Geophysical Research: Planets 10.1002/2013JE004480
GOUDGE ET AL. ©2014. American Geophysical Union. All Rights Reserved. 648

Figure 11. MASCS spectra showing examples of the four different spectral types (types I–IV). (a) Geometricallycorrected reflectance for the Kipling W pyroclastic deposit (type I), RS-05 pyroclastic deposit (type II), Lermontov SWpyroclastic deposit (type III), and Tyagaraja pyroclastic deposit (type IV) [Blewett et al., 2011; Kerber et al., 2011]. Spectraare from MASCS orbital tracks ORB_11222_205837, ORB_11354_152144, ORB_11247_091659, and ORB_11346_063128for the Kipling W, RS-05, Lermontov SW, and Tyagaraja pyroclastic deposits, respectively. (b) Ratioed MASCS spectra forthe four spectra shown in Figure 11a. The reference spectrum in each case is that of surrounding terrain that has aspectrum near the global average for Mercury [Izenberg et al., 2014] obtained during the same orbit. Note the changefrom a weakly red spectral slope and minimal to no UV downturn for type I to a strongly red spectral slope and strongUV downturn for type IV. (c–f ) Locations of MASCS footprints on Mercury’s surface (indicated by filled red boxes)for the spectra shown in Figure 11a and used as the numerators for the ratioed spectra in Figure 11b, for the(Figure 11c) Kipling W, (Figure 11d) RS-05, (Figure 11e) Lermontov SW, and (Figure 11f) Tyagaraja pyroclastic deposits.Approximate vent outlines are indicated by dashed orange lines. Background for all images is the MDIS-derived globalmosaic introduced in Figure 1.
Journal of Geophysical Research: Planets 10.1002/2013JE004480
GOUDGE ET AL. ©2014. American Geophysical Union. All Rights Reserved. 649
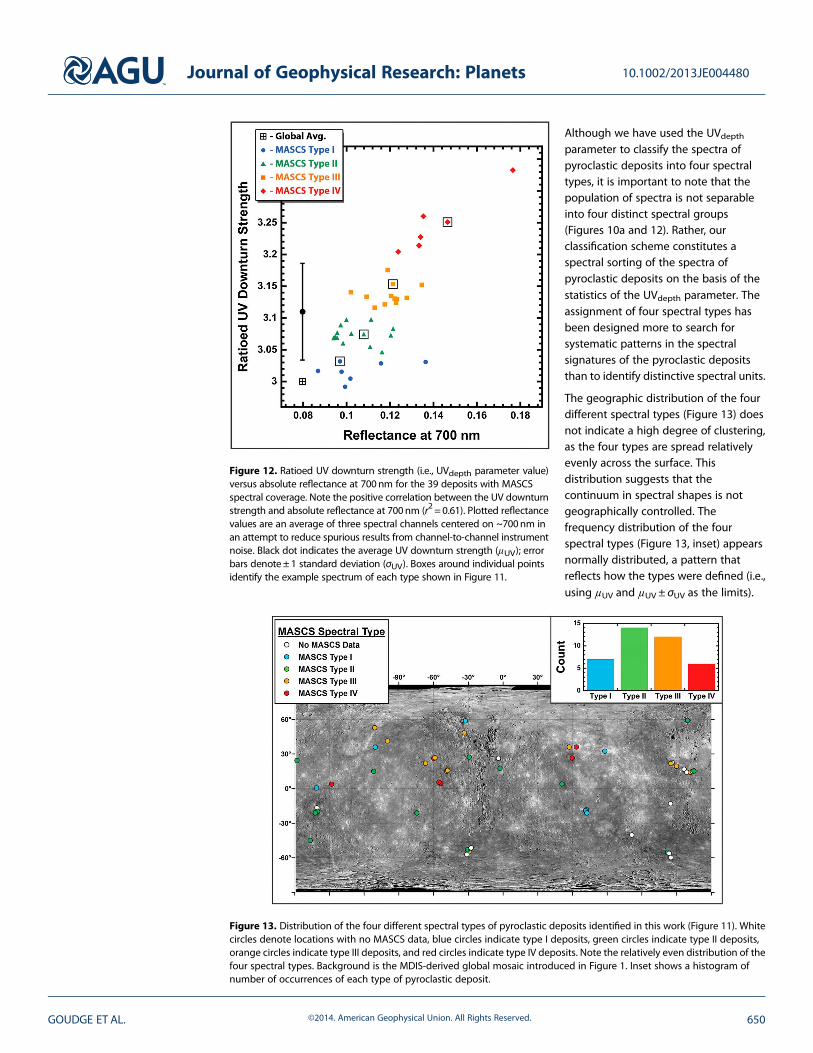
Although we have used the UVdepthparameter to classify the spectra ofpyroclastic deposits into four spectraltypes, it is important to note that thepopulation of spectra is not separableinto four distinct spectral groups(Figures 10a and 12). Rather, ourclassification scheme constitutes aspectral sorting of the spectra ofpyroclastic deposits on the basis of thestatistics of the UVdepth parameter. Theassignment of four spectral types hasbeen designed more to search forsystematic patterns in the spectralsignatures of the pyroclastic depositsthan to identify distinctive spectral units.
The geographic distribution of the fourdifferent spectral types (Figure 13) doesnot indicate a high degree of clustering,as the four types are spread relativelyevenly across the surface. Thisdistribution suggests that thecontinuum in spectral shapes is notgeographically controlled. Thefrequency distribution of the fourspectral types (Figure 13, inset) appearsnormally distributed, a pattern thatreflects how the types were defined (i.e.,using μUV and μUV ± σUV as the limits).
Figure 12. Ratioed UV downturn strength (i.e., UVdepth parameter value)versus absolute reflectance at 700nm for the 39 deposits with MASCSspectral coverage. Note the positive correlation between the UV downturnstrength and absolute reflectance at 700nm (r2=0.61). Plotted reflectancevalues are an average of three spectral channels centered on ~700nm inan attempt to reduce spurious results from channel-to-channel instrumentnoise. Black dot indicates the average UV downturn strength (μUV); errorbars denote± 1 standard deviation (σUV). Boxes around individual pointsidentify the example spectrum of each type shown in Figure 11.
Figure 13. Distribution of the four different spectral types of pyroclastic deposits identified in this work (Figure 11). Whitecircles denote locations with no MASCS data, blue circles indicate type I deposits, green circles indicate type II deposits,orange circles indicate type III deposits, and red circles indicate type IV deposits. Note the relatively even distribution of thefour spectral types. Background is the MDIS-derived global mosaic introduced in Figure 1. Inset shows a histogram ofnumber of occurrences of each type of pyroclastic deposit.
Journal of Geophysical Research: Planets 10.1002/2013JE004480
GOUDGE ET AL. ©2014. American Geophysical Union. All Rights Reserved. 650

5. Discussion
On the basis of the orbital observations of pyroclastic deposits presented above, we may draw severalinferences about the nature and timing of pyroclastic volcanic activity on Mercury.
5.1. Vent Morphometry
The measured areas for the 23 confidently mapped source vents (Table 2) show that these vents are large,comparable in size to terrestrial calderas formed from large plinian eruptions [e.g., Lipman, 1997; Geyer andMartí, 2008]. This size range then raises the question of whether the depressions present at the center of thepyroclastic deposits are actually vents or are instead calderas formed by the posteruption collapse of thesurface. Future work involving detailed stratigraphic mapping of individual events coupled with investigationof high-spatial-resolution stereo-derived topography for these vents will help to address this question [e.g.,Gwinner et al., 2012].
Although vent areas are similar to those of terrestrial calderas from explosive volcanic activity, vent depthshave a relatively narrow range of ~1.2–2.4 km (Figures 3a and 3b and Table 3), and the vents are ~2–5 timesdeeper than terrestrial calderas formed by large plinian eruptions [e.g., Lipman, 1997]. The dimensions ofterrestrial andmercurian volcanic features cannot be compared easily, however, as many factors are involved,including not only the difference in gravitational acceleration but also possible differences in the volume ofmagma present beneath any one feature, the volatile content of that magma, and the availability of shallowcrustal volatiles with which it might interact.
A closer analog to the pyroclastic source vents on Mercury may be vent depressions associated with somepyroclastic deposits on the Moon. The Orientale dark mantling deposit (Figure 3c) is a “ring” deposit ofpyroclastic material in the Orientale basin on the Moon interpreted to have been deposited via vulcanian-style volcanism [Head et al., 2002]. This source vent has ameasured area of ~148 km2 [Head et al., 2002], whichfalls within the range of areas of pyroclastic source vents on Mercury (Table 2), and its depth is ~2.6 km(Figure 3d), also similar to the depths of pyroclastic source vents on Mercury (Table 3). As with terrestrialanalogs for the mercurian source vents, it is difficult simply to compare the two features without more detailedconsiderations. These morphometric similarities would benefit from a more detailed volcanological analysis [e.g., Jozwiak and Head, 2012;Wilson and Head, 2012]. Another interesting aspect that will be illuminated by futuredetailed studies on individual vent morphologies is whether the measured vent areas and depths arerepresentative of solely the eruption of pyroclastic material, or if there have been multiple episodes of activity,including vent collapse, at a given source vent.
5.2. Vent Associations With Impact Craters
There is a strong correlation between pyroclastic deposits and impact craters, with 46 of 51 (~90%)pyroclastic deposits found in this geological context. Impact bombardment pervasively fractured theupper crust and locally reduced the crustal thickness beneath large impact basins; both of theseprocesses may have aided the upward propagation of magma-filled dikes to the surface [e.g., Head andWilson, 1992]. These effects may account for the observation that pyroclastic activity is predominantlyconfined to the interiors of impact craters.
Previous work on the ascent and eruption of magma on Mercury has suggested that the thermal contractionof the planet is likely to have led to a global stress state marked by horizontal compression, making it difficultfor magma to reach the surface [Strom et al., 1975;Wilson and Head, 2008, 2012]. Such a stress state may helpto account for the localization of pyroclastic deposits within impact craters, on the grounds that craterformation may have served to relieve the preexisting stress in the target area and create easier pathways forascending magma to reach the surface beneath impact craters [e.g., Head and Wilson, 1992].
5.3. Vent Associations With Smooth Plains
It is clear that most pyroclastic deposits are far from the smooth plains deposits mapped by Denevi et al.[2013], although a minority of the deposits are clustered around the margins of the smooth plains units(Figure 4). The only pyroclastic deposit contained within a large expanse of smooth plains is RS-02 [Kerberet al., 2011], which is located to the north of the Caloris basin, in the middle of a large area of circum-Calorisplains (Figure 4). Denevi et al. [2013] interpreted the majority of mapped smooth plains as volcanic in origin,
Journal of Geophysical Research: Planets 10.1002/2013JE004480
GOUDGE ET AL. ©2014. American Geophysical Union. All Rights Reserved. 651

but they noted that a volcanic origin is much less clear for the circum-Caloris plains to the north and west ofthe basin. It is therefore possible that pyroclastic deposit RS-02 is not located within a volcanic unit.
The concentration of several pyroclastic deposits around themargins of large smooth plains deposits (Figure 4)parallels the distribution of lunar pyroclastic deposits, which are often located around themargins of largemaredeposits [e.g., Head and Wilson, 1979; Gaddis et al., 1985; Weitz et al., 1998]. One possible explanation for thisobservation is that there is a genetic relationship between the two types of volcanism, whereby the sameperiod of volcanic activity was responsible for the emplacement of the smooth plains and the adjacentpyroclastic materials. Such a scenario, for instance, has been proposed for the Alphonsus crater pyroclasticdeposits on the Moon. Under that scenario, the magma source that fed the emplacement of the nearby MareNubium deposit may have also contributed magma beneath the Alphonsus crater, which then reached thesurface in one or more vulcanian eruptions to form the pyroclastic deposits [Head and Wilson, 1979].
However, many of the pyroclastic deposits onMercury are not associatedwith smooth plains deposits (Figure 4).For these deposits, it is likely that another factor is controlling their location, such as the characteristics (e.g.,volatile content) of the mantle source region or the presence of a recently formed impact crater, as discussedabove. Such alternative controls are likely to be most important for the younger pyroclastic deposits (i.e., thoseobserved within Calorian and Mansurian impact craters; Figures 8 and 9), as Denevi et al. [2013] concludedthat the majority of the volcanic smooth plains were emplaced from ~3.9 to 3.7Ga.
The lack of pyroclastic deposits identified on the large expanses of smooth plains mapped by Denevi et al.[2013] does not imply that pyroclastic volcanism never occurred in these regions. Rather, one may concludeonly that there has been no pyroclastic activity in these regions subsequent to the emplacement of thesmooth plains deposits. Given that pyroclastic activity appears to have occurred into the Mansurian (Figures 8and 9), however, long after the emplacement of the majority of the smooth plains deposits at ~3.9–3.7 Ga[Denevi et al., 2013], there is likely to be a physical explanation for the absence of pyroclastic deposits insmooth plains regions. One possibility, for instance, is that the volatiles needed to drive explosive volcaniceruptions were removed from themantle source regions of the plains deposits during the partial melting andmagma transport that led to the eruptions of the plains-forming lavas.
5.4. Relative Timing of Pyroclastic Volcanism
Another important aspect of pyroclastic deposits is their relative ages of emplacement inferred on the basisof both observed crosscutting relationships (Figures 5–7) and the degradation state of the host impactcraters (Figures 8 and 9).
The secondary crater chain from the Hokusai impact crater that is observed to crosscut the Praxiteles SW vent(Figure 5) places the cessation of pyroclastic activity at the Praxiteles SW vent earlier than the impact thatformed the Hokusai crater, which is of Kuiperian age on the basis of its extensive system of well-preservedrays [Spudis and Guest, 1988].
Additionally, the observed crosscutting of two pyroclastic source vents by lobate scarps (Figures 6a and 6b,yellow arrows) indicate that the pyroclastic activity at the NE Derzhavin and Glinka sites ended prior to thefinal major episode of activity along these tectonic features.
Many of the contractional tectonic features on Mercury, such as these lobate scarps, are believed to haveresulted from an extended period of global contraction [Strom et al., 1975; Watters et al., 1998] resulting fromthe cooling of the planet’s interior [e.g., Hauck et al., 2004]. This period of global contraction is thought to haveinitiated relatively early in Mercury’s history [Strom et al., 1975; Watters et al., 1998], but many of the largercontractional landforms may be associated with faults that continued to be active until much more recently inMercury’s geological history [e.g., Banks et al., 2012]. Since the crosscutting relationships observed here implyonly that pyroclastic activity at these two sites ended prior to the final movement along the lobate scarps, andnot necessarily prior to the time of their initiation, it is unclear where these deposits fall in Mercury’s globalstratigraphy. Thus, it is difficult to constrain the relative age of the pyroclastic activity at the NE Derzhavin andGlinka sites from the observed crosscutting relationships with lobate scarps alone.
The clear crosscutting of 11 pyroclastic source vents by hollows (e.g., Figure 7, orange arrows) is consistentwith the hypothesis that hollows are geologically young features that may even be currently active on thesurface of Mercury at some locations [Blewett et al., 2011]. The superposition relations suggest that the
Journal of Geophysical Research: Planets 10.1002/2013JE004480
GOUDGE ET AL. ©2014. American Geophysical Union. All Rights Reserved. 652

pyroclastic activity at these 11 sites ceased before the final development of the current population of hollows,but they do not preclude the possibility that these pyroclastic deposits may also be geologically young.
As hollows are thought to form through some sort of material removal process [Blewett et al., 2011, 2013;Vaughan et al., 2012; Thomas et al., 2014], it is possible that the hollows are forming either in the pyroclasticdeposit material or in the material that underlies the pyroclastic deposits. The observations presented heredo not favor either of these scenarios, so further work on the relation between pyroclastic deposits andhollows with high-spatial-resolution NAC images and stereo-derived topography [e.g., Gwinner et al., 2012] iswarranted to address this question.
That a number of the identified pyroclastic deposits are crosscut by hollows may be related to the idea that bothgeologic features are associatedwith volatiles [e.g., Kerber et al., 2009, 2011; Blewett et al., 2011; Thomas et al., 2014].However, given that both pyroclastic deposits and hollows are primarily foundwithin impact craters [e.g., Blewettet al., 2011, 2013; Kerber et al., 2011; Vaughan et al., 2012; Thomas et al., 2014], the spatial relation may be morecoincidental than causal. More detailed analyses of both types of features and the development of additionalmodels of hollow formation [e.g., Vaughan et al., 2012] would be helpful to explore this connection further.
The degradation states of the craters that host pyroclastic deposits provide upper limits on the ages of thepyroclastic deposits relative to Mercury’s global stratigraphy [Spudis and Guest, 1988] and are likely to providethe best constraints on the relative timing of pyroclastic activity on the surface of Mercury. If, for example, apyroclastic deposit occurs within a Mansurian-age crater, it can be concluded that the pyroclastic activity atthat site must be Mansurian or younger.
The results of this survey (Figure 9) show that the 46 pyroclastic deposits within impact craters have host craterswith a range of stratigraphic ages, from Mansurian to Pre-Tolstojan, according to the degradation criteria ofSpudis and Guest [1988], with approximately equal numbers of Mansurian, Calorian, and Tolstojan host craters.We can therefore rule out the possibility that all of the pyroclastic activity occurred early in Mercury’s history.
It is more difficult to rule out the possibility that all of the pyroclastic activity occurred relatively recently inMercury’s history, because this scenario would result in more pyroclastic deposits in older host craters, if onlybecause there are more older craters on Mercury, and such a relation is similar to what is observed (Figure 9).However, the pyroclastic source vents themselves have different degradation states, and those states ofpreservation can vary even across a single host crater (e.g., Figures 8b and 8c). These observations lead us toconclude that the pyroclastic activity on Mercury is likely to have occurred over a considerable fraction of theplanet’s history, with some deposits emplaced early and some deposits more recently.
5.5. Spectral Characteristics of Pyroclastic Deposits and Potential Causes for the UV Downturn
The spectral reflectance of the pyroclastic deposits (Figures 10 and 11) is characterized by relatively highreflectance values, a red spectral slope, and no resolvable broad absorption feature centered near 1000 nm,consistent with previous spectral characterizations of these deposits [Blewett et al., 2009; Kerber et al., 2011].Although MASCS spectra are primarily analyzed from 300 to 800 nm (Figures 10 and 11), the crystal fieldabsorption band centered near 1000 nm in spectra of mafic minerals such as olivine and low-calciumpyroxene is broad in nature, and some indication of such an absorption should appear even at these shortwavelengths, as evidenced in laboratory spectra [e.g., Adams, 1974; King and Ridley, 1987; Klima et al., 2007,2011]. Despite the fact that MASCS spectra differ from laboratory spectra, which are typically acquired undermore favorable measurement conditions, the lack of a resolvable broad absorption centered near 1000 nm inthe pyroclastic deposit spectra indicates that there is a low concentration (less than a few weight percent) ofoctahedrally coordinated Fe2+ present in the crystal structure of silicate minerals in the deposits [Burns,1993a]. This conclusion is consistent with the elemental abundances measured by MESSENGER’s X-RaySpectrometer (XRS) and Gamma-Ray Spectrometer, which indicate Fe abundances everywhere lessthan~ 4wt % [Nittler et al., 2011] and averaging ~1.9wt % in the northern hemisphere [Evans et al., 2012].
Ratios of the spectra of pyroclastic deposits to spectra of surrounding terrain having spectral characteristicssimilar to the average reflectance for Mercury [Izenberg et al., 2014] reveal a downturn at wavelengthsshortward of ~400 nm. The strength of this UV downturn differs among pyroclastic deposits (Figure 11b) andalso appears to be correlated with absolute reflectance values (Figure 12). Several factors could potentiallycause such a spectral feature, and we mention three possibilities here: (1) the transition metal content of thedeposits, (2) the grain size of the deposits, and (3) the degree of space weathering of the deposits.
Journal of Geophysical Research: Planets 10.1002/2013JE004480
GOUDGE ET AL. ©2014. American Geophysical Union. All Rights Reserved. 653
Spectral absorption features at UV wavelengths in geologic materials are primarily caused by oxygen-metal charge transfer (OMCT) bands from transition metals in the silicate mineral structure [Burns, 1993b].These OMCT bands are typically centered at ~200–300 nm, depending on the transition metal causing theabsorption (e.g., Fe, Ti, or V) [Wagner et al., 1987; Burns, 1993b; Cloutis et al., 2008]. OMCT absorption featuresin the UV region are orders of magnitude stronger than crystal field absorptions in the 1000 nm region [Burns,1993b], meaning that small amounts of Fe (or another transition metal) can cause OMCT absorptions andinfluence the shape of material spectra in the UV [Rava and Hapke, 1987; Klima et al., 2007, 2011; Cloutis et al.,2008; Greenspon et al., 2012]. OMCT absorptions have previously been proposed as an explanation for theshape of both disk-integrated and spatially resolved measurements of Mercury reflectance spectra acquiredby the MASCS instrument [McClintock et al., 2008; Holsclaw et al., 2010].
Laboratory studies have shown that decreasing Fe content in silicate minerals and glasses will (1) weakenthe strength of OMCT absorptions in the UV, (2) move the shoulder of this OMCT absorption to shorterwavelengths, and (3) increase the overall reflectance of thematerials [e.g., Rava and Hapke, 1987; Cloutis et al.,2008; Greenspon et al., 2012]. The overall effect of these changes is that decreased Fe content will result inhigher reflectance and steeper UV slopes [Rava and Hapke, 1987; Cloutis et al., 2008; Greenspon et al., 2012].This trend matches the observed spectral signature of the pyroclastic deposits relative to the averagespectrum for Mercury [Izenberg et al., 2014], and one interpretation of the MASCS data is that the pyroclasticdeposits are lower in Fe than the surrounding terrain. The observed lack of a broad absorption band centerednear 1000 nm in the pyroclastic deposit spectra coupled with very low global surface abundances of Fe[Nittler et al., 2011; Evans et al., 2012] limit the possibility for substantial Fe variations. The greater sensitivity ofthe UV region to the presence of trace amounts of iron [Burns, 1993b] may nonetheless permit the detectionof variations in Fe abundance in the context of a broadly low-iron surface [Nittler et al., 2011; Evans et al.,2012], as has been documented from recent XRS results [Weider et al., 2013].
An alternative possibility is that the observed downturn in the UV region of the spectrum is due to the result ofvariations in the physical properties of the deposits, in particular grain size. Laboratory studies by Cloutis et al.[2008] have shown that, in a manner similar to the effects of increasing Fe content, increasing the grain size ofsilicate minerals causes OMCT bands to deepen and broaden, resulting in a shallower UV slope. This trend isobserved evenwith spectra of a plagioclase feldspar sample that has a very low Fe concentration (0.29wt % Fe)[Cloutis et al., 2008]. Additionally, a general effect of increasing grain size on spectra from the ultraviolet to thenear infrared is to decrease the overall reflectance because of increased volume scattering and decreasedsurface reflections [e.g., Crown and Pieters, 1987; Gaffey et al., 1993; Mustard and Hays, 1997].
Therefore, a variation in grain size among the deposits could also explain the observed covariation of UVdownturn strength and overall reflectance (Figures 11 and 12). Furthermore, because the optical propertiesof the finest grain-size fraction are thought to control the spectral signature of lunar soils [Pieters et al., 1993],variations in the amount of fine particles within the pyroclastic deposits may contribute to the observedspectral trends in the UV. If differences in grain size are responsible for the UV downturn observed in theratioed MASCS spectra of the pyroclastic deposits, then those deposits are, on average, composed of finer-grained material than the rest of Mercury’s surface [Izenberg et al., 2014], as is observed for the fine-grainedpyroclastic material on the Moon [e.g., Heiken et al., 1974; Weitz et al., 1999].
A third possible contributor to variations in the observed UV downturn is a difference in the degree of spaceweathering. Space weathering on the Moon and other airless bodies is known to result in the darkening ofsurface material, the reduction of spectral contrast, and the reddening, or increase, of the visible to NIRspectral slope [e.g., Hapke, 2001; Blewett et al., 2009]. Much of the previous work on space weathering hasfocused on effects in the NIR region of the spectrum, but Hendrix and Vilas [2006] showed that the effect ofspace weathering in the UV is a decrease of the UV spectral slope. Hendrix and Vilas [2006] hypothesize thatthis change may be the result of the formation of nanophase iron coatings on mineral grains, a process alsocommonly invoked to explain some of the trends of space weathering in the NIR [e.g., Pieters et al., 1993; Hapke,2001; Noble and Pieters, 2003]. That spaceweathering acts to decrease the UV spectral slopemight suggest that,in the absence of other contributing factors, the pyroclastic deposits are less space weathered than Mercury’saverage surface [Izenberg et al., 2014], although the expectation that space weathering processes onMercury operate at higher rates than on the Moon [e.g., Cintala, 1992; Noble and Pieters, 2003; Braden andRobinson, 2013] renders this idea unlikely.
Journal of Geophysical Research: Planets 10.1002/2013JE004480
GOUDGE ET AL. ©2014. American Geophysical Union. All Rights Reserved. 654
Deciding among the above threeexplanations for the UV downturnobserved in the MASCS spectralsignatures of pyroclastic deposits(Figures 10 and 11) is not possible fromthe observations presented here. Furtheranalyses of MASCS data coupled withlaboratory analyses of the UV–VISspectral signatures of minerals relevantto the composition of Mercury, such aslow-iron silicates, and under conditionsanalogous to those on Mercury’s surface(e.g., with laser irradiation [Yamada et al.,1999]), will illuminate more fully theorigin of the spectral signaturesobserved for Mercury’spyroclastic deposits.
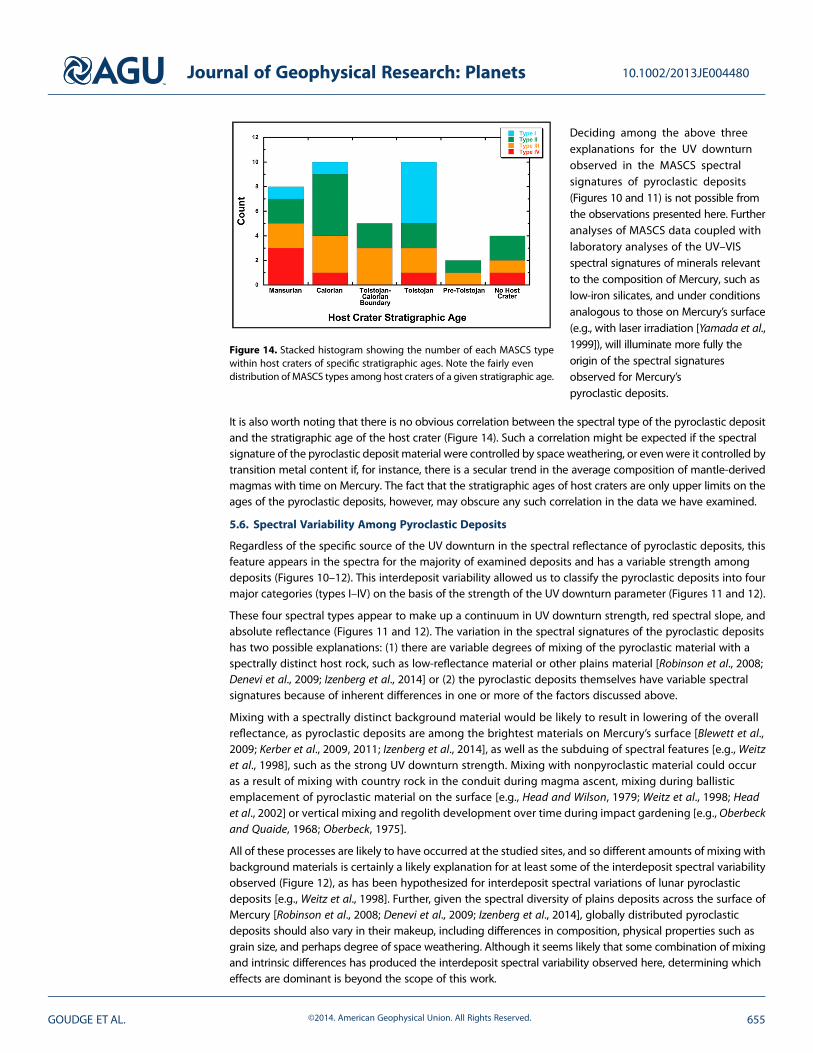
It is also worth noting that there is no obvious correlation between the spectral type of the pyroclastic depositand the stratigraphic age of the host crater (Figure 14). Such a correlation might be expected if the spectralsignature of the pyroclastic deposit material were controlled by space weathering, or evenwere it controlled bytransition metal content if, for instance, there is a secular trend in the average composition of mantle-derivedmagmas with time on Mercury. The fact that the stratigraphic ages of host craters are only upper limits on theages of the pyroclastic deposits, however, may obscure any such correlation in the data we have examined.
5.6. Spectral Variability Among Pyroclastic Deposits
Regardless of the specific source of the UV downturn in the spectral reflectance of pyroclastic deposits, thisfeature appears in the spectra for the majority of examined deposits and has a variable strength amongdeposits (Figures 10–12). This interdeposit variability allowed us to classify the pyroclastic deposits into fourmajor categories (types I–IV) on the basis of the strength of the UV downturn parameter (Figures 11 and 12).
These four spectral types appear to make up a continuum in UV downturn strength, red spectral slope, andabsolute reflectance (Figures 11 and 12). The variation in the spectral signatures of the pyroclastic depositshas two possible explanations: (1) there are variable degrees of mixing of the pyroclastic material with aspectrally distinct host rock, such as low-reflectance material or other plains material [Robinson et al., 2008;Denevi et al., 2009; Izenberg et al., 2014] or (2) the pyroclastic deposits themselves have variable spectralsignatures because of inherent differences in one or more of the factors discussed above.
Mixing with a spectrally distinct background material would be likely to result in lowering of the overallreflectance, as pyroclastic deposits are among the brightest materials on Mercury’s surface [Blewett et al.,2009; Kerber et al., 2009, 2011; Izenberg et al., 2014], as well as the subduing of spectral features [e.g., Weitzet al., 1998], such as the strong UV downturn strength. Mixing with nonpyroclastic material could occuras a result of mixing with country rock in the conduit during magma ascent, mixing during ballisticemplacement of pyroclastic material on the surface [e.g., Head and Wilson, 1979; Weitz et al., 1998; Headet al., 2002] or vertical mixing and regolith development over time during impact gardening [e.g., Oberbeckand Quaide, 1968; Oberbeck, 1975].
All of these processes are likely to have occurred at the studied sites, and so different amounts of mixing withbackground materials is certainly a likely explanation for at least some of the interdeposit spectral variabilityobserved (Figure 12), as has been hypothesized for interdeposit spectral variations of lunar pyroclasticdeposits [e.g., Weitz et al., 1998]. Further, given the spectral diversity of plains deposits across the surface ofMercury [Robinson et al., 2008; Denevi et al., 2009; Izenberg et al., 2014], globally distributed pyroclasticdeposits should also vary in their makeup, including differences in composition, physical properties such asgrain size, and perhaps degree of space weathering. Although it seems likely that some combination of mixingand intrinsic differences has produced the interdeposit spectral variability observed here, determining whicheffects are dominant is beyond the scope of this work.
Figure 14. Stacked histogram showing the number of each MASCS typewithin host craters of specific stratigraphic ages. Note the fairly evendistribution of MASCS types among host craters of a given stratigraphic age.
Journal of Geophysical Research: Planets 10.1002/2013JE004480
GOUDGE ET AL. ©2014. American Geophysical Union. All Rights Reserved. 655

6. Conclusions
We have completed an analysis of pyroclastic deposits on Mercury from imaging, spectral, and topographicdata acquired during the orbital phase of theMESSENGERmission. This analysis expands the global catalog ofpyroclastic deposits and brings the total number to 51. Our method for identifying new pyroclastic depositsfocused on the morphological identification of candidate pyroclastic source vents. Our approach differs fromthat of Kerber et al. [2011], who searched MDIS global color mosaics for the distinctive spectral signatureassociated with these deposits. It is therefore likely that additional pyroclastic deposits will be discovered inthe future with the use of methods complementary to those used here.
On the basis of global assessments of source vent areas and depths, deposit areas, geological associationsof the deposits, relative ages of the deposits, and spectral characteristics of the deposits, the principalconclusions are as follows:
1. The great majority (~90%) of pyroclastic deposits are found within impact craters and basins. Suchlocalization may be the result of easier access of magma to the surface because of impact-induced frac-turing and reduced crustal thickness beneath the largest impact features [e.g., Head and Wilson, 1992].
2. Crosscutting relationships and the degradation state of the impact craters that host pyroclastic depositssuggest that explosive volcanic activity on Mercury likely occurred over a substantial fraction of Mercury’sgeologic history, with the emplacement of some pyroclastic deposits as recently as the Mansurian period,which ranges from ~3.25 to 1Ga.
3. Most pyroclastic deposits are distant from smooth plains deposits, but some are located around smoothplains margins. The relation of the latter deposits to smooth plains on Mercury is similar to that seenfor many lunar pyroclastic deposits adjacent to lunar maria [e.g., Head andWilson, 1979; Gaddis et al., 1985;Weitz et al., 1998].
4. The spectral reflectance of pyroclastic deposits shows high overall reflectance values, a redder slope, anda downturn at UV wavelengths compared with that for surrounding material or spectrally averagematerial on Mercury. Possible explanations include the following: (1) the deposits are poor in transitionmetals compared with surrounding terrain, (2) the deposits consist of finer-grained material than thesurrounding terrain, or (3) the deposits are less space weathered than the surrounding terrain.
5. There is a covariation among pyroclastic deposits in the strength of the downturn in the UV and theabsolute reflectance value. These interdeposit variations may be due to (1) variable amounts of mixingwith underlying material [e.g., Head and Wilson, 1979; Weitz et al., 1998; Head et al., 2002] or (2) intrinsicchemical or physical differences (e.g., differences in grain size or mineralogy) among deposits.
ReferencesAdams, J. B. (1974), Visible and near-infrared diffuse reflectance spectra of pyroxenes as applied to remote sensing of solid objects in the
solar system, J. Geophys. Res., 79, 4829–4836, doi:10.1029/JB079i032p04829.Baker, D. M. H., J. W. Head, S. C. Schon, C. M. Ernst, L. M. Prockter, S. L. Murchie, B. W. Denevi, S. C. Solomon, and R. G. Strom (2011), The
transition from complex crater to peak-ring basin on Mercury: New observations from MESSENGER flyby data and constraints on basinformation models, Planet. Space Sci., 59, 1932–1948, doi:10.1016/j.pss.2011.05.010.
Banks, M. E., T. R. Watters, R. G. Strom, S. C. Solomon, S. E. Braden, C. R. Chapman, Z. Xiao, and N. G. Barlow (2012), Stratigraphic relationshipsbetween lobate scarps and young impact craters on Mercury: Implications for the duration of lobate scarp formation, Lunar Planet. Sci., 43,abstract 2684.
Benz, W., W. L. Slattery, and A. G. W. Cameron (1988), Collisional stripping of Mercury’s mantle, Icarus, 74, 516–528.Blewett, D. T., M. S. Robinson, B. W. Denevi, J. J. Gillis-Davis, J. W. Head, S. C. Solomon, G. M. Holsclaw, and W. E. McClintock (2009),
Multispectral images of Mercury from the first MESSENGER flyby: Analysis of global and regional color trends, Earth Planet. Sci. Lett., 285,272–282, doi:10.1016/j.epsl.2009.02.021.
Blewett, D. T., et al. (2011), Hollows on Mercury: MESSENGER evidence for geologically recent volatile-related activity, Science, 333,1856–1859, doi:10.1126/science.1211681.
Blewett, D. T., W. M. Vaughan, Z. Xiao, N. L. Chabot, B. W. Denevi, C. M. Ernst, and J. W. Head (2013), Mercury’s hollows: Constraints on for-mation and composition from analysis of geological setting and spectral reflectance, J. Geophys. Res. Planets, 118, 1013–1032, doi:10.1029/2012JE004174.
Boynton, W. V., A. L. Sprague, S. C. Solomon, R. D. Starr, L. G. Evans, W. C. Feldman, J. I. Trombka, and E. A. Rhodes (2007), MESSENGER and thechemistry of Mercury’s surface, Space Sci. Rev., 131, 85–104, doi:10.1007/s11214-007-9258-3.
Braden, S. E., and M. S. Robinson (2013), Relative regolith optical maturation rates on Mercury and the Moon, J. Geophys. Res. Planets, 118,1903–1914, doi:10.1002/jgre.20143.
Burns, R. G. (1993a), Mineralogical Applications of Crystal Field Theory, 2nd ed., 551 pp., Cambridge Univ. Press, New York, N. Y.Burns, R. G. (1993b), Origin of electronic spectra of minerals in the visible to near-infrared region, in Remote Geochemical Analysis: Elemental
and Mineralogical Composition, edited by C. M. Pieters and P. A. J. Englert, pp. 3–29, Cambridge Univ. Press, Cambridge, United Kingdom.Cameron, A. G. W. (1985), The partial volatilization of Mercury, Icarus, 64, 285–294.
AcknowledgmentsWe gratefully acknowledge the contri-butions of the engineers and managersof the MESSENGER mission that havemade this work possible. TheMESSENGER mission is supported bythe NASA Discovery Program undercontract NAS5-97271 to The JohnsHopkins University Applied PhysicsLaboratory and NASW-00002 to theCarnegie Institution of Washington.Sebastien Besse, Paul Byrne, OlafGustafson, and Catherine Weitz pro-vided thorough and constructivereviews that improved this paper. Wethank C.I. Fassett for assistance withtopographic data, and J.L. Dickson andD.M.H. Baker for the help in processingimage data. Thanks are also extended toD.M.H. Baker, M. Beach, D.M. Hurwitz, L.M.Jozwiak, K.E. Scanlon, W.M. Vaughan, andJ.L. Whitten for assistance with the initialsearch for potential pyroclastic sourcevents and helpful discussions.
Journal of Geophysical Research: Planets 10.1002/2013JE004480
GOUDGE ET AL. ©2014. American Geophysical Union. All Rights Reserved. 656

Cavanaugh, J. F., et al. (2007), The Mercury Laser Altimeter instrument for the MESSENGERmission, Space Sci. Rev., 131, 451–479, doi:10.1007/s11214-007-9273-4.
Cintala, M. J. (1992), Impact-induced thermal effects in the lunar and mercurian regoliths, J. Geophys. Res., 97, 947–973, doi:10.1029/91JE02207.Cloutis, E. A., K. A. McCormack, J. F. Bell, A. R. Hendrix, D. T. Bailey, M. A. Craig, S. A. Mertzman, M. S. Robinson, and M. A. Riner (2008),
Ultraviolet spectral reflectance properties of common planetary minerals, Icarus, 197, 321–347, doi:10.1016/j.icarus.2008.04.018.Crown, D. A., and C. M. Pieters (1987), Spectral properties of plagioclase and pyroxene mixtures and the interpretation of lunar soil spectra,
Icarus, 72, 492–506.Denevi, B. W., et al. (2009), The evolution of Mercury’s crust: A global perspective from MESSENGER, Science, 324, 613–618, doi:10.1126/
science.1172226.Denevi, B. W., et al. (2013), The distribution and origin of smooth plains on Mercury, J. Geophys. Res. Planets, 118, 891–907, doi:10.1002/jgre.20075.Domingue, D. L., F. Vilas, G. M. Holsclaw, J. Warell, N. R. Izenberg, S. L. Murchie, B. W. Denevi, D. T. Blewett, W. E. McClintock, and B. J. Anderson
(2010), Whole-disk spectrophotometric properties of Mercury: Synthesis of MESSENGER and ground-based observations, Icarus, 209,101–124, doi:10.1016/j.icarus.2010.02.022.
Domingue, D. L., S. L. Murchie, N. L. Chabot, B. W. Denevi, and F. Vilas (2011), Mercury’s spectrophotometric properties: Update from theMercuryDual Imaging System observations during the third MESSENGER flyby, Planet. Space Sci., 59, 1853–1872, doi:10.1016/j.pss.2011.04.012.
Evans, L. G., et al. (2012), Major-element abundances on the surface of Mercury: Results from the MESSENGER Gamma-Ray Spectrometer,J. Geophys. Res., 117, E00L07, doi:10.1029/2012JE004178.
Gaddis, L. R., C. M. Pieters, and B. R. Hawke (1985), Remote sensing of lunar pyroclastic mantling deposits, Icarus, 61, 461–489.Gaffey, S. J., L. A. McFadden, D. Nash, and C. M. Pieters (1993), Ultraviolet, visible, and near-infrared reflectance spectroscopy: Laboratory
spectra of geologic materials, in Remote Geochemical Analysis: Elemental and Mineralogical Composition, edited by C. M. Pieters and P. A. J.Englert, pp. 43–77, Cambridge Univ. Press, Cambridge, United Kingdom.
Geyer, A., and J. Martí (2008), The new worldwide collapse caldera database (CCDB): A tool for studying and understanding caldera pro-cesses, J. Volcanol. Geotherm. Res., 175, 334–354, doi:10.1016/j.jvolgeores.2008.03.017.
Gillis-Davis, J. J., D. T. Blewett, R. W. Gaskell, B. W. Denevi, M. S. Robinson, R. G. Strom, S. C. Solomon, and A. L. Sprague (2009), Pit-floor craterson Mercury: Evidence of near-surface igneous activity, Earth Planet. Sci. Lett., 285, 243–250, doi:10.1016/j.epsl.2009.05.023.
Greenspon, A. S., C. A. Hibbitts, and M. D. Dyar (2012), Compositional dependencies in ultraviolet reflectance spectra of synthetic glassesrelevant to airless bodies, Lunar Planet. Sci., 43, abstract 2490.
Gwinner, K., J. W. Head, J. Oberst, J. J. Gillis-Davis, Z. Xiao, R. G. Strom, F. Preusker, and S. C. Solomon (2012), Morphology of pit craters onMercury from stereo-derived topography and implications for pit crater formation, Lunar Planet. Sci., 43, abstract 1991.
Hapke, B. (2001), Space weathering from Mercury to the asteroid belt, J. Geophys. Res., 106, 10,039–10,073.Hartmann, W. K. (1966), Martian cratering, Icarus, 5, 565–576.Hartmann, W. K. (1977), Relative crater production rates on planets, Icarus, 31, 260–276.Hauck, S. A., II, A. J. Dombard, R. J. Phillips, and S. C. Solomon (2004), Internal and tectonic evolution of Mercury, Earth Planet. Sci. Lett., 222,
713–728, doi:10.1016/j.epsl.2004.03.037.Hawkins, S. E. III, et al. (2007), The Mercury Dual Imaging System on the MESSENGER spacecraft, Space Sci. Rev., 131, 247–338, doi:10.1007/
s11214-007-9266-3.Head, J. W., and L. Wilson (1979), Alphonsus-type dark-halo craters: Morphology, morphometry and eruption conditions, in Proc. Lunar
Planet. Sci. Conf., 10th, vol. 3, pp. 2861–2897, Pergamon Press, New York.Head, J. W., and L. Wilson (1992), Lunar mare volcanism: Stratigraphy, eruption conditions, and the evolution of secondary crusts, Geochim.
Cosmochim. Acta, 56, 2155–2175.Head, J. W., L. Wilson, and C. M. Weitz (2002), Dark ring in southwestern Orientale basin: Origin as a single pyroclastic eruption, J. Geophys.
Res., 107 (E1), 5001, doi:10.1029/2000JE001438.Head, J. W., C. R. Chapman, D. L. Domingue, S. E. Hawkins,W. E. McClintock, S. L. Murchie, L. M. Prockter, M. S. Robinson, R. G. Strom, and T. R. Watters
(2007), The geology of Mercury: The view prior to the MESSENGER mission, Space Sci. Rev., 131, 41–84, doi:10.1007/s11214-007-9263-6.Head, J. W., et al. (2008), Volcanism on Mercury: Evidence from the first MESSENGER flyby, Science, 321, 69–72, doi:10.1126/science.1159256.Head, J. W., et al. (2009), Volcanism onMercury: Evidence from the first MESSENGER flyby for extrusive and explosive activity and the volcanic
origin of plains, Earth Planet. Sci. Lett., 285, 227–242, doi:10.1016/j.epsl.2009.03.007.Head, J. W., et al. (2011), Flood volcanism in the northern high latitudes of Mercury revealed by MESSENGER, Science, 333, 1853–1856,
doi:10.1126/science.1211997.Heiken, G. H., D. S. McKay, and R. W. Brown (1974), Lunar deposits of possible pyroclastic origin, Geochim. Cosmochim. Acta, 38, 1703–1718.Hendrix, A. R., and F. Vilas (2006), The effects of space weathering at UV wavelengths: S-class asteroids, Astron. J., 132, 1396–1404,
doi:10.1086/506426.Holsclaw, G. M., W. E. McClintock, D. L. Domingue, N. R. Izenberg, D. T. Blewett, and A. L. Sprague (2010), A comparison of the ultraviolet to near-
infrared spectral properties of Mercury and the Moon as observed by MESSENGER, Icarus, 209, 179–194, doi:10.1016/j.icarus.2010.05.001.Izenberg, N. R., et al. (2014), The low-iron, reduced surface of Mercury as seen in spectral reflectance by MESSENGER, Icarus, 228, 364–374,
doi:10.1016/j.icarus.2013.10.023.Jozwiak, L. M., and J. W. Head (2012), Mercury pit-floor craters: Perspectives on their origin from lunar floor-fractured craters, Lunar Planet.
Sci., 43, abstract 2424.Kerber, L., J. W. Head, S. C. Solomon, S. L. Murchie, D. T. Blewett, and L. Wilson (2009), Explosive volcanic eruptions on Mercury: Eruption
conditions, magma volatile content, and implications for interior volatile abundances, Earth Planet. Sci. Lett., 285, 263–271, doi:10.1016/j.epsl.2009.04.037.
Kerber, L., J. W. Head, D. T. Blewett, S. C. Solomon, L. Wilson, S. L. Murchie, M. S. Robinson, B. W. Denevi, and D. L. Domingue (2011), The globaldistribution of pyroclastic deposits on Mercury: The view from MESSENGER flybys 1–3, Planet. Space Sci., 59, 1895–1909, doi:10.1016/j.pss.2011.03.020.
King, T. V. V., and W. I. Ridley (1987), Relation of the spectroscopic reflectance of olivine to mineral chemistry and some remote sensingimplications, J. Geophys. Res., 92, 11,457–11,469, doi:10.1029/JB092iB11p11457.
Klima, R. L., C. M. Pieters, and M. D. Dyar (2007), Spectroscopy of synthetic Mg-Fe pyroxenes I: Spin-allowed and spin-forbidden crystal fieldbands in the visible and near-infrared, Meteorit. Planet. Sci., 42, 235–253, doi:10.1111/j.1945-5100.2007.tb00230.x.
Klima, R. L., M. D. Dyar, and C. M. Pieters (2011), Near-infrared spectra of clinopyroxenes: Effects of calcium content and crystal structure,Meteorit. Planet. Sci., 46, 379–395, doi:10.1111/j.1945-5100.2010.01158.x.
Lipman, P. W. (1997), Subsidence of ash-flow calderas: Relation to caldera size and magma-chamber geometry, Bull. Volcanol., 59, 198–218,doi:10.1007/s004450050186.
Journal of Geophysical Research: Planets 10.1002/2013JE004480
GOUDGE ET AL. ©2014. American Geophysical Union. All Rights Reserved. 657
Lucchitta, B. K., and H. H. Schmitt (1974), Orange material in the Sulpicius Gallus Formation at the southwestern edge of Mare Serenitatis, inProc. Lunar Sci. Conf., 5th, vol. 1, pp. 223–234, Pergamon Press, New York.
Mazarico, E., D. D. Rowlands, G. A. Neumann, D. E. Smith, M. H. Torrence, F. G. Lemoine, and M. T. Zuber (2012), Orbit determination of theLunar Reconnaissance Orbiter, J. Geod., 86, 193–207, doi:10.1007/s00190-011-0509-4.
McClintock, W. E., and M. R. Lankton (2007), The Mercury Atmospheric and Surface Composition Spectrometer for the MESSENGER mission,Space Sci. Rev., 131, 481–521, doi:10.1007/s11214-007-9264-5.
McClintock, W. E., et al. (2008), Spectroscopic observations of Mercury’s surface reflectance during MESSENGER’s first Mercury flyby, Science,321, 62–65, doi:10.1126/science.1159933.
McCord, T. B., M. P. Charette, T. V. Johnson, L. A. Lebofsky, C. Pieters, and J. B. Adams (1972), Lunar spectral types, J. Geophys. Res., 77, 1349–1359.McCord, T. B., R. N. Clark, B. R. Hawke, L. A. McFadden, and P. D. Owensby (1981), Moon: Near-infrared spectral reflectance, a first good look,
J. Geophys. Res., 86, 10,883–10,892.Murchie, S. L., et al. (2008), Geology of the Caloris basin, Mercury: A view fromMESSENGER, Science, 321, 73–76, doi:10.1126/science.1159261.Mustard, J. F., and J. E. Hays (1997), Effects of hyperfine particles on reflectance spectra from 0.3 to 25 μm, Icarus, 125, 145–163.Neukum, G., B. König, H. Fechtig, and D. Storzer (1975), Cratering in the Earth-Moon system: Consequences for age determination by crater
counting, in Proc. Lunar Sci. Conf., 6th, vol. 3, pp. 2597–2620, Pergamon Press, New York.Nittler, L. R., et al. (2011), Themajor-element composition of Mercury’s surface fromMESSENGER X-ray spectrometry, Science, 333, 1847–1850,
doi:10.1126/science.1211567.Noble, S. K., and C. M. Pieters (2003), Space weathering on Mercury: Implications for remote sensing, Solar System Res., 37, 31–35.Oberbeck, V. R. (1975), The role of ballistic erosion and sedimentation in lunar stratigraphy, Rev. Geophys. Space Phys., 13, 337–362.Oberbeck, V. R., and W. L. Quaide (1968), Genetic implications of lunar regolith thickness variations, Icarus, 9, 446–465.Pashai, P., N. R. Izenberg, J. J. Gillis-Davis, T. R. Watters, D. T. Blewett, and S. C. Solomon (2010), A Mercury impact crater with volcanic and
tectonic modification, Lunar Planet. Sci., 41, abstract 1693.Pieters, C. M., E. M. Fischer, O. Rode, and A. Basu (1993), Optical effects of space weathering: The role of the finest fraction, J. Geophys. Res., 98,
20,817–20,824.Prockter, L. M., et al. (2010), Evidence for young volcanism on Mercury from the third MESSENGER flyby, Science, 329, 668–671, doi:10.1126/
science.1188186.Prockter, L. M., S. L. Murchie, C. M. Ernst, D. M. H. Baker, P. K. Byrne, J. W. Head, T. R.Watters, B. W. Denevi, C. R. Chapman, and S. C. Solomon (2012),
The geology of medium-sized basins on Mercury: Implications for surface processes and evolution, Lunar Planet. Sci., 43, abstract 1326.Rava, B., and B. Hapke (1987), An analysis of the Mariner 10 color ratio map of Mercury, Icarus, 71, 397–429.Robinson, M. S., and P. G. Lucey (1997), Recalibrated Mariner 10 color mosaics: Implications for Mercurian volcanism, Science, 275, 197–200,
doi:10.1126/science.275.5297.197.Robinson, M. S., et al. (2008), Reflectance and color variations on Mercury: Regolith processes and compositional heterogeneity, Science, 321,
66–69, doi:10.1126/science.1160080.Robinson, M. S., et al. (2010), Lunar Reconnaissance Orbiter Camera (LROC) instrument overview, Space Sci. Rev., 150, 81–124, doi:10.1007/
s11214-010-9634-2.Smith, D. E., et al. (2010), The Lunar Orbiter Laser Altimeter investigation on the Lunar Reconnaissance Orbiter mission, Space Sci. Rev., 150,
209–241, doi:10.1007/s11214-009-9512-y.Solomon, S. C., R. L. McNutt Jr., R. E. Gold, and D. L. Domingue (2007), MESSENGER mission overview, Space Sci. Rev., 131, 3–39, doi:10.1007/
s11214-007-9247-6.Solomon, S. C., et al. (2008), Return to Mercury: A global perspective on MESSENGER’s first Mercury flyby, Science, 321, 59–62, doi:10.1126/
science.1159706.Spudis, P. D., and J. E. Guest (1988), Stratigraphy and geologic history of Mercury, in Mercury, edited by F. Vilas, C. R. Chapman, and M. S.
Matthews, pp. 118–164, University of Arizona Press, Tuscon, Ariz.Strom, R. G., N. J. Trask, and J. E. Guest (1975), Tectonism and volcanism on Mercury, J. Geophys. Res., 80, 2478–2507, doi:10.1029/
JB080i017p02478.Thomas, R. J., D. A. Rothery, S. J. Conway, and M. Anand (2014), Hollows on Mercury: Materials and mechanisms involved in their formation,
Icarus, 229, 221–235, doi:10.1016/j.icarus.2013.11.018.Vaughan, W. M., J. Helbert, D. T. Blewett, J. W. Head, S. L. Murchie, K. Gwinner, T. J. McCoy, and S. C. Solomon (2012), Hollow-forming layers in
impact craters on Mercury: Massive sulfide or chloride deposits formed by impact melt differentiation?, Lunar Planet. Sci., 43, abstract 1187.Wagner, J. K., B. W. Hapke, and E. N. Wells (1987), Atlas of reflectance spectra of terrestrial, lunar, andmeteoritic powders and frosts from 92 to
1800 nm, Icarus, 69, 14–28.Watters, T. R., M. S. Robinson, and A. C. Cook (1998), Topography of lobate scarps on Mercury: New constraints on the planet’s contraction,
Geology, 26, 991–994.Watters, T. R., J. W. Head, S. C. Solomon, M. S. Robinson, C. R. Chapman, B. W. Denevi, C. I. Fassett, S. L. Murchie, and R. G. Strom (2009),
Evolution of the Rembrandt impact basin on Mercury, Science, 324, 618–621, doi:10.1126/science.1172109.Weider, S. Z., L. R. Nittler, R. D. Starr, and S. C. Solomon (2013), The distribution of iron on the surface of Mercury from MESSENGER X-Ray
Spectrometer measurements, Lunar Planet. Sci., 44, abstract 2189.Weitz, C. M., J. W. Head, and C. M. Pieters (1998), Lunar regional dark mantle deposits: Geologic, multispectral, and modeling studies,
J. Geophys. Res., 103, 22,725–22,759.Weitz, C. M., M. J. Rutherford, J. W. Head, and D. S. McKay (1999), Ascent and eruption of a lunar high-titanium magma as inferred from the
petrology of the 74001/2 drill core, Meteorit. Planet. Sci., 34, 527–540, doi:10.1111/j.1945-5100.1999.tb01361.x.Wilson, L., and J. W. Head (2008), Volcanism on Mercury: A new model for the history of magma ascent and eruption, Geophys. Res. Lett., 35,
L23205, doi:10.1029/2008GL035620.Wilson, L., and J. W. Head (2012), Volcanic eruption processes on Mercury, Lunar Planet. Sci., 43, abstract 1316.Yamada, M., S. Sasaki, H. Nagahara, A. Fujiwara, S. Hasegawa, H. Yano, T. Hiroi, H. Ohashi, and H. Otake (1999), Simulation of space weathering
of planet-forming minerals: Nanosecond pulse laser irradiation and proton implantation on olivine and pyroxene samples, Earth PlanetsSpace, 51, 1255–1265.
Zolotov, M. Y. (2011), On the chemistry of mantle and magmatic volatiles on Mercury, Icarus, 212, 24–41, doi:10.1016/j.icarus.2010.12.014.Zuber, M. T., et al. (2012), Topography of the northern hemisphere of Mercury from MESSENGER laser altimetry, Science, 336, 217–220,
doi:10.1126/science.1218805.
Journal of Geophysical Research: Planets 10.1002/2013JE004480
GOUDGE ET AL. ©2014. American Geophysical Union. All Rights Reserved. 658