pwc global information security survey
TRANSCRIPT
Changing the gameKey findings from The Global State of Information Security® Survey 2013
www.pwc.com/security
Advisory Services Security
While tight budgets have forestalled updates to security programs, many businesses are confident they’re winning the game. But the rules−and the players−have changed.
Methodology
The Global State of Information Security® Survey 2013 is a worldwide study by PwC, CIO magazine, and CSO magazine. It was conducted online from February 1, 2012, to April 15, 2012. Readers of CIO and CSO magazines and clients of PwC from around the globe were invited via e-mail to take the survey. The results discussed in this report are based on the responses of more than 9,300 CEOs, CFOs, CISOs, CIOs, CSOs, vice presidents, and directors of IT and information security from 128 countries. Forty percent of respondents were from North America, 26% from Europe, 18% from Asia, 14% from South America, and 2% from the Middle East and South Africa. The margin of error is less than 1%. All figures and graphics in this report were sourced from survey results.

Information security has always been a high-stakes game, one that demands a smart strategy, the right technology, and an unblinking focus on adversaries. Today, however, both the game and the opponents have changed. To win, businesses must play by new rules and bring advanced skills and strategy to the table.
Table of contents
The heart of the matter 2
For many businesses, security has become a game that is almost impossible to win. The rules have changed, and opponents−old and new−are armed with expert technology skills, and the risks are greater than ever.
An in-depth discussion 4
Attitudes about security often follow no rational game plan. Case in point? The general mood among global executives is optimistic, even though the data do not always support that sentiment. I. A game of confidence: Organizations assess their security practices 5II. A game of risk: The decline of capabilities over time 9 III. It’s how you play the game: Alignment, leadership, and training are key 17IV. The new world order: Asia advances, South America makes its move, and other regions try to maintain 21
What this means for your business 26
Understanding the practices of true information security leaders can help you improve your organization’s security game.
The heart of the matter
For many businesses, security has become a game that is almost impossible to win. The rules have changed, and opponents−old and new−are armed with expert technology skills, and the risks are greater than ever.
3 The heart of the matter
The uncertain economy of the past four years has made information security an increasingly challenging game whose outcome can have potentially serious consequences for your business. In today’s rapidly evolving threat landscape, businesses have fallen behind, their defenses weakened and security practices dulled by a protracted period of tight budgets and truncated projects. At the same time, their adversaries are becoming ever more sophisticated, breaching the defenses of business ecosystems and leaving reputational, financial, and competitive damage in their wake.
Those keeping score agree: The bad guys appear to be in the lead.
But respondents to The Global State of Information Security® Survey 2013 seem to be playing from an entirely different game plan. Among more than 9,300 executives across 128 countries and virtually every industry, confidence in their organizations’ information security practices remains high.
Indeed, many believe they are winning. Strategies are deemed to be sound. Budgets are recovering. Nearly half (42%) of respondents see their organization as a “front-runner” in terms of information security strategy and execution.
The odds, however, are not in their favor. Too often—and for too many organizations—diminished budgets have resulted in degraded security programs. Risks are neither well understood nor properly addressed. The number of security incidents is on the rise. Senior executives frequently are seen as part of the problem rather than keys to the solution.
Given today’s elevated threat environment, businesses can no longer afford to play a game of chance. They must prepare to play a new game, one that requires advanced levels of skill and strategy to win.
An in-depth discussion
Attitudes about security often follow no rational game plan. Case in point? The general mood among global executives is optimistic, even though the data do not always support that sentiment.
5 An in-depth discussion
I. A game of confidence: Organizations assess their security practices
Finding #1Good self-assessments continue this year, with a substantial number of respondents saying their organizations exhibit the attributes of information security leaders.
Finding #2Confidence runs deep. Most respondents believe their organizations have instilled effective information security behaviors into organizational culture.
Finding #3Good behaviors lead to good outcomes, so it’s not surprising that most respondents say their information security activities are effective—although they may not realize that confidence in this area has waned over the years.
6 Changing the game
Finding #1. Good self-assessments continue this year, with a substantial number of respondents saying their organizations exhibit the attributes of information security leaders.
A closer look at the data shows that many of these claims are overly optimistic, however. Our survey includes several questions meant to identify genuine security leadership, along with others that allow organizations to assess their own readiness. The self-assessments tend to be much more positive than our leadership analysis.
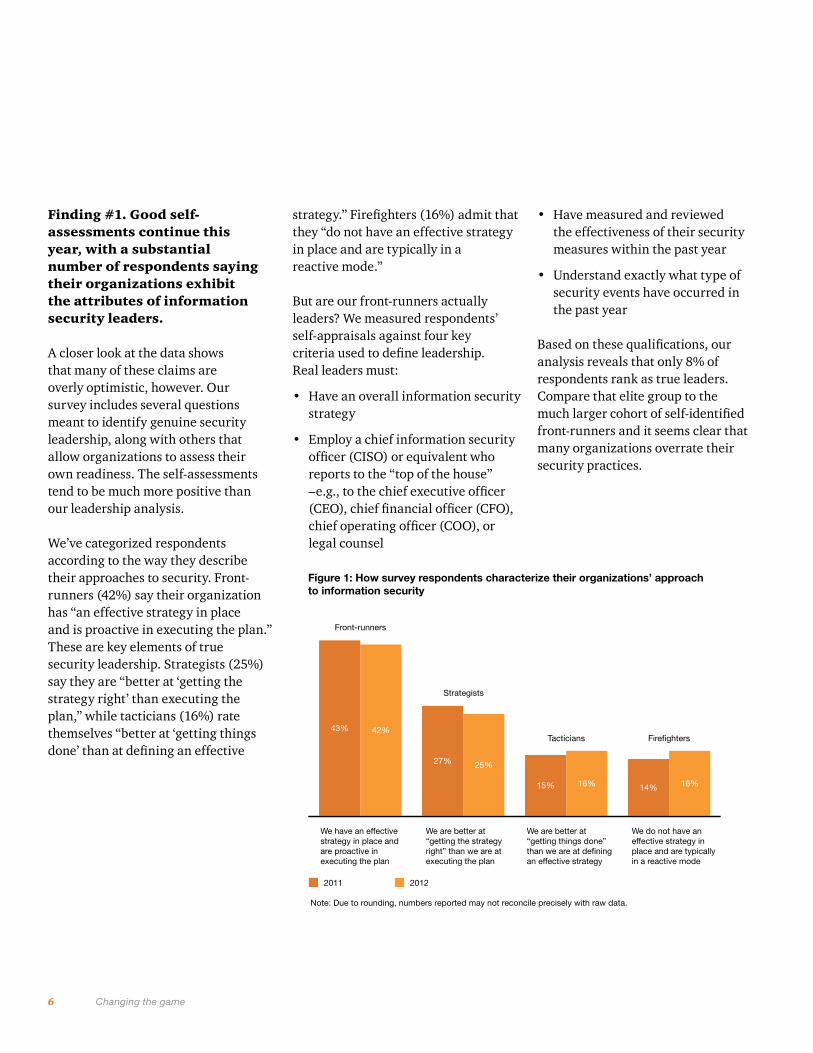
We’ve categorized respondents according to the way they describe their approaches to security. Front-runners (42%) say their organization has “an effective strategy in place and is proactive in executing the plan.” These are key elements of true security leadership. Strategists (25%) say they are “better at ‘getting the strategy right’ than executing the plan,” while tacticians (16%) rate themselves “better at ‘getting things done’ than at defining an effective
strategy.” Firefighters (16%) admit that they “do not have an effective strategy in place and are typically in a reactive mode.”
But are our front-runners actually leaders? We measured respondents’ self-appraisals against four key criteria used to define leadership. Real leaders must:
• Have an overall information security strategy
• Employ a chief information security officer (CISO) or equivalent who reports to the “top of the house” –e.g., to the chief executive officer (CEO), chief financial officer (CFO), chief operating officer (COO), or legal counsel
• Have measured and reviewed the effectiveness of their security measures within the past year
• Understand exactly what type of security events have occurred in the past year
Based on these qualifications, our analysis reveals that only 8% of respondents rank as true leaders. Compare that elite group to the much larger cohort of self-identified front-runners and it seems clear that many organizations overrate their security practices.
Figure 1: How survey respondents characterize their organizations’ approachto information security
We do not have aneffective strategy inplace and are typicallyin a reactive mode
We are better at “getting things done”than we are at definingan effective strategy
We are better at“getting the strategyright” than we are atexecuting the plan
We have an effectivestrategy in place andare proactive inexecuting the plan
2011 2012
Note: Due to rounding, numbers reported may not reconcile precisely with raw data.
Front-runners
Strategists
Tacticians Firefighters43% 42%
27% 25%
15% 16% 14% 16%
7 An in-depth discussion
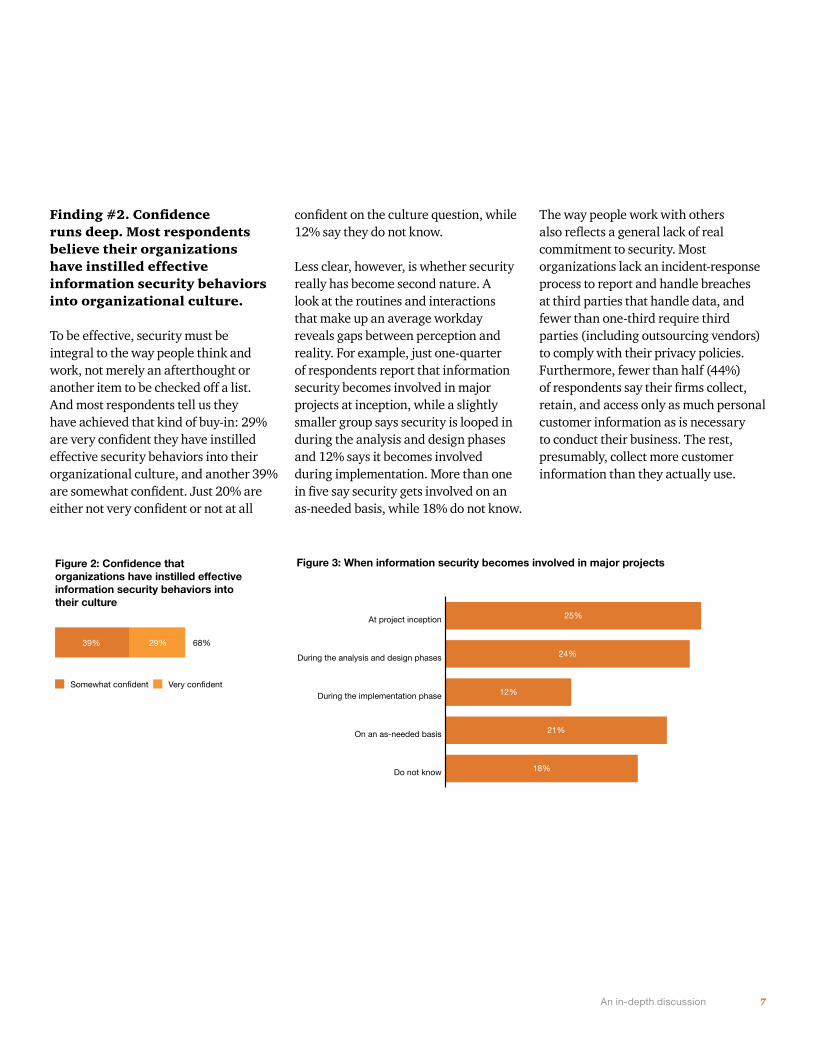
Figure 2: Confidence thatorganizations have instilled effectiveinformation security behaviors intotheir culture
Somewhat confident Very confident
39% 29% 68%
Finding #2. Confidence runs deep. Most respondents believe their organizations have instilled effective information security behaviors into organizational culture.
To be effective, security must be integral to the way people think and work, not merely an afterthought or another item to be checked off a list. And most respondents tell us they have achieved that kind of buy-in: 29% are very confident they have instilled effective security behaviors into their organizational culture, and another 39% are somewhat confident. Just 20% are either not very confident or not at all
confident on the culture question, while 12% say they do not know.
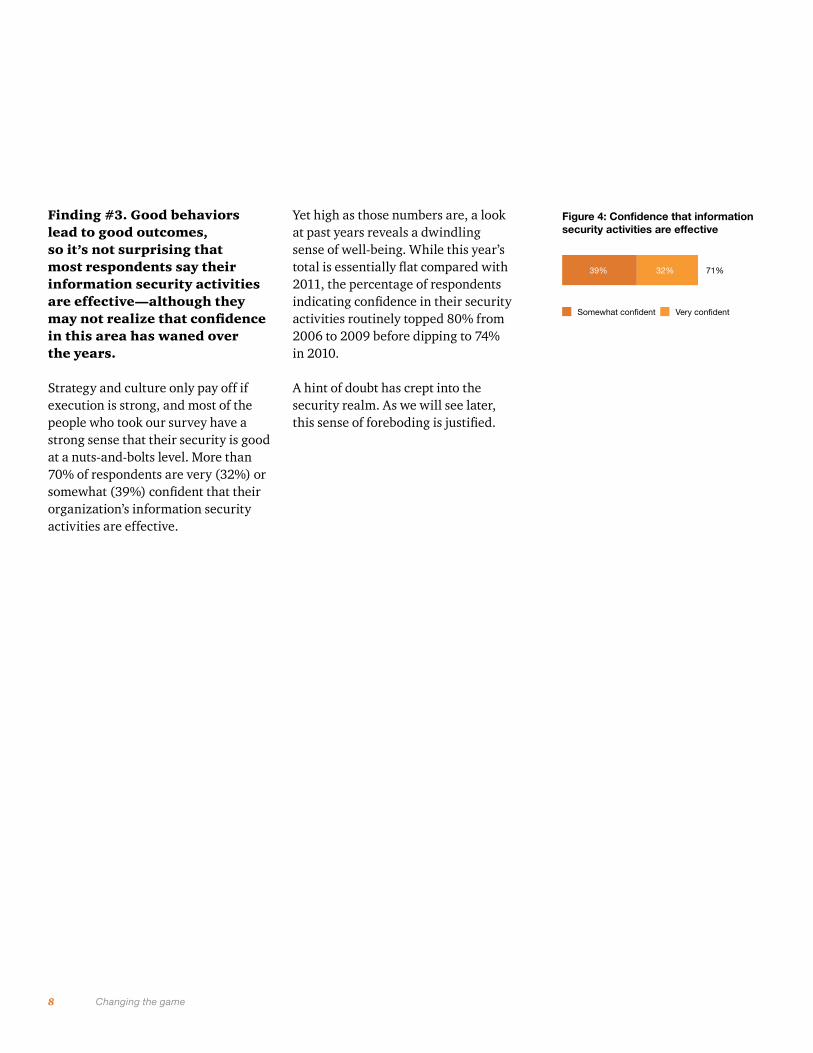
Less clear, however, is whether security really has become second nature. A look at the routines and interactions that make up an average workday reveals gaps between perception and reality. For example, just one-quarter of respondents report that information security becomes involved in major projects at inception, while a slightly smaller group says security is looped in during the analysis and design phases and 12% says it becomes involved during implementation. More than one in five say security gets involved on an as-needed basis, while 18% do not know.
The way people work with others also reflects a general lack of real commitment to security. Most organizations lack an incident-response process to report and handle breaches at third parties that handle data, and fewer than one-third require third parties (including outsourcing vendors) to comply with their privacy policies. Furthermore, fewer than half (44%) of respondents say their firms collect, retain, and access only as much personal customer information as is necessary to conduct their business. The rest, presumably, collect more customer information than they actually use.
Figure 3: When information security becomes involved in major projects
Do not know
On an as-needed basis
During the implementation phase
During the analysis and design phases
At project inception 25%
24%
12%
21%
18%
8 Changing the game
Finding #3. Good behaviors lead to good outcomes, so it’s not surprising that most respondents say their information security activities are effective—although they may not realize that confidence in this area has waned over the years.
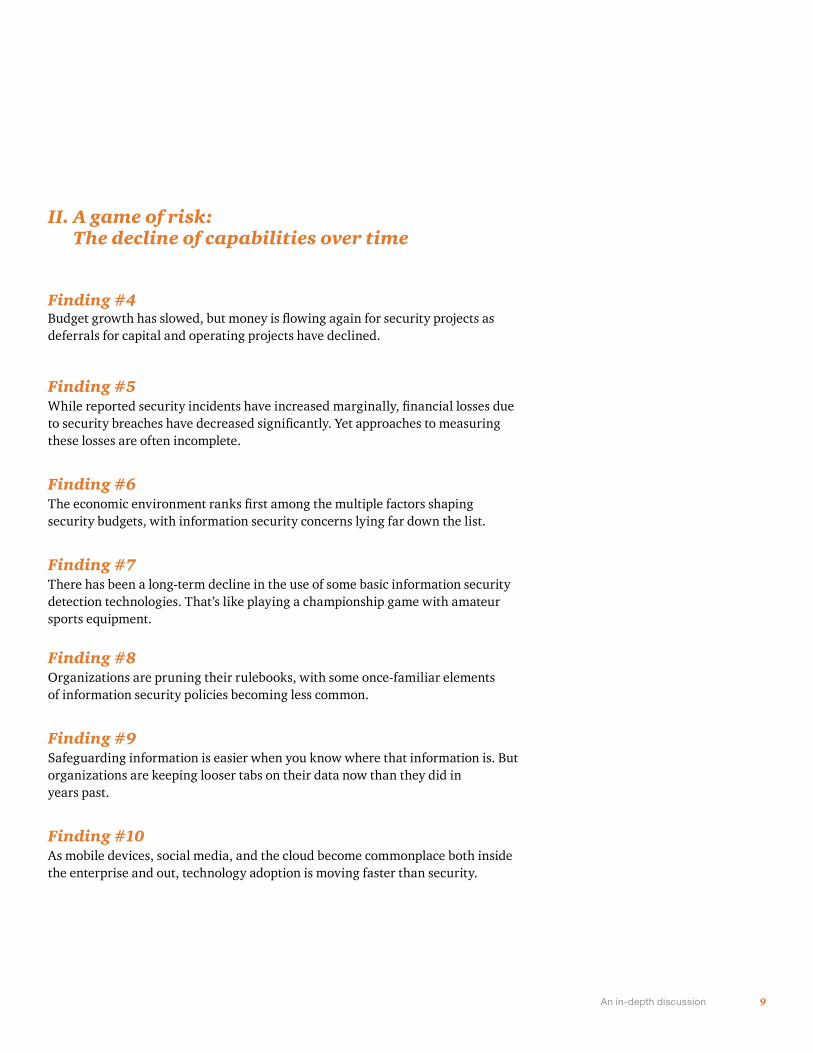
Strategy and culture only pay off if execution is strong, and most of the people who took our survey have a strong sense that their security is good at a nuts-and-bolts level. More than 70% of respondents are very (32%) or somewhat (39%) confident that their organization’s information security activities are effective.
Yet high as those numbers are, a look at past years reveals a dwindling sense of well-being. While this year’s total is essentially flat compared with 2011, the percentage of respondents indicating confidence in their security activities routinely topped 80% from 2006 to 2009 before dipping to 74% in 2010.
A hint of doubt has crept into the security realm. As we will see later, this sense of foreboding is justified.
Figure 4: Confidence that informationsecurity activities are effective
Somewhat confident Very confident
39% 32% 71%
9 An in-depth discussion
II. A game of risk: The decline of capabilities over time
Finding #4 Budget growth has slowed, but money is flowing again for security projects as deferrals for capital and operating projects have declined.
Finding #5While reported security incidents have increased marginally, financial losses due to security breaches have decreased significantly. Yet approaches to measuring these losses are often incomplete.
Finding #6The economic environment ranks first among the multiple factors shaping security budgets, with information security concerns lying far down the list.
Finding #7There has been a long-term decline in the use of some basic information security detection technologies. That’s like playing a championship game with amateur sports equipment.
Finding #8Organizations are pruning their rulebooks, with some once-familiar elements of information security policies becoming less common.
Finding #9Safeguarding information is easier when you know where that information is. But organizations are keeping looser tabs on their data now than they did in years past.
Finding #10As mobile devices, social media, and the cloud become commonplace both inside the enterprise and out, technology adoption is moving faster than security.
10 Changing the game
Finding #4. Budget growth has slowed, but money is flowing again for security projects as deferrals for capital and operating projects have declined.
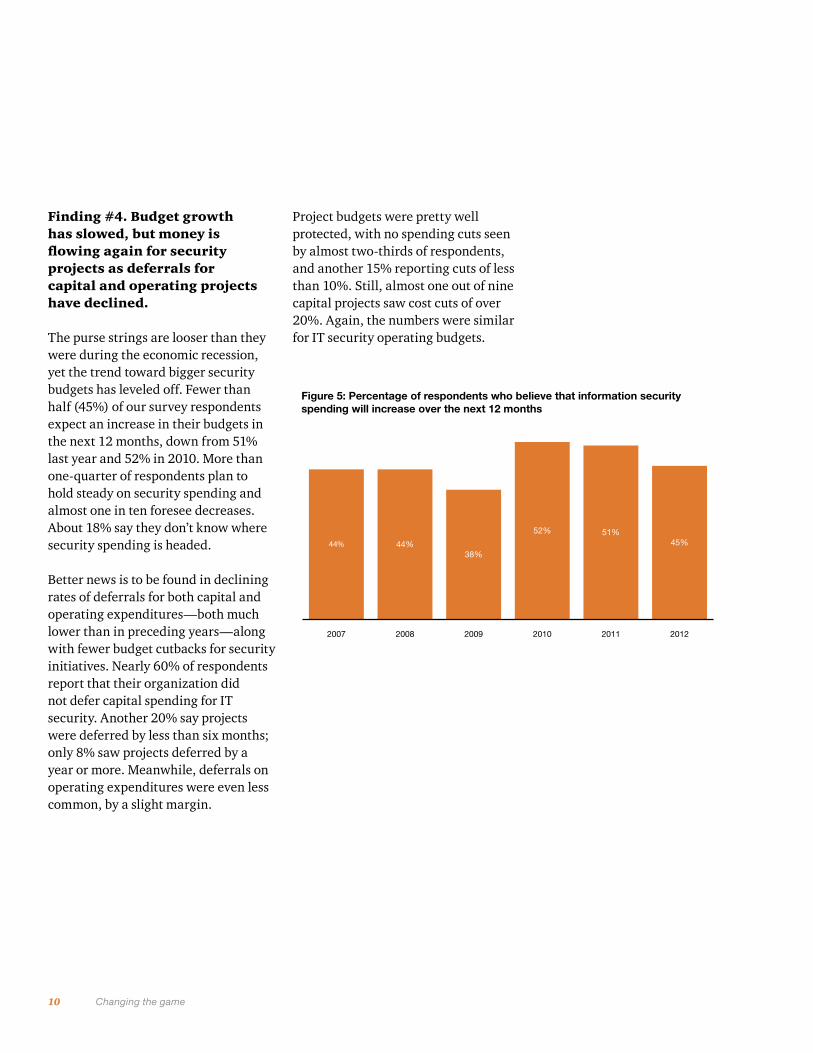
The purse strings are looser than they were during the economic recession, yet the trend toward bigger security budgets has leveled off. Fewer than half (45%) of our survey respondents expect an increase in their budgets in the next 12 months, down from 51% last year and 52% in 2010. More than one-quarter of respondents plan to hold steady on security spending and almost one in ten foresee decreases. About 18% say they don’t know where security spending is headed.
Better news is to be found in declining rates of deferrals for both capital and operating expenditures—both much lower than in preceding years—along with fewer budget cutbacks for security initiatives. Nearly 60% of respondents report that their organization did not defer capital spending for IT security. Another 20% say projects were deferred by less than six months; only 8% saw projects deferred by a year or more. Meanwhile, deferrals on operating expenditures were even less common, by a slight margin.
Project budgets were pretty well protected, with no spending cuts seen by almost two-thirds of respondents, and another 15% reporting cuts of less than 10%. Still, almost one out of nine capital projects saw cost cuts of over 20%. Again, the numbers were similar for IT security operating budgets.
Figure 5: Percentage of respondents who believe that information securityspending will increase over the next 12 months
201220112010200920082007
44% 44%38%
52% 51%45%
11 An in-depth discussion
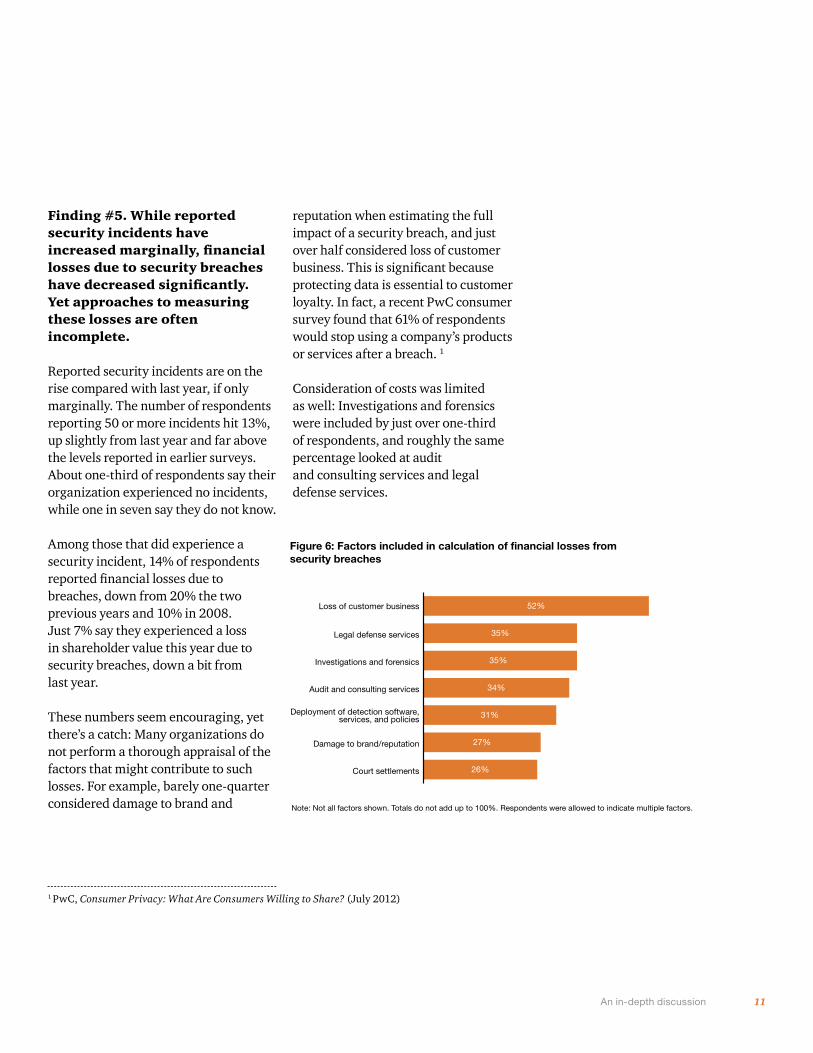
Finding #5. While reported security incidents have increased marginally, financial losses due to security breaches have decreased significantly. Yet approaches to measuring these losses are often incomplete.
Reported security incidents are on the rise compared with last year, if only marginally. The number of respondents reporting 50 or more incidents hit 13%, up slightly from last year and far above the levels reported in earlier surveys. About one-third of respondents say their organization experienced no incidents, while one in seven say they do not know.
Among those that did experience a security incident, 14% of respondents reported financial losses due to breaches, down from 20% the two previous years and 10% in 2008. Just 7% say they experienced a loss in shareholder value this year due to security breaches, down a bit from last year.
These numbers seem encouraging, yet there’s a catch: Many organizations do not perform a thorough appraisal of the factors that might contribute to such losses. For example, barely one-quarter considered damage to brand and
reputation when estimating the full impact of a security breach, and just over half considered loss of customer business. This is significant because protecting data is essential to customer loyalty. In fact, a recent PwC consumer survey found that 61% of respondents would stop using a company’s products or services after a breach. 1
Consideration of costs was limited as well: Investigations and forensics were included by just over one-third of respondents, and roughly the same percentage looked at audit and consulting services and legal defense services.
Figure 6: Factors included in calculation of financial losses fromsecurity breaches
Note: Not all factors shown. Totals do not add up to 100%. Respondents were allowed to indicate multiple factors.
Court settlements
Damage to brand/reputation
Deployment of detection software,services, and policies
Audit and consulting services
Investigations and forensics
Legal defense services
Loss of customer business 52%
35%
35%
34%
31%
27%
26%
1 PwC, Consumer Privacy: What Are Consumers Willing to Share? (July 2012)
12 Changing the game
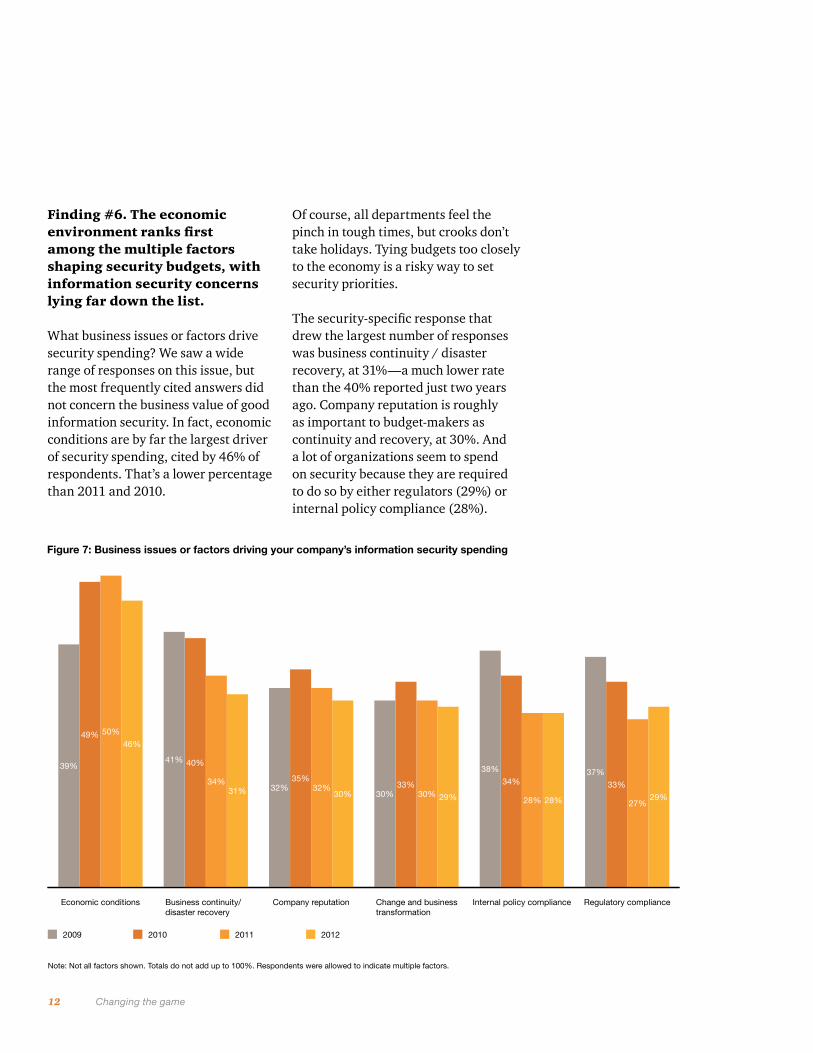
Finding #6. The economic environment ranks first among the multiple factors shaping security budgets, with information security concerns lying far down the list.
What business issues or factors drive security spending? We saw a wide range of responses on this issue, but the most frequently cited answers did not concern the business value of good information security. In fact, economic conditions are by far the largest driver of security spending, cited by 46% of respondents. That’s a lower percentage than 2011 and 2010.
Of course, all departments feel the pinch in tough times, but crooks don’t take holidays. Tying budgets too closely to the economy is a risky way to set security priorities.
The security-specific response that drew the largest number of responses was business continuity / disaster recovery, at 31%—a much lower rate than the 40% reported just two years ago. Company reputation is roughly as important to budget-makers as continuity and recovery, at 30%. And a lot of organizations seem to spend on security because they are required to do so by either regulators (29%) or internal policy compliance (28%).
Figure 7: Business issues or factors driving your company’s information security spending
Regulatory complianceInternal policy complianceChange and businesstransformation
Company reputationBusiness continuity/disaster recovery
Economic conditions
2009 2010 2011 2012
Note: Not all factors shown. Totals do not add up to 100%. Respondents were allowed to indicate multiple factors.
50%
46%49%
39%41% 40%
34%31% 32%
35%32%
30% 30%33%
30% 29%
38%
34%
28% 28%
37%
33%
27%29%
13 An in-depth discussion
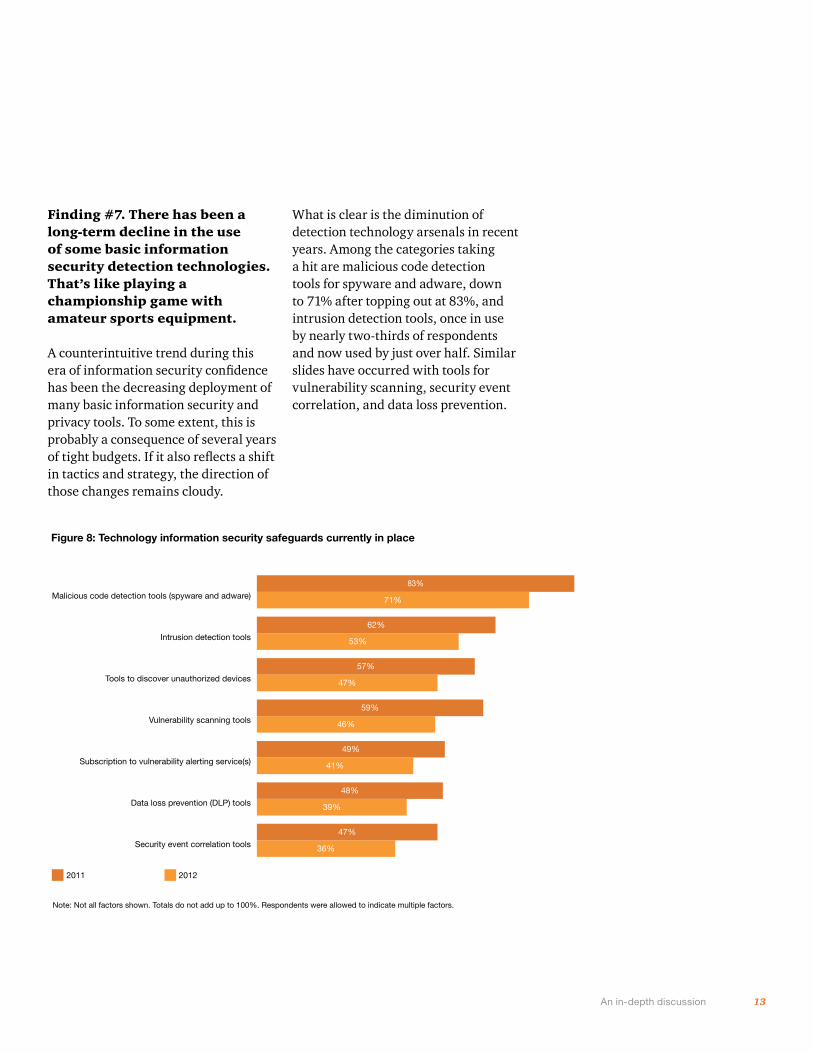
Finding #7. There has been a long-term decline in the use of some basic information security detection technologies. That’s like playing a championship game with amateur sports equipment.
A counterintuitive trend during this era of information security confidence has been the decreasing deployment of many basic information security and privacy tools. To some extent, this is probably a consequence of several years of tight budgets. If it also reflects a shift in tactics and strategy, the direction of those changes remains cloudy.
Figure 8: Technology information security safeguards currently in place
Note: Not all factors shown. Totals do not add up to 100%. Respondents were allowed to indicate multiple factors.
Security event correlation tools
Data loss prevention (DLP) tools
Subscription to vulnerability alerting service(s)
Vulnerability scanning tools
Tools to discover unauthorized devices
Intrusion detection tools
Malicious code detection tools (spyware and adware)
2011 2012
83%
71%
53%
57%
47%
59%
46%
49%
41%
48%
39%
47%
36%
62%
What is clear is the diminution of detection technology arsenals in recent years. Among the categories taking a hit are malicious code detection tools for spyware and adware, down to 71% after topping out at 83%, and intrusion detection tools, once in use by nearly two-thirds of respondents and now used by just over half. Similar slides have occurred with tools for vulnerability scanning, security event correlation, and data loss prevention.
14 Changing the game
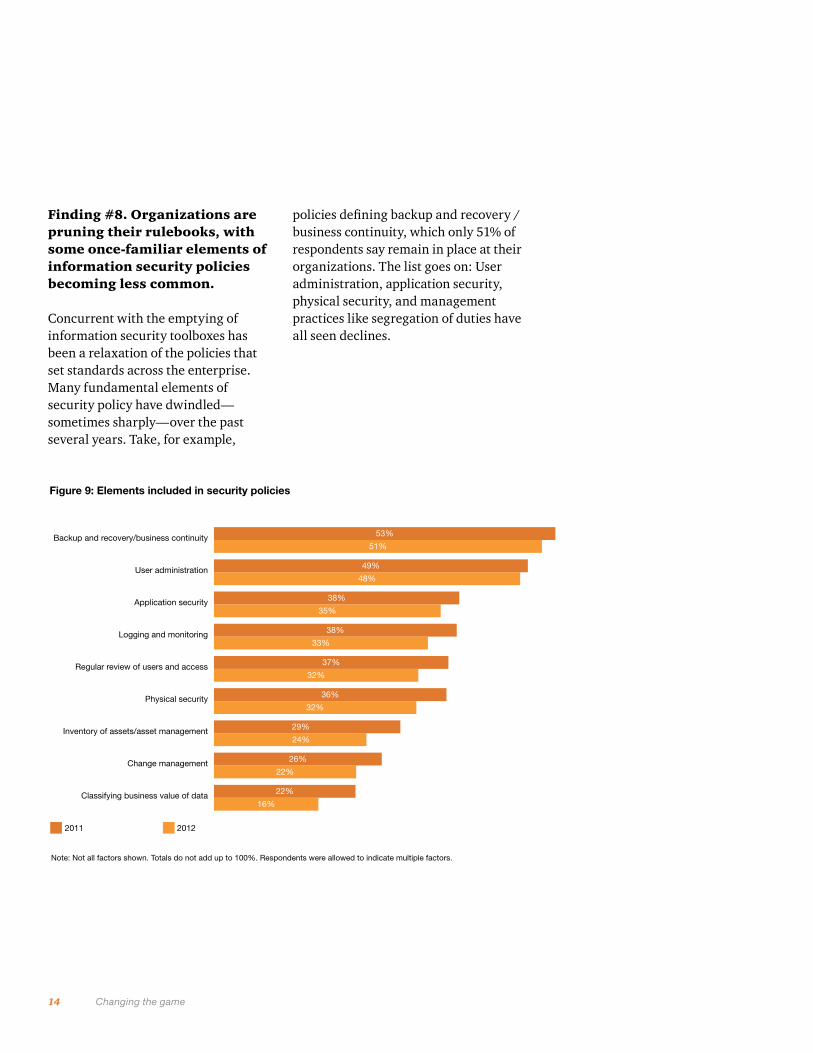
Finding #8. Organizations are pruning their rulebooks, with some once-familiar elements of information security policies becoming less common.
Concurrent with the emptying of information security toolboxes has been a relaxation of the policies that set standards across the enterprise. Many fundamental elements of security policy have dwindled—sometimes sharply—over the past several years. Take, for example,
Figure 9: Elements included in security policies
Note: Not all factors shown. Totals do not add up to 100%. Respondents were allowed to indicate multiple factors.
Classifying business value of data
Change management
Inventory of assets/asset management
Physical security
Regular review of users and access
Logging and monitoring
Application security
User administration
Backup and recovery/business continuity
2011 2012
53%
51%
49%
38%
35%
38%
33%
37%
32%
36%
32%
29%
24%
26%
22%
22%
16%
48%
policies defining backup and recovery / business continuity, which only 51% of respondents say remain in place at their organizations. The list goes on: User administration, application security, physical security, and management practices like segregation of duties have all seen declines.
15 An in-depth discussion
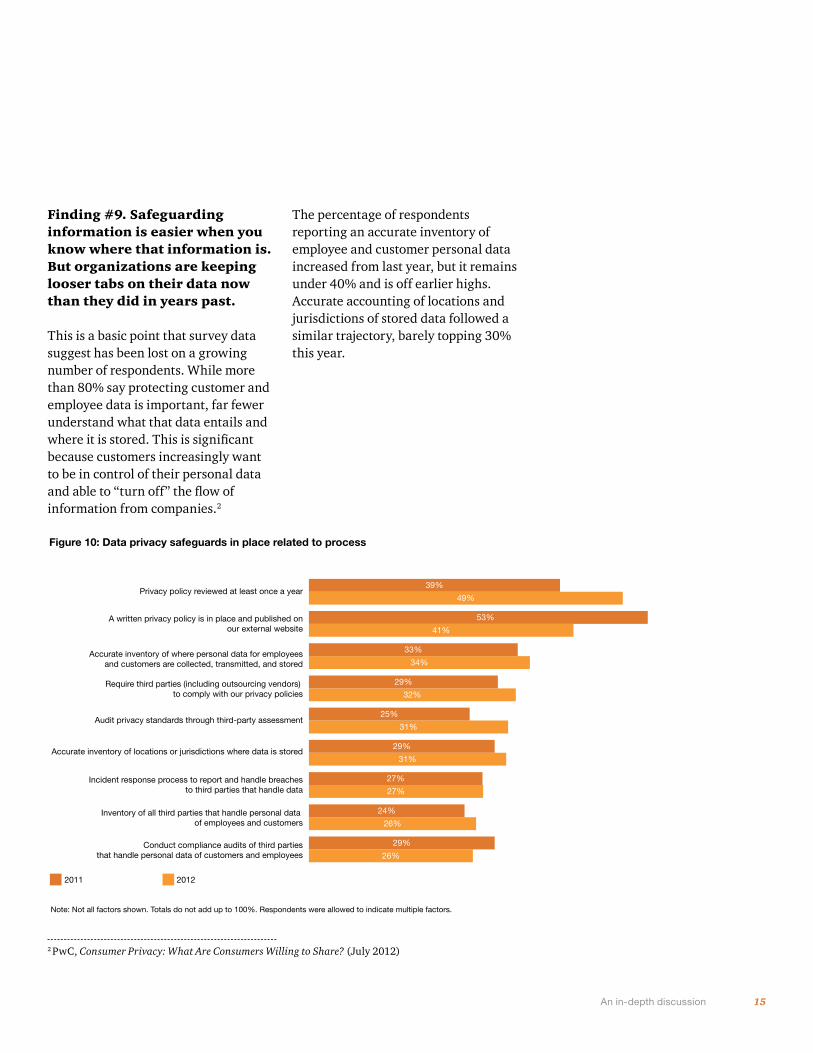
Finding #9. Safeguarding information is easier when you know where that information is. But organizations are keeping looser tabs on their data now than they did in years past.
This is a basic point that survey data suggest has been lost on a growing number of respondents. While more than 80% say protecting customer and employee data is important, far fewer understand what that data entails and where it is stored. This is significant because customers increasingly want to be in control of their personal data and able to “turn off” the flow of information from companies.2
The percentage of respondents reporting an accurate inventory of employee and customer personal data increased from last year, but it remains under 40% and is off earlier highs. Accurate accounting of locations and jurisdictions of stored data followed a similar trajectory, barely topping 30% this year.
Figure 10: Data privacy safeguards in place related to process
Note: Not all factors shown. Totals do not add up to 100%. Respondents were allowed to indicate multiple factors.
Conduct compliance audits of third parties that handle personal data of customers and employees
Inventory of all third parties that handle personal data of employees and customers
Incident response process to report and handle breaches to third parties that handle data
Accurate inventory of locations or jurisdictions where data is stored
Audit privacy standards through third-party assessment
Require third parties (including outsourcing vendors) to comply with our privacy policies
Accurate inventory of where personal data for employees and customers are collected, transmitted, and stored
A written privacy policy is in place and published on our external website
Privacy policy reviewed at least once a year
2011 2012
39%
49%
53%
33%
34%
29%
32%
25%
31%
29%
31%
27%
27%
24%
26%
29%
26%
41%
2 PwC, Consumer Privacy: What Are Consumers Willing to Share? (July 2012)
16 Changing the game
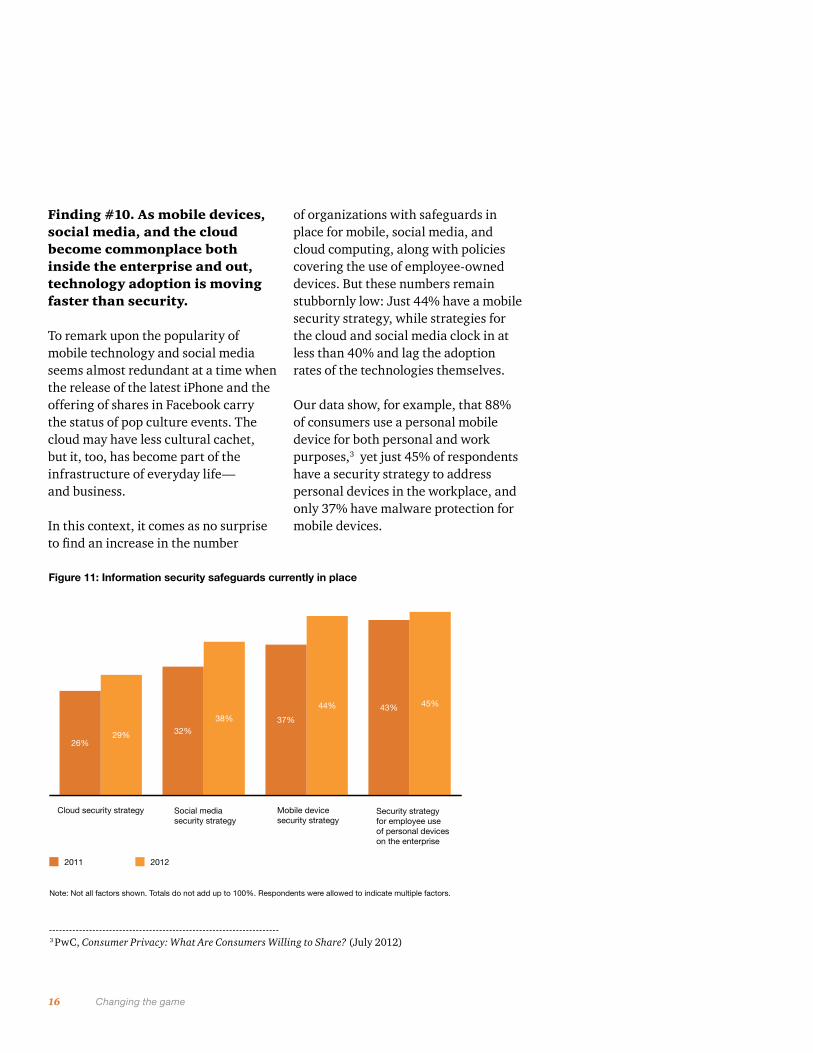
Finding #10. As mobile devices, social media, and the cloud become commonplace both inside the enterprise and out, technology adoption is moving faster than security.
To remark upon the popularity of mobile technology and social media seems almost redundant at a time when the release of the latest iPhone and the offering of shares in Facebook carry the status of pop culture events. The cloud may have less cultural cachet, but it, too, has become part of the infrastructure of everyday life— and business.
In this context, it comes as no surprise to find an increase in the number
Figure 11: Information security safeguards currently in place
Security strategyfor employee use of personal devices on the enterprise
Mobile device security strategy
Social media security strategy
Cloud security strategy
2011 2012
Note: Not all factors shown. Totals do not add up to 100%. Respondents were allowed to indicate multiple factors.
26%29% 32%
38% 37%
44% 43% 45%
of organizations with safeguards in place for mobile, social media, and cloud computing, along with policies covering the use of employee-owned devices. But these numbers remain stubbornly low: Just 44% have a mobile security strategy, while strategies for the cloud and social media clock in at less than 40% and lag the adoption rates of the technologies themselves.
Our data show, for example, that 88% of consumers use a personal mobile device for both personal and work purposes,3 yet just 45% of respondents have a security strategy to address personal devices in the workplace, and only 37% have malware protection for mobile devices.
3 PwC, Consumer Privacy: What Are Consumers Willing to Share? (July 2012)
17 An in-depth discussion
III. It’s how you play the game: Alignment, leadership, and training are key
Finding #11A focus on business success should inform all aspects of the organization’s activities. Most respondents say security strategies and security spending are aligned with business goals.
Finding #12An effective coach is key to a winning team. Respondents say executives still have work to do in demonstrating their leadership in security strategy. Security leaders, meanwhile, still lack adequate access to the executive suite.
Finding #13People who don’t know how to do things rarely do them well, which makes the lack of staff and resources available for security training a significant problem.
18 Changing the game
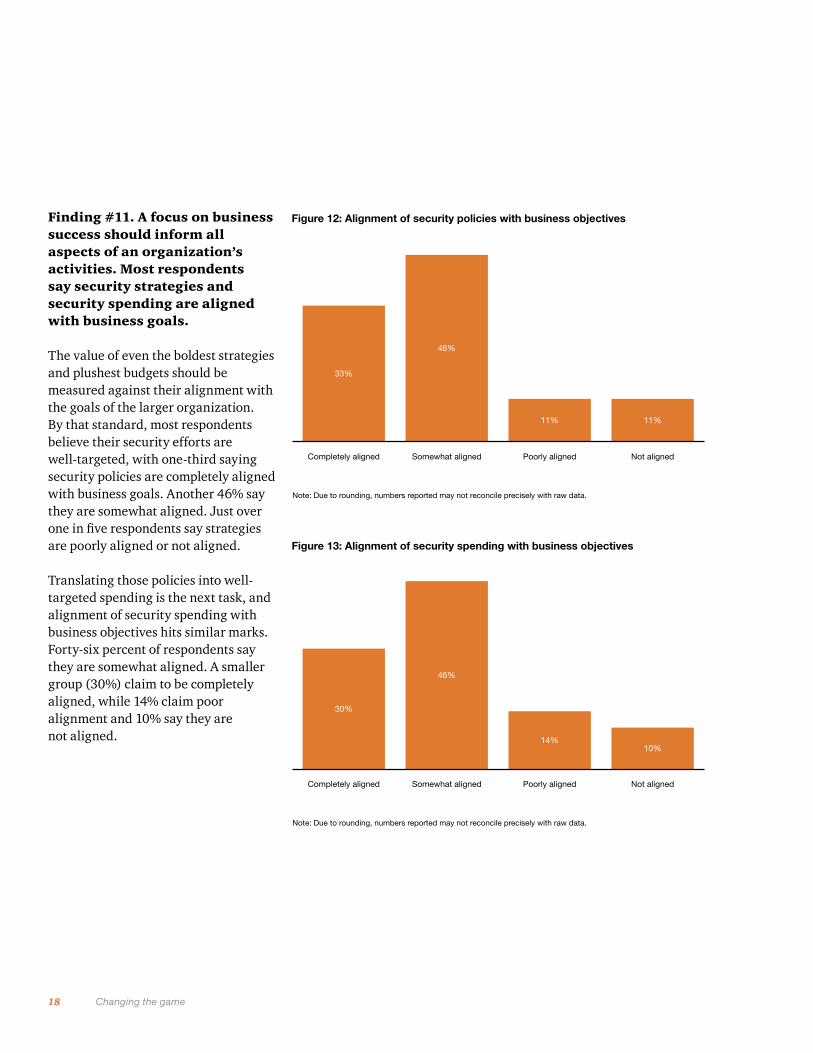
Finding #11. A focus on business success should inform all aspects of an organization’s activities. Most respondents say security strategies and security spending are aligned with business goals.
The value of even the boldest strategies and plushest budgets should be measured against their alignment with the goals of the larger organization. By that standard, most respondents believe their security efforts are well-targeted, with one-third saying security policies are completely aligned with business goals. Another 46% say they are somewhat aligned. Just over one in five respondents say strategies are poorly aligned or not aligned.
Translating those policies into well-targeted spending is the next task, and alignment of security spending with business objectives hits similar marks. Forty-six percent of respondents say they are somewhat aligned. A smaller group (30%) claim to be completely aligned, while 14% claim poor alignment and 10% say they are not aligned.
Figure 12: Alignment of security policies with business objectives
Not alignedPoorly alignedSomewhat alignedCompletely aligned
Note: Due to rounding, numbers reported may not reconcile precisely with raw data.
33%
46%
11% 11%
Figure 13: Alignment of security spending with business objectives
Not alignedPoorly alignedSomewhat alignedCompletely aligned
Note: Due to rounding, numbers reported may not reconcile precisely with raw data.
30%
46%
14%10%
19 An in-depth discussion
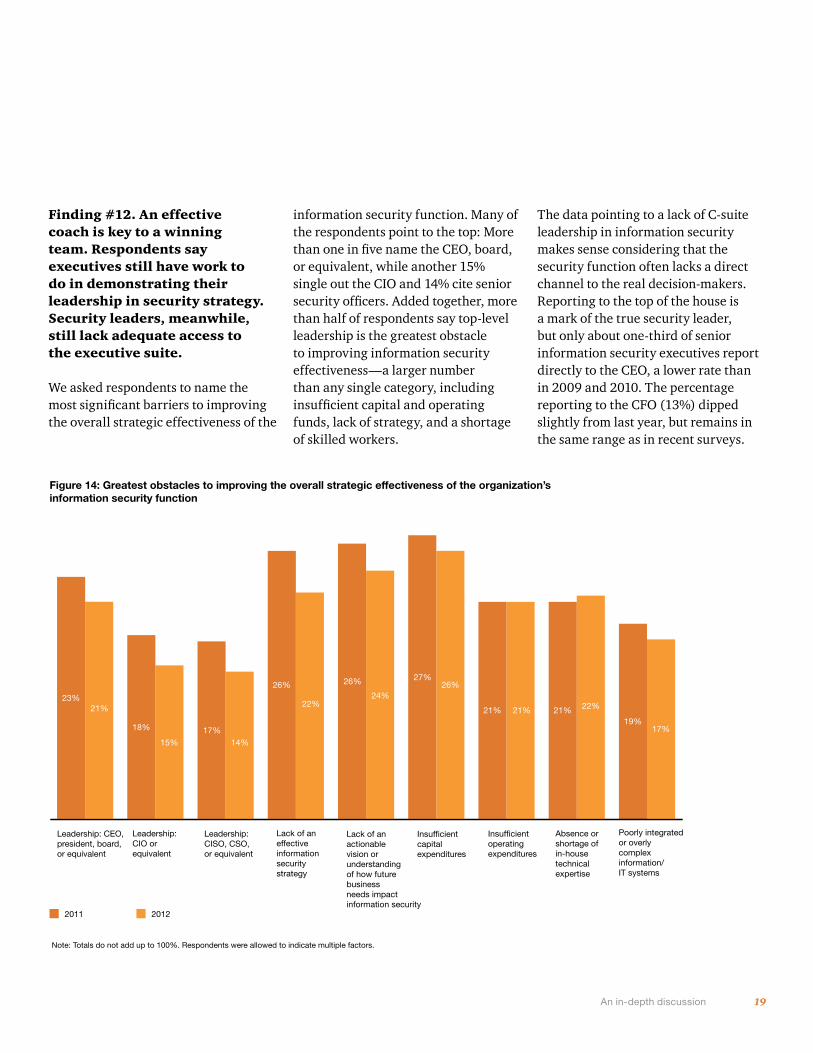
Finding #12. An effective coach is key to a winning team. Respondents say executives still have work to do in demonstrating their leadership in security strategy. Security leaders, meanwhile, still lack adequate access to the executive suite.
We asked respondents to name the most significant barriers to improving the overall strategic effectiveness of the
information security function. Many of the respondents point to the top: More than one in five name the CEO, board, or equivalent, while another 15% single out the CIO and 14% cite senior security officers. Added together, more than half of respondents say top-level leadership is the greatest obstacle to improving information security effectiveness—a larger number than any single category, including insufficient capital and operating funds, lack of strategy, and a shortage of skilled workers.
Figure 14: Greatest obstacles to improving the overall strategic effectiveness of the organization’s information security function
Poorly integratedor overly complex information/IT systems
Absence orshortage ofin-house technical expertise
Insufficient operatingexpenditures
Insufficient capitalexpenditures
Lack of an actionable vision or understanding of how future business needs impact information security
Lack of an effectiveinformationsecurity strategy
Leadership:CISO, CSO, or equivalent
Leadership: CIO orequivalent
Leadership: CEO,president, board, or equivalent
2011 2012
Note: Totals do not add up to 100%. Respondents were allowed to indicate multiple factors.
18%
21%23%
15%17%
14%
26%
22%
26%
24%
27%26%
21% 21% 21% 22%
19%17%
The data pointing to a lack of C-suite leadership in information security makes sense considering that the security function often lacks a direct channel to the real decision-makers. Reporting to the top of the house is a mark of the true security leader, but only about one-third of senior information security executives report directly to the CEO, a lower rate than in 2009 and 2010. The percentage reporting to the CFO (13%) dipped slightly from last year, but remains in the same range as in recent surveys.
20 Changing the game
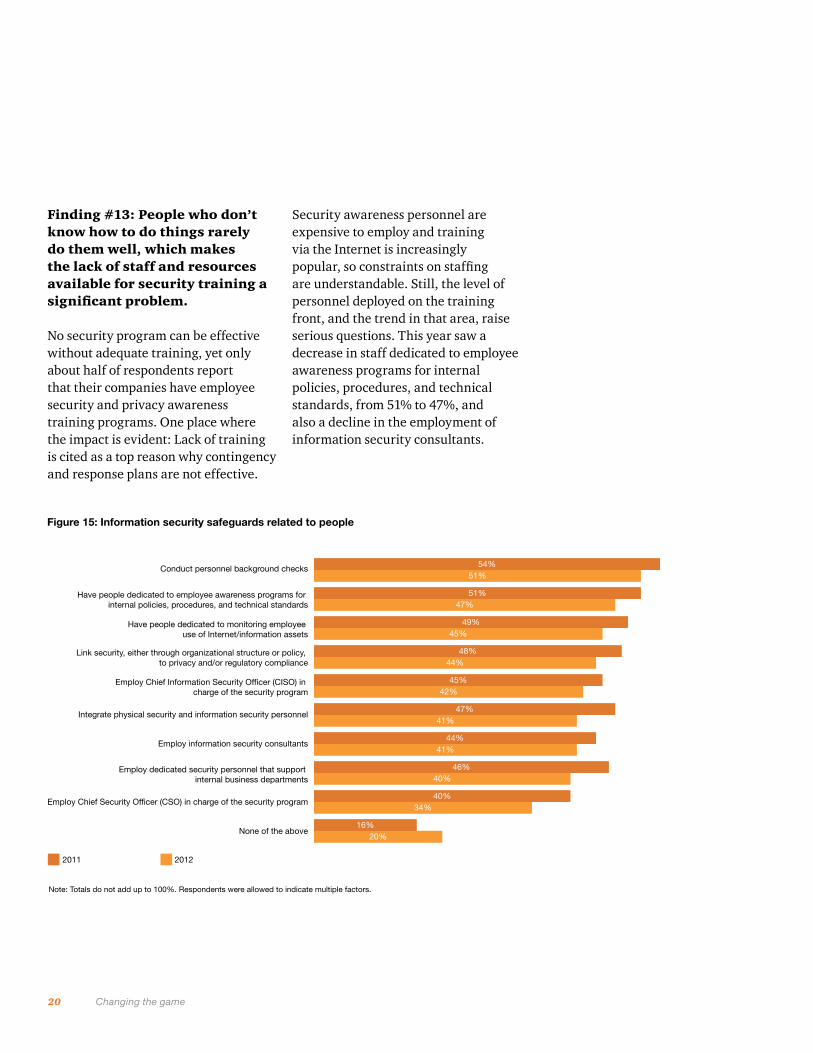
Finding #13: People who don’t know how to do things rarely do them well, which makes the lack of staff and resources available for security training a significant problem.
No security program can be effective without adequate training, yet only about half of respondents report that their companies have employee security and privacy awareness training programs. One place where the impact is evident: Lack of training is cited as a top reason why contingency and response plans are not effective.
Security awareness personnel are expensive to employ and training via the Internet is increasingly popular, so constraints on staffing are understandable. Still, the level of personnel deployed on the training front, and the trend in that area, raise serious questions. This year saw a decrease in staff dedicated to employee awareness programs for internal policies, procedures, and technical standards, from 51% to 47%, and also a decline in the employment of information security consultants.
Figure 15: Information security safeguards related to people
Note: Totals do not add up to 100%. Respondents were allowed to indicate multiple factors.
None of the above
Employ Chief Security Officer (CSO) in charge of the security program
Employ dedicated security personnel that support internal business departments
Employ information security consultants
Integrate physical security and information security personnel
Employ Chief Information Security Officer (CISO) in charge of the security program
Link security, either through organizational structure or policy, to privacy and/or regulatory compliance
Have people dedicated to monitoring employee use of Internet/information assets
Have people dedicated to employee awareness programs for internal policies, procedures, and technical standards
Conduct personnel background checks
2011 2012
54%51%
51%
49%45%
48%44%
45%42%
47%
41%
46%40%
40%34%
16%20%
47%
41%
44%
21 An in-depth discussion
IV. The new world order: Asia advances, South America makes its move, and other regions try to maintain
Finding #14 Years of investment pay off as Asia leads the world in security practices and performance.
Finding #15Security budgets are almost flat in North America, but certain strategies show gains.
Finding #16As spending stalls in Europe and safeguards weaken, some security practices are improving. Finding #17South America plays catch-up on security investments and emerges as a leader in some important categories.
22 Changing the game
Finding #14. Years of investment pay off as Asia leads the world in security practices and performance.
Among all regions, Asia has the fewest respondents who expect a decrease in security budgets this year. In fact, roughly 60% of Asian respondents expect to see an increase over the next 12 months. That’s down from 74% in 2011, but still among the highest of any region.
But Asia’s success in creating a culture of security goes beyond spending. The region, in fact, boasts the highest number of self-proclaimed front-runners among our survey respondents. Confidence in information security runs high in Asia, and at least some of this confidence is justified by the extent to which strategy, technology, and processes are in place.
For example, senior security executives report directly to the CEO more often in Asia than elsewhere—an important measure of security’s place in organizational culture. And it’s clear that this culture of security runs deep: Asian organizations are the second most likely to bake security into major projects from the start, and are more likely than their peers in other regions to base security spending on factors like business
continuity and disaster recovery, rather than other external drivers.
Asia respondents also put their organizations at or near the top of global averages in terms of security and privacy technology deployment, and also in terms of process. As for keeping up with new challenges, Asia rates highly for mobile security initiatives and cloud security strategy.
Finding #15. Security budgets are almost flat in North America, but certain strategies show gains.
Plan your work and work your plan: That seems to be the motto in North America. At first glance, the budget outlook for the region is uninspiring. Only about one-third of respondents expect to see a bump in their security budgets next year, continuing a modest up trend but far behind Asia and South America. Almost the same percentage—a larger percentage than in any other region—expects budgets to remain flat, and uncertainty hangs over the discussion of dollars, with almost one-quarter of respondents saying they do not know where spending is headed.
But look a little closer and one trend emerges: predictable outcomes. Responses from North American
organizations indicate that they are the best in the world at staying on plan when it comes to IT projects. Based on their survey responses, they are the least likely to defer capital or operational projects, and the deferrals that do happen tend to be shorter than those in other regions. And North American firms are the least likely to cut budgets for capital and operational projects.
This strength in process and planning extends to other areas. Respondents say that their contingency plans for downtime, for example, are quite effective. Indeed, average downtimes over the past 12 months as a result of security incidents (unavailable services/applications/network) are lower in North America than in other regions.
Other areas in which North American respondents indicate superior performance when measured against peers include the vital areas of mobility, social media, and the cloud. While progress in these realms still lags the adoption rates of the technologies, North America ties with Asia for the lead in cloud security strategy and is tops in mobile and social networking security—the latter by a considerable margin. Another distinction: Responses from North American firms indicate that they are far and away the least likely to outsource security functions.
23 An in-depth discussion
#16. As spending stalls in Europe and safeguards weaken, some security practices are improving.
European respondents claim modest confidence in the effectiveness of their information security policies and activities. The region has a lower percentage of self-proclaimed front-runners than any part of the globe except the Middle East and South Africa. And as Winston Churchill might have put it, these executives have much to be modest about.
Spending remains in the doldrums. Expectations for budget growth are higher than North America, but Europe also leads every region except the Middle East and South Africa in respondents looking at lower budgets (14%). Both security spending and security policies are less well-aligned with business goals than in other established regions.
Europe does lead the world in the percentage of firms that employ chief privacy officers or the equivalent, and also rates highly in terms of employing CISOs and chief security officers (CSOs). However, these executives report to the top of the house less often than in the three other leading regions. Europe scores poorly in terms of privacy technology and policy, and surpasses only the Middle East and
South Africa in terms of fewer senior security executives reporting directly to the CEO.
#17. South America plays catch-up on security investments and emerges as a leader in some important categories.
An upbeat mood is evident in South America, where spending has picked up after a fallow spell and confidence is on the rebound. More than 60% of respondents expect to see their security budgets increase in the next 12 months, including the highest proportion in any region expecting very large budget increases of 30% or more. Conversely, deferrals and cuts to project budgets are more frequent than in most other regions.
The surge of investment comes as tough economic times were beginning to deplete the region’s security arsenal. Now South American respondents are at or near the top of global rankings for confidence in security culture and the effectiveness of security activities. In terms of privacy and security technologies, South America tends to outscore Europe and in some cases has surpassed North America.
Looking to the future, South American respondents indicate the region is doing pretty well in terms of initiatives for mobile security, at least as compared with regions other than Asia. Respondents are also bullish about the cloud’s impact on security. South America trails only Asia in the frequency of security policy reviews. Outsourcing of various security functions, however, is more common among South American respondents than among respondents from any other region.
24 Changing the game
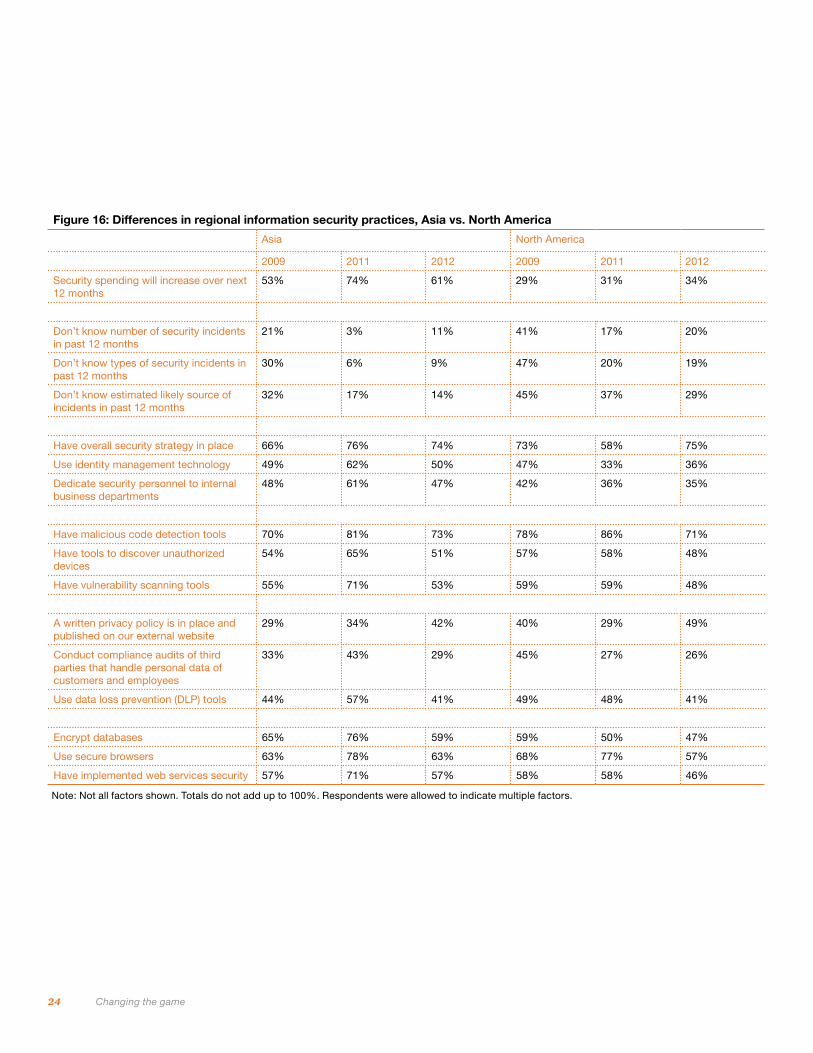
Figure 16: Differences in regional information security practices, Asia vs. North America
Asia North America
2009 2011 2012 2009 2011 2012
Security spending will increase over next 12 months
53% 74% 61% 29% 31% 34%
Don’t know number of security incidents in past 12 months
21% 3% 11% 41% 17% 20%
Don’t know types of security incidents in past 12 months
30% 6% 9% 47% 20% 19%
Don’t know estimated likely source of incidents in past 12 months
32% 17% 14% 45% 37% 29%
Have overall security strategy in place 66% 76% 74% 73% 58% 75%
Use identity management technology 49% 62% 50% 47% 33% 36%
Dedicate security personnel to internal business departments
48% 61% 47% 42% 36% 35%
Have malicious code detection tools 70% 81% 73% 78% 86% 71%
Have tools to discover unauthorized devices
54% 65% 51% 57% 58% 48%
Have vulnerability scanning tools 55% 71% 53% 59% 59% 48%
A written privacy policy is in place and published on our external website
29% 34% 42% 40% 29% 49%
Conduct compliance audits of third parties that handle personal data of customers and employees
33% 43% 29% 45% 27% 26%
Use data loss prevention (DLP) tools 44% 57% 41% 49% 48% 41%
Encrypt databases 65% 76% 59% 59% 50% 47%
Use secure browsers 63% 78% 63% 68% 77% 57%
Have implemented web services security 57% 71% 57% 58% 58% 46%
Note: Not all factors shown. Totals do not add up to 100%. Respondents were allowed to indicate multiple factors.
25 An in-depth discussion
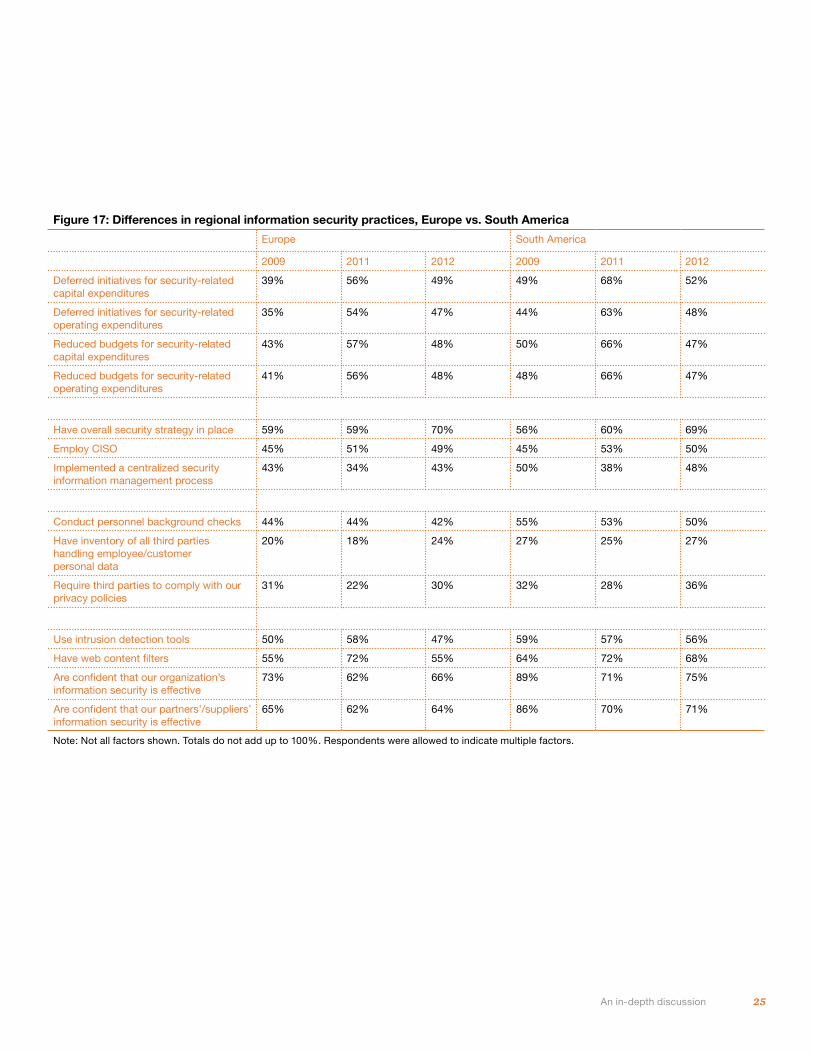
Figure 17: Differences in regional information security practices, Europe vs. South America
Europe South America
2009 2011 2012 2009 2011 2012
Deferred initiatives for security-related capital expenditures
39% 56% 49% 49% 68% 52%
Deferred initiatives for security-related operating expenditures
35% 54% 47% 44% 63% 48%
Reduced budgets for security-related capital expenditures
43% 57% 48% 50% 66% 47%
Reduced budgets for security-related operating expenditures
41% 56% 48% 48% 66% 47%
Have overall security strategy in place 59% 59% 70% 56% 60% 69%
Employ CISO 45% 51% 49% 45% 53% 50%
Implemented a centralized security information management process
43% 34% 43% 50% 38% 48%
Conduct personnel background checks 44% 44% 42% 55% 53% 50%
Have inventory of all third parties handling employee/customer personal data
20% 18% 24% 27% 25% 27%
Require third parties to comply with our privacy policies
31% 22% 30% 32% 28% 36%
Use intrusion detection tools 50% 58% 47% 59% 57% 56%
Have web content filters 55% 72% 55% 64% 72% 68%
Are confident that our organization’s information security is effective
73% 62% 66% 89% 71% 75%
Are confident that our partners’/suppliers’ information security is effective
65% 62% 64% 86% 70% 71%
Note: Not all factors shown. Totals do not add up to 100%. Respondents were allowed to indicate multiple factors.
What this means for your business
Understanding the practices of true information security leaders can help you improve your organization’s security game.
27 What this means to your business
Thousands of executives participated in this survey. These are people who take information security seriously. Indeed, their jobs—and the success of their organizations—depend on getting it right. Yet just 8% responded to our questions in ways that met our criteria for true leaders in the field—an elite group with the vision, determination, skills, and support to create the most effective security organizations.
Leaders comprise a higher percentage of respondents from North America and Asia than from either Europe or South America. In general terms, executives who are leaders are more likely to work at a large company than a smaller one, and to command larger IT and security budgets than their peers.
How leaders play the game
Organizations that are true leaders in information security are much more likely than other companies to employ integrated approaches and frameworks that combine compliance, privacy and data usage, security, and identity theft.
Leaders are less likely to cut security spending and more likely to increase it, and they score higher than non-leaders on almost every area of security preparedness. They measure financial losses more thoroughly, and are much better aligned with overall
business strategy than non-leaders—although there is substantial room for improvement on that front, especially in terms of how they spend their money. Interestingly, leaders are more likely than other survey respondents to blame their companies’ most senior executives for security shortcomings.
The distance between leaders and the rest of our respondents is very wide in some key areas. For example, leaders are far less likely to defer projects and suffer cuts to project budgets. They are also much more likely to employ a CISO than the overall survey population (90% vs. 42%) and to employ a CSO (70% to 34%).
When it comes to securing newer technologies such as mobile devices, social media, and the cloud, leaders are ahead of the pack on strategy, and have a sizable lead in deploying mobile device malware protection and launching mobile security initiatives.
Finally, leaders are far more aware of what’s going on in their organizations than the average respondent. On question after question, either no leaders or a very small fraction of the group said they did not know the answer, while “do not know” responses among the general respondent population routinely registered 15% or more.
28 Changing the game
What you can do to improve your performance
Information security today is a rapidly evolving game of advanced skill and strategy. As a result, the security models of the past decade are no longer effective.
Today’s information security leaders acknowledge that playing the game at a higher level is required to achieve effective security. They know that the very survival of the business demands that they understand security threats, prepare for them, and respond to them quickly.
Businesses seeking to strengthen their security practice must:
• Implement a comprehensive risk-assessment strategy and align security investments with identified risks
• Understand their organization’s information, who wants it, and what tactics adversaries might use to get it
• Understand that information security requirements—and, indeed, overall strategies for doing business—have reached a turning point
• Embrace a new way of thinking in which information security is both a means to protect data and an opportunity to create value to the business
Ask us, and we can provide you with more details on the way leaders play a better game and how their moves are relevant to your organization.
The Global State of Information Security® is a registered trademark of International Data Group, Inc.
© 2012 PricewaterhouseCoopers LLP, a Delaware limited liability partnership. All rights reserved. PwC refers to the United States member firm, and may sometimes refer to the PwC network. Each member firm is a separate legal entity. Please see www.pwc.com/structure for further details. This content is for general information purposes only, and should not be used as a substitute for consultation with professional advisors. DH-13-0028.th
www.pwc.com/giss2013
For more information, please contact:
Gary Loveland Products & Services Industries 949 437 5380 [email protected]
Mark Lobel Products & Services Industries 646 471 5731 [email protected]
Joe Nocera Financial Services Industry 312 298 2745 [email protected]
Peter Harries Health Industries 213 356 6760 [email protected]
John Hunt Public Sector 703 918 3767 [email protected]
Dave Burg Forensic Services 703 918 1067 [email protected]
Dave Roath Risk Assurance Services 646 471 5876 [email protected]
Or visit: www.pwc.com/giss2013