q3 2019 investor presentation - ir.net1.com
TRANSCRIPT

Q3 2019 Investor Presentation
www.net1.com
Safe Harbor Statement
2
The Private Securities Litigation Reform Act of 1995 provides a “safe harbor” for certain forward-looking statements so long as such information is identified as forward-looking and is accompanied by meaningful cautionary statements identifying important factors that could cause actual results to differ materially from those projected in the information. The use of words such as “may”, “might”, “will”, “should”, “expect”, “plan”, “anticipate”, “believe”, “estimate”, “project”, “intend”, “future”, “potential” or “continue”, and other similar expressions are intended to identify forward-looking statements. All of these forward-looking statements are based on estimates and assumptions by our management that, although we believe to be reasonable, are inherently uncertain. Forward-looking statements involve risks and uncertainties, including, but not limited to, economic, competitive, governmental and technological factors outside of our control, that may cause our business, industry, strategy or actual results to differ materially from the forward-looking statements. These risks and uncertainties may include those discussed in the Company’s annual report on Form 10-K for the year ended June 30, 2018, on file with the Securities and Exchange Commission, and other factors which may not be known to us. Any forward-looking statement speaks only as of its date. We undertake no obligation to publicly update or revise any forward-looking statement, whether as a result of new information, future events or otherwise, except as required by law.

Unless specifically noted otherwise within this presentation, the following terms are hereby defined as follows:
Constant Currency: We analyze our results of operations both in U.S. dollars, as presented in the consolidated financial statements, and supplementally in ZAR, because ZAR is the functional currency of the entities which contribute the majority of our profits and is the currency in which the majority of our transactions are initially incurred and measured. Due to the significant impact of currency fluctuations between the U.S. dollar and ZAR on our reported results and because we use the U.S. dollar as our reporting currency, we believe that the supplemental presentation of our results of operations in ZAR is useful to investors to understand the changes in the underlying trends of our business. The use of constant currency is a non-GAAP measure.
Adjusted EBITDA : Net (loss) income before non-controlling interests, earnings from equity accounted investments, interest, taxation, depreciation and amortization expenses (“EBITDA”) adjusted for impairment losses, transaction or financing related charges, and other non-operating or non-recurring items that are considered expenses or income under U.S. GAAP. EBITDA and adjusted EBITDA are non-GAAP measures and represent a performance measure that is not intended to represent a liquidity measure.
Reconciliation of US GAAP measures to EBITDA, Adjusted EBITDA, Fundamental (Loss) Earnings and (Loss) Earnings Per Share: The reconciliation is included in Appendix A.
The Company does not provide reconciliation of its forward-looking non-GAAP measures to GAAP due to the inherent difficulty in forecasting and quantifying certain amounts that are necessary for GAAP and the related GAAP to non-GAAP reconciliation, including adjustments, that could be made for currency exchange rate fluctuations and other charges reflected in the Company’s reconciliation of historic numbers, the amount of which, based on historical experience, could be significant.
Discontinued operations: Refer to Note 2 to Q3 2019 Form 10-Q and Appendix B for discontinued operation disclosures. Unless otherwise specified, the results of DNI for fiscal 2019 are excluded from analysis included in this presentation.
Defined Terms
3

Performance Summary Company highlights include:
• Progress made to achieved break-even of South African operations by the end of Q4 2019
• Continued deleveraging of balance sheet – early-settled long-term debt on May 3, 2019
• Commenced corporate actions with a reduction in DNI interest from 55% to 30%, and issued a call option to sell the remaining 30% stake
Year to date Fiscal 2019 financial summary:
• Revenue of $310 million (including DNI)
• Fundamental loss per share of $1.48, which includes contribution from DNI, includes a $1.41 of non-cash adjustments including a $0.40 allowance for doubtful loans receivable, $0.61 Cell C fair value loss adjustment and $0.05 Cedar Cellular note impairment loss
Third Quarter Fiscal 2019 financial summary:
• Revenue of $86 million (including DNI)
• Fundamental loss per share of $0.62, which includes contribution from DNI, $0.61 of non-cash adjustments including $0.40 Cell C fair value loss adjustment, $0.09 loss on DNI disposal, $0.07 impairment loss and $0.05 Cedar Cell note impairment loss
Investment Portfolio performance:
• Cell C had a difficult second half of 2018 causing fair value adjustment
• OneFi and MobiKwik trading towards achieving break-even in next fiscal year
• Finbond results for the year ended Feb 2019 expected late May 2019
4

FINANCIAL HIGHLIGHTS Third Quarter 2019
Q3 2019 Financial Report
6
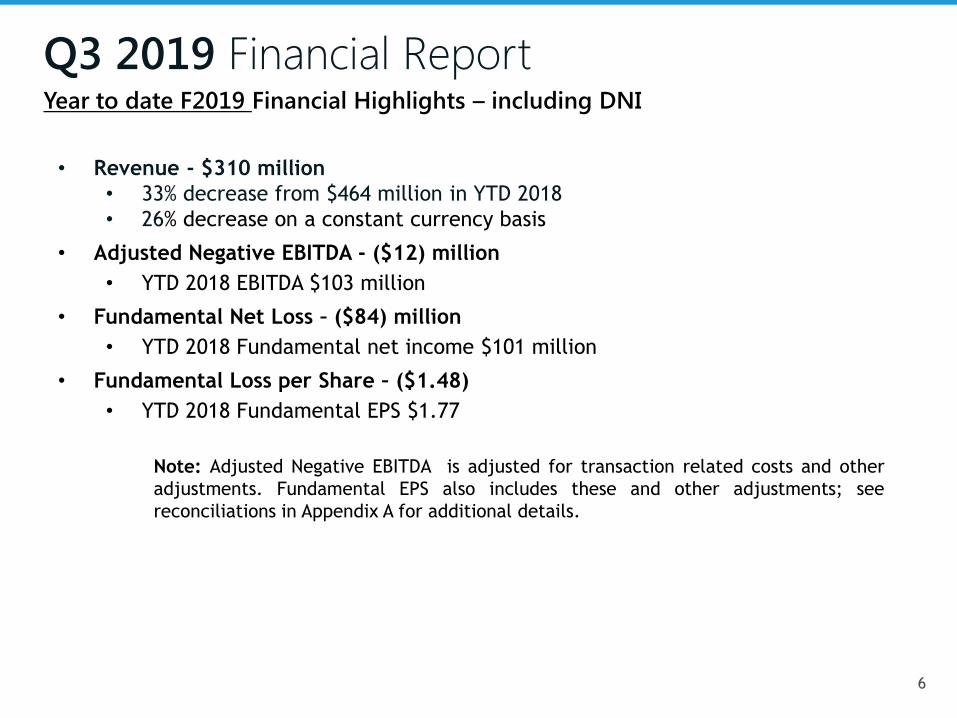
Year to date F2019 Financial Highlights – including DNI
• Revenue - $310 million
• 33% decrease from $464 million in YTD 2018
• 26% decrease on a constant currency basis
• Adjusted Negative EBITDA - ($12) million
• YTD 2018 EBITDA $103 million
• Fundamental Net Loss – ($84) million
• YTD 2018 Fundamental net income $101 million
• Fundamental Loss per Share – ($1.48)
• YTD 2018 Fundamental EPS $1.77
Note: Adjusted Negative EBITDA is adjusted for transaction related costs and other
adjustments. Fundamental EPS also includes these and other adjustments; see
reconciliations in Appendix A for additional details.

Q3 2019 Financial Report
7
Q3 2019 Financial Highlights – including DNI
• Revenue - $86 million
• 47% decrease from $163 million in Q3 2018
• 37% decrease on a constant currency basis
• Adjusted Negative EBITDA - ($1) million
• Q3 2018 EBITDA $34 million
• Fundamental Net loss – ($35) million
• Q3 2018 Fundamental net income $54 million
• Fundamental Loss per share – ($0.62)
• Q3 2018 FEPS $0.95
Note: Adjusted EBITDA is adjusted for transaction related costs and other adjustments.
Fundamental EPS also includes these and other adjustments; see reconciliations in
Appendix A for additional details.

-
100
200
300
400
500
600
700
800
2017 2018 2019
R 752 R 712
R 267
ZA
R M
illions
Q3 constant currency FIAT Revenue
Q3 2019 Financial Report Business Segment Results – Third quarter – excluding DNI
• SATP constant currency revenue declined 72%
• Expiration of SASSA contract and impact of
auto-migration of EPE customers
• ITP USD revenue declined 26%
• Lower contributions from IPG and South Korea,
including lower crypto-processing compared
with Q3 2018
• FIAT constant currency revenue declined 63%
• Impact of auto-migration of EPE customers in
value added and financial services
-
200
400
600
800
1,000
2017 2018 2019
R 846 R 878
R 246
ZA
R M
illions
Q3 constant currency SATP Revenue
-
10
20
30
40
50
60
2017 2018 2019
$ 42 $ 46
$ 34
USD
Millions
Q3 USD ITP Revenue
(26%)
4%
(72%)
11%
(5%)
(63%)
8

Q3 2019 Financial Report Business Segment Results – year to date – excluding DNI
USD
(Millions)
Revenue Operating
(Loss) Income
Operating Margin
F2019 F2018 F2019 F2018 F2019 F2018
SATP
% Change*
$ 77
(62%)
$ 204
($ 28)
nm
$ 39
(37%) 19%
ITP
% Change*
112
(18%)
136 1
nm
(15)
1% (11%)
FIAT
% Change*
72
(57%)
168
(28)
nm
42
(39%) 25%
Sub-total
% Change*
261
(43%)
509
(56)
nm
66
(21%) 13%
Inter-segment
Eliminations
% Change*
(8)
(82%)
(45)
(19)
17%
(17)
nm nm
Total
% Change*
$ 253
(45%)
$ 464 ($ 76)
nm
$ 49
(30%) 11%
9 *% change in constant currency

Q3 2019 Financial Report Business Segment Results – Third quarter – excluding DNI
USD
(Millions)
Revenue Operating
(Loss) Income
Operating Margin
Q3 2019 Q3 2018 Q3 2019 Q3 2018 Q3 2019 Q3 2018
SATP
% Change*
$ 17
(72%)
$ 74
($ 13)
nm
$ 13
(75%) 17%
ITP
% Change*
34
(12%)
46
2
nm
(15)
6% (32%)
FIAT
% Change*
19
(63%)
60
(5)
nm
15
6% (32%)
Sub-total
% Change*
71
(67%)
179
(16)
nm
13
(23%) 7%
Inter-segment
Eliminations
% Change*
(2)
nm
(17)
(6)
45%
(5)
nm nm
Total
% Change*
$ 69
(50%)
$ 163 ($ 22)
nm
$ 8
(25%) 5%
10 *% change in constant currency

11
Q3 2019 Financial Report 2019 Revenue Analysis – Key contributors

Q3 2019 Financial Report Balance Sheet Overview
USD (Millions) Mar 31, 2019 Jun 30, 2018
Net Unrestricted Cash $ 40 $ 90
Investments and Equity Accounted Investments(1) $ 323 $ 299
Total Assets $ 840 $ 1,219
Total Equity $ 501 $ 738
Total Long-Term Debt(2) $ 16 $ 50
Book Value / Share $ 8.81 $ 13.03
Net Cash / Share $ 0.42 $ 0.70
Debt / Equity 0.03 0.07
12
(1) March 31, 2019 includes 38% interest in DNI with a carrying value of $74 million
(2) March 31, 2019 debt settled in full on May 3, 2019, using $15 million in proceeds from sale of 8% of DNI and utilization of
$1 million in cash

13
% held Balance Sheet Value
(Mar 2019)
Equity Accounted:
Bank Frick 35% $46 million >$46 million (1)
Finbond (JSE listed) 29% 46 million $87 million (2)
OneFi 25% $8 million $25 - $35 million (3)
DNI 38% $74 million $74 million (4)
Investments:
Cell C 15% $122 million $122 million
MobiKwik 12% $27 million $35 million (5)
TOTAL $323 million >$389 million (6)
1) Based on carrying value
2) Mar 29, 2019 value - 268m shares at R4.69 at $1/R14.48
3) Based on peer analysis of other neobanks
4) % of DNI sold for $14.8 million on May 3, 2019. Remaining 30% subject to an option to dispose for
$59.3 million
5) 12% of $290m (MobiKwik valuation at Bajaj investment)
6) Compared with Net1 market cap of $213 million (56.7M shares x $3.75)
Values at carrying value unless stated otherwise
Q3 2019 Financial Report Key Investments

BUSINESS OVERVIEW SOUTH AFRICAN TRANSACTION PROCESSING
Third Quarter 2019
SATP Segment Highlights
15
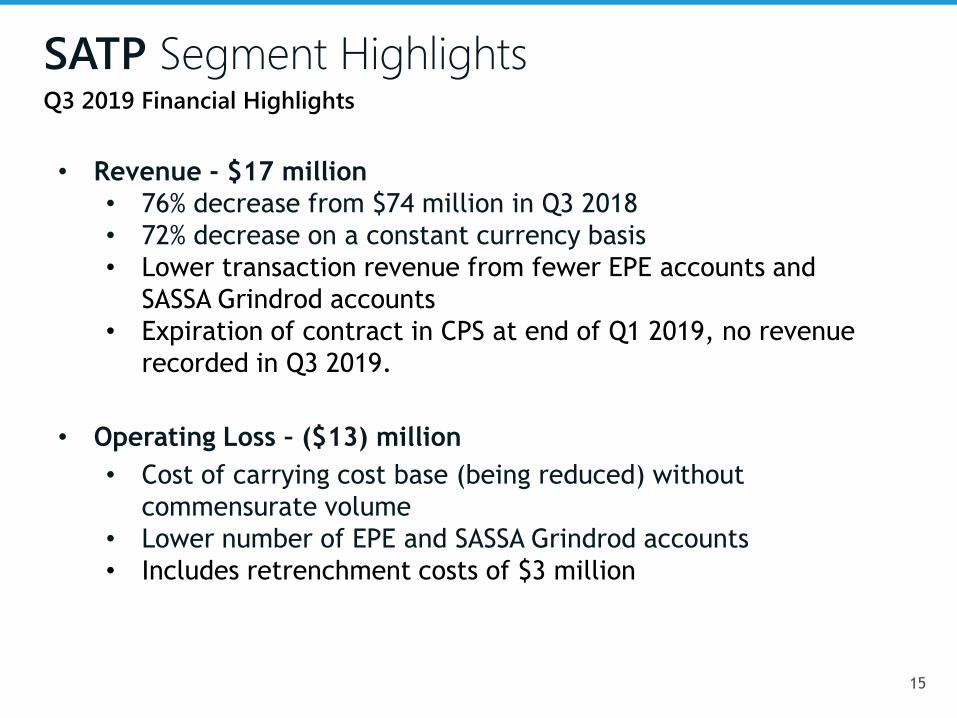
Q3 2019 Financial Highlights
• Revenue - $17 million
• 76% decrease from $74 million in Q3 2018
• 72% decrease on a constant currency basis
• Lower transaction revenue from fewer EPE accounts and
SASSA Grindrod accounts
• Expiration of contract in CPS at end of Q1 2019, no revenue
recorded in Q3 2019.
• Operating Loss – ($13) million
• Cost of carrying cost base (being reduced) without
commensurate volume
• Lower number of EPE and SASSA Grindrod accounts
• Includes retrenchment costs of $3 million
BUSINESS OVERVIEW INTERNATIONAL TRANSACTION PROCESSING
Third Quarter 2019

ITP Segment Highlights
17
Q3 2019 Financial Highlights
• Revenue - $34 million
• 26% decrease compared to $46 million in Q3 2018
• Lower transaction values and volume in South Korea
• Contraction in IPG processing activities particularly China
processing and crypto-currency transactions
• Operating income – $2 million
• Q3 2018 includes $20 million goodwill impairment related to
IPG
• Excluding non-recurring charges, ITP operating income and
margin improved in Q3 2019 compared to Q3 2018, driven by
improved contribution from KSNET

ITP Segment Highlights Q3 2019 Key Trends
• South Korea and Rest of the World (ROW) Growth • South Korea revenue down 13% in KRW compared to Q3 2018 due to
lower transaction values and volumes
• ROW revenue impacted by contraction in IPG processing activities
18
-
10
20
30
40
50
Q1 2017
Q2 2017
Q3 2017
Q4 2017
Q1 2018
Q2 2018
Q3 2018
Q4 2018
Q1 2019
Q2 2019
Q3 2019
Revenue KRW Billions
-
1
2
3
4
5
6
7
8
9
Q1 2017
Q2 2017
Q3 2017
Q4 2017
Q1 2018
Q2 2018
Q3 2018
Q4 2018
Q1 2019
Q2 2019
Q3 2019
Revenue ROW (excl Korea) - USD Millions

IPG Consolidation and Expansion
19
Q3 2019 PROGRESS UPDATES:
• Consolidation of various business units largely
complete with appropriate management structure
• China processing volumes largely dried up
• Focus on growing processing volumes
0
20
40
60
80
100
120
Card Processing Volume ($Mil)
0
2
4
6
8
10
12
14
16
SEPA Processing Volume ($Mil)
0 2 4 6 8
10 12 14 16 18 20
China Processing Volume ($Mil)
IPG PLAYS AN INTEGRAL ROLE IN PROVIDING END-TO-END SOLUTIONS FOR ISSUING, ACQUIRING
AND PROCESSING GLOBALLY.

BUSINESS OVERVIEW FINANCIAL INCLUSION & APPLIED TECHNOLOGIES
Third Quarter 2019

FIAT Segment Highlights
21
Q3 2019 Financial Highlights
• Revenue - $19 million
• 68% decrease from $60 million in Q3 2018
• 63% decrease on a constant currency basis
• Operating Loss - $5 million
• Operating income $15 million in Q3 2018
• Q3 2019 Includes retrenchment costs of $1.6 million
• EPE Accounts
• Active accounts stabilized at 1.1 million through Q3 2019
• MoneyLine
• Stability of loan book and bad debts reverting to historical
averages

FIAT Segment Highlights
22
Q3 2019 Key Trends
# of EPE Accounts Receiving Grants Value of Loans Outstanding
Number of Billed SmartLife Policies
0.0
0.5
1.0
1.5
2.0
Q3FY19 Q2FY19 Q1FY19 Q4FY18 Q3FY18 Q2FY18 Q1FY18
Mill
ion
s
As of quarter ended
0
200
400
600
800
1,000
1,200
1,400
Mill
ion
s
Outstanding Capital Deferred Service Fees
0
100,000
200,000
300,000
400,000
500,000

Investment’s Highlights
23

Appendix A

Reconciliation of non-GAAP measures
25
Third quarter – Fundamental Net (Loss) Income and Negative EBITDA
$ '000 EPS, basic $ '000 EPS, basic
Fundamental net (loss) income (Non-GAAP) (34,951) (0.62) 53,759 0.95
Impairment loss (5,305) (19,865)
Loss on disposal of DNI (5,140) -
Amortisation of intangible assets, net of tax (4,380) (2,268)
Retrenchment costs, net of tax (3,270) -
Accreted interest on DNI contingent consideration (1,012) -
Amortization, net related to non-controlling interest 918 -
Transaction costs (873) (110)
Stock-based charge(2) (578) (575)
Amortisation of intangible assets, net of tax - equity accounted investments (142) (431)
Facility fee (51) (120)
Refund of Korean indirect taxes - 1,985
Net (loss) income attributable to net1 (GAAP) (54,784) (0.96) 32,375 0.57
Change in fair value of equity securities 26,263 (37,843)
Loss on disposal of DNI 5,140
Non-controlling interest (728) 302
Earnings from equity-accounted investments 464 (3,960)
Interest income 959 (5,154)
Interest expense 3,493 2,426
Income tax expense (2,490) 19,418
Impairment loss 5,305 19,865
Depreciation and amortization 9,881 9,341
(Negative) EBITDA (Non-GAAP) (6,497) 36,770
Adjusted for:
Transaction costs 4,542 110
Refund of Korean indirect taxes - (2,545)
Adjusted (Negative) EBITDA (Non-GAAP) (1,082) 34,335
Three months ended
Mar-19 Mar-18

Reconciliation of non-GAAP measures
26
Year to date – Fundamental Net (Loss) Income
$ '000 EPS, basic $ '000 EPS, basic
Fundamental net income (Non-GAAP) (83,781) (1.48) 100,656 1.77
Impairment loss (13,502) (19,865)
Loss on disposal of DNI (5,140) -
Amortisation of intangible assets, net of tax (13,496) (6,644)
Retrenchment costs, net of tax (3,775) -
Accreted interest on DNI contingent consideration (1,848) -
Amortization, net related to non-controlling interest 2,737 -
Transaction costs (2,723) (2,050)
Stock-based charge(2) (1,763) (2,010)
Amortisation of intangible assets, net of tax - equity accounted investments (427) (1,925)
Facility fee (206) (467)
Non-recurring Mastertrading allowance for doubtful accounts - (7,803)
Refund of Korean indirect taxes - 1,985
Change in US tax rate - (860)
Profit on sale of Xeo - 463
Net income attributable to net1 (GAAP) (123,924) (2.18) 61,480 1.08
Nine months ended
Mar-19 Mar-18

Reconciliation of non-GAAP measures
27
Year to date –Negative EBITDA
$ '000 EPS, basic $ '000 EPS, basic
Net income attributable to net1 (GAAP) (123,924) (2.18) 61,480 1.08
Change in fair value of equity securities 42,099 (37,843)
Loss on disposal of DNI 5,140 -
Non-controlling interest 2,339 903
Earnings from equity-accounted investments 338 (7,389)
Interest income (586) (14,903)
Interest expense 9,030 6,872
Income tax expense 1,702 39,757
Impairment loss 13,496 19,865
Depreciation and amortization 30,528 27,030
EBITDA (Non-GAAP) (19,838) 95,772
Adjusted for:
Retrenchment costs 5,243 2,207
Transaction costs 2,723 (2,545)
Non-recurring Mastertrading allowance for doubtful accounts - 7,803
Profit on sale of Xeo - (463)
Adjusted EBITDA (Non-GAAP) (11,872) 102,774
Nine months ended
Mar-19 Mar-18

Appendix B

Reconciliation of non-GAAP measures
29
Third quarter –Negative EBITDA (continuing and discontinued operations)
Three months ended March 31, 2019: Continuing Discontinued Total
Operating income (GAAP) (22,355) 672 (21,683)
Depreciation and amortization 7,454 2,427 9,881
Impairment loss - 5,305 5,305
(Negative) EBITDA (Non-GAAP) (14,901) 8,404 (6,497)
Adjusted for:
Retrenchment costs 4,542 4,542
Transaction costs 873 873
Adjusted (Negative) EBITDA (Non-GAAP) (9,486) 8,404 (1,082)
Nine months ended March 31, 2019: Continuing Discontinued Total
Operating income (GAAP) (75,543) 11,681 (63,862)
Depreciation and amortization 22,502 8,026 30,528
Impairment loss 8,191 5,305 13,496
(Negative) EBITDA (Non-GAAP) (44,850) 25,012 (19,838)
Adjusted for:
Retrenchment costs 5,243 5,243
Transaction costs 2,723 2,723
Adjusted (Negative) EBITDA (Non-GAAP) (36,884) 25,012 (11,872)