q3fy19 earnings announcement - lenovo · this presentation contains “forward-looking...
TRANSCRIPT

Q3FY19 Earnings Announcement
2019 Lenovo Internal. All rights reserved.
Feb 20, 2019 – Raleigh, USAFeb 21, 2019 – Hong Kong

Forward Looking Statement
This presentation contains “forward-looking statements” which are statements that refer to expectations and plans for the future and include, without limitation, statements regarding Lenovo’s future results of operations, financial condition or business prospects as well as other statements based on projections, estimates and assumptions. In some cases, these statements can be identified by terms such as "expect," "intend," "plan," "believe," "estimate," "may," "will," "should" and comparable words (including the negative of such words). These forward-looking statements, reflect the current expectations and plans of the directors and management of Lenovo, which may not materialize or may change. Many risks, uncertainties and other factors, some of which are unpredictable and beyond Lenovo’s control, could affect the matters discussed in these forward-looking statements. These factors include, without limitation, economic and business conditions globally and in the countries where we operate, Lenovo’s ability to predict and respond quickly to market developments, consumer demand, pricing trends and competition; changes in applicable laws and regulations (including applicable tax and tariff rates). Any variance from the expectations or plans on which these forward-looking statements are based could cause Lenovo’s actual results or actions to differ materially from those expressed or implied in these statements. These forward-looking statements are not guarantees of future performance and you are cautioned not to place undue reliance on these statements. Lenovo undertakes no obligation to update any forward-looking statements in this presentation, whether as a result of new information or any subsequent change, development or event. All forward-looking statements in this presentation are qualified by reference to this paragraph.
2019 Lenovo Internal. All rights reserved. 2

Yuanqing YangChairman & CEO
2019 Lenovo Internal. All rights reserved.
MBG PTI%
12.94
14.04
320
150
350
233
Q41415
Q11516
Q21516
Q31516
Q41516
Q11617
Q21617
Q31617
Q41617
Q11718
Q21718
Q31718
Q41718
Q11819
Q21819
Q31819
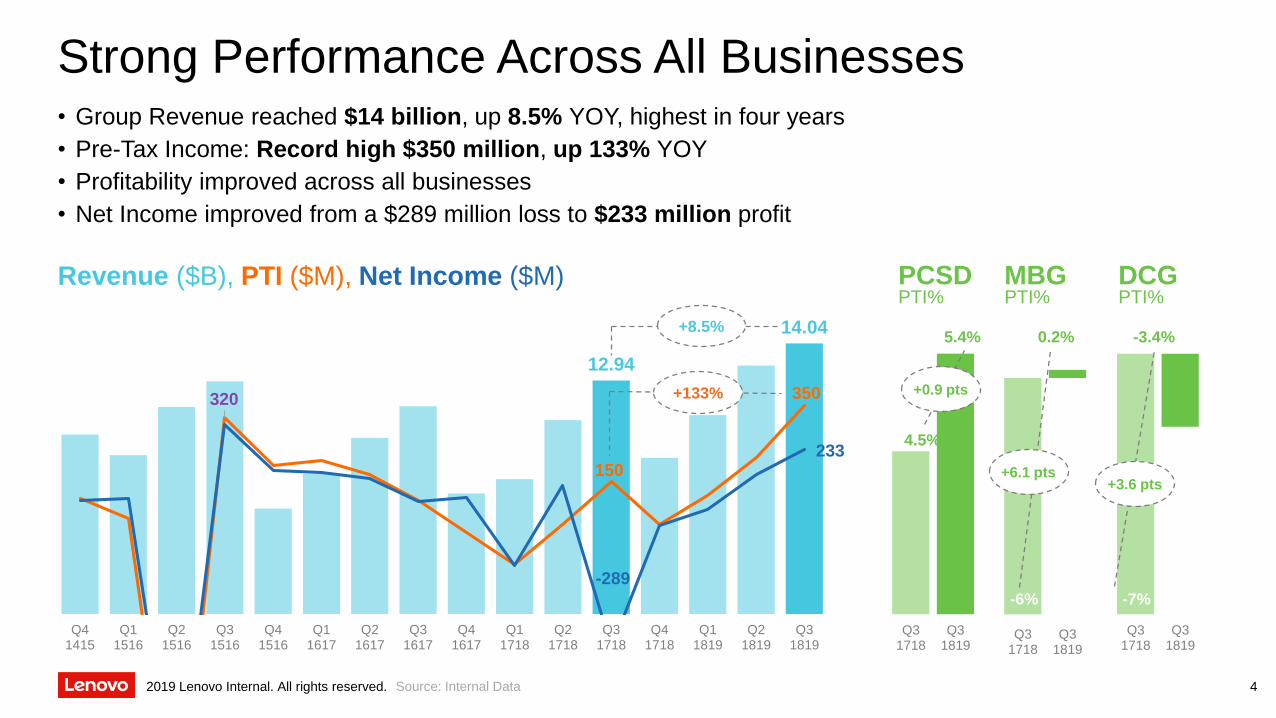
Strong Performance Across All Businesses• Group Revenue reached $14 billion, up 8.5% YOY, highest in four years
• Pre-Tax Income: Record high $350 million, up 133% YOY
• Profitability improved across all businesses
• Net Income improved from a $289 million loss to $233 million profit
Revenue ($B), PTI ($M), Net Income ($M)
Source: Internal Data
+133%
Q31718
Q31819
Q31718
Q31819
Q31718
Q31819
PCSD PTI%
+0.9 pts
+6.1 pts+3.6 pts
5.4% 0.2% -3.4%
4.5%
-6% -7%
DCG PTI%
+8.5%
-289
2019 Lenovo Internal. All rights reserved. 4

IDG: PC & PCD (PC+Tablet)
• Record revenue and profit for PC
• PC revenue grew by 16%, 17-point
premium to market YOY
• PC PTI margin improved by 1 point YOY
• Remain Undisputed #1 in PC and PCD– PC record market share of 24.6%
– PCD market share 17%
5Source: IDC, Internal Data
Global PC Top 3 Market Share(%)24.6 23.6
16.5
Q3FY1617
Q4FY1617
Q1FY1718
Q2FY1718
Q3FY1718
Q4FY1718
Q1FY1819
Q2FY1819
Q3FY1819
Lenovo HP Dell
0
100
200
300
400
500
600
700
800
-1000
1000
3000
5000
7000
9000
11000
Q31415
Q41415
Q11516
Q21516
Q31516
Q41516
Q11617
Q21617
Q31617
Q41617
Q11718
Q21718
Q31718
Q41718
Q11819
Q21819
Q31819
PC Revenue ($M) & PTI ($M)
Global PCD Top 3 Market Share (%)
17.1
16.0
14.5
Q3FY1617
Q4FY1617
Q1FY1718
Q2FY1718
Q3FY1718
Q4FY1718
Q1FY1819
Q2FY1819
Q3FY1819
Lenovo Apple HP
RecordHigh
2019 Lenovo Internal. All rights reserved.

• Focus on high-growth and premium segments, revenue outgrew the market in
– Workstations, Thin & Light, Visuals by over 30 points
– Gaming by 16 points
– Chromebook by 220+ points
IDG: PC & PCD
(PC+Tablet)
62019 Lenovo Internal. All rights reserved. Source: Industry Data & Internal Data
Segment Revenue YoY Growth vs Market
Market Lenovo
Market Lenovo Market Lenovo
-0.6%
-5.1%
Visuals
27.7%
15.3%
257%
35.7%
Gaming Chromebook
Market Lenovo Market Lenovo
8.9%
23.2%
43.4% 57.8%
Workstation Thin & Light
+34.4pts
+32.8pts
+15.9pts
+221.3pts
+34.6pts

IDG: PCSD
(PC, Tablet & Smart Devices)
• Outside China: Revenue grew faster and improved profitability
• In China: Maintained revenue & profitability
Source: Internal Data
6,564
7,660
Q3 1718 Q3 1819
PCSD Revenue
YoY Growth
Outside China ($M)
+16.7%
PCSD PTI Margin
YoY Growth
Outside China (%)
2.5%
4.1%
Q3 1718 Q3 1819
+1.7 pts
2019 Lenovo Internal. All rights reserved. 7

• Confident in continuing to outgrow the market
– Invest in high-growth segments
– Focus on customer centricity
– Drive the convergence of computing, communication and intelligent technologies
IDG: PC & PCD Outlook
82019 Lenovo Internal. All rights reserved.
Yoga S940
2019 Lenovo Internal. All rights reserved.

IDG: Mobile
• Breakthrough – Profitable worldwide1st time since Motorola acquisition
• Results from strong execution of strategy Expense reduction
Simplified product portfolio
Focus on selected markets:
- Latin America: Maintained profitability and #2
- North America: Volume outgrew market by 40+ points, profit improved $90 million+ YOY
- China: Quadrupled revenue YOY
Innovation: Moto Z3 and 5G Mod announced as Verizon’s first 5G solution
Source: IDC, Internal Data
29.8
-11
Q3 FY1718 Q4 FY1718 Q1 FY1819 Q2 FY1819 Q3 FY1819
Lenovo
Market
North America Mobile Volume YTY Growth (%)
16.4
Q3 FY1718 Q4 FY1718 Q1 FY1819 Q2 FY1819 Q3 FY1819
Lenovo Samsung Huawei Apple LG
Latin America Mobile Market Share (%)
Q3 FY1718 Q4 FY1718 Q1 FY1819 Q2 FY1819 Q3 FY1819
Lenovo
Market
-13
China Mobile Revenue YTY Growth (%)
309.6
2019 Lenovo Internal. All rights reserved. 9

• Resume profitable growth
• Continue to innovate and execute current strategy
IDG: Mobile Outlook
102019 Lenovo Internal. All rights reserved.
Moto G7

Data Center
• Revenue: Strong double-digit YoY growth
• Profitability: Improved for 5th
consecutive quarter YOY
• Triple-digit growth of Hyperscale driven by majority of new projects now designed, manufactured in house
• Software Defined revenue grew ~70% YOY
• Remained #1 in Top 500 supercomputer rankings
11Source: Internal Data
DCG Revenue and PTI Margin
1,225 1,223
1,6291,544
1,600
-7.0%
-5.2%
-3.9% -3.9%-3.4%
Q3 FY1718 Q4 FY1718 Q1 FY1819 Q2 FY1819 Q3 FY1819
Revenue ($M) PTI Margin (%)
+31%
266.3
68.2
Q3 FY1718 Q4 FY1718 Q1 FY1819 Q2 FY1819 Q3 FY1819
Hyperscale SDI
DCG Segments Revenue Growth YOY(%)
2019 Lenovo Internal. All rights reserved.

Will continue to:
• Invest in technology leadership
• Building end-to-end product portfolio
• Joint venture with NetApp in China expands our business
• Develop capabilities in Software Defined with aim to lead
Data Center Outlook
122019 Lenovo Internal. All rights reserved.

Driving Intelligent
Transformation
• Driving Smart IoT, Smart Infrastructure, and Smart Vertical Solutions
• Smart IoT at CES
– Making traditional devices smarter
– Developing new smart devices
• Drive Smart Infrastructure by DCG
• Big Data & Verticals revenue grew ~70% YOY
• Software & Services reached $638 million
13
Lenovo
Smart
Clock
Lenovo Smart ManufacturingSource: Internal Data 2019 Lenovo Internal. All rights reserved.

Once we reachone peak, we aim at an even higher one.We never give up.
2019 Lenovo Internal. All rights reserved. 14
Wong Wai MingChief Financial Officer
2019 Lenovo Internal. All rights reserved.

150
37
113
213
350
0
50
100
150
200
250
300
350
400
Q3FY2017/18
Q4FY2017/18
Q1FY2018/19
Q2FY2018/19
Q3FY2018/19
Pre-Tax Income
Financial Highlights
16
Q3 Highlights
Record high revenue in constant currency;
6th consecutive quarter of YTY growth
Record high reported PTI, more than
doubled YTY; consistent YTY
improvement for 5 consecutive quarters
Gross profit margin improved to 14.6%,
highest in 10 quarters
2
1
US$ Million
3
1
2
3
12,939
10,638
11,913
13,38014,035
7,000
11,000
15,000
Q3FY2017/18
Q4FY2017/18
Q1FY2018/19
Q2FY2018/19
Q3FY2018/19
Revenue
Revenue
US$ Million
+US$200M
13.5%
14.5%
13.7%
13.4%
14.6%
-0.6
-0.4
-0.2
0.0
0.2
0.4
0.6
0.8
1.0
1.2
13%
13%
14%
14%
15%
15%
Q3FY2017/18
Q4FY2017/18
Q1FY2018/19
Q2FY2018/19
Q3FY2018/19
Gross Margin and YTY pts changes
Gross Margin GPM YTY pts2019 Lenovo Internal. All rights reserved.

17
Cash and Working Capital
211
-753
33667
1548
-800
-300
200
700
1,200
1,700
Q3 FY2017/18 Q4 FY2017/18 Q1 FY2018/19 Q2 FY2018/19 Q3 FY2018/19
Net cash generated from/(used in) operating activities
1
1,7471,932
2,689
2,325
3,508
1,000
1,500
2,000
2,500
3,000
3,500
4,000
4,500
Q3 FY2017/18 Q4 FY2017/18 Q1 FY2018/19 Q2 FY2018/19 Q3 FY2018/19
Bank Deposits and Cash
3,9833,792
4,1254,281
3,792
32
4240
36 35
20
25
30
35
40
45
50
1,000
1,500
2,000
2,500
3,000
3,500
4,000
4,500
Q3 FY2017/18 Q4 FY2017/18 Q1 FY2018/19 Q2 FY2018/19 Q3 FY2018/19
Inventory and Days of Inventory*
Inventory Days Inventory
2
US$ Million
US$ Million
*Days of Inventory is calculated in three months average.
Q3 Highlights
Improvement in working capital
management; Better terms of account
payable
Inventory reduction in both finished goods
and parts2
1
US$ Million Day
2019 Lenovo Internal. All rights reserved.

11,713
9,41510,284
11,83612,436
0
3,000
6,000
9,000
12,000
15,000
Q3 FY2017/18 Q4 FY2017/18 Q1 FY2018/19 Q2 FY2018/19 Q3 FY2018/19
Revenue
Revenue
Intelligent Devices Business Group (IDG)*
Q3 Highlights
1. Robust revenue growth driven by strong PC performance
2. PTI improved YTY for 5 consecutive quarters, driven by consistent profitability expansion.
306248
328
466
586
2.6% 2.6%3.2%
3.9%
4.7%
0.0%
1.0%
2.0%
3.0%
4.0%
5.0%
6.0%
7.0%
8.0%
0
100
200
300
400
500
600
700
Q3 FY2017/18 Q4 FY2017/18 Q1 FY2018/19 Q2 FY2018/19 Q3 FY2018/19
Pretax Income and Margin
Pre-tax Income Pretax Income Margin
US$ Million
US$ Million
18
1
2
1
2
• IDG mainly consists of PC & Smart Device (PCSD) and Mobile Business Group (MBG) businesses.
• In fiscal quarter two, Others segment including consumer electronic related businesses was reclassified to PCSD retrospectively to align with the corporate strategy.2019 Lenovo Internal. All rights reserved.

9,618
8,0608,619
10,23510,729
0
2,000
4,000
6,000
8,000
10,000
12,000
Q3 FY2017/18 Q4 FY2017/18 Q1 FY2018/19 Q2 FY2018/19 Q3 FY2018/19
Revenue
Revenue
IDG - PC & Smart Device Business Group (PCSD)
Q3 Highlights
1. Record high revenue; reinforced market leadership in premium & high-growth segments
1. Double-digit revenue growth for 4th
consecutive quarter; premium to market revenue growth of 12 pts YTY
2. Another PTI margin expansion to 5.4% due to favorable mix shift and higher services attach rate
1. Services and Solutions business continued to gain traction; strong momentum in Device as a Service
430389
425
515
584
4.5%4.8% 4.9% 5.0%
5.4%
3.0%
4.0%
5.0%
6.0%
7.0%
8.0%
-50
50
150
250
350
450
550
650
Q3FY2017/18
Q4FY2017/18
Q1FY2018/19
Q2FY2018/19
Q3FY2018/19
Pretax Income and Margin
Pre-tax Income Pretax Income Margin
US$ Million
US$ Million
19
2
1
3
4
2
3
In fiscal quarter two, Others segment like those consumer electronic related businesses was reclassified to PCSD retrospectively to align with the corporate strategy.
2019 Lenovo Internal. All rights reserved.

IDG - Mobile Business Group (MBG)
Q3 Highlights
1. PTI profit for the first time since acquisition, a result of strong execution in focused markets, streamlined portfolio and cost control
2. Focus on core markets: NA continued to show solid momentum; LA continued profitable with solid market position
3. Efficient cost structure and improved PTI margin thanks to well executed expense reduction
4. Streamlined product portfolio to reduce complexity and help to expand scale in the mainstream segments, i.e. Moto Z, G & E
-124-142
-97
-49
3
-6.0%
-10.6%
-5.9%
-3.1%
0.2%
-12.0%
-10.0%
-8.0%
-6.0%
-4.0%
-2.0%
0.0%
2.0%
-160-140-120-100-80-60-40-20
020
Q3 FY2017/18 Q4 FY2017/18 Q1 FY2018/19 Q2 FY2018/19 Q3 FY2018/19
Pretax Profit / Loss and Margin
Pre-tax Profit / Loss Pre-tax Profit / Loss Margin
1
2,076
1,342
1,646 1,601 1,669
0
500
1,000
1,500
2,000
2,500
Q3 FY2017/18 Q4 FY2017/18 Q1 FY2018/19 Q2 FY2018/19 Q3 FY2018/19
Revenue
Revenue
US$ Million
US$ Million
20
2
1
3
4
2
3
2019 Lenovo Internal. All rights reserved.

Q3 Highlights
1. 5th consecutive quarter of strong double-digit YTY revenue growth, driven by Software Defined Infrastructure and Hyperscale segments
2. 5 consecutive quarters of YTY PTI margin improvement
3. Strong growth in fast-growing segments:
Lenovo was the fastest growing out of the tier 1 vendors in the Hyperconverged System
HPC grew double-digits YTY, and maintained WW # 1
Flash Array shipments grew triple-digits for 4 consecutive quarters
Data Center Business Group (DCG)
-86
-64 -63 -60 -55
-7.0%
-5.2%
-3.9% -3.9%-3.4%
-8.0%
-7.0%
-6.0%
-5.0%
-4.0%
-3.0%
-2.0%
-1.0%
0.0%
-150
-130
-110
-90
-70
-50
-30
-10
10Q3 FY2017/18 Q4 FY2017/18 Q1 FY2018/19 Q2 FY2018/19 Q3 FY2018/19
Pretax Loss and Margin
Pre-tax Loss Pre-tax Loss Margin
1,225 1,223
1,6291,544 1,600
0
500
1,000
1,500
Q3 FY2017/18 Q4 FY2017/18 Q1 FY2018/19 Q2 FY2018/19 Q3 FY2018/19
Revenue
Revenue
US$ Million
US$ Million
21
2
1
3
1
2
2019 Lenovo Internal. All rights reserved.

Outlook
22
• IDG: To deliver premium-to-market growth with strong profitability while building smart devices capabilities
• PCSD: Continue to drive premium to market revenue growth while maintain industry-leading profitability
• MBG: Leverage competitive cost structure and investing in innovation to resume revenue growth in key strategic markets while sustaining profitability
• DCG: To drive premium-to-market and sustainable healthy growth
• Strengthen total solution capabilities (i.e. strengthen storage portfolio, drive more Services, etc.)
• Continue to accelerate high-growth segments – Hyperscale, SDI, AI/HPC, NFV and IoT solutions
• Optimize Hyperscale business model with in-house design and manufacturing
• Global strategic partnership with NetApp, including a JV in China
• Intelligent Transformation: To accelerate growth in Software and Service, Big Data, and Verticals
Solutions business with customer centric offerings
2019 Lenovo Internal. All rights reserved.

Appendix
23
- Financial Summary
- Condensed Consolidated Income Statement- Condensed Consolidated Balance Sheet- Condensed Consolidated Cash Flow Statement
2019 Lenovo Internal. All rights reserved.

Financial Summary-As Reported
24
US$ Million Q3 FY2018/19 Q3 FY2017/18 Y/Y% Q2 FY2018/19
Revenue 14,035 12,939 8% 13,380
Gross Profit 2,050 1,751 17% 1,794
Operating Expenses (1,616) (1,547) 4% (1,504)
Operating Profit 434 204 112% 290
Other Non-Operating Expenses (84) (54) 55% (77)
Pre-tax Income 350 150 133% 213
Taxation (85) (425) (80%) (40)
Profit/(loss) for the period 265 (275) N/A 173
Non-controlling interests (32) (14) 125% (5)
Profit attributable to Equity Holders 233 (289) N/A 168
EPS (US cents)
- Basic 1.96 (2.53) N/A 1.41
- Diluted 1.92 (2.53) N/A 1.40
Dividend per share (HK cents) 6.00
Q3 FY2018/19 Q3 FY2017/18 Q2 FY2018/19
Gross margin 14.6% 13.5% 13.4%
E/R ratio 11.5% 12.0% 11.2%
Operating margin 3.1% 1.6% 2.2%
PTI margin 2.5% 1.2% 1.6%
Net margin attributable to Equity Holders 1.7% -2.2% 1.3%
2019 Lenovo Internal. All rights reserved.

25
Condensed Consolidated Income Statement US$ Million Q3 FY2018/19 Q3 FY2017/18
Revenue 14,035 12,939
Cost of sales (11,985) (11,188)
Gross profit 2,050 1,751
Selling and distribution expenses (702) (741)
Administrative expenses (616) (453)
Research and development expenses (273) (344)
Other operating expense - net (25) (9)
Operating profit 434 204
Finance income 6 7
Finance costs (86) (60)
Share of losses of associated companies and joint ventures (4) (1)
Profit/(loss) before taxation 350 150
Taxation (85) (425)
Profit/(loss) for the period 265 (275)
Profit/(Loss) attributable to:
Equity holders of the company 233 (289)
Perpetual securities holders 13 13
Other non-controlling interests 19 1
Earnings/(Loss) per share (US cents)
- Basic 1.96 (2.53)
- Diluted 1.92 (2.53)
2019 Lenovo Internal. All rights reserved.

26
Condensed Consolidated Balance Sheet
US$ Million As at As at
Dec 31, 2018 Sep 30, 2018
Non-current assets 12,799 12,560
Property, plant and equipment 1,411 1,232
Intangible assets 8,297 8,286
Others 3,091 3,042
Current assets 18,480 18,327
Bank deposits and cash 3,508 2,325
Trade, notes and other receivables 10,948 11,431
Inventories 3,792 4,281
Others 232 290
Current liabilities 22,784 22,592
Borrowings 2,641 2,640
Trade, notes, other payables, accruals and provisions 19,055 18,956
Others 1,088 996
Net current liabilities (4,304) (4,265)
Non-current liabilities 4,625 4,342
Total equity 3,870 3,953
2019 Lenovo Internal. All rights reserved.

2019 Lenovo Internal. All rights reserved. 27
Condensed Consolidated Cash Flow Statement
US$ Million Q3 FY2018/19 Q3 FY2017/18 Q2 FY2018/19
Net cash generated from operating activities 1,548 211 67
Net cash used in investing activities (217) (103) (103)
Net cash (used in)/generated from financing activities (165) 395 (318)
Increase/(Decrease) in cash and cash equivalents 1,166 503 (354)
Effect of foreign exchange rate changes 21 14 (46)
Cash and cash equivalents at the beginning of the period 2,213 1,144 2,613
Cash and cash equivalents at the end of the period 3,400 1,661 2,213
