q4 and full year fy2015 earnings - wordpress.com€¦ · q4 fy2015 highlights • net revenues of...
TRANSCRIPT
Q4 and Full Year FY2015 EARNINGS
IMPORTANT NOTICE
This presentation contains statements that contain “forward looking statements”including, but without limitation, statements relating to the implementation ofstrategic initiatives, and other statements relating to Dynamatic Technologies’(“Dynamatic” or “Company”) future business developments and economicperformance.
While these forward looking statements indicate our assessment and futureexpectations concerning the development of our business, a number ofrisks, uncertainties and other unknown factors could cause actual developments andresults to differ materially from our expectations.
These factors include, but are not limited to, general market, macro-economic, governmental and regulatory trends, movements in currency exchange andinterest rates, competitive pressures, technological developments, changes in thefinancial conditions of third parties dealing with us, legislative developments, andother key factors that could affect our business and financial performance.
Dynamatic Technologies undertakes no obligation to publicly revise any forwardlooking statements to reflect future / likely events or circumstances.
2
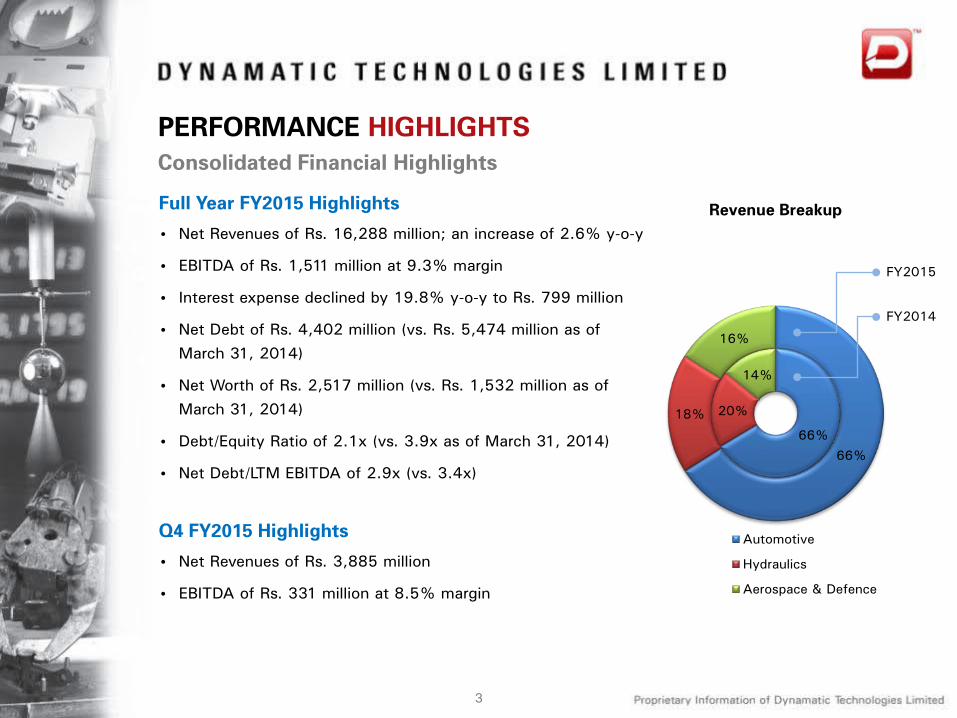
PERFORMANCE HIGHLIGHTSConsolidated Financial Highlights
Full Year FY2015 Highlights
• Net Revenues of Rs. 16,288 million; an increase of 2.6% y-o-y
• EBITDA of Rs. 1,511 million at 9.3% margin
• Interest expense declined by 19.8% y-o-y to Rs. 799 million
• Net Debt of Rs. 4,402 million (vs. Rs. 5,474 million as of March 31, 2014)
• Net Worth of Rs. 2,517 million (vs. Rs. 1,532 million as of March 31, 2014)
• Debt/Equity Ratio of 2.1x (vs. 3.9x as of March 31, 2014)
• Net Debt/LTM EBITDA of 2.9x (vs. 3.4x)
3
Q4 FY2015 Highlights
• Net Revenues of Rs. 3,885 million
• EBITDA of Rs. 331 million at 8.5% margin
66%
20%
14%
66%
18%
16%
Revenue Breakup
Automotive
Hydraulics
Aerospace & Defence
FY2015
FY2014

PERFORMANCE HIGHLIGHTS
4
Recent Corporate Developments
Credit rating upgrade:
• On April 30, 2015, Dynamatic announced that ICRA has upgraded the long term rating for theCompany’s line of credit to ICRA BBB+ and has reaffirmed the short term rating for the line ofcredit at ICRA A2. Further, ICRA has confirmed that the outlook on the long term rating isstable
Execution of aerospace segment orders:
• On February 18, 2015, the Company handed over the first set of aft pylon and cargo rampassemblies for Boeing’s CH-47F Chinook helicopter
• On February 19, 2015, the Company handed over the first ‘Made in India’ aft fuselageassembly and turn over bulkhead assembly to Bell Helicopter
Launch of pilot production facility for next generation unmanned aircraft systems (UAS):
• On February 17, 2015, Dynamatic and AeroVironment, Inc of the US inaugurated the pilotproduction facility for the development of the next generation unmanned aircraftsystem, Cheel. It is intended to be the next-generation small UAS for joint development andproduction under the DTTI (Defence Technology and Trade Initiative) program by DynamaticTechnologies and AeroVironment in India
PERFORMANCE HIGHLIGHTSManagement Commentary
Commenting on the results, Mr. Udayant Malhoutra, CEO and Managing Directorsaid:
“Last fiscal year has been a turnaround year for us. During the year, we took variousinitiatives to strengthen our financial position and made investments in creatingcapacities and improving our capabilities to be ‘future ready’. A stronger operatingplatform coupled with a enhanced balance sheet situation along with the improvingglobal business environment will put us in the next trajectory of growth.
Our Aerospace and Defense segment continued its robust performance whilstAutomotive segment demonstrated signs of recovery and Hydraulics continued tobe under pressure. In the Aerospace and Defense segment we won new orders andstarted making deliveries to Boeing and Bell Helicopters for their existing orders.Our current order book is robust at Rs. 60 billion which gives us the confidence ofsustained future growth. The outlook for the automotive segment is positive as theglobal auto sector continues to improve. Although Hydraulics segment has beenunder pressure but we have received new orders and expect this segment toperform better in the coming year.
We are quite pleased with the results of our various strategic initiatives over the pastcouple of years. Management team is ‘future ready’ and look forward to excitingtimes ahead.”
5
FINANCIAL PERFORMANCE SUMMARY
Rs. millionQ4 y-o-y
Growth(%)
Q3 q-o-q Growth
(%)
Full Year y-o-yGrowth
(%)FY15 FY14 FY15 FY15 FY14
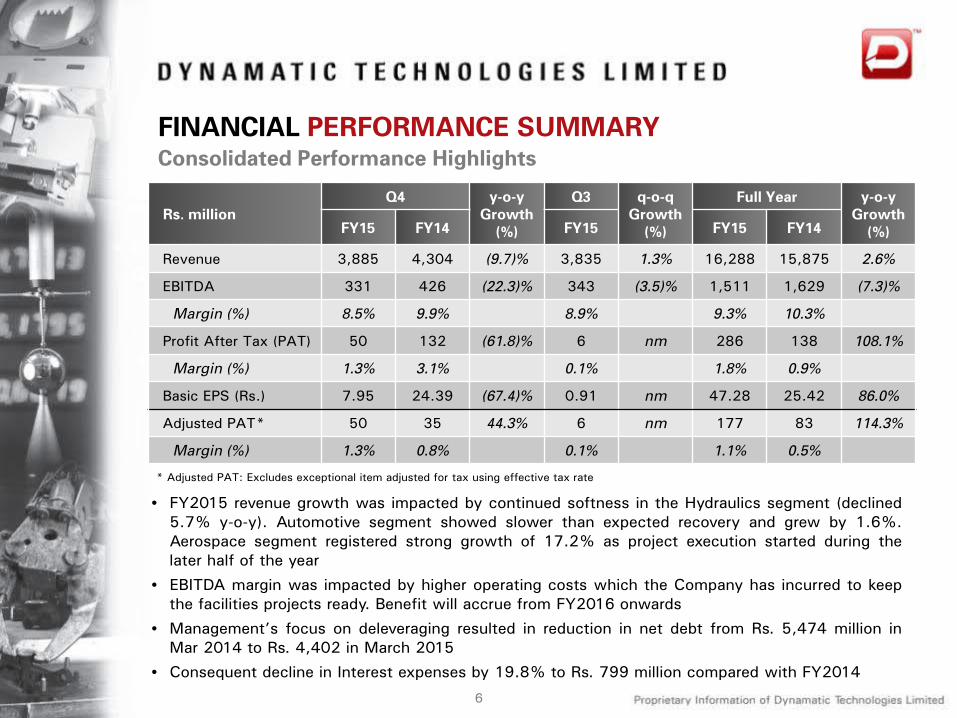
Revenue 3,885 4,304 (9.7)% 3,835 1.3% 16,288 15,875 2.6%
EBITDA 331 426 (22.3)% 343 (3.5)% 1,511 1,629 (7.3)%
Margin (%) 8.5% 9.9% 8.9% 9.3% 10.3%
Profit After Tax (PAT) 50 132 (61.8)% 6 nm 286 138 108.1%
Margin (%) 1.3% 3.1% 0.1% 1.8% 0.9%
Basic EPS (Rs.) 7.95 24.39 (67.4)% 0.91 nm 47.28 25.42 86.0%
Adjusted PAT* 50 35 44.3% 6 nm 177 83 114.3%
Margin (%) 1.3% 0.8% 0.1% 1.1% 0.5%
• FY2015 revenue growth was impacted by continued softness in the Hydraulics segment (declined5.7% y-o-y). Automotive segment showed slower than expected recovery and grew by 1.6%.Aerospace segment registered strong growth of 17.2% as project execution started during thelater half of the year
• EBITDA margin was impacted by higher operating costs which the Company has incurred to keepthe facilities projects ready. Benefit will accrue from FY2016 onwards
• Management’s focus on deleveraging resulted in reduction in net debt from Rs. 5,474 million inMar 2014 to Rs. 4,402 in March 2015
• Consequent decline in Interest expenses by 19.8% to Rs. 799 million compared with FY2014
Consolidated Performance Highlights
6
* Adjusted PAT: Excludes exceptional item adjusted for tax using effective tax rate
AEROSPACE AND DEFENCE SEGMENT
Rs. million
Q4 y-o-y growth
(%)
Q3 q-o-q growth
(%)
Full Year y-o-y growth
(%)FY15 FY14 FY15 FY15 FY14
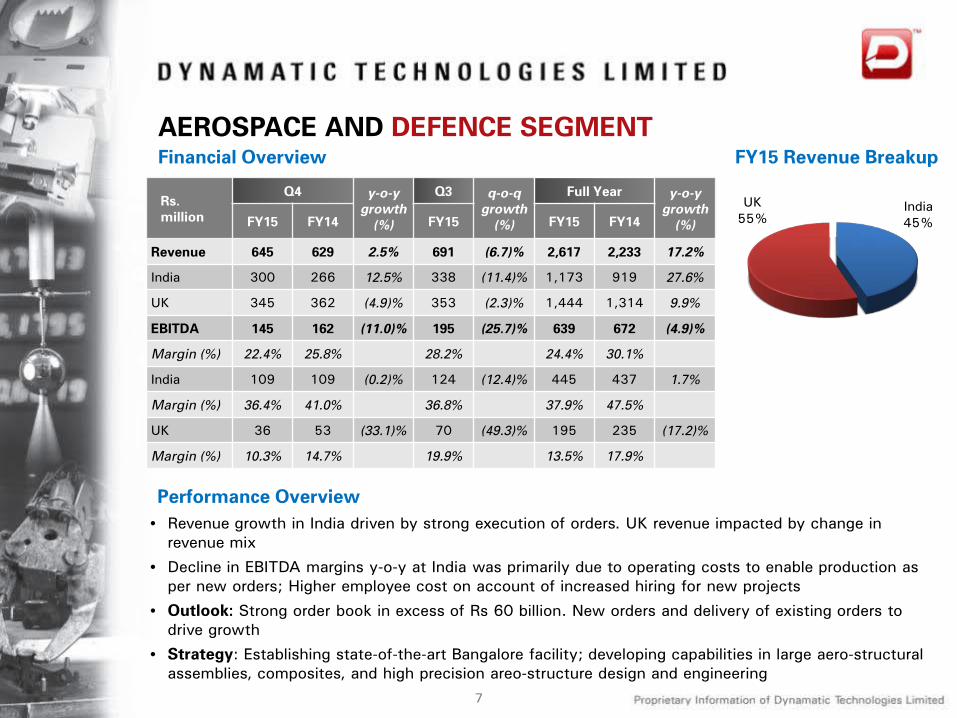
Revenue 645 629 2.5% 691 (6.7)% 2,617 2,233 17.2%
India 300 266 12.5% 338 (11.4)% 1,173 919 27.6%
UK 345 362 (4.9)% 353 (2.3)% 1,444 1,314 9.9%
EBITDA 145 162 (11.0)% 195 (25.7)% 639 672 (4.9)%
Margin (%) 22.4% 25.8% 28.2% 24.4% 30.1%
India 109 109 (0.2)% 124 (12.4)% 445 437 1.7%
Margin (%) 36.4% 41.0% 36.8% 37.9% 47.5%
UK 36 53 (33.1)% 70 (49.3)% 195 235 (17.2)%
Margin (%) 10.3% 14.7% 19.9% 13.5% 17.9%
Financial Overview
7
FY15 Revenue Breakup
India45%
UK55%
Performance Overview• Revenue growth in India driven by strong execution of orders. UK revenue impacted by change in
revenue mix
• Decline in EBITDA margins y-o-y at India was primarily due to operating costs to enable production as per new orders; Higher employee cost on account of increased hiring for new projects
• Outlook: Strong order book in excess of Rs 60 billion. New orders and delivery of existing orders to drive growth
• Strategy: Establishing state-of-the-art Bangalore facility; developing capabilities in large aero-structural assemblies, composites, and high precision areo-structure design and engineering

HYDRAULICS SEGMENT
8
Rs. million
Q4 y-o-y growth
(%)
Q3 q-o-q growth
(%)
Full Year y-o-y growth
(%)FY15 FY14 FY15 FY15 FY14
Revenue 663 776 (14.5)% 660 0.4% 2,922 3,098 (5.7)%
India 395 409 (3.5)% 425 (7.0)% 1,785 1,684 6.0%
UK 268 366 (26.9)% 236 13.7% 1,137 1,414 (19.6)%
EBITDA 90 90 (0.5)% 59 52.2% 341 404 (15.6)%
Margin (%) 13.6% 11.6% 8.9% 11.7% 13.0%
India 69 58 19.0% 54 29.1% 283 301 (6.3)%
Margin (%) 17.5% 14.2% 12.6% 15.8% 17.9%
UK 21 32 (35.8)% 5 281.6% 58 103 (43.2)%
Margin (%) 7.7% 8.8% 2.3% 5.1% 7.3%
• India revenue impacted by continued slowdown in the Indian tractor industry due to the unseasonal rainfall. UK revenues declined due to muted demand in Europe for agricultural machinery and also spare parts
• Higher employee cost on account of LTS (long term settlement) in India
• UK profitability affected y-o-y due to volume decline
• Outlook: New orders expected in the UK. Demand expected from pick up in the domestic construction equipment and infrastructure industries
• Strategy: Focus on OEM market and exports. Growth through replacement market and lean manufacturing systems
Performance Overview
FY15 Revenue Breakup
India61%
UK39%
Financial Overview
AUTOMOTIVE SEGMENT
9
Financial Overview
Rs. million
Q4 y-o-y growth
(%)
Q3 q-o-q growth
(%)
Full Year y-o-y growth
(%)FY15 FY14 FY15 FY15 FY14
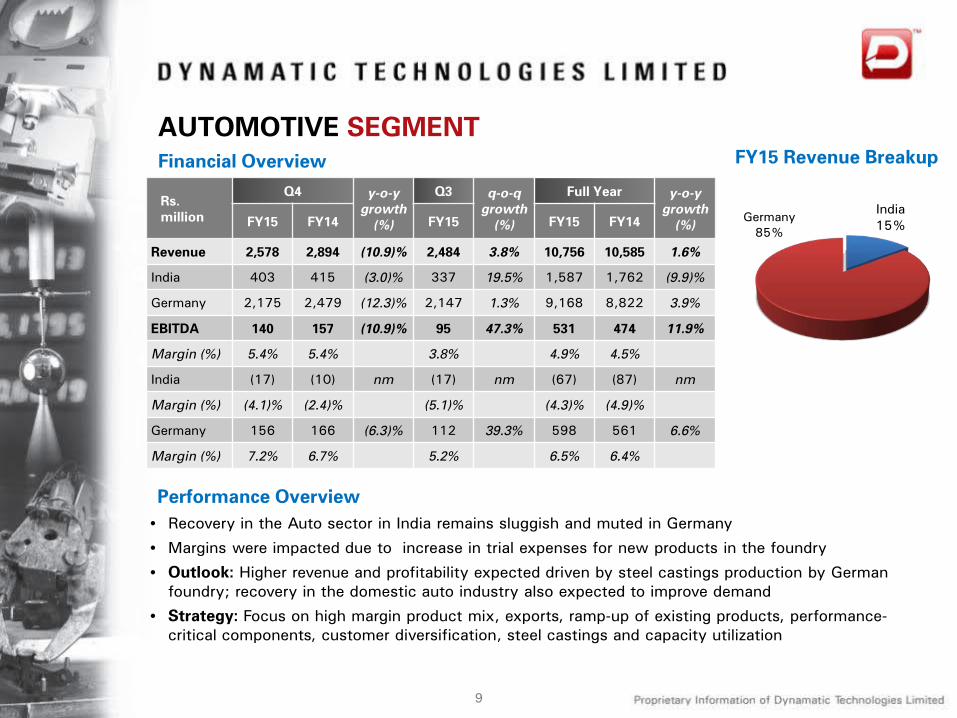
Revenue 2,578 2,894 (10.9)% 2,484 3.8% 10,756 10,585 1.6%
India 403 415 (3.0)% 337 19.5% 1,587 1,762 (9.9)%
Germany 2,175 2,479 (12.3)% 2,147 1.3% 9,168 8,822 3.9%
EBITDA 140 157 (10.9)% 95 47.3% 531 474 11.9%
Margin (%) 5.4% 5.4% 3.8% 4.9% 4.5%
India (17) (10) nm (17) nm (67) (87) nm
Margin (%) (4.1)% (2.4)% (5.1)% (4.3)% (4.9)%
Germany 156 166 (6.3)% 112 39.3% 598 561 6.6%
Margin (%) 7.2% 6.7% 5.2% 6.5% 6.4%
• Recovery in the Auto sector in India remains sluggish and muted in Germany
• Margins were impacted due to increase in trial expenses for new products in the foundry
• Outlook: Higher revenue and profitability expected driven by steel castings production by German foundry; recovery in the domestic auto industry also expected to improve demand
• Strategy: Focus on high margin product mix, exports, ramp-up of existing products, performance-critical components, customer diversification, steel castings and capacity utilization
Performance Overview
FY15 Revenue Breakup
India15%
Germany85%

Revenue (Rs. mn) and Growth (Q-o-Q) Segment Wise Revenue Contribution
EBITDA (Rs. mn) and Margin (%)
10
4,304 4,250 4,319
3,835 3,8857.6%
(1.3)%
1.6% (11.2)%
1.3%
Q4 FY14 Q1 FY15 Q2 FY15 Q3 FY15 Q4 FY15
67% 68% 65% 65% 66%
18% 18% 19% 17% 17%
15% 14% 16% 18% 17%
Q4 FY14 Q1 FY15 Q2 FY15 Q3 FY15 Q4 FY15
Automotive Hydraulics Aerospace & Defence
426463
374343 331
9.9% 10.9% 8.7% 8.9% 8.5%
Q4 FY14 Q1 FY15 Q2 FY15 Q3 FY15 Q4 FY15
QUARTERLY FINANCIAL TRENDS
Financial Performance
Capital Structure Debt and Net Debt (Rs.mn)
Net Debt/LTM EBITDA & Debt/Equity (x) Interest Expense (Rs. mn) & Interest Coverage (x)
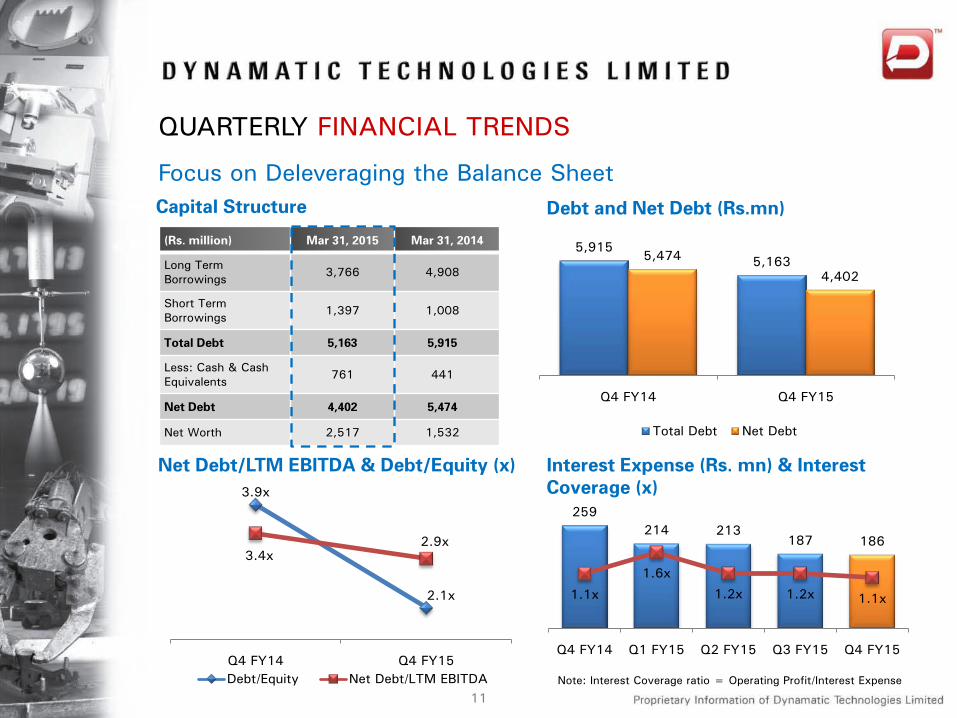
(Rs. million) Mar 31, 2015 Mar 31, 2014
Long Term Borrowings 3,766 4,908
Short Term Borrowings 1,397 1,008
Total Debt 5,163 5,915
Less: Cash & Cash Equivalents 761 441
Net Debt 4,402 5,474
Net Worth 2,517 1,532
Note: Interest Coverage ratio = Operating Profit/Interest Expense
11
259214 213
187 186
1.1x
1.6x
1.2x 1.2x 1.1x
Q4 FY14 Q1 FY15 Q2 FY15 Q3 FY15 Q4 FY15
5,915 5,163 5,474
4,402
Q4 FY14 Q4 FY15
Total Debt Net Debt
3.9x
2.1x
3.4x2.9x
Q4 FY14 Q4 FY15Debt/Equity Net Debt/LTM EBITDA
QUARTERLY FINANCIAL TRENDS
Focus on Deleveraging the Balance Sheet
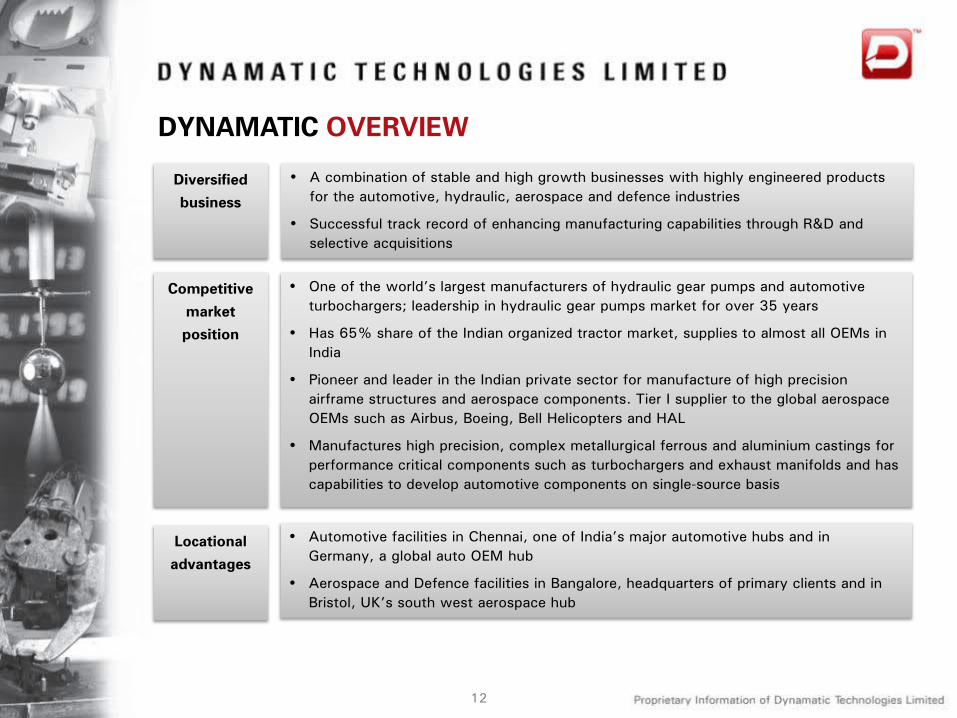
DYNAMATIC OVERVIEW
Competitive
market
position
• One of the world’s largest manufacturers of hydraulic gear pumps and automotive turbochargers; leadership in hydraulic gear pumps market for over 35 years
• Has 65% share of the Indian organized tractor market, supplies to almost all OEMs in India
• Pioneer and leader in the Indian private sector for manufacture of high precision airframe structures and aerospace components. Tier I supplier to the global aerospace OEMs such as Airbus, Boeing, Bell Helicopters and HAL
• Manufactures high precision, complex metallurgical ferrous and aluminium castings for performance critical components such as turbochargers and exhaust manifolds and has capabilities to develop automotive components on single-source basis
• A combination of stable and high growth businesses with highly engineered products for the automotive, hydraulic, aerospace and defence industries
• Successful track record of enhancing manufacturing capabilities through R&D and selective acquisitions
Diversified
business
• Automotive facilities in Chennai, one of India’s major automotive hubs and in Germany, a global auto OEM hub
• Aerospace and Defence facilities in Bangalore, headquarters of primary clients and in Bristol, UK’s south west aerospace hub
Locational
advantages
12

DYNAMATIC OVERVIEW
R&D and
Intellectual
Property
• Owns 17 patents for various products in India and internationally
• Has the design IP for all the products manufactured in the Hydraulics segment
• R&D units recognized by Department of Scientific and Industrial Research, Government of India
• Advanced iron foundry in India and Germany. Also has aluminium foundry in India for captive use
• Owns one of the most advanced ferrous foundries in Europe (Germany) capable of manufacturing highly intricate castings
• In-house division for design validation and optimization, analysis and prototypes
• Has 11 facilities across India (Bangalore, Chennai, Coimbatore, Nasik), UK (Swindon, Bristol) and Germany (Schwarzenberg)
Vertically
Integrated
Facilities
Blue Chip
Customers
• Automotive: Audi, BMW, Daimler, Ford, Hyundai, Nissan, Tata Motors, Volkswagen
• Hydraulics: Caterpillar, Cummins, Eicher, Escorts, John Deere, Mahindra & Mahindra, New Holland Fiat , Same Deutz-Fahr
• Aerospace and Defence: Airbus, Bell Helicopter, Boeing, GKN Aerospace, HAL, Spirit Aerosystems
• Highly qualified board and management team with significant industry experience
• 6 out of 12 Directors Independent
Board and
Management
13

DYNAMATIC OVERVIEWCombination of Stable and High Growth Businesses
AUTOMOTIVE
66% of FY15 Revenue
• Ferrous and non-ferrous automotive components including engine, transmission, turbocharger and chassis parts
• Metallurgical ferrous and aluminium castings
HYDRAULICS
18% of FY15 Revenue
• Hydraulic valves
• Hydraulic gear pumps
• Combined displacement pump packages
• Fan drive systems
• Fixed displacement pumps
AEROSPACE & DEFENCE
16% of FY15 Revenue
• Wings, rear fuselages, ailerons, wing flaps and major airframe structures
• Defence products and solutions
14
• Audi
• BMW
• Daimler
• Ford
• Hyundai
• Nissan
• Tata Motors
• Volkswagen
• Caterpillar
• Eicher
• Escorts
• John Deere
• Mahindra & Mahindra
• New Holland Fiat
• Same Deutz-Fahr
• Airbus
• Boeing
• Bell
• Sprint
• HAL

BLUE CHIP INVESTOR BASEKey Institutional Investors
Shareholders Sep-14 Dec-14 Mar-15
Promoters 53.8% 51.1% 51.1%
FIIs 18.0% 16.8% 15.2%
DIIs 0.5% 5.4% 6.8%
Others 27.8% 26.7% 26.9%
Total 100.0% 100.0% 100.0%
Shareholding Pattern Trend Equity History
Year EventEquity Capital
(Rs. mn)
1974 Initial Public Offering 2.9
1987 Rights Issue 11.2
1992 Rights Issue 21.0
1994 Rights Issue 31.5
1995 Bonus Issue 41.9
2008 Amalgamation 48.1
2008 Qualified Institutional Placement 54.1
2014 Preferential convertible warrants 60.4
2014 Qualified Institutional Placement 63.4
Shareholding Structure
15
• Goldman Sachs India Equity Fund
• HDFC Trustee Company Limited (HDFC Infrastructure Fund)
• SBI Magnum Multiplier Plus Scheme 1993
• Alchemy India Long Term Fund
• L&T Infrastructure Fund
• DSP Blackrock Opportunities Fund
• Principal Mutual Fund
• Param Capital Research Pvt Ltd
• Citigroup Global Mauritius Markets Pvt Ltd
• Samena Special Situations Mauritius
Promoters51%
FIIs15%
DIIs7%
Others27%
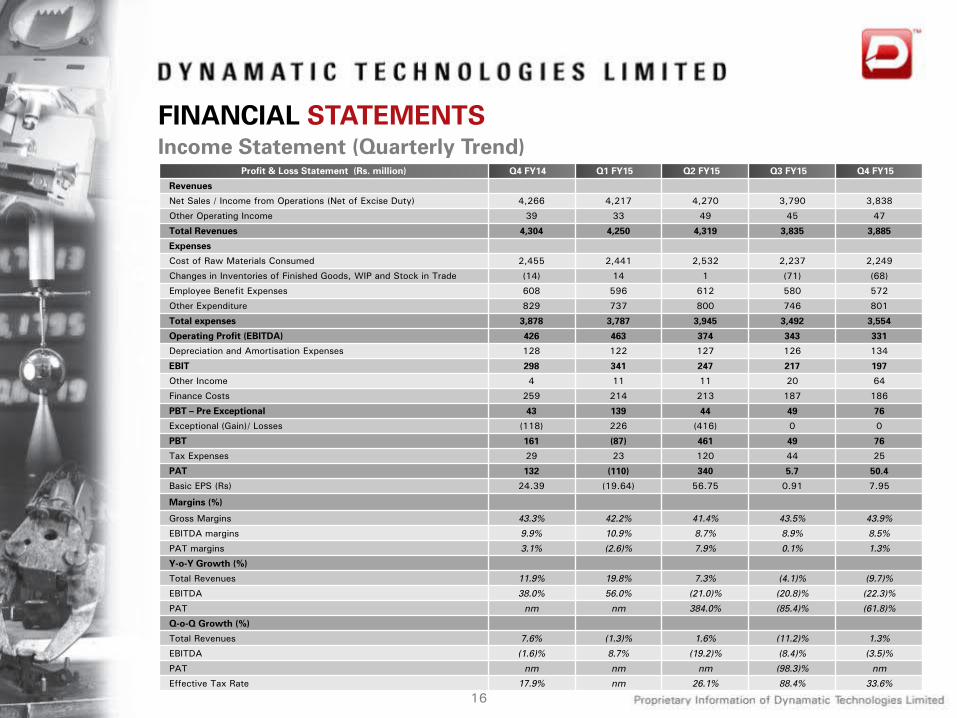
FINANCIAL STATEMENTS
Profit & Loss Statement (Rs. million) Q4 FY14 Q1 FY15 Q2 FY15 Q3 FY15 Q4 FY15
Revenues
Net Sales / Income from Operations (Net of Excise Duty) 4,266 4,217 4,270 3,790 3,838
Other Operating Income 39 33 49 45 47
Total Revenues 4,304 4,250 4,319 3,835 3,885
Expenses
Cost of Raw Materials Consumed 2,455 2,441 2,532 2,237 2,249
Changes in Inventories of Finished Goods, WIP and Stock in Trade (14) 14 1 (71) (68)
Employee Benefit Expenses 608 596 612 580 572
Other Expenditure 829 737 800 746 801
Total expenses 3,878 3,787 3,945 3,492 3,554
Operating Profit (EBITDA) 426 463 374 343 331
Depreciation and Amortisation Expenses 128 122 127 126 134
EBIT 298 341 247 217 197
Other Income 4 11 11 20 64
Finance Costs 259 214 213 187 186
PBT – Pre Exceptional 43 139 44 49 76
Exceptional (Gain)/ Losses (118) 226 (416) 0 0
PBT 161 (87) 461 49 76
Tax Expenses 29 23 120 44 25
PAT 132 (110) 340 5.7 50.4
Basic EPS (Rs) 24.39 (19.64) 56.75 0.91 7.95
Margins (%)
Gross Margins 43.3% 42.2% 41.4% 43.5% 43.9%
EBITDA margins 9.9% 10.9% 8.7% 8.9% 8.5%
PAT margins 3.1% (2.6)% 7.9% 0.1% 1.3%
Y-o-Y Growth (%)
Total Revenues 11.9% 19.8% 7.3% (4.1)% (9.7)%
EBITDA 38.0% 56.0% (21.0)% (20.8)% (22.3)%
PAT nm nm 384.0% (85.4)% (61.8)%
Q-o-Q Growth (%)
Total Revenues 7.6% (1.3)% 1.6% (11.2)% 1.3%
EBITDA (1.6)% 8.7% (19.2)% (8.4)% (3.5)%
PAT nm nm nm (98.3)% nm
Effective Tax Rate 17.9% nm 26.1% 88.4% 33.6%
Income Statement (Quarterly Trend)
16

FINANCIAL STATEMENTS
Profit & Loss Statement (Rs. million) FY14 FY15
Revenues
Net Sales / Income from Operations (Net of Excise Duty) 15,719 16,115
Other Operating Income 156 174
Total Revenues 15,875 16,288
Expenses
Cost of Raw Materials Consumed 8,982 9,458
Changes in Inventories of Finished Goods, WIP and Stock in Trade (71) (125)
Employee Benefit Expenses 2,216 2,360
Other Expenditure 3,119 3,084
Total expenses 14,246 14,778
Operating Profit (EBITDA) 1,629 1,511
Depreciation and Amortisation Expenses 513 509
EBIT 1,117 1,002
Other Income 35 106
Finance Costs 997 799
PBT – Pre Exceptional 155 308
Exceptional (Gain)/ Losses (103) (191)
PBT 258 499
Tax Expenses 120 213
PAT 137.7 286.5
Basic EPS (Rs) 25.42 47.28
Margins (%)
Gross Margins 43.9% 42.7%
EBITDA margins 10.3% 9.3%
PAT margins 0.9% 1.8%
Y-o-Y Growth (%)
Total Revenues 2.6%
EBITDA (7.3)%
PAT 108.1%
Effective Tax Rate 42.6%
Income Statement (Annual Trend)
17

FINANCIAL STATEMENTS
Balance Sheet (Rs. million) Sep-13 Mar-14 Sep-14 Mar-15
ASSETS
Non-Current Assets
Goodwill 679 679 679 879
Fixed Assets
i) Tangible Fixed Assets 5,685 5,967 5,558 5,355
ii) Intangible Fixed Assets 272 224 193 202
iii) Capital work in progress 769 28 71 44
Non-Current Investment 0 0 0 0
Deferred tax asset (net) 0 0 5 0
Long Term Loans and Advances 242 250 273 242
Other Non Current Assets 89 110 79 161
Total Non-Current Assets 7,735 7,258 6,858 6,882
Current Assets
Inventories 2,313 2,280 2,257 2,272
Trade Receivables / Sundry Debtors 1,069 1,016 1,020 1,131
Cash and Cash Equivalents 545 441 557 761
Short-Term Loans and Advances 233 321 352 314
Other Current Assets 318 278 254 138
Total Current Assets 4,478 4,336 4,440 4,616
TOTAL ASSETS 12,213 11,594 11,298 11,498
Balance Sheet – Assets
18

FINANCIAL STATEMENTSBalance Sheet – LiabilitiesBalance Sheet (Rs. million) Sep-13 Mar-14 Sep-14 Mar-15
EQUITY and LIABILITIES
Shareholders Fund
Share capital 54 55 60 63
Reserves and surplus 859 1,376 2,134 2,453
Money Received against Share Warrants 125 100 0 0
Non-controlling interest (Preference capital) 330 26 26 4
Total Shareholders Fund 1,367 1,558 2,220 2,520
Non-Current Liabilities
Long-Term Borrowings 3,645 3,619 3,005 2,658
Deferred Tax Liabilities (net) 315 341 278 276
Other Long Term Liabilities 201 139 33 30
Long Term Provisions 31 29 37 68
Total Non-Current Liabilities 4,192 4,127 3,352 3,032
Current Liabilities
Short-Term Borrowings 1,412 1,008 1,265 1,397
Trade Payables 2,587 2,806 2,617 2,743
Other Current Liabilities 2,456 1,939 1,578 1,580
Short-Term Provisions 197 157 265 226
Total Current Liabilities 6,653 5,909 5,726 5,946
TOTAL EQUITY and LIABILITIES 12,213 11,594 11,298 11,498
19

CONTACT DETAILS
Mr. Hanuman Sharma
Executive Director and Chief Financial Officer
Dynamatic Technologies LimitedDynamatic Park Peenya Industrial Area Bangalore 560 058 IndiaT: +91 80 2839 4933 / 34 / 35F: +91 80 2839 5823E: [email protected]
Mr. Naveen Chandra
Head – Legal, Compliance & Company Secretary
Dynamatic Technologies LimitedDynamatic Park Peenya Industrial Area Bangalore 560 058 IndiaT: +91 80 2839 4933 / 34 / 35F: +91 80 2839 5823E: [email protected]
www.dynamatics.net
CIN: L72200KA1973PLC002308