qesst thin film pv report 2020 - first solar
TRANSCRIPT

Thin Film CdTe Photovoltaics and the U.S. Energy Transition in 2020
Clark A. Miller, Ian Marius Peters, Shivam Zaveri
QESST Engineering Research Center
Arizona State University
Massachusetts Institute of Technology
2
TABLE OF CONTENTS
Executive Summary .............................................................................................. 9
I - The Place of Solar Energy in a Low-Carbon Energy Transition ...................... 12
A - The Contribution of Photovoltaic Solar Energy to the Energy Transition .. 14
B - Transition Scenarios .................................................................................. 16
I.B.1 - Decarbonizing California ................................................................... 16
I.B.2 - 100% Renewables in Australia ......................................................... 17
II - PV Performance ............................................................................................. 20
A - Technology Roadmap ................................................................................. 21
II.A.1 - Efficiency ........................................................................................... 22
II.A.2 - Module Cost ...................................................................................... 27
II.A.3 - Levelized Cost of Energy (LCOE) ....................................................... 29
II.A.4 - Energy Payback Time ........................................................................ 32
B - Hot and Humid Climates ............................................................................ 34
II.B.1 - Impact of Temperature ..................................................................... 34
II.B.2 - Impact of Water Vapor ...................................................................... 36
II.B.3 - Impact of Aerosols ............................................................................ 39
II.B.4 - Performance Ratio ............................................................................ 39
II.B.5 - Energy Yield ...................................................................................... 41
C - Performance of CdTe PV in the Field ......................................................... 43
II.C.1 - Outdoor Testing Sites and Results ................................................... 43
II.C.2 - Degradation ...................................................................................... 45
II.C.3 - Temperature Performance ............................................................... 48
II.C.4 - Spectral Effect .................................................................................. 50
II.C.5 - ARC and Soiling ................................................................................. 54
D - Reliability Testing ....................................................................................... 56

3
II.D.1 - Indoor Testing Procedures and Results ........................................... 56
II.D.2 - Technological Innovation .................................................................. 58
E - Future Efficiency Development .................................................................. 61
II.E.1 – Band Gap Grading ........................................................................... 61
II.E.2 - Overcoming Low Voltages ................................................................. 63
II.E.3 - Next Generation Devices .................................................................. 65
F - Improving First Solar Competitiveness ...................................................... 68
III - Environmental, Health, and Safety Considerations for Cdte Photovoltaics 70
A - Materials and Supply Chain ....................................................................... 71
B - Manufacturing ............................................................................................ 75
III.B.1 - Manufacturing Facility ..................................................................... 76
III.B.2 - Manufacturing Process .................................................................... 77
III.B.3 - Personnel and Worker Safety .......................................................... 78
III.B.4 - Production Quality and Safety ......................................................... 80
III.B.5 - Independent Quality Tests Certification .......................................... 81
III.B.6 - Value of Production Under One Roof .............................................. 82
C - Operational Life Cycle and Non-Routine Events ........................................ 83
III.C.1 - Field Breakage ................................................................................. 84
III.C.2 - Extreme Weather Events ................................................................. 86
III.C.3 - Fire Tests .......................................................................................... 87
III.C.4 - Operations and Maintenance (O&M) .............................................. 88
D - PV End of Life ............................................................................................. 92
III.D.1 - Recycling and Decommissioning .................................................... 93
III.D.2 - Recycling Process ............................................................................ 94
III.D.3 - First Solar Recycling Capacity ......................................................... 94
III.D.4 - Future of PV Recycling ..................................................................... 95

4
IV - Comparison of PV Environmental Impacts ................................................... 96
A - Overall Life Cycle Environmental Comparisons ......................................... 96
B - Carbon footprint ....................................................................................... 102
C - Water Use ................................................................................................. 107
D - Land Use .................................................................................................. 109
E - Dust and Particulates ............................................................................... 113
F - Biodiversity ............................................................................................... 115
G - Materials Hotspots ................................................................................... 118
V - The Value of Solar Energy in Clean Energy Transitions .............................. 119
A - The Driver of Solar Energy Adoption: Eco-Efficiency ................................ 119
B - Grid Integration of Solar Energy ............................................................... 122
V.B.1 - Cost of PVS ..................................................................................... 128
V.B.2 - Battery Development ...................................................................... 130
C – U.S. Manufacturing Competitiveness and Employment ........................ 131
D - Energy Access .......................................................................................... 133
V.D.1 - PV-Battery System .......................................................................... 135
V.D.2 - PV-Battery and Diesel System ........................................................ 135
V.D.3 - PV-Diesel System ............................................................................ 135
E - Energy Resilience ..................................................................................... 136
VI - Conclusion .................................................................................................. 138
References ........................................................................................................ 140
5
LIST OF FIGURES
Figure 1. PV Growth Over 20 Year Period ............................................................................... 14
Figure 2. Decarbonize California Projections.......................................................................... 16
Figure 3. Australia Renewable Energy Maps .......................................................................... 18
Figure 4. Projected PV Installation 2016-2030 ...................................................................... 20
Figure 5. Thin-film PV Market Share and Production ............................................................. 22
Figure 6. Sensitivity Map for 2012 Cost Structure ................................................................. 23
Figure 7. CdTe PV Efficiency Record for Solar Cells and Modules ......................................... 24
Figure 8. PV Efficiency Comparison ........................................................................................ 25
Figure 9. Band Gap Comparison ............................................................................................. 27
Figure 10. Decrease in PV Module Pricing ............................................................................. 28
Figure 11. PV Module Pricing .................................................................................................. 29
Figure 12. Levelized Cost of Energy Comparison ................................................................... 30
Figure 13. Levelized Cost and Capital Cost Comparison ........................................................ 31
Figure 14. Africa and Europe Energy Payback Map ............................................................... 32
Figure 15. Average PV Energy Payback Time ......................................................................... 33
Figure 16. Cell Efficiency at Different Band Gaps .................................................................. 35
Figure 17. PV Module Temperature Range ............................................................................ 36
Figure 18. Precipitable Water and Band Gap Effects on Efficiency ....................................... 37
Figure 19. Spectral Response Maps....................................................................................... 38
Figure 20. Aerosol Impacts ..................................................................................................... 39
Figure 21. Performance Ratio in Different Regions................................................................ 40
Figure 22. Performance Ratio Comparison ............................................................................ 41
Figure 23. Annual Energy Yield ............................................................................................... 42
Figure 24. Global Energy Yield Maps ...................................................................................... 42
Figure 25. First Solar Test Locations ...................................................................................... 43
Figure 26. First Solar Monitored Plants .................................................................................. 44
Figure 27. First Solar Performance ......................................................................................... 44
Figure 28. Historical CdTe PV Power Output .......................................................................... 46
Figure 29. Degradation Rates ................................................................................................. 46
Figure 30. Degradation Location and Rates ........................................................................... 47
Figure 31. Initial Stabilization ................................................................................................. 48
Figure 32. Temperature Effects on PV Modules ..................................................................... 49
Figure 33. Spectral Factor in Spain ........................................................................................ 50
Figure 34. PV Module Performance Ratio Comparison in Four Locations ............................. 51
Figure 35. Performance Ratio Differences ............................................................................. 52
Figure 36. PV Power Generation Over a Month ...................................................................... 53
Figure 37. Anti-Reflective Coating Effects .............................................................................. 54
Figure 38. Soiling Effects ........................................................................................................ 54

6
Figure 39. Soiling Trends ........................................................................................................ 55
Figure 40. Test Cycles ............................................................................................................. 56
Figure 41. Test Cycle Effects on Power Output ...................................................................... 57
Figure 42. ZnTe Back Contact Architecture ............................................................................ 59
Figure 43. ZnTe Back Contact Effects .................................................................................... 59
Figure 44. Stabilization and Predictability of CdTe PV............................................................ 60
Figure 45. Selenium Concentration in CdTe Film ................................................................... 61
Figure 46. First Solar Efficiency Gains .................................................................................... 62
Figure 47. CdTe Overcoming 1 Volt Barrier ............................................................................ 63
Figure 48. Magnesium Effects on Band Gap .......................................................................... 64
Figure 49. Magnesium CdTe Cell Characteristics ................................................................... 64
Figure 50. Limiting Efficiencies for Tandem Solar Cells ......................................................... 65
Figure 51. Tandem Cell Structures ......................................................................................... 66
Figure 52. Module Cost Breakdown ....................................................................................... 67
Figure 53. System Installation Cost ........................................................................................ 68
Figure 54. CdTe Module Manufacturing Cost ......................................................................... 69
Figure 55. CdTe Molecular Structure ...................................................................................... 72
Figure 56. CdTe Toxicology ..................................................................................................... 73
Figure 57. Ecotoxicity of Metals .............................................................................................. 74
Figure 58. Circular Economy of CdTe ...................................................................................... 75
Figure 59. Series 6 Manufacturing Process ........................................................................... 76
Figure 60. CdTe Module Automation ..................................................................................... 76
Figure 61. First Solar CdTe Module Structure ........................................................................ 77
Figure 62. First Solar Facility 2019 Air Samples .................................................................... 79
Figure 63. Biomonitoring of First Solar Workers .................................................................... 80
Figure 64. First Solar Reliability Testing ................................................................................. 81
Figure 65. First Solar Manufacturing Facility .......................................................................... 82
Figure 66. CdTe PV Field Breakage Fate and Transport Evaluation ....................................... 85
Figure 67. CdTe PV Fire Fate and Transport Evaluation ......................................................... 88
Figure 68. 1 MW Block of CdTe PV ......................................................................................... 90
Figure 69. First Solar O&M Locations 2014 ........................................................................... 91
Figure 70. First Solar O&M Facility ......................................................................................... 91
Figure 71. Landfill Evaluation ................................................................................................. 92
Figure 72. Recycling Process .................................................................................................. 94
Figure 73. Manufacturing Waste Recycling and Disposal Breakdown 2015-2018 ............... 95
Figure 74. Cd Emissions of Different Power Generation Systems ......................................... 96
Figure 75. Life Cycle Environmental Impacts of CdTe and CIGS PV Modules ........................ 98
Figure 76. Life Cycle Human Health Impacts of Different Power Generation Systems ......... 99
Figure 77. Life Cycle Ecosystem Impacts of Different Power Generation Systems ............. 100
Figure 78. Life Cycle Environmental Comparison of PV Technologies ................................. 100
7
Figure 79. Life Cycle Environmental Footprint of Different Power Generation Systems ...... 101
Figure 80. PV GHG Emissions in Different Regions .............................................................. 103
Figure 81. PV GHG Emission Rate ........................................................................................ 103
Figure 82. PV Production GHG Emissions ............................................................................ 104
Figure 83. PV Carbon Footprint and Energy Payback ........................................................... 105
Figure 84. Recycling GHG Net Benefits ................................................................................ 106
Figure 85. Recycling Energy Net Benefits ............................................................................. 107
Figure 86. CdTe PV Life Cycle Water Withdrawal.................................................................. 108
Figure 87. First Solar Water Use ........................................................................................... 109
Figure 88. Life Cycle Land Transformation ........................................................................... 110
Figure 89. Land Transformation and Occupation of Coal and Solar Power ......................... 111
Figure 90. PV Panel Shading and Soil Water Content and Biomass Produced ................... 112
Figure 91. Dust and Particulate Emissions from PV Plants .................................................. 114
Figure 92. Responsible Land Use ......................................................................................... 116
Figure 93. Vegetation Management ..................................................................................... 117
Figure 94. U.S. Energy Additions and Retirements 2019 ..................................................... 120
Figure 95. Environmental and Health Benefits from Solar Penetration............................... 121
Figure 96. PV Eco-Efficiency ................................................................................................. 122
Figure 97. PV Plant Components .......................................................................................... 123
Figure 98. PV Plant Power Availability .................................................................................. 124
Figure 99. Power Load Profile for California ......................................................................... 125
Figure 100. Grid Flexible Solar ............................................................................................. 126
Figure 101. Power Management Tradeoff ............................................................................ 126
Figure 102. Automated Generation Control ......................................................................... 127
Figure 103. Solar Energy Grid Services ................................................................................ 128
Figure 104. PVS and CT Cost Comparison ........................................................................... 129
Figure 105. Battery Storage Technology Development ........................................................ 130
Figure 106. PV Production by Type and Region.................................................................... 131
Figure 107. PV Installation Projections Through 2024 ........................................................ 133
8
List of Tables
Table 1. Different Solar Cell Metrics ....................................................................................... 26
Table 2. Energy Payback Comparison .................................................................................... 34
Table 3. Properties of Different PV Devices ............................................................................ 35
Table 4. CdTe and CIGS Efficiencies ....................................................................................... 67
Table 5. First Solar Series 6 Module Composition ................................................................. 71
Table 6. Chemical and physical properties of CdTe and Cd ................................................... 72
Table 7. First Solar PV Plants in the United States ................................................................. 83
Table 8. Vegetation Sampling ............................................................................................... 118
Table 9. Lifecycle Cost of Operation Comparison ................................................................. 129
Table 10. Microgrid Supporting a Village .............................................................................. 135
Table 11. Microgrid Comparison........................................................................................... 136
Acknowledgments
The authors thank First Solar for giving access to its Perrysburg, Ohio, U.S. manufacturing and
water treatment facility. We appreciate the following First Solar associates who helped coordinate the
site visit and responded to questions: Parikhit Sinha, Lou Trippel, Markus Gloeckler, Clarence
Hertzfeld, Jacob Benjamin, Tilak Gullinkala, Thomas Sullivan, and John Brewis,
9
EXECUTIVE SUMMARY
Solar energy and the photovoltaic (PV) technologies that harvest it are rapidly transforming the
world’s energy systems. This transformation is being driven by two basic facts. First, solar energy is
nearly carbon-free. As such, it is an ideal technology for tackling climate change. And, as the overall
carbon intensity of the power grid declines, manufacturing new solar panels will eventually become
carbon-neutral. Second, thanks to technology and manufacturing improvements, solar energy is
extremely inexpensive. Today, a new solar power plant is one of the lowest cost strategies available
for meeting the world’s growing energy needs, in terms of the levelized cost of electricity. And the price
keeps going down, with new world record low prices for contracts routinely announced.
Many projections of the future of energy now anticipate that, as a result of its low cost and
minimal carbon footprint, solar energy may provide as much as 50% or more of future global energy
demand. Part of this growth is likely to come from electric utilities, who are increasingly comfortable
with high rates of penetration of solar PV on the grid. At the same time, the need for low-carbon options
for the transportation sector is driving innovation in battery-electric vehicles, hydrogen fuel cell cars,
and other solutions, all of which provide the potential to soak up and store large quantities of
abundant, low-cost solar electrons produced when the sun is shining. Together, the electricity and
transport sectors may drive the addition of multiple terawatts of solar panel manufacturing capacity
and of solar panel deployment over the next several decades.
These trends highlight the importance for the field of solar energy to regularly evaluate the
ongoing progress of photovoltaics in technology innovation and development, safety and
environmental performance, contributions to low-carbon energy transitions, and providing value to
society. This report contributes to that effort, focused on thin film cadmium telluride (CdTe) solar PV
technology and the principal global manufacturer of CdTe PV modules, First Solar. Today, CdTe PV
technologies comprise approximately one-third of the U.S. utility-scale PV market and over 25 GW of
CdTe PV modules have been deployed globally. First Solar’s capacity to manufacture CdTe PV modules
is currently 6 GW per year, globally, and projected to grow to 8 GW in the next few years. With annual
production capacity of 1.9 GW in its Ohio manufacturing facilities, First Solar is the largest U.S. PV
module manufacturer, with over 2,750 direct jobs in the U.S., $1 billion spent annually in the U.S.
supply chain, and over $1 billion spent on research and development since 2010.
Working with First Solar, we reviewed the now extensive research literature describing the
performance of CdTe PV technologies and systems, both theoretically and in the field over the past
two decades. We also visited First Solar facilities and spoke with First Solar technology, manufacturing,
and sustainability managers. The work was carried out jointly by Arizona State University and the
Massachusetts Institute of Technology, under the auspices of the Quantum Energy and Sustainable
Solar Technologies Engineering Research Center.
The report describes the growing acceleration of trends towards transitioning the U.S. and
global economy to a carbon-neutral future, the place of PV technologies in that transition, existing and
potential future CdTe PV technologies, the historical and theoretical performance of CdTe technologies

10
in terms of energy generation in diverse operating contexts, the environmental and safety record of
CdTe PV, and the social and economic dimensions of solar energy.
Based on our review of competitiveness, safety, and life cycle environmental performance,
CdTe PV technology is expected to make a valuable contribution to the U.S. energy transition. These
conclusions are drawn on the basis of eco-efficiency as the driver of solar energy adoption, where eco-
efficiency is the concept of creating more economic value with lower environmental impacts. The main
findings include:
• Creating economic value: CdTe PV technology is well positioned to contribute
significant economic value as part of a low-carbon energy transition. Along with wind
and combined cycle natural gas, utility-scale solar energy is the most cost-competitive
source of new electricity generation based on levelized cost of energy. To the extent
that module prices continue to fall and module efficiencies continue to increase, these
economic benefits will continue to grow. To date, CdTe PV efficiency has increased
steadily with record cell efficiency of 22.1%, record module efficiency of 19.0%, and
average commercial modules of 420-450W (First Solar Series 6). Innovation in module
size and packaging, back contacts, and semiconductor band-gap grading have been
used to improve CdTe PV device efficiency, long-term degradation rates, and cost per
watt, and additional improvements in efficiency are expected in future CdTe PV
technologies. In the future, synergies with battery storage and vehicle electrification
are also expected to increase the demand for and integration of solar energy into the
grid. Through use of advanced inverters, control systems, energy forecasting, and rapid
ramping capabilities, large-scale PV power plants are also able to regulate real and
reactive power output to provide grid-flexible operation and provide important grid
services. CdTe PV technology is especially suited for hot and humid climates, where it
has higher energy yield than crystalline silicon PV due to a lower temperature
coefficient and lower spectral sensitivity to infrared light absorption by water vapor.
• Creating environmental value: CdTe PV technology is also well positioned to contribute
significant environmental value as part of a low-carbon energy transition. Overall, CdTe
PV technology has among the lowest greenhouse gas emissions and smallest
environmental footprints of any energy technology. Per unit energy generated, CdTe PV
creates significantly lower overall life-cycle environmental impacts than the current
U.S. electricity grid. Avoidance of grid electricity greenhouse gas and air pollutant
emissions with use of PV electricity amounts to environmental and public health
benefits of $20/MWh and $14/MWh, respectively. Among commercial PV
technologies, due to low energy and material use in manufacturing, CdTe PV has the
lowest life cycle environmental impacts, including carbon footprint, energy payback
time, water use, human health impacts, and ecosystem impacts. Properly designed
and constructed solar facilities can have a positive impact on shared uses of land,
including increasing agricultural productivity and enhancing biodiversity through
revegetation, management of invasive and sensitive species, and preservation of land
for alternative future uses. CdTe PV modules are also recyclable, reducing long-term
waste from energy generation. First Solar’s high-value recycling facilities have been

11
operating commercially for over a decade and are able to recover more than 90% of a
CdTe PV module for reuse in new solar modules and glass products. First Solar’s global
recycling facilities process 20,000-30,000 metric tons of manufacturing scrap and
end-of-life PV modules annually.
• Health, safety, and reliability: First Solar CdTe PV modules are designed to provide 25+
years of reliable performance. CdTe is sourced as a byproduct of zinc and copper
mining. All thin film PV manufacturing steps occur in a single facility, facilitating
integrated quality control. Automated, enclosed equipment and air monitoring help
ensure industrial hygiene, and worker biomonitoring is used to confirm occupational
health. First Solar manufacturing facilities are certified to international standards for
quality, environmental management, and occupational health (ISO 9001, ISO 14001,
ISO 45001). Product reliability is continuously evaluated through in-line monitoring of
production processes, indoor reliability testing with long-term test sequences, outdoor
testing in temperate, tropical, and desert climates, and operations and maintenance
programs that monitor performance in the field. The manufacturing process
encapsulates and seals ~3 µm thick semiconductor layers in durable glass-glass
modules. Experimental data, fate and transport models, and field data from extreme
weather events have confirmed the environmental product safety of CdTe PV in case
of non-routine events such as field breakage and fire. Although the goal is to recycle
all PV modules, standard waste characterization testing and fate and transport
modeling have confirmed the environmental product safety of CdTe PV in case of
landfill disposal. Strong chemical bonding in CdTe results in high chemical and thermal
stability, which are important for long-term device reliability and product safety.

12
I - THE PLACE OF SOLAR ENERGY IN A LOW-CARBON ENERGY TRANSITION
The U.S. and the globe are in the midst of a large-scale transformation of the energy sector.
This transformation is expected to fundamentally alter the world’s energy mix, shifting the energy
sector from a heavy dominance on fossil fuels, today, to one in the relatively near future that is much
more reliant on alternative energy sources and, especially, solar photovoltaic (PV) and other renewable
energy technologies. As we detail below, current estimates anticipate that the energy sector will
globally deploy multiple terawatts (TW) of solar PV technologies over the course of the next few
decades. There is thus a clear need to assess the long-term performance and sustainability of PV
technologies. In this report, we review thin-film, CdTe PV technologies, manufactured by First Solar,
with regard to a range of technical performance, environmental, health, safety, and socio-economic
considerations.
The current transformation of the energy sector is being driven by two primary factors. The
first is rapid declines in the price of renewable energy generation technologies, especially solar and
wind technologies. In the past decade, world record prices for unsubsidized contracts for solar energy
dropped by a factor of ten from 17 cents/kWh in 2011 to less than 2 cents/kWh in 2018 and by lesser
but significant amounts for wind energy (onshore from 8 to 2 cents/kWh; offshore from 17 to 5 cents
per kWh) (Liebreich, 2018). In 2018, as a result, the levelized cost of energy from new solar and wind
generation was lower than for all other electricity generation technologies, and in a growing fraction of
the world was competitive with the marginal cost of operation of existing coal, gas, and nuclear power
plants (Lazard, 2019). In May 2019, the EU spot market price for mainstream silicon solar modules
was 25 cents/W (Schachinger, 2020). The second is widespread scientific, public, and policy concern
about climate change and the resulting need to quickly reduce carbon emissions from energy use
(IPCC, 2019). Concerns about climate change have grown markedly since 1990, escalating rapidly
over the past ten years. Today, a growing number of governments and companies have committed to
achieve carbon neutrality over the next few decades, including several of the world’s largest oil
companies, such as British Petroleum and Total S.A. (The Climate Group, 2020; CNCA, 2020).
These changes in policies and markets are, in turn, driving new patterns of energy generation
and investment in new energy technologies, with renewable energy now accounting for 18% of U.S.
electricity generation, while coal has dropped to 24% of U.S. electricity generation (EIA, 2020d). In
2021, the U.S. Energy Information Administration (EIA) projects electricity generation from renewable
sources to surpass nuclear and coal (2020a). Worldwide, since 2016, new investments each year in
solar and wind generation capacity have exceeded new investments in natural gas and coal-fired
power plants (McKinsey, 2019). In 2019, global investments in wind and solar energy reached $ 284
billion (BNEF, 2019). Today, the amount of global investment in new renewable energy generation
technologies for the power sector is nearly three times the amount invested in new fossil fuel
generation (IEA, 2019b).
13
The upshot of these changes is that expectations are rapidly evolving regarding the future of
the global energy industry. Annual additions to the world’s capacity for solar energy generation now
top 100 GW/year, and this number is anticipated to continue to increase steadily (Liebreich, 2018).
Recent estimates suggest that solar and wind technologies will supply between 20% and 40% of world
electricity demand by 2040 (BNEF, 2019; IEA, 2019b). While forecasts for what a future carbon-
neutral energy system will ultimately look like remain uncertain, current expectations are that
renewables will occupy a large share of future energy generation. Under such a scenario, it is not
unreasonable that solar PV technologies may by themselves perhaps comprise up to 50% of the
world’s energy markets. By 2050, one estimate projects that the world will install an additional 7.7 TW
of solar PV (McKinsey, 2019). This may be particularly true if electric vehicles come to dominate the
transportation sector, requiring large, low-cost increases to electricity supply. Another recent study
examined the scale of solar PV additions to global energy supply to meet 50% of the world’s energy
needs under a variety of scenarios (Kurtz et al., 2020). Their estimates range from 37 TW, in a scenario
in which all final end uses of energy are electrified, to 180 TW, in a scenario in which major segments
of final end uses of energy rely on chemical storage and combustion of hydrocarbons generated with
renewable electricity. Their baseline scenario is 80-120 TW of solar PV in a world of 10 billion people
and 3.2 kW of consumption per person.
Within this landscape of changing energy policies and technologies, the manufacturing and
deployment of CdTe thin film solar PV technologies constitutes an important segment of the PV market.
In the U.S., CdTe PV accounts for approximately one-third of cumulative capacity of utility-scale solar
through 2018 (Bolinger et al., 2019). First Solar employs over 2,750 associates in the U.S. and with
the addition of a second factory in Ohio in 2019, First Solar’s U.S. annual production capacity is 1.9
GW, making it the largest PV module manufacturer in the U.S. and the Western hemisphere (First Solar,
2019c). In the past decade, over one-third of the total manufactured PV modules in the U.S. (2010-
2018) were thin film CdTe PV modules (NREL, 2019). Globally, in 2017, thin film technologies
represented approximately 5% of the world’s solar energy markets (Fraunhofer, 2019). Within the thin
film market, the largest manufacturing segment is CdTe, with First Solar currently the world’s largest
manufacturer of thin film PV. As of 2020, First Solar reported total sales of over 25 GW of CdTe thin
film product (First Solar, 2020b). Today, First Solar’s global manufacturing capacity for CdTe thin film
PV modules is approximately 6.0 GW/year, with 5.5 GW/year of manufacturing capacity for its newest
Series 6 modules in three facilities in Vietnam, Malaysia, and Perrysburg, OH (First Solar, 2020). The
scale of CdTe thin film PV manufacturing is expected to grow. While the future scale of the PV market
is uncertain, First Solar currently anticipates expanding its manufacturing capacity to ~8 GW/year by
the end of 2021 (First Solar, 2020b). If thin film retains a similar market share of global solar
installations over the next few decades, total cumulative installations of CdTe thin film PV could reach
several hundred GW or more.
Our intention in this report is to review the most important developments in solar energy in
recent years, with an emphasis on CdTe thin film technologies. Outstanding results have been
achieved by many contributors and in many countries. A complete overview of existing literature
(Google Scholar lists close to 3,000,000 publications on solar energy, 750,000 alone in the last four
years) is beyond our scope. Our approach was to select examples that we believe illustrate and are
representative of the developments and discussions currently ongoing. This selection was subjective

14
and with a focus on the United States. The omission of studies from this report should in no way be
interpreted as a comment on their quality. For example, when discussing energy transition scenarios,
we briefly describe efforts in Australia and in California. Australia and California both have a long
tradition in solar energy development and have recently developed exemplary integrative
infrastructure concepts. Yet, equally detailed transition scenarios now exist for many regions and
countries around the world. We kindly ask the reader to bear this in mind.
A - The Contribution of Photovoltaics to the Energy Transition
Between 1998 and 2015, the cumulative photovoltaics installation capacity has grown
between 20% and 72% annually, with a compound growth rate of about 40%. This makes PV the
fastest growing renewable energy technology. However, most projections and scenarios of PV
deployment have consistently underestimated this growth (Creutzig et al., 2017). For example, the
International Energy Agency (IEA) predicted annual growth rates of between 16% and 30% between
1998 and 2010. The 2012 World Energy Outlook ‘new policies’ scenario predicted 32% annual growth
until 2015 but anticipated a too small growth rate of 12% for the following five years. Transformation
scenarios by the German Advisory Council on Global Change (WBGU) estimated the growth rate to be
26%, and even the most advanced scenarios fall below reality with expected growth between 24% and
32%. The different scenarios, as well as the actual growth of PV are shown in Figure 1, illustrating the
fact that every projection has consistently fallen short of the pace of actual solar growth.
Figure 1. PV Growth Over 20-Year Period
Figure 1. Top left - PV growth rate over 20 years. Lower left - real capacity over time (red) compared to
various scenario projections. Shown are year to year data from past developments until 2016. Right -
comparison of projections to historic growth rate (Creutzig et al., 2017).

15
The discrepancy between actual deployment and model-based predictions is attributed to
biases in the models, with three factors being especially important: underestimates of the fast
technological learning that has occurred in the PV industry, changes in policy support for PV, and
increasing costs for competing technologies. PV technology has experienced exceptional technological
learning. Module costs, in accordance with what is sometimes called Swanson’s Law, have decreased
by 22.5% for every doubling of installed capacity. Underestimating the learning rates, as well as the
rapid capacity expansion, have both contributed to modelling errors. In addition, cost reductions in PV
technology have helped transform it from an expensive option to one that is on par or even less
expensive than traditional electricity sources, expanding the customer base. Learning curves are
expected to continue in the future (Creutzig et al., 2017). By 2030, for example, projections suggest
that solar energy may be the lowest cost energy source in most global markets, including being less
expensive than the marginal costs of operating existing combined cycle thermal power plants
(McKinsey, 2019).
Policy support has also had a significant impact on the success of PV. One example of policy
is the use of feed-in tariffs, which have accelerated growth in some markets following their
introduction. In Germany, feed-in tariffs contributed to a 400-fold growth in installed capacity between
2000 and 2016 (Creutzig et al., 2017). Important features of the German feed-in tariff were a
streamlined permitting procedure and guaranteed remuneration over a long time period (20 years),
making PV a low-risk investment. In addition, the technology enjoyed broad societal and public
acceptance, with adopters willing to pay up to a 20% premium on electricity generated via PV modules.
These factors are often left out of models of the electricity market, which typically minimize system
cost and design the energy mix accordingly. Only stylized policies, like carbon pricing, are typically
considered, and often projections are made using existing policies only. Personal preferences and
technology-specific policies are typically neglected, resulting in a failure to capture these effects in
growth predictions. In addition, models overestimated the impact of carbon capture and storage or
nuclear power, technologies that can compete with the growth of renewables (Creutzig et al., 2017).
Creutzig et al. (2017) present their own growth model, attempting to correct for some of these
discrepancies. They predict a share of 30% to 40% of PV in the electricity mix by 2050, even if sectors
continue to electrify. They conclude:
Reaching a solar economy would require policymakers and society to
overcome organizational and financial challenges in the next decades but
would then offer the most-affordable clean energy solution for many.
Continuing to underestimate the role of solar risks squandering this
opportunity.

16
B - Transition Scenarios
As more and more regions of the world, as well as individual companies and cities, commit to
carbon neutrality, a number of initiatives have begun to develop longer-term scenarios for the
transition to carbon free electricity generation. Briefly, two such scenarios are discussed here. These
scenarios are meant to be illustrative, only, reflecting a much larger pool of efforts currently underway
to identify and develop pathways for achieving long-term energy transitions for specific localities or
organizations. In both cases, as with many other similar efforts worldwide, the studies project large
new additions of solar energy in the coming decades.
I.B.1 - Decarbonizing California
California is a leader in the solar energy transition in the U.S. With the passage of Senate Bill
100, California has committed to targets of 60% renewable electricity by 2030 and 100% carbon-free
electricity by 2045 (2018). The California electric utility, Southern California Edison, has developed
the Clean Power and Electrification Pathway as an integrated approach to reduce greenhouse gas
emissions and air pollution and create a future low-carbon economy, including electricity generation,
transportation and buildings (Southern California Edison 2017). They plan to further develop state
policies and explore new measures to find cost-effective and practical ways to significantly reduce
emissions, reach defined climate goals, and generate new jobs. Goals include the installation of
increasingly energy efficient buildings with electrified space and water heaters, an electric grid that is
80% carbon free and the adoption of more than 7 million electric vehicles, all by 2030. Figure 2
summarizes these measures and shows that the objective is to reduce the overall carbon footprint of
the California economy by 40% compared to 1990 in 2030, and by 80% in 2050.
Figure 2. Decarbonize California Projections

17
Figure 2. Illustration of California’s clean power and electrification pathway (Southern California Edison,
2017).
The plan includes the future installation of an additional 30 GW of renewable energy
generation capacity and 10 additional GW of storage from fixed and mobile sources. The plan is to
support these resources with large hydroelectric generators. Achieving the goals set for 2030 are seen
as a starting point to achieve the even deeper carbon emission goals set for 2050. While the initial
period will be dominated by a shift to renewable electricity, later measures will more strongly focus on
further decarbonizing the transportation sector, buildings, and industrial energy consumption.
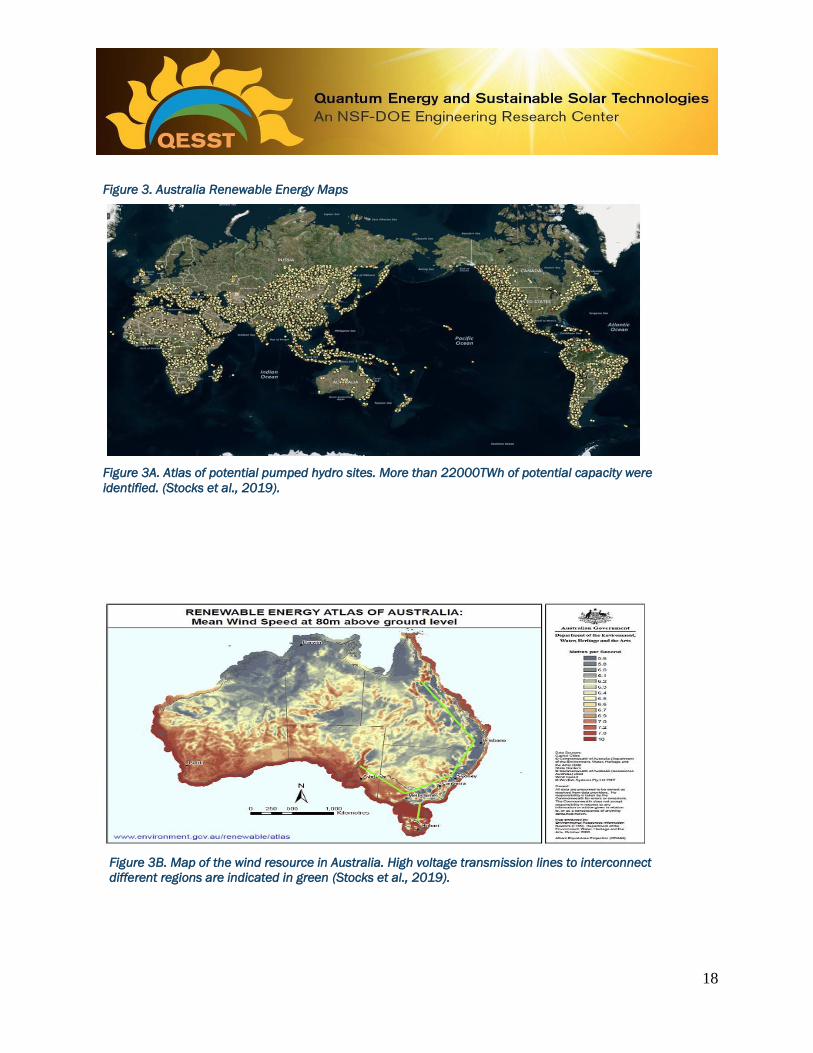
I.B.2 - 100% Renewables in Australia
In a series of papers, A. Blakers and colleagues from the Australian National University (ANU)
describe a scenario that supports 100% renewable electricity for Australia (Blakers 2017, Blakers et
al. 2017). They present simulated results using an hourly energy balance model of the Australian
National Electricity Market (ANEM), assuming a scenario with 100% renewable electricity. The lion’s
share of the generation is provided by wind and photovoltaics (about 90%), with biomass and
hydroelectricity providing the balance of required energy. They assume that wind and solar generation
are distributed over the Australian landmass to average out variations in weather patterns and to
reduce the need for storage (see Figure 3B). Meeting this assumption would require a significant
expansion of high-voltage interconnection power lines between regions, as well as adding electricity
storage. These measures are also necessary to support grid stability. To provide storage, the study
concentrates on pumped hydro, which currently accounts for 97% of the worldwide stationary installed
storage capacity. The study includes estimates of the unused pumped hydro potential in Australia. The
authors later extended this investigation to provide a map of potential pumped hydro sites in the world
(Figure 3A). The additional cost to support the projected renewable energy supply is estimated at
AU$25-30/MWh (corresponding to US$19-23/MWh). LCOE is estimated at AU$93/MWh
(US$70/MWh) and is estimated to fall over time.
18
Figure 3. Australia Renewable Energy Maps
Figure 3A. Atlas of potential pumped hydro sites. More than 22000TWh of potential capacity were
identified. (Stocks et al., 2019).
Figure 3B. Map of the wind resource in Australia. High voltage transmission lines to interconnect
different regions are indicated in green (Stocks et al., 2019).

19
Achieving the goals set for 2030 are seen as a starting point to
achieve the even deeper carbon emission goals set for 2050.
While the initial period will be dominated by a shift to renewable
electricity, later measures will more strongly focus on further
decarbonizing the transportation sector, buildings, and
industrial energy consumption.

20
II - PV PERFORMANCE
PV deployment is growing rapidly. To achieve the high solar PV capacities needed to reduce
carbon emissions from the energy sector significantly and create a low-carbon economy, however, will
require significant continued growth, as highlighted above. One of the core questions is what the
conditions are for the PV industry to be able to scale sufficiently rapidly to meet global PV targets.
Central to that challenge is the need to continue to advance the performance of PV technologies
coming off the manufacturing line.
Needleman et al. (2016) used the Paris climate goals to estimate a PV deployment target of
more than 10TW by 2030, about 20 times the total installed PV capacity at the end of 2018. To achieve
this installed capacity, the study emphasizes that manufacturing capacity needs to scale accordingly
and explores the requirements for achieving this goal.
The study explores multiple scenarios through which the PV industry might scale its
manufacturing capacity. The scenarios explored include simply scaling current PV manufacturing,
raising additional debt, and including new technological innovations (e.g., reduced variable costs and
increased module efficiencies) (Needleman et al., 2016). The results for different scenarios are
summarized in Figure 4.
Figure 4. Projected PV Installation 2016-2030
Figure 4. Projection for cumulative PV installation over time for a number of scenarios: baseline
technology (light blue), line-of-sight technology innovations (red), an advanced concept with improved
efficiency (16% to 24% module efficiency), an advanced concept focusing on reduced variable costs
(green), and line of sight improvements with an additional increase in debt to equity ratio of 5:1
(Needleman et al., 2016).
21
The authors find that, currently, the PV industry is not capable of scaling fast enough on its
own. With existing manufacturing capacity (light blue line), the installed PV capacity by 2030 would fall
significantly below 2TW (Needleman et al., 2016). Line-of-sight innovation (red line) would improve the
potential to meet the Paris goals—between 3 and 4TW PV could be installed by 2030—but this would
still not suffice to reach the needed manufacturing capacity. One way to accelerate growth is to
increase debt (yellow). This strategy is initially efficient and allows the fastest growth rates of any
scenario. In later years, however, interest payments slow the ability of companies to grow, and growth
stagnates. In the shown scenario, a debt to equity ratio of 5:1 was used, and a cumulative capacity of
just above 4TW was reached. The most efficient ways to improve growth that the authors identified
were technological advancements. One scenario used a reduced variable cost (green), which can be
accomplished, for example, by using much thinner wafers and advanced module concepts (the
scenarios were developed for silicon). This scenario achieved more than 6TW cumulative installation.
A further improvement in efficiency (from 16 to 24%) resulted in the highest installation level – more
than 11TW. It should be noted, though, that the models assume that innovation here benefits profit
margins that are used to scale manufacturing; they do not prioritize a reduction in selling price.
The study highlights the crucial role of continuing innovation in the PV industry to create the
conditions to supply enough modules to achieve the deployment targets necessary to create a low-
carbon economy. Improving efficiency and reducing material and module costs, traditionally targets of
PV research, are confirmed to be the right topics. The study also warns that the accumulation of debt,
a practice observed with many PV companies in their battle for market shares, while helpful in the
short term, may become a serious issue for the ability of companies to continue to expand
manufacturing capacity in the future.
A - Technology Roadmap
PV technology has seen a tremendous increase in installations, with more than 0.5 TW of
cumulative capacity installed today. The market is dominated by wafer-silicon technology (multi- and
mono-crystalline silicon), which have seen extraordinary growth rates. Thin-film technologies utilize
glass or other substrate materials to directly deposit compound semiconductors such as CdTe and
copper indium gallium diselenide (CIGS), instead of silicon wafers. Thin-film technologies, particularly
CdTe, have also benefited from rapid growth in the PV industry. Market share for thin-film technologies
has decreased since 2009 (Figure 5A), despite overall production having ramped up significantly
(Figure 5B). The reason for the comparably small market share is the immense scaling of silicon PV
production following the embrace of this technology by Chinese solar manufacturers. In 2017, thin-
film technologies garnered approximately 4.5% of the global PV market, with CdTe securing over 2%.
As of 2017, annual production of CdTe was just 2.5 GW per year. In 2019, CdTe manufacturing grew
significantly, to nearly 6 GW/year of CdTe PV modules, more than doubling its prior peak production
capacity from 2016, and it is set to continue to grow rapidly in the next few years.

22
Figure 5. Thin-film PV Market Share and Production
Figure 5A. Market share of thin-film PV technologies (Fraunhofer, 2019).
Figure 5B. Module production of thin-film PV technologies (Fraunhofer, 2019).
II.A.1 - Efficiency
The power conversion efficiency, measured under standard testing conditions, remains the
most significant factor of merit for photovoltaic technologies. The significance of this factor lies in the
sensitivity of most other metrics to efficiency. Improving efficiency (without increasing cost, and ideally
while also decreasing cost) is the most effective technological way to reduce the costs of a module

23
and the levelized cost of electricity (as measured in $/W) (Powell et al., 2012; Powell et al., 2013).
Figure 6 shows that improving module cost is most sensitive to gains in the efficiency of PV modules,
and efficiency has the highest potential for cost savings overall. These results were derived for silicon
but can be qualitatively transferred to CdTe as well.
Figure 6. Sensitivity Map for 2012 Cost Structure
Figure 6. Sensitivity map of the cost structure for silicon solar cells. The analysis emphasizes the role of
improving efficiencies in reducing costs. Module cost is most sensitive to changes in efficiency, and
improving efficiency has also the overall highest potential for cost savings (Powell et al., 2013).
The state of the art for CdTe cell and module efficiencies, according to the NREL (2020)
efficiency charts, is shown in Figure 7. The efficiency record for a lab-made solar cell (0.5 cm2) is
22.1%. Since 2010, this number has steadily increased ~15%, with First Solar having contributed the
majority of world records since then, including the most recent. Lab-based efficiencies demonstrate
the potential of a technology but are not representative for what can be realized in a manufactured
module. Scaling of cells to module areas induces additional loss mechanisms for all key metrics
(current, voltage, and fill factor). The current world record efficiency for a CdTe module is 19.0% (Green
et al., 2019) for a First Solar module with an area of 2.4 m2. Also, this number has steadily increased
from about 10% in 2010, with First Solar being the only contributor since 2012.

24
Figure 7. CdTe PV Efficiency Record for Solar Cells and Modules
Figure 7. Development of cell (dots) and module (triangle) record CdTe PV efficiencies over the past
30 years. First Solar’s contributions are marked by darker shades (National Renewable Energy
Laboratory, 2019).
A comparison of efficiencies between CdTe and other technologies is shown in Figure 8 and
Table 1 (Fraunhofer, 2019). Table 1 was adapted for this report, using data from multiple sources
(Green et al., 2019; Geisthardt & Topic, 2015). Note that Figure 8 only considers cells with an area in
excess of 1cm2, and the highest efficiency value for a CdTe solar cell with this area is given as 21.0%,
whereas the record efficiency for a smaller cell is 22.1% (both First Solar). All major technologies are
included that contribute to utility and residential PV applications. These technologies are mono-
crystalline silicon, multi-crystalline silicon, CIGS and CdTe. We also include one upcoming technology:
perovskites. There are currently no perovskite module manufacturers selling products, and this
technology is still resolving stability issues.

25
Figure 8. PV Efficiency Comparison
Figure 8. Comparison of state-of-the-art research cell and module efficiencies for a variety of different PV
technologies (Fraunhofer, 2019).
In 2019, CdTe manufacturing grew significantly, to nearly 6 GW/year of
CdTe PV modules, more than doubling its prior peak production capacity
from 2016, and it is set to continue to grow rapidly in the next few years.
26
In a direct comparison, cell and module efficiencies for CdTe are slightly below the values
achieved for the other technologies – a disadvantage that is compensated by the lower fabrication
cost of CdTe modules, as will be shown later. The highest efficiency value achieved for any single-
junction solar cell under non-concentrated light is 28.8% for GaAs. The most advanced silicon solar
cells have achieved 26.7%, multi-crystalline silicon – the most widely installed technology – have
achieved efficiencies of 22.3% and CIGS cells have achieved 22.9%. The most efficient advanced
silicon PV module has achieved 24.4% efficiency, multi-crystalline silicon 19.9%, and CIGS 19.2%.
CdTe has currently achieved 19.0%.
A look at some of the key solar cell characteristics reveals the future potential avenues for
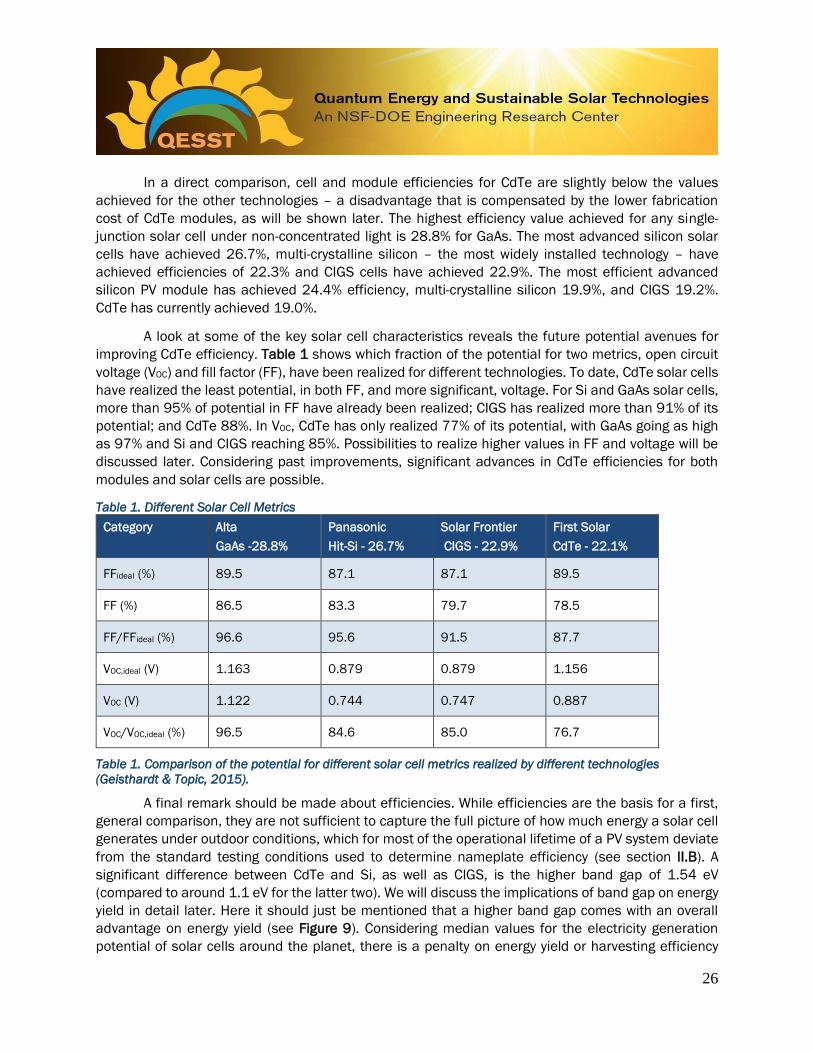
improving CdTe efficiency. Table 1 shows which fraction of the potential for two metrics, open circuit
voltage (VOC) and fill factor (FF), have been realized for different technologies. To date, CdTe solar cells
have realized the least potential, in both FF, and more significant, voltage. For Si and GaAs solar cells,
more than 95% of potential in FF have already been realized; CIGS has realized more than 91% of its
potential; and CdTe 88%. In VOC, CdTe has only realized 77% of its potential, with GaAs going as high
as 97% and Si and CIGS reaching 85%. Possibilities to realize higher values in FF and voltage will be
discussed later. Considering past improvements, significant advances in CdTe efficiencies for both
modules and solar cells are possible.
Table 1. Different Solar Cell Metrics
Category Alta
GaAs -28.8%
Panasonic
Hit-Si - 26.7%
Solar Frontier
CIGS - 22.9%
First Solar
CdTe - 22.1%
FFideal (%) 89.5 87.1 87.1 89.5
FF (%) 86.5 83.3 79.7 78.5
FF/FFideal (%) 96.6 95.6 91.5 87.7
VOC,ideal (V) 1.163 0.879 0.879 1.156
VOC (V) 1.122 0.744 0.747 0.887
VOC/VOC,ideal (%) 96.5 84.6 85.0 76.7
Table 1. Comparison of the potential for different solar cell metrics realized by different technologies
(Geisthardt & Topic, 2015).
A final remark should be made about efficiencies. While efficiencies are the basis for a first,
general comparison, they are not sufficient to capture the full picture of how much energy a solar cell
generates under outdoor conditions, which for most of the operational lifetime of a PV system deviate
from the standard testing conditions used to determine nameplate efficiency (see section II.B). A
significant difference between CdTe and Si, as well as CIGS, is the higher band gap of 1.54 eV
(compared to around 1.1 eV for the latter two). We will discuss the implications of band gap on energy
yield in detail later. Here it should just be mentioned that a higher band gap comes with an overall
advantage on energy yield (see Figure 9). Considering median values for the electricity generation
potential of solar cells around the planet, there is a penalty on energy yield or harvesting efficiency

27
(i.e. the average efficiency of the solar cell under outdoor operation) that is roughly linear with band
gap. Comparing CdTe and Si on this account, lab-measured efficiencies of Si solar cells should be
reduced by 1.4% to better account for outdoor conditions, whereas CdTe solar cell efficiencies should
only be reduced by 0.2% (Peters & Buonassisi, 2018). This would bring module efficiencies of CdTe,
CIGS and multi-crystalline silicon very close together.
Figure 9. Band Gap Comparison
Figure 9. Upper - Comparison of standard testing condition efficiency ɳSTC and harvesting efficiency ɳ
h for different solar cell technologies in the radiative limit as a function of band gap. Lower - The
difference between the two efficiency metrics is plotted, revealing a roughly linear relation between
the efficiency penalty for outdoor operation and the band gap of a solar cell. As a consequence,
standard testing condition efficiencies benefit cells with a smaller band gap. In outdoor operation,
performance losses for higher band gap cells are smaller than and result in a better performance
ratio when compared to STC ratings (Peters & Buonassisi, 2018).
II.A.2 - Module Cost
A second important metric is the cost of the module. Typically, this cost is measured in $/W
and combines the power generated by the module (W) with the cost to produce a module ($). The
reduction of this metric ($/W) in PV over the past decades is unique in the history of energy
technologies. A 29% reduction in cost for every doubling in installed capacity has been observed for
silicon solar cells, and a 25% reduction for thin-film technologies. Reminiscent of Moore’s Law for
semiconductors, this development is sometimes referred to as “Swanson’s Law”. Module prices
between 2006 and 2017 are shown in Figure 10. The total installed capacity in 2017 was 405GW for
c-Si technology and 33GW in thin-film modules (about half of which are CdTe PV modules).

28
Figure 10. Decrease in PV Module Pricing
Figure 10. Learning rates for thin-film (green) and crystalline silicon technology (blue) for the time between
Q2 2006 and Q1 2017 (Fraunhofer, 2019).
Traditionally, thin-film technologies have been able to produce modules at a lower $/W price
than crystalline silicon technology, due to the relatively low energy and material requirements of thin
film PV manufacturing. In recent years, however, strong competition among silicon PV manufacturers
in China, with a focus on capturing market share, has resulted in the sale of some silicon modules at
extremely low prices, especially in conventional multi-crystalline aluminum back surface field (Al-BSF)
technology. The fact that the industry transitioned from BSF to passivated emitter and rear cell (PERC)
and, to some extent, from multi-crystalline to mono-crystalline manufacturing may be an additional
factor. Manufacturers have closed or phased out old manufacturing lines which is accelerating the
transition away from this out-of-date technology (Al-BSF). Figure 11 shows the U.S. and global average
selling prices for silicon PV technologies (NREL, 2019).

29
Figure 11. PV Module Pricing
Figure 11. U.S. and global average selling prices for different crystalline silicon (c-Si) PV technologies
(NREL, 2019).
II.A.3 - Levelized Cost of Energy (LCOE)
A third relevant metric is the levelized cost of electricity (LCOE). This metric describes the price
at which a PV installation is able to generate electricity over its lifetime. In addition to efficiency and
module cost, this metric also considers balance of system (BOS) costs, as well as costs for installation
and maintenance and the impacts of module degradation on electricity generation by the module as
time progresses. LCOE uses a net present value calculation to assess the average cost of electricity
incorporating all occurring costs over the lifetime of the PV system.
PV electricity has undergone dramatic cost reductions that have turned it from one of the most
expensive forms of electricity to one of the cheapest. An analysis by Lazard (2019) shows this
development in Figure 12 (2019).

30
Figure 12. Levelized Cost of Energy Comparison
Figure 12. Unsubsidized LCOE for different electricity generators between 2009 and 2019 (Lazard, 2019).
When considering unsubsidized LCOE, solar and wind fare better than any other source of
electricity. Notably, thin film solar PV with 32-42 $/MWh is slightly cheaper than crystalline silicon PV
with 36-44 $/MWh in this analysis (Lazard, 2019). Wind generates the lowest value with 28-54
$/MWh, and gas combined cycle is also at a very low value with 44-68 $/MWh (Figure 13). A large
part of the reason for the low LCOE of renewable energy technologies is their rapidly declining capital
costs, in comparison to traditional energy technologies (Figure 13).

31
Figure 13. Levelized Cost and Capital Cost Comparison
Figure 13A. Analysis of the unsubsidized LCOE for various electricity generating technologies. The analysis
shows that solar PV and wind are cost-competitive with conventional generation technologies.
Figure 13B. In some instances, the capital costs of renewable energy generation technologies have
converged with those of certain conventional generation technologies, which coupled with improvements in
operational efficiency for renewable energy technologies, have led to a decrease in LCOE (Lazard, 2019).

32
II.A.4 - Energy Payback Time
A fourth relevant metric is energy payback time. Investigations of energy payback time
generally mirror the results for the carbon footprint (see later in the report, section IV). The smaller
energy intensity of fabricating a CdTe PV module compared to a silicon module, in combination with
relatively high conversion efficiencies results in faster energy payback times. Whereas the carbon
footprint critically depends on the carbon intensity of the electricity used in the fabrication process,
the energy payback time is solely defined by the amount of energy required to manufacture the module
and the amount of energy produced by the system. The latter varies with the solar cell resource, which
is location dependent, due to, among other things, the cosine factor of solar insolation and variations
in air mass.
Figure 14. Africa and Europe Energy Payback Map
Figure 14. Standard (upper row) and non-renewable (lower row) energy payback time of different photovoltaic
technologies (Louwen et al., 2017).
A study by Louwen et al. shows the energy payback time for several PV technologies as a
function of location for Africa, Europe and the Middle East, Figure 14 (2017). The authors distinguish
between energy payback time (EPBT, upper row) and non-renewable EPBT (lower row). The difference
between the two lies in the assumption about what type of electricity production is replaced by a newly
installed PV system: the current mix of electricity, including all renewable and non-renewable sources
(conventional EPBT) or just non-renewable sources (non-renewable EPBT). The difference between the
total and non-renewable EPBT depends on the penetration level of renewable electricity sources. In
33
countries with very high shares of renewable energy (mainly hydropower) like Norway, there will be a
big difference between the two, while at low penetration levels of renewable electricity, the difference
will be small.
In either case, CdTe has the lowest EPBT of all investigated technologies, with values below
0.5 years in many locations, especially on the African continent, but also in some southern European
countries, where irradiance levels are similar to the U.S. Variations in EPBT are due to the calculation
method which considers each country’s average grid efficiency. Countries with high shares of
renewable electricity (especially hydropower) and with high primary energy to electricity conversion
efficiency show high non-renewable payback times.
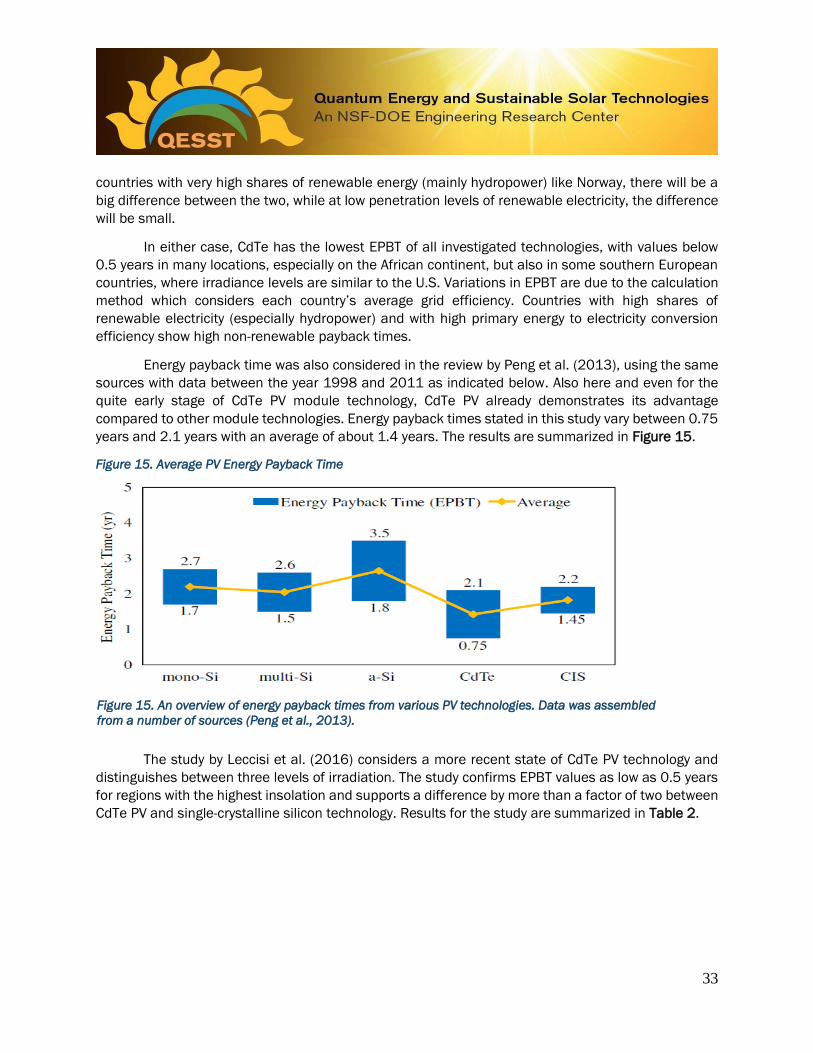
Energy payback time was also considered in the review by Peng et al. (2013), using the same
sources with data between the year 1998 and 2011 as indicated below. Also here and even for the
quite early stage of CdTe PV module technology, CdTe PV already demonstrates its advantage
compared to other module technologies. Energy payback times stated in this study vary between 0.75
years and 2.1 years with an average of about 1.4 years. The results are summarized in Figure 15.
Figure 15. Average PV Energy Payback Time
Figure 15. An overview of energy payback times from various PV technologies. Data was assembled
from a number of sources (Peng et al., 2013).
The study by Leccisi et al. (2016) considers a more recent state of CdTe PV technology and
distinguishes between three levels of irradiation. The study confirms EPBT values as low as 0.5 years
for regions with the highest insolation and supports a difference by more than a factor of two between
CdTe PV and single-crystalline silicon technology. Results for the study are summarized in Table 2.

34
Table 2. Energy Payback Comparison
GRID EFFICIENCY () SC-SI PV MC-SI PV CDTE PV CIGS PV
1000 KWH/(M2 YR) (=0.3) 2.8 2.1 1.1 1.9
1700 KWH/(M2 YR) (=0.3) 1.6 1.2 0.6 1.1
2300 KWH/(M2 YR) (=0.3) 1.2 0.9 0.5 0.8
Table 2. Energy payback time (yr) for various PV technologies and under various insolation conditions and
grid efficiencies (Leccisi et al., 2016).
B - Hot and Humid Climates
Solar cells react to the environments in which they are placed, including temperature and
humidity, and cells made of different materials react differently to their operating conditions and
environmental contexts. These differences can have a significant impact on the amount of energy
produced by different kinds of solar cells. Generally, materials with a higher band-gap are less sensitive
to operating conditions, where the band gap of a semiconductor is the minimum energy required to
excite an electron from its bound state into a free state where it can participate in conduction.
Compared to silicon, the reduced sensitivity of CdTe to elevated temperatures or to the impact of
humidity on the light available to the PV module (technically referred to as light extinction) provides
CdTe thin film modules with an advantage, especially when operating in hot and humid climates. The
result is an improved relative performance and higher comparable energy yield, defined as the total
energy output from an installed solar module.
II.B.1 - Impact of Temperature
The impact of temperature on PV system performance is well documented (Nishioka et al.,
2003; Woyte et al., 2013; Ye et al., 2013; Reich et al., 2012). The impact of temperature is also
developed in predictive models (King et al., 2004; Veldhuis et al., 2015; Sandia National Laboratories,
2020). The solar-cell output voltage and current generation are affected via temperature and
materials-specific factors (the kT dependence of Boltzmann statistics and materials-specific band gap
narrowing or widening), as well as device-architecture specific factors (Peters et al., 2018). Figure 16
shows how the radiative efficiency of several PV materials changes as a function of temperature.
Figure 16 directly compares the temperature dependence of performance ratios of state-of-the-art
CdTe and PERC-type silicon PV modules as a function of temperature. This function is often linearly
approximated, and the slope is called the power temperature coefficient.
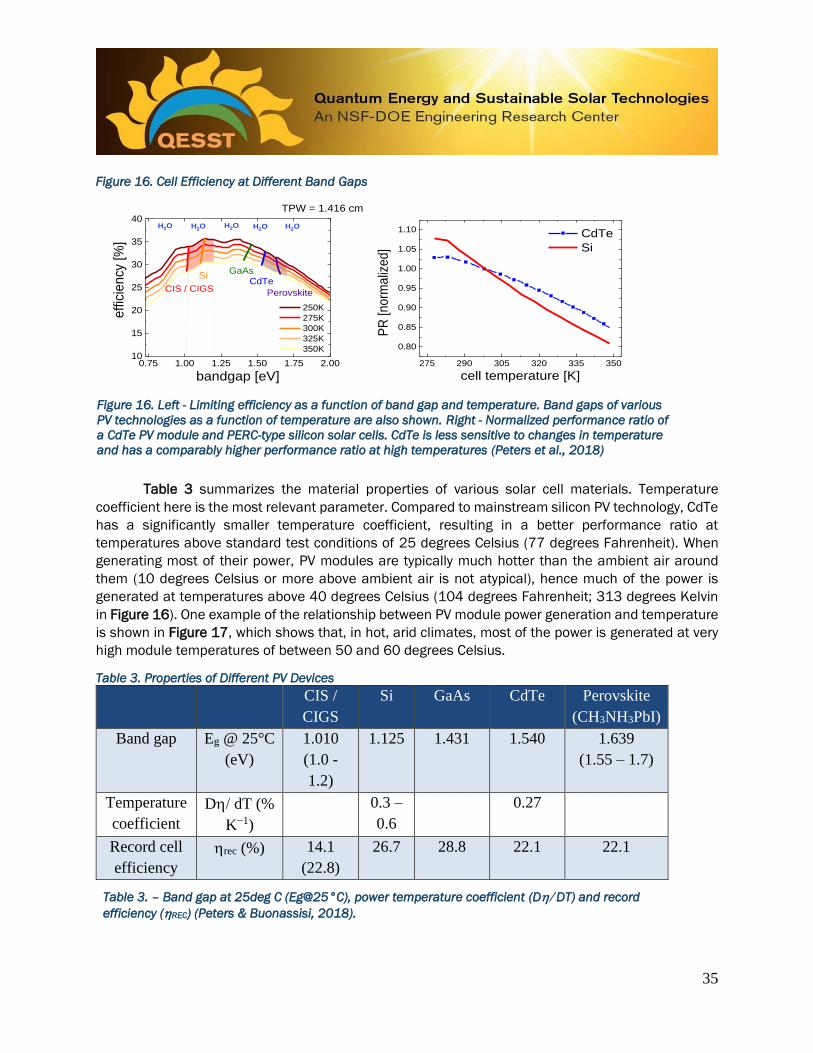
35
Figure 16. Cell Efficiency at Different Band Gaps
0.75 1.00 1.25 1.50 1.75 2.0010
15
20
25
30
35
40TPW = 1.416 cm
H2O H2O H2O H2O
Perovskite
CdTeSi
GaAs
CIS / CIGS
250K
275K
300K
325K
350K
eff
icie
ncy
[%
]
bandgap [eV]
H2O
275 290 305 320 335 350
0.80
0.85
0.90
0.95
1.00
1.05
1.10
PR
[norm
aliz
ed]
cell temperature [K]
CdTe
Si
Figure 16. Left - Limiting efficiency as a function of band gap and temperature. Band gaps of various
PV technologies as a function of temperature are also shown. Right - Normalized performance ratio of
a CdTe PV module and PERC-type silicon solar cells. CdTe is less sensitive to changes in temperature
and has a comparably higher performance ratio at high temperatures (Peters et al., 2018)
Table 3 summarizes the material properties of various solar cell materials. Temperature
coefficient here is the most relevant parameter. Compared to mainstream silicon PV technology, CdTe
has a significantly smaller temperature coefficient, resulting in a better performance ratio at
temperatures above standard test conditions of 25 degrees Celsius (77 degrees Fahrenheit). When
generating most of their power, PV modules are typically much hotter than the ambient air around
them (10 degrees Celsius or more above ambient air is not atypical), hence much of the power is
generated at temperatures above 40 degrees Celsius (104 degrees Fahrenheit; 313 degrees Kelvin
in Figure 16). One example of the relationship between PV module power generation and temperature
is shown in Figure 17, which shows that, in hot, arid climates, most of the power is generated at very
high module temperatures of between 50 and 60 degrees Celsius.
Table 3. Properties of Different PV Devices
CIS /
CIGS
Si GaAs CdTe Perovskite
(CH3NH3PbI)
Band gap Eg @ 25°C
(eV)
1.010
(1.0 -
1.2)
1.125 1.431 1.540 1.639
(1.55 – 1.7)
Temperature
coefficient
D dT (%
K−1)
0.3 –
0.6
0.27
Record cell
efficiency
rec (%) 14.1
(22.8)
26.7 28.8 22.1 22.1
Table 3. – Band gap at 25deg C (Eg@25°C), power temperature coefficient (D DT) and record
efficiency (REC) (Peters & Buonassisi, 2018).

36
A smaller temperature coefficient offers a significant advantage for a PV technology in hot
climates. It should be noted, though, that temperature coefficients are not only linked to materials, but
also depend on the architecture of the solar cell. In general, solar cells with a higher voltage have a
smaller temperature coefficient. Typical values for silicon are in the range of -0.45%/K; for CdTe values
are around -0.27%/K. The very best silicon solar cells, heterojunction (or commonly called HIT cells),
however, generate much higher voltages than conventional silicon solar cells (up to 750mV at open
circuit) and can have temperature coefficients as low as -0.3%/K. Further improving the voltage of
CdTe solar cells should also reduce the temperature coefficient.
Figure 17. PV Module Temperature Range
Figure 17. Insolation and module temperature in a hot and arid sub-tropical environment. The
majority of the power is generated at module temperatures between 50°C and 60°C (Peters et al.,
2018).
II.B.2 - Impact of Water Vapor
In addition to temperature effects, also the impact of spectral variation on CdTe modules, and
their differences to silicon, are well documented. Spectral effects occur because different agents in
the atmosphere absorb light predominantly in certain spectral ranges. Water, a main contributor to
the shape of ground reaching solar radiation, is more dominantly active in the infrared, while aerosols
are mostly active in the blue. These absorptions result in changes of the percentage of available
photons that can be absorbed by a solar cell. A small band gap cell like silicon will see a larger relative
reduction in power for high atmospheric water concentrations than a larger band gap cell like CdTe.
The reverse is true for aerosols.
Higher levels of humidity or water vapor in the atmosphere, sometimes referred to as
precipitable water, reduces the amount of sunlight that reaches the solar module as it passes through
the atmosphere. Water blocks or extinguishes light through absorption or scattering. Water absorption
is not equally distributed over all wavelengths of sunlight, but rather is concentrated in a number of

37
discrete bands called absorption bands. These absorption bands are indicated in Figure 17 as blue
bars and marked with H2O. Figure 18 shows how the limiting efficiency of solar cell as a function of
band gap of the solar cell material changes with increasing amounts of water in the atmosphere. It
can be seen that, whenever one of the blue bars is crossed, efficiency is reduced. Because silicon has
a smaller band gap (1.12 eV) than CdTe (1.54eV), silicon absorbs a wider range of photons, and light
that Si can use is affected by more absorption bands. Consequently, as the water content in the
atmosphere increases, the light intensity that can be used by silicon modules to create electricity is
reduced more strongly than for CdTe. The greater sensitivity of silicon compared to CdTe is also shown
in Figure 18.
Figure 18. Precipitable Water and Band Gap Effects on Efficiency
0.75 1.00 1.25 1.50 1.75 2.0010
15
20
25
30
35
40
0 cm
1cm
3cm
6cm
12cm
effic
iency [
%]
bandgap [eV]
H2OH2O H2O H2O H2O
T = 298.15 K
CIS / CIGS
SiGaAs
CdTe
Perovskite
0 3 6 9 120.80
0.85
0.90
0.95
1.00
PR
[n
orm
aliz
ed
]
precipitable water [cm]
CdTe
Si
Figure 18. Left - Limiting efficiency as a function of band gap and total precipitable water. Band gaps
of various PV technologies are also shown. Right - Normalized performance ratio of a CdTe PV module
and a PERC type silicon solar cells as a function of total precipitable water (Peters et al., 2018)
The sensitivity to water is specific to a solar cell band gap, which is defined by its absorber
material. Higher band gap materials are principally less sensitive to water vapor in the atmosphere
than lower band gap materials. All higher band gap materials consequently have an advantage over
silicon in areas with high humidity. Because this advantage is tied to the absorbed band gap, there
are also no technological means by which lower band gap materials could compensate. In temperate
climates, the total precipitable water (i.e. the total water content of the atmosphere when condensed
into a column) is typically below 2cm. In the tropics, values can be as high as 12cm, and the
corresponding performance difference between silicon and CdTe can exceed 10%.
Analysis by First Solar (Figure 19) shows how spectral variations influence the energy yield of
CdTe PV modules compared to silicon PV modules (Lee et al., 2015). Because of the generally greater
atmospheric water content in parts of the tropics and subtropics, CdTe has a performance advantage
in these regions. The effect was named “spectral gain” and describes the relative gain in energy yield
when compared to yield based on a single, standard spectrum (typically called the AM1.5 spectrum).

38
Figure 19. Spectral Response Maps
A) United States
B) South Africa
C) India
D) Japan
Figure 19. Irradiance rated spectral gain in energy yield for the First Solar series 4-2 module in different
regions of the world (Lee et al., 2015).
A note on PV module characterization – Testing and certification of PV
modules is done under so called Standard Testing Conditions. These
conditions include one particular temperature (25deg C), a specific
spectrum (AM1.5g), and one specific light intensity (1000W/m2). To
account for deviations of these conditions, typically corrections are
applied. The already mentioned temperature coefficient is one of these
corrections, and allows projecting performance at varying temperatures.
Spectral effects have long been neglected. One reason is that variations in
the spectral shape alone have little consequence when only silicon solar
cells are considered, and silicon PV has dominated utility installations for a
long time. Yet, if two PV technologies with different band gaps are
compared, spectral correction becomes necessary. For this reason, First
Solar and others have introduced spectral correction factors that need to
be applied to arrive at the correct energy yield for CdTe PV modules. The
above shown spectral gain is a consequence of this.

39
II.B.3 - Impact of Aerosols
Similar to water, aerosols in the atmosphere also extinguish light through absorption and
scattering. One difference between aerosols and water is the spectral range in which they are active.
While water extinguishes light in bands, many of which are located in the infrared, aerosols
predominately affect blue, short wavelength light. As CdTe absorption is constrained to shorter
wavelengths than silicon, it is relatively more affected by aerosols. Note that this argument refers to
aerosols in the atmosphere and not to soiling. The situation for soiling is different and is determined
by module architecture rather than solar cell material.
A study by MIT indicates that CdTe modules are affected more strongly by atmospheric
aerosols (Peters & Buonassisi, 2018). In areas with high pollution, especially cities like Delhi or
Shanghai, CdTe PV modules have a disadvantage over silicon for this reason (see Figure 20).
Figure 20. Aerosol Impacts
A) Aerosol Related Flux Attenuation B) Estimated Performance Reduction
Figure 20. Impact of PM2.5 aerosols on a variety of PV materials. A) Estimated flux attenuation as a
function of band gap. B) Projected performance reduction for four PV materials in selected cities with
high levels of air pollution (Peters & Buonassisi, 2018).
II.B.4 - Performance Ratio
Performance ratio is not uniquely defined, and the meaning of the term can differ depending
on who uses it. Importantly, performance ratio in research often is used differently than in industry. In
general, the performance ratio describes the ratio of actual yield to the expected yield. The expected
yield requires a reference value, which can be derived, for example, from the STC module efficiency,
or from the nameplate capacity of the system, but can also be obtained from more rigorous
calculations. The actual yield also needs to be specified and can vary, depending on whether, for
example AC or DC yield is considered.

40
Performance ratios are a useful research metric to compare different solar cell technologies,
as they eliminate efficiency differences from the comparison and integrate the impacts of
temperature, humidity, and other factors on performance. Because of the lower sensitivity of CdTe to
water related light absorption and temperature, compared to silicon, we’d expect to see higher
performance ratios for CdTe in hot & humid climates. In reverse, in cold and dry climates, silicon solar
cells should show superior performance. Various studies confirm this expectation (Gottschalga et al.,
2003; Alonso-Abella et al., 2014; Nofuentes et al., 2014; Schweiger et al., 2017), with examples in
Figure 21 (Peters et al., 2018; Huld & Gracia Amillo, 2015).
Figure 21. Performance Ratio in Different Regions
Figure 21A. Simulated performance ratios for a variety of solar cell technologies for all areas shown in B.
Figure 21B. Difference between the performance ratios of CdTe and mono-Si in parts of Africa, Europe
and Asia (Huld & Gracia Amillo, 2015).
Huld & Gracia Amillo (2015) explored the difference in performance between CdTe and silicon
solar cells in parts of Africa, Europe and Asia using satellite-based simulations (Figure 21). Their results
confirm the expected trends: CdTe has a performance advantage in all of Africa, tropical and sub-
tropical Asia (with the exception of the Himalayas), and parts of southern Europe. The magnitude of
the performance advantage is up to 8%. In northern Europe and northern Asia, as well as in the high
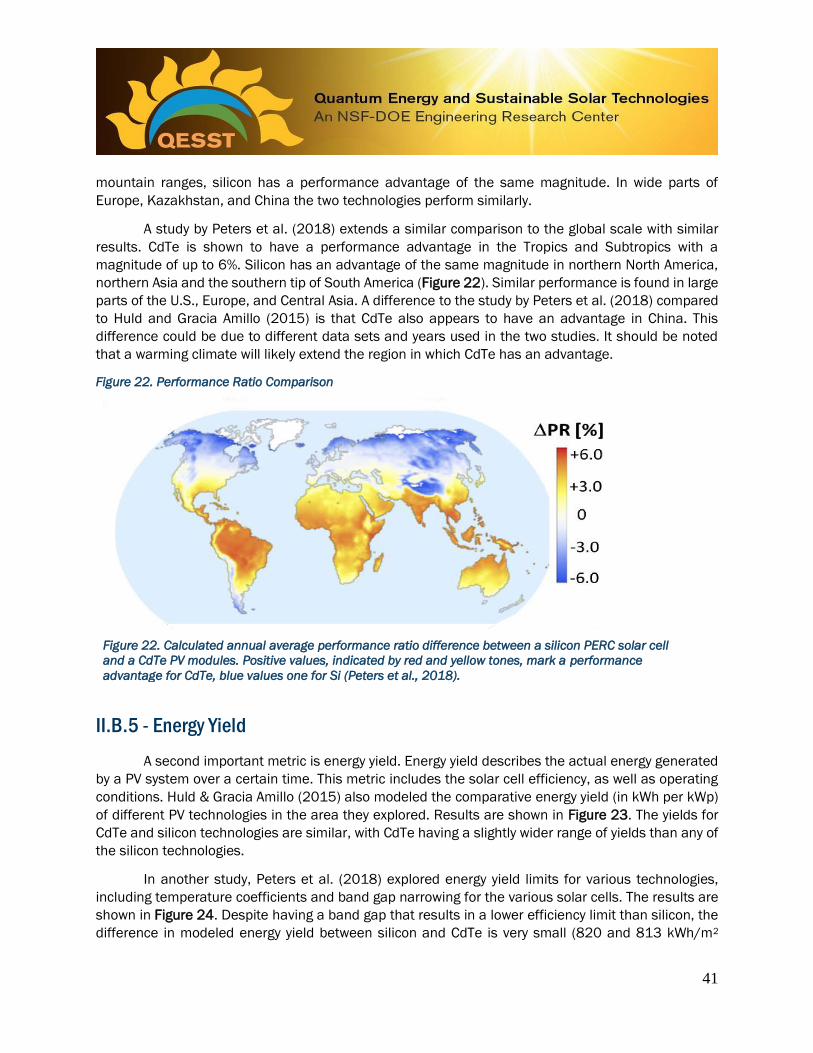
41
mountain ranges, silicon has a performance advantage of the same magnitude. In wide parts of
Europe, Kazakhstan, and China the two technologies perform similarly.
A study by Peters et al. (2018) extends a similar comparison to the global scale with similar
results. CdTe is shown to have a performance advantage in the Tropics and Subtropics with a
magnitude of up to 6%. Silicon has an advantage of the same magnitude in northern North America,
northern Asia and the southern tip of South America (Figure 22). Similar performance is found in large
parts of the U.S., Europe, and Central Asia. A difference to the study by Peters et al. (2018) compared
to Huld and Gracia Amillo (2015) is that CdTe also appears to have an advantage in China. This
difference could be due to different data sets and years used in the two studies. It should be noted
that a warming climate will likely extend the region in which CdTe has an advantage.
Figure 22. Performance Ratio Comparison
Figure 22. Calculated annual average performance ratio difference between a silicon PERC solar cell
and a CdTe PV modules. Positive values, indicated by red and yellow tones, mark a performance
advantage for CdTe, blue values one for Si (Peters et al., 2018).
II.B.5 - Energy Yield
A second important metric is energy yield. Energy yield describes the actual energy generated
by a PV system over a certain time. This metric includes the solar cell efficiency, as well as operating
conditions. Huld & Gracia Amillo (2015) also modeled the comparative energy yield (in kWh per kWp)
of different PV technologies in the area they explored. Results are shown in Figure 23. The yields for
CdTe and silicon technologies are similar, with CdTe having a slightly wider range of yields than any of
the silicon technologies.
In another study, Peters et al. (2018) explored energy yield limits for various technologies,
including temperature coefficients and band gap narrowing for the various solar cells. The results are
shown in Figure 24. Despite having a band gap that results in a lower efficiency limit than silicon, the
difference in modeled energy yield between silicon and CdTe is very small (820 and 813 kWh/m2

42
annual yield in 2015). Based on these yield numbers, the same study suggests that when comparing
efficiencies of silicon and CdTe cells measured under standard testing conditions, about 1.2% should
be added to the value of CdTe for a fair comparison of the median worldwide yield of silicon and CdTe
solar cells.
Figure 23. Annual Energy Yield
Figure 23. Annual calculated energy yield for various PV technologies (Huld & Gracia Amillo, 2015).
As an example: the current world record cell for silicon is 26.7%, the one for CdTe 22.1%. These
values were both measured under standard testing conditions, and do not reflect typical operating
conditions. If median worldwide conditions were considered, the value for silicon should be reduced
by 1.4%, reaching 25.3% harvesting efficiency, and the value for CdTe by 0.2%, reaching 21.9%, where
harvesting efficiency is the average efficiency of the solar cell under outdoor operation. These two
numbers, 25.3% and 21.9%, are a better comparison of the relative theoretical effectiveness of the
two technologies when it comes to generating electricity under real-world operating conditions.
Figure 24. Global Energy Yield Maps
Figure 24. (A) gives the energy yield in kWh/m2 for 2015 with a material having the ideal band gap in
each location. (B)-(F) show the energy yields for the five considered materials. These five graphs are
shown with two axes corresponding to the radiative limit (right) and a projection to record solar cell
efficiencies (left, color) (Peters & Buonassisi, 2018).
a) ideal band-gap
b) 1.01 eV - CIS
c) 1.12 eV - Silicon
d) 1.43 eV - GaAs
e) 1.54 eV - CdTe
f) 1.64 eV - Perovskite

43
C - Performance of CdTe PV in the Field
With more than 25 GW of modules sold, there are now numerous installations of CdTe modules
around the world. For many of these installations, measurement data is available to compile a
comprehensive picture of CdTe solar cell performance over time in the field. In this section, we
summarize the available data.
II.C.1 - Outdoor Testing Sites and Results
First Solar maintains a number of testing sites around the world that are used to monitor the
performance of CdTe PV technology under a variety of operating conditions. Figure 25 shows
photographs of one of these testing sites (upper left) and the additional equipment used to monitor
weather data (lower left) (Buehler, 2015).
Dedicated sites are distributed around the planet and cover a variety of climate zones,
including temperate climates in Ohio and Chile, the hot arid climate of Arizona, and hot humid climates
of Malaysia, India and the Philippines. Monitoring across different climate zones is important because
there are significant differences between different PV technologies regarding performance metrics, as
well as soiling and degradation behavior. A more detailed discussion of the former is provided in PV
Performance section II.B.
Figure 25. First Solar Test Locations
Figure 25. Photographic images of a First Solar testing site (upper left) and the additional monitoring
setup (lower left). A total of six sites spread all around the world (middle) is used for detailed
monitoring (middle). The sites are distributed over various climate zones (right), to allow monitoring
over a wide range of operating conditions (Buehler, 2015).
In addition to the detailed measurements, First Solar also monitors the performance of several
of its commercial systems. Figure 26 shows a map of the global distribution of First Solar PV systems
in the year 2015 on the left. Those monitored for performance are marked in red. Also, here, monitored
systems are distributed over several climate zones to cover a large variety of the operating conditions
prevalent on earth. On the right-hand side, the measured system performance is compared with the
results of performance modelling. The histogram shows that systems, overall, perform as expected.
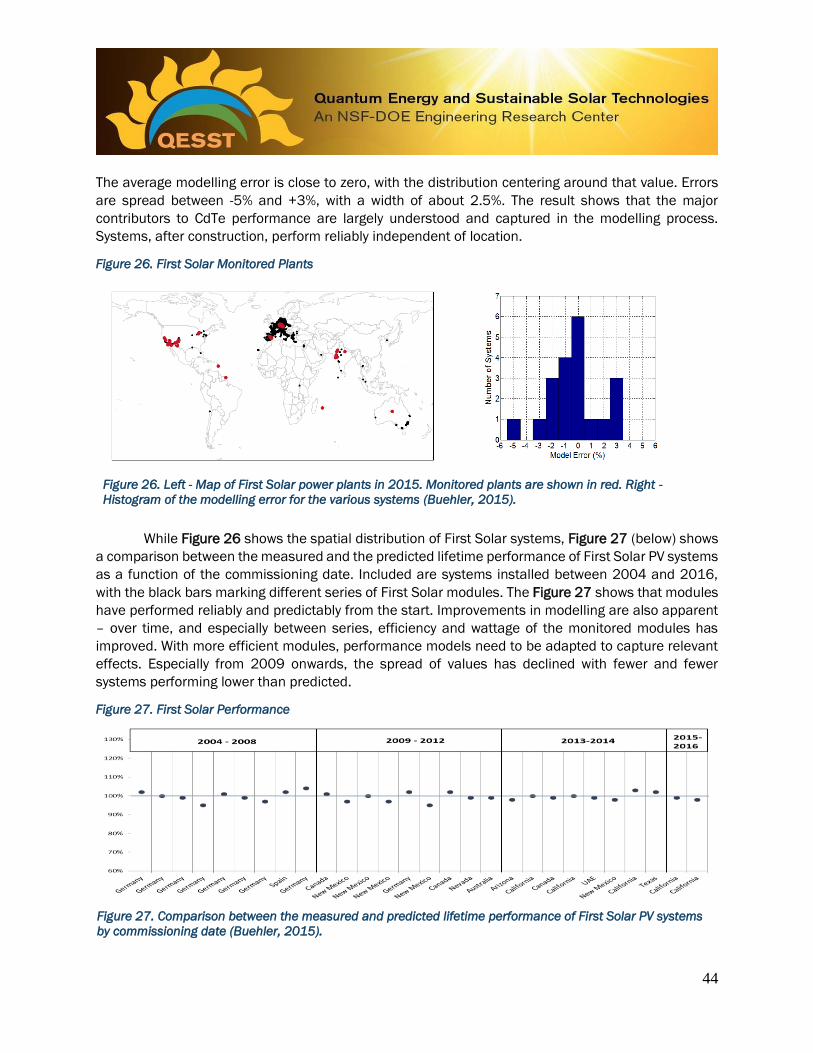
44
The average modelling error is close to zero, with the distribution centering around that value. Errors
are spread between -5% and +3%, with a width of about 2.5%. The result shows that the major
contributors to CdTe performance are largely understood and captured in the modelling process.
Systems, after construction, perform reliably independent of location.
Figure 26. First Solar Monitored Plants
Figure 26. Left - Map of First Solar power plants in 2015. Monitored plants are shown in red. Right -
Histogram of the modelling error for the various systems (Buehler, 2015).
While Figure 26 shows the spatial distribution of First Solar systems, Figure 27 (below) shows
a comparison between the measured and the predicted lifetime performance of First Solar PV systems
as a function of the commissioning date. Included are systems installed between 2004 and 2016,
with the black bars marking different series of First Solar modules. The Figure 27 shows that modules
have performed reliably and predictably from the start. Improvements in modelling are also apparent
– over time, and especially between series, efficiency and wattage of the monitored modules has
improved. With more efficient modules, performance models need to be adapted to capture relevant
effects. Especially from 2009 onwards, the spread of values has declined with fewer and fewer
systems performing lower than predicted.
Figure 27. First Solar Performance
Figure 27. Comparison between the measured and predicted lifetime performance of First Solar PV systems
by commissioning date (Buehler, 2015).

45
II.C.2 - Degradation
A variety of degradation mechanisms exist that result in a reduction of power output of all PV
modules over time. Two categories of mechanisms can be distinguished: first, mechanisms that affect
the semiconductor devices themselves, and second, mechanisms that affect the module construction,
including material degradation in back sheet or module encapsulation. Degradation mechanisms are
present in all semiconductors, and are specific to each technology, despite having a similar result:
stress over the lifetime of operation reduces the power conversion efficiency of the solar cell over time,
resulting in a regular and often predictable performance reduction. Degradation mechanisms in the
module depend on the used module architecture and are caused by harsh environmental exposure.
Examples are water ingress that can result in delamination or corrosion of different parts of the
module. To explore module degradation, a number of testing procedures are applied. These
procedures include indoor and outdoor measurements and are designed to represent a variety of
conditions. Experience with these degradation procedures is used to develop models to predict he
power output of a module. Comparison between simulated and measured performance results are
often used to gauge the reliability and predictability of a PV module.
The annual degradation rate defines the relative reduction in power output over time. Reducing
degradation has been shown to be a critical factor in reaching very low LCOE, as a longer lifetime for
the module stretches its viable generating period out considerably in time, with higher annual
production in each year. As a result, degradation has been a focus for technology improvement by the
U.S. Department of Energy in recent years (Peters et al., 2019).
CdTe solar cells degrade differently from silicon PV modules, which makes a direct comparison
between these two technologies less than straightforward. Especially, CdTe modules show fast initial
degradation followed by a saturation at a much lower rate. Furthermore, continuous improvement in
module technology has resulted in a distinct improvement of CdTe degradation over the last couple of
years (Peters et al., 2019; Strevel et al., 2013; Gloeckler, 2017).
One of the longest running tests is a 600 W CdTe research installation established at NREL in
1995, which has been running ever since, and for which more than 19 years of continuous data is
available. DC power output for this module, along with a 1200 W installation from 2003 is shown in
Figure 28 (Ngan et al., 2014). Degradation rates for these two installations are -0.47 ± 0.07 %/year
and -0.33 ± 0.19 %/year. Figure 28 show the potential for CdTe PV to operate for very long periods of
time with relatively little degradation.
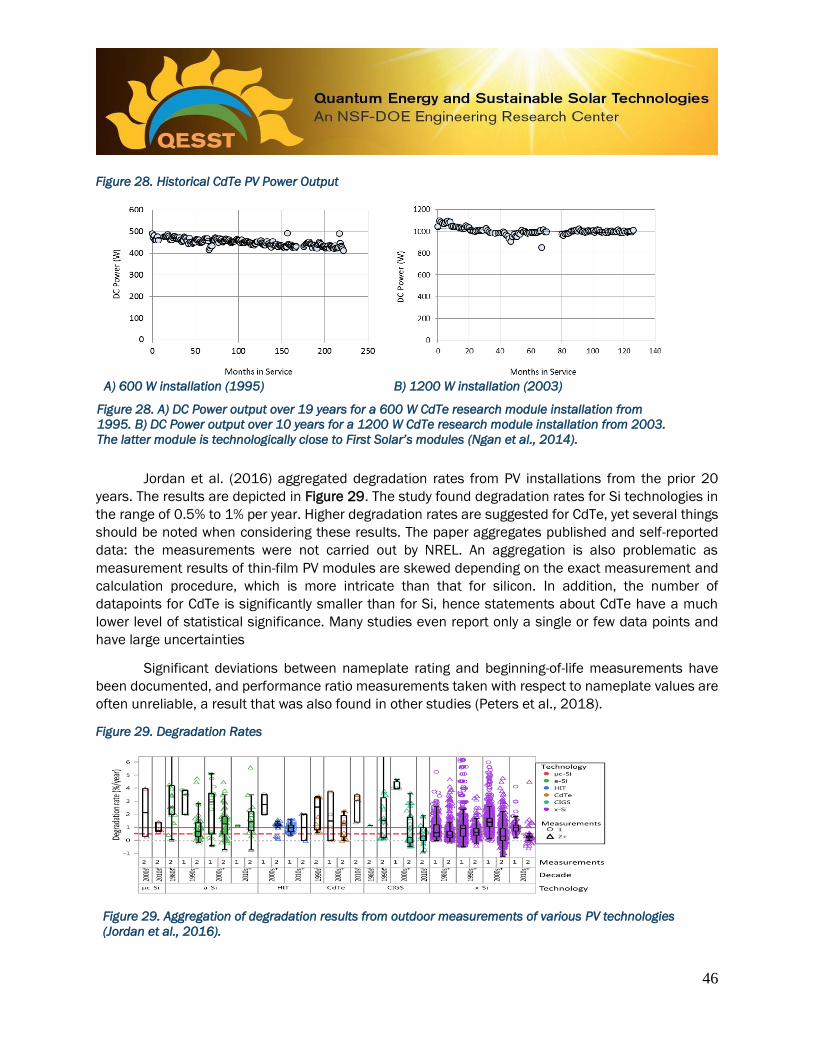
46
Figure 28. Historical CdTe PV Power Output
A) 600 W installation (1995)
B) 1200 W installation (2003)
Figure 28. A) DC Power output over 19 years for a 600 W CdTe research module installation from
1995. B) DC Power output over 10 years for a 1200 W CdTe research module installation from 2003.
The latter module is technologically close to First Solar’s modules (Ngan et al., 2014).
Jordan et al. (2016) aggregated degradation rates from PV installations from the prior 20
years. The results are depicted in Figure 29. The study found degradation rates for Si technologies in
the range of 0.5% to 1% per year. Higher degradation rates are suggested for CdTe, yet several things
should be noted when considering these results. The paper aggregates published and self-reported
data: the measurements were not carried out by NREL. An aggregation is also problematic as
measurement results of thin-film PV modules are skewed depending on the exact measurement and
calculation procedure, which is more intricate than that for silicon. In addition, the number of
datapoints for CdTe is significantly smaller than for Si, hence statements about CdTe have a much
lower level of statistical significance. Many studies even report only a single or few data points and
have large uncertainties
Significant deviations between nameplate rating and beginning-of-life measurements have
been documented, and performance ratio measurements taken with respect to nameplate values are
often unreliable, a result that was also found in other studies (Peters et al., 2018).
Figure 29. Degradation Rates
Figure 29. Aggregation of degradation results from outdoor measurements of various PV technologies
(Jordan et al., 2016).
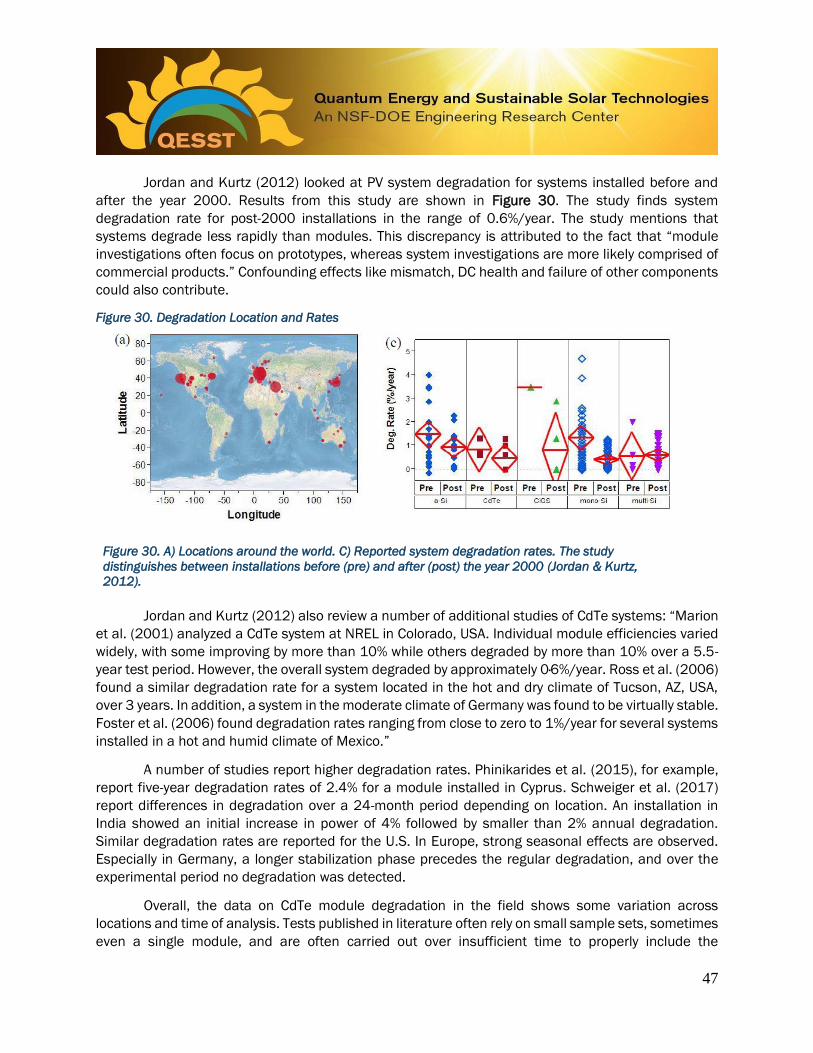
47
Jordan and Kurtz (2012) looked at PV system degradation for systems installed before and
after the year 2000. Results from this study are shown in Figure 30. The study finds system
degradation rate for post-2000 installations in the range of 0.6%/year. The study mentions that
systems degrade less rapidly than modules. This discrepancy is attributed to the fact that “module
investigations often focus on prototypes, whereas system investigations are more likely comprised of
commercial products.” Confounding effects like mismatch, DC health and failure of other components
could also contribute.
Figure 30. Degradation Location and Rates
Figure 30. A) Locations around the world. C) Reported system degradation rates. The study
distinguishes between installations before (pre) and after (post) the year 2000 (Jordan & Kurtz,
2012).
Jordan and Kurtz (2012) also review a number of additional studies of CdTe systems: “Marion
et al. (2001) analyzed a CdTe system at NREL in Colorado, USA. Individual module efficiencies varied
widely, with some improving by more than 10% while others degraded by more than 10% over a 5.5-
year test period. However, the overall system degraded by approximately 0·6%/year. Ross et al. (2006)
found a similar degradation rate for a system located in the hot and dry climate of Tucson, AZ, USA,
over 3 years. In addition, a system in the moderate climate of Germany was found to be virtually stable.
Foster et al. (2006) found degradation rates ranging from close to zero to 1%/year for several systems
installed in a hot and humid climate of Mexico.”
A number of studies report higher degradation rates. Phinikarides et al. (2015), for example,
report five-year degradation rates of 2.4% for a module installed in Cyprus. Schweiger et al. (2017)
report differences in degradation over a 24-month period depending on location. An installation in
India showed an initial increase in power of 4% followed by smaller than 2% annual degradation.
Similar degradation rates are reported for the U.S. In Europe, strong seasonal effects are observed.
Especially in Germany, a longer stabilization phase precedes the regular degradation, and over the
experimental period no degradation was detected.
Overall, the data on CdTe module degradation in the field shows some variation across
locations and time of analysis. Tests published in literature often rely on small sample sets, sometimes
even a single module, and are often carried out over insufficient time to properly include the
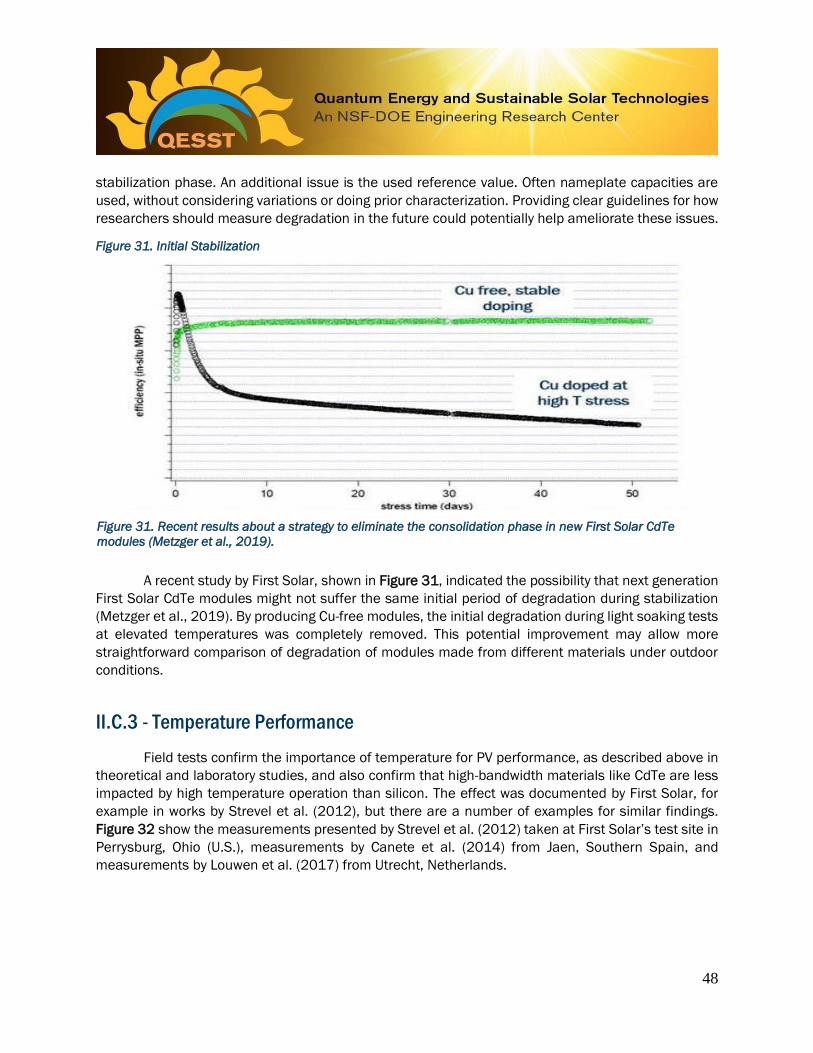
48
stabilization phase. An additional issue is the used reference value. Often nameplate capacities are
used, without considering variations or doing prior characterization. Providing clear guidelines for how
researchers should measure degradation in the future could potentially help ameliorate these issues.
Figure 31. Initial Stabilization
Figure 31. Recent results about a strategy to eliminate the consolidation phase in new First Solar CdTe
modules (Metzger et al., 2019).
A recent study by First Solar, shown in Figure 31, indicated the possibility that next generation
First Solar CdTe modules might not suffer the same initial period of degradation during stabilization
(Metzger et al., 2019). By producing Cu-free modules, the initial degradation during light soaking tests
at elevated temperatures was completely removed. This potential improvement may allow more
straightforward comparison of degradation of modules made from different materials under outdoor
conditions.
II.C.3 - Temperature Performance
Field tests confirm the importance of temperature for PV performance, as described above in
theoretical and laboratory studies, and also confirm that high-bandwidth materials like CdTe are less
impacted by high temperature operation than silicon. The effect was documented by First Solar, for
example in works by Strevel et al. (2012), but there are a number of examples for similar findings.
Figure 32 show the measurements presented by Strevel et al. (2012) taken at First Solar’s test site in
Perrysburg, Ohio (U.S.), measurements by Canete et al. (2014) from Jaen, Southern Spain, and
measurements by Louwen et al. (2017) from Utrecht, Netherlands.

49
Figure 32. Temperature Effects on PV Modules
A) Strevel et al. – Perrysburg (US)
B) Canete et al. – Jaen (Spain)
C) Louwen et al. – Utrecht (Netherlands)
Figure 32. Examples for measured comparison of temperature effects for different module technologies for
the US (A), Spain (B) and the Netherlands (C). Note that in the last figure Cadmium Telluride is abbreviated
CT (Cañete et al., 2014; Strevel et al., 2012; Louwen et al., 2017).
Reported temperature coefficients in these studies vary between -0.2%/K (Strevel et al. 2012)
and -0.29%/K (Louwen et al. 2017; Canete reports -0.25%/K). Reported values for silicon vary
between -0.4%/K and -0.5%/K.

50
II.C.4 - Spectral Effect
The impacts of spectral absorption by water and aerosols has also been confirmed in the field.
Alonso Abella et al. (2014) have captured the differences between module technologies by defining a
spectral factor for each. The spectral factors define spectral gains (for values above 1) and losses (for
values below 1) compared to the standard AM1.5 spectrum. Detailed experimental results for Jaen,
as well as experimental and theoretical results for Jaen and Madrid are shown in Figure 33.
Figure 33. Spectral Factor in Spain
A) measured SF in Jaen, Spain
B) overall SF for different cities and technologies
Figure 33. A) Measured spectral factor (SF) over the course of a year in Jaen (Spain). B) Experimental
and simulated results for the overall SF in Madrid and Jaen. (Alonso Abella et al., 2014)
The results for Jaen show a seasonal dependence of spectral factor for CdTe with losses in
winter and gains in summer. Given the overall higher insolation level in summer, this results in a net
spectral gain over the course of a year. Crystalline silicon technologies, in comparison, show very flat
curves, as they utilize a much greater fraction of the sun spectrum. It should be noted that measured
values of spectral factors depend on the spectral range of the available measurement equipment. As
a result, there is a discrepancy between simulation and experimental results in this work. Overall gains
for CdTe were smaller than expected, which can be attributed to additional effects that were not
considered in the study.
A very insightful study is depicted in Figure 34 in which the authors established a method to
distinguish between temperature effects, low irradiance, spectral effects, angle of incidence, and
soiling (Schweiger et al., 2017). The study was carried out at four sites with distinctly different
operating conditions in Cologne, Ancona, Tempe and Chennai. The study showed spectral gains for the
two included CdTe systems, with a notable spectral gain of more than 5% in Chennai. The study also
clearly shows the better temperature performance of CdTe compared to c-Si in all locations.
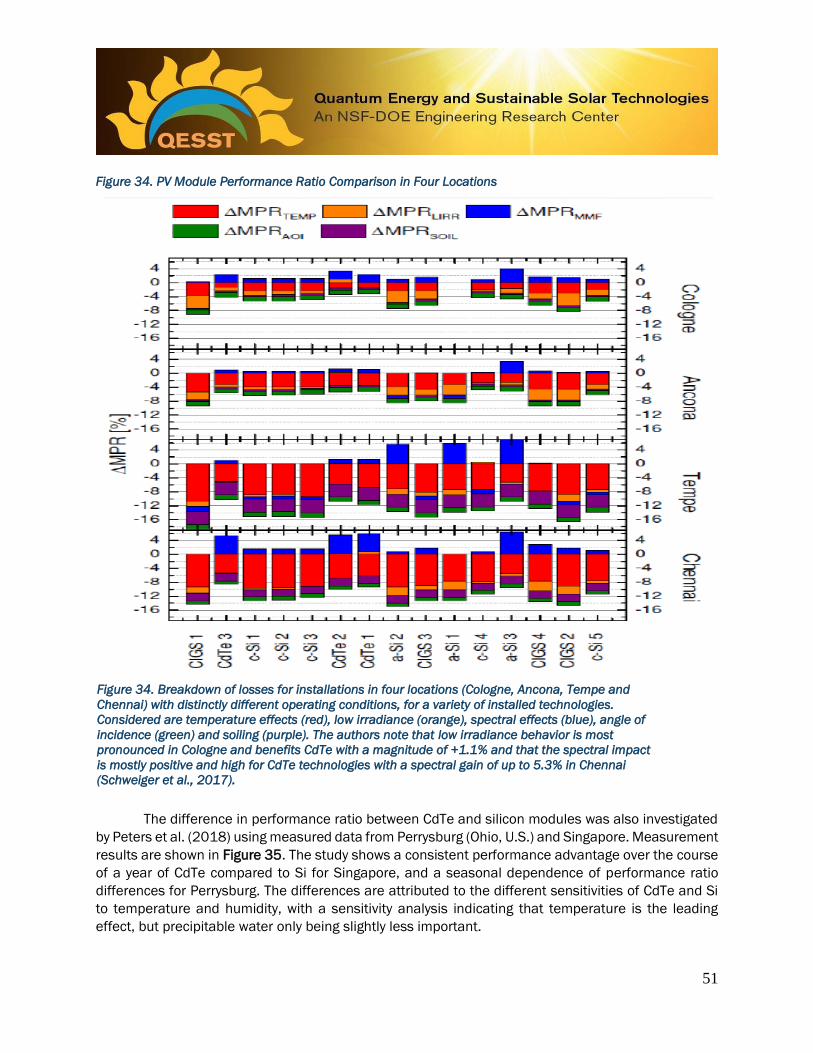
51
Figure 34. PV Module Performance Ratio Comparison in Four Locations
Figure 34. Breakdown of losses for installations in four locations (Cologne, Ancona, Tempe and
Chennai) with distinctly different operating conditions, for a variety of installed technologies.
Considered are temperature effects (red), low irradiance (orange), spectral effects (blue), angle of
incidence (green) and soiling (purple). The authors note that low irradiance behavior is most
pronounced in Cologne and benefits CdTe with a magnitude of +1.1% and that the spectral impact
is mostly positive and high for CdTe technologies with a spectral gain of up to 5.3% in Chennai
(Schweiger et al., 2017).
The difference in performance ratio between CdTe and silicon modules was also investigated
by Peters et al. (2018) using measured data from Perrysburg (Ohio, U.S.) and Singapore. Measurement
results are shown in Figure 35. The study shows a consistent performance advantage over the course
of a year of CdTe compared to Si for Singapore, and a seasonal dependence of performance ratio
differences for Perrysburg. The differences are attributed to the different sensitivities of CdTe and Si
to temperature and humidity, with a sensitivity analysis indicating that temperature is the leading
effect, but precipitable water only being slightly less important.
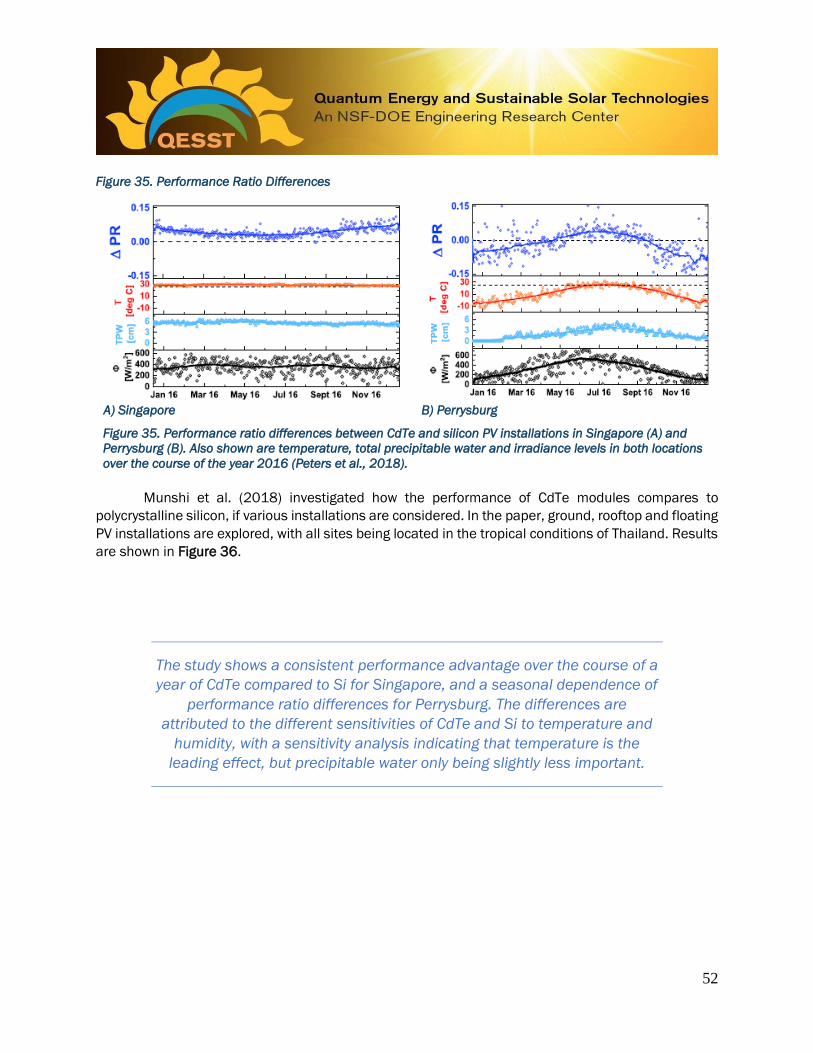
52
Figure 35. Performance Ratio Differences
A) Singapore
B) Perrysburg
Figure 35. Performance ratio differences between CdTe and silicon PV installations in Singapore (A) and
Perrysburg (B). Also shown are temperature, total precipitable water and irradiance levels in both locations
over the course of the year 2016 (Peters et al., 2018).
Munshi et al. (2018) investigated how the performance of CdTe modules compares to
polycrystalline silicon, if various installations are considered. In the paper, ground, rooftop and floating
PV installations are explored, with all sites being located in the tropical conditions of Thailand. Results
are shown in Figure 36.
The study shows a consistent performance advantage over the course of a
year of CdTe compared to Si for Singapore, and a seasonal dependence of
performance ratio differences for Perrysburg. The differences are
attributed to the different sensitivities of CdTe and Si to temperature and
humidity, with a sensitivity analysis indicating that temperature is the
leading effect, but precipitable water only being slightly less important.

53
Figure 36. PV Power Generation Over a Month
Figure 36. One-month comparison of Cadmium Telluride and polycrystalline silicon PV modules on different
installation. Considered are ground-mounted, rooftop and floating PV systems (Munshi et al., 2018).
The study shows that the performance advantage for CdTe, driven by both temperature and
spectral effects, is consistent over all installations. Notably, no differences are found for installations
on water, for which lower module temperatures could be expected. These results, again, speak to the
intrinsic material advantage of the higher band gap CdTe absorber, compared to silicon.

54
II.C.5 - ARC and Soiling
In the last decade, antireflection coatings (ARC) on the front glass, and more recently also anti-
soiling coatings, have become a main feature of PV modules. ARC coatings reduce the 4% front surface
reflection of the glass cover, and typically recover about half of this loss. Passow et al. (2018)
experimentally investigated the impact of ARC coatings on the power generation of First Solar modules
(2018). Results of a measurement series over 30 months are shown in Figure 37. The overall gain
due to the ARC is 1.8%.
Figure 37. Anti-Reflective Coating Effects
Figure 37. Ratio of average weekly measured to predicted power generation of a group of modules
with (blue) and without (orange) anti-reflective coating (ARC) (Passow, 2018).
Figure 38. Soiling Effects
Figure 38. Daily ratios of effective irradiance (insolation) received by soiled to non-soiled modules (soiling
ratios) over time (thick line), as well as normalized power output (thin line) over one year (2013 / 2014).
Blue bars indicate rainfall (Gostein et al., 2014).

55
The soiling or buildup of dirt on PV modules can result in significant reductions in PV module
power output. Gostein et al. (2014) investigated soiling levels and rates alongside PV plant
performance in the desert southwest of the United States, the Arabian Peninsula, and Western
Australia. The study found indication of a strong correlation between soiling level and power reduction,
with, in some cases a 1:1 direct correlation. Soiling rates for the five investigated sites varied between
0.5% per week and 5% per week, underlining the importance of reducing soiling for PV modules in
desert environments, particularly in humid, dust-prone climates (e.g., Arabian Peninsula), which can
transform dry dust into clustered and sticky dust. Results of this study are shown in Figure 38.
Grammatico & Littmann (2016) investigated the anti-soiling benefits of antireflection coating.
The results of this study are shown in Figure 39. The authors find that First Solar CdTe PV modules
with ARC don’t soil as much in semi-arid and desert climates. The average annual reduction in soiling
rate in the desert southwest was 22% in one location and 25% in another. In climates with frequent
rain, no or few benefits were observed.
Figure 39. Soiling Trends
Figure 39. Soiling trends observed throughout Spring 2015. Blue circles are daily ratios of dirty to
clean insolation for First Solar non-ARC CdTe modules, orange circles are daily ratios of dirty to clean
insolation for First Solar ARC CdTe modules. The soiling rate of each data set is determined by the
slope of each dotted line (Grammatico & Littmann, 2016).

56
D - Reliability Testing
II.D.1 - Indoor Testing Procedures and Results
Warranties for field performance of PV modules are typically granted for 25 years, with several
producers giving even longer warranties. As innovation in PV progresses rapidly, field exposure testing
to validate long-term performance for such long times is impractical, and the PV industry has
developed accelerated testing procedures in the lab to mimic long term exposure and more rapidly
assess probable future performance and degradation of modules in the field. A number of
internationally accepted accelerated testing procedures exist to establish module reliability in the field.
Procedures follow a general format with an initial measurement of a test sample, followed by an
accelerated environmental exposure and a final test of power and safety of the sample. Three of the
common stressors for PV modules are thermal cycling with temperatures being varied between –40
to +85°C, (the profile is shown in Figure 40 on the left), humidity freeze cycling with temperatures
being varied over the same range, though with a different time profile, and humidity kept at 85% during
the hot period (profile shown in Figure 40 on the right), as well as damp heat testing, with a constant
exposure of 85°C and 85% relative humidity (not shown) (Strevel et al., 2013; IEC, 2008). Typically,
modules are kept for 1000 hours (about 6 weeks) under these conditions. In addition, modules are
tested for performance under electrical bias and UV exposure, as well as mechanical stresses such as
static load, dynamic load, and hail.
Figure 40. Test Cycles
Figure 40. Left - IEC 61646 thermal cycling profile. Right - IEC 61646 humidity freeze profile (Strevel et al.,
2013).

57
Historically, testing procedures for thin-film PV modules were defined by the IEC 61646
standard test protocols and were different from those used for silicon modules (IEC 61215), though
now testing procedures for both technologies have been harmonized (IEC, 1993). A standard test for
thermal cycling consists of 200 cycles; for humidity freeze testing, typically 10 cycles are used. This
standard, together with the IEC 61730 safety standard, provides the general framework of certification
to assure a common minimum level of testing procedures. They are common practice in industry (IEC,
2004). In recent years, the need to further refine PV module testing to evaluate more than initial
quality has become apparent, and additional tests are being designed to provide better insight into
the reliability and long-term performance of PV modules.
Figure 41 shows results for thermal cycling (left) damp heat testing (right) of First Solar Series
3 Black modules. In this particular experiment, thermal cycling was extended to five times the duration
of the standard test, and damp heat testing was carried out with more than six times the conventional
1000-hour test. Results in Figure 41 are for a sample population of 25 modules. No measurable power
reduction was found after the extended thermal cycling. For the damp heat testing, it is important to
note that the modules undergo an extended exposure in dark environmental chambers, after which a
light soaking recovery process is carried out to eliminate the dark storage effects and restore power
generation back to baseline. Three such exposures were conducted, one after about 2300 hours, one
after about 4400 hours, and one upon test completion (6384 hours). Even after this extreme testing,
the power output of the module was reduced by only 7 ± 3%. This result demonstrates the durability
of First Solar’s encapsulation and packaging procedure, which are also utilized in subsequent module
versions (Series 4 and 6).
Figure 41. Test Cycle Effects on Power Output
Figure 41. Left - result of extended thermal cycling. Right - Result of extended damp heat testing. Testing
durations are five times for thermal cycling, and more than six times that of standard procedures for damp
heat testing. No power reduction was observed for thermal cycling, during damp heat testing, power
reduced by only about 7%, despite the harsh testing conditions (Strevel et al., 2013).
58
II.D.2 - Technological Innovation
As discussed in the previous section, PV reliability research and testing has evolved from a
focus on initial quality to improving long-term reliability, which is essential given the long warranty life
of commercial PV modules. The long-term reliability of PV modules can be improved via technological
innovation (Strevel et al., 2013). While the improvements described below were first implemented in
prior versions of First Solar modules (First Solar Series 3 Black Plus module, compared to the First
Solar Series 3 Black module), they are also applicable to subsequent versions of First Solar modules
(Series 4 and 6) and are therefore described in this section. The Series 3 Black and Series 4|6 module
features innovations intended to provide improved long-term durability due to an upgrade in the
encapsulating material. The Series 3 Black Plus and Series 4|6 module additionally features
innovations in device technology to improve long-term power output degradation.
The packaging system of the Series 3 Black and Series 4|6 module employs an upgraded edge
sealant which extends around the module perimeter and an improved encapsulant between the glass
laminates. Both innovations provide a better protection from water ingress and improved electrical
insulation. The edge sealant uses a carbon-based colorant – the reason for the product name (black).
Carbon is known to not affect the active solar cell material negatively and to absorb UV light very
efficiently. The material, hence, acts as a radical scavenger. The material has other advantages,
including that the volume resistivity is between 1015 and 1016 Ωcm, more than ten orders of magnitude
above the value provided in guidelines for electrical insulation. Moreover, it features high tolerance to
extreme operating conditions (temperature and humidity), and it provides excellent solid insulation,
with a relative thermal index (RTI) measured by First Solar at 105°C – a strong indicator that the
material is suitable for operation in hot and arid climates.
The encapsulant acts as a secondary barrier against environmental influences after the edge
sealant. The role of encapsulants for water ingress has been covered extensively in the literature
(Kempe, 2005). A main feature of the improved encapsulant is a water vapor transmission rate (WVR)
that is several times smaller than that of conventional EVA. A further feature of the new encapsulant
is the observed very high strength of its bonding to glass even after harsh, accelerated testing. The
encapsulant bond strength is on the order of 5 megapascals (~50 kg/cm2), making it very difficult to
separate the front and back of the modules and so it is very difficult to break the modules open.
The Series 3 Black Plus module and Series 4|6 modules also feature innovations in the device
architecture. The main innovation is an improved back contact using ZnTe (see Figure 42). ZnTe
improves the valence band offset from p-type CdTe. This results in a back contact that has a more
ohmic characteristic and is more stable (Gessert et al., 1996; Rioux et al., 1993). The benefits of a
ZnTe contact were first demonstrated in 2012 by a new device efficiency record of 17.3%. Following
this achievement, the ZnTe contact was integrated into full-scale module fabrication. The nameplate
improvement of this innovation is between 5 and 8 Wp. The ZnTe back contact improved both fill factor
and VOC of the modules.

59
Figure 42. ZnTe Back Contact Architecture
Figure 42. Solar cell architecture without (left) and with (right) ZnTe back contact. (Strevel et al.,
2013).
Accelerated testing was used to examine the long-term power degradation behavior of the two
module types. Figure 43 (top) shows the power loss over time for the standard and ZnTe-based device.
The 300-day exposure, which is believed to be equivalent to long-term operation, included extreme
temperatures, full spectrum illumination beyond 1sun (1000W/m2), and high-bias. The ZnTe based
device showed a power loss below 10%, compared to a 17% reduction in the standard device. The
observed degradation rate showed the potential to improve the long-term degradation values to –0.5%
per annum for all climates, which has been documented in Series 4 and Series 6 modules.
Figure 43. ZnTe Back Contact Effects
Figure 43. Left - Power loss after extended light soaking exposure. The ZnTe-based device (Series 3
Black Plus) showed less than 10% reduction after 300 days of testing. Right - Comparative power
loss vs. accelerated temperature and light soaking stresses. The improved long-term stability of the
ZnTe-based device (Series 3 Black Plus) is an indication of inhibited Cu migration due to the presence
of ZnTe (Strevel et al., 2013). Note that ZnTe is also utilized in Series 4|6 modules.
ZnTe is also believed to retard Cu diffusion, thus helping to keep a Cu-rich back contact
(Narayanswamy et al., 1999). Curtailing Cu diffusion results in improved long-term stability.
Temperature variations under accelerated light soaking (Figure 43) show improved long-term stability
of the ZnTe-based device.
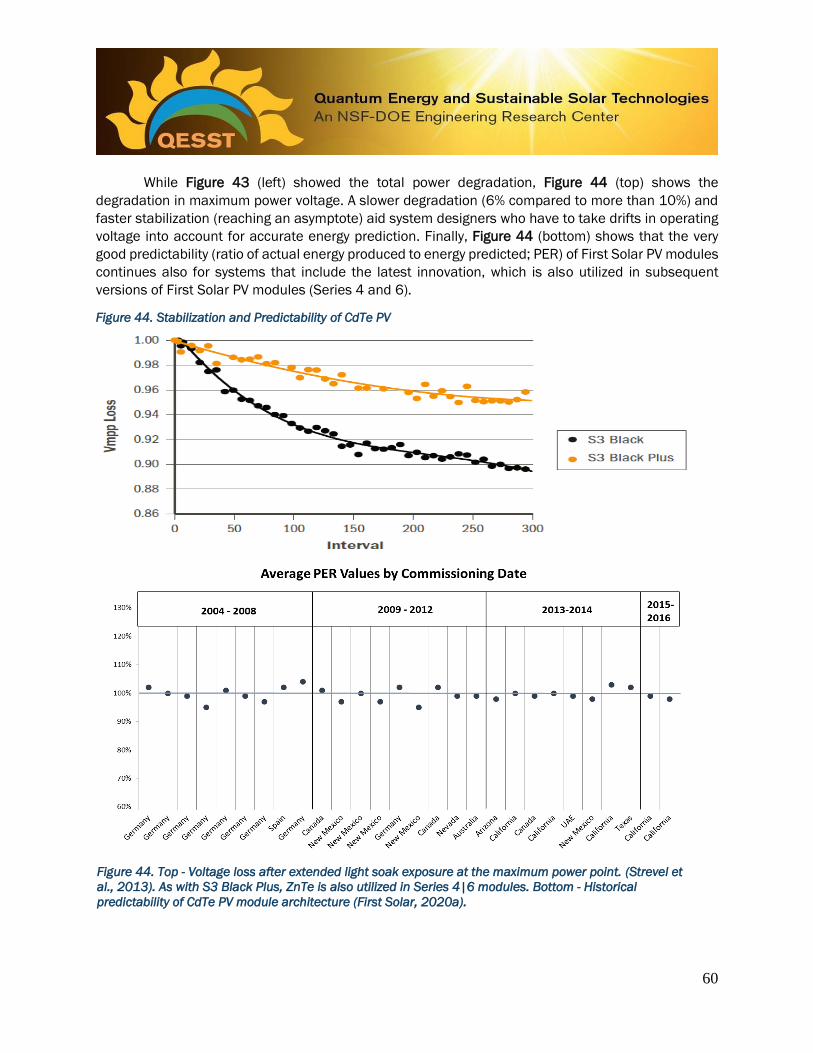
60
While Figure 43 (left) showed the total power degradation, Figure 44 (top) shows the
degradation in maximum power voltage. A slower degradation (6% compared to more than 10%) and
faster stabilization (reaching an asymptote) aid system designers who have to take drifts in operating
voltage into account for accurate energy prediction. Finally, Figure 44 (bottom) shows that the very
good predictability (ratio of actual energy produced to energy predicted; PER) of First Solar PV modules
continues also for systems that include the latest innovation, which is also utilized in subsequent
versions of First Solar PV modules (Series 4 and 6).
Figure 44. Stabilization and Predictability of CdTe PV
Figure 44. Top - Voltage loss after extended light soak exposure at the maximum power point. (Strevel et
al., 2013). As with S3 Black Plus, ZnTe is also utilized in Series 4|6 modules. Bottom - Historical
predictability of CdTe PV module architecture (First Solar, 2020a).
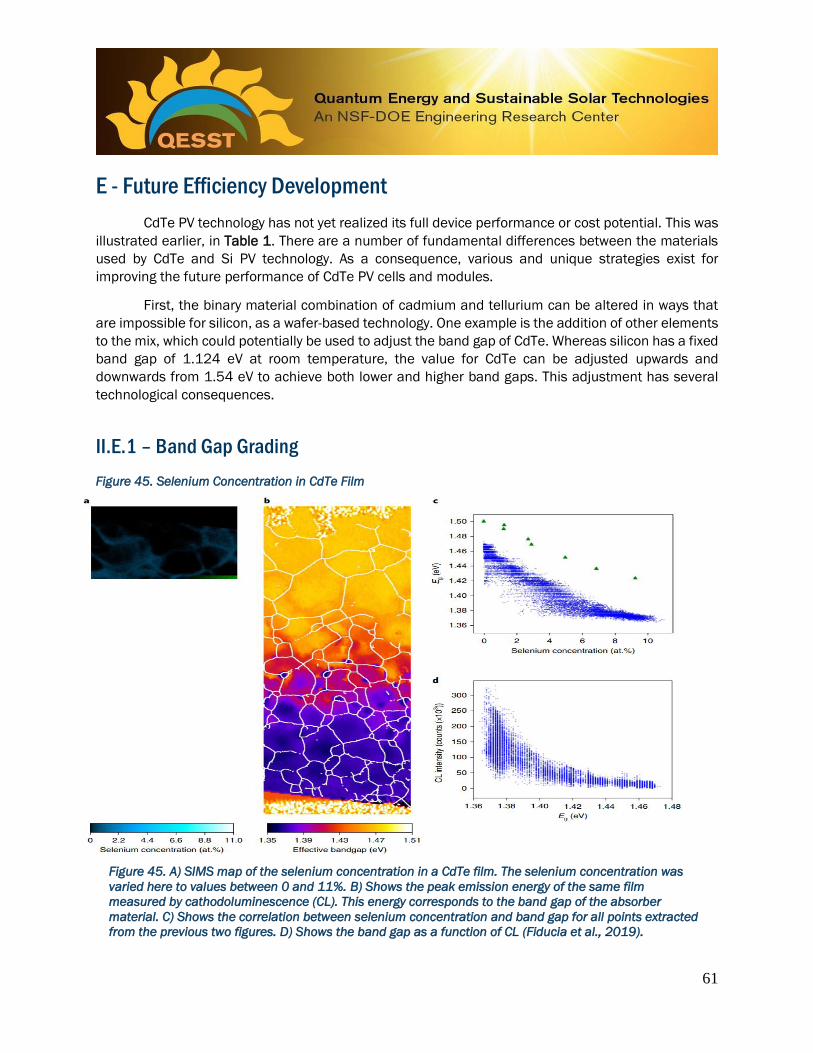
61
E - Future Efficiency Development
CdTe PV technology has not yet realized its full device performance or cost potential. This was
illustrated earlier, in Table 1. There are a number of fundamental differences between the materials
used by CdTe and Si PV technology. As a consequence, various and unique strategies exist for
improving the future performance of CdTe PV cells and modules.
First, the binary material combination of cadmium and tellurium can be altered in ways that
are impossible for silicon, as a wafer-based technology. One example is the addition of other elements
to the mix, which could potentially be used to adjust the band gap of CdTe. Whereas silicon has a fixed
band gap of 1.124 eV at room temperature, the value for CdTe can be adjusted upwards and
downwards from 1.54 eV to achieve both lower and higher band gaps. This adjustment has several
technological consequences.
II.E.1 – Band Gap Grading
Figure 45. Selenium Concentration in CdTe Film
Figure 45. A) SIMS map of the selenium concentration in a CdTe film. The selenium concentration was
varied here to values between 0 and 11%. B) Shows the peak emission energy of the same film
measured by cathodoluminescence (CL). This energy corresponds to the band gap of the absorber
material. C) Shows the correlation between selenium concentration and band gap for all points extracted
from the previous two figures. D) Shows the band gap as a function of CL (Fiducia et al., 2019).

62
For example, it is possible to add selenium to cadmium telluride to generate a material with a
lower band gap. By gradually adjusting the selenium concentration, regions with a graded band gap
can be generated. This concept is shown in Figure 45 (Fiducia et al., 2019). Adding between 0 and
10% of selenium results in a variation of the absorber band gap roughly between 1.46eV and 1.36eV.
Higher concentrations of selenium have the opposite effect: at Selenium concentrations above
approximately 40%, the band gap increases, and at 100%, it reaches 1.7eV (Weiss, 2018). Inclusion
of selenium to lower the band gap allows extending the photo-active range of the solar cells, resulting
in active absorption at higher wavelengths, and consequently, higher currents and higher efficiencies.
First Solar already uses a technique called band gap grading in its modules (Gloeckler, 2017).
Figure 46A gives a historic overview of the developments that have allowed increasing the efficiencies
of First Solar’s PV modules. A first innovation was the introduction of a ZnTe buffer layer at the rear to
improve contacts and passivation (section II.D.2), a second innovation was related to improving the
quality of the bulk absorber material quality. Adjusting the material composition of the absorber was
commenced in 2014 and has helped push cell efficiencies beyond the 20% mark.
Figure 46B shows the effect of not one, but two variations of composition of CdTe that are
active in different wavelength ranges. The substitution of CdS at the cell front has improved the blue-
response of the cell by eliminating parasitic processes, and band gap grading has allowed further
increasing the cell’s current to close to 31 mA/cm2. Very high currents are one of the reasons for the
outstanding efficiencies that First Solar was able to produce.
Figure 46. First Solar Efficiency Gains
Figure 46A. Historic overview of First Solar’s efficiencies, and which innovations were key in improving
them (Weiss, 2018).

63
Figure 46B. External quantum efficiencies of different device generations. The substitution of CdS has
improved the blue response of the cell, band gap grading has allowed extending the red response,
together resulting in outstanding currents (close to 31 mA/cm2) and efficiencies (21.5% in this case)
(Weiss, 2018).
II.E.2 - Overcoming Low Voltages
CdTe devices with a voltage in excess of 1V were studied by Burst et al. (2016). Figure 47
shows a histogram of past voltages measured at NREL for 2400 devices. The Figure 47 clearly shows
the type of improvement that these new architectures allow, as previously only very few devices
achieved voltages in excess of 850 mV.
Figure 47. CdTe Overcoming 1 Volt Barrier
Figure 47. Burst et al. (2016) show how new concepts can overcome historical barriers of CdTe solar cells.
A) Shows a histogram of VOC values measured at NREL for more than 2400 devices. No devices much
above 850 mV appear in this chart. B) New developments have enabled CdTe to surpass the 1V barrier.
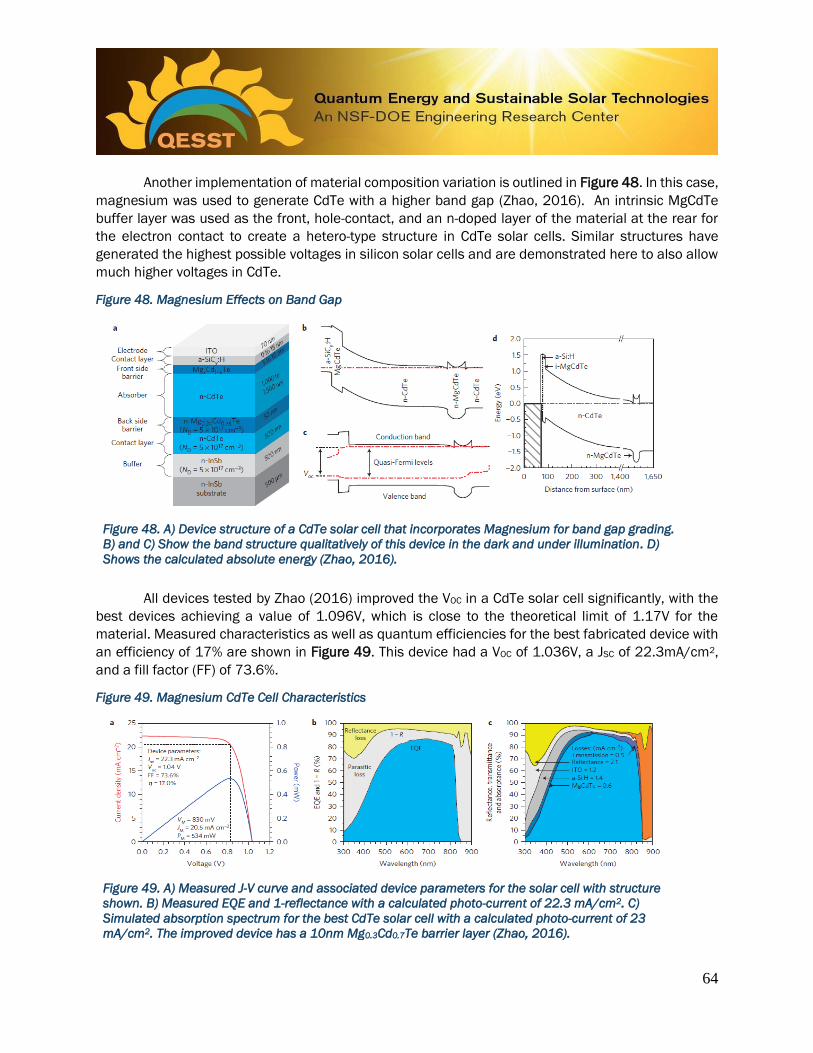
64
Another implementation of material composition variation is outlined in Figure 48. In this case,
magnesium was used to generate CdTe with a higher band gap (Zhao, 2016). An intrinsic MgCdTe
buffer layer was used as the front, hole-contact, and an n-doped layer of the material at the rear for
the electron contact to create a hetero-type structure in CdTe solar cells. Similar structures have
generated the highest possible voltages in silicon solar cells and are demonstrated here to also allow
much higher voltages in CdTe.
Figure 48. Magnesium Effects on Band Gap
Figure 48. A) Device structure of a CdTe solar cell that incorporates Magnesium for band gap grading.
B) and C) Show the band structure qualitatively of this device in the dark and under illumination. D)
Shows the calculated absolute energy (Zhao, 2016).
All devices tested by Zhao (2016) improved the VOC in a CdTe solar cell significantly, with the
best devices achieving a value of 1.096V, which is close to the theoretical limit of 1.17V for the
material. Measured characteristics as well as quantum efficiencies for the best fabricated device with
an efficiency of 17% are shown in Figure 49. This device had a VOC of 1.036V, a JSC of 22.3mA/cm2,
and a fill factor (FF) of 73.6%.
Figure 49. Magnesium CdTe Cell Characteristics
Figure 49. A) Measured J-V curve and associated device parameters for the solar cell with structure
shown. B) Measured EQE and 1-reflectance with a calculated photo-current of 22.3 mA/cm2. C)
Simulated absorption spectrum for the best CdTe solar cell with a calculated photo-current of 23
mA/cm2. The improved device has a 10nm Mg0.3Cd0.7Te barrier layer (Zhao, 2016).

65
Being able to overcome classical voltage barriers is a huge step forward to generating CdTe
solar cells with 25% efficiency and bringing the technology closer to what crystalline silicon can
achieve. Yet, there are still technological barriers to be overcome to integrate these new device
structures with the high current architectures currently used at First Solar.
II.E.3 - Next Generation Devices
Variations in the absorber band gap also open up the possibility to realize a concept with very
high efficiencies: tandem solar cells. A tandem solar cell combines two electrically distinct absorbers
with different band gaps to reduce thermalization (a thermodynamic loss present in every solar cell).
A tandem solar cell made up of two absorbers has a theoretical efficiency limit of close to 45%,
compared to a single-junction limit of approximately 33%. The limiting efficiency is determined by the
combination of the two different band gaps and the electrical connection. For the latter, typically two
types of connections are considered. The first is a two-terminal connection, in which the cells are
separated by a tunnel junction and share one set of terminals. This architecture requires current
matching and is very sensitive to band gap variations. The second connection is represented by the
four terminal (4T) architecture, in which the cells are contacted independently and are only optically
connected. This architecture does not rely on current matching and allows a broader combination of
different band gaps. There are a number of variations of these two architectures, but also these can
generally be separated into some that require current matching and others that don’t. The limiting
efficiencies for either case are shown in Figure 50 (Mailoa, 2016).
Figure 50. Limiting Efficiencies for Tandem Solar Cells
Figure 50. The figure on the left shows calculations for the two terminal (2T) architecture, in which the
two cells are monolithically integrated, and electrically separated by a tunnel junction – making current
matching necessary. The figure on the right shows the four terminal (4T) architecture, in which the two
cells are contacted independently and only optically connected (Mailoa, 2016).
0.5 1.0 1.5 2.00.5
1.0
1.5
2T
EG,TOP
(eV)
EG
,BO
TT
OM (
eV
)
10
20
30
40
45
MAX
(%)
0.5 1.0 1.5 2.00.5
1.0
1.5
MAX (%)
EG,TOP
(eV)
EG
,BO
TT
OM (
eV
)
10
20
30
40
454T
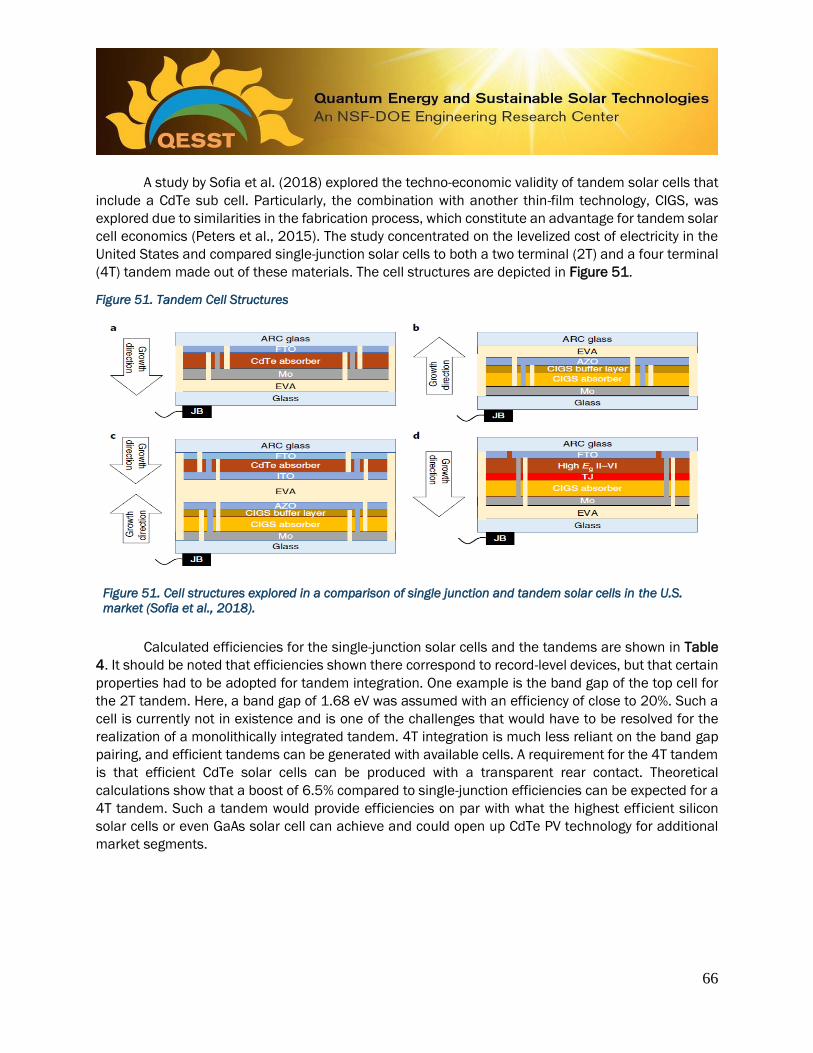
66
A study by Sofia et al. (2018) explored the techno-economic validity of tandem solar cells that
include a CdTe sub cell. Particularly, the combination with another thin-film technology, CIGS, was
explored due to similarities in the fabrication process, which constitute an advantage for tandem solar
cell economics (Peters et al., 2015). The study concentrated on the levelized cost of electricity in the
United States and compared single-junction solar cells to both a two terminal (2T) and a four terminal
(4T) tandem made out of these materials. The cell structures are depicted in Figure 51.
Figure 51. Tandem Cell Structures
Figure 51. Cell structures explored in a comparison of single junction and tandem solar cells in the U.S.
market (Sofia et al., 2018).
Calculated efficiencies for the single-junction solar cells and the tandems are shown in Table
4. It should be noted that efficiencies shown there correspond to record-level devices, but that certain
properties had to be adopted for tandem integration. One example is the band gap of the top cell for
the 2T tandem. Here, a band gap of 1.68 eV was assumed with an efficiency of close to 20%. Such a
cell is currently not in existence and is one of the challenges that would have to be resolved for the
realization of a monolithically integrated tandem. 4T integration is much less reliant on the band gap
pairing, and efficient tandems can be generated with available cells. A requirement for the 4T tandem
is that efficient CdTe solar cells can be produced with a transparent rear contact. Theoretical
calculations show that a boost of 6.5% compared to single-junction efficiencies can be expected for a
4T tandem. Such a tandem would provide efficiencies on par with what the highest efficient silicon
solar cells or even GaAs solar cell can achieve and could open up CdTe PV technology for additional
market segments.

67
Table 4. CdTe and CIGS Efficiencies
Architecture Efficiency (%)
CdTe Single Junction 19.9
CIGS Single Junction 19.8
2T Tandem 25.0
4T Tandem 26.5
Table 4. Single junction and tandem efficiencies (Sofia et al., 2018).
The results presented in Table 4 suggest that tandem solar cells should be competitive in U.S.
residential markets but should not be able to compete with conventional single junction solar cells in
utility-scale markets (Sofia et al., 2018). This result is likely transferable to other tandem solar cell
structures, for example, using a silicon bottom cell. The detailed LCOE calculation is shown in Figure
52. The main difference between residential and utility installations affecting the competitiveness of
different solar cell concepts are the balance of system (BOS) and other soft costs. Overall system costs
are larger for a smaller system, resulting in a larger premium for efficiency. The efficiency benefit of a
tandem is, hence, worth the additional fabrication cost for a small, residential type installation, but
may become uneconomic for large utility scale installations.
Figure 52. Module Cost Breakdown
A) Module cost B) LCOE residential (left) and utility (right)
Figure 52. Modeled module cost (A) and LCOE (B) for the considered single-junction and tandem solar cells.
Despite the fact that the module cost of tandems is higher in terms of $/W (A), the higher efficiency
generates additional value in a system. This value is high enough to make tandems, and particularly the
most efficient, 4T, option the most economic choice in residential installations. On a utility scale, however,
the lowest cost single junction solar cell may be the preferable option (Sofia et al., 2018).

68
F - Improving First Solar Competitiveness
Increasing the efficiency of modules is not the only way First Solar can improve the
competitiveness of their products. In a theoretical study, Horowitz et al. (2017) showed that increasing
the module area is beneficial to reducing the total installed system cost, and hence the levelized cost
of electricity. The simulated effect of module area in installation cost is shown in Figure 53.
Figure 53. System Installation Cost
Figure 53. Effect of module area on total installed system cost for various PV technologies. Numbers
represent U.S. weighted average cost (Horowitz et al., 2017).
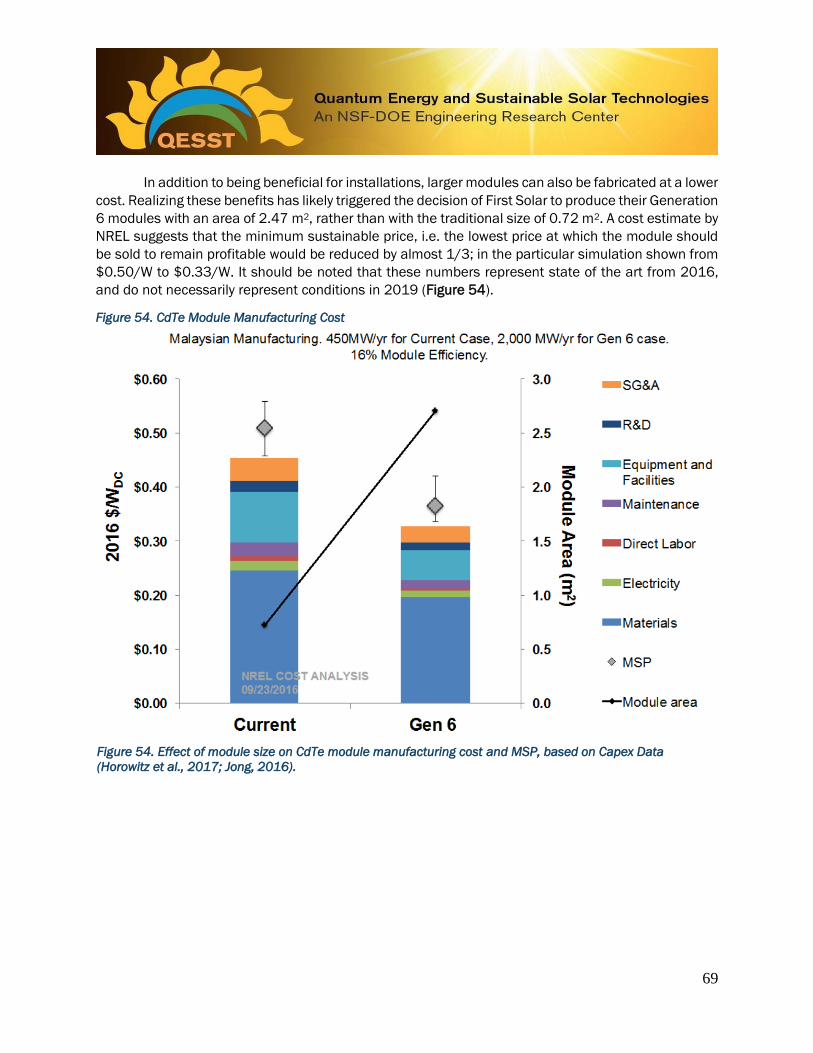
69
In addition to being beneficial for installations, larger modules can also be fabricated at a lower
cost. Realizing these benefits has likely triggered the decision of First Solar to produce their Generation
6 modules with an area of 2.47 m2, rather than with the traditional size of 0.72 m2. A cost estimate by
NREL suggests that the minimum sustainable price, i.e. the lowest price at which the module should
be sold to remain profitable would be reduced by almost 1/3; in the particular simulation shown from
$0.50/W to $0.33/W. It should be noted that these numbers represent state of the art from 2016,
and do not necessarily represent conditions in 2019 (Figure 54).
Figure 54. CdTe Module Manufacturing Cost
Figure 54. Effect of module size on CdTe module manufacturing cost and MSP, based on Capex Data
(Horowitz et al., 2017; Jong, 2016).

70
III - ENVIRONMENTAL, HEALTH, AND SAFETY CONSIDERATIONS FOR CdTe PHOTOVOLTAICS
All technologies need to be carefully reviewed for possible environment, health, and safety
(EHS) risks and held to high standards of EHS protection across the product lifecycle. This includes
consideration of potential EHS risks associated with four aspects or phases of the technology’s
creation, use, and disposal: the materials used and their supply chains, the manufacturing process,
the use of the technology, and its recycling, disposal, or other end-of-life management. Increasingly,
many people suggest that this should be approached from the perspective of a circular economy, in
which all materials are used and re-used in a continuous cycle, with no waste streams.
For CdTe PV, all of these considerations are important, and, as a manufacturer, First Solar has
taken a number of steps to minimize EHS risks across the lifecycle of CdTe solar modules, using a
precautionary approach. Early in the development of CdTe, for example, prior to significant
manufacturing or deployment, research identified a number of recommendations related to industrial
hygiene, biomonitoring, worker training, and recycling to ensure robust EHS performance (Fthenakis
and Moskowitz, 2000), and these have been implemented throughout the product lifecycle. In
addition, First Solar has proactively established standards for quality control in both its supply chain
and manufacturing processes and has developed technologies, facilities, and programs to recycle
modules and recover materials for future use.
CdTe PV is a mature PV technology with over 25 GW of solar modules deployed globally over
the past 20 years, including 200+ million PV modules in over 18,000 projects in the Americas, Europe,
Middle East, Africa, Asia, and Australia. This two-decade history of manufacturing and deployment
allows for a track-record based approach to evaluating EHS risks (Hagendorf et al., 2017; VCCER,
2019; Fthenakis et al., 2020) to complement the precautionary approach taken during the original
development and deployment of CdTe PV.

71
A - Materials and Supply Chain
A complete First Solar Series 6 module requires both raw materials and manufactured
components (Table 5). These are sourced from qualified suppliers. First Solar spends over $1.9 billion
globally, each year, on raw materials and manufactured components. First Solar has various quality
control measures in place to curtail variation in suppliers and their products (2018). These measures
reduce performance variations in the final First Solar PV module. Any new suppliers are required to
undergo a rigorous Supplier Qualification process, which is linked to First Solar’s Change Management
System. The Supplier Quality group identifies and monitors cases of non-conformance with First Solar
requirements and requires suppliers to take permanent corrective actions to address issues. A cross-
functional team reviews suppliers for quality, cost, flexibility, service, technology, and sustainability, in
order to provide feedback to continue meeting First Solar’s needs. All suppliers must provide First
Solar with confirmation that they follow fair labor standard laws aligned with Responsible Business
Alliance (RBA) code of conduct and referencing international labor and human rights. First Solar also
audits new and high-risk suppliers on environmental and social criteria with audit questions developed
based on the RBA code of conduct (First Solar, 2018).
Table 5. First Solar Series 6 Module Composition
Item Description % Weight of Module
Semiconductor material Thin-film Cadmium Telluride
(CdTe)
0.12%
Laminate material Polyolefin 2.02%
Bussing material Copper Leaf Foil and Bus Bars 0.025%
Glass Front (Substrate) Glass and
Back (Cover) Glass
84.5%
Junction Box and Cable
Assembly
Polyphenylene Housing and
Halogen-Free Electrical
Cables
0.56%
Frame and bars Aluminum 12.5%
Frame adhesive Silicon-based adhesive 0.83%
Table 5. Module composition of First Solar Series 6 modules (First Solar, 2019).
Of the raw materials, the semiconductor material used to convert sunlight to electricity is
cadmium telluride, which comprises about 0.12% of the total module weight. The glass modules
sealing the semiconductor comprise 84.5% of the module weight (30 kg). The aluminum frame and
bars that frame the module comprise most of the rest of the weight (4.5 kg).
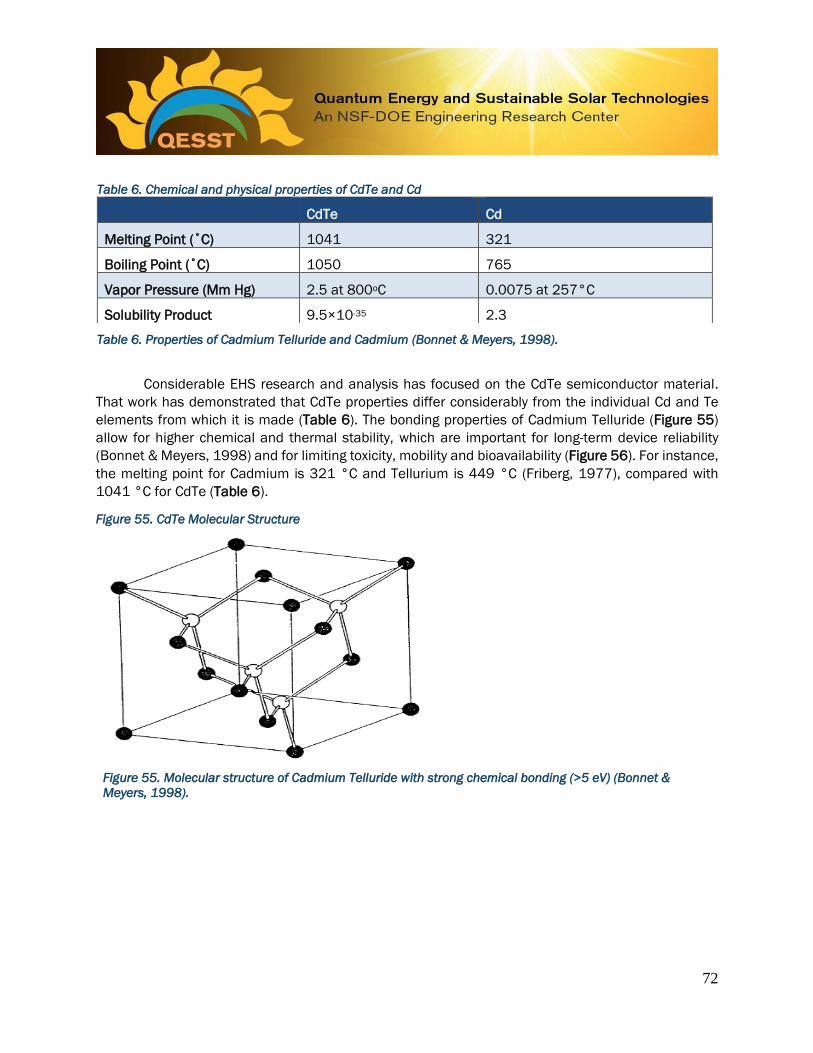
72
Table 6. Chemical and physical properties of CdTe and Cd
CdTe Cd
Melting Point (˚C) 1041 321
Boiling Point (˚C) 1050 765
Vapor Pressure (Mm Hg) 2.5 at 800oC 0.0075 at 257°C
Solubility Product 9.5×10⁻³⁵ 2.3
Table 6. Properties of Cadmium Telluride and Cadmium (Bonnet & Meyers, 1998).
Considerable EHS research and analysis has focused on the CdTe semiconductor material.
That work has demonstrated that CdTe properties differ considerably from the individual Cd and Te
elements from which it is made (Table 6). The bonding properties of Cadmium Telluride (Figure 55)
allow for higher chemical and thermal stability, which are important for long-term device reliability
(Bonnet & Meyers, 1998) and for limiting toxicity, mobility and bioavailability (Figure 56). For instance,
the melting point for Cadmium is 321 °C and Tellurium is 449 °C (Friberg, 1977), compared with
1041 °C for CdTe (Table 6).
Figure 55. CdTe Molecular Structure
Figure 55. Molecular structure of Cadmium Telluride with strong chemical bonding (>5 eV) (Bonnet &
Meyers, 1998).

73
Figure 56. CdTe Toxicology
Figure 56. Toxicological properties of CdTe and other Cd compounds (Kaczmar, 2011; Zayed &
Philippe, 2009).
As shown in Figure 56, CdTe exhibits toxicological properties that are approximately two to
three orders of magnitude lower than that of Cd and soluble Cd compounds. Similarly, Figure 57 shows
ecotoxicological properties of CdTe are approximately three orders of magnitude lower than Cd, based
on ecotoxicity characterization factors which relate chemical emissions to their life cycle
environmental impact.

74
Figure 57. Ecotoxicity of Metals
Figure 57. Ecotoxicity characterization factors (CF) for emissions to air, water, and soil for CdTe, Cd,
and metal ions (Sinha et al., 2018b).
First Solar sources its CdTe from supply chains that originate in zinc and copper mining. Zinc
mining has created an abundance of Cd as a byproduct, with a surplus projected due to reduced uses
in other applications (Matsuno et al., 2012). Tellurium is sourced as a byproduct of copper mining and
refining (Figure 58). First Solar’s suppliers make CdTe from these mining byproducts, and the CdTe is
then supplied as a stable compound to First Solar’s manufacturing facilities. CdTe is then
1.00E+01
1.00E+02
1.00E+03
1.00E+04
1.00E+05
1.00E+06
1.00E+07
CF in
-m3.
day/
kgem
itted
CF for ecotoxicity for emissions to air
Inorganics
CdTe
Cd(II)
1.00E+02
1.00E+03
1.00E+04
1.00E+05
1.00E+06
1.00E+07
CF in
-m3.
day/
kgem
itted CF for ecotoxicity for emissions to water
Inorganics
CdTe
Cd(II)
1.00E+02
1.00E+03
1.00E+04
1.00E+05
1.00E+06
1.00E+07
CF in
-m3.
day/
kgem
itted CF for ecotoxicity for emissions to soil
Inorganics
CdTe
Cd(II)
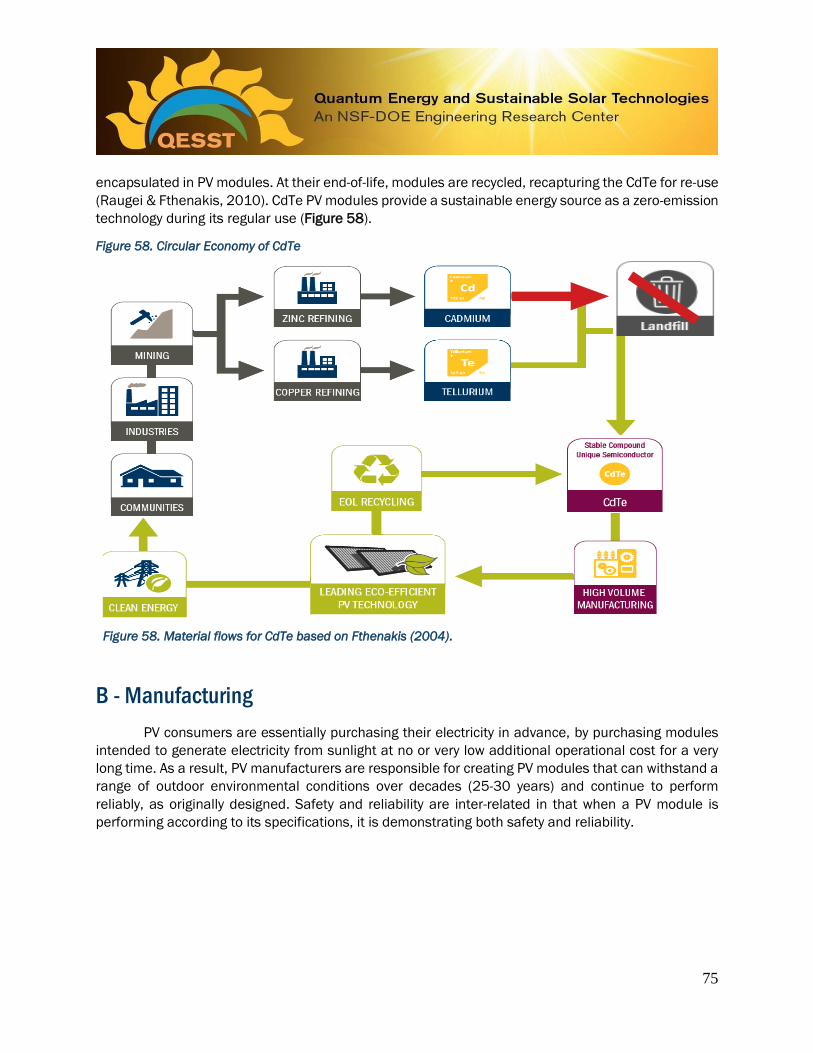
75
encapsulated in PV modules. At their end-of-life, modules are recycled, recapturing the CdTe for re-use
(Raugei & Fthenakis, 2010). CdTe PV modules provide a sustainable energy source as a zero-emission
technology during its regular use (Figure 58).
Figure 58. Circular Economy of CdTe
B - Manufacturing
PV consumers are essentially purchasing their electricity in advance, by purchasing modules
intended to generate electricity from sunlight at no or very low additional operational cost for a very
long time. As a result, PV manufacturers are responsible for creating PV modules that can withstand a
range of outdoor environmental conditions over decades (25-30 years) and continue to perform
reliably, as originally designed. Safety and reliability are inter-related in that when a PV module is
performing according to its specifications, it is demonstrating both safety and reliability.
Figure 58. Material flows for CdTe based on Fthenakis (2004).

76
Figure 59. Series 6 Manufacturing Process
Figure 59. Hyperlink to First Solar manufacturing process video.
Manufacturing operations and their relevance to product safety and reliability are considered
in this section with in-depth details on First Solar’s Series 6 CdTe PV manufacturing process. An
overview of manufacturing process is found in a First Solar video Figure 59.
III.B.1 - Manufacturing Facility
First Solar has now completed the upgrade of its Perrysburg, Ohio U.S. manufacturing plant to
produce Series 6 PV modules, at a cost of $175 Million USD (First Solar, 2018). This facility now has
the capacity to annually produce 0.6 GW of Series 6 solar modules. First Solar has also added a second
high-volume manufacturing facility (1.2 GW annual capacity; $400 million USD investment) in Ohio,
making First Solar the largest U.S. PV manufacturer. This facility upgrade added 500 employees to the
Perrysburg area, increasing the total First Solar workforce to 6,433 in 2018 (First Solar, 2019). The
upgraded facility utilizes an automated manufacturing process for the Series 6 PV modules (Figure
60). First Solar personnel on the manufacturing floor generally provide quality control functions and
troubleshoot the production line. In addition to manufacturing, the First Solar Ohio campuses have a
reliability lab, on-site wastewater treatment, and a PV module recycling facility that is reducing the total
amount of waste from the manufacturing plants.
Figure 60. CdTe Module Automation
Figure 60. Automated manufacturing process for First Solar Series 6 manufacturing.

77
III.B.2 - Manufacturing Process
Once materials arrive at the Perrysburg facility, the Series 6 modules are manufactured in a
single factory, along a continuous, automated assembly line, “under one roof” (Colville, 2017). There
are three major steps in the PV module production process: semiconductor deposition, cell definition,
and finishing (including testing the finished PV modules). Each step in the production line has a quality
control checkpoint. The employees perform rigorous quality tests to ensure each step of the production
process has a uniform result. The PV modules go through additional random batch quality sampling
procedures. The production cycle takes approximately 3.5 hours to complete each PV module (First
Solar, 2018). Figure 61 shows the module structure including the thin film semiconductor thickness
(~33 times thinner than a human hair) encapsulated in a glass-laminate-glass monolithic solid-state
device, with additional details below.
Figure 61. First Solar CdTe Module Structure
Figure 61. In the PV module structure, the CdTe semiconductor is a 3-micrometer thin film sealed between
two glass layers (First Solar, 2018).
Each glass module (front substrate glass and back cover glass) in the PV module is supplied
based on First Solar Series 6 module specifications, with tin oxide used as a transparent and
conductive contact on the front glass. These glass modules are cleaned, inspected, and mechanically
transported to a storage area.
A machine places the front glass module onto the semiconductor application (coater) line. A
thin film of CdTe is deposited onto the tin oxide layer. Because of the high chemical and thermal
stability of CdTe, multiple deposition methods can be used in the semiconductor application line, such
as electrodeposition and vapor transport. First Solar uses a vapor transport deposition technique,
which can yield higher deposition rates than other techniques such as closed-space sublimation
(Bonnet & Meyers, 1998). The back contact ZnTe layer is deposited onto the PV module using a
sputtering technique.

78
Workers perform a quality control analysis ensuring the semiconductor layer meets the
specifications to ensure proper PV module performance. Once the quality control step confirms the
semiconductor was correctly deposited, the modules are ready to be etched to define the cells.
A laser etching process scribes the individual PV cells, creating a path for the charge carriers
to travel through the PV module. The quality control step checks the laser etching details before the
module is encapsulated with polyolefin laminate and back glass. The interconnection bussing is added
to electrically connect PV cells and deliver current to the junction box before the module is
encapsulated.
The laminate and back cover glass are placed on top of the front glass, sealing the modules,
and an edge seal is also applied. An additional anti-reflective coating is applied to the front glass. The
CdTe semiconductor is encased within the PV module with an encapsulant bond strength on the order
of 5 megapascals (~50 kg/cm2 or ~725 pounds/inch2).
The junction box and electrical cables are then affixed onto the module. Each PV module is
flash tested with a sun simulator (1000 W/m2) to ensure it performs at a certain power rating. This is
the final step in the manufacturing process, after which the PV modules undergo final quality control.
A random selection of newly produced modules are subject to rigorous quality testing, including testing
for extended reliability (durability), in order to help ensure that the batch will withstand harsh outdoor
environments.
III.B.3 - Personnel and Worker Safety
First Solar’s manufacturing operation runs continuously (24 hours a day and 7 days a week).
To ensure worker safety and optimal production rates, four crews work 12-hour shifts throughout the
week. Production roles, production lines, and safety practices are standardized throughout all First
Solar facilities worldwide. The majority of First Solar employees (71%) work in manufacturing facilities.
In the U.S., there are over 1400 employees in the manufacturing department.
First Solar prioritizes worker safety and has taken proactive approaches to improve employee
wellbeing and strives to become an injury-free workplace. The most common injury types in First Solar
manufacturing facilities are bruise/contusion, strain/sprain, and cuts/lacerations. The primary
mechanisms of injury are hit/struck into, hit/struck by and overexertion/awkward posture
(ergonomics). Since 2008, when the injury rate was 2.6 injuries per 200,000 hours of exposure, First
Solar has made significant improvements towards worker safety. In 2018, there were 0.43 injuries per
200,000 hours of exposure at First Solar. Even though this number increased from 0.29 in 2017, it is
well below the glass manufacturing industry average of 4.9 (First Solar, 2019d). In 2017, First Solar
began transitioning manufacturing lines from Series 4 to Series 6, with fewer associates and
production hours worked due to retooling. The 2018 injury rate is similar to the 2016 injury rate (0.44
per 200,000 hours of exposure).
Employees are made aware of the mechanical, electrical, and chemical risks of being on the
manufacturing floor. Since these risks can cause bodily harm, floor personnel are required to go

79
through a full day of orientation and then hands-on training at their workstations. When they join the
company, workers are given orientation training and hands-on learning from other floor workers until
they are able to competently perform their role. During this training period, a veteran employee or line
manager takes responsibility for the employee and watches over them on the floor.
Manufacturing floor personnel and their surroundings are carefully monitored throughout the
facility. Employees and visitors are required to have personal protective equipment (PPE) when
entering the floor. Even though much of the production line is automated, PPE is required to protect
sight, hearing, hands, and feet. Incidents are recorded and reported to First Solar’s multiple safety
committees who meet bi-weekly and report to the Environmental, Health, and Safety committee every
quarter. Each recorded incident is reviewed, and safety committees take corrective actions to prevent
further injuries and ensure worker safety.
Floor personnel are tested for exposure to different chemicals and compounds including Cd
compounds. The safety team routinely monitors facility air quality. Manufacturing equipment is self-
enclosed with HEPA filtration used to capture particulate emissions (Lim, 2012). As shown in Figure
62, particulate Cd concentrations in indoor air are comparable across First Solar manufacturing
facilities and are over an order of magnitude below permissible exposure limits.
Figure 62. First Solar Facility 2019 Air Samples
Figure 62. First Solar manufacturing indoor air sampling in 2019 shows all three facilities are well below the
OSHA Exposure Limits and First Solar limits are stricter than OSHA limits. These figures are confirmed by
independent auditors (First Solar, 2019b).
0.12 0.16 0.17 0.060.18 0.10 0.05 0.130.13 0.13 0.13 0.09
0.0
0.5
1.0
1.5
2.0
2.5
3.0
3.5
4.0
4.5
5.0
Q1 2019 Q2 2019 Q3 2019 Q4 2019
Ave
rage
Man
ufac
turi
ng A
ir C
once
ntra
tion
(µg
Cd/m
3 )
First Solar Manufacturing Air Sampling 2019Area and personal monitoring of total particulates
USA
Malaysia
Vietnam
OSHA 8-hour Permissible Exposure Limit (5 µg Cd/m3)
First Solar 12-hour Permissible Exposure Limit (2.5 µg Cd/m3)
First Solar Action Level (1 µg Cd/m3)

80
Research has confirmed the effectiveness of First Solar industrial hygiene programs. In a
longitudinal biomonitoring study, First Solar studied thousands of workers in their Kulim, Malaysia
facility over a period of five years. Worker blood and urine Cd samples were well below occupational
safety limits and did not increase as a function of years worked (Sinha et al., 2016). External health
and safety auditors annually reconfirm safety and health outcomes for workers as part of ISO 45001
certification. As shown in Figure 63, biomonitoring concentrations are comparable across First Solar
manufacturing facilities and are about an order of magnitude below permissible exposure limits.
Figure 63. Biomonitoring of First Solar Workers
Figure 63. First Solar manufacturing floor worker’s biomonitoring results in 2019 show no significant
amount of cadmium when measured to OSHA limits for exposure (First Solar, 2019b).
III.B.4 - Production Quality and Safety
Throughout the production process each PV module is subjected to strict quality control
measures. These measures help create a uniform product that performs reliably and safely throughout
its 25-30 year life cycle. Quality control measures include in-line process monitoring and inspection,
production reliability monitoring, quality and reliability lab testing, and outdoor proving grounds
(Buehler, 2015).
From each batch of PV modules manufactured, modules are randomly selected and subjected
to extended reliability tests in addition to those implemented on the manufacturing line. These
modules undergo accelerated aging in environmental chambers that use multiple cycles of
temperature, humidity, and light exposure extremes (Figure 64). After testing, these modules are
recycled in First Solar’s recycling facilities. These tests help ensure that the modules are able to
withstand various environmental conditions in the field over long periods of time.
0.710.87
0.440.48 0.53 0.49
0
0.5
1
1.5
2
2.5
3
3.5
4
4.5
5
Vietnam Malaysia USA
Cd C
once
ntra
tion
First Solar Manufacturing
Biomonitoring (2019)
Blood (µg Cd/L) Urine (µg Cd/g Cr)
Blood Occupational limit (5 µg Cd/L) Urine Occupational limit (3 µg Cd/g Cr)
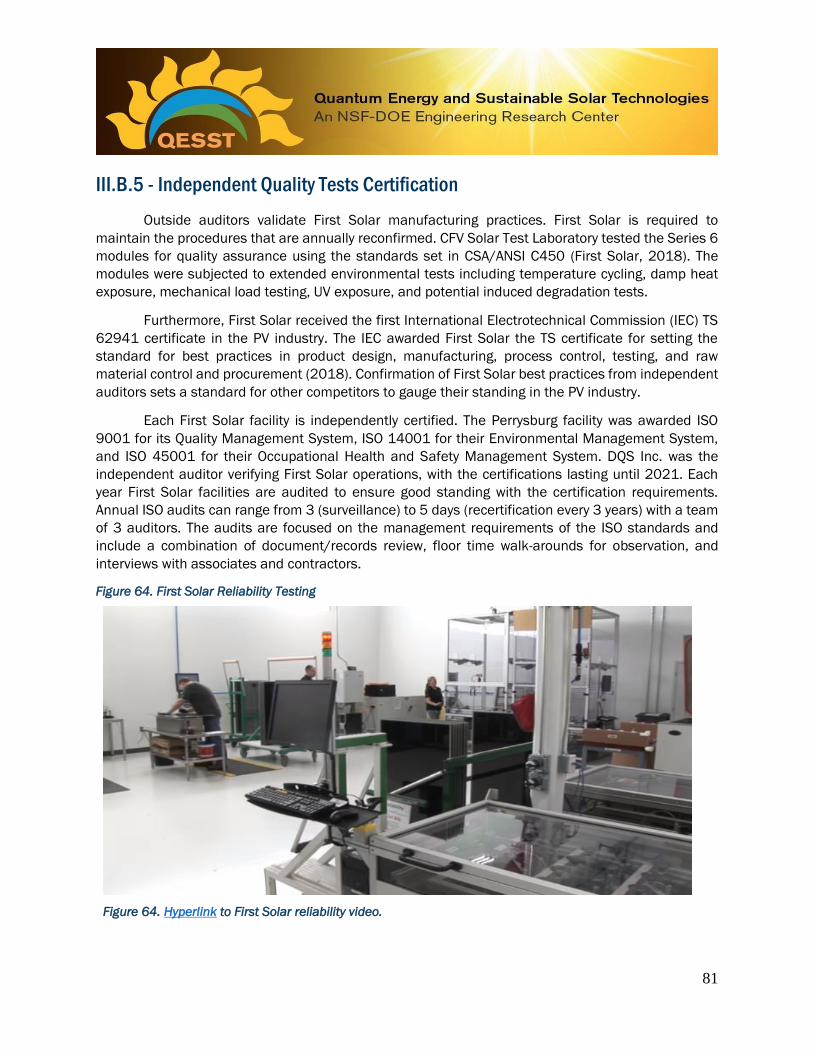
81
III.B.5 - Independent Quality Tests Certification
Outside auditors validate First Solar manufacturing practices. First Solar is required to
maintain the procedures that are annually reconfirmed. CFV Solar Test Laboratory tested the Series 6
modules for quality assurance using the standards set in CSA/ANSI C450 (First Solar, 2018). The
modules were subjected to extended environmental tests including temperature cycling, damp heat
exposure, mechanical load testing, UV exposure, and potential induced degradation tests.
Furthermore, First Solar received the first International Electrotechnical Commission (IEC) TS
62941 certificate in the PV industry. The IEC awarded First Solar the TS certificate for setting the
standard for best practices in product design, manufacturing, process control, testing, and raw
material control and procurement (2018). Confirmation of First Solar best practices from independent
auditors sets a standard for other competitors to gauge their standing in the PV industry.
Each First Solar facility is independently certified. The Perrysburg facility was awarded ISO
9001 for its Quality Management System, ISO 14001 for their Environmental Management System,
and ISO 45001 for their Occupational Health and Safety Management System. DQS Inc. was the
independent auditor verifying First Solar operations, with the certifications lasting until 2021. Each
year First Solar facilities are audited to ensure good standing with the certification requirements.
Annual ISO audits can range from 3 (surveillance) to 5 days (recertification every 3 years) with a team
of 3 auditors. The audits are focused on the management requirements of the ISO standards and
include a combination of document/records review, floor time walk-arounds for observation, and
interviews with associates and contractors.
Figure 64. First Solar Reliability Testing
Figure 64. Hyperlink to First Solar reliability video.
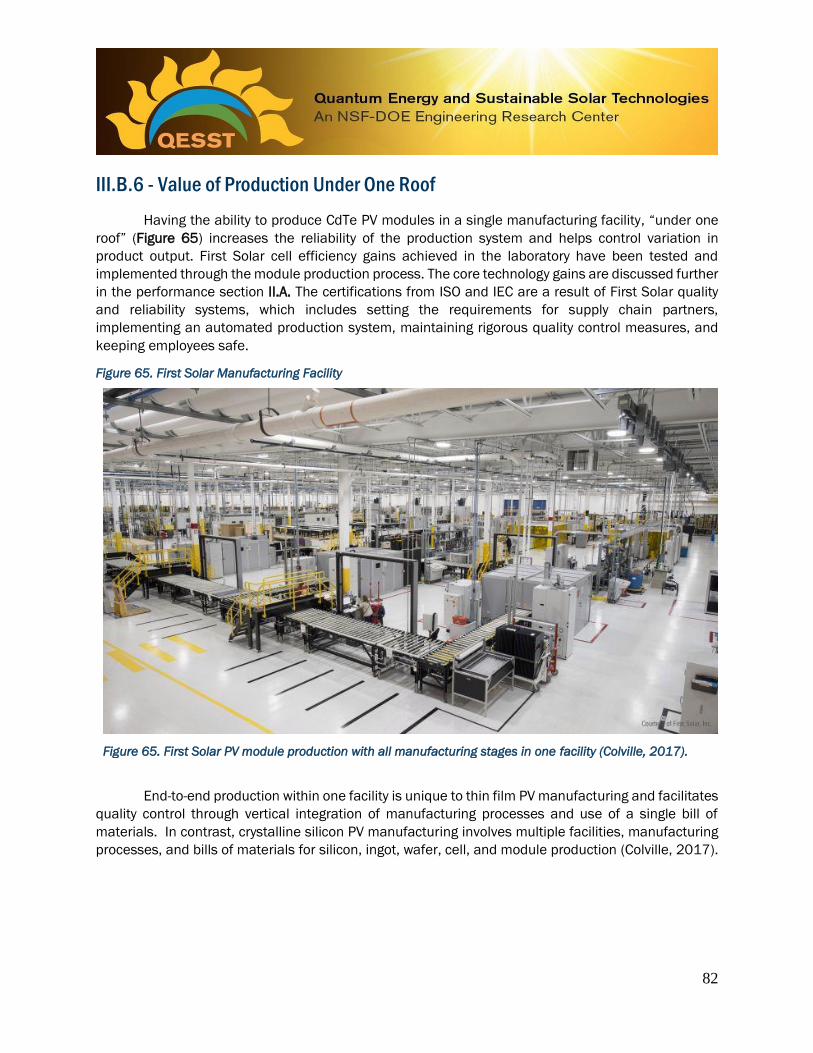
82
III.B.6 - Value of Production Under One Roof
Having the ability to produce CdTe PV modules in a single manufacturing facility, “under one
roof” (Figure 65) increases the reliability of the production system and helps control variation in
product output. First Solar cell efficiency gains achieved in the laboratory have been tested and
implemented through the module production process. The core technology gains are discussed further
in the performance section II.A. The certifications from ISO and IEC are a result of First Solar quality
and reliability systems, which includes setting the requirements for supply chain partners,
implementing an automated production system, maintaining rigorous quality control measures, and
keeping employees safe.
Figure 65. First Solar Manufacturing Facility
Figure 65. First Solar PV module production with all manufacturing stages in one facility (Colville, 2017).
End-to-end production within one facility is unique to thin film PV manufacturing and facilitates
quality control through vertical integration of manufacturing processes and use of a single bill of
materials. In contrast, crystalline silicon PV manufacturing involves multiple facilities, manufacturing
processes, and bills of materials for silicon, ingot, wafer, cell, and module production (Colville, 2017).

83
C - Operational Life Cycle and Non-Routine Events
Environment, health, and safety considerations are also important once technologies are
deployed in the field. Evaluations of field performance are made via testing and modeling, as well as
via observations of field experience. Over 80,000 First Solar modules undergo extensive quality and
reliability testing annually (First Solar, 2018). In addition, data have been collected for extreme
weather events such as hurricanes and tornados, and modules have been tested for non-routine
events such as fire and field breakage as discussed below.
Table 7. First Solar PV Plants in the United States
Table 7A. Example southwest U.S. utility-scale solar projects utilizing CdTe PV technology.
PROJECT OWNER LOCATION STATE STATUS O&M PPA SIZE (MW AC)
OFFTAKER
Sun Streams First Solar Maricopa County AZ Development 150 SCE
Agua Caliente NRG Energy & BHE Renewables
Yuma County AZ Operation ✓ 290 PG&E
American Kings First Solar Kings County CA Development 123 SCE
Little Bear Solar First Solar Fresno County CA Development 40 Marin Clean Energy
Windhub First Solar Kern County CA Development 20 SCE
California Flats Capital Dynamics Monterey County CA Construction ✓ 280 PG&E & Apple
Rosamond First Solar Kern County CA Construction 150 SCE
Willow Springs First Solar Kern County CA Construction 100 SCE
AVSR1 Exelon Los Angeles County CA Operation ✓ 230 PG&E
Blythe NRG Energy Riverside County CA Operation ✓ 21 SCE
Campo Verde Southern Power Imperial County CA Operation ✓ 139 SDG&E
Cuyama D.E. Shaw Renewable Investments Santa Barbara County CA Operation ✓ 40 PG&E
Desert Sunlight NextEra Energy Resources, NRG Energy & Sumitomo Corp of America
Riverside County
CA
Operation ✓
550
PG&E and SCE
Kingbird 8point3 Energy Partners Kern County CA Operation ✓ 40 Cities of Pasadena, Riverside, Colton and Azusa
Lost Hills Blackwell Southern Power & 8point3 Kern County CA Operation ✓ 32 PG&E, City of Roseville
North Star Southern Power & 8point3 Fresno County CA Operation ✓ 60 PG&E
Portal Ridge D.E. Shaw Renewable Investments Los Angeles County CA Operation 32 PG&E and SCE
Rancho Seco D.E. Shaw Renewable Investments Sacramento County CA Operation ✓ 11 SMUD
Solar Gen 2 Southern Power & 8point3 Imperial County CA Operation ✓ 150 SDG&E
Stateline Southern Power & 8point3 San Bernardino County CA Operation ✓ 300 SCE
Topaz Solar Farms BHE Renewables San Luis Obispo County CA Operation ✓ 550 PG&E
Cimarron Southern Power and Turner Renewable Energy
Colfax County NM Operation ✓ 30 Tri-State Generation and Transmission Association
Macho Springs Southern Power Luna County NM Operation ✓ 50 El Paso Electric
Sunshine Valley First Solar Nye County NV Development 100 SCE
Switch Station 1 & 2 EDFRenewable Energy& J.P. Morgan Clark County NV Operation ✓ 180 NV Energy
Moapa Southern Paiute
Capital Dynamics Clark County NV Operation ✓ 250 LADWP
Silver State South NextEra Energy Resources Clark County NV Operation 250 SCE
Silver State North Enbridge Clark County NV Operation ✓ 50 NV Energy
Barilla First Solar Pecos County TX Operation ✓ 30 -
East Pecos Southern Power Pecos County TX Operation ✓ 119 Austin Energy

84
Over 10 GW of CdTe PV has been deployed in the U.S., including both projects self-developed
by First Solar and by third-party developers. Example projects are shown in Table 7 and range from
10 to 550 MW AC. First Solar PV systems are designed for ground-mount utility scale projects. This
market approach has shaped how the PV modules are installed and maintained. Engineering,
Procurement, and Construction (EPC) contractors are used to install the PV systems. First Solar offers
to operate and maintain the power system and provide end of life recycling options which are
discussed in section III.D.
Table 7B. Example southeast U.S. utility-scale solar projects utilizing CdTe PV technology.
III.C.1 - Field Breakage
Broken modules refer to PV modules with cracked glass which may result from extreme
weather (e.g. impact fracture from hail) or human factors (e.g., stress fracture from installation
damage). Based on warranty return statistics, module breakage is rare, occurring in approximately 1%
of modules over the 25-year warranty operating life (0.04%/yr). Over one-third of breakages occur
during shipping and installation, resulting in removal for take-back and recycling. For the remainder,
routine module inspections and power output monitoring are used to identify modules that are non-
functioning potentially due to breakage (Sinha & Wade, 2015). Utility-scale PV systems are sizeable
investments that are continuously monitored (see section III.C.4).

85
Figure 66. CdTe PV Field Breakage Fate and Transport Evaluation
Figure 66. Comparison of Cd exposure point concentrations in soil (top), groundwater (middle) and air
(bottom) to USEPA health screening levels for CdTe PV field breakage in residential rooftops, commercial
rooftops and ground-mounted utility-scale scenario Exposure point concentrations are shown in blue and
health screening levels are shown with dashed lines (IEA, 2019a).
1.0E-07
1.0E-06
1.0E-05
1.0E-04
1.0E-03
1.0E-02
1.0E-01
1.0E+00
1.0E+01
1.0E+02
1.0E+03
Residential Commercial Utility-Scale
mg C
d/kg
CdTe PV Soil Evaluation
Exposure Point Concentration Residential screening value
Commercial/industrial screening level
1.0E-131.0E-121.0E-111.0E-101.0E-091.0E-081.0E-071.0E-061.0E-051.0E-041.0E-031.0E-021.0E-011.0E+00
Residential Commercial Utility-Scale
µg C
d/m
3
CdTe PV Air Evaluation
Exposure Point Concentration Residential screening level
Commercial/industrial screening level
1.0E-101.0E-091.0E-081.0E-071.0E-061.0E-051.0E-041.0E-031.0E-021.0E-011.0E+00
Residential Commercial Utility-Scale
mg Cd
/L
CdTe PV Groundwater Evaluation
Exposure Point Concentration
Residential/commercial/industrial screening value
Maximum contaminant level
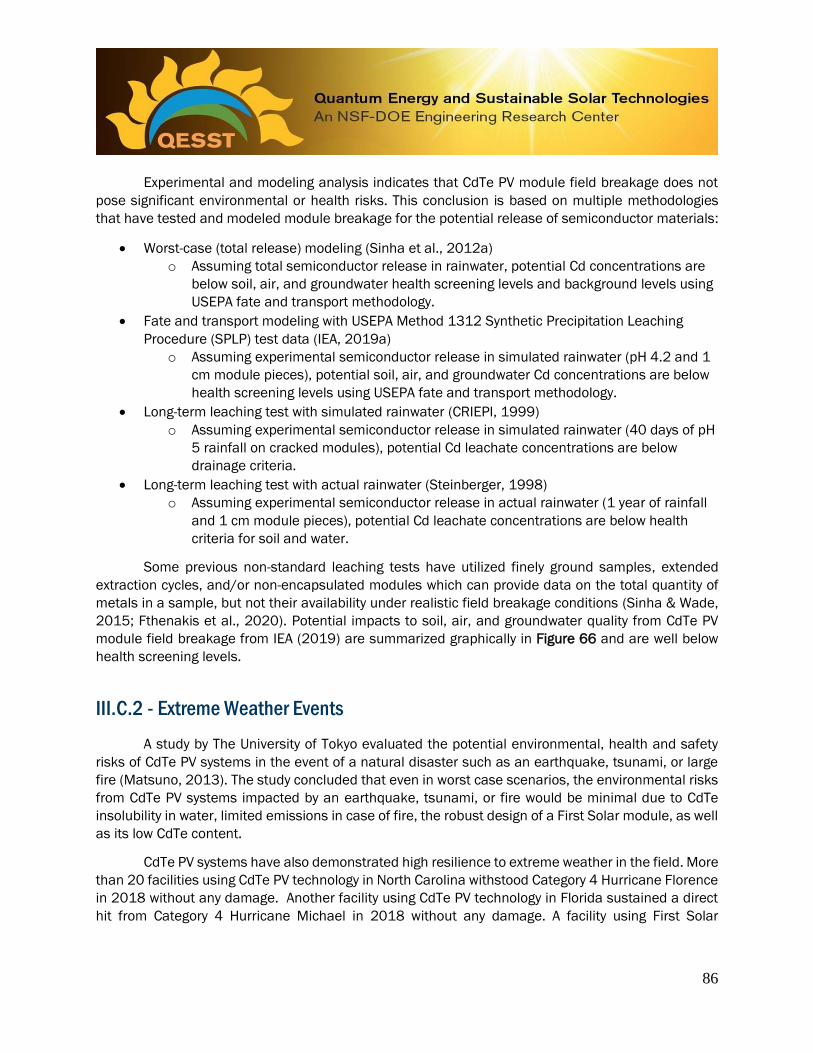
86
Experimental and modeling analysis indicates that CdTe PV module field breakage does not
pose significant environmental or health risks. This conclusion is based on multiple methodologies
that have tested and modeled module breakage for the potential release of semiconductor materials:
• Worst-case (total release) modeling (Sinha et al., 2012a)
o Assuming total semiconductor release in rainwater, potential Cd concentrations are
below soil, air, and groundwater health screening levels and background levels using
USEPA fate and transport methodology.
• Fate and transport modeling with USEPA Method 1312 Synthetic Precipitation Leaching
Procedure (SPLP) test data (IEA, 2019a)
o Assuming experimental semiconductor release in simulated rainwater (pH 4.2 and 1
cm module pieces), potential soil, air, and groundwater Cd concentrations are below
health screening levels using USEPA fate and transport methodology.
• Long-term leaching test with simulated rainwater (CRIEPI, 1999)
o Assuming experimental semiconductor release in simulated rainwater (40 days of pH
5 rainfall on cracked modules), potential Cd leachate concentrations are below
drainage criteria.
• Long-term leaching test with actual rainwater (Steinberger, 1998)
o Assuming experimental semiconductor release in actual rainwater (1 year of rainfall
and 1 cm module pieces), potential Cd leachate concentrations are below health
criteria for soil and water.
Some previous non-standard leaching tests have utilized finely ground samples, extended
extraction cycles, and/or non-encapsulated modules which can provide data on the total quantity of
metals in a sample, but not their availability under realistic field breakage conditions (Sinha & Wade,
2015; Fthenakis et al., 2020). Potential impacts to soil, air, and groundwater quality from CdTe PV
module field breakage from IEA (2019) are summarized graphically in Figure 66 and are well below
health screening levels.
III.C.2 - Extreme Weather Events
A study by The University of Tokyo evaluated the potential environmental, health and safety
risks of CdTe PV systems in the event of a natural disaster such as an earthquake, tsunami, or large
fire (Matsuno, 2013). The study concluded that even in worst case scenarios, the environmental risks
from CdTe PV systems impacted by an earthquake, tsunami, or fire would be minimal due to CdTe
insolubility in water, limited emissions in case of fire, the robust design of a First Solar module, as well
as its low CdTe content.
CdTe PV systems have also demonstrated high resilience to extreme weather in the field. More
than 20 facilities using CdTe PV technology in North Carolina withstood Category 4 Hurricane Florence
in 2018 without any damage. Another facility using CdTe PV technology in Florida sustained a direct
hit from Category 4 Hurricane Michael in 2018 without any damage. A facility using First Solar
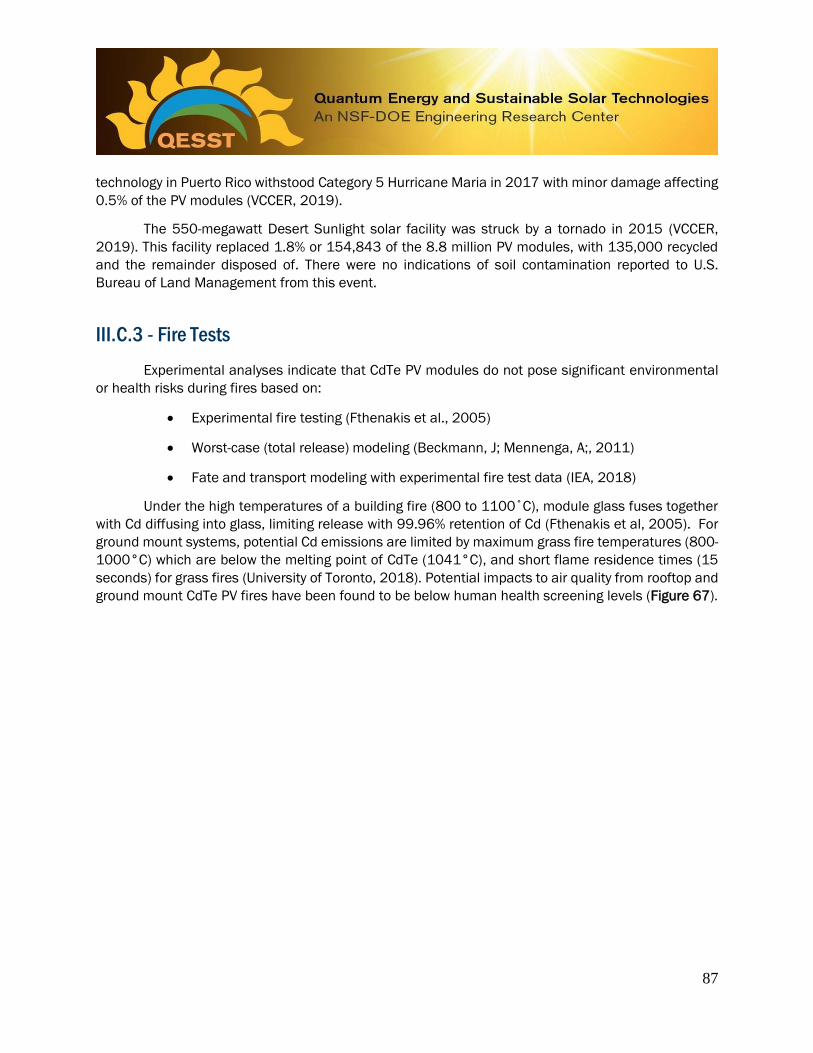
87
technology in Puerto Rico withstood Category 5 Hurricane Maria in 2017 with minor damage affecting
0.5% of the PV modules (VCCER, 2019).
The 550-megawatt Desert Sunlight solar facility was struck by a tornado in 2015 (VCCER,
2019). This facility replaced 1.8% or 154,843 of the 8.8 million PV modules, with 135,000 recycled
and the remainder disposed of. There were no indications of soil contamination reported to U.S.
Bureau of Land Management from this event.
III.C.3 - Fire Tests
Experimental analyses indicate that CdTe PV modules do not pose significant environmental
or health risks during fires based on:
• Experimental fire testing (Fthenakis et al., 2005)
• Worst-case (total release) modeling (Beckmann, J; Mennenga, A;, 2011)
• Fate and transport modeling with experimental fire test data (IEA, 2018)
Under the high temperatures of a building fire (800 to 1100˚C), module glass fuses together
with Cd diffusing into glass, limiting release with 99.96% retention of Cd (Fthenakis et al, 2005). For
ground mount systems, potential Cd emissions are limited by maximum grass fire temperatures (800-
1000°C) which are below the melting point of CdTe (1041°C), and short flame residence times (15
seconds) for grass fires (University of Toronto, 2018). Potential impacts to air quality from rooftop and
ground mount CdTe PV fires have been found to be below human health screening levels (Figure 67).
88
Figure 67. CdTe PV Fire Fate and Transport Evaluation
Figure 67A. Maximum ground-level ambient air Cd concentration and acute exposure screening guideline
levels (AEGL) for building fires with rooftop CdTe PV. Y-axis shows ground-level Cd emissions concentration
(mg/m3) and x-axis shows downwind distance from fire (m). Acute exposure guideline (AEGL) assessment
values for Cd are shown above the emissions concentrations (Beckmann and Mennenga, 2011).
Figure 67B. Maximum ground-level ambient air Cd concentration and acute exposure screening guideline
levels (AEGL) for building fires with rooftop CdTe PV (IEA, 2018).
III.C.4 - Operations and Maintenance (O&M)
The field performance and safety of PV systems is improved through proper operation and
maintenance (O&M) processes. Utility-scale PV systems are sizeable investments where the reliability
0.001
0.1
10
1000
0 50 100 150 200 250 300 350 400 450 500
Max
imu
m g
rou
nd
-lev
el a
ir
con
cen
trat
ion
(μ
g C
d/m
3 )
Averaging period (min)
Small building fire Medium building fire Large building fire AEGL-2 screening level

89
and durability of the PV modules and systems over the 25-30 year lifespan are critical factors that are
continuously monitored (Figure 70). PV plant operation and maintenance (O&M) processes directly
impact the return on investment. O&M practices can lead to optimal energy yield, as well as field safety
through continuous monitoring of the condition of the field, whereas lack of O&M can lead to cascading
power failures with fiscal losses. In the solar industry, O&M sector growth is tied to recent scaling of
large-scale PV deployment. O&M companies use the energy availability metric to quantify the value of
their services.
O&M best practices can help PV installations produce higher yields. The energy yield of a PV
solar plant is affected by a large set of factors. Weather patterns, the time of day, and seasonal
variability, are a few factors affecting the energy availability metric (Hunt et al., 2015). PV solar plants
have different options in maximizing the value of solar energy, with storage of solar energy discussed
later in section V.B.
The plant operator managing the O&M of a PV plant controls the power generation output. This
output is predicted in advance and measured in real-time to ensure the PV plant is performing at
optimal capacity. Software is integral in monitoring the status of the PV system and components in
real-time. Plant operators use different software such as PVGuard, PVSyst, and PlantPredict to
estimate plant performance and effective availability. The accuracy of the software depends on the
input factors; some do not control for system interruptions such as inverter failure, forced outages,
and outages outside of management control. Plant operators must account for the nuances unique to
solar plants, such as partial plant downtimes where one inverter may be offline while the rest operate
normally (Hunt et al., 2015).
As an O&M provider, First Solar has a central PV plant management for operations and on-site
technicians for maintenance. In 2015, 5 Gigawatts of PV plants were managed by First Solar making
them the largest O&M management company in the world (Figure 69) (GTM Research , 2015). In
2019, First Solar O&M increased to 10 Gigawatts under management, with high average availability
(>99%) (2019). 10 Gigawatts of modules requires First Solar to manage over 70 square miles of
area (Figure 68).

90
Figure 68. 1 MW Block of CdTe PV
Figure 68. Components needed for 1 Megawatt block of First Solar PV.
A part of First Solar’s Quality and Reliability Mission includes PV plant monitoring through
measuring PV plant performance against predictions. First Solar captures PV system performance data
through the plants it manages and through PV plant surveys. This ongoing validation of First Solar PV
module performance is in addition to data from the 40+ First Solar field test sites. First Solar energy
predictions were within ±5% of actual plant energy yield (Ghiotto et al., 2016).
On-site technicians address issues at the plant, including all types of outages, and perform
proactive services to reduce potential downtime and component failure. Technicians inspect modules
and manage the grounds around the modules. In response to plant equipment failures, critical system
components are procured to provide the most cost-effective options to reduce PV plant downtime.
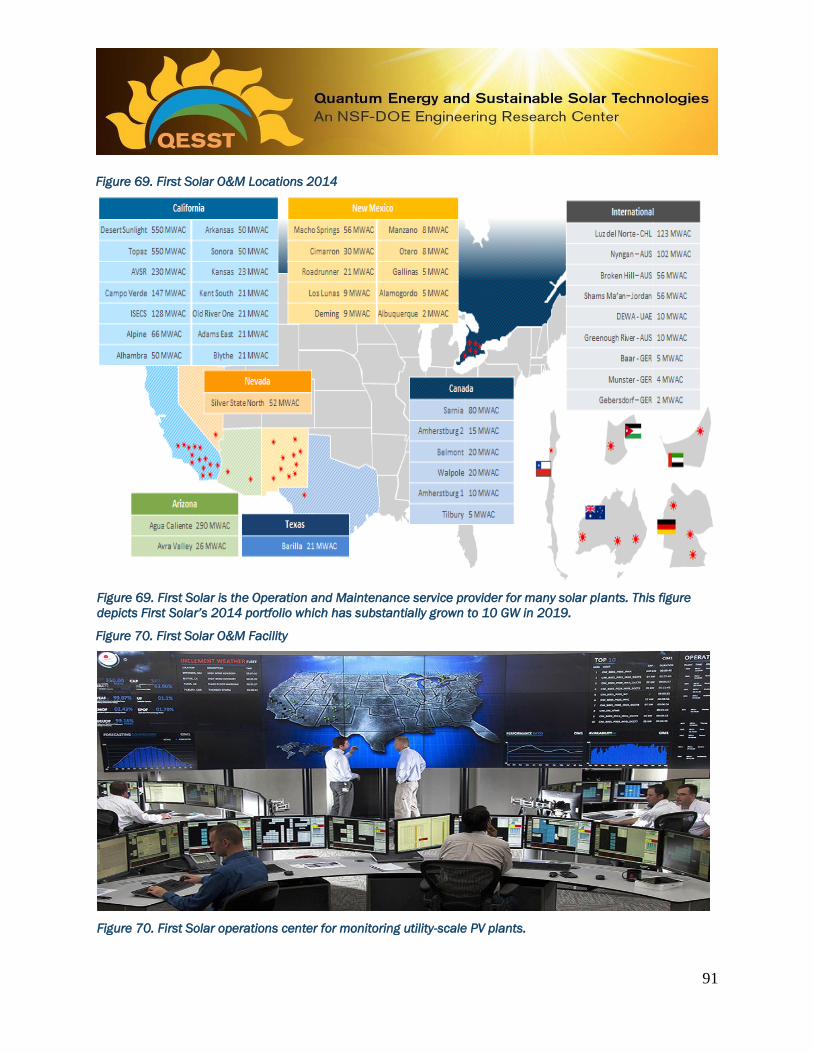
91
Figure 69. First Solar O&M Locations 2014
Figure 69. First Solar is the Operation and Maintenance service provider for many solar plants. This figure
depicts First Solar’s 2014 portfolio which has substantially grown to 10 GW in 2019.
Figure 70. First Solar O&M Facility
Figure 70. First Solar operations center for monitoring utility-scale PV plants.
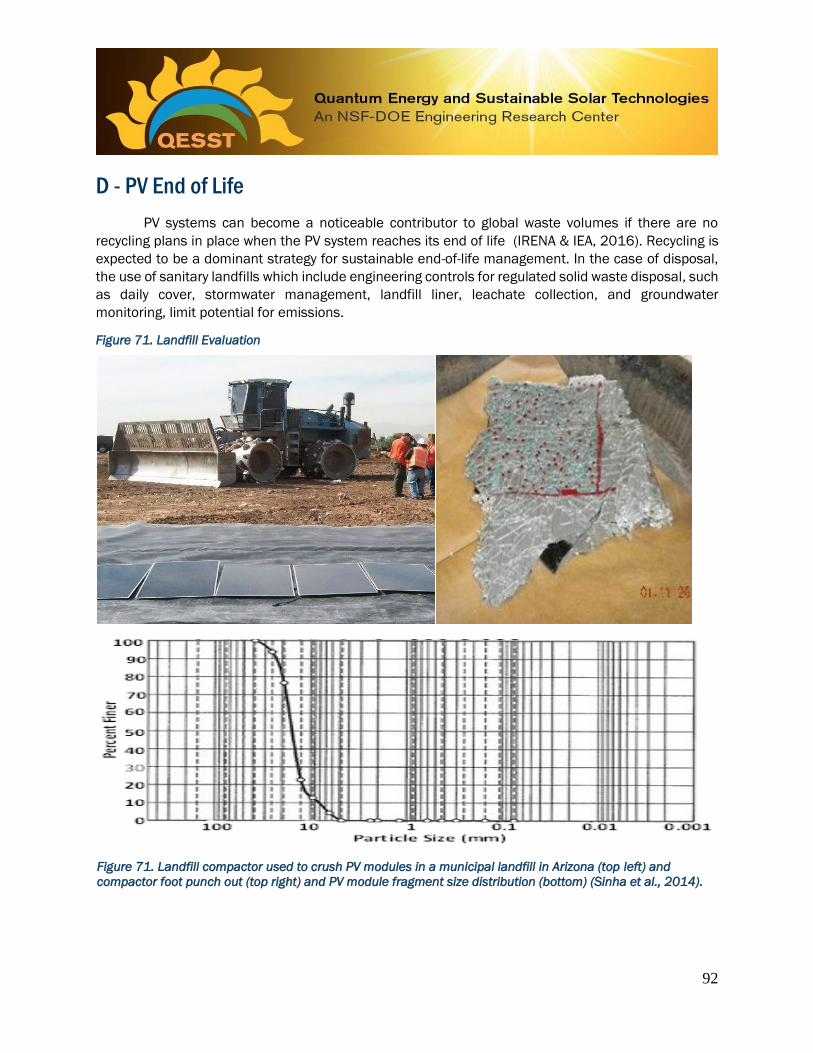
92
D - PV End of Life
PV systems can become a noticeable contributor to global waste volumes if there are no
recycling plans in place when the PV system reaches its end of life (IRENA & IEA, 2016). Recycling is
expected to be a dominant strategy for sustainable end-of-life management. In the case of disposal,
the use of sanitary landfills which include engineering controls for regulated solid waste disposal, such
as daily cover, stormwater management, landfill liner, leachate collection, and groundwater
monitoring, limit potential for emissions.
Figure 71. Landfill Evaluation
Figure 71. Landfill compactor used to crush PV modules in a municipal landfill in Arizona (top left) and
compactor foot punch out (top right) and PV module fragment size distribution (bottom) (Sinha et al., 2014).
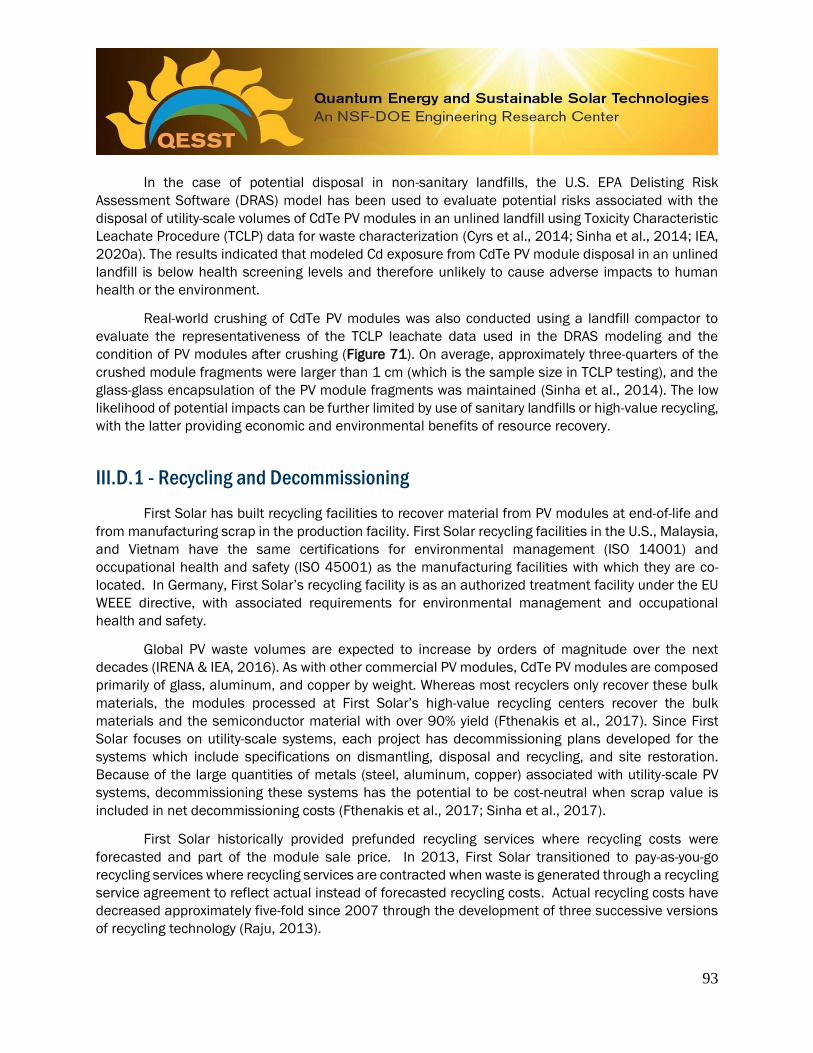
93
In the case of potential disposal in non-sanitary landfills, the U.S. EPA Delisting Risk
Assessment Software (DRAS) model has been used to evaluate potential risks associated with the
disposal of utility-scale volumes of CdTe PV modules in an unlined landfill using Toxicity Characteristic
Leachate Procedure (TCLP) data for waste characterization (Cyrs et al., 2014; Sinha et al., 2014; IEA,
2020a). The results indicated that modeled Cd exposure from CdTe PV module disposal in an unlined
landfill is below health screening levels and therefore unlikely to cause adverse impacts to human
health or the environment.
Real-world crushing of CdTe PV modules was also conducted using a landfill compactor to
evaluate the representativeness of the TCLP leachate data used in the DRAS modeling and the
condition of PV modules after crushing (Figure 71). On average, approximately three-quarters of the
crushed module fragments were larger than 1 cm (which is the sample size in TCLP testing), and the
glass-glass encapsulation of the PV module fragments was maintained (Sinha et al., 2014). The low
likelihood of potential impacts can be further limited by use of sanitary landfills or high-value recycling,
with the latter providing economic and environmental benefits of resource recovery.
III.D.1 - Recycling and Decommissioning
First Solar has built recycling facilities to recover material from PV modules at end-of-life and
from manufacturing scrap in the production facility. First Solar recycling facilities in the U.S., Malaysia,
and Vietnam have the same certifications for environmental management (ISO 14001) and
occupational health and safety (ISO 45001) as the manufacturing facilities with which they are co-
located. In Germany, First Solar’s recycling facility is as an authorized treatment facility under the EU
WEEE directive, with associated requirements for environmental management and occupational
health and safety.
Global PV waste volumes are expected to increase by orders of magnitude over the next
decades (IRENA & IEA, 2016). As with other commercial PV modules, CdTe PV modules are composed
primarily of glass, aluminum, and copper by weight. Whereas most recyclers only recover these bulk
materials, the modules processed at First Solar’s high-value recycling centers recover the bulk
materials and the semiconductor material with over 90% yield (Fthenakis et al., 2017). Since First
Solar focuses on utility-scale systems, each project has decommissioning plans developed for the
systems which include specifications on dismantling, disposal and recycling, and site restoration.
Because of the large quantities of metals (steel, aluminum, copper) associated with utility-scale PV
systems, decommissioning these systems has the potential to be cost-neutral when scrap value is
included in net decommissioning costs (Fthenakis et al., 2017; Sinha et al., 2017).
First Solar historically provided prefunded recycling services where recycling costs were
forecasted and part of the module sale price. In 2013, First Solar transitioned to pay-as-you-go
recycling services where recycling services are contracted when waste is generated through a recycling
service agreement to reflect actual instead of forecasted recycling costs. Actual recycling costs have
decreased approximately five-fold since 2007 through the development of three successive versions
of recycling technology (Raju, 2013).

94
III.D.2 - Recycling Process
The recycling process has three main parts: pretreatment, delamination, and recovery. During
the pretreatment phase, the aluminum frame and junction box with cables are removed (Fthenakis,
2004). The delamination phase uses mechanical crushing steps with a shredder and a hammermill.
The final step is where the glass and semiconductor material are both recovered using hydrogen
peroxide and sulfuric acid leaching solution (Figure 72). During this process, the semiconductor is
leached and precipitated, with unrefined semiconductor material containing Cd and Te sent to a third-
party supplier for refining and compounding back to semiconductor-grade CdTe. An estimated 90% of
the semiconductor and glass is recovered in First Solar’s recycling facility (Raju, 2013). The remaining
10% consists largely of glass fines which are too small to recycle and some encapsulant material which
has not been completely separated from glass.
Figure 72. Recycling Process
Figure 72. First Solar’s recycling process flow (Version 3) (2019).
III.D.3 - First Solar Recycling Capacity
Currently, First Solar’s recycling facilities range in capacity from 30 to 150 metric tons per day
(Sinha et al., 2017). These facilities are found in Germany, Vietnam, Malaysia, and the U.S. The
Perrysburg, Ohio U.S. facility has the capacity to process 150 metric tons with zero wastewater
discharge (First Solar, 2019d). The U.S. recycling facility is continuously operating (24 hours a day and
7 days a week). In 2018, First Solar recycled about 21,000 metric tons of PV modules, including about
5,000 metric tons in the U.S. facility, the majority of which was manufacturing scrap. The recycled
material figures will continue to increase as more modules reach their end-of-life. For perspective,
IRENA and IEA have forecasted cumulative global PV module waste of about 1.7 million metric tons
through 2030 under their regular-loss scenario (IRENA & IEA, 2016). With current recycling throughput
Shredder Hammermill Crushed/Milled Scrap
Holding Bin
EVA/Glass Separation
Metals Precipitation CdTeUnrefined
Semiconductor Material
Film Removal Solid/ Liquid Separation
Glass products
Rubber products
FS PV modules
Third-party Cd/Te
Separation & Refining

95
of about 20,000-30,000 metric tons per year, First Solar recycling facilities could process the
equivalent of 10-20% of global PV module waste from 2020-2030. If all four First Solar recycling
facilities were operating Version 3 recycling (150 metric tons per day each), annual recycling
throughput could be increased substantially to over 200,000 metric tons per year.
When considering manufacturing waste other than PV modules, First Solar recycled 15,740
metric tons and disposed of 7,250 metric tons in 2018 (First Solar, 2019). The 2018 recycled amounts
include both hazardous and non-hazardous materials as set forth in U.S. Resource Conservation and
Recovery Act, the Malaysian Environmental Quality Schedule Wastes regulations, the Vietnamese Law
No. 55/2014/QH13 on Environmental Protection, and European Union Waste Electrical & Electronic
Equipment directive (First Solar, 2019d; Sinha et al., 2017). As shown in Figure 73, 68-85% of total
manufacturing waste was recycled from 2015-2018.
Figure 73. Manufacturing Waste Recycling and Disposal Breakdown 2015-2018
Figure 73. Waste percentages of recycled and disposed material for manufacturing waste other than PV
modules at First Solar production facilities (First Solar, 2019d).
III.D.4 - Future of PV Recycling
The initial challenge of creating a commercial-scale recycling technology was addressed over
a decade ago when First Solar established the PV industry’s first global recycling program. Future
challenges include addressing the collection cost of transporting the modules to a recycling facility.
This requires setting up either mobile recycling operations or devising cost-effective transportation
schemes for the modules. Along with the recyclers, PV system owners and policymakers will play an
integral role in addressing the following key challenges for end-of-life management of PV modules
(Sinha et al., 2017).
• Predictable waste volumes
• Collection logistics
• Off-takers for the recycling products.

96
IV - COMPARISON OF PV ENVIRONMENTAL IMPACTS
A - Overall Life Cycle Environmental Comparisons
The primary benefit of PV electricity is its superior environmental performance compared to
conventional power plants. Across a wide range of indicators, PV technologies generally have lower
environmental impacts than other energy technologies, both overall and on a basis of per unit energy
generated. Among PV technologies, CdTe thin-film PV has a particularly good environmental
performance.
Conventional U.S. electricity grid generation systems are predominantly powered by
combustion-based or thermal power plants using coal, natural gas, and oil fuel that are alternatively
labeled as carbon-based fuels or fossil fuels. Based on life cycle advantages relative to conventional
grid power generation sources, Fthenakis et al. found that replacing grid electricity with ground-mount
CdTe PV systems in the U.S. can result in 89–98% reductions of GHG emissions, criteria pollutants,
heavy metals, and radioactive species (2008). These include reductions in life cycle emissions of Cd,
which is routinely emitted during coal electricity generation and oil combustion (Figure 74).
Figure 74. Cd Emissions of Different Power Generation Systems
Figure 74. Life cycle Cd emissions per Gigawatt-hour Produced (Fthenakis et al., 2008).
97
A primary difference between PV systems and conventional generation is that PV systems have
no emissions during operation. Combustion of fossil fuel for conventional generation have large use-
phase emissions which are bound to increase as electricity demand increases. For example, use-
phase emissions from energy consumption at conventional power plants and combined-heat-and-
power plants in the U.S. amounted to approximately 2 billion metric tons of CO2-equivalent (eq) per
year over the period 2008-2018 (EIA, 2020b). PV and other zero emission systems on average
displace about 950 lb CO2,eq/MWh (430 kg CO2,eq/MWh) for each MWh generated for the U.S. grid
(EPA, 2020).
In addition to greenhouse gas emissions, U.S. grid electricity generation also emits on average
about 0.3 kg/MWh each of the air pollutants sulfur dioxide (SO2) and nitrogen oxides (NOx) (EPA,
2020). PV systems do not create these air pollutants while producing the same electricity for the U.S.
grid. Avoidance of grid electricity greenhouse gas and air pollutant emissions with use of PV electricity
amounts to environmental and public health benefits of $20/MWh and $14/MWh, respectively (Wiser
et al., 2016).
Solar energy and PV technologies also have additional environmental advantages, beyond
reductions in air pollution and greenhouse gas emissions. J. Bergesen et al. (2014) carried out a hybrid
life-cycle assessment for two thin-film PV technologies: CdTe and CIGS. A scenario using 2010 inputs
is considered alongside a hypothetical future scenario for the year 2030 using technology roadmaps
from NREL. The authors define 12 impact categories related to the manufacturing process that are
related to environmental, human health, and natural resource impacts of energy generation. The
factors include the usage of various metals, water depletion and land occupation. Impact factors are
compared to a baseline of fossil fuels (marking 100%). The results are summarized in Figure 75, which
shows the environmental and resource impacts of ground-mounted CdTe PV systems from 2010 and
2030 normalized to those of the 2010 U.S. electricity grid mix, based on U.S. EPA TRACI 1.0 and
ReCiPe 2008 life cycle impact assessment methods (Bergesen et al., 2014).
Using 2010 data, the authors find that thin-film PV technologies perform at least 90% better
than traditional fossil fuel generation in seven of the 12 categories, at least 50% better in three
categories, and comparable or worse in the final two categories of land occupation and metal depletion
(Bergesen et al., 2014). Land occupation is found to be similar for the PV technologies and fossil fuels,
and metal depletion is significantly higher.
Fthenakis et al. (2008) found that replacing grid electricity with ground-
mount CdTe PV systems in the U.S. can result in 89–98% reductions of
GHG emissions, criteria pollutants, heavy metals, and radioactive species.
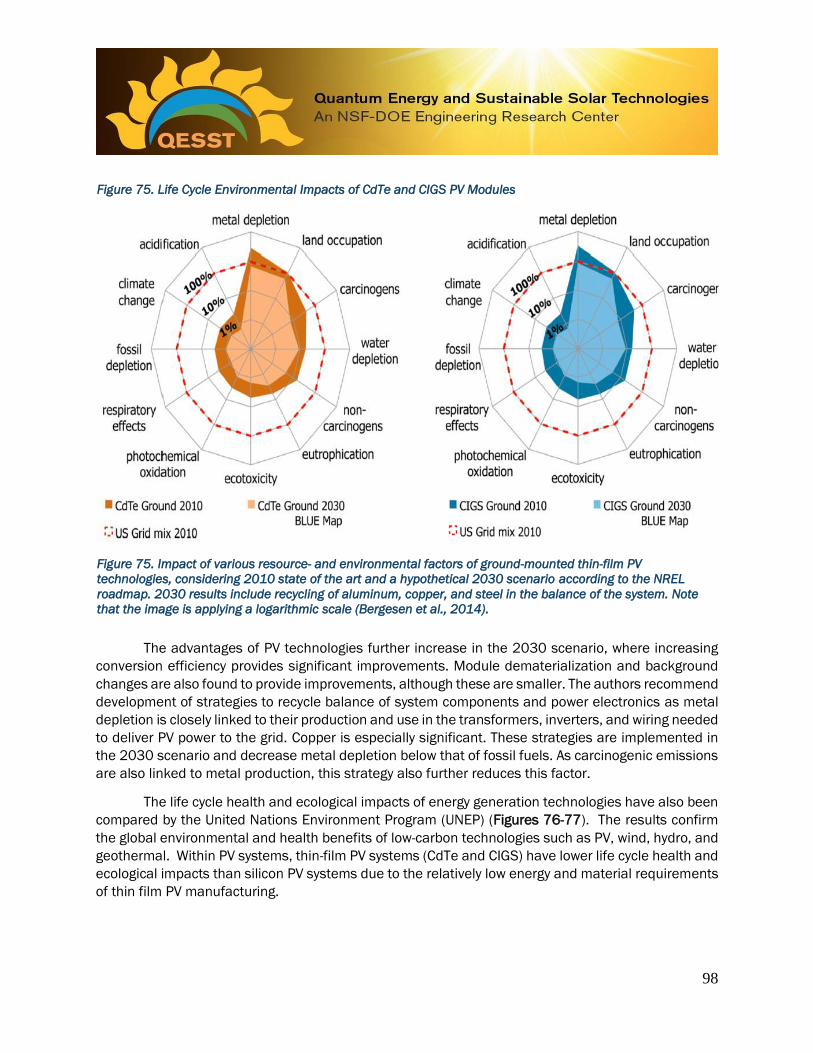
98
Figure 75. Life Cycle Environmental Impacts of CdTe and CIGS PV Modules
Figure 75. Impact of various resource- and environmental factors of ground-mounted thin-film PV
technologies, considering 2010 state of the art and a hypothetical 2030 scenario according to the NREL
roadmap. 2030 results include recycling of aluminum, copper, and steel in the balance of the system. Note
that the image is applying a logarithmic scale (Bergesen et al., 2014).
The advantages of PV technologies further increase in the 2030 scenario, where increasing
conversion efficiency provides significant improvements. Module dematerialization and background
changes are also found to provide improvements, although these are smaller. The authors recommend
development of strategies to recycle balance of system components and power electronics as metal
depletion is closely linked to their production and use in the transformers, inverters, and wiring needed
to deliver PV power to the grid. Copper is especially significant. These strategies are implemented in
the 2030 scenario and decrease metal depletion below that of fossil fuels. As carcinogenic emissions
are also linked to metal production, this strategy also further reduces this factor.
The life cycle health and ecological impacts of energy generation technologies have also been
compared by the United Nations Environment Program (UNEP) (Figures 76-77). The results confirm
the global environmental and health benefits of low-carbon technologies such as PV, wind, hydro, and
geothermal. Within PV systems, thin-film PV systems (CdTe and CIGS) have lower life cycle health and
ecological impacts than silicon PV systems due to the relatively low energy and material requirements
of thin film PV manufacturing.
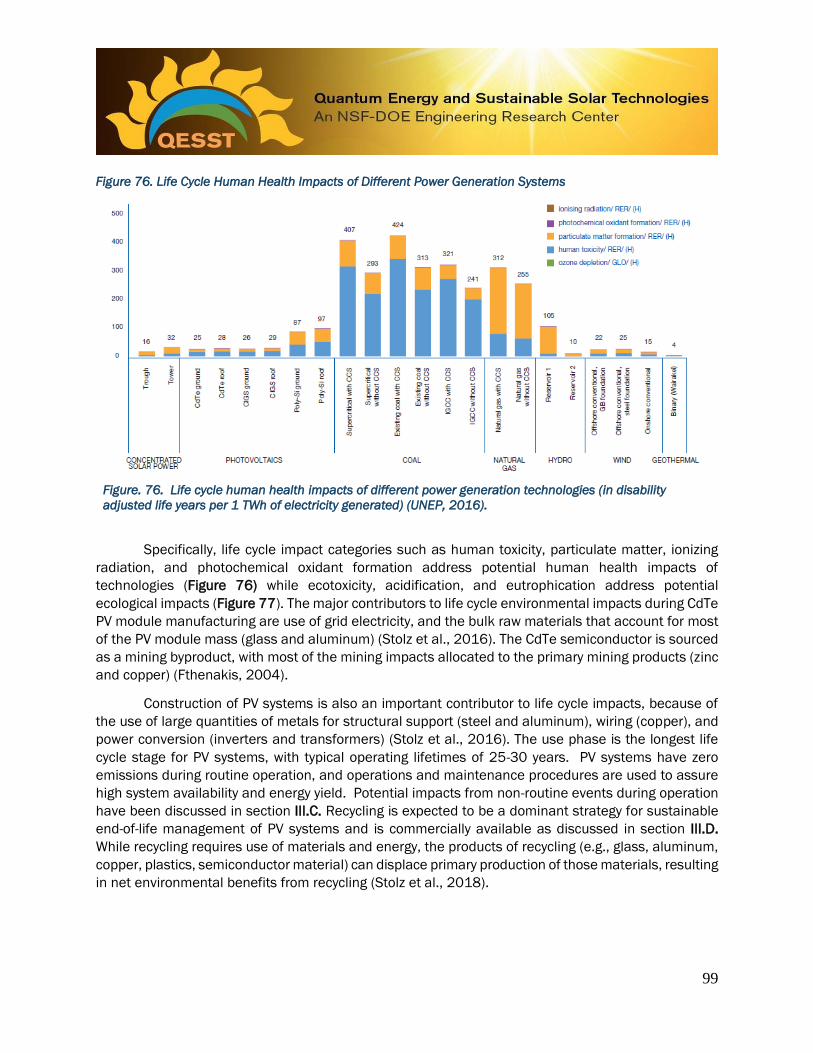
99
Figure 76. Life Cycle Human Health Impacts of Different Power Generation Systems
Figure. 76. Life cycle human health impacts of different power generation technologies (in disability
adjusted life years per 1 TWh of electricity generated) (UNEP, 2016).
Specifically, life cycle impact categories such as human toxicity, particulate matter, ionizing
radiation, and photochemical oxidant formation address potential human health impacts of
technologies (Figure 76) while ecotoxicity, acidification, and eutrophication address potential
ecological impacts (Figure 77). The major contributors to life cycle environmental impacts during CdTe
PV module manufacturing are use of grid electricity, and the bulk raw materials that account for most
of the PV module mass (glass and aluminum) (Stolz et al., 2016). The CdTe semiconductor is sourced
as a mining byproduct, with most of the mining impacts allocated to the primary mining products (zinc
and copper) (Fthenakis, 2004).
Construction of PV systems is also an important contributor to life cycle impacts, because of
the use of large quantities of metals for structural support (steel and aluminum), wiring (copper), and
power conversion (inverters and transformers) (Stolz et al., 2016). The use phase is the longest life
cycle stage for PV systems, with typical operating lifetimes of 25-30 years. PV systems have zero
emissions during routine operation, and operations and maintenance procedures are used to assure
high system availability and energy yield. Potential impacts from non-routine events during operation
have been discussed in section III.C. Recycling is expected to be a dominant strategy for sustainable
end-of-life management of PV systems and is commercially available as discussed in section III.D.
While recycling requires use of materials and energy, the products of recycling (e.g., glass, aluminum,
copper, plastics, semiconductor material) can displace primary production of those materials, resulting
in net environmental benefits from recycling (Stolz et al., 2018).
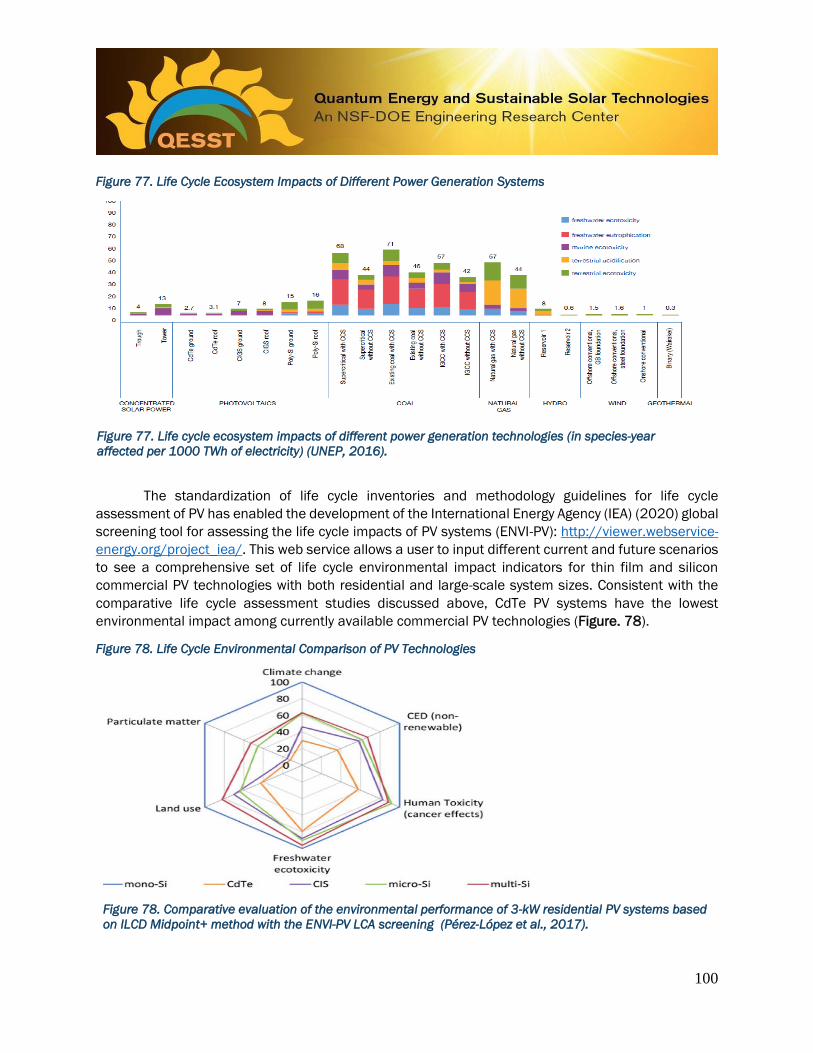
100
Figure 77. Life Cycle Ecosystem Impacts of Different Power Generation Systems
Figure 77. Life cycle ecosystem impacts of different power generation technologies (in species-year
affected per 1000 TWh of electricity) (UNEP, 2016).
The standardization of life cycle inventories and methodology guidelines for life cycle
assessment of PV has enabled the development of the International Energy Agency (IEA) (2020) global
screening tool for assessing the life cycle impacts of PV systems (ENVI-PV): http://viewer.webservice-
energy.org/project_iea/. This web service allows a user to input different current and future scenarios
to see a comprehensive set of life cycle environmental impact indicators for thin film and silicon
commercial PV technologies with both residential and large-scale system sizes. Consistent with the
comparative life cycle assessment studies discussed above, CdTe PV systems have the lowest
environmental impact among currently available commercial PV technologies (Figure. 78).
Figure 78. Life Cycle Environmental Comparison of PV Technologies
Figure 78. Comparative evaluation of the environmental performance of 3-kW residential PV systems based
on ILCD Midpoint+ method with the ENVI-PV LCA screening (Pérez-López et al., 2017).

101
Collectively, these assessments demonstrate the high overall environmental performance of
CdTe PV technologies, across their entire lifecycle, both with respect to other PV technologies and,
especially, with respect to fossil fuel generated electricity. Overall, the environmental impacts of
conventional, thermal power plants using carbon-based or fossil fuels dwarf those of renewable energy
technologies. In most categories, the reduction in environmental impact from using PV technologies is
between one and two orders of magnitude. The environmental impacts of renewable power sources
primarily stem from its material uses, manufacturing processes, and land use. Renewable
technologies are found to have zero or negligible emissions during the operational phase.
When comparing different PV technologies, thin-film solar modules tend to perform better than
crystalline silicon technology. This is due to the less energy, and material intensive fabrication process
of thin-film technology, but also depends on the energy mix used to fabricate the solar cells. In Figure
79, carbon footprint, water footprint, and air pollution are compared for conventional, thermal
electricity generators and different PV technologies (First Solar, 2018). The graph shows the great
potential of PV technology, and especially CdTe PV to transfer to a more sustainable electricity
generation.
Figure 79. Life Cycle Environmental Footprint of Different Power Generation Systems
Figure 79. Comparison of carbon footprint, water footprint and air pollution of conventional thermal
power plants and various PV technologies according to First Solar (First Solar, 2018).
First Solar achieves the small environmental footprint by using a fully integrated and resource-
efficient PV module fabrication process in countries that provide electricity by sources with a moderate
carbon intensity. The energy payback time that First Solar states is as low as six months under high
irradiation conditions. In this way, PV power plants with First Solar modules generate 50 times as much
electricity as is required for their construction over a 25-year time period.
As we describe below, ongoing and systematic environmental assessment can help the solar
industry further reduce its already small long-term environmental impacts. For example, the
management of disposal and end-of-life of PV systems will significantly impact overall environmental

102
impact, and recycling practices can help reduce the already small environmental impacts. First Solar
is able to recycle their CdTe modules with 90% efficiency. The recouped semiconductor material is
reincorporated into new more efficient CdTe solar modules, reducing energy use, energy-related
emissions, and materials consumption. The recouped glass is reincorporated into new glass products.
Further PV technology innovation, especially, as described earlier in this report, with regard to future
improvements in module efficiency, will also further reduce the environmental impacts of PV energy
generation by reducing the use of materials and land per unit of energy generated.
B - Carbon footprint
The primary driver of solar energy’s rapid growth in the past two decades stem principally from
its ability to combat climate change. Studies about carbon footprint or global warming impact show a
drastic advantage of PV technologies over conventional, thermal power plants using carbon-based
fuels. Among PV technologies, CdTe consistently appears as the established technology with the lowest
carbon footprint. In several studies, this advantage of CdTe is confirmed, and is also shown to hold
over different locations.
Louwen et al. (2017) calculated the greenhouse gas emission of various PV technologies
based on operating conditions in Africa, the Middle East and Europe (Figure 80) in units of
gCO2,eq/kWh. This quantity is affected by the amount of greenhouse gases emitted as a result of
fabrication and the energy yield of the PV installations. The study states that all module technologies
achieve emissions that are around or below 50 gCO2,eq/kWh. This value is much lower than that of
conventional electricity generation based on carbon-based fuels, for which the GHG emissions range
from roughly 400 to over 1000gCO2,eq/kWh, depending on fuel type. For CdTe PV modules, emission
factors are as low as 15 gCO2,eq/kWh, while the highest values of up to 120 gCO2,eq/kWh are found for
mono-Si PV modules in areas with low insolation. Overall, CdTe PV modules were found to be less than
30 gCO2,eq/kWh for all areas assessed.
When comparing different PV technologies, thin-film solar modules (CdTe
modules) tend to perform better than crystalline silicon technology. This is
due to the less energy, and material intensive fabrication process of thin-
film technology, but also depends on the energy mix used to fabricate the
solar cells.

103
Figure 80. PV GHG Emissions in Different Regions
Figure 80. Greenhouse gas (GHG) emissions of various photovoltaic technologies according to Louwen et al.
(2017).
Peng et al. (2013) performed a review of greenhouse gas emission and energy payback time
of different PV technologies. The study from 2013 features CdTe PV modules with efficiencies between
6% and 11%, with data taken mainly from studies published between 1998 and 2011 (Fthenakis et
al., 2005; Jungbluth et al. , 2007; Alsema et al., 2006; Raugei, M;, 2007; Kato et al., 2001; Wild-
Scholten, 2009; Alsema, 1998; Ito et al., 2010; Fthenakis et al., 2009). Despite the comparably low
efficiency of CdTe PV modules at this point in time, the greenhouse gas emissions for this technology
were already found to be smaller on average than for other PV technologies, including two other thin-
film technologies CIS and a-Si. Results are summarized in Figure 81.
Figure 81. PV GHG Emission Rate
Figure 81. An overview of greenhouse gas emission rates from various PV technologies. Data was
assembled from a number of literature studies (Peng et al., 2013).
The superior performance of CdTe was attributed to the lower life cycle energy demand when
comparing crystalline silicon efficiencies to the recent progress in CdTe conversion efficiencies
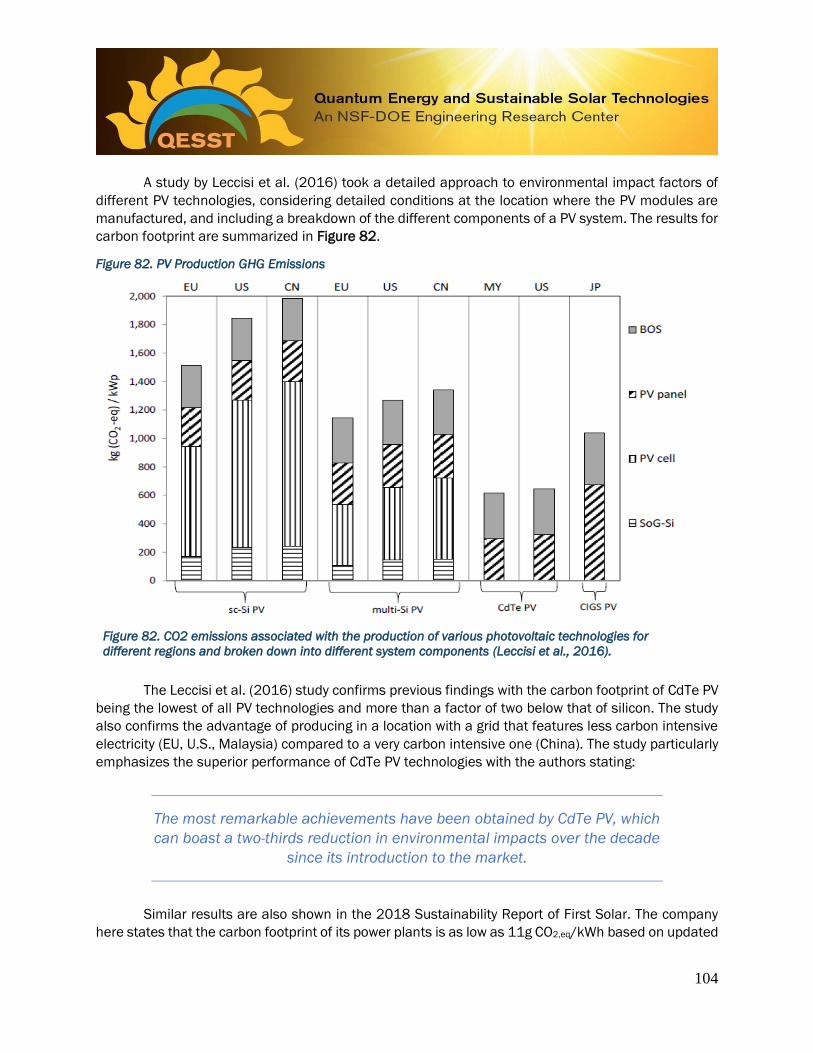
104
A study by Leccisi et al. (2016) took a detailed approach to environmental impact factors of
different PV technologies, considering detailed conditions at the location where the PV modules are
manufactured, and including a breakdown of the different components of a PV system. The results for
carbon footprint are summarized in Figure 82.
Figure 82. PV Production GHG Emissions
Figure 82. CO2 emissions associated with the production of various photovoltaic technologies for
different regions and broken down into different system components (Leccisi et al., 2016).
The Leccisi et al. (2016) study confirms previous findings with the carbon footprint of CdTe PV
being the lowest of all PV technologies and more than a factor of two below that of silicon. The study
also confirms the advantage of producing in a location with a grid that features less carbon intensive
electricity (EU, U.S., Malaysia) compared to a very carbon intensive one (China). The study particularly
emphasizes the superior performance of CdTe PV technologies with the authors stating:
The most remarkable achievements have been obtained by CdTe PV, which
can boast a two-thirds reduction in environmental impacts over the decade
since its introduction to the market.
Similar results are also shown in the 2018 Sustainability Report of First Solar. The company
here states that the carbon footprint of its power plants is as low as 11g CO2,eq/kWh based on updated

105
PV module efficiencies, compared to values as low as 14g CO2,eq/kWh in Peng at al. (2013) with state-
of-the-art about 10 years prior (Figure 81 & 83).
Figure 83. PV Carbon Footprint and Energy Payback
Figure 83. Carbon footprint and energy payback time of different PV technologies in different regions
(First Solar, 2018).
The results from Figure 83 illustrate an important feature of PV technologies, namely that there
are still significant opportunities to further reduce their already low environmental impact. Three in
particular are worth discussion with regard to GHG emissions. First, improving the efficiency of PV
modules will, all else being equal, increase the amount of energy generated by each module (total
kWh) and thus reduce the GHG emissions on a per kWh basis. Second, reducing the carbon intensity
of the energy used in PV manufacturing and in the production of materials used in PV manufacturing
(e.g., by increasing the percentage of renewables integrated into the electricity grid) will reduce GHG
emissions, as this energy input is the greatest current source of GHG emissions.
Finally, recycling PV systems can also reduce life cycle GHG emissions of PV. Held investigated
the impact of recycling on the global warming potential of CdTe PV modules (Held, 2009). A life cycle
assessment is performed according to recycling procedures that were already commercially
implemented. The study includes recycling and energy recovery of materials as well as further
treatment and disposal of solid and liquid wastes. The study concludes that recycling would contribute
to a significant net reduction of the environmental profile in both primary energy demand and
greenhouse gas impact of end-of-life of CdTe PV modules.
The main contributors to the considered environmental impact categories are identified as
chemicals, amongst which hydrogen peroxide is the most significant, and primary energy required in
the fabrication of CdTe PV modules. Recycling of outgoing valuable material would significantly reduce
the overall environmental impact of CdTe PV modules. In the analysis presented in the study, primary
energy demand for the end-of-life phase of PV modules was reduced by approx. 13% relative from

106
93MJ/m2 to 81MJ/m2 and global warming potential for PV modules by approx. 30% from 8.5kg CO2,eq
to 6.0kg CO2,eq per m2. Results are shown in Figure 84.
Figure 84. Recycling GHG Net Benefits
Figure 84. Changes in global warming potential per m2 if modules are recycled (Held, 2009).
Ravikumar et al. (2015) found similar results in their investigation of the lifecycle benefits of
recycling a PV module. This study considers recycling the entire CdTe PV system and is based on First
Solar’s high-value recycling process. By recycling an entire PV system, lifetime and energy footprint are
reduced by about 24% of the energy used to manufacture the system in the first place. The factors
with the greatest impact on the energy benefit of recycling were identified as reducing the energy
required to recover unrefined semiconductor material from the module and ensuring high recovery of
steel and glass from the end-of-life CdTe PV system. If only the module is recycled and the remaining
system is not considered, 13.2 kg of glass, 0.007 kg of Cd, and 0.008 kg of Te can be recovered per
m2. The energy impact is, however, almost neutral. Results are summarized in Figure 85.
An additional important factor that was identified is energy required for transportation. Energy
intensity here depends on the tradeoff between material recovery and recycling operations at the
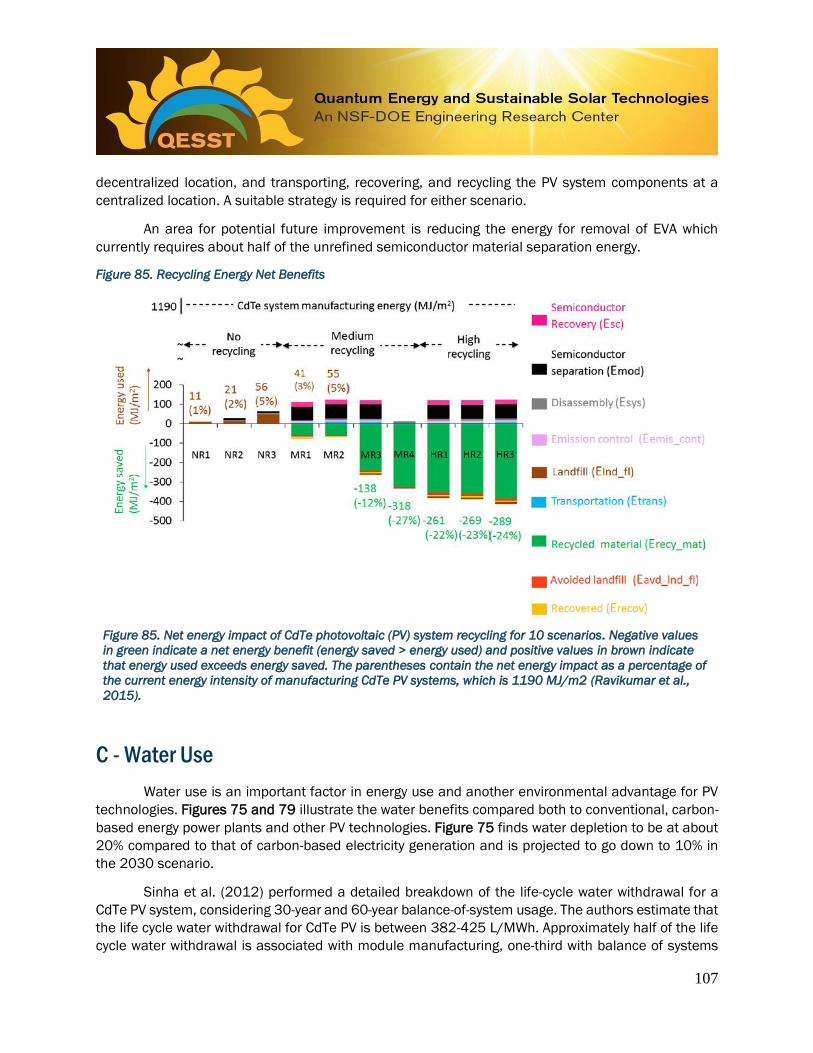
107
decentralized location, and transporting, recovering, and recycling the PV system components at a
centralized location. A suitable strategy is required for either scenario.
An area for potential future improvement is reducing the energy for removal of EVA which
currently requires about half of the unrefined semiconductor material separation energy.
Figure 85. Recycling Energy Net Benefits
C - Water Use
Water use is an important factor in energy use and another environmental advantage for PV
technologies. Figures 75 and 79 illustrate the water benefits compared both to conventional, carbon-
based energy power plants and other PV technologies. Figure 75 finds water depletion to be at about
20% compared to that of carbon-based electricity generation and is projected to go down to 10% in
the 2030 scenario.
Sinha et al. (2012) performed a detailed breakdown of the life-cycle water withdrawal for a
CdTe PV system, considering 30-year and 60-year balance-of-system usage. The authors estimate that
the life cycle water withdrawal for CdTe PV is between 382-425 L/MWh. Approximately half of the life
cycle water withdrawal is associated with module manufacturing, one-third with balance of systems
Figure 85. Net energy impact of CdTe photovoltaic (PV) system recycling for 10 scenarios. Negative values
in green indicate a net energy benefit (energy saved > energy used) and positive values in brown indicate
that energy used exceeds energy saved. The parentheses contain the net energy impact as a percentage of
the current energy intensity of manufacturing CdTe PV systems, which is 1190 MJ/m2 (Ravikumar et al.,
2015).

108
factors, and the remainder from takeback and recycling. Primary contributors during manufacturing
are the use of grid electricity, glass, and on-site water. Balance of system factors include the use of
steel, copper, inverters, and on-site water. Contributions to recycling include electricity, chemical use,
and transport during takeback and recycling. The detailed breakdown in shown in Figure 86. Compared
to conventional electricity generators, CdTe PV uses a much smaller amount of water. Considering
state of the art in the southwestern USA, CdTe PV arrays can displace water withdrawal by between
1700–5600 L/MWh (Sinha et al., 2012b).
Figure 86. CdTe PV Life Cycle Water Withdrawal
Figure 86. Life cycle water withdrawal of CdTe PV broken down into major contributions (Sinha et al.,
2012).
First Solar also tracks water consumption per Watt produced from their manufacturing
processes. In their Sustainability Report, First Solar states that water intensity was reduced by 35%
between 2009 and 2017 (see Figure 87). The reduction was due to improvements in module
efficiency, manufacturing throughput, and the implementation of water conservation and recycling
projects. An increase in 2017 is caused by a ramp-down phase in production related to the transition
to Series 6 manufacturing, as many facilities like cooling towers still ran during the ramp-down as
before. Overall water consumption continued to be reduced in 2017 and 2018 by implementing
recycling programs in Malaysia, where over 75 million liters of water were saved.
0
50
100
150
200
250
300
350
400
450
Global WeightedAverage; 30 yr
BOS mount
Global WeightedAverage; 60 yr
BOS mount
Lif
e C
ycle
Wat
er W
ith
dra
wal
in C
dT
e P
V (
L/M
Wh
)
Takeback and Recycling -Other
Takeback and Recycling -On-site water
Takeback and Recycling -Transport
Takeback and Recycling -Hydrogen peroxide
Takeback and Recycling -Electricity
BOS - Other
BOS - Copper
BOS - Inverter
BOS - On-site water fordust suppression
BOS - Steel
Module - Other
Module - On-site water inmanufacturing
Module - Glass
Module - Electricity

109
Figure 87. First Solar Water Use
Figure 87. Reduction in water use per watt produced (First Solar, 2019).
D - Land Use
Land use is an important consideration for PV technologies. PV deployment requires space to
capture sunlight, although the total amount required is comparatively low, as we discuss below, versus
other energy technologies, as the amount of solar energy that falls on the Earth is very high. More
importantly, design choices have significant implications for the overall environmental impact of PV
technologies on land use. Design options by the installer include the choice of which space to use for
PV deployment (e.g., building rooftops, brownfields, integration with agriculture, or natural ecosystems
all have very different environmental profiles), how land is prepared for use (e.g., if land surfaces are
graded), and how solar is integrated into the land environment (e.g., with regard to biodiversity or
agricultural production). These design options can all significantly increase or decrease environmental
impacts. For example, ground disturbance due to land surface grading can be reduced using the disk-
and-roll site preparation method, or by eliminating site grading where feasible and simply replacing
with vegetation mowing (Sinha et al., 2018b).
Fthenakis and Kim quantified the land transformation associated with different energy
technologies (2009). The focus of their study is a comparison between conventional and renewable
energy technologies, considering the full life cycle of each. The study considers PV, wind, hydroelectric
and biomass as renewable options, and coal, nuclear and natural gas as conventional sources. The
authors state that previous studies were often critical of the potential of renewables to address the
climate crisis based on the charge that renewables would require comparably large amounts of land.
The hypothesis that the authors work on is that previous studies did not consider the full life cycle of
different technologies or the importance of direct and indirect land use and, for example, neglected
the land transformation during surface coal mining.
To address this issue, the authors suggest a methodology in which they quantify
• direct land transformation for the power plant operation in the U.S.
• land transformation through mining and milling
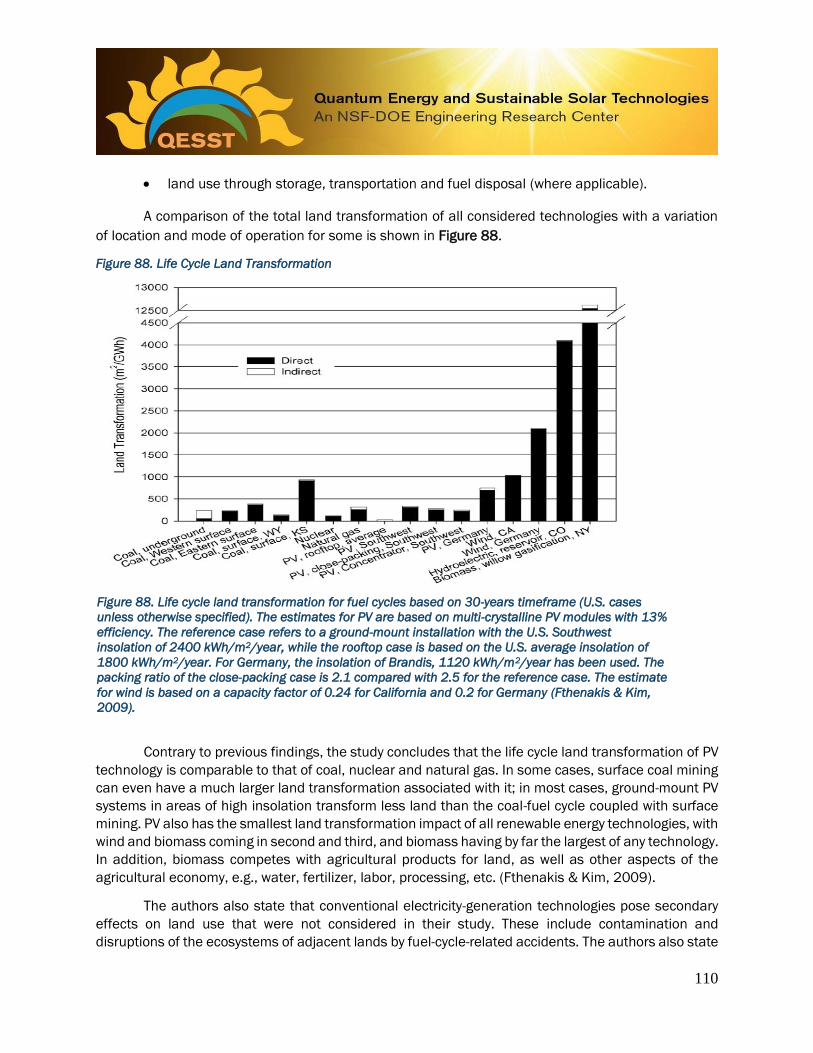
110
• land use through storage, transportation and fuel disposal (where applicable).
A comparison of the total land transformation of all considered technologies with a variation
of location and mode of operation for some is shown in Figure 88.
Figure 88. Life Cycle Land Transformation
Figure 88. Life cycle land transformation for fuel cycles based on 30-years timeframe (U.S. cases
unless otherwise specified). The estimates for PV are based on multi-crystalline PV modules with 13%
efficiency. The reference case refers to a ground-mount installation with the U.S. Southwest
insolation of 2400 kWh/m2/year, while the rooftop case is based on the U.S. average insolation of
1800 kWh/m2/year. For Germany, the insolation of Brandis, 1120 kWh/m2/year has been used. The
packing ratio of the close-packing case is 2.1 compared with 2.5 for the reference case. The estimate
for wind is based on a capacity factor of 0.24 for California and 0.2 for Germany (Fthenakis & Kim,
2009).
Contrary to previous findings, the study concludes that the life cycle land transformation of PV
technology is comparable to that of coal, nuclear and natural gas. In some cases, surface coal mining
can even have a much larger land transformation associated with it; in most cases, ground-mount PV
systems in areas of high insolation transform less land than the coal-fuel cycle coupled with surface
mining. PV also has the smallest land transformation impact of all renewable energy technologies, with
wind and biomass coming in second and third, and biomass having by far the largest of any technology.
In addition, biomass competes with agricultural products for land, as well as other aspects of the
agricultural economy, e.g., water, fertilizer, labor, processing, etc. (Fthenakis & Kim, 2009).
The authors also state that conventional electricity-generation technologies pose secondary
effects on land use that were not considered in their study. These include contamination and
disruptions of the ecosystems of adjacent lands by fuel-cycle-related accidents. The authors also state
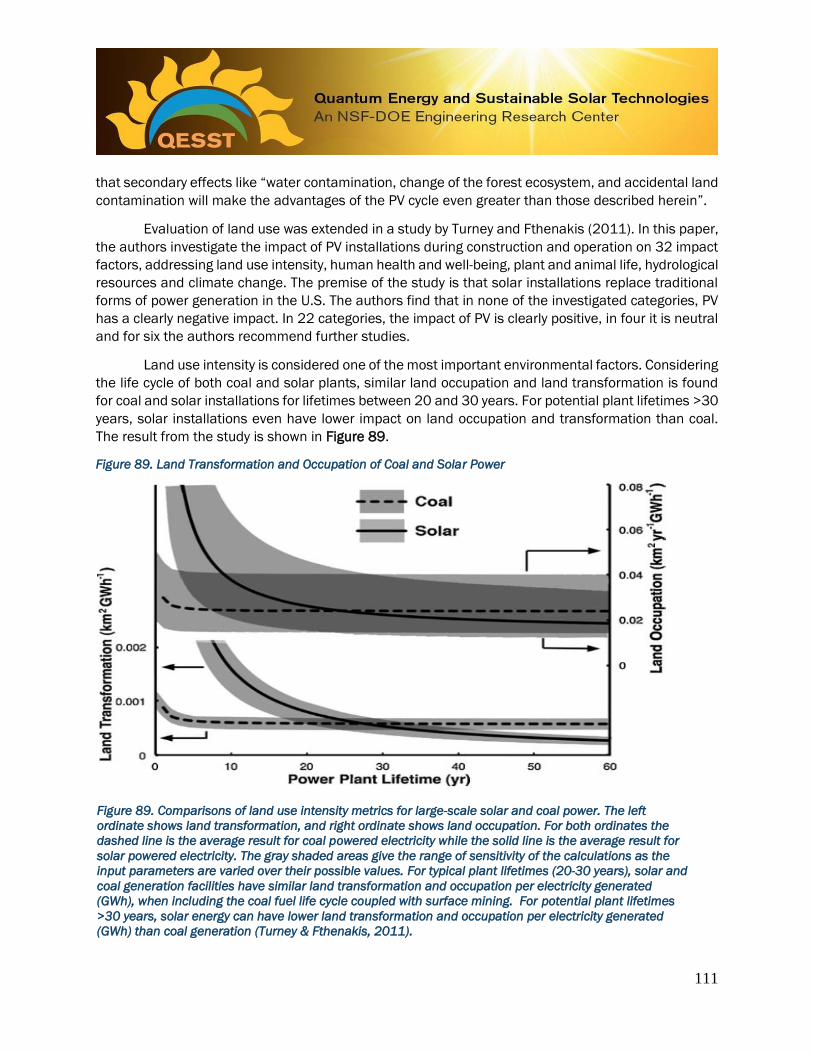
111
that secondary effects like “water contamination, change of the forest ecosystem, and accidental land
contamination will make the advantages of the PV cycle even greater than those described herein”.
Evaluation of land use was extended in a study by Turney and Fthenakis (2011). In this paper,
the authors investigate the impact of PV installations during construction and operation on 32 impact
factors, addressing land use intensity, human health and well-being, plant and animal life, hydrological
resources and climate change. The premise of the study is that solar installations replace traditional
forms of power generation in the U.S. The authors find that in none of the investigated categories, PV
has a clearly negative impact. In 22 categories, the impact of PV is clearly positive, in four it is neutral
and for six the authors recommend further studies.
Land use intensity is considered one of the most important environmental factors. Considering
the life cycle of both coal and solar plants, similar land occupation and land transformation is found
for coal and solar installations for lifetimes between 20 and 30 years. For potential plant lifetimes >30
years, solar installations even have lower impact on land occupation and transformation than coal.
The result from the study is shown in Figure 89.
Figure 89. Land Transformation and Occupation of Coal and Solar Power
Figure 89. Comparisons of land use intensity metrics for large-scale solar and coal power. The left
ordinate shows land transformation, and right ordinate shows land occupation. For both ordinates the
dashed line is the average result for coal powered electricity while the solid line is the average result for
solar powered electricity. The gray shaded areas give the range of sensitivity of the calculations as the
input parameters are varied over their possible values. For typical plant lifetimes (20-30 years), solar and
coal generation facilities have similar land transformation and occupation per electricity generated
(GWh), when including the coal fuel life cycle coupled with surface mining. For potential plant lifetimes
>30 years, solar energy can have lower land transformation and occupation per electricity generated
(GWh) than coal generation (Turney & Fthenakis, 2011).

112
The authors also state that there are significant differences in environmental impact
depending on the choice of site location (a result that is confirmed by other studies, see the biodiversity
section IV.F). The most environmentally beneficial locations are previously disturbed sites with high
insolation and absent wildlife. Solar power installations in forests, on the other hand, will release
significantly more CO2 (two to four times as much) than sites in deserts. Note that these estimates are
for non-commercial forests, whereas commercial forests (timberlands) are periodically harvested,
regardless of solar development. The difference in GHG emissions for forests is mainly due to
clearance of vegetation but is further heightened by the lower insolation due to higher cloud cover in
forest regions. Total emissions are calculated to be between 16 and 86 g CO2,eq/kWh. This value is
still low compared to emissions from coal-based electricity that were given with approx. 1100 g
CO2,eq/kWh.
The relationship between PV systems and agricultural productivity has also been evaluated.
Adeh et al. (2018) explored the environmental effects of PV modules placed on an unirrigated pasture.
The pasture was located on the Oregon State Campus and experiences frequent water stress. The
authors observed and quantified changes to the microclimatology, soil moisture, water usage, and
biomass productivity due to the presence of the solar modules. Sensors were installed on the site of
the solar farm two years after its completion, including neutron probes for measuring soil moisture.
Differences in soil moisture, relative humidity, air temperature, wind speed and wind direction were
observed. Areas under PV solar modules maintained significantly higher soil moisture throughout the
period of observation. Differences were also observed in late season biomass. The areas under PV
modules produced up to 90% more biomass here than areas with full sun exposure. In addition, areas
under PV modules were much more water efficient (more than 300%) than fully exposed areas. Results
for soil moisture and biomass rate are shown in Figure 90.
Figure 90. PV Panel Shading and Soil Water Content and Biomass Produced
Figure 90. A) Water content as a function of depth in areas with full, partial and no PV coverage.
B) Comparison of dry biomass produced under three conditions: Solar Fully Covered (Shaded), Sky Fully
Open (Alley) and control area (Adeh E. et al., 2018).

113
Based on the results of their study, the authors make recommendations for the design of solar
plants to take advantage of potential gains in agricultural production. Semi-arid pastures with wet
winters were identified as ideal candidates for “agrivoltaics” systems. Inhomogeneities in shading and
exposure to water were identified as potential issues, and the author recommend working on designs
that improve on these issues. Agrivoltaics is now considered a major opportunity for increasing U.S.
and global PV production via strategies that also enhance land use and agricultural production and
farm income (Weselek et al., 2019).
E - Dust and Particulates
A related facet of land use is the impact of land transformation on dust and particulate
emissions. Ravikumar and Sinha investigated the impact of PV installations on downwind particulate
matter concentrations in a 2017 study of the same title (Ravikumar & Sinha, 2017). Investigations
were performed at the Desert Sunlight 550MW PV installation in Riverside County, California.
Particulate matter with diameters below 2.5 μm (PM2.5) and 10 μm (PM10) was collected at four
different stations on different parts of the plant over a period of three years. The three-year study
period covered pre-construction, construction and post-construction. The authors hypothesize that the
utility-scale PV installation reduces particle emissions from land occupied by PV modules due to a
wind-shielding effect. The main findings to support this hypothesis are:
• Confidence intervals of the mean particle concentrations during construction overlap with
or are lower than background concentrations for three of the four measurement stations.
• Post-construction particle concentrations downwind of the PV installation are significantly
below background concentrations at three of the four measurement stations.
The supporting graphs are shown in Figure 91.
The significance of these findings lies in the role that PV installations could play in supporting
downwind particle emission abatement in desert climates, similar to the one found at the site of this
PV construction. Furthermore, particle emission reductions were observed within 10 months after
completing the construction. The authors conclude that post-construction monitoring of downwind
particle levels may be reduced to a one-year period for other projects with similar construction and
operation conditions.
Utility-scale PV installation reduces particle emissions from land occupied
by PV modules due to a wind-shielding effect.

114
Figure 91. Dust and Particulate Emissions from PV Plants
Figure 91. Particle concentration (PM10-PM2.5) before, during and after construction including confidence
intervals of 95%. Taken from beta attenuation monitor stations around the PV plant (Ravikumar & Sinha,
2017).

115
F - Biodiversity
In a report by the German Renewable Energies Agency, opportunities for biodiversity due to PV
installations are discussed (Peschel, 2010). In a first part, the report motivates how PV parks interact
with ecosystems by discussing prior research findings, and then, in a second part, makes
recommendations for best practices for conservation measures.
Regarding the impact of PV installations on biodiversity, the report draws a positive conclusion,
but also cautions that further research is necessary. Prior studies reviewed by Peschel (2010) indicate
that, although construction projects always constitute a certain disturbance of flora and fauna, if they
are properly designed, solar parks can have a positive impact on biological diversity by improving the
quality of habitats for animals and plants. PV installations also have a chance to create new habitats.
Even greater improvements can be achieved if sites with PV installations are integrated into
greater ecosystem networks, especially if land with poor species diversity is concerned. Figure 92
presents a sketch for overall integration of PV installations in ecosystems. As an example, the report
states that previously cleared agricultural land could be transferred into well maintained grassland,
which additionally acts as a carbon sink and reduces the use of fertilizers, pesticide and environmental
pollution. As degraded agricultural land is often proposed for large-scale solar facilities, this example
is particularly relevant to the PV industry. Another example where PV installations can have a
significant positive impact are contaminated areas and landfill sites. While the most significant
improvements will be achieved for stressed sites, positive impacts are also possible for sites with
higher nature value.
The report makes a number of recommendations regarding best practices, which can be considered
alongside other siting considerations such as land costs, distance to transmission, hydrology, and
topography:
• Site selection has a strong influence on the environmental impact. The report identifies sites
along major transport routes, contaminated brownfield sites, former arable land, landfill sites
and slagheaps as especially suitable, while recommends that protected sites only be
considered within certain restrictions.
• Local conditions, environmental remediation and compensatory measures must be
considered during the environmental impact assessment. To ensure environmentally friendly
use, local authorities, environmental groups and the public should be involved in the planning
process.
• Monitoring and quality control during construction is essential. The report recommends
involving an environmental monitoring expert who is responsible for considering all relevant
concerns before and during construction, and also for supervising the implementation of and
adherence to defined conservation and abatement measures.
• Soil sealing should be avoided to provide habitats for animal and plant species.
• The canopy effect, i.e. non-uniform shading and water ingress into the ground should be
considered but can have positive as well as negative effects.

116
• Helping conserve the regional genetic diversity of plants should be considered as a goal for
site development.
• The report also recommends long-term monitoring of the sites to ensure learning and quality
control of the implemented measures. Furthermore, the report emphasizes the importance
of site maintenance.
Figure 92. Responsible Land Use
Figure 92. Sketch of the concept for integrating PV installations in a wider ecosystem, developed by the
German Renewable Energies Agency (Peschel, 2010).
Recommendations were also made by Sinha et al. (2018). In this study, the authors explore
species diversity and biological productivity of vegetation on the Topaz Solar Farms project in San Luis
Obispo County, California (Sinha et al., 2018b). The PV farm has a capacity of 550 MW and was, at
the time the paper was written, one of the largest installations in the world. The study finds that
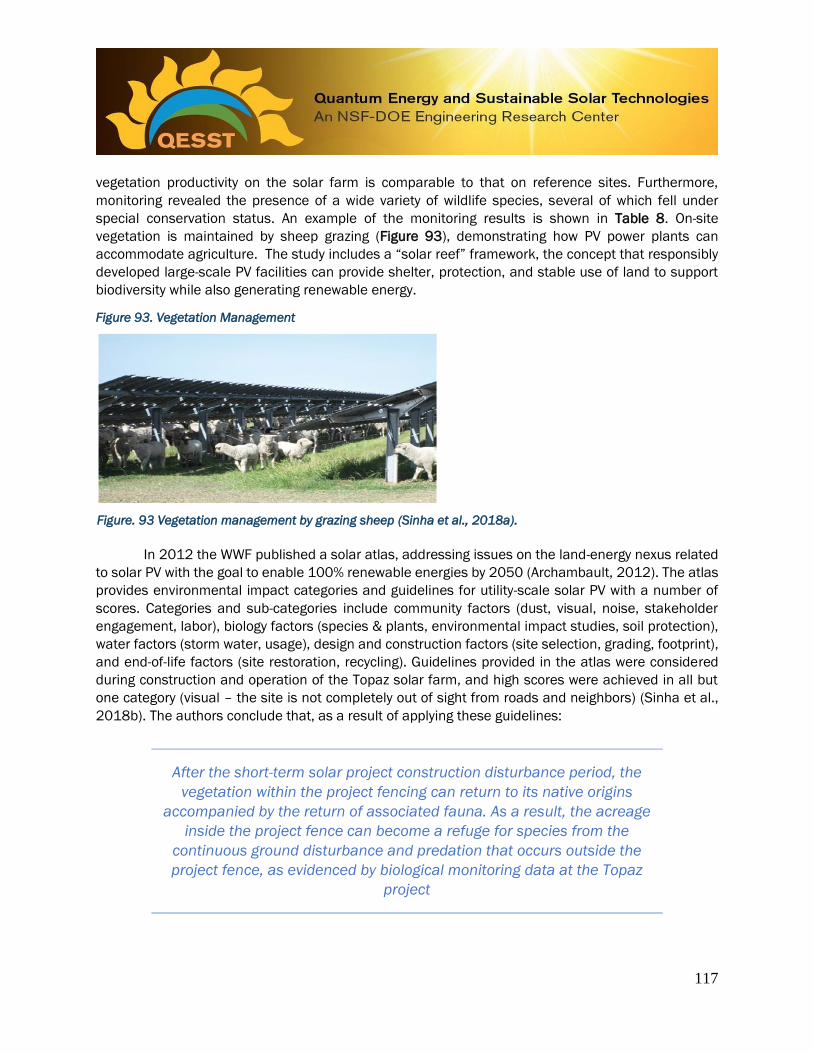
117
vegetation productivity on the solar farm is comparable to that on reference sites. Furthermore,
monitoring revealed the presence of a wide variety of wildlife species, several of which fell under
special conservation status. An example of the monitoring results is shown in Table 8. On-site
vegetation is maintained by sheep grazing (Figure 93), demonstrating how PV power plants can
accommodate agriculture. The study includes a “solar reef” framework, the concept that responsibly
developed large-scale PV facilities can provide shelter, protection, and stable use of land to support
biodiversity while also generating renewable energy.
Figure 93. Vegetation Management
Figure. 93 Vegetation management by grazing sheep (Sinha et al., 2018a).
In 2012 the WWF published a solar atlas, addressing issues on the land-energy nexus related
to solar PV with the goal to enable 100% renewable energies by 2050 (Archambault, 2012). The atlas
provides environmental impact categories and guidelines for utility-scale solar PV with a number of
scores. Categories and sub-categories include community factors (dust, visual, noise, stakeholder
engagement, labor), biology factors (species & plants, environmental impact studies, soil protection),
water factors (storm water, usage), design and construction factors (site selection, grading, footprint),
and end-of-life factors (site restoration, recycling). Guidelines provided in the atlas were considered
during construction and operation of the Topaz solar farm, and high scores were achieved in all but
one category (visual – the site is not completely out of sight from roads and neighbors) (Sinha et al.,
2018b). The authors conclude that, as a result of applying these guidelines:
After the short-term solar project construction disturbance period, the
vegetation within the project fencing can return to its native origins
accompanied by the return of associated fauna. As a result, the acreage
inside the project fence can become a refuge for species from the
continuous ground disturbance and predation that occurs outside the
project fence, as evidenced by biological monitoring data at the Topaz
project

118
Table 8. Vegetation Sampling
Table 8. Dominant species of vegetation by quadrat sampling location in 2015, tallied by species and number
of quadrats in which it was dominant (1 m2 quadrats) (Sinha et al., 2018).
G - Materials Hotspots
In addition to documenting the environmental footprint of PV systems, life cycle assessment
can be used to improve the environmental footprint by addressing hotspots, or primary contributors to
life cycle environmental impacts. Based on results from the EU product environmental footprint pilot
study on PV, a primary environmental hotspot for PV systems is non-renewable resource depletion,
due to reliance on metals such as steel, copper, aluminum, and semiconductor materials in PV
modules and balance of systems (Stolz et al., 2016). The use of raw and manufactured materials in
PV systems will continue to be a burden as the PV industry grows to larger scales and supplies a greater
fraction of total U.S. electricity production beyond the 2% it supplied in 2018 (EIA, 2020c). For
instance, copper will become a critical cost factor for PV systems, which use 11–40 times more per
kWh generated than conventional fossil power generation systems (Hertwich et al., 2014)
The impact of PV systems can be calculated by the amount of installed capacity. For instance,
creating 83 GW of PV capacity requires 0.6 million metric tons of copper which is more than 50% of
the copper refined in the U.S. in 2013 (Bergesen et al., 2014). Meeting the IEA’s BLUE Map scenario
(39% of total global electricity generation from solar, wind, and hydropower) would require about two
years of the current copper supply (Hertwich et al., 2014). The resource depletion environmental
hotspot can be addressed by a number of strategies, including recovering these materials through
recycling during project decommissioning (Sinha & Wade, 2018), increasing the efficiency of PV
technologies, and finding alternative manufacturing and deployment strategies that use less copper.

119
V - THE VALUE OF SOLAR ENERGY IN CLEAN ENERGY TRANSITIONS
In the coming decades, the U.S. energy sector will undergo a major energy transition. The pace
of that transition will be determined by how rapidly low-carbon energy technologies like solar energy
can displace higher-carbon alternatives across the entire U.S. economy. This is not a simple
undertaking; neither is it impossible. Already, this transformation is underway, with both renewable
technologies and electric vehicles now available at competitive prices in markets for transportation
and electricity generation.
Solar energy will likely play a significant role in the U.S. energy transition, both in replacing
existing electricity generation technologies and as a source of new electricity generation to support the
electrification of transportation fleets and industrial processes. As highlighted at the beginning of this
report, some scenarios now suggest that solar energy may ultimately provide as much as 50% or more
of the world’s future energy supply by the second half of the 21st century. If that is indeed true, it will
be because solar energy provides a wide array of benefits to societies and organizations that adopt it.
A - The Driver of Solar Energy Adoption: Eco-Efficiency
The primary driver of the growth of solar energy adoption is eco-efficiency. Eco-efficiency is the
concept of creating more economic value with lower environmental impacts. When thin-film PV
technology was commercialized two decades ago, other PV modules primarily utilized wafer silicon
technology. Thin-film PV technology utilized glass as the manufacturing substrate instead of silicon
wafers. The technology disrupted the industry by significantly lowering manufacturing costs. PV
affordability (measured, as described above, by the LCOE of PV energy), as well as excellent
environmental performance (as illustrated in the previous section IV.A by the low life cycle
environmental impacts of the technology), in combination with strong demand, initially created by
European feed-in-tariff structures, led to a new era of PV as a mainstream energy source.
The costs of renewable electricity systems have continuously decreased since the 1990s, and
systems are still being optimized. A decade ago, the cost of producing a GW of electricity using gas,
oil, and hard and brown coal sources was still lower than any PV source (Figure 12). Since then, PV
costs have been reduced due to technological innovations, manufacturing optimization, and accessing
larger markets, such as utility scale markets. Lazard’s Levelized Cost of Energy (LCOE) comparison
(Figure 13) summarizes current life cycle costs per MWh of new electricity generation. At $40/MWh,
PV outcompetes gas-combined cycle ($56/MWh), coal ($109/MWh), and nuclear ($155/MWh) power
generation systems (Lazard, 2019). Thin-film utility scale systems outcompete all other solar PV
options (Figure 13), due to higher energy yield found in II.B.5 and competitive capital costs.
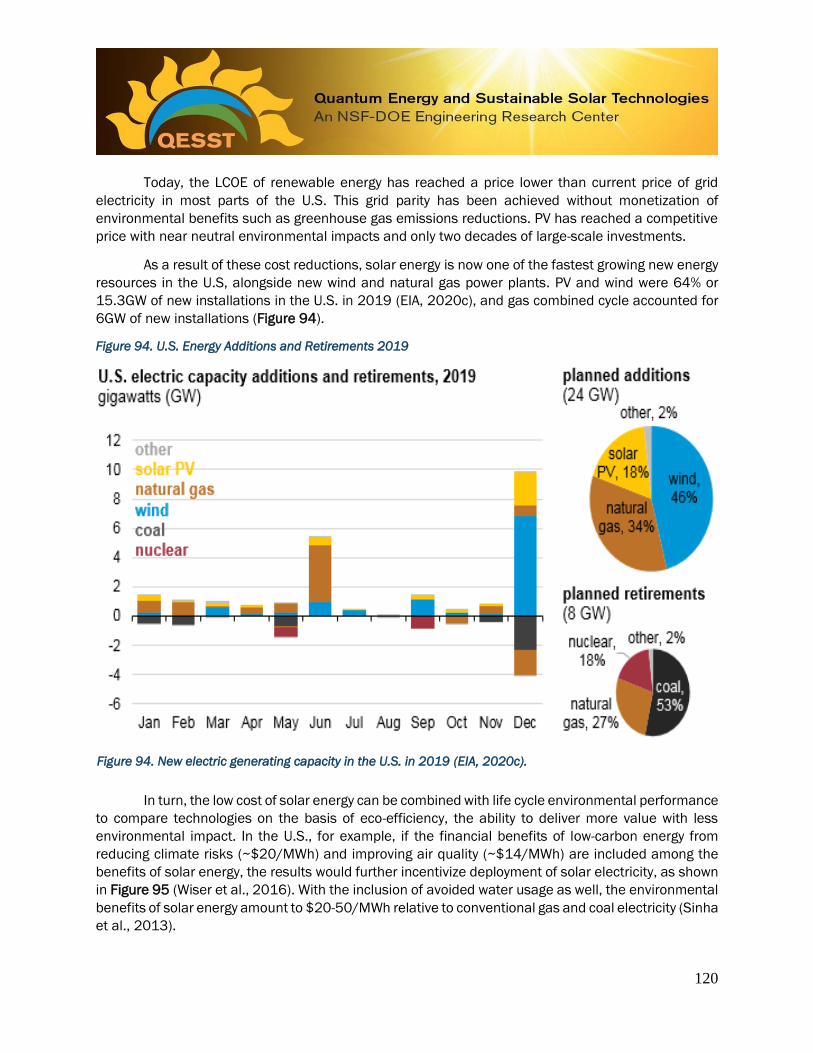
120
Today, the LCOE of renewable energy has reached a price lower than current price of grid
electricity in most parts of the U.S. This grid parity has been achieved without monetization of
environmental benefits such as greenhouse gas emissions reductions. PV has reached a competitive
price with near neutral environmental impacts and only two decades of large-scale investments.
As a result of these cost reductions, solar energy is now one of the fastest growing new energy
resources in the U.S, alongside new wind and natural gas power plants. PV and wind were 64% or
15.3GW of new installations in the U.S. in 2019 (EIA, 2020c), and gas combined cycle accounted for
6GW of new installations (Figure 94).
Figure 94. U.S. Energy Additions and Retirements 2019
Figure 94. New electric generating capacity in the U.S. in 2019 (EIA, 2020c).
In turn, the low cost of solar energy can be combined with life cycle environmental performance
to compare technologies on the basis of eco-efficiency, the ability to deliver more value with less
environmental impact. In the U.S., for example, if the financial benefits of low-carbon energy from
reducing climate risks (~$20/MWh) and improving air quality (~$14/MWh) are included among the
benefits of solar energy, the results would further incentivize deployment of solar electricity, as shown
in Figure 95 (Wiser et al., 2016). With the inclusion of avoided water usage as well, the environmental
benefits of solar energy amount to $20-50/MWh relative to conventional gas and coal electricity (Sinha
et al., 2013).

121
Figure 95. Environmental and Health Benefits from Solar Penetration
Figure 95. Environmental and health benefits of achieving large-scale solar penetration in the U.S. (14% of
U.S. electricity demand by 2030 and 27% by 2050) (Wiser et al., 2016).
An eco-efficiency study of different kinds of PV systems and non-renewable power generation
systems was conducted for the Bavarian State Ministry of the Environment and Consumer Protection
(Seitz et al., 2013). As shown in Figure 96, ground-mounted and industrial rooftop CdTe PV systems
have the highest overall eco-efficiency scores among PV systems. Larger PV systems have lower life
cycle costs due to economies of scale, which are balanced in overall eco-efficiency scores by the low
land use requirements of rooftop PV systems. CdTe PV systems have lower life cycle environmental
burdens than CIS and mono-c-Si PV systems due to lower material and energy requirements in
manufacturing.

122
Figure 96. PV Eco-Efficiency
Figure 96. Eco-efficiency portfolio for three PV technologies Si-mono, CdTe (1) and CIS (1) for residential
rooftops, large industrial rooftops and ground-mounted systems (Seitz et al., 2013).
B - Grid Integration of Solar Energy
Given solar energy’s eco-efficiency advantages, we expect to see continued increases in solar
energy adoption in future years. This is only likely to increase with accelerating commitments to cut
carbon emissions drastically by many communities, companies, states, and countries. This growth of
renewable energy will continue to displace traditional electricity generators, requiring the
consideration of integrating renewable energy into the electricity grid.
One fundamental difference between fossil thermal and renewable electricity generators is
their operating procedure. Steam turbines, gas turbines and combined cycle plants are rotating
machines that are built to synchronize with the electricity grid. Wind and solar, on the other hand, use
inverters for grid connection and are not by nature synchronous to the grid’s frequency. Furthermore,
solar and wind plants feature an intermittent power generation that, without further measures, does
not precisely conform with the demand patterns experienced by our current electricity infrastructure.
The further integration of wind and solar consequently is an infrastructure challenge that requires
innovation both on the side of how PV power plants are operated, and how electricity is used.

123
Developing and deploying grid-friendly, large-scale PV power plants that support grid stability
is one of the necessary steps to further the integration of PV generation into the power grid. As PV
becomes more prevalent, it also needs to take an increasing responsibility to guarantee reliability and
a high power quality. An exemplary layout for a large-scale (multi-MW) utility-scale PV power plant is
shown in Figure 97. Components include solar modules, inverters, grid interconnections, controls and
data acquisition.
Figure 97. PV Plant Components
Figure 97 Components of a typical utility-scale PV power plant. Image from NREL (Gevorgian & O’Neill,
2016).
A typical power output profile of a PV installation is shown in Figure 98. This particular profile
was recorded on two consecutive days for the Ilumina PV plant in Puerto Rico. The characteristic
sinusoidal shape of the power generation with a peak around noon is visible. On the second day rapid
fluctuations, most likely caused by clouds can also be seen. Either of those features requires a
different management strategy. The Figure 98 also indicates one possible measure to better manage
PV power plant operation: a 10% curtailment. The curtailment would give headroom to plant operators
to respond to up and down regulation.

124
Figure 98. PV Plant Power Availability
Figure 98. Total power of the Illumina PV power plan with reserve over two days with different weather
(August 3rd, 4th 2014). The red curve indicates a potential 10% curtailment (Gevorgian & O’Neill, 2016).
One task of a grid operator is to match the power generation with demand. A demand curve in
spring for California (CAISO) is shown in Figure 99 (Loutan et al., 2017). This particular demand curve
was recorded on April 24th, 2016. It also shows the contributions from different electricity sources.
Both time and location are of significance, as they shape the demand. In this particular case, a spring
day in California, means that PV installations already generate a fair amount of electricity after the
winter months. Temperatures, on the other hand, are still low enough that people do not turn on air
conditioning systems, resulting in relatively small demand around noon. This combination marks a
worst-case scenario for solar PV, and results in an overproduction of electricity that has to be curtailed.
On this particular day, more than 2GW of renewable generation were curtailed.
This phenomenon has also been named the “duck curve”, due to the shape of the load profile
resembling a duck, with the sharp rise of net load (i.e. total load – renewable generation; dashed red
line in Figure 99) resembling the duck’s neck. It’s important to remember that this phenomenon is
most emphasized only during certain days and not the entire year. As solar installation increases,
curtailment will become more widespread, if no other measures are taken. Measures that reduce the
need for curtailment and also the urgency of the duck curve include:
• Addition of electricity storage (for example pumped hydro or batteries) to the
infrastructure to shift electricity generated during midday to evening or morning hours.
• Extension of the electricity grid. Adding distributed loads and generators to the system,
especially in East – West direction will even out the load profile.
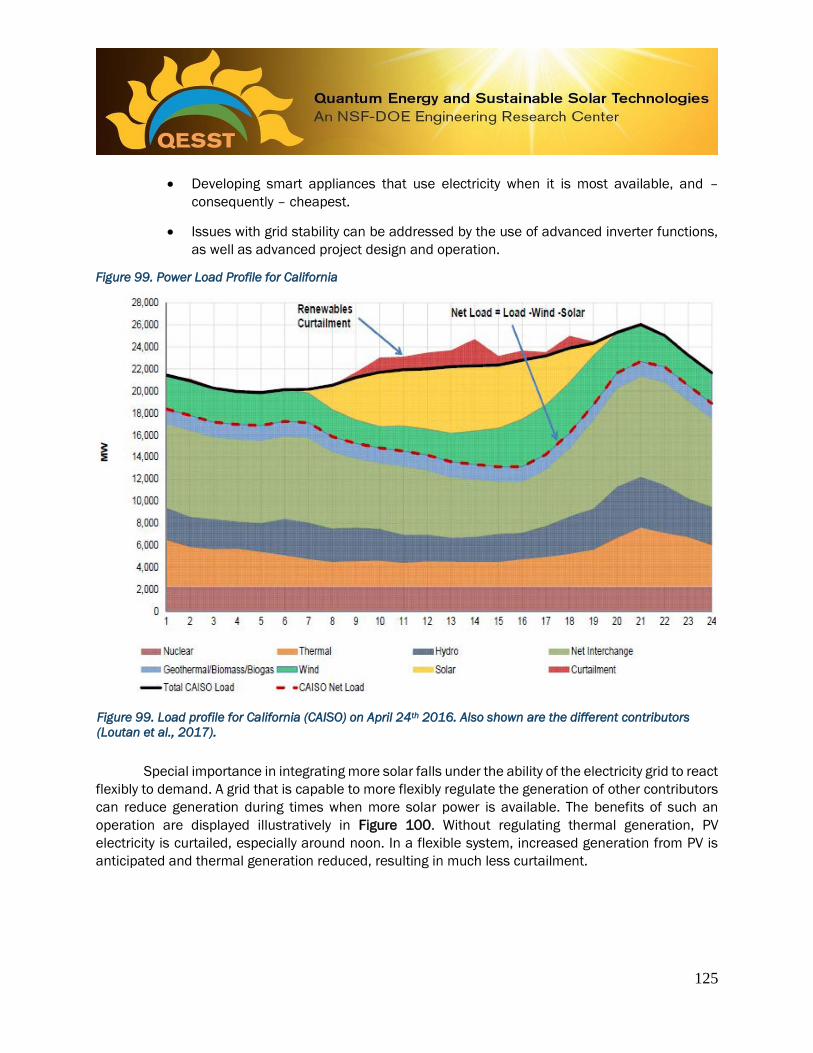
125
• Developing smart appliances that use electricity when it is most available, and –
consequently – cheapest.
• Issues with grid stability can be addressed by the use of advanced inverter functions,
as well as advanced project design and operation.
Figure 99. Power Load Profile for California
Figure 99. Load profile for California (CAISO) on April 24th 2016. Also shown are the different contributors
(Loutan et al., 2017).
Special importance in integrating more solar falls under the ability of the electricity grid to react
flexibly to demand. A grid that is capable to more flexibly regulate the generation of other contributors
can reduce generation during times when more solar power is available. The benefits of such an
operation are displayed illustratively in Figure 100. Without regulating thermal generation, PV
electricity is curtailed, especially around noon. In a flexible system, increased generation from PV is
anticipated and thermal generation reduced, resulting in much less curtailment.
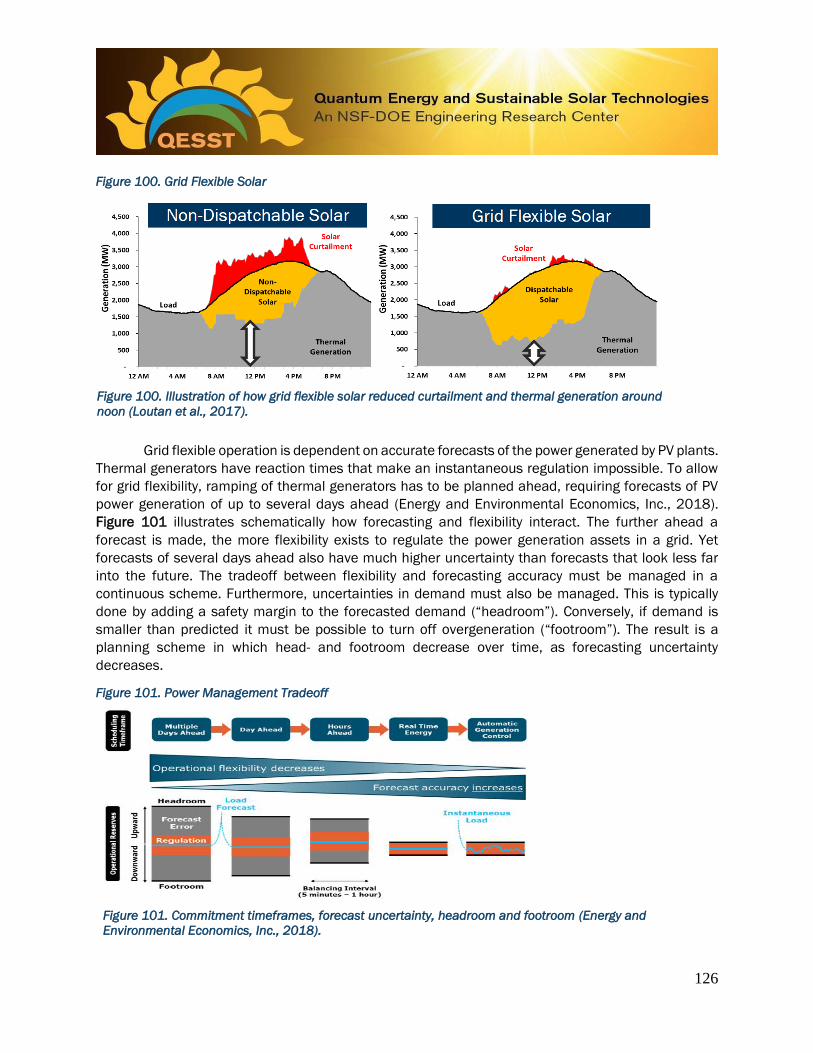
126
Figure 100. Grid Flexible Solar
Figure 100. Illustration of how grid flexible solar reduced curtailment and thermal generation around
noon (Loutan et al., 2017).
Grid flexible operation is dependent on accurate forecasts of the power generated by PV plants.
Thermal generators have reaction times that make an instantaneous regulation impossible. To allow
for grid flexibility, ramping of thermal generators has to be planned ahead, requiring forecasts of PV
power generation of up to several days ahead (Energy and Environmental Economics, Inc., 2018).
Figure 101 illustrates schematically how forecasting and flexibility interact. The further ahead a
forecast is made, the more flexibility exists to regulate the power generation assets in a grid. Yet
forecasts of several days ahead also have much higher uncertainty than forecasts that look less far
into the future. The tradeoff between flexibility and forecasting accuracy must be managed in a
continuous scheme. Furthermore, uncertainties in demand must also be managed. This is typically
done by adding a safety margin to the forecasted demand (“headroom”). Conversely, if demand is
smaller than predicted it must be possible to turn off overgeneration (“footroom”). The result is a
planning scheme in which head- and footroom decrease over time, as forecasting uncertainty
decreases.
Figure 101. Power Management Tradeoff
Figure 101. Commitment timeframes, forecast uncertainty, headroom and footroom (Energy and
Environmental Economics, Inc., 2018).

127
The ability of a solar power plant to operate according to demands was tested on a 300MW
First Solar PV power plant in California. For the plant to maintain the required regulation range (30MW),
the peak power of all the plants’ inverters needs to be estimated at any time. Available max power was
estimated through maximum power point tracking of one of the eighty inverters. The measured AC
power of the single inverter was taken as an indicator of the power available in the remaining 79. The
plants ability to respond was tested on several times during the day. As an example, performance
during the morning testing period is shown in Figure 102. The response whenever a new requirement
for generation was set was close to immediate (compare red and yellow curves). However, this high
precision could not be achieved on all occasions. In some cases, most likely, the internal ramp rate of
individual inverters limited the response time of the system. Overall, results show PV power plants are
well capable to support stability and reliability in a grid. The measured accuracy of the PV plant (87%)
were better even than those of fast gas turbines (63%), and hydro or combined cycle plants (47%).
Figure 102. Automated Generation Control
Figure 102. Experimental validation of automated generation control (AGC). The figure shows the
power output profile of a First Solar 300MW power plant with CAISOs footprint on August 24th 2016
between 9:47 and 10:10 (Loutan et al., 2017).
While grid flexibility will support the integration of solar PV into the grid, it is not sufficient to
achieve the ambitious deployment targets for carbon neutrality. To achieve these targets, grid flexibility
must be combined with additional measures like grid extensions and electricity storage. Adding
storage is a very attractive option, as storage allows to shift generated electricity freely to other times
of the day or year. Storage, hence, can make PV electricity fully dispatchable. While storage has the
capability to achieve dispatchability by itself, a solution based on only storage is likely not practical
due to the vast amounts of capacity required for shifts that exceed a couple of hours. How storage
supports PV deployment is schematically sketched in Figure 103 (Morjaria, 2018).
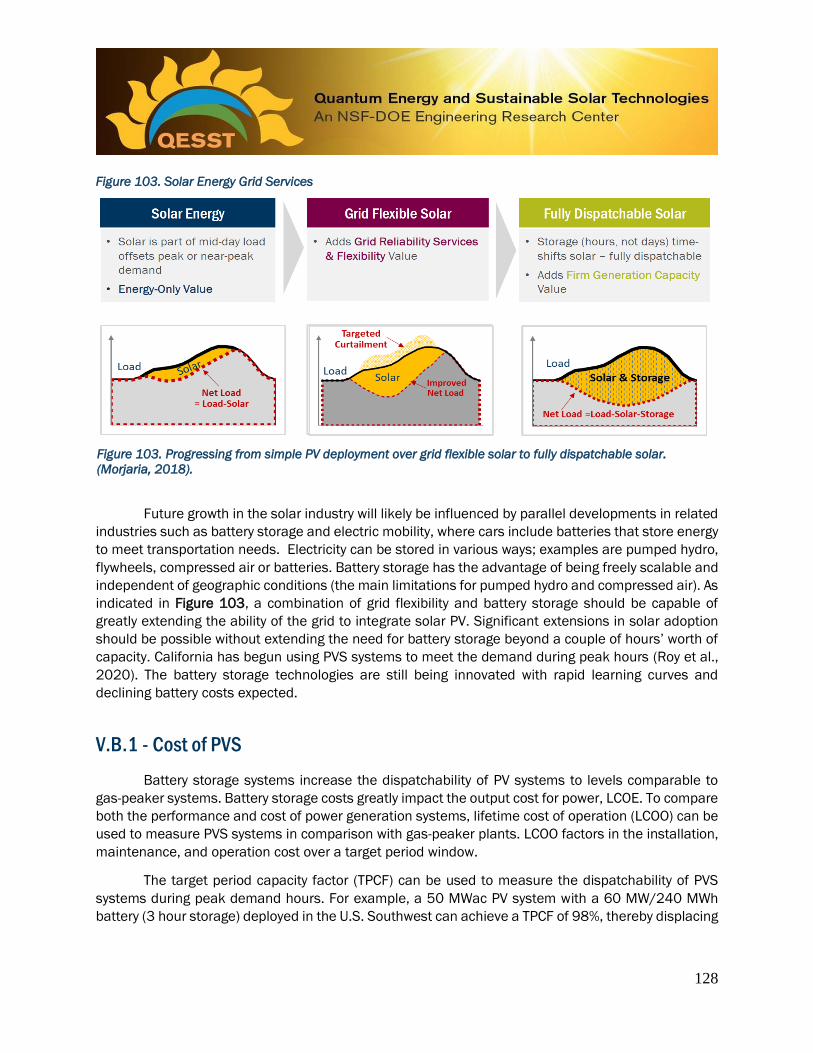
128
Figure 103. Solar Energy Grid Services
Figure 103. Progressing from simple PV deployment over grid flexible solar to fully dispatchable solar.
(Morjaria, 2018).
Future growth in the solar industry will likely be influenced by parallel developments in related
industries such as battery storage and electric mobility, where cars include batteries that store energy
to meet transportation needs. Electricity can be stored in various ways; examples are pumped hydro,
flywheels, compressed air or batteries. Battery storage has the advantage of being freely scalable and
independent of geographic conditions (the main limitations for pumped hydro and compressed air). As
indicated in Figure 103, a combination of grid flexibility and battery storage should be capable of
greatly extending the ability of the grid to integrate solar PV. Significant extensions in solar adoption
should be possible without extending the need for battery storage beyond a couple of hours’ worth of
capacity. California has begun using PVS systems to meet the demand during peak hours (Roy et al.,
2020). The battery storage technologies are still being innovated with rapid learning curves and
declining battery costs expected.
V.B.1 - Cost of PVS
Battery storage systems increase the dispatchability of PV systems to levels comparable to
gas-peaker systems. Battery storage costs greatly impact the output cost for power, LCOE. To compare
both the performance and cost of power generation systems, lifetime cost of operation (LCOO) can be
used to measure PVS systems in comparison with gas-peaker plants. LCOO factors in the installation,
maintenance, and operation cost over a target period window.
The target period capacity factor (TPCF) can be used to measure the dispatchability of PVS
systems during peak demand hours. For example, a 50 MWac PV system with a 60 MW/240 MWh
battery (3 hour storage) deployed in the U.S. Southwest can achieve a TPCF of 98%, thereby displacing

129
a 70 MW combustion turbine plant (Roy et al., 2020). This PVS system also has an 8% LCOO advantage
over natural gas turbine plants as seen in Table 9.
Table 9. Lifecycle Cost of Operation Comparison
Table 9. LCOO of PVS and Gas Combustion Turbine in the U.S. Southwest (Roy et al., 2020).
When including environmental costs as a fiscal cost, a mid-range value for one metric ton of
GHG emissions is $46 (Gillingham & Stock, 2018). If monetized through a carbon tax or other financial
instrument, this social cost provides PVS an additional significant advantage over gas-peaker systems.
A gas plant LCOO is substantially higher when considering environmental costs as seen in Figure 104.
Figure 104. PVS and CT Cost Comparison
Figure 104. LCOO comparison between PVS and conventional gas combustion turbine (in M$) without and
with environmental costs (Roy et al., 2020).
$0
$50
$100
$150
$200
LCOO LCOO+ E
PVS CT
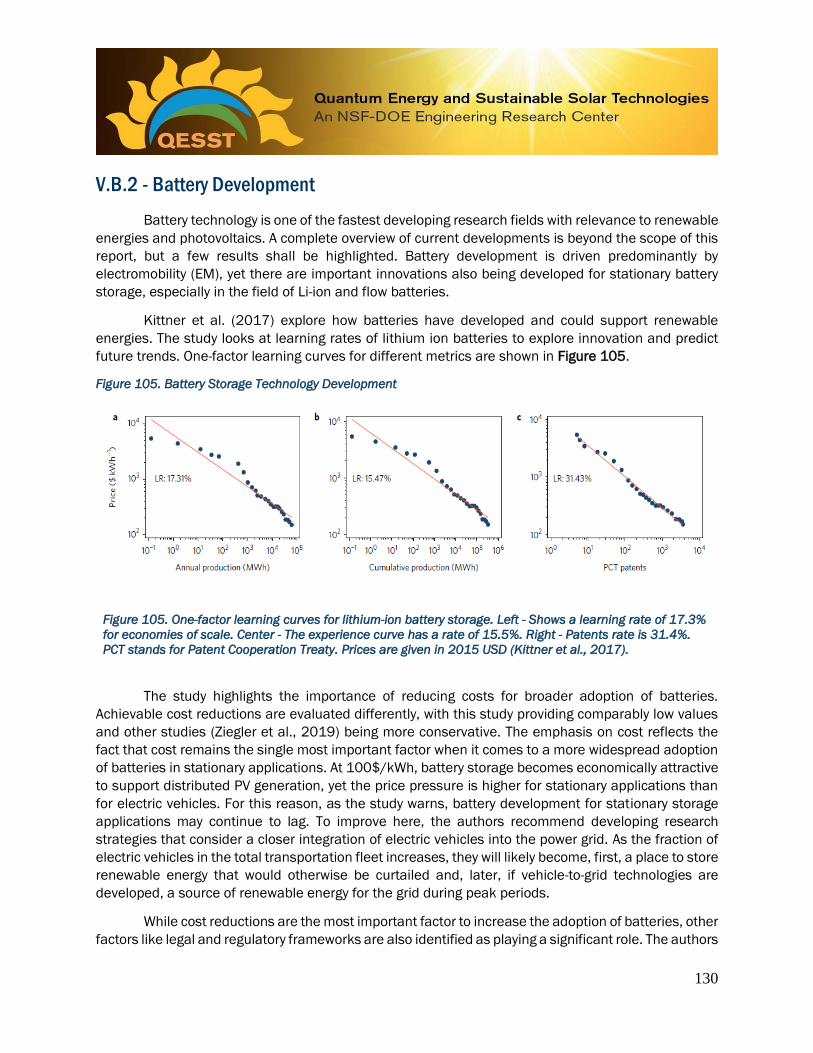
130
V.B.2 - Battery Development
Battery technology is one of the fastest developing research fields with relevance to renewable
energies and photovoltaics. A complete overview of current developments is beyond the scope of this
report, but a few results shall be highlighted. Battery development is driven predominantly by
electromobility (EM), yet there are important innovations also being developed for stationary battery
storage, especially in the field of Li-ion and flow batteries.
Kittner et al. (2017) explore how batteries have developed and could support renewable
energies. The study looks at learning rates of lithium ion batteries to explore innovation and predict
future trends. One-factor learning curves for different metrics are shown in Figure 105.
Figure 105. Battery Storage Technology Development
Figure 105. One-factor learning curves for lithium-ion battery storage. Left - Shows a learning rate of 17.3%
for economies of scale. Center - The experience curve has a rate of 15.5%. Right - Patents rate is 31.4%.
PCT stands for Patent Cooperation Treaty. Prices are given in 2015 USD (Kittner et al., 2017).
The study highlights the importance of reducing costs for broader adoption of batteries.
Achievable cost reductions are evaluated differently, with this study providing comparably low values
and other studies (Ziegler et al., 2019) being more conservative. The emphasis on cost reflects the
fact that cost remains the single most important factor when it comes to a more widespread adoption
of batteries in stationary applications. At 100$/kWh, battery storage becomes economically attractive
to support distributed PV generation, yet the price pressure is higher for stationary applications than
for electric vehicles. For this reason, as the study warns, battery development for stationary storage
applications may continue to lag. To improve here, the authors recommend developing research
strategies that consider a closer integration of electric vehicles into the power grid. As the fraction of
electric vehicles in the total transportation fleet increases, they will likely become, first, a place to store
renewable energy that would otherwise be curtailed and, later, if vehicle-to-grid technologies are
developed, a source of renewable energy for the grid during peak periods.
While cost reductions are the most important factor to increase the adoption of batteries, other
factors like legal and regulatory frameworks are also identified as playing a significant role. The authors
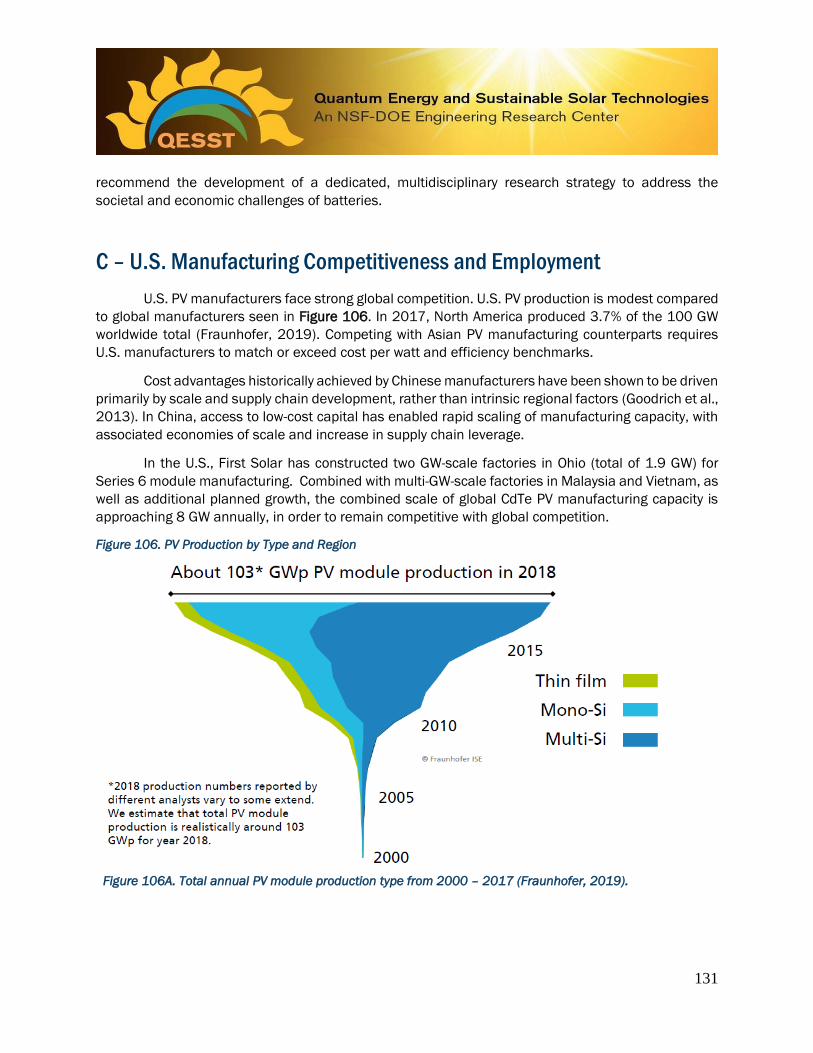
131
recommend the development of a dedicated, multidisciplinary research strategy to address the
societal and economic challenges of batteries.
C – U.S. Manufacturing Competitiveness and Employment
U.S. PV manufacturers face strong global competition. U.S. PV production is modest compared
to global manufacturers seen in Figure 106. In 2017, North America produced 3.7% of the 100 GW
worldwide total (Fraunhofer, 2019). Competing with Asian PV manufacturing counterparts requires
U.S. manufacturers to match or exceed cost per watt and efficiency benchmarks.
Cost advantages historically achieved by Chinese manufacturers have been shown to be driven
primarily by scale and supply chain development, rather than intrinsic regional factors (Goodrich et al.,
2013). In China, access to low-cost capital has enabled rapid scaling of manufacturing capacity, with
associated economies of scale and increase in supply chain leverage.
In the U.S., First Solar has constructed two GW-scale factories in Ohio (total of 1.9 GW) for
Series 6 module manufacturing. Combined with multi-GW-scale factories in Malaysia and Vietnam, as
well as additional planned growth, the combined scale of global CdTe PV manufacturing capacity is
approaching 8 GW annually, in order to remain competitive with global competition.
Figure 106. PV Production by Type and Region
Figure 106A. Total annual PV module production type from 2000 – 2017 (Fraunhofer, 2019).

132
Figure 106B. PV module production from 2010-2017 (Fraunhofer, 2019).
The solar industry employs 242,000 people throughout manufacturing, construction,
operation and maintenance, and recycling product life cycle in the U.S. (The Solar Foundation, 2018).
The industry has seen a relatively continual growth in employment, although the short-term and long-
term implications of the coronavirus pandemic remain unclear. Globally, the PV industry has had a
compound annual growth rate of 36.8% in installation from 2010 to 2018 (Fraunhofer, 2019). Within
the U.S., the utility-scale sector employs about 14% of the total solar workforce, yet it accounts for the
majority of solar deployment (Figure 107). Long-term job growth in the solar industry over the past
decade was primarily due to the falling costs of solar energy, which has been largely driven by the
utility-scale segment. Scaling production in the utility-scale PV segment allows for more rapid grid
penetration of solar energy due to economies of scale and grid integration capabilities (see the grid
integration section V.B). Projected growth in utility-scale PV installations are the largest contributors
to sector growth as shown in Figure 107 (NREL, 2019).
In addition to direct employment, the solar industry contributes to indirect employment through
its supply chain. For example, in 2017, First Solar spent approximately $1.95 billion on its global
supply chain (manufacturing bill of materials, project spend, capital spend and indirect expenses). In
total, direct and indirect employment corresponds to over 30,000 direct, indirect and induced jobs
across First Solar and its supply chain worldwide. Approximately $917 million or 47 percent was spent
on local suppliers in the U.S. to support module manufacturing operations and solar project
development (First Solar, 2018).
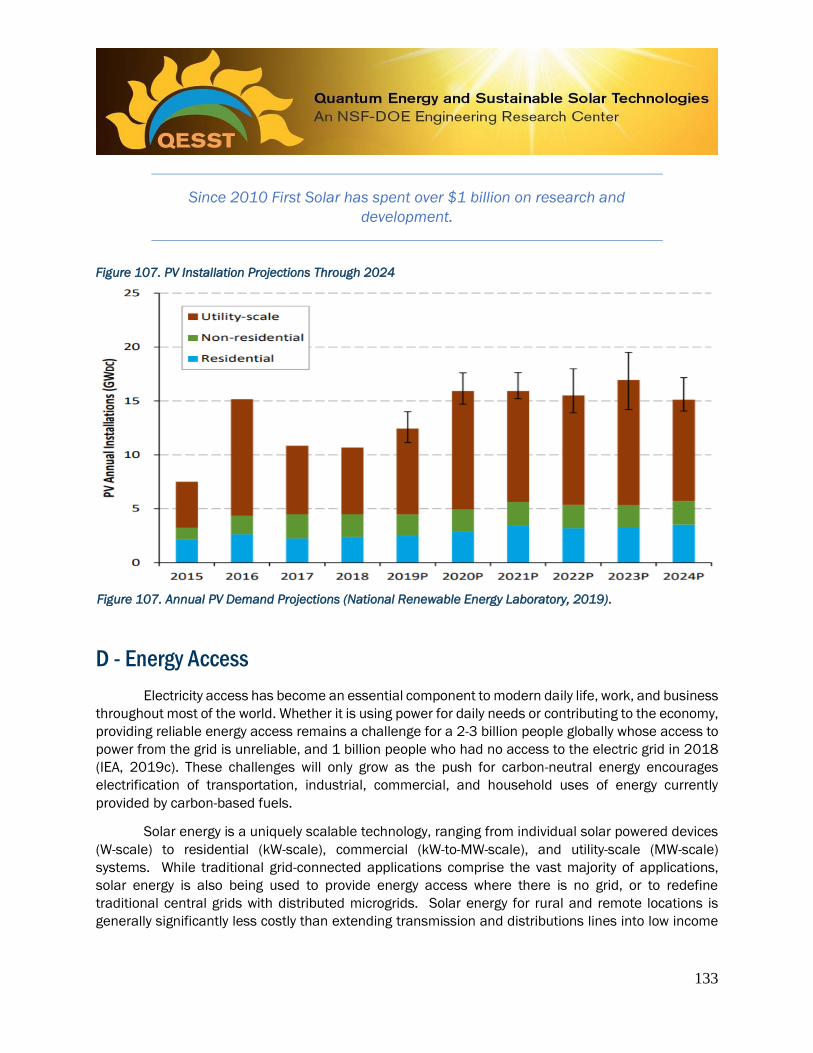
133
Since 2010 First Solar has spent over $1 billion on research and
development.
Figure 107. PV Installation Projections Through 2024
Figure 107. Annual PV Demand Projections (National Renewable Energy Laboratory, 2019).
D - Energy Access
Electricity access has become an essential component to modern daily life, work, and business
throughout most of the world. Whether it is using power for daily needs or contributing to the economy,
providing reliable energy access remains a challenge for a 2-3 billion people globally whose access to
power from the grid is unreliable, and 1 billion people who had no access to the electric grid in 2018
(IEA, 2019c). These challenges will only grow as the push for carbon-neutral energy encourages
electrification of transportation, industrial, commercial, and household uses of energy currently
provided by carbon-based fuels.
Solar energy is a uniquely scalable technology, ranging from individual solar powered devices
(W-scale) to residential (kW-scale), commercial (kW-to-MW-scale), and utility-scale (MW-scale)
systems. While traditional grid-connected applications comprise the vast majority of applications,
solar energy is also being used to provide energy access where there is no grid, or to redefine
traditional central grids with distributed microgrids. Solar energy for rural and remote locations is
generally significantly less costly than extending transmission and distributions lines into low income
134
or rural population areas. In other areas, geographic barriers, such as mountainous terrain, can make
extending the grid even more costly.
Energy access involves both technical and business-model innovation. On the business model
side of the equation, low-income communities often do not provide attractive investment
opportunities, and poorly designed business models can lead either to lack of payment for electricity
or payments that exceed affordability and so exacerbate poverty. Critical to solving these problems is
to design energy access projects so that they deliver high levels of social and economic value for
energy users (Miller et al., 2015). This requires adopting user-centered and community co-production
approaches in the design of energy technologies and projects that allow for systems to enhance the
productive use of energy and to create positive feedback loops that enhance local economic
development and grow local capacity (Miller et al., 2018). Adopting these approaches to project design
can help increase the bankability of projects by delivering higher levels of value to remote and rural
communities that enables higher repayment rates, reduces theft, and allows for growth of energy use
and energy sales over time. If designed properly, electricity access can bring benefits to people through
increased local business and employment opportunities, revenue generation, education attainment,
and positive health outcomes.
A popular approach to the energy access issue has been the utilization of microgrids, which
provide an alternative to centralized grids. Microgrids benefit people living in isolated areas, harsh
terrains, or areas impacted by severe weather. Microgrids provide regional power from village-scale to
regional-scale, with over 3,700 microgrids already in operation around the world (Bilich et al., 2017).
Barriers to microgrids stem from financial burdens, policy challenges, and a lack of skilled technicians
to operate a microgrid (Williams et al., 2015). Microgrid implementation in rural areas can provide
electricity to underserved areas using multiple energy generation sources.
Current microgrids consist of energy generation systems (PV modules, wind turbines) and
energy backup systems (diesel generators, battery banks). The adoption of these systems provides
rural populations enough power to use small appliances such as mobile phones and cooking
appliances. In a partnership between First Solar and Powerhive, variations of microgrid systems were
tested. The microgrids used PV-Battery, PV-Diesel, and PV-Battery and Diesel systems to understand
the life cycle impacts and tradeoffs (Bilich et al., 2017). This study took place in Kenya and each
microgrid was evaluated with the parameters listed in Table 10.

135
Table 10. Microgrid Supporting a Village
Microgrid Parameters
Village Demographics 100 people/5.7 people per household
Daily Demand Per Household 1.545 kWh/day
Total Daily Demand 27.108 kWh/day
Peak Load Factor 2.69
22 Year Avg Solar Insolation 5.935 kWh/m2day
Microgrid Lifetime 25 years
PV Module Type CdTe
Battery Chemistry Li-Ion (nickel-cobalt-manganese)
End Of Life Scenario Landfill
Table 10. Characteristics of a community solar microgrid (Bilich et al., 2017).
V.D.1 - PV-Battery System
The microgrid composed of a PV energy generation source and battery backup system is
dependent on daily solar insolation. Variation in generation resulted in a mismatch of demand and
supply where there is a 7% unmet demand found in Table 11. This microgrid would supply 93% of all
of the demand (Bilich et al., 2017).
V.D.2 - PV-Battery and Diesel System
The microgrid composed of a PV energy generation source and both a backup battery system
and diesel generator meets the full electricity demand. Here, a 3.89 kW diesel generator covered
electricity demand when the battery was depleted (Bilich et al., 2017).
V.D.3 - PV-Diesel System
The microgrid composed of a PV energy generation source and a 3.3 kW diesel generator had
the most inefficient outcomes. The PV system only supplied 22.4% of the electricity demand found in
Table 11. The diesel generator supplied 77.5% of the electricity demand (Bilich et al., 2017). This
system had the highest emissions due to the large dependence on diesel combustion.
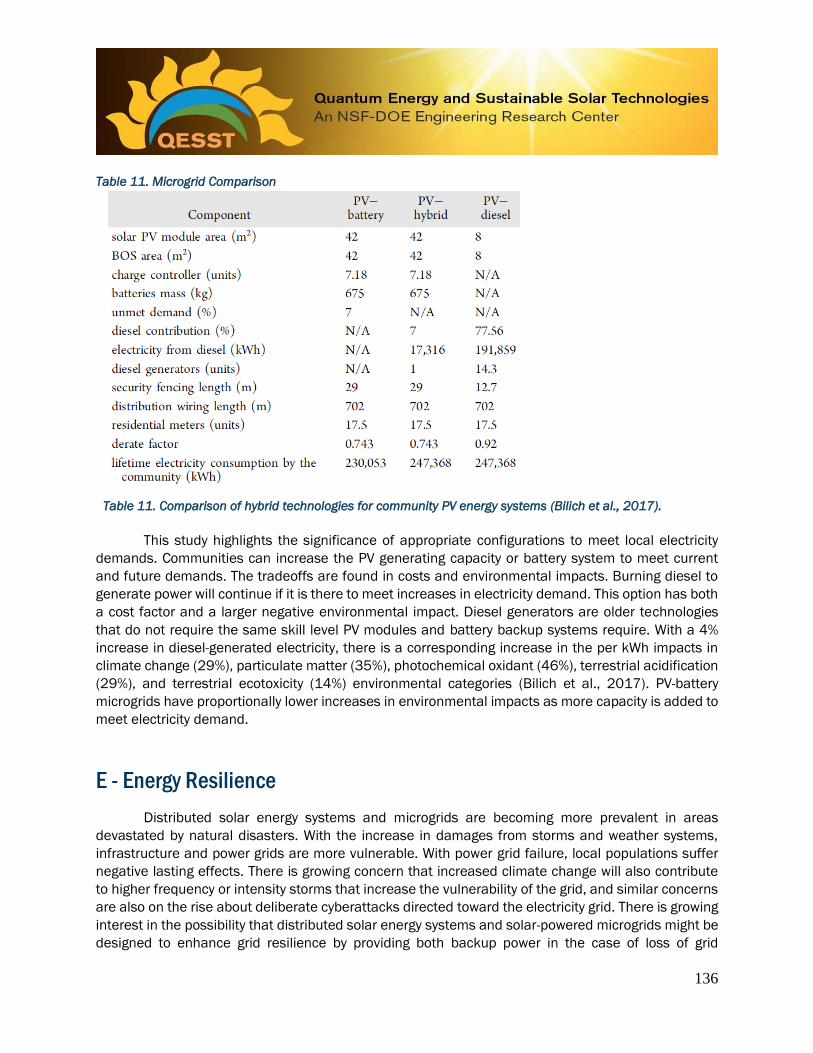
136
Table 11. Microgrid Comparison
Table 11. Comparison of hybrid technologies for community PV energy systems (Bilich et al., 2017).
This study highlights the significance of appropriate configurations to meet local electricity
demands. Communities can increase the PV generating capacity or battery system to meet current
and future demands. The tradeoffs are found in costs and environmental impacts. Burning diesel to
generate power will continue if it is there to meet increases in electricity demand. This option has both
a cost factor and a larger negative environmental impact. Diesel generators are older technologies
that do not require the same skill level PV modules and battery backup systems require. With a 4%
increase in diesel-generated electricity, there is a corresponding increase in the per kWh impacts in
climate change (29%), particulate matter (35%), photochemical oxidant (46%), terrestrial acidification
(29%), and terrestrial ecotoxicity (14%) environmental categories (Bilich et al., 2017). PV-battery
microgrids have proportionally lower increases in environmental impacts as more capacity is added to
meet electricity demand.
E - Energy Resilience
Distributed solar energy systems and microgrids are becoming more prevalent in areas
devastated by natural disasters. With the increase in damages from storms and weather systems,
infrastructure and power grids are more vulnerable. With power grid failure, local populations suffer
negative lasting effects. There is growing concern that increased climate change will also contribute
to higher frequency or intensity storms that increase the vulnerability of the grid, and similar concerns
are also on the rise about deliberate cyberattacks directed toward the electricity grid. There is growing
interest in the possibility that distributed solar energy systems and solar-powered microgrids might be
designed to enhance grid resilience by providing both backup power in the case of loss of grid
137
electricity and the ability to island electricity services. However, one primary challenge to this model is
that grid-tied rooftop distributed solar systems generally power down in the case of loss of grid power
unless accompanied by a battery system.
One example of interest in the use of solar energy to enhance energy resilience is in Puerto
Rico, where Hurricane Maria (Category 5, 2017) caused over 5000 deaths due to mass power outages,
food shortages, hospital closures, and electric grid neglect (Bottger, 2018). Since the hurricane, large
numbers of people have emigrated to the mainland U.S. (Hinojosa & Melendez, 2018). There is
widespread interest among the public and legislators in solar energy, and especially community solar
initiatives, to reduce dependency on imported energy. Puerto Rico imports 98% of its energy from U.S.
fossil fuel sources, at a cost of $3 billion per year. In 2019, the legislature set a renewable portfolio
standard of 100% for 2045, and the electric utility is seeking options to build increased renewable
generation into its integrated resource plan. Individual households, businesses, and communities are
also looking toward solar energy as a potential option for increasing resilience, too, and there are a
number of local solar initiatives underway, even among the poorest communities.
There is growing concern that increased climate change will also
contribute to higher frequency or intensity storms that increase the
vulnerability of the grid, and similar concerns are also on the rise about
deliberate cyberattacks directed toward the electricity grid. There is
growing interest in the possibility that distributed solar energy systems and
solar-powered microgrids might be designed to enhance grid resilience by
providing both backup power in the case of loss of grid electricity and the
ability to island electricity services.

138
VI - CONCLUSION
The U.S. and the globe are in the midst of a large-scale transformation of the energy sector.
Solar energy will likely play a significant role in the U.S. energy transition, both in replacing existing
electricity generation technologies and as a source of new electricity generation to support the
electrification of transportation fleets and industrial processes. As the largest U.S. solar manufacturer,
First Solar and its CdTe PV technology already have a significant role in the U.S. energy sector. In the
past decade, over one-third of the total manufactured PV modules in the U.S. (2010-2018) were thin
film CdTe PV modules (NREL, 2019). The track record of CdTe PV technology has been proven in lab
and field performance. The historical performance of CdTe PV technology in terms of energy
generation, reliability, environmental benefits and safety in diverse operating climates complements
the theoretical findings presented in this report. CdTe PV outperforms other PV technologies and non-
renewable energy production sources on a life cycle environmental basis. Solar energy will continue to
have positive social and economic impacts in the U.S. as the growth of the CdTe PV industry continues.
Based on our review of CdTe PV competitiveness, product safety throughout its life-cycle, and
environmental performance, this technology is expected to make a significant contribution to the U.S.
energy transition. These conclusions are drawn on the basis of eco-efficiency as the driver of solar
energy adoption, where eco-efficiency is the concept of creating more economic value with lower
environmental impacts. The main findings in this report are summarized with respect to the eco-
efficiency framework.
Creating economic value: CdTe PV technology is well positioned to contribute significant
economic value as part of a low-carbon energy transition. Along with wind and combined cycle natural
gas, utility-scale solar energy is the most cost-competitive source of new electricity generation based
on levelized cost of energy. To the extent that module prices continue to fall and module efficiencies
continue to increase, these economic benefits will continue to grow. To date, CdTe PV efficiency has
increased steadily with record cell efficiency of 22.1%, record module efficiency of 19.0%, and average
commercial modules of 420-450W (First Solar Series 6).
Innovation in module size and packaging, back contacts, and semiconductor band-gap grading
have been used to improve CdTe PV device efficiency, long-term degradation rates, and cost per watt,
and additional improvements in efficiency are expected in future CdTe PV technologies. In the future,
synergies with battery storage and vehicle electrification are also expected to increase the demand for
and integration of solar energy into the grid. Through use of advanced inverters, control systems,
energy forecasting, and rapid ramping capabilities, large-scale PV power plants are also able to
regulate real and reactive power output to provide grid-flexible operation and provide important grid
services. CdTe PV technology is especially suited for hot and humid climates, where it has higher
energy yield than crystalline silicon PV due to a lower temperature coefficient and lower spectral
sensitivity to infrared light absorption by water vapor.
Creating environmental value: CdTe PV technology is also well positioned to contribute
significant environmental value as part of a low-carbon energy transition. Overall, CdTe PV technology

139
has among the lowest greenhouse gas emissions and smallest environmental footprints of any
technology. Per unit energy generated, CdTe PV creates significantly lower overall life-cycle
environmental impacts than the current U.S. electricity grid. Avoidance of grid electricity greenhouse
gas and air pollutant emissions with use of PV electricity amounts to environmental and public health
benefits of $20/MWh and $14/MWh, respectively.
Among commercial PV technologies, due to low energy and material use in manufacturing,
CdTe PV has the lowest life cycle environmental impacts, including carbon footprint, energy payback
time, water use, human health impacts, and ecosystem impacts. Properly designed and constructed
solar facilities can have a positive impact on shared uses of land, including increasing agricultural
productivity and enhancing biodiversity through revegetation, management of invasive and sensitive
species, and preservation of land for alternative future uses. CdTe PV modules are also recyclable,
reducing long-term waste from energy generation. First Solar’s high-value recycling facilities have been
operating commercially for over a decade and are able to recover more than 90% of a CdTe PV module
for reuse in new solar modules and glass products. First Solar’s global recycling facilities process
20,000-30,000 metric tons of manufacturing scrap and end-of-life PV modules annually.
Health, safety, and reliability improvements: First Solar CdTe PV modules are designed to
provide 25+ years of reliable performance. CdTe is sourced as a byproduct of zinc and copper mining.
All thin film PV manufacturing steps occur in a single facility, facilitating integrated quality control.
Automated, enclosed equipment and air monitoring help ensure industrial hygiene, and worker
biomonitoring is used to confirm occupational health. First Solar manufacturing facilities are certified
to international standards for quality, environmental management, and occupational health (ISO
9001, ISO 14001, ISO 45001). Product reliability is continuously evaluated through in-line monitoring
of production processes, indoor reliability testing with long-term test sequences, outdoor testing in
temperate, tropical, and desert climates, and operations and maintenance programs that monitor
performance in the field. The semiconductor layers are encapsulated within a 36 kg glass-glass
module with encapsulant bond strength on the order of 5 megapascals (~725 pounds/inch2).
Experimental data, fate and transport models, and field data from extreme weather events have
confirmed the environmental product safety of CdTe PV in case of non-routine events such as field
breakage and fire. Although the goal is to recycle all PV modules, standard waste characterization
testing and fate and transport modeling have confirmed the environmental product safety of CdTe PV
in case of landfill disposal. Strong chemical bonding in CdTe results in high chemical and thermal
stability, which are important for long-term device reliability and product safety.

140
REFERENCES
Adeh, E., et al. (2018). Remarkable agrivoltaic influence on soil moisture, micrometeorology
and water-use efficiency. PLOS ONE, 13, 1-15.
Alonso-Abella, M., et al. (2014). Analysis of spectral effects on the energy yield of different PV
(photovoltaic) technologies: The case of four specific sites. Energy, 67, 435-443.
Alsema, E. (1998). Energy requirements of thin film solar cell modules—a review. Renewable
and Sustainable Energy Reviews, 2, 387-415.
Alsema, E., et al. (2006). Environmental impacts of PV electricity generation—a critical
comparison of energy supply options. 21st European Photovoltaic Solar Energy
Conference. Dresden, Germany.
Ameli, N., et al. (2017). Can the US keep the PACE? A natural experiment in accelerating the
growth of solar electricity. Applied Energy, 191, 163-169.
Archambault, A. (2012). Solar PV Atlas: Solar Power in Harmony with Nature. World Wildlife
Fund. Retrieved June 9, 2020, from http://awsassets.panda.org/downloads/
solar_pv_atlas_final_screen_version_feb_2013.pdf.
Beckmann, J., & Mennenga, A. (2011). Calculation of Emissions When There is a Fire in a
Photovoltaic System made of Cadmium Telluride Modules. Augsberg, Germany:
Bavarian Environmental Protection Agency.
Bergesen, J., et al. (2014). Thin-film photovoltaic power generation offers decreasing
greenhouse gas emissions and increasing environmetal co-benefits in the long term.
Environmental Science and Technology, 48, 16, 9834-9843.
Bilich, A., et al. (2017). Life cycle assessment of solar photovoltaic microgrid systems in off-
grid communities. Environmental Science and Technology, 51, 1-10.
Blakers, A., et al. (2017). The government is right to fund energy storage: a 100% renewable
grid is within reach. Chain Reaction, 129, 12-13.
Blakers, A. (2017). 100% renewable electricity in Australia. Energy, 133, 471-482.
Bloomberg New Energy Finance (2019). Clean Energy Investment Trends. Bloomberg.
Bolinger, M., et al. (2019). Utility-Scale Solar: Emprical Trends in Project Technology, Cost,
Performance, and PPA Pricing. Lawrence Berkeley National Laboratory.

141
Bonnet, D., & Meyers, P. (1998). Cadmium-telluride—Material for thin film solar cells. Journal
of Material Research, 13, 2740-2753.
Bottger, C. (2018). This Hurricane Season, Puerto Ricans Are Imagining a Sustainable Future.
Washington D.C., USA: Inter-Hemisphere Resource Center Press.
Buehler, P. (2015). First Solar Quality and Reliability Strategy. Presented June 15, 2015. IEEE
PVSC. New Orleans: IEEE.
Burst, J., et al. (2016). CdTe solar cells with open-circuit voltage breaking the 1V barrier.
Nature Energy, 1, 1-7.
California Renewables Portfolio Standard Program: Emissions of Greenhouse Gases. Senate
Bill 100 (2018).
Cañete, C., et al. (2014). Energy performance of different photovoltaic module technologies
under outdoor conditions. Energy, 65, 295-302.
Carbon Neutral Cities Alliance (2020). Carbon Neutral Cities Alliance. Retrieved June 9, 2020,
from https://carbonneutralcities.org/.
Colville, F. (2017). Manufacturing under one roof: The gold standard for module consistency
and reliability? PV Tech. Retrieved June 9, 2020, from https://www.pv-
tech.org/editors-blog/manufacturing-under-one-roof-the-gold-standard-for-module-
consistency-and-r.
Creutzig, F., et al. (2017). The underestimated potential of solar energy to mitigate climate
change. Nature Energy, 2, 17140.
Central Research Institute for the Electric Power Industry (1999). Report on the Results of
Work Entrusted to the Renewable Energy and Industrial Technology Development
Organization. Central Research Institute for the Electric Power Industry.
Cyrs, W., et al. (2014). Landfill waste and recycling: Use of a screening-level risk assessment
tool for end-of-life cadmium telluride (CdTe) thin-film photovoltaic (PV) panels. Energy
Policy, 68, 524-533.
EIA (2020a). EIA Expects U.S. Electricity Generation from Renewables to Soon Surpass
Nuclear and Coal. Retrieved June 9, 2020, from
https://www.eia.gov/todayinenergy/detail.php?id=42655.
EIA (2020b). Emissions Summary. Washington D.C., USA: US EIA. Retrieved from
https://www.eia.gov/electricity/annual/html/epa_09_01.html.

142
EIA (2020c). Total Energy. Washington D.C., USA: EIA. Retrieved June 9, 2020, from
https://www.eia.gov/totalenergy/data/browser/?tbl=T10.06#/?f=A&start=2000&en
d=2018&charted=0-4-9-10.
EIA (2020d). What is U.S. Electricity Generation by Energy Source? Retrieved June 9, 2020,
from https://www.eia.gov/tools/faqs/ faq.php?id=427&t=3.
Energy and Environmental Economics, Inc. (2018). Investigating the Economic Value of
Flexible Solar Power Plant Operation. San Francisco: EEE. Retrieved June 9, 2020,
from https://www.ethree.com/wp-content/uploads/2018/10/Investigating-the-
Economic-Value-of-Flexible-Solar-Power-Plant-Operation.pdf
EPA (2020). Energy Grid Summary. Washington D.C., USA: US EPA.
Fiducia, T., et al. (2019). Understanding the role of selenium in defect passivation for highly
efficient selenium-alloyed cadmium telluride solar cells. Nature Energy, 4, 504-511.
First Solar (2018). Sustainability Report. Perrysburg: First Solar.
First Solar (2019a). On 20th Anniversary, First Solar Sets 25GW Milestone for Cleaner, Thin
Film Solar. Retrieved June 9, 2020, from https://investor.firstsolar.com/ news/press-
release-details/2019/On-20th-Anniversary-First-Solar-Sets-25GW-Milestone-for-
Cleaner-Thin-Film-Solar/default.aspx.
First Solar (2019b). Biomonitoring and Air Sampling. Perrysburg: First Solar.
First Solar (2019c). First Solar Becomes Largest PV Module Manufacturer in the Western
Hemisphere. Retrieved June 9, 2020, from
https://investor.firstsolar.com/news/press-release-details/2019/First-Solar-
Becomes-Largest-PV-Module-Manufacturer-in-the-Western-Hemisphere/default.aspx.
First Solar (2019d). First Solar Sustainability Metrics. Perrysburg: First Solar.
First Solar (2019e). First Solar Thin Film Series 6 PV Module. Perrysburg: First Solar.
First Solar (2020a). First Solar Monitored System Performance. Perrysburg: First Solar.
First Solar (2020b). First Solar Q4 19 Earnings and 2020 Guidance Call. First Solar. Retrieved
from https://s2.q4cdn.com/646275317/files/doc_financials/2019/q4/Earnings-
4Q-2019-and-2020-Guidance-presentation-Final.pdf.
Foster, R., et al. (2006). Field testing of CdTe PV modules in Mexico. Denver, CO, USA: 35th
American Solar Energy Society Annual Solar Conference.
Fraunhofer (2019). Photovoltaic Report. Germany: Fraunhofer.

143
Friberg, L. (1977). Toxicology of Metals Volume 2. Washington, D.C.: U.S. Environmental
Protection Agency.
Fthenakis, V., et al. (2005). Emissions and Encapsulation of Cadmium in CdTe PV Modules
During Fires. Progress in Photovoltaics: Research and Applications, 13, 713-723.
Fthenakis, V., et al. (2008). Emissions from Photovoltaic Life Cycles. Environmental Science
and Technology, 42, 2168-2174.
Fthenakis, V. et al. (2009). Update of PV energy payback times and life-cycle greenhouse gas
emissions. 24th European Photovoltaic Solar Energy Conference. Hamburg, Germany.
Fthenakis, V., et al. (2017). Cost Optimization of Decommissioning and Recycling CdTe PV
Power Plants. IEEE PVSC, 1-6.
Fthenakis, V., et al. (2020). Sustainability evaluation of CdTe PV: An update. Renewable and
Sustainable Energy Reviews, 123, 1-10.
Fthenakis, V. (2004). Life cycle impact analysis of cadmium in CdTe PV production. Renewable
and Sustainable Energy Reviews, 8, 303-334.
Fthenakis, V. (2012). Sustainability metrics for extending thin-film photovoltaics to terawatt
levels. Material Research Society, 37, 425-430.
Fthenakis, V., & Kim, H. (2009). Land use and electricity generation: A life-cycle analysis.
Renewable and Sustainable Energy Reviews, 13, 1465-1474.
Fthenakis, V., & Moskowitz, P. (2000). Photovoltaics: Environmental, health and safety issues
and perspective. Progress in Photovoltaics: Research and Applications, 8, 27-38.
Geisthardt, M., & Topic, M. (2015). Status and Potential of CdTe Solar-Cell Efficiency. IEEE
Journal of Photovoltaics, 5, 1217-1221.
Gessert, T., et al. (1996). Development of Cu doped ZnTe as a back contact interface layer for
thin film CdS/CdTe solar cells. J. Vac. Sci. Technol., 14, 806-812.
Gevorgian, V., & O’Neill, B. (2016). Advanced Grid-Friendly Controls Demonstration Project for
Utility-Scale PV Power Plants. Golden: NREL.
Ghiotto, N., et al. (2016). Utility Scale PV Plant Performance in Australia. Tempe, AZ: First
Solar.
Gillingham, K., & Stock, J. (2018). The Cost of Reducing Greenhouse Gas Emissions. . Journal
of Economic Perspective, 32, 53-72.
Gloeckler, M. (2017). CdTe Solar in 2017. IEEE PVSC.
144
Goodrich, A., et al. (2013). Assessing the drivers of regional trends in solar photovoltaic
manufacturing. Energy Environmental Science, 6, 2811-2821.
Gostein, M., et al. (2014). Measuring Soiling Losses at Utility-Scale PV Power Plants. IEEE
PVSC.
Gottschalga, R., et al. (2003). Experimental study of variations of the solar spectrum of
relevance to thin film solar cells. Solar Energy Materials & Solar Cells, 79, 527-537.
Grammatico, M., & Littmann, B. (2016). Quantifying the Anti-Soiling Benefits of Anti-Reflective
Coatings on First Solar Cadmium Telluride PV Modules. IEEE PVSC.
Green, M., et al. (2019). Solar cell efficiency tables (Version 53). Progress in Photovoltaics,
27, 3-12.
GTM Research (2015). Megawatt-Scale PV O&M and Asset Management. San Francisco: GTM
Research.
Hagenorf, C., et al. (2017). Assessment of performance, environmental, health, and safety
aspects of First Solar's CdTe PV Technology. CENER. Retrieved June 9, 2020, from
http://www.cener.com/wp-content/uploads/2017/03/30.2945.0-01-
FirstSolar_EUReviewReport.pdf.
Held, M. (2009). Life cycle assessment of CdTe module recycling. 24th EUPVSEC, 2370-2375.
Held, M. (2011). Update of environmental indicators and energy payback time of CdTe PV
systems in Europe. Progress in Photovoltaics: Research and Applications, 19, 614-26.
Hertwich, E., et al. (2014). Integrated life-cycle assessment of electricity-supply scenarios
confirms global environmental benefit of low-carbon technologies. PNAS, 112, 6277-
6282.
Hess, D. (2016). The politics of niche-regime conflicts: Distributed solar energy in the United
States. Environmental Innovation and Societal Transitions, 19, 42-50.
Hinojosa, J., & Melendez, E. (2018). Puerto Rican Exodus: One Year Since Hurricane Maria.
New York, NY: CUNY Center for Puerto Rican Studies.
Horowitz, K., et al. (2017). An Analysis of the Cost and Performance of Photovoltaic Systems
as a Function of Module Area, Technical Report. Washington D.C., USA: NREL.
Huld, T., & Gracia Amillo, A. (2015). Estimating PV module performance over large
geographical regions: The role of irradiance, air temperature, wind speed and solar
spectrum. Energies, 8, 5159-5181.
Hunt, K., et al. (2015). Availability of Utility-Scale Photovoltaic Power Plants. IEEE PVSC.

145
IEA (2018). Human Health Risk Assessment Methods for PV. Part 1: Fire Risks, PVPS Task
12.
IEA (2019a). Human Health Risk Assessment Methods for PV. Part 2: Breakage Risks. PVPS
Task 12.
IEA (2019b). World Energy Investment. Paris: International Energy Agency.
IEA (2019c). World Energy Outlook. Paris: International Energy Agency. Retrieved June 9,
2020, from https://www.iea.org/reports/world-energy-outlook-2019.
IEA (2020a). Human Health Risk Assessment Methods for PV Part 3: Module Disposal Risks.
PVPS Task 12. Paris: International Energy Agency.
IEA (2020b). Life Cycle Inventories and Life Cycle Assessments of Photovoltaic Systems.
Retrieved June 9, 2020, from http://iea-pvps.org/index.php?id=315.
IEC (1993). Crystalline silicon terrestrial photovoltaic (PV) modules – Design qualification and
type approval.
IEC (2004). Photovoltaic (PV) module safety qualification.
IEC (2008). Thin-film terrestrial photovoltaic (PV) modules–Design qualification and type
approval.
IEC (2018). IECRE issues first solar PV certificate. Retrieved June 9, 2020, from
https://blog.iec.ch/2018/05/iecre-issues-first-solar-pv-certificate/.
IPCC (2019). Climate Change and Land: an IPCC Special Report on Climate Change,
Desertification, Land Degradation, Sustainable Land Management, Food Security, and
Greenhouse Gas Fluxes in Terrestrial Ecosystems. Geneva: IPCC.
IRENA & IEA (2016). End-of-Life Management: Solar Photovoltaic Panels. International
Renewable Energy Agency and International Energy Agency Photovoltaic Power
Systems.
Ito, M., et al. (2010). Life-cycle analyses of very-large scale PV systems using six types of PV
modules. Current Applied Physics, 10, 271-273.
Jacobson, M., et al. (2015). Low-cost solution to the grid reliability problem with 100%
penetration of intermittent wind, water, and solar for all purposes. Proc Natl Acad Sci
USA, 112, 15060-15065.
Jacobson, M., et al. (2017a). 100% Clean and renewable wind, water, and sunlight all-sector
energy roadmaps for 139 countries of the world. Joule, 1, 108–121.
146
Jacobson, M., et al. (2017b). The United States can keep the grid stable at low cost with 100%
clean, renewable energy in all sectors despite inaccurate claims. Proc Natl Acad Sci
114, E5021-E5023.
Jong, T. (2016). First Solar Analyst Meeting: Manufacturing Update. Perrysburg: First Solar.
Jordan, D., et al. (2016). Compendium of photovoltaic degradation rates. Progressive
Photovoltaic, 24, 978-989.
Jordan, D., & Kurtz, S. (2012). Photovoltaic Degradation Rates — An Analytical Review.
Golden: NREL.
Jungbluth, N., et al. (2007). Life cycle assessment of photovoltaics update of the ecoinvent
database. 14th SETAC LCA Case Studies Symposium. Giteborg.
Kato, K., et al. (2001). A life-cycle analysis on thin-film CdS/CdTe PV modules. Solar Energy
Materials & Solar Cells, 67, 279-287.
Kempe, M. (2005). Control of Moisture Ingress into Photovoltaic Modules. Golden: NREL.
Kim, H., et al. (2012). Life cycle greenhouse gas emissions of thin-film photovoltaic electricity
generation. Journal of Industrial Ecology, 16, 110-121.
King, D., et al. (2004). Photovoltaic Array Performance Model SAND2004-3535. Sandia
National Laboratories.
Kittner, N., et al. (2017). Energy storage deployment and innovation for the clean energy
transition. Nature Energy, 17125, 1-6.
Kurtz, S., et al. (2020). Revisiting The Terawatt Challenge. Retrieved June 9, 2020, from
https://www.cambridge.org/core/services/aop-cambridge-
core/content/view/DCB6493B04080C1A37A7B676E9D88BBF/S0883769420000
731a.pdf/revisiting_the_terawatt_challenge.pdf.
Lazard (2019). Lazard's Levelized Cost of Energy Analysis - Version 13. Retrieved June 9,
2020, from https://www.lazard.com/media/451086/lazards-levelized-cost-of-energy-
version-130-vf.pdf
Leccisi, E., et al. (2016). The energy and environmental performance of ground-mounted
photovoltaic systems—A timely update. Energies, 9, 1-13.
Lee, M., et al. (2015). Understanding Next Generation Cadmium Telluride Photovoltaic
Performance due to Spectrum. IEEE PVSC.
Liebreich, M. (2018). Global Trends in Clean Energy and Transportion. Smart Energy Day (pp.
1-59). Liebreich Associates.
147
Lim, L. (2012). Photovoltaic Cadmium Telluride Technology Exposure Assessment. 9th IOHA
International Scientific Conference. Kuala Lumpur, Malaysia.
Loutan, C., et al. (2017). Demonstration of Essential Reliability Services by a 300-MW Solar
Photovoltaic Power Plant. Golden: NREL.
Louwen, A., et al. (2017). Comprehensive characterisation and analysis of PV module
performance under real operating conditions. Progress in Photovoltaics: Research and
Applications, 25, :218–232.
Mailoa, J. (2016). Beyond the Shockley-Queisser limit: intermediate band and tandem solar
cells leveraging silicon and CdTe technology. Doctoral Thesis. Cambridge, MA: MIT.
Marion, B., et al. (2001). Performance summary for the first solar CdTe 1-kW system.
NREL/CP-520-30942. Golden: NREL.
Matsuno, Y., et al. (2012). Dynamic modeling of cadmium substance flow with zinc and steel
demand in Japan. Resources, Conservation and Recycling, 61, 83-90.
Matsuno, Y. (2013). Environmental risk assessment of CdTe PV systems to be considered
under catastrophic events in Japan. Tokyo, Japan: University of Tokyo.
McKinsey (2019). Global Energy Perspective 2019. Retrieved June 9, 2020 from
https://www.mckinsey.com/~/media/McKinsey/Industries/Oil%20and%20Gas/Our
%20Insights/Global%20Energy%20Perspective%202019/McKinsey-Energy-Insights-
Global-Energy-Perspective-2019_Reference-Case-Summary.ashx.
Merchant, E. (2019). The Status of US Solar Manufacturing, One Year After Tariffs. Retrieved
June 9, 2020, from https://www.greentechmedia.com/articles/ read/us-solar-
manufacturing-status-tariffs#gs.t0nno6.
Metzger, W., et al. (2019). Exceeding 20% efficiency with in situ group V doping in
polycrystalline CdTe solar cells. Nature Energy, 4, 837-845.
Miller, C., et al. (2015). The social value of mid-scale energy in Africa: Redefining value and
redesigning energy to reduce poverty. Energy Research and Social Science, 5, 67-69.
Miller, C., et al. (2018). Poverty Eradication through Energy Innovation: A Multi-Layer Design
Framework for Social Value Creation. ASU-AE4H Joint Working Paper.
Morjaria, M. (2018). Solar Industry Perspective beyond LCOE. ESIG.
Munshi, A., et al. (2018). Thin-film CdTe photovoltaics – The technology for utility scale
sustainable energy generation. Solar Energy, 173, 511-516.

148
Narayanswamy, C., et al. (1999). Analysis of Cu diffusion in ZnTe-based contacts for thin-film
CdS/CdTe solar cells. AIP Conf. Proc., 462.
Needleman, D., et al. (2016). Economically sustainable scaling of photovoltaics to meet
climate targets. Energy Environment, 9, 2122-2129.
Ngan, L., et al. (2014). Performance Characterization of Cadmium Telluride Modules Validated
by Utility Scale and Test Systems. IEEE PVSC.
Nishioka, K., et al. (2003). Field-test analysis of P Vsystem output characteristics focusing on
module temperature. Sol. Energy Mater. Sol. Cell, 75, 665-671.
Nofuentes, G., et al. (2014). Analysis of the dependence of the spectral factor of some PV
technologies on the solar spectrum distribution. Applied Energy, 113, 302–309.
National Renewable Energy Laboratory (2019). Solar Industry Update. Washington, D.C.:
United States Government.
National Renewable Energy Laboratory (2020). Cell Efficiency. Retrieved June 9, 2020, from
https://www.nrel.gov/pv/cell-efficiency.html.
National Renewable Energy Laboratory (2020). Module Efficiency. Retrieved June 9, 2020,
from https://www.nrel.gov/pv/module-efficiency.html.
Passow, K. (2018). Commercial Test of Anti-Reflective Coating on First Solar Cadmium
Telluride PV Modules. IEEE PVSC.
Peng, J., et al. (2013). Review on life cycle assessment of energy payback and greenhouse
gas emission of solar photovoltaic systems. Renewable and Sustainable Energy
Reviews, 19, 255-274.
Pérez-López, P., et al. (2017). ENVI-PV: An interactive web client for multi-criteria life cycle
assessment of photovoltaic systems worldwide. Prog. Photovolt: Res. Appl., 25, 484-
498.
Peschel, T. (2010). Solar parks, opportunities for biodiversity. Renews Special Volume, 45, 1-
19.
Peters, I., et al. (2015). Techno-economic analysis of tandem photovoltaic systems. RSC
Advances, 6, 66911-66923.
Peters, I., et al. (2018). Urban haze and photovoltaics. Energy & Environmental Science, 11,
3043-3054.
Peters, I., et al. (2019). The value of efficiency in photovoltaics. Joule, 20, 2732-2747.
149
Peters, I., & Buonassisi, T. (2018). Energy yield limits for single-junction solar cells. Joule, 2,
1160-1170.
Phinikarides, A., et al. (2015). Analysis of photovoltaic system performance time series:
Seasonality and performance loss. Renewable Energy, 77, 51-63.
Powell, D., et al. (2012). Crystalline silicon photovoltaics: A cost analysis framework for
determining technology pathways to reach baseload electricity costs. Energy Environ.
Science, 5, 5874-5883.
Powell, D., et al. (2013). Modeling the cost and minimum sustainable price of crystalline
silicon photovoltaic manufacturing in the United States. IEEE Journal of Photovoltaics,
3, 662-668.
Raju, S. (2013). First Solar's Industry-Leading PV Technology and Recycling Program.
Perrysburg: First Solar.
Raugei, M., & Fthenakis, V. (2010). Cadmium flows and emissions from CdTe PV: Future
expectations. Energy Policy, 38, 5223-5228.
Raugei, M. (2007). Life cycle assessment and energy pay-back time of advanced photovoltaic
modules: CdTe and CIS compared to poly-Si. Energy, 32, 1310-1318.
Ravikumar, D., et al. (2015). An anticipatory approach to quantify energetics of recycling CdTe
photovoltaic systems. Prog. Photovolt: Res. Application, 24, 735-746.
Ravikumar, D., & Sinha, P. (2017). The impact of photovoltaic (PV) installations on downwind
particulate matter concentrations. Journal of The Air & Waste Management
Association, 67, 1126-1136.
Reich, N., et al. (2012). Performance ratio revisited: is PR > 90% realistic? Prog. Photovolt.
Res. Application, 20, 717-726.
Rioux, D., et al. (1993). ZnTe: A potential interlayer to form low resistance back contacts
inCdS/CdTe solar cells. J. Appl. Phys, 73, 8381-8385.
Ross, M., et al. (2006). Improvement in Reliability and Energy Yield Prediction of Thin-Film
CdS/CdTe PV Modules. 4th World Conference on Photovoltaic Energy Conversion.
Waikoloa, HI: WCPEC.
Roy, S., et al. (2020). Assessing the techno-economics and environmental attributes of utility-
scale PV with battery energy storage systems (PVS) compared to conventional gas
peakers for providing firm capacity in California. Energies, 13, 1-24.

150
Sandia National Laboratories (2020). PV Performance. Retrieved June 9, 2020, from
https://pvpmc.sandia.gov/modeling-steps/2-dc-module-iv/cell-temperature/pvsyst-
cell-temperature-model/.
Schachinger, M. (2020). Module Price Index. Retrieved June 9, 2020, from: https://www.pv-
magazine.com/features/investors/module-price-index/.
Schweiger, M., et al. (2017). Performance stability of photovoltaic modules in different
climates. Prog. Photovolt: Res. Appl., 25, 968-981.
Seitz, M., et al. (2013). Eco-efficiency Analysis of Photovoltaic Modules. Munich, Germany:
Bifa Environmental Institute.
Sinha, P., et al. (2012a). Fate and transport evaluation of potential leaching risks from
Cadmium Telluride photovoltaics. Environmental Toxicology and Chemistry, 31, 1670-
1675.
Sinha, P., et al. (2012b). Life cycle water usage in CdTe photovoltaics, IEEE Journal of
Photovoltaics, 3, 429-432.
Sinha, P., et al. (2013). Total Cost Electricity Pricing of Photovoltaics. 28th EU PVSEC.
Sinha, P., et al. (2014). Evaluation of Potential Health and Environmental Impacts from End-
of-life Disposal of Photovoltaics. In: Gill, M.A. (Ed.). Photovoltaics: Synthesis,
Applications and Emerging Technologies, 37-52.
Sinha, P., et al. (2016). Biomonitoring of CdTe PV Manufacturing and Recycling Workers. 43rd
IEEE Photovoltaic Specialists Conference, 1-6.
Sinha, P., et al. (2017). Life cycle management and recycling of PV systems. PV Tech, 47-50.
Sinha, P., et al. (2018a). Best practices in responsible land use for improving biodiversity at a
utility-scale solar facility. Case Studies in the Environment, 2, 1-12.
Sinha, P., et al. (2018b). Developing Ecological Life Cycle Impact Assessment
Characterization Factors for CdTe. Waikoloa, HI: WCPEC-7.
Sinha, P., et al. (2018c). Human Health Risk Assessment Methods for PV Part 1: Fire Risks.
IEA PVPS Task 12.
Sinha, P., & Wade, A. (2015). Assessment of leaching tests for evaluating potential
environmental impacts of PV module field breakage. Journal of Photovoltaics, 5, 1710-
1714.
Sinha, P., & Wade, A. (2018). Addressing hotspots in the product environmental footprint of
CdTe photovoltaics. IEEE Journal of Photovoltaics, 8, 793-797.
151
Sofia, S., et al. (2018). Economic viability of thin-film tandem solar modules in the United
States. Nature Energy, 3, 387-394.
Southern California Edison (2017). The Clean Power and Electrification Pathway Realizing
California’s Environmental Goals. Retrieved June 9, 2020, from:
https://www.sce.com/about-us/reliability/meeting-
demand/pathwayto2030?from=/pathwayto2030
Steinberger, H. (1998). Health, safety and environmental risks from the operation of CdTe and
CIS thin film modules. Progress Photovoltaics, 6, 99-103.
Stocks, M., et al. (2019). A Global Atlas of Pumped Hydro Energy Storage. Retrieved June 9,
2020, from https://openresearch-repository.anu.edu.au/handle/1885/142579.
Stolz, P., et al. (2016). PEF screening report of electricity from photovoltaic panels in the
context of the EU Product Environmental Footprint Category Rules (PEFCR) Pilots, v.
2.0. Uster, Switzerland: Treeze Ltd and SmartGreenScans.
Stolz, P., et al. (2018). Life Cycle Assessment of Current Photovoltaic Module Recycling, IEA
PVPS Task 12. International Energy Agency Power Systems Programme.
Strevel, N., et al. (2012). Performance characterization and superior energy yield of First Solar
PV power plants in high-temperature conditions. Photovoltaics International, 17, 1-6.
Strevel, N., et al. (2013). Improvements in CdTe module reliability and long-term degradation
through advances in construction and device innovation. Photovoltaics International,
22, 1-8.
The Climate Group (2020). RE100 Overview. Retrieved June 9, 2020, from
http://there100.org/re100.
The Solar Foundation (2018). National Solar Jobs Census. Washington, DC: The Solar
Foundation.
Turney, D., & Fthenakis, V. (2011). Environmental impacts from the installation and operation
of large-scale solar power plants. Renewable and Sustainable Energy Reviews, 15,
3261-3270.
UNEP (2016). Summary for Policymakers, Green Energy Choices: The Benefits, Risks, and
Trade-Offs of Low-Carbon Technologies for Electricity Production. Retrieved June 9,
2020, from https://www.greengrowthknowledge.org/resource/summary-policy-
makers-green-energy-choicesthe-benefits-risks-and-trade-offs-low-carbon.
University of Toronto (2018). Grass Fire Behaviour and Flame. Retrieved June 9, 2020, from
http://www.firelab.utoronto.ca/publications/grass_field_guide.html.

152
VCCER (2019). Assessment of the Risks Associated with Thin Film. Blacksburg: Virgina Tech.
Veldhuis, A., et al. (2015). An empirical model for rack-mounted PV module temperatures for
Southeast Asian locations evaluated for minute time scales. IEEE Journal of
Photovoltaics, 5, 774-782.
Weiss, D. (2018). The Future of 2nd and 3rd generation photovoltaics. Pathways for Solar
Energy Conversion and Storage. Hong Kong: 2018 GRC.
Weselek, A., et al. (2019). Agrophotovoltaic systems: Applications, challenges, and
opportunities. A review. Agronomy for Sustainable Development, 39, 35.
Wild-Scholten, M. (2009). Energy Payback Times of PV Modules and Systems. Workshop
Photovoltaik-Modultechnik.
Williams, N., et al. (2015). Enabling private sector investment in microgrid-based rural
electrification in developing countries: A review. Renewable Sustainable Energy
Review, 52, 1268-1281.
Wiser, R., et al. (2016). The environmental and public health benefits of achieving high
penetrations of solar energy in the United States. Energy, 113, 472-486.
Woyte, A., et al. (2013). Monitoring of photovoltaic systems: Good practices and systematic
analysis. 28th EU PVSEC.
Ye, Z., et al. (2013). On PV module temperatures in tropical regions. Solar Energy, 88, 80-87.
Zhao, Y. (2016). Monocrystalline CdTe solar cells with open-circuit voltage over 1V and
efficiency of 17%. Nature Energy, 1, 16067.
Ziegler, M., et al. (2019). Storage requirements and costs of shaping renewable energy toward
grid decarbonization. Joule, 3, 2134-2153.