quality assurance of a helical tomotherapy machinelcr.uerj.br/manual_abfm/quality assurance of a...
TRANSCRIPT

Quality assurance of a helical tomotherapy machine
This article has been downloaded from IOPscience. Please scroll down to see the full text article.
2004 Phys. Med. Biol. 49 2933
(http://iopscience.iop.org/0031-9155/49/13/012)
Download details:
IP Address: 152.92.171.92
The article was downloaded on 08/10/2010 at 22:20
Please note that terms and conditions apply.
View the table of contents for this issue, or go to the journal homepage for more
Home Search Collections Journals About Contact us My IOPscience
INSTITUTE OF PHYSICS PUBLISHING PHYSICS IN MEDICINE AND BIOLOGY
Phys. Med. Biol. 49 (2004) 2933–2953 PII: S0031-9155(04)71892-8
Quality assurance of a helical tomotherapy machine
J D Fenwick1,2, W A Tome1,2, H A Jaradat1, S K Hui1, J A James2,J P Balog2,3, C N DeSouza3, D B Lucas3, G H Olivera2,3, T R Mackie1,2,3
and B R Paliwal1,2
1 Department of Human Oncology, University of Wisconsin-Madison, 600 Highland Avenue,Madison, WI 53792, USA2 Department of Medical Physics, University of Wisconsin-Madison, 1300 University Avenue,Madison, WI 53706, USA3 Tomotherapy Incorporated, 1240 Deming Way, Madison, WI 53717, USA
E-mail: [email protected]
Received 11 November 2003, in final form 3 March 2004Published 17 June 2004Online at stacks.iop.org/PMB/49/2933doi:10.1088/0031-9155/49/13/012
AbstractHelical tomotherapy has been developed at the University of Wisconsin, and‘Hi-Art II’ clinical machines are now commercially manufactured. At thecore of each machine lies a ring-gantry-mounted short linear accelerator whichgenerates x-rays that are collimated into a fan beam of intensity-modulatedradiation by a binary multileaf, the modulation being variable with gantryangle. Patients are treated lying on a couch which is translated continuouslythrough the bore of the machine as the gantry rotates. Highly conformaldose-distributions can be delivered using this technique, which is the therapyequivalent of spiral computed tomography. The approach requires synchronyof gantry rotation, couch translation, accelerator pulsing and the opening andclosing of the leaves of the binary multileaf collimator used to modulate theradiation beam. In the course of clinically implementing helical tomotherapy,we have developed a quality assurance (QA) system for our machine. Thesystem is analogous to that recommended for conventional clinical linearaccelerator QA by AAPM Task Group 40 but contains some novel components,reflecting differences between the Hi-Art devices and conventional clinicalaccelerators. Here the design and dosimetric characteristics of Hi-Art machinesare summarized and the QA system is set out along with experimentaldetails of its implementation. Connections between this machine-based QAwork, pre-treatment patient-specific delivery QA and fraction-by-fraction doseverification are discussed.
0031-9155/04/132933+21$30.00 © 2004 IOP Publishing Ltd Printed in the UK 2933
2934 J D Fenwick et al
1. Introduction
Helical tomotherapy has been developed at the University of Wisconsin (UW) over severalyears (Mackie et al 1993, 1999), and commercial ‘Hi-Art II’ clinical machines are nowmanufactured by Tomotherapy Inc (Madison, WI). Tomotherapy delivers a rotating intensity-modulated fan beam of radiation, the modulation varying with gantry angle. Because theresulting dose-distributions comprise modulated contributions from many angles, the systemhas the potential to deliver highly conformal treatments (Reckwerdt et al 2000).
Axial, or serial tomotherapy (Low et al 1998a, 1998b, 1999) delivers dose-distributionsslice-by-slice, patients being sequentially and discretely translated through the gantryrotational plane of a linear accelerator (linac) between slice deliveries. Helical tomotherapyon the other hand continuously translates patients through the bore of the machine as thegantry rotates, the therapy equivalent of spiral computed tomography (Kalender and Polacin1991). This approach requires synchrony of gantry rotation, couch translation, linac pulsingand the opening and closing of the leaves of the binary multileaf collimator (MLC) used tomodulate the radiation beam. Whereas axial tomotherapy can be accomplished by addinga binary MLC to the front of a conventional linac and moving the treatment couch using ahighly precise indexing system, the helical approach has required a completely re-engineeredmachine—because to achieve continuous beam rotation many major system components haveto be placed on a ring-gantry, coupled to the remaining non-rotating components (electricalpower and high-pressure air supplies, static control and off-board computers) using slip-ringtechnology.
In the course of clinically implementing helical tomotherapy at the University ofWisconsin Comprehensive Cancer Center, we have developed a quality assurance (QA)system for our Hi-Art machine, building on the ‘TG40’ conventional linac QA schedule(AAPM Topic Group 40—Kutcher et al 1994) and previously described axial tomotherapyQA methodologies (Low et al 1998a, 1998b, Woo et al 2003). Here our system is set out,together with its rationale in the form of a review of the design and dosimetric characteristicsof Hi-Art machines. Because these devices differ from conventional commercial linac systems(elements of the dose delivery being highly synchronized and dynamic), the QA system thathas been set up contains some novel components. Experimental details of its implementationare provided, together with some baseline data and suggestions for modification of the systemas the technology matures.
2. Rationale for the helical tomotherapy QA system
2.1. The helical tomotherapy process
Much has been published elsewhere detailing the design and dosimetry of Hi-Art machines(Balog et al 1999a, 1999b, 2003a, 2003b, Mackie et al 1993, 1999). These ideas aresummarized here, and lead naturally to the QA system that has been implemented.
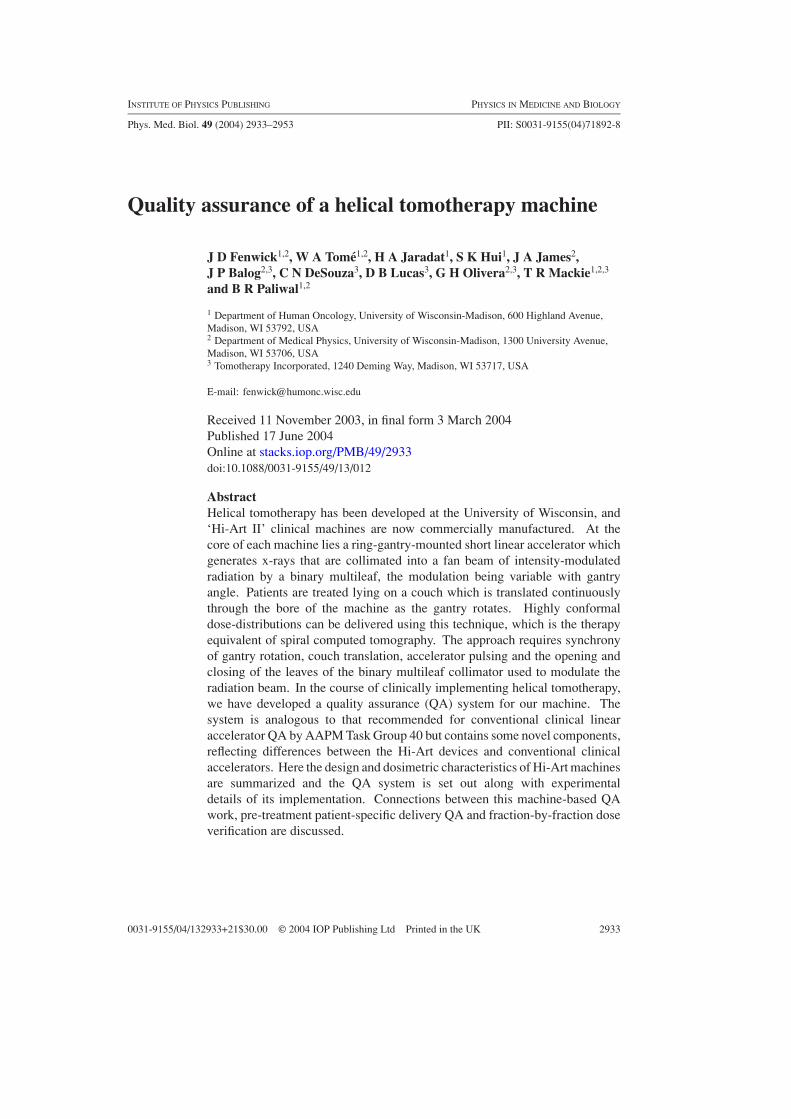
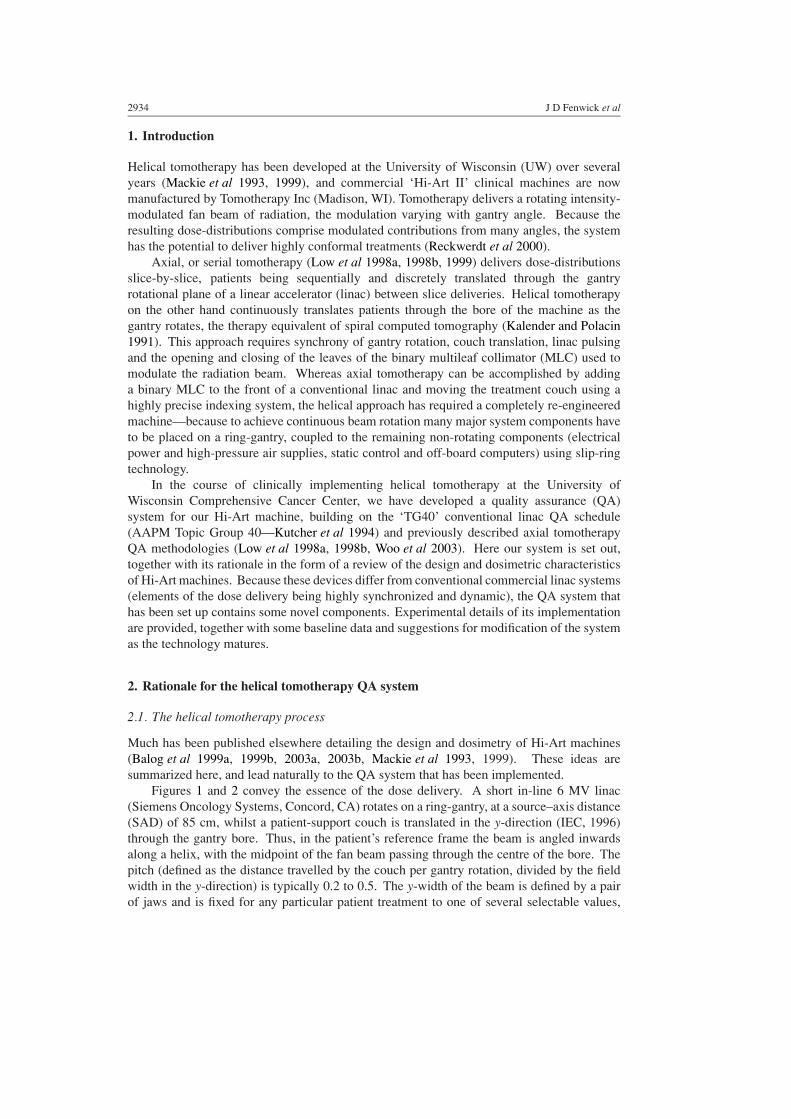
Figures 1 and 2 convey the essence of the dose delivery. A short in-line 6 MV linac(Siemens Oncology Systems, Concord, CA) rotates on a ring-gantry, at a source–axis distance(SAD) of 85 cm, whilst a patient-support couch is translated in the y-direction (IEC, 1996)through the gantry bore. Thus, in the patient’s reference frame the beam is angled inwardsalong a helix, with the midpoint of the fan beam passing through the centre of the bore. Thepitch (defined as the distance travelled by the couch per gantry rotation, divided by the fieldwidth in the y-direction) is typically 0.2 to 0.5. The y-width of the beam is defined by a pairof jaws and is fixed for any particular patient treatment to one of several selectable values,
Quality assurance of a helical tomotherapy machine 2935
6 MV linac Electron beam
Target Whole treatment headrotates around y -axis,with an SAD of 85 cm
Binary multileaf
y-jaws
Photons
x
z
y
Figure 1. A simplified schematic of the Hi-Art treatment head pictured at a gantry angle of 0◦,together with the IEC coordinate system. X-rays produced by a 6 MV linac are collimated downto a fan beam by a pair of jaws, and modulated laterally by a binary multileaf which is blocked offat both ends.
y
Hi-Art axisof rotation
Cylindrical patient geometry,
driven from left to right
The radiation fan beamrotates as the couchtranslates z
x
Figure 2. The Hi-Art fan beam axially rotates while the patient (pictured here as a cylinder) istranslated along the axis of the machine by the moving couch.
for instance 1, 2.5 or 5 cm. Laterally the beam is modulated by a 64 leaf binary MLC (whoseleaves transition rapidly between open and closed states), each leaf having a width of 6.25 mmprojected to isocentre for a maximum possible open lateral field length of 40 cm. The systemdoes not include a physical flattening filter. Consequently its dose-rate is increased, thusreducing treatment times (Deasy et al 2001), and the primary fluence emanating from thetreatment head is forward peaked until it is modulated by the MLC (Balog et al 2003a).
Intensity modulation is accomplished by varying the fraction of time for which differentleaves are opened. The modulation can change with angle, an individual modulation patternbeing defined over the course of a ‘projection’ which corresponds to a gantry rotation of justover 7◦, giving exactly 51 projections per revolution. The gantry rotates at a constant velocityduring treatment with a period between 10 and 60 s per rotation, and so the time-per-projectionis 196 ms or greater. The extent to which a projection is modulated can be characterizedthrough the ‘modulation factor’—the ratio of the maximum to the average leaf open time forthe projection (the averaging excluding leaves beyond the projection’s field edge, which do

2936 J D Fenwick et al
not open). The maximum permissible modulation factor for any part of a delivery is specifiedduring treatment planning; for complex geometries more highly modulated treatments achievegreater conformality but they inevitably take longer to deliver and are unnecessary for lesscomplex cases.
2.2. Factors impacting on dose-distributions delivered by a helical tomotherapy machine
Helical tomotherapy is a highly dynamic treatment process whose accuracy depends on thecorrect performance of the radiation source, MLC, gantry and table. The total dose deliveredto any anatomic site within a patient is, of course, the time-integral of the dose-rate at that siteand thus depends on factors relating to
(1) static beam dosimetry;(2) system dynamics;(3) system synchrony;(4) system geometry.
The static beam (1) and geometric (4) groups of factors are similar to those determining dose-distributions delivered using conventional linear accelerators. Dynamic (2) and synchrony (3)factors have some overlap with similar aspects of sliding window IMRT and axial tomotherapysystem performance (LoSasso et al 1998, Low et al 1998a, 1998b). In total we have identified23 machine characteristics (factors (a)–(w) detailed below) that impact on delivered dose.
2.2.1. Static beam factors. The static beam factors that lie at the heart of helical tomotherapydosimetry (Balog et al 2003b) are
(a) output, characterized as dose-rate at some depth in water for a fixed field-size with thesource–surface distance (SSD) set at the Hi-Art SAD;
(b) field-size dependent output factors;(c) off-axis profile in the lateral direction measured at some depth in water;(d) off-axis profile in the y-direction measured at some depth in water;(e) depth-dose variation, characterized as a percentage-depth-dose in water for a fixed field-
size;(f) output ramp-up time and subsequent stability.
These factors differ a little from their conventional linac equivalents. Firstly, Hi-Art machinesdo not work on a monitor unit-based system, but operate more like a cobalt unit. Output (a)is therefore calibrated in terms of a reference dose rate, measured in units of cGy per minuterather than the conventional cGy per monitor unit.
Secondly, because Hi-Art machines do not have flattening filters, the head scattercontribution to dose is lower than that of conventional linacs (Chaney et al 1994). Thisallows the variation of output factor with field-size (b) to be adequately modelled in threestages:
(bi) changes in head scatter with jaw setting are accounted for by modelling independentoutput factors for each of the jaw settings selectable for patient treatments;
(bii) the variation of phantom scatter with the extent of field irradiated is dealt with by theconvolution-based dose calculation algorithm of the planning system;
(biii) the remaining factor significantly impacting on output is the tongue-and-groove (TG)effect (Balog et al 1999b), which causes an increase in the fluence-per-leaf-opening ifmany neighbouring leaves are opened together, compared to that when only one or afew neighbouring leaves are opened. It is corrected for by the planning system, which
Quality assurance of a helical tomotherapy machine 2937
-30 -20 -10 0 10 20 300
20
40
60
80
100no
rmal
ized
late
ral p
rofi
le (
%)
x (cm)
-40 -20 0 20 400
20
40
60
80
100
norm
aliz
ed y
-pro
file
(%
)
y (mm)(a) (b)
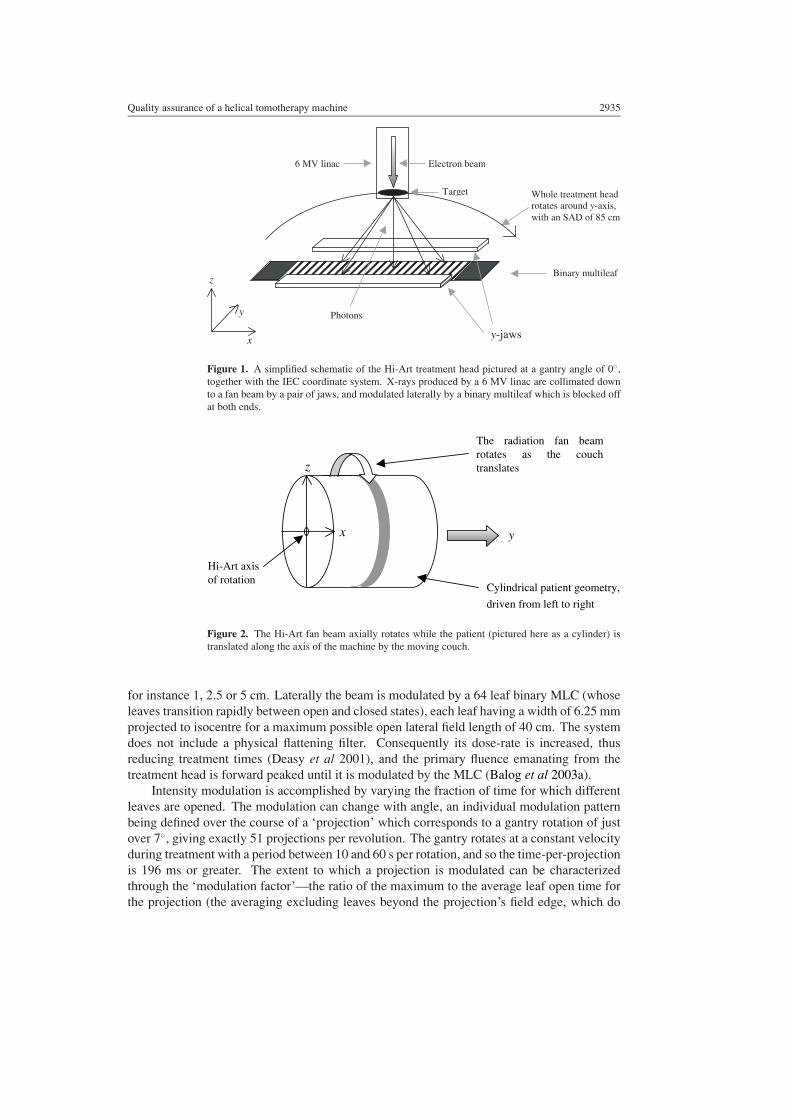
Figure 3. (a) Lateral profiles measured for a 40 × 2.5 cm2 field at an SSD of 85 cm and depthsin water of 1.5 (•) and 10 cm (◦); the profiles have been normalized to 100% on the centralaxis. (b) y-axis profiles (normalized to 100% on the central axis) measured for 40 × 1 (•), 40 ×2.5 (◦) and 40 × 5 cm2 (�) fields at 10 cm depth in water along the axis of the Hi-Art machine.
multiplies planned leaf opening times by TG correction factors measured at machinecommissioning. These TG factors are specific to each leaf, and are determined bymeasuring the fluence-per-leaf-opening when only an individual leaf is opened andthen comparing this value to those measured when the leaf plus either or both of itsneighbouring leaves are opened together (Balog et al 2003b).
Thirdly, the forward peaking of the primary radiation beam is reflected in the shape of thelateral profile (c), while the shape of the y-profile (d) is mainly determined by the jaw openingand penumbra width (figure 3). Historically, beams produced by conventional treatment unitswere intended to be uniformly flat and symmetric to accommodate treatment with broadunmodulated beams. However, this constraint is unnecessary for helical tomotherapy becausethe lateral profile is modulated by the MLC and the static y-profile is smeared out by thehelical delivery. Thus classical measures of the off-axis dose-distribution such as flatness andsymmetry are not very relevant. Of course, it is important that the profile shapes measured atcommissioning (Balog et al 2003b) and modelled by the Hi-Art planning system accuratelyreflect machine performance at the time of treatment. This is particularly critical when treatingpatients set up with their midlines roughly centrally located in the Hi-Art bore but with targetslying off midline, as the dose delivered to such offset targets will depend heavily on the shapeof the lateral profile.
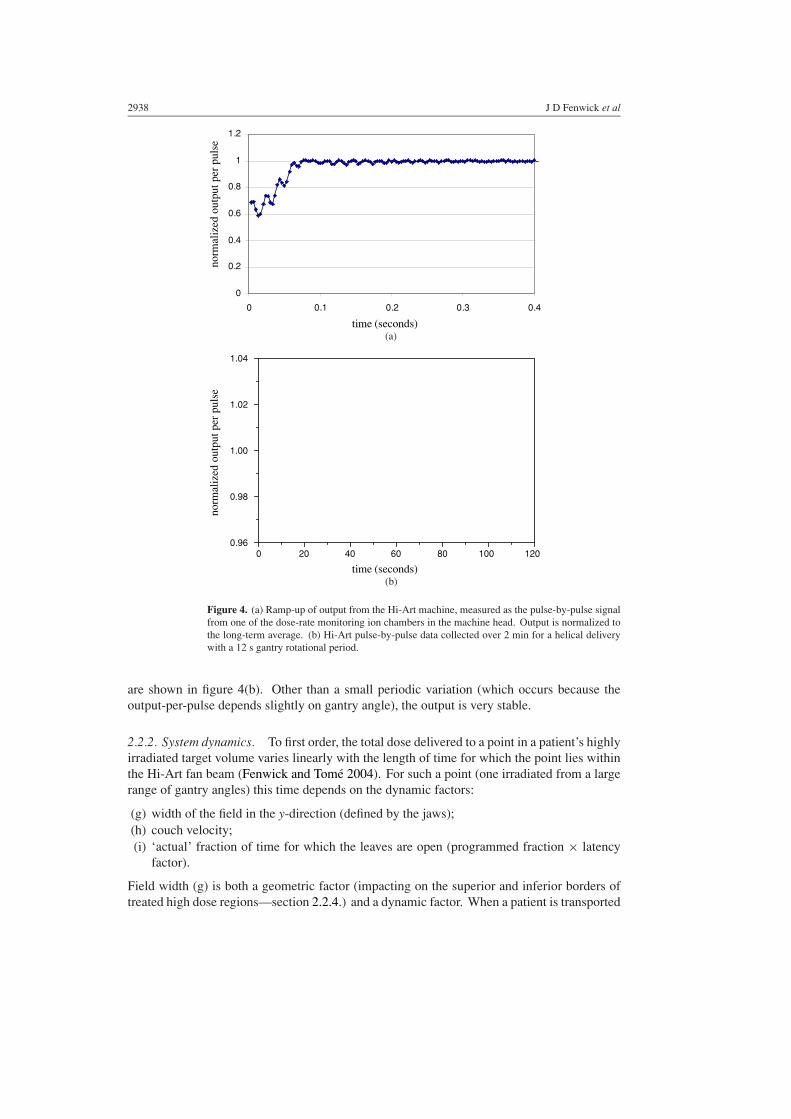
Fourthly, depth-dose variation (e) is typically rather greater than that of conventional 6 MVmachines because of the reduced Hi-Art source–axis distance (Balog et al 2003a). And finally,output ramp-up time (f) is the interval from the commencement of linac pulsing to the pointwhere output reaches a stable value (figure 4(a)). To allow the dose-rate to stabilize beforebeginning a patient treatment, the MLC is kept closed for a fixed time after the start of linacpulsing, which clearly should be at least as great as the ramp-up time. After ramp-up, beamstability over the course of a treatment (typically a few minutes) is essential for accurate dosedelivery, and is therefore monitored by an interlock system that terminates treatment if theoutput averaged over 1 and 5 second windows deviates from the reference level by more than50% or 5%, respectively. In fact stability is generally substantially better than this. Pulse-by-pulse output data collected over 2 minutes for a helical delivery with a 12 s gantry rotation
2938 J D Fenwick et al
0
0.2
0.4
0.6
0.8
1
1.2
0 0.1 0.2 0.3 0.4
time (seconds)
norm
aliz
ed o
utpu
t per
pul
seno
rmal
ized
out
put p
er p
ulse
0 20 40 60 80 100 1200.96
0.98
1.00
1.02
1.04
(a)
time (seconds)(b)
Figure 4. (a) Ramp-up of output from the Hi-Art machine, measured as the pulse-by-pulse signalfrom one of the dose-rate monitoring ion chambers in the machine head. Output is normalized tothe long-term average. (b) Hi-Art pulse-by-pulse data collected over 2 min for a helical deliverywith a 12 s gantry rotational period.
are shown in figure 4(b). Other than a small periodic variation (which occurs because theoutput-per-pulse depends slightly on gantry angle), the output is very stable.
2.2.2. System dynamics. To first order, the total dose delivered to a point in a patient’s highlyirradiated target volume varies linearly with the length of time for which the point lies withinthe Hi-Art fan beam (Fenwick and Tome 2004). For such a point (one irradiated from a largerange of gantry angles) this time depends on the dynamic factors:
(g) width of the field in the y-direction (defined by the jaws);(h) couch velocity;(i) ‘actual’ fraction of time for which the leaves are open (programmed fraction × latency
factor).
Field width (g) is both a geometric factor (impacting on the superior and inferior borders oftreated high dose regions—section 2.2.4.) and a dynamic factor. When a patient is transported
Quality assurance of a helical tomotherapy machine 2939
0
10
20
30
40
50
60
70
80
90
100
110
0 10 20 30 40 50 60 70 80 90 100
programmed open time (%)
actu
al o
pen
tim
e (%
)
Leaf 2
Leaf 22
Leaf 43
Leaf 63
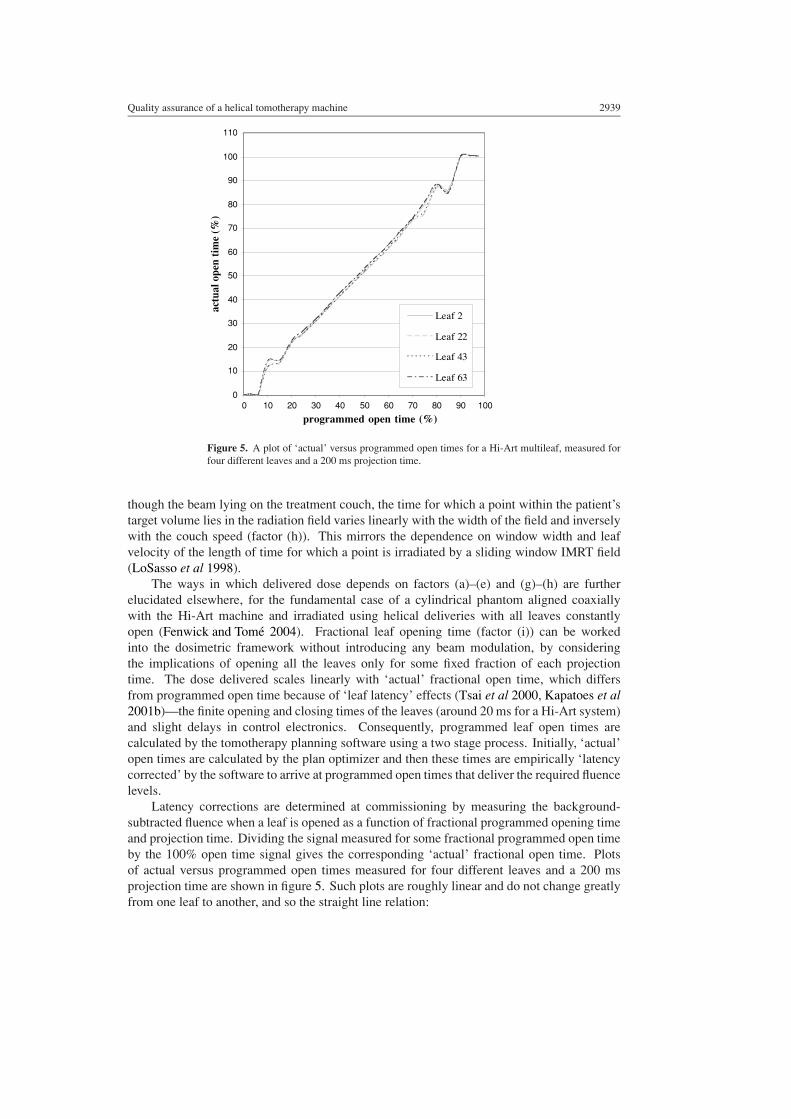
Figure 5. A plot of ‘actual’ versus programmed open times for a Hi-Art multileaf, measured forfour different leaves and a 200 ms projection time.
though the beam lying on the treatment couch, the time for which a point within the patient’starget volume lies in the radiation field varies linearly with the width of the field and inverselywith the couch speed (factor (h)). This mirrors the dependence on window width and leafvelocity of the length of time for which a point is irradiated by a sliding window IMRT field(LoSasso et al 1998).
The ways in which delivered dose depends on factors (a)–(e) and (g)–(h) are furtherelucidated elsewhere, for the fundamental case of a cylindrical phantom aligned coaxiallywith the Hi-Art machine and irradiated using helical deliveries with all leaves constantlyopen (Fenwick and Tome 2004). Fractional leaf opening time (factor (i)) can be workedinto the dosimetric framework without introducing any beam modulation, by consideringthe implications of opening all the leaves only for some fixed fraction of each projectiontime. The dose delivered scales linearly with ‘actual’ fractional open time, which differsfrom programmed open time because of ‘leaf latency’ effects (Tsai et al 2000, Kapatoes et al2001b)—the finite opening and closing times of the leaves (around 20 ms for a Hi-Art system)and slight delays in control electronics. Consequently, programmed leaf open times arecalculated by the tomotherapy planning software using a two stage process. Initially, ‘actual’open times are calculated by the plan optimizer and then these times are empirically ‘latencycorrected’ by the software to arrive at programmed open times that deliver the required fluencelevels.
Latency corrections are determined at commissioning by measuring the background-subtracted fluence when a leaf is opened as a function of fractional programmed opening timeand projection time. Dividing the signal measured for some fractional programmed open timeby the 100% open time signal gives the corresponding ‘actual’ fractional open time. Plotsof actual versus programmed open times measured for four different leaves and a 200 msprojection time are shown in figure 5. Such plots are roughly linear and do not change greatlyfrom one leaf to another, and so the straight line relation:
2940 J D Fenwick et al
Cylindrical phantom
Target
MLC opening for a90° gantry angle
MLC opening for a 0° gantry angle
Hi-Art central axis
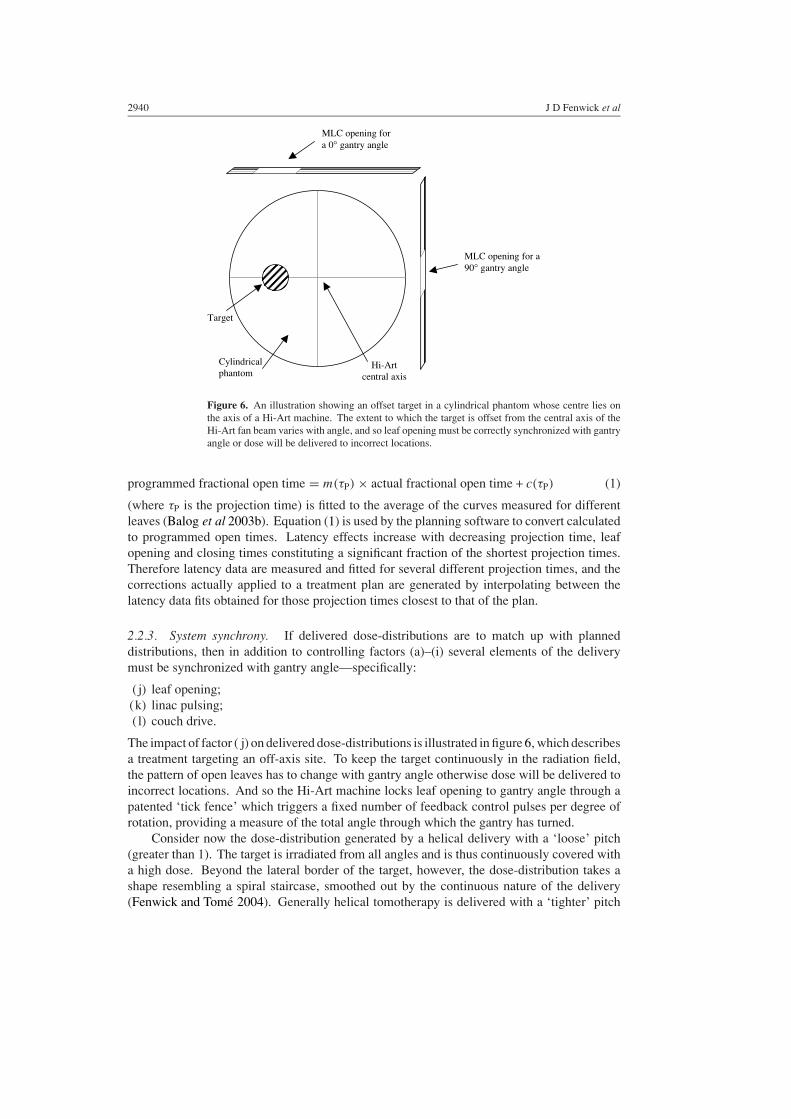
Figure 6. An illustration showing an offset target in a cylindrical phantom whose centre lies onthe axis of a Hi-Art machine. The extent to which the target is offset from the central axis of theHi-Art fan beam varies with angle, and so leaf opening must be correctly synchronized with gantryangle or dose will be delivered to incorrect locations.
programmed fractional open time = m(τP) × actual fractional open time + c(τP) (1)
(where τP is the projection time) is fitted to the average of the curves measured for differentleaves (Balog et al 2003b). Equation (1) is used by the planning software to convert calculatedto programmed open times. Latency effects increase with decreasing projection time, leafopening and closing times constituting a significant fraction of the shortest projection times.Therefore latency data are measured and fitted for several different projection times, and thecorrections actually applied to a treatment plan are generated by interpolating between thelatency data fits obtained for those projection times closest to that of the plan.
2.2.3. System synchrony. If delivered dose-distributions are to match up with planneddistributions, then in addition to controlling factors (a)–(i) several elements of the deliverymust be synchronized with gantry angle—specifically:
( j) leaf opening;(k) linac pulsing;( l) couch drive.
The impact of factor ( j) on delivered dose-distributions is illustrated in figure 6, which describesa treatment targeting an off-axis site. To keep the target continuously in the radiation field,the pattern of open leaves has to change with gantry angle otherwise dose will be delivered toincorrect locations. And so the Hi-Art machine locks leaf opening to gantry angle through apatented ‘tick fence’ which triggers a fixed number of feedback control pulses per degree ofrotation, providing a measure of the total angle through which the gantry has turned.
Consider now the dose-distribution generated by a helical delivery with a ‘loose’ pitch(greater than 1). The target is irradiated from all angles and is thus continuously covered witha high dose. Beyond the lateral border of the target, however, the dose-distribution takes ashape resembling a spiral staircase, smoothed out by the continuous nature of the delivery(Fenwick and Tome 2004). Generally helical tomotherapy is delivered with a ‘tighter’ pitch
Quality assurance of a helical tomotherapy machine 2941
(less than 1), contracting down the dose-distribution beyond the target so that the staircaseoverlaps itself. Beam divergence adds further structure to the distribution, generating a small‘thread’ perturbation of dose within the target region (Kissick et al 2004).
If the linac were run at a fixed pulse repetition rate but the gantry rotation speed varied alittle with angle (because of an imbalance of the gantry) then beyond the target the dose-levelsaround the peripheral spirals would also vary slightly with angle. This follows because dosewould be roughly proportional to time spent in the beam, and beyond the border of the targetregion the time spent in the beam depends on the rotational speed of the gantry. Actually,pulsing of the linac (factor (k)) is also locked to gantry rotation though the tick fence, leadingto a constant output per degree of rotation and removing the erroneous angular dose variation.
Couch velocity (factor (l)) is not yet locked to gantry rotation in the Hi-Art system; couchand gantry speeds are currently considered sufficiently independently well regulated to achieveadequate synchrony. In fact slight differences between the planned and actual speed of thecouch relative to the gantry rotational velocity can arise because the Hi-Art tolerance on gantryrotation speed is 2% (although with precise calibration better accuracy can be achieved, atleast initially). Such differences will lead to small dose delivery errors: a velocity mismatchof up to 2% would lead to all the rotations of a treatment being completed over 98–102%of the planned target length, creating inaccuracies of ±2% in the length of the highly dosedregion (equivalent to a ±2 mm uncertainty on the inferior border of a 10 cm long target)and in the dose-level delivered to the target. These errors can, and will, be eliminated bylocking couch and gantry drive. Likewise, the shapes of the target region thread effect andthe peripheral spiralling will be correctly calculated by the planning system if the couch andgantry are tightly synchronized, but otherwise will be a little distorted.
Given correct matching of average couch and gantry speeds, if the couch speed is constant,while the gantry speed varies a little with angle then a small periodic y-direction ripple will begenerated in the target region dose-distribution. This dose variation occurs because the output(number of linac pulses) per angle is held constant, and so variations in gantry speed leadto fluctuations in the number of pulses per second. Elsewhere it is shown that for a typicalpitch of 0.4, a variation of ±1% in gantry speed will lead to a y-direction ripple of ±0.1% inthe target dose-distribution (Fenwick and Tome 2004). An almost identical effect is createdby rotational variation of the linac output per pulse (figure 4(b)), a ±1% output-per-pulserotational variation also leading to a ±0.1% ripple for a pitch of 0.4.
2.2.4. System geometry. Given accurate beam dosimetry, system dynamics and synchrony,planned dose-distributions will be accurately delivered using the Hi-Art system provided thatthe machine geometry is set up to match the geometric design modelled by the planningsystem. Many innovative Hi-Art geometric checks have been described by Balog et al (2003a)including tests of
(m) field centring in the y-direction, checking that beams do not diverge out of the rotationalplane of the gantry;
(n) collimator twist, checking that the jaws are aligned with the gantry plane;
(o) MLC twist, checking that leaves run perpendicular to the gantry plane;
(p) MLC centring and alignment, assessed by determining that the central leaves 32 and 33project to either side of the isocentre, and that TG artefacts induced in the radiation beamlateral profile by sequentially opening neighbouring leaves are roughly symmetric aboutthe field centre.
2942 J D Fenwick et al
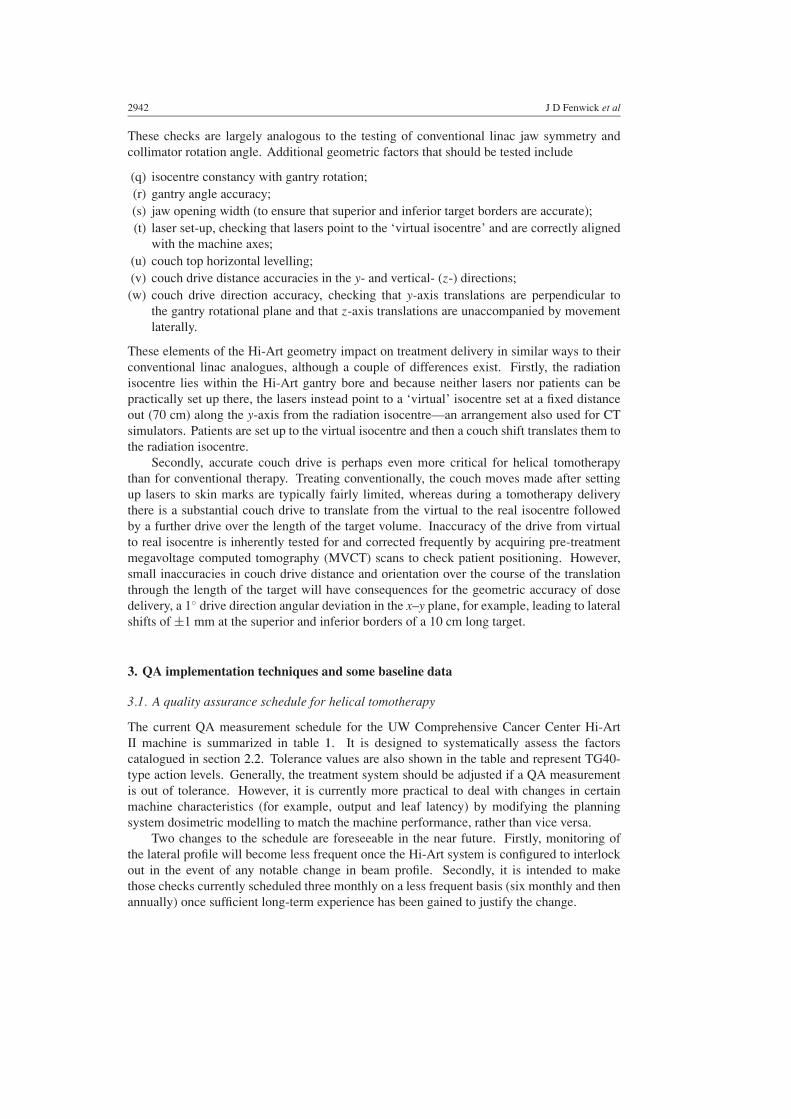
These checks are largely analogous to the testing of conventional linac jaw symmetry andcollimator rotation angle. Additional geometric factors that should be tested include
(q) isocentre constancy with gantry rotation;(r) gantry angle accuracy;(s) jaw opening width (to ensure that superior and inferior target borders are accurate);(t) laser set-up, checking that lasers point to the ‘virtual isocentre’ and are correctly aligned
with the machine axes;(u) couch top horizontal levelling;(v) couch drive distance accuracies in the y- and vertical- (z-) directions;(w) couch drive direction accuracy, checking that y-axis translations are perpendicular to
the gantry rotational plane and that z-axis translations are unaccompanied by movementlaterally.
These elements of the Hi-Art geometry impact on treatment delivery in similar ways to theirconventional linac analogues, although a couple of differences exist. Firstly, the radiationisocentre lies within the Hi-Art gantry bore and because neither lasers nor patients can bepractically set up there, the lasers instead point to a ‘virtual’ isocentre set at a fixed distanceout (70 cm) along the y-axis from the radiation isocentre—an arrangement also used for CTsimulators. Patients are set up to the virtual isocentre and then a couch shift translates them tothe radiation isocentre.
Secondly, accurate couch drive is perhaps even more critical for helical tomotherapythan for conventional therapy. Treating conventionally, the couch moves made after settingup lasers to skin marks are typically fairly limited, whereas during a tomotherapy deliverythere is a substantial couch drive to translate from the virtual to the real isocentre followedby a further drive over the length of the target volume. Inaccuracy of the drive from virtualto real isocentre is inherently tested for and corrected frequently by acquiring pre-treatmentmegavoltage computed tomography (MVCT) scans to check patient positioning. However,small inaccuracies in couch drive distance and orientation over the course of the translationthrough the length of the target will have consequences for the geometric accuracy of dosedelivery, a 1◦ drive direction angular deviation in the x–y plane, for example, leading to lateralshifts of ±1 mm at the superior and inferior borders of a 10 cm long target.
3. QA implementation techniques and some baseline data
3.1. A quality assurance schedule for helical tomotherapy
The current QA measurement schedule for the UW Comprehensive Cancer Center Hi-ArtII machine is summarized in table 1. It is designed to systematically assess the factorscatalogued in section 2.2. Tolerance values are also shown in the table and represent TG40-type action levels. Generally, the treatment system should be adjusted if a QA measurementis out of tolerance. However, it is currently more practical to deal with changes in certainmachine characteristics (for example, output and leaf latency) by modifying the planningsystem dosimetric modelling to match the machine performance, rather than vice versa.
Two changes to the schedule are foreseeable in the near future. Firstly, monitoring ofthe lateral profile will become less frequent once the Hi-Art system is configured to interlockout in the event of any notable change in beam profile. Secondly, it is intended to makethose checks currently scheduled three monthly on a less frequent basis (six monthly and thenannually) once sufficient long-term experience has been gained to justify the change.
Quality assurance of a helical tomotherapy machine 2943
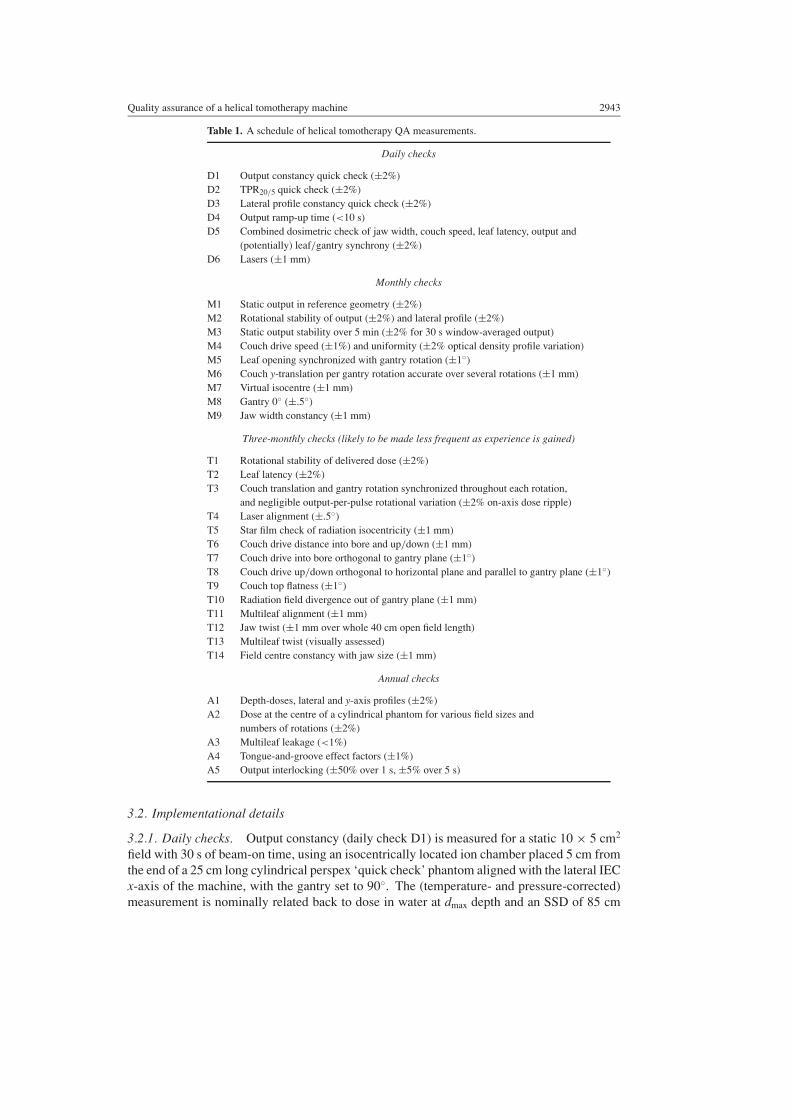
Table 1. A schedule of helical tomotherapy QA measurements.
Daily checks
D1 Output constancy quick check (±2%)D2 TPR20/5 quick check (±2%)D3 Lateral profile constancy quick check (±2%)D4 Output ramp-up time (<10 s)D5 Combined dosimetric check of jaw width, couch speed, leaf latency, output and
(potentially) leaf/gantry synchrony (±2%)D6 Lasers (±1 mm)
Monthly checks
M1 Static output in reference geometry (±2%)M2 Rotational stability of output (±2%) and lateral profile (±2%)M3 Static output stability over 5 min (±2% for 30 s window-averaged output)M4 Couch drive speed (±1%) and uniformity (±2% optical density profile variation)M5 Leaf opening synchronized with gantry rotation (±1◦)M6 Couch y-translation per gantry rotation accurate over several rotations (±1 mm)M7 Virtual isocentre (±1 mm)M8 Gantry 0◦ (±.5◦)M9 Jaw width constancy (±1 mm)
Three-monthly checks (likely to be made less frequent as experience is gained)
T1 Rotational stability of delivered dose (±2%)T2 Leaf latency (±2%)T3 Couch translation and gantry rotation synchronized throughout each rotation,
and negligible output-per-pulse rotational variation (±2% on-axis dose ripple)T4 Laser alignment (±.5◦)T5 Star film check of radiation isocentricity (±1 mm)T6 Couch drive distance into bore and up/down (±1 mm)T7 Couch drive into bore orthogonal to gantry plane (±1◦)T8 Couch drive up/down orthogonal to horizontal plane and parallel to gantry plane (±1◦)T9 Couch top flatness (±1◦)T10 Radiation field divergence out of gantry plane (±1 mm)T11 Multileaf alignment (±1 mm)T12 Jaw twist (±1 mm over whole 40 cm open field length)T13 Multileaf twist (visually assessed)T14 Field centre constancy with jaw size (±1 mm)
Annual checks
A1 Depth-doses, lateral and y-axis profiles (±2%)A2 Dose at the centre of a cylindrical phantom for various field sizes and
numbers of rotations (±2%)A3 Multileaf leakage (<1%)A4 Tongue-and-groove effect factors (±1%)A5 Output interlocking (±50% over 1 s, ±5% over 5 s)
3.2. Implementational details
3.2.1. Daily checks. Output constancy (daily check D1) is measured for a static 10 × 5 cm2
field with 30 s of beam-on time, using an isocentrically located ion chamber placed 5 cm fromthe end of a 25 cm long cylindrical perspex ‘quick check’ phantom aligned with the lateral IECx-axis of the machine, with the gantry set to 90◦. The (temperature- and pressure-corrected)measurement is nominally related back to dose in water at dmax depth and an SSD of 85 cm
2944 J D Fenwick et al
100 200 300 400 500 600 7000
20
40
60
80
100no
rmal
ized
late
ral p
rofi
le (
%)
0 100 200 300 400 500 600 700
0.990
0.995
1.000
1.005
1.010
ratio
of
norm
aliz
ed p
rofi
les
MVCT channel numberMVCT channel number(a) (b)
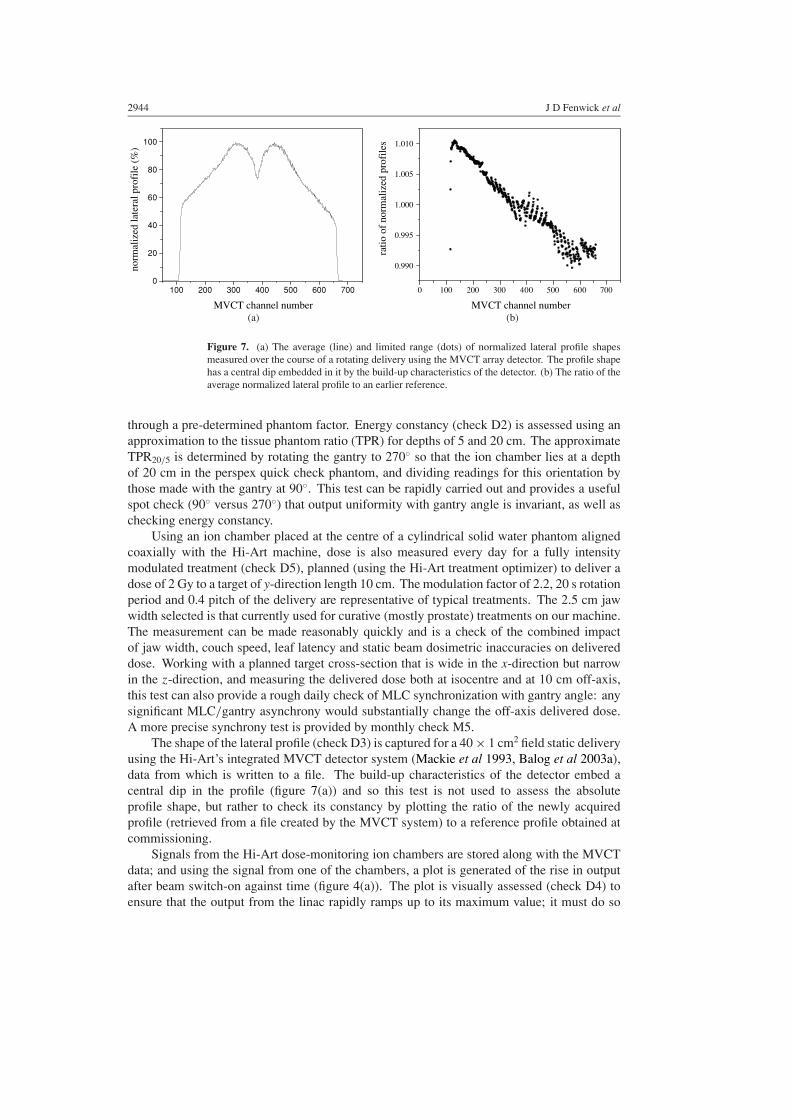
Figure 7. (a) The average (line) and limited range (dots) of normalized lateral profile shapesmeasured over the course of a rotating delivery using the MVCT array detector. The profile shapehas a central dip embedded in it by the build-up characteristics of the detector. (b) The ratio of theaverage normalized lateral profile to an earlier reference.
through a pre-determined phantom factor. Energy constancy (check D2) is assessed using anapproximation to the tissue phantom ratio (TPR) for depths of 5 and 20 cm. The approximateTPR20/5 is determined by rotating the gantry to 270◦ so that the ion chamber lies at a depthof 20 cm in the perspex quick check phantom, and dividing readings for this orientation bythose made with the gantry at 90◦. This test can be rapidly carried out and provides a usefulspot check (90◦ versus 270◦) that output uniformity with gantry angle is invariant, as well aschecking energy constancy.
Using an ion chamber placed at the centre of a cylindrical solid water phantom alignedcoaxially with the Hi-Art machine, dose is also measured every day for a fully intensitymodulated treatment (check D5), planned (using the Hi-Art treatment optimizer) to deliver adose of 2 Gy to a target of y-direction length 10 cm. The modulation factor of 2.2, 20 s rotationperiod and 0.4 pitch of the delivery are representative of typical treatments. The 2.5 cm jawwidth selected is that currently used for curative (mostly prostate) treatments on our machine.The measurement can be made reasonably quickly and is a check of the combined impactof jaw width, couch speed, leaf latency and static beam dosimetric inaccuracies on delivereddose. Working with a planned target cross-section that is wide in the x-direction but narrowin the z-direction, and measuring the delivered dose both at isocentre and at 10 cm off-axis,this test can also provide a rough daily check of MLC synchronization with gantry angle: anysignificant MLC/gantry asynchrony would substantially change the off-axis delivered dose.A more precise synchrony test is provided by monthly check M5.
The shape of the lateral profile (check D3) is captured for a 40 × 1 cm2 field static deliveryusing the Hi-Art’s integrated MVCT detector system (Mackie et al 1993, Balog et al 2003a),data from which is written to a file. The build-up characteristics of the detector embed acentral dip in the profile (figure 7(a)) and so this test is not used to assess the absoluteprofile shape, but rather to check its constancy by plotting the ratio of the newly acquiredprofile (retrieved from a file created by the MVCT system) to a reference profile obtained atcommissioning.
Signals from the Hi-Art dose-monitoring ion chambers are stored along with the MVCTdata; and using the signal from one of the chambers, a plot is generated of the rise in outputafter beam switch-on against time (figure 4(a)). The plot is visually assessed (check D4) toensure that the output from the linac rapidly ramps up to its maximum value; it must do so

Quality assurance of a helical tomotherapy machine 2945
within 10 s, as this is the (adjustable) interval for which all leaves are currently kept closed atthe beginning of each treatment.
A laser set-up to the virtual isocentre (check D6) is conveniently tested every day usingthe SonArray optical guidance system (ZMed, Ashland, MA). A jig is lined up to the lasers,and the guidance system then provides a comparison of the jig location with a fixed referencepoint (the virtual isocentre) established at machine commissioning. In the absence of opticalguidance any alternative fiducial mark could be used instead—for example, a reference pointon the couch, at a fixed couch position.
3.2.2. Monthly checks. Output is measured directly at 5 cm deep in water with an SSD of85 cm (check M1) using an ion chamber placed at the centre of a 5 × 10 cm2 field, irradiatedfor 30 s. The reading is linked back to dose at dmax through a PDD curve measured atcommissioning.
Rotational beam stability (check M2) is determined using the Hi-Art’s on-board MVCTdetector array. A rotational treatment is delivered with all leaves open, a jaw width of 1 cmand the couch retracted out of the bore. The MVCT detector captures the shape of the lateralbeam profile at each linac pulse. The pulse-by-pulse Hi-Art ion chamber measurements storedalongside this profile data are plotted to characterize the variation of output with gantry angle,generating a trace like the first 30 s of figure 4(b). The angular output variation shown by suchtraces correlates well with dose measurements made at isocentre for a fixed delivery time anda range of (static) gantry angles.
Normalized lateral profile shapes are determined for each pulse; the normalized profilevalue at a point being calculated as the ratio of the detector reading at that point to thetotalled array signal for that pulse. The normalized profile averaged over all views is plotted(figure 7(a)) together with the greatest and least values at each point over the course of thedelivery, which shows the limited extent of profile variation with angle. The ratio of themeasured average profile to a reference profile is also plotted (figure 7(b)). The figure showsa tilt: tilts of 1–2% have often been seen and may either reflect changes in the beam or smallsequencing inconsistencies in the (prototype) detector read-out. The read-out technique hasbeen upgraded, but it is nonetheless sensible to make periodic checks of the lateral profileindependently of the MVCT scanner. Therefore, the profile is also spot-checked each monthby making ion chamber measurements of doses delivered at 5 cm deep in solid water on-axisand at ±10 cm off-axis using a static 40 × 5 cm2 field, and comparing ratios of these valuesto profile measurements made at commissioning.
An output stability over a typical treatment beam-on time of 5 min (check M3) is testedfor a static delivery. The signal from one of the Hi-Art dose-monitoring ion chambers is usedto generate a 5 min long trace of output versus time. The length of time for which a pointwithin a patient’s highly dosed target volume lies inside the borders of the Hi-Art fan beamduring a helical delivery is roughly equal to the gantry period divided by the pitch—around30 s or longer for typical clinical treatments. Therefore, the raw data shown in figure 4(b)are smoothed to generate a plot showing the variation with the time of output averaged over a30 s window. This smoothed output should vary by less than ±2% around the average outputof the delivery.
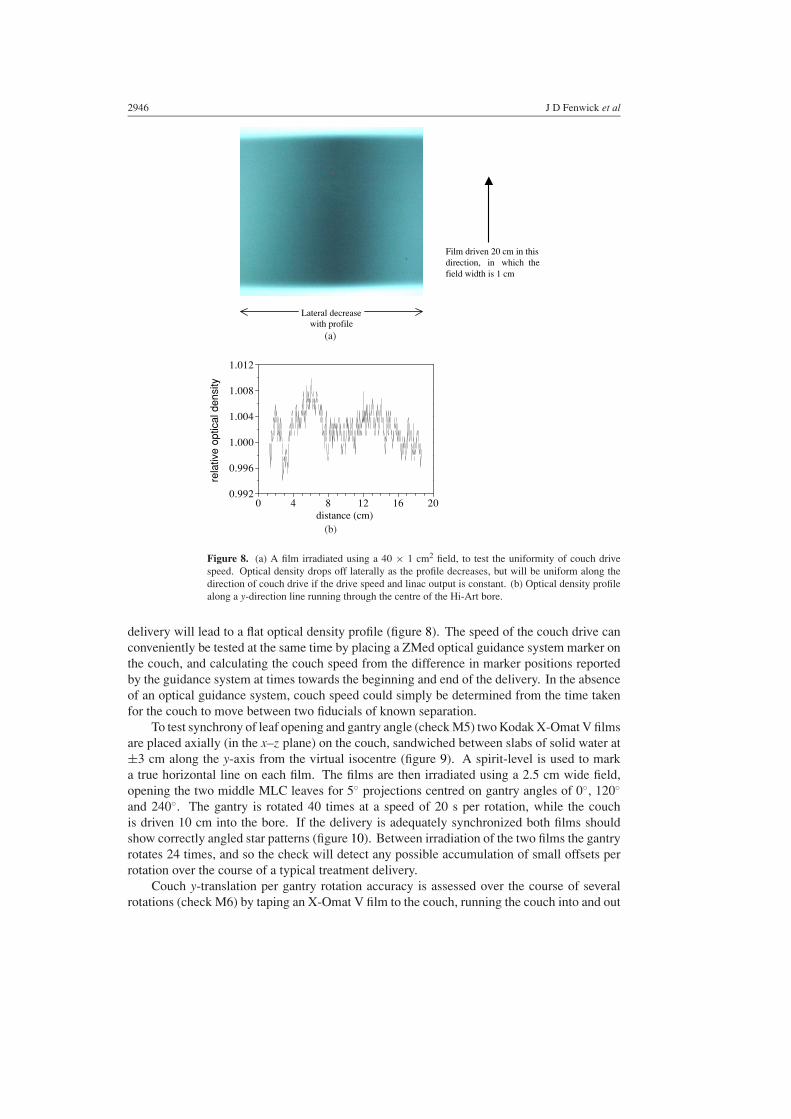
Uniformity of couch drive speed is tested (check M4) by taping an EDR2 film (EastmanKodak, Rochester, NY) to the couch, marking the direction of couch drive on the film andcovering the film with 15 mm of solid water build-up. With the gantry set at 0◦, the film isirradiated using a 40 × 1 cm2 field; the delivery takes 300 s during which time the couchis driven 20 cm. A film optical density profile along the direction of couch drive is plotted(figure 8); given a stable beam output (check M3), uniform couch speed throughout the
2946 J D Fenwick et al
0 4 8 12 16 200.992
0.996
1.000
1.004
1.008
1.012
rela
tive
optic
al d
ensi
ty
distance (cm)
Film driven 20 cm in thisdirection, in which thefield width is 1 cm
Lateral decrease with profile
(a)
(b)
Figure 8. (a) A film irradiated using a 40 × 1 cm2 field, to test the uniformity of couch drivespeed. Optical density drops off laterally as the profile decreases, but will be uniform along thedirection of couch drive if the drive speed and linac output is constant. (b) Optical density profilealong a y-direction line running through the centre of the Hi-Art bore.
delivery will lead to a flat optical density profile (figure 8). The speed of the couch drive canconveniently be tested at the same time by placing a ZMed optical guidance system marker onthe couch, and calculating the couch speed from the difference in marker positions reportedby the guidance system at times towards the beginning and end of the delivery. In the absenceof an optical guidance system, couch speed could simply be determined from the time takenfor the couch to move between two fiducials of known separation.
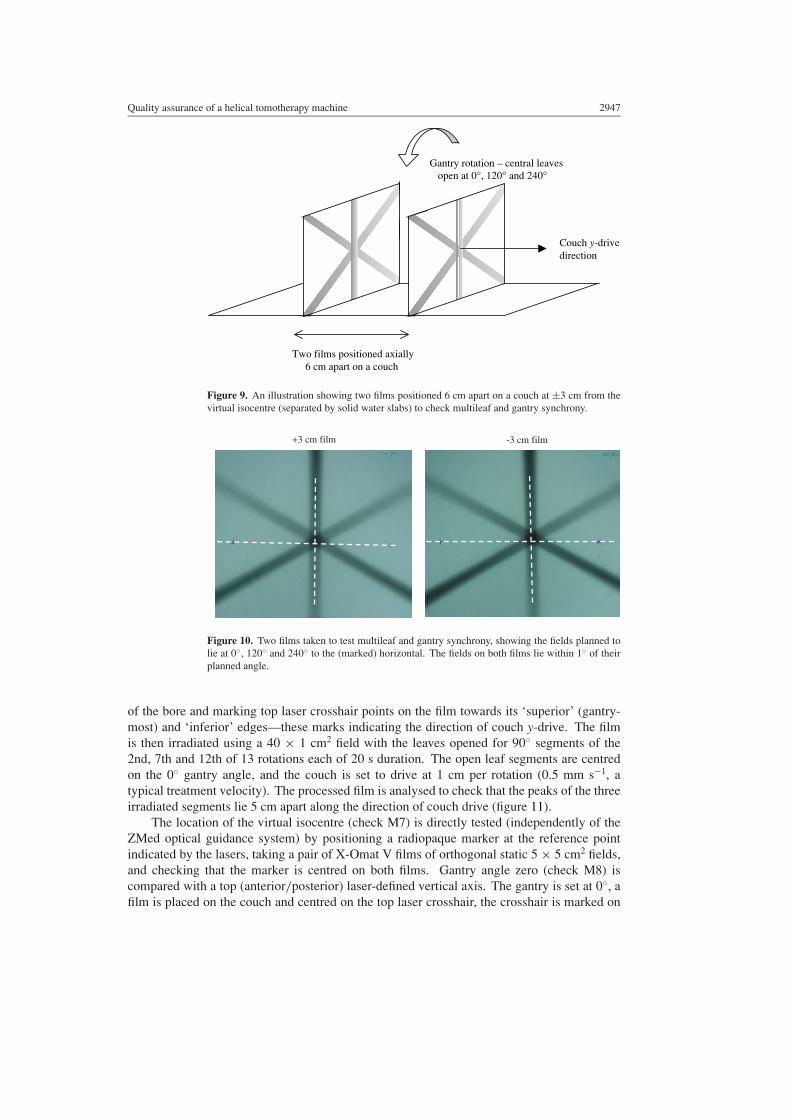
To test synchrony of leaf opening and gantry angle (check M5) two Kodak X-Omat V filmsare placed axially (in the x–z plane) on the couch, sandwiched between slabs of solid water at±3 cm along the y-axis from the virtual isocentre (figure 9). A spirit-level is used to marka true horizontal line on each film. The films are then irradiated using a 2.5 cm wide field,opening the two middle MLC leaves for 5◦ projections centred on gantry angles of 0◦, 120◦
and 240◦. The gantry is rotated 40 times at a speed of 20 s per rotation, while the couchis driven 10 cm into the bore. If the delivery is adequately synchronized both films shouldshow correctly angled star patterns (figure 10). Between irradiation of the two films the gantryrotates 24 times, and so the check will detect any possible accumulation of small offsets perrotation over the course of a typical treatment delivery.
Couch y-translation per gantry rotation accuracy is assessed over the course of severalrotations (check M6) by taping an X-Omat V film to the couch, running the couch into and out
Quality assurance of a helical tomotherapy machine 2947
Couch y-drivedirection
Two films positioned axially 6 cm apart on a couch
Gantry rotation – central leaves open at 0°, 120° and 240°
Figure 9. An illustration showing two films positioned 6 cm apart on a couch at ±3 cm from thevirtual isocentre (separated by solid water slabs) to check multileaf and gantry synchrony.
-3 cm film +3 cm film
Figure 10. Two films taken to test multileaf and gantry synchrony, showing the fields planned tolie at 0◦, 120◦ and 240◦ to the (marked) horizontal. The fields on both films lie within 1◦ of theirplanned angle.
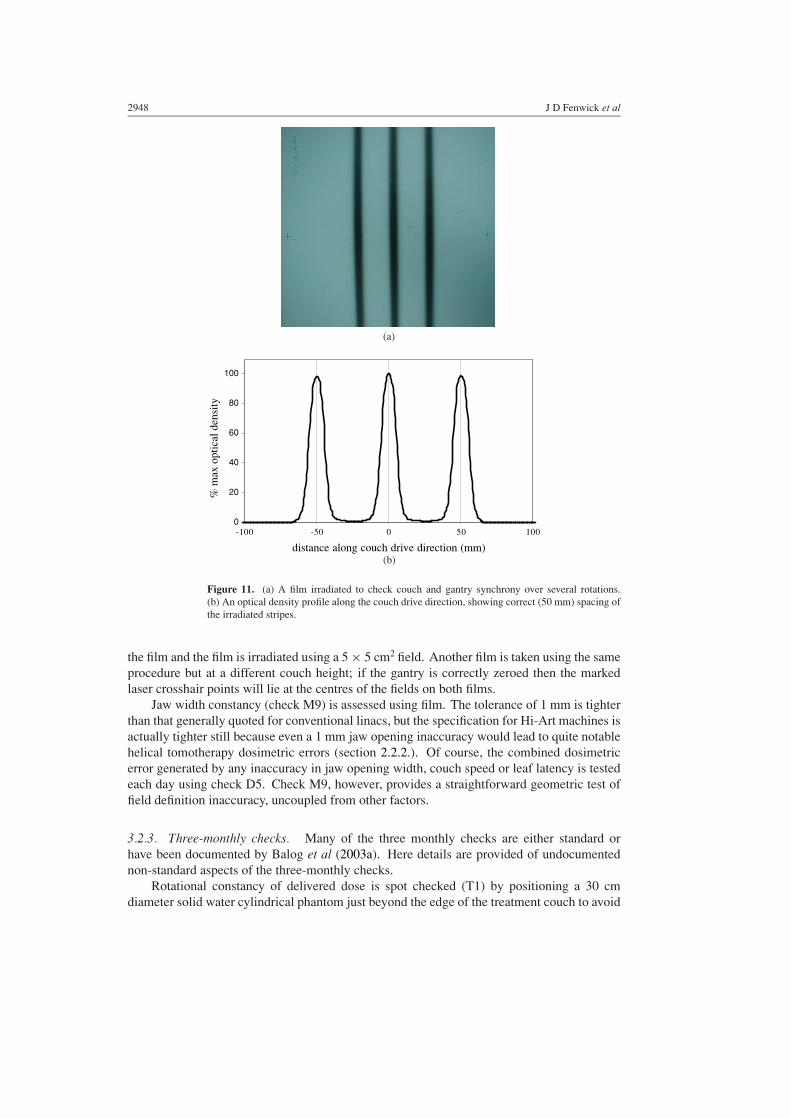
of the bore and marking top laser crosshair points on the film towards its ‘superior’ (gantry-most) and ‘inferior’ edges—these marks indicating the direction of couch y-drive. The filmis then irradiated using a 40 × 1 cm2 field with the leaves opened for 90◦ segments of the2nd, 7th and 12th of 13 rotations each of 20 s duration. The open leaf segments are centredon the 0◦ gantry angle, and the couch is set to drive at 1 cm per rotation (0.5 mm s−1, atypical treatment velocity). The processed film is analysed to check that the peaks of the threeirradiated segments lie 5 cm apart along the direction of couch drive (figure 11).
The location of the virtual isocentre (check M7) is directly tested (independently of theZMed optical guidance system) by positioning a radiopaque marker at the reference pointindicated by the lasers, taking a pair of X-Omat V films of orthogonal static 5 × 5 cm2 fields,and checking that the marker is centred on both films. Gantry angle zero (check M8) iscompared with a top (anterior/posterior) laser-defined vertical axis. The gantry is set at 0◦, afilm is placed on the couch and centred on the top laser crosshair, the crosshair is marked on
2948 J D Fenwick et al
0
20
40
60
80
100
-100 -50 0 50 100
distance along couch drive direction (mm)
% m
ax o
ptic
al d
ensi
ty
(a)
(b)
Figure 11. (a) A film irradiated to check couch and gantry synchrony over several rotations.(b) An optical density profile along the couch drive direction, showing correct (50 mm) spacing ofthe irradiated stripes.
the film and the film is irradiated using a 5 × 5 cm2 field. Another film is taken using the sameprocedure but at a different couch height; if the gantry is correctly zeroed then the markedlaser crosshair points will lie at the centres of the fields on both films.
Jaw width constancy (check M9) is assessed using film. The tolerance of 1 mm is tighterthan that generally quoted for conventional linacs, but the specification for Hi-Art machines isactually tighter still because even a 1 mm jaw opening inaccuracy would lead to quite notablehelical tomotherapy dosimetric errors (section 2.2.2.). Of course, the combined dosimetricerror generated by any inaccuracy in jaw opening width, couch speed or leaf latency is testedeach day using check D5. Check M9, however, provides a straightforward geometric test offield definition inaccuracy, uncoupled from other factors.
3.2.3. Three-monthly checks. Many of the three monthly checks are either standard orhave been documented by Balog et al (2003a). Here details are provided of undocumentednon-standard aspects of the three-monthly checks.
Rotational constancy of delivered dose is spot checked (T1) by positioning a 30 cmdiameter solid water cylindrical phantom just beyond the edge of the treatment couch to avoid
Quality assurance of a helical tomotherapy machine 2949
couch attenuation, supported by two light aluminium struts. The phantom is coaxially alignedwith the Hi-Art machine, and irradiated using an eight rotation delivery (field y-width of 5 cmand lateral length 2.5 cm, rotational period 20 s and no couch drive). Doses delivered to pointsat ±10 cm along the x- and z-axes from the isocentre are measured with an ion chamber, andshould lie in a narrow range. Rotational output stability is tested each month using check M2;however, that is a test of the stability of the beam, not of the delivered dose which outsidethe target region could be affected by gantry speed non-uniformity—although as linac pulsingis locked to gantry rotation, doses delivered outside the target region should be rotationallystable (section 2.2.3.).
Leaf latency (check T2) is tested as described in section 2.2.2. using the on-board MVCTdetector to measure fluence when the leaves are opened. Latency data are collected forprojection times between 200 and 600 ms (there being little further change as times increasebeyond 600 ms), and straight lines are fitted to the resulting curves of actual versus programmedfractional opening times. These fits are compared with those obtained at commissioning andit is checked that no change of more than 2% has occurred in the fitted value of actual openingtime for any particular programmed opening time.
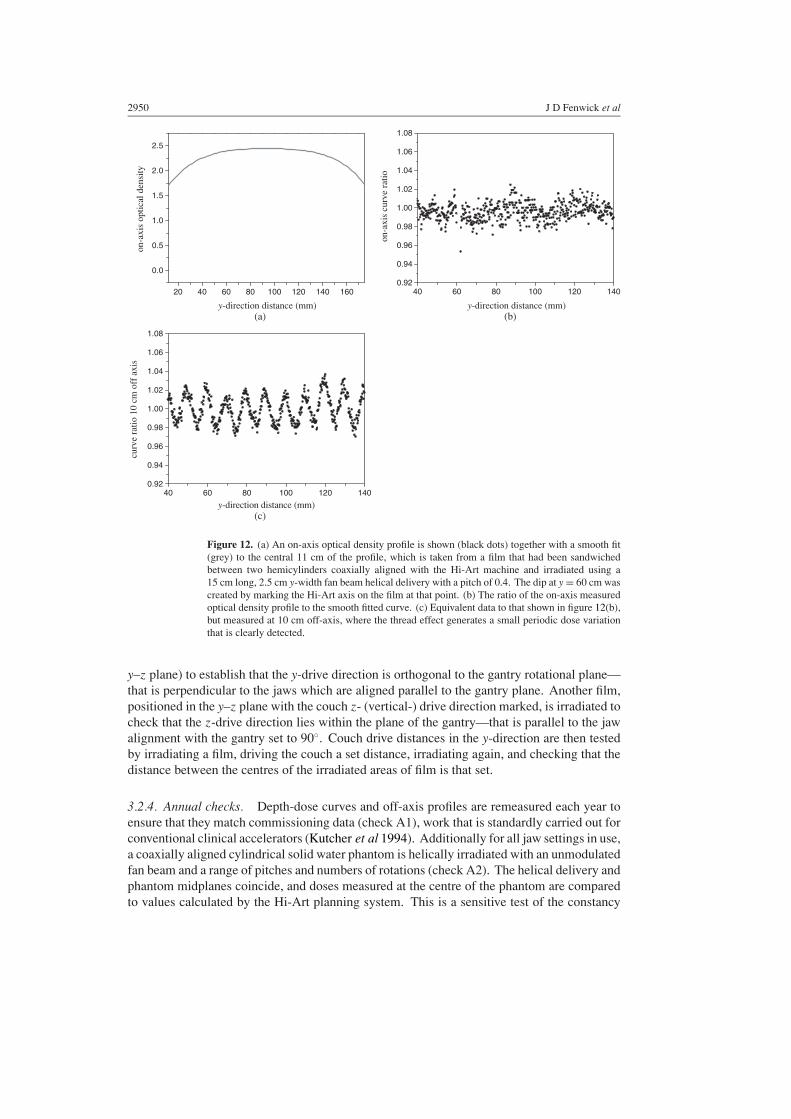
To test for the combined effects of rotational variations in output per linac pulse andsynchrony of couch drive and gantry rotation (check T3), a cylindrical solid water phantomis aligned coaxially with the Hi-Art machine and placed just beyond the end of the treatmentcouch, supported by aluminium struts. The phantom is comprised two hemicylinders, andbetween these is sandwiched an EDR2 film with a couple of points lying along the Hi-Artmachine axis (indicated by a laser) marked on the film. The film is irradiated using a deliveryof pitch 0.4, rotational period 20 s, helix length 15 cm, and an unmodulated fan beam ofy-width 2.5 cm and lateral length 40 cm, and the on-axis film optical density y-profile isplotted (figure 12(a)). The on-axis dose-distribution should be smoothly rounded, but anyrotational variation of output per pulse or gantry-couch synchrony would embed a ripple intothe underlying smooth distribution, the ripple’s wavelength being 1 cm for this pitch and fanbeam width. Note that the on-axis film optical density profile shown in figure 8(b) (checkM4), delivered using a scanned 1 cm field and measured at 15 mm depth in solid water isnot rounded, because scanned 1 cm fields generate less rounding than scanned 2.5 cm fieldsand because there is less photon scatter at a depth of 15 mm than at the centre of the cylinder(Fenwick and Tome 2004).
A smooth (quartic) curve is fitted to the central 11 cm of the on-axis profile, and theratio of the measured optical density to the smooth fit is plotted to check for any 1 cm ripple.None is seen (figure 12(b)) which demonstrates that our Hi-Art machine is currently adequatelyrotationally stable, as this test can very sensitively detect such a ripple if it exists. Figures 12(c)is analogous to 12(b), but shows data measured at 10 cm off-axis where the thread effectgenerates a small 1 cm wavelength ripple (Kissick et al 2004) independently of any rotationalvariation of output or gantry-couch synchrony; the ±2% ripple is clearly seen.
Couch drive distances and directions (checks T6–8) are assessed using a mixture of film-based tests and optical guidance (again, in the absence of optical guidance, straightforwardgeometric fiducials can be used). A true vertical axis is established by setting up the opticalguidance system to a horizontally levelled guidance array. Vertical couch drive orientation anddistances can then be checked using the guidance system. Having established that the verticalcouch drive is true, the orientation of the top laser can easily be tested by lining up a point onthe couch to the laser crosshair, and then driving the couch up and down and checking that thecrosshair remains aligned with the point.
Films of a 40 × 1 cm2 field, with the couch y-drive direction marked on, are taken at gantryangles of 0◦ (with the film placed flat on the couch) and 90◦ (with the film positioned in the
2950 J D Fenwick et al
20 40 60 80 100 120 140 160
0.0
0.5
1.0
1.5
2.0
2.5on
-axi
s op
tical
den
sity
y-direction distance (mm) y-direction distance (mm)
40 60 80 100 120 1400.92
0.94
0.96
0.98
1.00
1.02
1.04
1.06
1.08
on-a
xis
curv
e ra
tio
(a)
(c)
(b)
40 60 80 100 120 1400.92
0.94
0.96
0.98
1.00
1.02
1.04
1.06
1.08
curv
e ra
tio 1
0 cm
off
axi
s
y-direction distance (mm)
Figure 12. (a) An on-axis optical density profile is shown (black dots) together with a smooth fit(grey) to the central 11 cm of the profile, which is taken from a film that had been sandwichedbetween two hemicylinders coaxially aligned with the Hi-Art machine and irradiated using a15 cm long, 2.5 cm y-width fan beam helical delivery with a pitch of 0.4. The dip at y = 60 cm wascreated by marking the Hi-Art axis on the film at that point. (b) The ratio of the on-axis measuredoptical density profile to the smooth fitted curve. (c) Equivalent data to that shown in figure 12(b),but measured at 10 cm off-axis, where the thread effect generates a small periodic dose variationthat is clearly detected.
y–z plane) to establish that the y-drive direction is orthogonal to the gantry rotational plane—that is perpendicular to the jaws which are aligned parallel to the gantry plane. Another film,positioned in the y–z plane with the couch z- (vertical-) drive direction marked, is irradiated tocheck that the z-drive direction lies within the plane of the gantry—that is parallel to the jawalignment with the gantry set to 90◦. Couch drive distances in the y-direction are then testedby irradiating a film, driving the couch a set distance, irradiating again, and checking that thedistance between the centres of the irradiated areas of film is that set.
3.2.4. Annual checks. Depth-dose curves and off-axis profiles are remeasured each year toensure that they match commissioning data (check A1), work that is standardly carried out forconventional clinical accelerators (Kutcher et al 1994). Additionally for all jaw settings in use,a coaxially aligned cylindrical solid water phantom is helically irradiated with an unmodulatedfan beam and a range of pitches and numbers of rotations (check A2). The helical delivery andphantom midplanes coincide, and doses measured at the centre of the phantom are comparedto values calculated by the Hi-Art planning system. This is a sensitive test of the constancy
Quality assurance of a helical tomotherapy machine 2951
of the fan beam y-profile tails, as these determine the extent to which the dose delivered tothis point rises with increasing helical delivery length (Balog et al 2003b, Fenwick and Tome2004).
Multileaf leakage (check A3) is tested by setting a jaw width of 5 cm and irradiating anX-Omat V film for 3 s with all leaves open, and then irradiating another part of the film for300 s with all leaves closed. Given MLC leakage of less than 1%, the film darkening anywherein the second irradiated region should be less than that at the equivalent point in the first.
Tongue-and-groove fluence effects are tested (check A4) by making fluence-per-leaf-opening measurements for various leaf opening patterns using the MVCT detector. From thisdata TG factors are determined (Balog et al 2003b) and checked against values obtained atcommissioning. And lastly, output interlocking (A5) is straightforwardly tested each month bytemporarily changing the reference dose-rate (held in software) and making sure that treatmentdeliveries interlock out after appropriate lengths of time.
4. Discussion
The QA schedule that has been developed is fairly consistent with that recommended byAAPM Topic Group 40 (Kutcher et al 1994) for conventional linacs. Off-axis ratio testingis far more frequent, and will remain so until the profile shape is interlocked. Rotationalstability is checked more frequently than recommended by TG40, reflecting the inherentlyrotational nature of helical tomotherapy. The more novel components of the system (checksD4-5, M3-6, T1 and T3) are designed to test the dynamic and synchronous characteristics ofHi-Art machines. Three monthly tests may be carried out less frequently (six monthly andthen annually) as more experience is gained with the machine.
This machine QA schedule has been implemented in parallel with a programme of patient-specific quality-assurance tests: detailed film and ion-chamber measurements are made in aphantom to check planned treatments before their first fraction, and in vivo TLD measurementsare collected over the course of treatment to verify delivery. It is intended to present patient-specific QA results in another paper, together with a summary of data gathered from themachine QA programme.
In the future, delivery verification may be accomplished using dose-reconstructionsoftware to process exit fluence data collected by the Hi-Art’s MVCT detector (Kapatoes et al2001a, 2001b, 2001c). While this software would provide extremely useful, detailed,automated fraction-by-fraction checking of treatment delivery, for several reasons it wouldcomplement but not replace the machine QA system. Firstly, by definition the dose-reconstruction software can only catch treatment errors retrospectively; thus Hi-Art machinechecks should continue to be made each day before treatments commence as these will detectsome problems before they lead to treatment errors.
Secondly, the software provides only an indirect inference of the dose actually deliveredto a patient. Imagine the (extreme) case of a cylindrical patient aligned coaxially with themachine. Then from the exit fluence measured by the MVCT detector, it would be impossibleto detect errors in couch speed or MLC/gantry synchronization—which directly impact onthe absolute dose and the shape of the dose-distribution delivered to the patient, respectively.In other words, errors in these machine characteristics would only impact on exit fluence ifthey led to differences between planned and actual radiation path-lengths through the patient’sbody during treatment—requiring an irregular contour to pick them up.
Thirdly, the most effective way to monitor a machine’s precise geometric set up is todirectly measure the geometry; dose-reconstruction may detect some alignment errors, butwould currently struggle to pick up others—for instance, jaw or multileaf twist, or beam
2952 J D Fenwick et al
y-divergence. And fourthly, on those occasions when the software does detect a delivery error,machine QA records will aid assessment of whether the error is due to patient set up or amachine fault, and will likely provide an indication of which facets of machine performancemight need investigation.
Similarly, machine-based and pre-treatment patient-specific QA systems are alsocomplementary. The pre-treatment patient-specific QA work assesses the accuracy with whichthe planned dose-distribution is delivered to a phantom, allowing for differences between thepatient’s anatomy and the geometry of the phantom in which the measurements are made.While this check usefully tests all components of machine performance at once, the specificcause of any discrepancy uncovered will be diagnosed using the machine QA system, whichaims to check each individual factor impacting on the delivered dose-distribution.
5. Summary
The design and dosimetric characteristics of Hi-Art machines have been reviewed. A QAsystem has been developed for these machines which tests both the conventional and thedynamic and synchronous aspects of Hi-Art performance. Experimental details are providedfor the more novel QA tests devised, and possible future changes to the system are discussed.The complementary roles of machine QA, patient-specific pre-treatment QA and dose-reconstruction delivery verification are described. It is intended to present summaries ofmachine and patient-specific QA data in a future paper.
The QA system presented here builds on established conventional linac and axialtomotherapy QA methodologies, which have been modified and extended in ways that reflectthe novel aspects of the Hi-Art design in the light of our experience with the machine sofar. Helical tomotherapy has a relatively short clinical track record, and as further operationalexperience is gained it may be found that some checks should be made at different intervalsto those suggested in table 1 and that additional tests need to be developed.
Acknowledgments
The authors thank the referees for most helpful and detailed reviews of this paper. JohnFenwick wishes to thank the staff at Clatterbridge Centre for Oncology for teaching him howto quality assure conventional linear accelerators. This work was funded by Tomotherapy Incand NIH grant P01 CA088960. Joshua James is supported by an AAPM/RSNA Fellowshipfor Graduate Study in Medical Physics.
References
Balog J, Mackie T R, Pearson D, Hui S, Paliwal B and Jeraj R 2003a Benchmarking beam alignment for a clinicalhelical tomotherapy device Med. Phys. 30 1118–27
Balog J, Mackie T R, Reckwerdt P, Glass M and Angelos L 1999a Characterization of the output for helical deliveryof intensity modulated slitbeams Med. Phys. 26 55–64
Balog J, Mackie T R, Wenman D L, Glass M, Fang G and Pearson D 1999b Multileaf collimator interleaf transmissionMed. Phys. 26 176–86
Balog J, Olivera G and Kapatoes J 2003b Clinical helical tomotherapy commissioning dosimetry Med. Phys. 303097–106
Chaney E L, Cullip T J and Gabriel T A 1994 A Monte Carlo study of accelerator head scatter Med. Phys. 21 1383–90Deasy J O, Fowler J F, Roti J L and Low D A 2001 Dose-rate effects in intensity modulated radiation therapy Int. J.
Radiat. Oncol. Biol. Phys. 51 S1 400–1Fenwick J D and Tome W A 2004 Modelling simple helically-delivered dose-distributions Phys. Med. Biol. submitted

Quality assurance of a helical tomotherapy machine 2953
IEC 1996 Report 1217—Guide to Coordinates, Movements and Scales used for Radiotherapy Equipment BS EN61217 (London: BSI)
Kalender W A and Polacin A 1991 Physical performance characteristics of spiral CT scanning Med. Phys. 18 910–5Kapatoes J M, Olivera G H, Balog J P, Keller H, Reckwerdt P J and Mackie T R 2001a On the accuracy and
effectiveness of dose reconstruction for tomotherapy Phys. Med. Biol. 46 943–66Kapatoes J M, Olivera G H, Ruchala K J and Mackie T R 2001b On the verification of the incident fluence in
tomotherapy IMRT Phys. Med. Biol. 46 2953–63Kapatoes J M, Olivera G H, Ruchala K J, Smilowitz J B, Reckwerdt P J and Mackie T R 2001c A feasible method
for clinical delivery verification and dose reconstruction in tomotherapy Med. Phys. 28 528–42Kissick M W, Fenwick J D, Jeraj R, Kapatoes J M, Keller H and Mackie T R 2004 The helical tomotherapy thread
effect Med. Phys. submittedKutcher G J, Coia L, Gillin M, Hanson W F, Leibel S, Morton R J, Palta J R, Purdy J A, Reinstein L E,
Svensson G K, Weller M and Wingfield L 1994 Comprehensive QA for radiation oncology: report of AAPMRadiation Therapy Committee Task Group 40 Med. Phys. 21 581–618
LoSasso T, Chui C-S and Ling C C 1998 Physical and dosimetric aspects of a multileaf collimator system used in thedynamic mode for implementing intensity modulated radiotherapy Med. Phys. 25 1919–27
Low D A, Chao K S C, Mutic S, Gerber R L, Perez C A and Purdy J A 1998a Quality assurance of serial tomotherapyfor head and neck treatments Int. J. Radiat. Oncol. Biol. Phys. 42 681–92
Low D A, Mutic S, Dempsey J F, Gerber R L, Bosch W R, Perez C A and Purdy J A 1998b Quantitative dosimetricverification of an IMRT planning and delivery system Radiother. Oncol. 49 305–16
Low D A, Mutic S, Dempsey J F, Markman J, Goddu S M and Purdy J A 1999 Abutment region dosimetry for serialtomotherapy Int. J. Radiat. Oncol. Biol. Phys. 45 193–203
Mackie T R, Balog J, Ruchala K, Shepard D, Aldridge J S, Fitchard E E, Reckwerdt P, Olivera G H, McNutt T andMehta M 1999 Tomotherapy Semin. Radiat. Oncol. 9 108–17
Mackie T R, Holmes T, Swerdloff S, Reckwerdt P, Deasy J O, Yang J, Paliwal B and Kinsella T 1993 Tomotherapy:a new concept for the delivery of dynamic conformal radiotherapy Med. Phys. 20 1709–19
Reckwerdt P J, Olivera G H, Shepard D M and Mackie T R 2000 Case studies in tomotherapy optimization:breast, prostate, mesothelioma and nasopharyngeal treatments Proc. 13th Int. Conf. on the Use of Computers inRadiation Therapy (Heidelberg, May 2000) ed W Schlegel and T Bortfeld (Heidelberg: Springer) pp 60–2
Tsai J-S, Rivard M J and Engler M J 2000 Dependence of linac output on the switch rate of an intensity-modulatedtomotherapy collimator Med. Phys. 27 2215–25
Woo S Y, Grant W, McGary J E, Teh B S and Butler E B 2003 The evolution of quality assurance for intensity-modulated radiation therapy (IMRT): sequential tomotherapy Int. J. Radiat. Oncol. Biol. Phys. 56 274–86