quality control b. von haller 8th june 2015 cern
TRANSCRIPT

Quality Control
B. von Haller
8th June 2015
CERN

CWG9 in a nutshell
▶Started in May 2013 along with O2
▶Group working on ▶the Data Quality Monitoring ▶the Quality Assurance▶the Visualization
Quality Control (QC)
▶For Run 2 and Run 3
B. von Haller | CWG9 DQM-QA-Visualization | 08.06.2014 2

CWG9 Members
▶ Renu Bala▶ Francesca Bellini▶ Jakob Blomer▶ Daniele de Gruttola▶ Mihaela Gheata▶ Lukasz Graczykowski▶ Malgorzata Janik▶ Andreas Morsch▶ Jeremi Niedziela▶ Jacek Otwinowski▶ Ankita Sharma▶ Maciej Szymanski▶ Barthélémy Von Haller
B. von Haller | CWG9 DQM-QA-Visualization | 08.06.2014 3
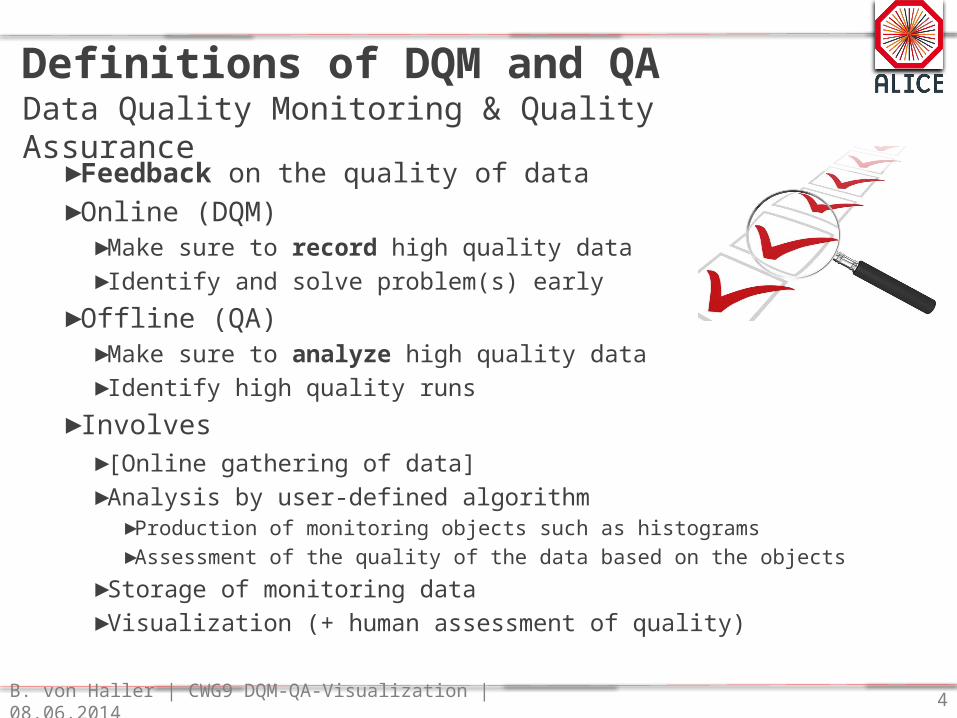
Definitions of DQM and QAData Quality Monitoring & Quality Assurance
B. von Haller | CWG9 DQM-QA-Visualization | 08.06.2014 4
▶ Feedback on the quality of data ▶ Online (DQM)
▶ Make sure to record high quality data▶ Identify and solve problem(s) early
▶ Offline (QA)▶ Make sure to analyze high quality data▶ Identify high quality runs
▶ Involves▶ [Online gathering of data]▶ Analysis by user-defined algorithm
▶ Production of monitoring objects such as histograms▶ Assessment of the quality of the data based on the objects
▶ Storage of monitoring data▶ Visualization (+ human assessment of quality)

B. von Haller | CWG9 DQM-QA-Visualization | 08.06.2014
CWG9 TasksGroup focusing on the data Quality Assurance, online and offline, and the visualization of its results as well as of the visualization of the data itself▶ Run 3
▶ Study how to monitor data efficiently and in plenty without interfering with the data taking
▶ Discuss QA output and results, incremental QA and procedures to formalize if the results are acceptable or not
▶ Determine the needs, and design the software, to access, visualize the results▶ Define and develop the software to visualize data, raw and reconstructed▶ Technical Design Report and prototyping
5
Dat
aflow
Monitoring Object Generation
AutomaticQuality Assessment
Storage
Visualization

B. von Haller | CWG9 DQM-QA-Visualization | 08.06.2014
QC ServersPossibility to use EPNs or dedicated machines
EPNs
Sync
hron
ous
Asyn
chro
nous
TF Building
Data Reduction 1
Detector Reco.
Final reconstruction
Calibration 2
QC
obje
cts
Time Frame QCTime Frame QCTF QC
Compressed TF QC
Event QC
Compressed TF QC
Event QC
AOD QC
CTF QC
Calibration 1
Event Extraction
FLPs
RAW QCRAW QCRAW QC
~1%RAW, Sub-TF
QC Repo
QC objects+ quality
TrendingTrendingTrending
CorrelationCorrelationCorrelation
Automatic Checks
Mergers
Legend
O2 Dataflow step
QC Task QC objects (e.g. histo)
Physics data transport
QC Infrastructure QC objects + quality
SpecificWebApp
GenericWeb
Application
SpecificWebApp
SpecificWeb
Applications
Web Server& REST API
ALICE Experiment
Extra QC tasksExtra QC tasks
Advanced QC
Local Aggregation
Extra QC tasksExtra QC tasksAuxiliary
monitoring
CTP LHCDCS TF, CTF, AOD
ALICE Detectors
6
Time Slicing
Data Reduction 0
Calibration 0
RAW QCRAW QCSub-TF QC

Current and future tasks
▶Run 3▶QC prototyping
▶Merging (naive and complex approaches)▶Web ROOT gui▶Basic functionalities to integrate with first prototype of
an FLP (see next slide for details)
B. von Haller | CWG9 DQM-QA-Visualization | 08.06.2014 7

EPNs
B. von Haller | FLP proto - QC | 03.06.2015
QC ServersPossibility to use EPNs or dedicated machines
Sync
hron
ous
Asyn
chro
nous
TF Building
Data Reduction 1
Detector Reco.
Final reconstruction
Calibration 2
QC
obje
cts
Time Frame QCTime Frame QCTF QC
Compressed TF QC
Event QC
Compressed TF QC
Event QC
AOD QC
CTF QC
Calibration 1
Event Extraction
FLPs
Time Slicing
Data Reduction 0
RAW QCRAW QCRAW QC
Calibration 0
~1%RAW, Sub-TF
QC Repo
QC objects+ quality
TrendingTrendingTrending
CorrelationCorrelationCorrelation
Automatic Checks
Mergers
Legend
O2 Dataflow step
QC Task QC objects (e.g. histo)
Physics data transport
QC Infrastructure QC objects + quality
SpecificWebApp
GenericWeb
Application
SpecificWebApp
SpecificWeb
Applications
Web Server& REST API
ALICE Experiment
RAW QCRAW QCSub-TF QC
Extra QC tasksExtra QC tasks
Advanced QC
Local Aggregation
Extra QC tasksExtra QC tasksAuxiliary
monitoring
CTP LHCDCS
ITS Half layer
8

FLPs
B. von Haller | FLP proto - QC | 03.06.2015
QC ServersPossibility to use EPNs or dedicated machines
~1%RAW, Sub-TF
QC Repo
QC objects+ qualityAutomatic
Checks
Legend
O2 Dataflow step
QC Task QC objects (e.g. histo)
Physics data transport
QC Infrastructure QC objects + quality
SpecificWebApp
Web Server& REST API
ALICE Experiment
Extra QC tasksExtra QC tasks
Advanced QC
9
QC functionality for FLP prototype :• Get raw data or STF samples locally
or from another machine. • Process the data, produce histos
and send them to central QC infrastructure
• Check the quality of the histograms• Store histos and quality in a repository• Display the histos and their quality
Time Slicing
Data Reduction 0
RAW QCRAW QCRAW QC
Calibration 0
RAW QCRAW QCSub-TF QC
Local Aggregation
ITS Half layer

Current and future tasks
▶ Run 3 (continued)▶ Actual implementation – 5 areas
▶Mergers▶General Framework and API▶Repository▶Automatic checkers, correlation, trending▶Clients
▶ Event Display - Visualization▶Evolve Run 1 and Run 2 ED for Run 3
▶Time Frames and Run 3 events as input▶Geometry
▶Total Event Display▶Data converters : ESD -> xml/json ; Run3-ESD -> xml/json▶Geometry converter : AliRoot -> 3d Studio max
B. von Haller | CWG9 DQM-QA-Visualization | 08.06.2014 10
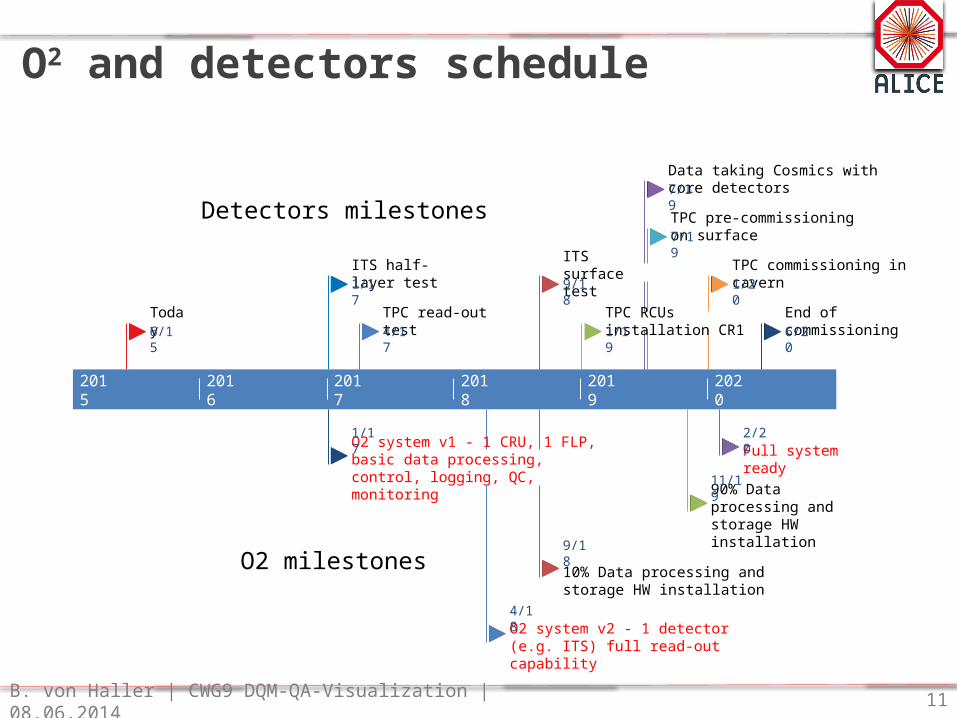
O2 and detectors schedule
B. von Haller | CWG9 DQM-QA-Visualization | 08.06.2014 11
2015 2016 2017 2018 2019 2020
Today6/15
ITS half-layer test1/17
TPC read-out test4/17
ITS surface test9/18
TPC RCUs installation CR11/19
Data taking Cosmics with core detectors7/19
TPC pre-commissioning on surface7/19
TPC commissioning in cavern1/20
End of commissioning6/20
O2 system v1 - 1 CRU, 1 FLP, basic data processing, control, logging, QC, monitoring
1/17
O2 system v2 - 1 detector (e.g. ITS) full read-out capability
4/18
10% Data processing and storage HW installation
9/18
90% Data processing and storage HW installation
11/19
Full system ready2/20
Detectors milestones
O2 milestones

CWG9 schedule
▶ Q1 2017▶ FLP prototype, basic QC: data sampling, general api and framework,
some checkers, repository, basic client▶ Q1 2018
▶ Mergers (work already started)▶ Clients (including generic)▶ Automatic checkers, correlation, trending
▶ Q1 2019▶ Fully ready for cosmics
▶ Event Display ▶ Still to be exactly defined, should be ready Q1 2018 ▶ Waiting for data format▶ Work already started on converter and geometry extraction
B. von Haller | CWG9 DQM-QA-Visualization | 08.06.2014 12

Conclusion
▶CWG9 gathers all QC stakeholders ▶Requirements and architecture available▶Next main milestone is Q1 2017▶Prototyping has started
▶We are looking for motivated and competent developers to work on the QC framework or on prototyping specific parts
B. von Haller | CWG9 DQM-QA-Visualization | 08.06.2014 13

B. von Haller | CWG9 DQM-QA-Visualization | 08.06.2014 14
Past work
▶Run 2▶Event Display ▶Run 2 preparation
▶Run 3▶System Requirements Specifications (SRS)
▶Delivered
▶TDR▶Architecture and design of the Data Quality Control and
Event Display▶Defined milestones and required manpower
B. von Haller | CWG9 DQM-QA-Visualization | 08.06.2014 15