quantifying user experiences for integration into a home ... · a case study of canister and...
TRANSCRIPT
Proceedings 19th Triennial Congress of the IEA, Melbourne 9-14 August 2015
1
Quantifying user experiences for integration into a home appliance design process: a case study of canister and robotic vacuum cleaner user experiences
Ai MIYAHARAa, Kumiko SAWADAb, Yuka YAMAZAKIb, Miwa NAKANISHIa
aFaculty of Science & Technology, Department of Administration Engineering ,Keio University,
Yokohama, Kanagawa 223-8522, JAPAN; bIndustrial Design Center, Mitsubishi Electric Corporation, Kamakura, Kanagawa 247-8501, JAPAN
In this study, we established an evaluation method for the home appliance user experience (UX), an added-value feature in product development, to introduce UX into the product design process. A mobile application was built to efficiently collect “good experiences” big data from users. The forms of human and home appliance interactions were used to classify the collected data and a probabilistic model, showing the relationship between contextual conditions and the experienced UX, was developed. A quantifiable evaluation value was calculated for the comparison of UX. Keywords: user experience, product design, vacuum cleaner, home appliance, big data
1. Introduction
Home appliances, such as vacuum cleaners and refrigerators, have already achieved high standards of functionality, efficiency, and usability, and have become so-called “mature products.” Such products are no longer easily distinguished by the abovementioned qualities, and each manufacturer is now obligated to add new value to their products. The added-value approach to product development focuses on user experience (UX), aiming to provide “good experiences” to their users. Currently, product design follows this “good experiences” concept. However, UX is the result of user–product interactions (ISO9241-210:2010) and is considerably affected by the context of such interactions (Hassenzahl & Tractinsky, 2006). Therefore, designers need to predict features that will deliver “a good experience” under different contextual conditions.
This study is part of a project to develop a UX-based design method for home appliances. Our developed process will derive which UXs should be improved, in other words, what constitutes “the good experiences,” from big data analysis.
2. Method
This study proceeded as follows: 1) We established a data collection method for “experiences” that were accompanied by positive feelings from the user. 2) We defined the forms of interaction between the user and the home appliance from the collected data and developed a probabilistic model, which shows the relationship between such conditions and the kind of UX.
2.1 Data collection method
2.1.1 The aim
User experiences can be extracted from ethnographic research, which intensively observes user actions alongside the user. Despite the strength of this approach, it is unsuitable for rapid product development, which is required for home appliances, because it necessitates the long-term observation of only a few targets. In response to this time-factor dilemma, Hama (2014) built a mobile terminal application for the purpose of collecting utility-time UX for automobiles. We built our application using Hama’s two application requirements as a reference, which are: 1) To obtain detailed information (actions, feelings, and context) of the UX, as though observing alongside the user and 2) To efficiently collect a large amount of information on various UXs.

Proceedings 19th Triennial Congress of the IEA, Melbourne 9-14 August 2015
2
2.1.2 Input items
Hassenzahl and Tractinsky (2006) stated that “UX is a consequence of a user’s internal state (predispositions, expectations, needs, motivation, mood, etc.), the characteristics of the designed system (e.g. complexity, purpose, usability, functionality, etc.) and the context (or the environment) within which the interaction occurs (e.g. organisational / social setting, meaningfulness of the activity, voluntariness of use, etc.)”. Based on this idea, we considered the input items to extract the “good experiences” of users from the following viewpoints: 1) from the user’s characteristic, 2) from the characteristics of the home appliance, and 3) from the form of interaction. These categorized input items are listed in Table 1.
Table 1. Input items of the mobile application.
Intention of the input items Input items Perceiving the user’s characteristic ! age
! sex ! frequency of use
Perceiving home appliance’s characteristic ! action ! emotion ! context of use (4W1H)
Perceiving the interaction form ! explanation of the home appliance by the user ! context of use (4W1H)
Burke (1969) stated “Any complete statement about motives will offer some kind of answers to these five
questions: what was done (act), when or where it was done (scene), who did it (agent), how he did it (agency), and why (purpose)”. Thus, we asked respondents to resolve the context of use into 4W1H (Who, Where, When, What, How), with the aim of perceiving the characteristic of the home appliance and the interaction form.
Tanaka (2012) divided UX extracted by his questionnaire into groups using the KJ method and proposed “24 types of UX in housework and cooking (UX24).” In this study, we re-worked Tanaka’s UX24, as shown in Table 2 (new UX24), and asked respondents to evaluate their experiences using our application’s 24 alternatives.
Table 2. New UX24 evaluation criteria for evaluating user’s interactions with home appliances.
No. Contents 1 Having heartwarming feelings 2 Noticing a new self 3 Remembering past good experiences 4 Praised by someone 5 Able to please someone 6 Able to do easily / quickly 7 Arouses aspirations 8 Feeling an emotional connection 9 Able to trust something to someone 10 Experiencing visual beauty 11 Experiencing auditory beauty 12 Feeling fulfilled 13 Able to concentrate
14 Able to do well 15 Able to do at timing 16 Feeling comfortable / relaxed 17 Feeling refreshed 18 Feeling fulfilled 19 Feeling tidy 20 Feeling unusually luxurious 21 Able to imagine good experiences in the
future 22 Feeling moderate 23 Understanding what had not previously been
understood 24 Feelings of progress
2.1.3 Structure
To acquire detailed information (actions, feelings, and context) on the UX, as though we were observing alongside the user, we employed a conversational interface throughout the application. Quesenbery and Brooks (2011) provided some examples of active listening skills, including repetition and feedback, which we used to shape the reaction and character of the application’s responses to the user’s answers.
Proceedings 19th Triennial Congress of the IEA, Melbourne 9-14 August 2015
3
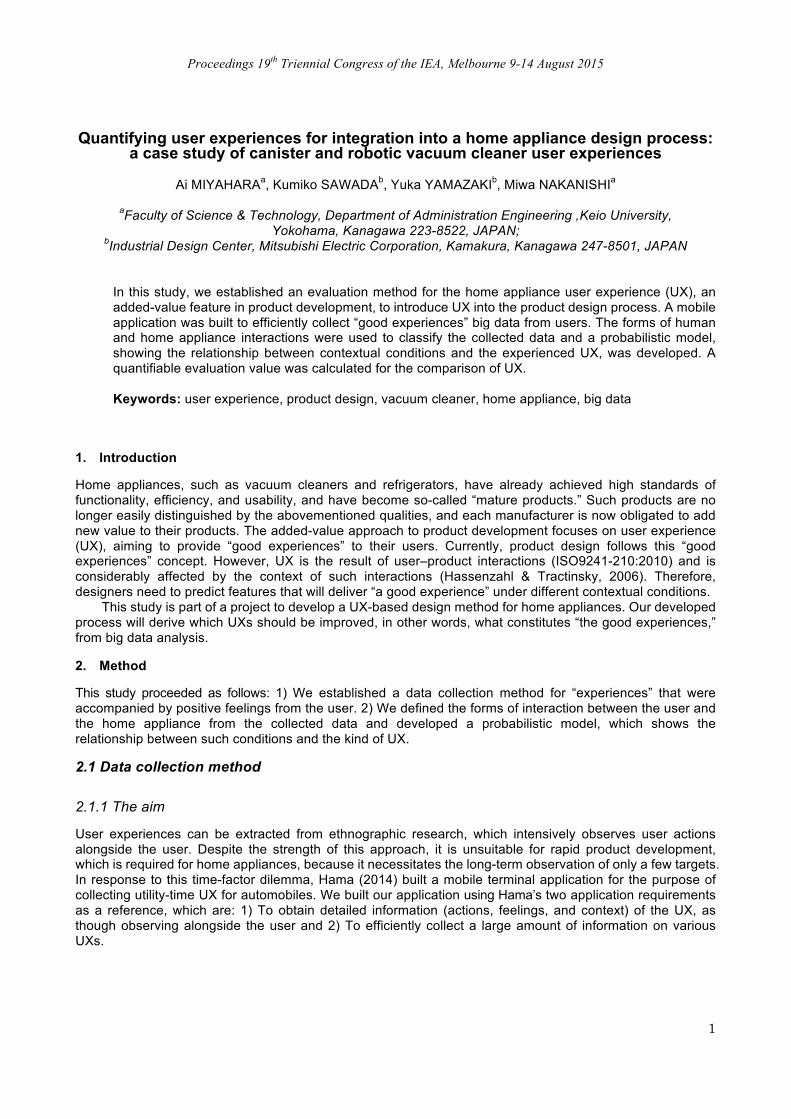
2.1.4 Implementation methods
Our mobile application was released on October 23, 2014 for iPhone users, although only the Japanese version is available at present. Examples of typical application screens are shown in Figure 1.
Figure 1. Examples of user screens for our mobile application.
2.2 The evaluation of UX
2.2.1 Conceptual model
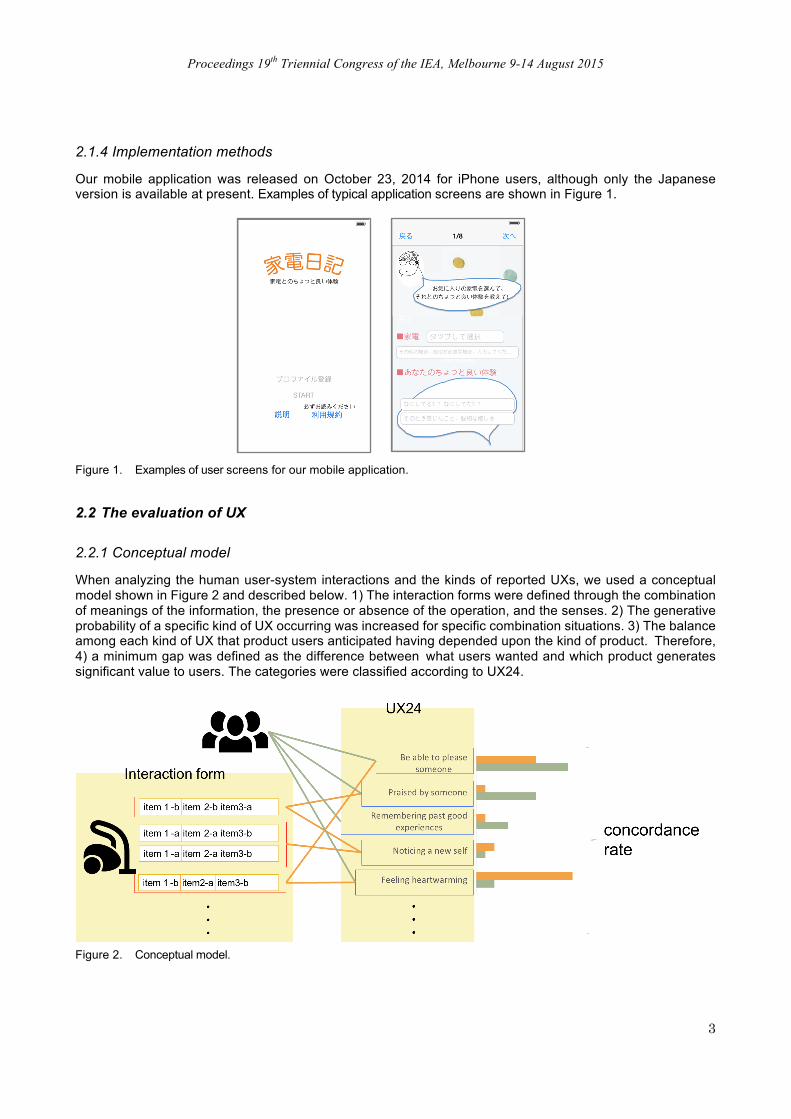
When analyzing the human user-system interactions and the kinds of reported UXs, we used a conceptual model shown in Figure 2 and described below. 1) The interaction forms were defined through the combination of meanings of the information, the presence or absence of the operation, and the senses. 2) The generative probability of a specific kind of UX occurring was increased for specific combination situations. 3) The balance among each kind of UX that product users anticipated having depended upon the kind of product. Therefore, 4) a minimum gap was defined as the difference between what users wanted and which product generates significant value to users. The categories were classified according to UX24.
Figure 2. Conceptual model.

Proceedings 19th Triennial Congress of the IEA, Melbourne 9-14 August 2015
4
2.2.2 The systemization of the interaction form
We set three items to define the form of the human user-system interaction, as shown in Table 3.
Table 3. Forms of human user-system interaction.
Senses Meanings of the information Presence or absence of the operation
Sight Inform state Control
Hearing Inform result Non-control
The sense of smell Inform the user of what should be done
Gustation Have user make a projection of the result
Somatesthesia Meaningless
I. Senses
Among the senses, we examined the sense of sight, hearing, smell, gustation, and somatesthesia.
II. Meanings of the information
The contents were classified and the meaning of the information that occurred at the time of interaction was determined. Inoue (2013) defined “the system image” and “the operation image” of the operational object as a mental model. He stated that it is necessary for designers to understand a users’ mental model and reflect it through design, otherwise, users cannot make good use of the products. Figure 3 shows the relationship between a mental model and a design model. Figure 3. Relationship between a mental model and a design model (Inoue, 2013) In addition, Yamaoka (2012) proposed five items to estimate the degree of the construction of a mental model. Table 4 lists these items.
Table 4. Items to estimate the degree of construct in a mental model (Yamaoka, 2012)
Item Contents Understanding of indications Be able to understand terms and contents on instruments or their
screen display Understanding of conditions Be able to understand conditions of instruments during operation Planning Be able to understand what to do to attain operational objectives Prediction of system behavior Be able to predict how to use functions and what to do during
instrument operation Interaction between system elements Be able to understand the relationship between parts of instruments
and between the layered structure of displays

Proceedings 19th Triennial Congress of the IEA, Melbourne 9-14 August 2015
5
Because our aim was not to eliminate difficulty in product use, but rather to consider the influence of positive interactions in human-products experiences, we adapted this idea to create the following classification:
a) Inform the state Information that informs the state of the home appliance, e.g., operating status or end status. b) Inform the result Information that informs the result from the use of the home appliance. c) Inform the user of what should be done Information that informs the user of what actions to take. d) Have the user make a projection of the result Information that has the user make a projection of the result. e) Meaningless Information that does not have meaning, such as the above options, or a meaningless user experience.
III. Presence or absence of the operation
We classified the collected answers as to whether the user operated the home appliance (e.g., pushed a button, lifted the lid) or not. This classification clarifies the starting point of human-product interaction.
2.2.3 Determination of the relationship between interaction forms and the kind of UX
We used 280 survey answers, collected till January 16, 2015, to associate interaction forms with each kind of UX. We covered cases where the same combination of the interaction elements occurred for no more than 10 of the 280 conditions of interaction. We then calculated the conditional probability of each kind of UX under each conditions of interaction (Ai) by the following formula: 𝑃𝑈𝑋𝑗𝐴𝑖=𝑡ℎ𝑒 𝑛𝑢𝑚𝑏𝑒𝑟 𝑜𝑓 𝑡ℎ𝑒 𝑎𝑛𝑠𝑤𝑒𝑟𝑠 𝑖𝑛𝑐𝑙𝑢𝑑𝑖𝑛𝑔 𝑈𝑋𝑗 𝑎𝑛𝑑 𝐴𝑖𝑡ℎ𝑒 𝑛𝑢𝑚𝑏𝑒𝑟 𝑜𝑓 𝑡ℎ𝑒 𝑎𝑛𝑠𝑤𝑒𝑟𝑠 𝑖𝑛𝑐𝑙𝑢𝑑𝑖𝑛𝑔 𝐴𝑖.
(1)
2.2.4 Calculation of the generative probability of each kind of UX
We hypothesized that each kind of UX generated through interaction with the entire product could be explained by summing all the human-product interactions. Therefore, we calculated the generative probability using the following formula: 𝑃𝑈𝑋𝑗=𝑃(𝑈𝑋𝑗|𝐴𝑖)𝑃(𝐴𝑖). (2) 𝑃(𝐴𝑖): Appearance ratio of conditions of interaction (i); 𝑃(𝑈𝑋𝑗|𝐴𝑖): Conditional probability of generating UXj under a condition of interaction (Ai); i=1〜 {the number of conditions of interaction}; j=1〜24 {the number of UX categories}
2.2.5 Case study: canister versus robotic vacuum cleaners We evaluated UX by examining the concordance rate between the calculated generative probability of each kind of UX and the balance of the user-anticipated UX for the product. In this study, we calculated both variables for two types of vacuum cleaners: a canister vacuum and a robotic vacuum First, a questionnaire survey was completed to clarify the users anticipated product experience. Users were presented with a list of the 24 UX categories, defined by UX24, and were asked to make multiple response selections regarding their desired experiences. The degree of anticipation for each kind of UX was calculated using the following formula. 𝑈𝑖= {𝑡ℎ𝑒 𝑛𝑢𝑚𝑏𝑒𝑟 𝑜𝑓 𝑡ℎ𝑒 𝑟𝑒𝑠𝑝𝑜𝑛𝑑𝑒𝑛𝑡𝑠 𝑡ℎ𝑎𝑡 𝑐ℎ𝑜𝑠𝑒 𝑈𝑋𝑖}𝑡ℎ𝑒 𝑛𝑢𝑚𝑏𝑒𝑟 𝑜𝑓 𝑎𝑙𝑙 𝑟𝑒𝑠𝑝𝑜𝑛𝑑𝑒𝑛𝑡𝑠.
(3)

Proceedings 19th Triennial Congress of the IEA, Melbourne 9-14 August 2015
6
Next, the generative probability was calculated for each kind of UX using formula (1) and (2). The users’ desired UX responses were used to define a “good experience.” Finally, a quantitative UX evaluation value was produced using the following formula: 𝐸=24−𝑖=124𝑑𝑒𝑔𝑟𝑒𝑒 𝑜𝑓 𝑎𝑛𝑡𝑖𝑐𝑖𝑝𝑎𝑡𝑖𝑜𝑛 𝑓𝑜𝑟 𝑈𝑋𝑖−𝑔𝑒𝑛𝑒𝑟𝑎𝑡𝑖𝑣𝑒 𝑝𝑟𝑜𝑏𝑎𝑏𝑖𝑙𝑖𝑡𝑦 𝑜𝑓 𝑈𝑋𝑖}. (4)
3. Results
3.1 Collected big data analysis
From the anticipated UX responses, 319 “good experience” data points were collected from October 23, 2014 to January 16, 2015. This data was manipulated after anonymization. Figure 4 shows the breakdown of these responses.
(a) (b)
(c) (d) (e) Figure 4. Breakdown of user responses: species structure of (a) home appliances, (b) UX24, (c) senses, (d) meanings of the information, and (e) control.
3.2 Relationship between conditions of interaction and the kind of UX
Table 5 shows the conditions of interaction and the conditional probability of generating UX.
Table 5. Conditions of interaction and conditional probability of generating UX.

Proceedings 19th Triennial Congress of the IEA, Melbourne 9-14 August 2015
7
3.3 Vacuum cleaner case study results
3.3.1 User-anticipated UX
Figure 5 shows that users anticipated the experiences of being recognized for their work and having a fulfilling experience when using a canister vacuum cleaner. On the other hand, users anticipated comfort and ease of use when using a robotic cleaner.
Figure 5. User-anticipated UX for canister and robotic vacuum cleaners.
3.3.2 Product-generated UX responses
After product interaction, 23 responses for canister vacuum cleaner use and 10 responses for robotic cleaner use were collected using the computer survey application, creating a baseline for a “good experience.” Figure 6 illustrates that canister vacuum cleaners generate an experience in which the user feels that they can accomplish their task briskly, while the robotic cleaner generates feelings of emotional connection, fulfillment, and comfort.
0
0.1
0.2
0.3
0.4
0.5
0.6
0.7
0.8
0.9
1
Feelin
g hear
twar
min
g
Noticin
g a
new
self
Rem
em
bering
past
good
exp
eriences
Pra
ised
by s
om
eone
Be a
ble t
o p
leas
e s
om
eone
Be a
ble t
o d
o e
asily
/ q
uic
kly
Aro
usi
ng
aspi
rations
Feelin
g em
otional
connections
Be a
ble t
o leav
e s
om
eth
ing
to
som
eone w
ith t
rust
Feelin
g vi
sual
beau
ty
Feelin
g au
dito
ry b
eau
ty
Feelin
g fu
lfill
ing
Be a
ble t
o c
oncentr
ate
Be a
ble t
o d
o w
ell
Be a
ble t
o d
o a
t tim
ing
Feelin
g com
fort
/ r
ela
Feelin
g re
fresh
ingn
ess
Feelin
g fu
lfill
ment
Feelin
g be
ing
tidy
Feelin
g unusu
al luxu
ry
Be a
ble t
o im
agin
e g
ood
exp
eriences
in t
he futu
re
Bein
g m
ode
rate
am
ounts
or
degr
ee
Unde
rsta
ndi
ng
what
hav
e n
ot
been u
nde
rsto
od
Feelin
g pr
ogr
ess
es
degr
ee o
f ant
icip
atio
n
UX24
canister vacuum cleaner robotic cleaner

Proceedings 19th Triennial Congress of the IEA, Melbourne 9-14 August 2015
8
Figure 6. Product interaction-generated UX for canister and robotic vacuum cleaners.
3.3.3 The evaluation value for each vacuum cleaners
According to our calculations, using equation (4), the evaluation value is 17 for the canister vacuum cleaner and 16 for the robotic vacuum cleaner. The higher evaluation value indicates that canister vacuum cleaners fulfill more of the users’ anticipated experiences than the robotic cleaners.
4. Conclusion
In this study, we gathered and analyzed “good experiences” of vacuum cleaner use to clarify the positive effects that interactions between human and home appliances have on UX. We developed a mobile application to efficiently collect 319 responses, which were used to define what users considered as “good experiences”. Next, we succeeded in calculating the generative probability of each kind of UX for each condition of interaction. Finally, we proposed a UX evaluation method. Using this method, we calculated both the generative probability of each kind of UX and the balance of the users’ anticipated interactions, which were then used to calculate the UX evaluation value. This method has the potential to become instrumental in future product design because it converts big data into quantitative measurement.
References
K. Burke. 1969. “A Grammar of Motives.” University of California Press, 15. Hassenzahl, M. and Tractinsky, N. 2006. “User Experience: A Research Agenda.” Behavior & Information Technology
25(2): 91–97. K. Inoue. 2013. “INTERFACEDESIGNNOKYOUKASYO (The textbook of the interface design).” Maruzen Publishing ISO9241-210. 2010. Ergonomics of Human-System Interaction–Part210: Human-Centered Design for Interactive
Systems. Geneva: International Standard Organization. W. Quesenbery and K. Brooks. 2011. “Storytelling for User Experience: Crafting Stories for Better Design.” Rosenfeld,
1–298 T. Yamaoka and T. Doi. 2012. “MENTALMODELNIMOTODUKU.DESIGNSAKUSEIGUIDELINEAN (the guideline for
design based on the mental model).” Japan Society of Kansei Engineering, 7: 109–111
0
0.02
0.04
0.06
0.08
0.1
0.12
0.14
0.16
0.18
Feelin
g hear
twar
min
g
Noticin
g a
new
self
Rem
em
bering
past
good
exp
eriences
Pra
ised
by s
om
eone
Be a
ble t
o p
leas
e s
om
eone
Be a
ble t
o d
o e
asily
/ q
uic
kly
Aro
usi
ng
aspi
rations
Feelin
g em
otional
connections
Be a
ble t
o leav
e s
om
eth
ing
to
som
eone w
ith t
rust
Feelin
g vi
sual
beau
ty
Feelin
g au
dito
ry b
eau
ty
Feelin
g fu
lfill
ing
Be a
ble t
o c
oncentr
ate
Be a
ble t
o d
o w
ell
Be a
ble t
o d
o a
t tim
ing
Feelin
g com
fort
/ r
ela
Feelin
g re
fresh
ingn
ess
Feelin
g fu
lfill
ment
Feelin
g be
ing
tidy
Feelin
g unusu
al luxu
ry
Be a
ble t
o im
agin
e g
ood
exp
eriences
in t
he futu
re
Bein
g m
ode
rate
am
ounts
or
degr
ee
Unde
rsta
ndi
ng
what
hav
e n
ot
been
unde
rsto
od
Feelin
g pr
ogr
ess
es ge
nera
tive
prob
abilit
y
UX24
canister vacuum cleaner robotic cleaner